Embed Size (px)
Citation preview

3.00 Property, Plant and Equipment:
This amount consists as follows:
Cost (Opening Balance) 4,873,651,142 4,642,157,126
4,873,651,142 4,642,157,126
Add: Addition during the year 69,787,819 231,494,016
A. Total Cost 4,943,438,961 4,873,651,142
B. Accumulated Depreciation 1,944,637,546 1,917,948,265
Opening Balance 1,917,948,265 1,805,636,114
Add: Charged during the year 26,689,281 112,312,150
Written down value: WDV (A-B) 2,998,801,414 2,955,702,877
4.00 Capital Work-in-Process:
This amount consists as follows:
Opening Balance Note-4.01 1,813,449,730 1,401,051,422
Add: Addition during the year Note-4.02 23,521,663 412,398,308
1,836,971,393 1,813,449,730
Total 1,836,971,393 1,813,449,730
4.01 Opening Balance:
This amount consists as follows:
Machinery Work-In Process 1,040,970,604 912,759,382
Building & Other Work-In Process 772,479,126 488,292,040
1,813,449,730 1,401,051,422
4.02 Addition during the year:
This amount consists as follows:
Machinery Work-In Process 9,866,669 128,211,222
Building & Other Work-In Process 13,654,994 284,187,086
23,521,663 412,398,308
5.00 Investment:
This amount consists as follows:
Palash Spinning Mills Ltd. 100,000,000 100,000,000
Phoenix Holdings Ltd. 476,389 476,389
Total 100,476,389 100,476,389
6.00 Inventories:
This amount consists as follows:
Finished goods 653,572,134 629,113,625
Work in Process 982,585,645 994,516,675
Raw Materials 752,970,743 763,598,344
Spare Parts 56,571,470 45,737,021
Total 2,445,699,992 2,432,965,665
Amounts in Taka
Un-Quoted
(ii)The Company acquired 15,000 ordinary shares out of 50,000 shares of Tk.100 each of Phoenix Holdings Ltd. which is 30% of
total shares.
(i) The Company acquired 225,000 ordinary share of at a cost of Tk.100,000,000 each @ Tk. 444.44 each including a premium of
Tk. 344.44 of Palash Spinning Mills from shers which is 45% of total share of its share holders by way of transfer. There is no
commercial operation of Palash Spinning Mills.
30th September
2016 30th June 2016
13
Amounts in Taka
30th September
2016 30th June 2016
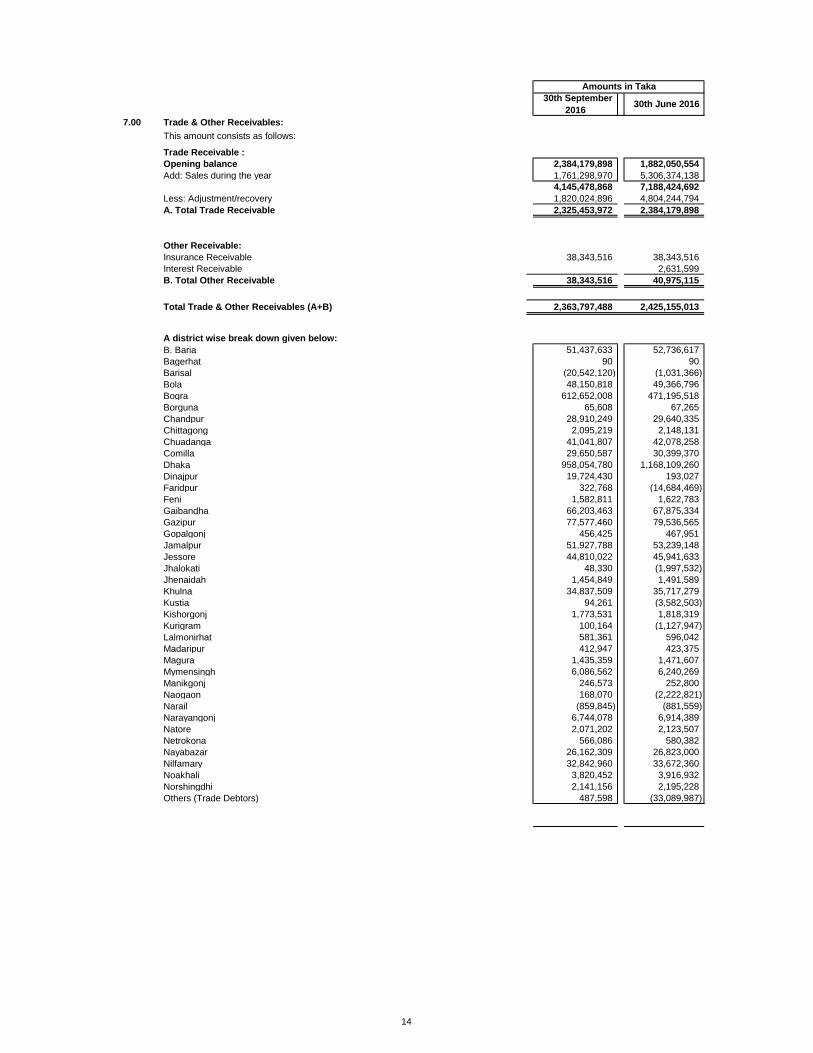
7.00 Trade & Other Receivables:
This amount consists as follows:
Trade Receivable :
Opening balance 2,384,179,898 1,882,050,554
Add: Sales during the year 1,761,298,970 5,306,374,138
4,145,478,868 7,188,424,692
Less: Adjustment/recovery 1,820,024,896 4,804,244,794
A. Total Trade Receivable 2,325,453,972 2,384,179,898
Other Receivable:
Insurance Receivable 38,343,516 38,343,516
Interest Receivable 2,631,599
B. Total Other Receivable 38,343,516 40,975,115
Total Trade & Other Receivables (A+B) 2,363,797,488 2,425,155,013
A district wise break down given below:
B. Baria 51,437,633 52,736,617
Bagerhat 90 90
Barisal (20,542,120) (1,031,366)
Bola 48,150,818 49,366,796
Bogra 612,652,008 471,195,518
Borguna 65,608 67,265
Chandpur 28,910,249 29,640,335
Chittagong 2,095,219 2,148,131
Chuadanga 41,041,807 42,078,258
Comilla 29,650,587 30,399,370
Dhaka 958,054,780 1,168,109,260
Dinajpur 19,724,430 193,027
Faridpur 322,768 (14,684,469)
Feni 1,582,811 1,622,783
Gaibandha 66,203,463 67,875,334
Gazipur 77,577,460 79,536,565
Gopalgonj 456,425 467,951
Jamalpur 51,927,788 53,239,148
Jessore 44,810,022 45,941,633
Jhalokati 48,330 (1,997,532)
Jhenaidah 1,454,849 1,491,589
Khulna 34,837,509 35,717,279
Kustia 94,261 (3,582,503)
Kishorgonj 1,773,531 1,818,319
Kurigram 100,164 (1,127,947)
Lalmonirhat 581,361 596,042
Madaripur 412,947 423,375
Magura 1,435,359 1,471,607
Mymensingh 6,086,562 6,240,269
Manikgonj 246,573 252,800
Naogaon 168,070 (2,222,821)
Narail (859,845) (881,559)
Narayangonj 6,744,078 6,914,389
Natore 2,071,202 2,123,507
Netrokona 566,086 580,382
Nayabazar 26,162,309 26,823,000
Nilfamary 32,842,960 33,672,360
Noakhali 3,820,452 3,916,932
Norshingdhi 2,141,156 2,195,228
Others (Trade Debtors) 487,598 (33,089,987)
14

Amounts in Taka
30th September
2016 30th June 2016
Suspenses A/c ( Trade Debtores) 46,354 46,354
Pabna 524,879 (829,167)
Panchagar 21,637,219 52,941,241
Potuakhali 711,747 729,721
Pirojpur 394,967 404,941
Rajbari 52,690 (7,022,943)
Rajshahi 1,151,797 (1,180,884)
Rangpur 80,714,737 82,753,069
Satkhira 284,796 291,988
Sariyatpur 7,646 7,646
Sherpur 4,714,772 4,837,420
Sirajgonj 134,240 134,240
Sylhet 73,530,560 85,640,420
Tangail 2,580,790 2,645,965
Thakurgaon 3,085,920 3,163,851
Zinjira 543,500 (620,938)
Total 2,325,453,972 2,384,179,898
8.00 Advances, Deposits and Prepayments:
This amount consists as follows:
Advances Note-8.01 1,989,637,136 1,580,502,295
Deposits and Investments Note-8.02 100,607,971 91,850,714
2,090,245,106 1,672,353,009
8.01 Advances:
This amount consists as follows:
Against goods and services 210,453,385 208,502,068
Against Salary 14,377,559 18,408,936
Against Land purchase 164,285,714 136,285,714
Advance Building Construction for NOF 286,500 286,500
Advance for Preliminary & Pre-Operating Expense (NOF) 3,303,016 1,425,540
Advance Income Tax Note-8.1.1 395,680,536 339,966,313
Factory current account 10,832,317 3,398,183
Material in Transit 943,383,189 715,049,616
L/C margin 239,599,146 152,804,545
VAT current account 7,435,774 2,912,179
Bank Gurantee Commission - 1,462,700
1,989,637,136 1,580,502,295
8.1.1 Advance Income Tax:
This amount consists as follows:
Opening Balance 339,966,313 180,115,707
Add Addition during the year 55,714,223 159,850,606
395,680,536 339,966,313
Less: Refund during the year - -
Less : Adjusted after Tax Assessment - -
- -
Closing Balance 395,680,536 339,966,313
8.02 Deposits and Investments:
This amount consists as follows:
FDR with Eastern Bank Ltd. 56,863,074 54,570,295
CDBL 500,000 500,000
FDR with Bank Asia Ltd. - 2,020,257
FDR with South East Bank Ltd. 3,561,804 3,303,980
FDR with IFIC Bank Ltd. 8,653,000 -
FDR with Jamuna Bank Ltd. - 426,089
Security deposit with WASA, DESA & Custom 31,030,093 31,030,093
Total 100,607,971 91,850,714
15

Amounts in Taka
30th September
2016 30th June 2016
9.00 Cash and Cash Equivalents:
This amount consists as follows:
Cash in Hand 527,851 496,427
Cash at Bank Note-9.01 33,607,708 19,238,555
34,135,559 19,734,982
9.01 Cash at Bank:
This amount consists as follows:
Agrani Bank Ltd Tejgaon Br. A/c No-69959 848,579
AB Bank Ltd Kawran Bazar Br. A/c No-680000 248,217 296,242
AB Bank Ltd Kawran Bazar Br. A/c No-STD 750680-430 212,478 15,812
Al-Arafah Islami Bank Ltd Motijheel A/c No 15224 1,907,274 300,866
Al-Arafah Islami Bank Ltd Jatra Bari A/C No 200078491 186,792 54,931
Bank Asia Ltd Scotia Br. IPO STD-764 5,232,651 5,232,651
Bank Asia Ltd Scotia Br. A/c No-495 5,041 66,617
Basic Bank Ltd karwan bazar A/cNo-000180 163,876 2,061,636
BRAC Bank Ltd Gulshan Br. A/c No-84004 15,720 15,720
City Bank Ltd Po Motijheel A/c No-872001 37,636 110,776
City Bank Ltd Motijheel A/c No-872002 3,848,508 3,747,454
City Bank Ltd Motijheel A/c No-14340 1,182,001 117,717
Dutch Bangla Bank Ltd Dilkusha A/c No-002704 674,970 44,849
Dutch Bangla Bank Ltd Motijheel Br. A/c No-1742 -
Dutch Bangla Bank Ltd /Local KB A/c No-11053 174,989 124,989
Dhaka Bank Ltd K.Bazar Local A/c No-6359 - -
Dhaka Bank Ltd Motijheel A/c No 8522 - -
Eastern Bank Ltd Sonargoan Br. A/c No-008112 1,557,956 57,956
Exim Bank Ltd Motijheel A/c No-006 71,991 415,466
First Security Bank Ltd Mohakhali Br. A/c No-000518 88,710 90,351
Islami Bank BD Ltd Mohakhali A/c No-0001007 2,565,043 98,642
Islami Bank BD Ltd Gandria A/c No-5107 5,000 5,000
IFIC Bank Ltd K.Bazar A/c No-124260001 2,561,806 115,651
Jamuna Bank Ltd Dhilkusha A/c No-0195 340,651 131,050
Janata Bank Ltd Bangshal Br. A/c No-040010 310,510 711,327
Janata Bank Ltd Farmgate Br. A/c No-000173 70,384 64,584
Mutual Trust Bank Ltd Motijheel Br. A/c No-10672/23 55,062 (4,298)
Mutual Trust Bank Ltd Dhanmondi Br. A/c No-01875 10,000 10,000
National Bank Ltd Dhilkusha Br. A/c No-3379 167,284 78,845
National Bank Ltd Dhilkusha Br. A/c No- New Ipo 10,000 10,000
National Bank Ltd K Bazzar A/c No. 000603 4,189,319 -
NCC Bank Ltd Dhanmondhi Br. A/c No. 10127 5,144 5,804
NRB bank A/c No 22067 10,000 10,000
One Bank Ltd Dhilkusha Br. A/c No. 238007 300,119 187,074
Prime Bank Ltd K.Bazzar A/c No 8756 548,863 618,871
Primier Bank Ltd Gulshan Br. A/c 7477 4,017 4,017
Pubali Bank Ltd Tejgaon A/c No. 0017 2,360 2,360
Pubali Bank Ltd Tejgaon A/c No. 009161 846,086 175,135
Rupali Bank Ltd Green Road A/c No. 000155 412,118 68,388
Southeast Bank Ltd Dhanmondhi Br.-25 A/c No. 9826 791 1,830
Southeast Bank Ltd Dhanmondhi Br. A/c No. 000939 27,035 27,035
Southeast Bank Ltd Unit-2 A/c No. 00025 3,517,005
Shajalal Bank Ltd Motijheel Br. A/c No. 6337 189,982 222,972
Social Islami Bank Ltd Motijheel Br. A/c No. 37219 7,598 7,803
Social Islami Bank Ltd Panthopath Br. A/c No. 000979 261,134 176,922
Sonali Bank Ltd A.H.M Br. A/c No. 000097 619,468 119,468
Sonali Bank Ltd Tejgaon Br. A/c No. 000032 168,984 167,710
Sonali Bank Ltd Motejheel Br. A/c No. 8235 5,000 5,000
Sonali Bank Ltd RJC Motejheel Br. A/c No 131303006 397,699 1,229,985
State Bank Of India A/c No. 202001 7,580 7,580
United Commercial Bank Ltd Mohakhali Br. A/c No. 000177 256,913 482,399
United Commercial Bank Ltd Naya Bazar Br. A/c No. 000125 56,284 55,690
Uttara Bank Ltd A.H.M Br. A/c No. 212361 69,660 839,098
Total 33,607,708 19,238,555
16
Amounts in Taka
30th September
2016 30th June 2016
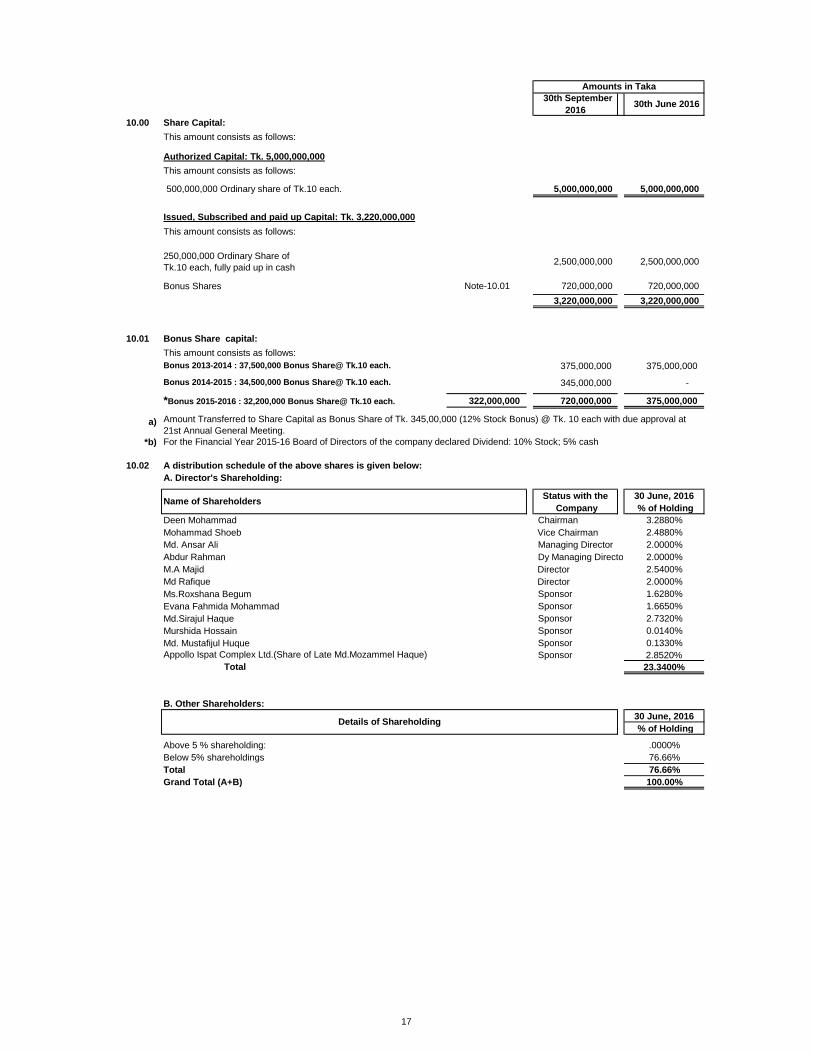
10.00 Share Capital:
This amount consists as follows:
Authorized Capital: Tk. 5,000,000,000
This amount consists as follows:
500,000,000 Ordinary share of Tk.10 each. 5,000,000,000 5,000,000,000
This amount consists as follows:
250,000,000 Ordinary Share of
Tk.10 each, fully paid up in cash 2,500,000,000 2,500,000,000
Bonus Shares Note-10.01 720,000,000 720,000,000
3,220,000,000 3,220,000,000
10.01 Bonus Share capital:
This amount consists as follows:
375,000,000 375,000,000
345,000,000 -
322,000,000 720,000,000 375,000,000
a)
*b)
10.02 A distribution schedule of the above shares is given below:
A. Director's Shareholding:
Status with the 30 June, 2016
Company % of Holding
Deen Mohammad Chairman 3.2880%
Mohammad Shoeb Vice Chairman 2.4880%
Md. Ansar Ali Managing Director 2.0000%
Abdur Rahman Dy Managing Director 2.0000%
M.A Majid Director 2.5400%
Md Rafique Director 2.0000%
Ms.Roxshana Begum Sponsor 1.6280%
Evana Fahmida Mohammad Sponsor 1.6650%
Md.Sirajul Haque Sponsor 2.7320%
Murshida Hossain Sponsor 0.0140%
Md. Mustafijul Huque Sponsor 0.1330%
Sponsor 2.8520%
Total 23.3400%
B. Other Shareholders:
30 June, 2016
% of Holding
Above 5 % shareholding: .0000%
Below 5% shareholdings 76.66%
Total 76.66%
Grand Total (A+B) 100.00%
*Bonus 2015-2016 : 32,200,000 Bonus Share@ Tk.10 each.
Bonus 2013-2014 : 37,500,000 Bonus Share@ Tk.10 each.
Bonus 2014-2015 : 34,500,000 Bonus Share@ Tk.10 each.
Details of Shareholding
Issued, Subscribed and paid up Capital: Tk. 3,220,000,000
Name of Shareholders
Appollo Ispat Complex Ltd.(Share of Late Md.Mozammel Haque)
Amount Transferred to Share Capital as Bonus Share of Tk. 345,00,000 (12% Stock Bonus) @ Tk. 10 each with due approval at
21st Annual General Meeting.
For the Financial Year 2015-16 Board of Directors of the company declared Dividend: 10% Stock; 5% cash
17

Amounts in Taka
30th September
2016 30th June 2016
Classification of Shareholders by holding:
30 June, 2016 30 June, 2016
No. of holders % of Holding
Less than 500 Shares 10,388,439 43,231 3.23%
501to 5000 Shares 18,359,111 9,504 5.70%
5,001 to 10,000 Shares 14,179,644 1,937 4.40%
10,001 to 20,000 Shares 17,556,963 1,219 5.45%
20,001 to 30,000 Shares 11,877,514 476 3.69%
30,001 to 40,000 Shares 8,133,026 230 2.53%
40,001 to 50,000 Shares 7,216,414 155 2.24%
50,001 to 100,000 Shares 17,906,035 252 5.56%
100,001 to 1,000,000 Shares 37,986,889 168 11.80%
1,000,000 toabove Shares 178,395,965 33 55.40%
322,000,000 57,205 100.00%
11.00 Share Premium:
This amount consists as follows:
1,200,000,000 1,200,000,000
1,200,000,000 1,200,000,000
12.00 Revaluation Surplus:
This is as per last Account
*Land & Land Development 1,141,578,189 1,141,578,189
1,141,578,189 1,141,578,189
13.00 Retained Earnings:
This amount consists as follows:
Balance brought forward Note-13.01 1,966,606,296 1,790,573,121
Add. Profit for the period 216,581,356 753,449,659
2,183,187,652 2,544,022,780
- (146,166,484)
- (86,250,000)
-
(345,000,000)
Balance carried forward 2,183,187,652 1,966,606,296
13.01 Opening Retained Earnings:
This amount consists as follows:
Balance Brought Forward 1,966,606,296 1,966,606,296
Less:Impairments - -
Add: Borrowing cost - -
1,966,606,296 1,966,606,296
Less: Cash Dividend paid to share holder as per approval at 21st Annual General
Meeting from 287,50,000 shares @3%
Less: Amount Transferred to Share Capital as Bonus Share of 375,00,000 (15% Stock
Bonus) @ Tk. 10 each with due approval at 20th Annual General Meeting.
100,000,000 Ordinary Share of Tk.12 each, fully paid up in cash
No of Shares
*The revaluation of Land has been done on June 30, 2012 by A.Wahab & Co. Chartered Accountants , A member Firm of Lading
Edge Alliance.
Less: Reversal Tax benefit on Unabsorbed Depreciation allowance carry forwarded u/s
42(6) (Since this amount has been considered as per Assessment in nthe New Tax
Liabilities (BAS-8,Para-36)
Less: Amount Transferred to Share Capital as Bonus Share of 345,00,000 (12% Stock
Bonus) @ Tk. 10 each with due approval at 21st Annual General Meeting.
Particulars
18

Amounts in Taka
30th September
2016 30th June 2016
14.00 Long Term Borrowings and current portion:
This amount consists as follows:
Due within
one year
Due after more
than one year
Due within
one year
Due after more
than one year
D
u
Bank Asia - - 171,681,600 155,176,333
Jamuna Bank Ltd. 110,166,000 229,606,158 - -
IFIC Bank Ltd. 337,583,328 269,753,063 337,583,328 319,991,387
Mercantile Bank limited 60,000,000 132,588,522 60,000,000 139,832,575
Mutual trust Bank limited 82,677,252 21,703,749 82,677,252 43,486,200
NCC Bank limited 100,404,000 50,772,169 100,404,000 72,267,598
Southeast Bank Ltd 11,027,120 - 14,477,444 -
GSP Finance & Investment Ltd. 13,960,956 33,618,872 14,000,004 33,579,824
GSP Finance Company Ltd.(Lease) - 51,159,899 - 51,159,899
Phienix Finance & Investment Ltd 73,282,164 201,319,315 73,282,164 197,380,806
Islamic Finance & Investment Ltd 55,593,960 125,091,812 55,593,960 124,568,605
Social Islami Bank limited 60,087,072 36,714,648 60,087,072 51,412,342
Total 904,781,852 1,152,328,207 969,786,824 1,188,855,569
15.00 Short Term Borrowings:
This amount consists as follows:
Jamuna Bank Ltd (TR) 303,564,149 150,457,423
Mutual Trust Bank Ltd (TR) 126,732,224 123,241,930
IFIC Bank Ltd (Force/Loan) - 10,309,961
IFIC Bank Ltd (TR) 147,108,615 139,761,337
IFIC Bank Ltd (Deferred) 110,673,949 150,339,235
GSP Finance Company Ltd. 101,166,667 101,166,667
Southeast Bank Ltd (TR) 80,711,102 60,993,377
Phienix Finance & Investment Ltd 155,319,289 150,698,333
Loan general with IFIC bank Ltd 111,747,223 100,144,444
Time loan with Jamuna bank Ltd. 150,850,708 60,226,956
Total 1,287,873,926 1,047,339,663
16.00 Bank Overdraft:
This amount consists as follows:
Jamuna Bank 61,471,585 41,293,370
Dhaka Bank Ltd. K Bazar 3,996,872 3,774,063
National Bank Ltd. K Bazzar - 1,125,803
IFIC Bank Ltd. 152,477,230 152,560,872
Total 217,945,687 198,754,107
17.00 Liabilities for Expenses:
This amount consists as follows:
Audit fee 950,000 457,500
Electricity 5,186,934 12,736,463
Gas 17,460,060 11,802,406
Salary and Allowances 10,425,092 8,198,003
Wages and Salary 1,389,655 2,817,998
AIT payable 276,335 325,149
Income Tax Deducted at source from Salary 234,693 746,443
Income Tax Deducted at source -others 208,870 500,737
VAT Deducted at source 3,365,125 3,059,155
AGM Expenses 1,896,050 2,590,800
Telephone 280,642 332,132
Contribution to Providend fund 7,341,088 5,980,229
49,014,543 49,547,015
As on 30 September 2016Name of Bank
As on 30 June 2016
This represent the present outstanding balances of the above term loans. The above loans are secured by personal guarantee of
the director of the company and the pari passu sharing agreement between banks on fixed and flouting assets of the company. The
interest rate of this loans are varying from 11%-14%. The Payment of installment were being made regularly.
19

Amounts in Taka
30th September
2016 30th June 2016
18.00 Trade & Other Payables:
This amount consists as follows:
Trade Payables 18.01 10,527,512 17,961,041
Other Payables 18.02 8,802,997 8,991,943
19,330,509 26,952,984
18.01 Trade Payables:
AK Traders 3,582,630 3,782,659
Airtech - 257,500
AbulHossain &Co 245,820 1,716,700
Ator Banu Traders 846,520 446,450
Basundhara Industrial Complex - 875,000
B2B Communication 85,000 1,275,774
Bengal Carbon & Teflon Tech 49,140 94,500
BRB Cable Industries Ltd 922,716 1,058,161
Encon 166,350
Mr.Jalil Traders 2,436,000 2,774,522
MD Steel Casting Indus. - 500,000
Hazi Zabbar Enterpries 524,800 328,548
Deluar Paint & Hardware - 120,600
Motaleb Iron Store - 30,000
Sensotec Automation & Control - 69,000
System Engineering - 40,000
The Easten Chemicals Ltd 25,860 777,812
HR International 245,000 1,088,339
J.Co Battery(Antimoni) 148,952 189,893
Royal Rubber Insd. 85,690 648,725
Sunrise chemical 1,329,384 1,720,508
10,527,512 17,961,041
18.02 Other Payables:
Dividend Unpaid 3,848,508 3,747,454
IPO Applicant (Refund warrant with Bank Asia) 4,954,489 4,954,489
Satcom IT Ltd - 290,000
8,802,997 8,991,943
19.00 Provision for Income Tax:
This amount consists as follows:
Opening balance 210,488,801 295,754,089
Provision made during the Period 69,969,679 166,714,792
280,458,480 462,468,881
Note-19.01 - 251,980,080
- -
- 251,980,080
Closing balance 280,458,480 210,488,801
Less: Adjusted/Paid during the Period as per Assessment
Less: Tax benefit on Unabsorbed Dep.allowance Carry Forwrded
20

Amounts in Taka
30th September
2016 30th June 2016
20.00 Liabilities for Deffered Tax:
This amount consists as follows:
Carrying Value of Fixed Assets 1,040,881,975 1,065,533,438
As Tax Base 547,783,634 547,783,634
Temporary Difference 493,098,340 517,749,804
Addition not included in Tax Base (233,531,835) (231,494,016)
Net Temporary Difference 259,566,505 286,255,788
Deffered Tax Liabilities @25% 64,891,626 71,563,947
Deferred Tax Liability/Expenses - -
Deferred Tax Asset/Income during
the Period (6,672,321) (1,325,202)
21.00 Other Provisions:
This amount consists as follows:
Provision For Gratuity Note-21.01 22,393,510 17,684,181
Provision for Workers Profit Participation & Welfare Fund Note-21.02 93,236,349 78,505,890
Provision for Bad Debts Note-21.03 33,106,810 32,174,198
148,736,668 128,364,269
21.01 Provision For Gratuity:
This amount consists as follows:
Opening balance 17,684,181 13,979,013
Add. Addition made during the period 4,851,713 7,231,240
Less: Gratuity Paid 142,384 3,526,072
Total 22,393,510 17,684,181
21.02
This amount consists as follows:
Opening balance 78,505,890 62,329,095
Add. Addition made during the period 14,730,459 35,097,851
Less: Paid during the year as per rule - -
(80% of Tk.35,476,981=2/3rd of 28,381,585) (18,921,056)
Total 93,236,349 78,505,890
21.03 Provision for Bad Debts:
This amount consists as follows:
Opening balance 32,174,198 23,098,707
Add. Addition made during the period 2,707,612 12,663,991
34,881,810 35,762,698
Less: Recovery during the year 1,775,000 3,588,500
Closing balance 33,106,810 32,174,198
The Company made provision for Workers Profit Participation Fund (WPPF) @ 5% of the profit before charging such expense .
The company has decided to adopt policy of reorganization of deferred tax in accordance with the Bangladesh Accounting Standard
12 (BAS). Deferred tax is provided using the liability method for temporary difference between the carrying value of fixed assets as
per accounts and the corresponding income tax written down value. Deferred tax is calculated at the effective Income Tax rate
Prevailling at balance sheet date.
The Company made provision for gratuity equivalent to two months basic pay for all ellegible employee during the year.
Provision for Workers Profit Participation & Welfare Fund:
21

Amounts in Taka
30th September
2016 30th June 2016
22.00 Net Turnover:
This amount consists as follows:
CI Sheet 1,345,250,096 1,326,841,259 3,845,575,221
CR Coil 255,343,698 343,793,789 793,175,547
GP Coil 148,580,000 30,385,678 573,633,091
Ridge 12,125,176 23,506,097 93,990,279
Total 1,761,298,970 1,724,526,822 5,306,374,138
23.00 Cost of Sales:
This amount consists as follows:
Opening Work in Process 994,516,675 1,167,279,440 1,167,279,440
Add. Raw Materials Consumed Note- 23.01 1,252,146,014 866,197,001 3,186,850,618
Total Work in Process 2,246,662,690 2,033,476,441 4,354,130,058
Less: Closing Work in Process 982,585,645 781,555,556 994,516,675
Total Consumption 1,264,077,045 1,251,920,885 3,359,613,382
Add: Factory Overheads Note- 23.02 92,453,083 84,433,765 409,577,119
Cost of Production 1,356,530,128 1,336,354,650 3,769,190,501
Add: Finished Goods (Opening) 629,113,625 972,151,500 972,151,500
Finished Goods Available 1,985,643,753 2,308,506,150 4,741,342,001
Less: Finished Goods (Closing) 653,572,134 1,000,225,557 629,113,625
Cost of goods sold 1,332,071,619 1,308,280,593 4,112,228,376
23.01 Raw Materials Consumed:
This amount consists as follows:
A. Opening Stock of Raw Materials 809,335,364 816,608,168 816,608,169
HR Coil 428,327,659 456,684,025 456,684,025
Zinc Ingot 314,302,885 311,075,631 311,075,631
Chemical 20,967,799 34,220,923 34,220,924
Spare parts 45,737,021 14,627,589 14,627,589
B. Add: Raw Materials Purchased 1,252,352,863 693,143,806 3,179,577,814
HR Coil 979,314,026 642,052,567 2,214,436,351
Zinc Ingot 207,358,022 23,510,857 805,867,708
Chemical 48,223,603 19,982,188 99,440,843
Spare parts 17,457,212 7,598,194 59,832,912
C. Raw Materials available for Consumption (A+B) 2,061,688,227 1,509,751,974 3,996,185,982
D. Less: Closing Stock of Raw Materials 809,542,213 643,554,973 809,335,364
HR Coil 503,556,807 588,286,803 428,327,659
Zinc Ingot 218,876,037 37,004,560 314,302,885
Chemical 30,537,899 6,991,091 20,967,799
Spare parts 56,571,470 11,272,519 45,737,021
Raw Materials Consumption (C-D) 1,252,146,014 866,197,001 3,186,850,618
23.1.1 Raw Materials Consumption:
This amount consists as follows:
HR Coil 904,084,878 510,449,789 2,242,792,717
Zinc Ingot 302,784,870 297,581,928 802,640,454
Chemical 38,653,503 47,212,020 112,693,968
Spare parts 6,622,763 10,953,264 28,723,480
1,252,146,014 866,197,001 3,186,850,618
30 June' 2016 July'15 to Sept'15
Amounts in Taka
July'16 to
Sept'16
22

Amounts in Taka
30th September
2016 30th June 2016
23.02 Factory Overheads:
This amount consists as follows:
Depreciation 25,354,817 25,289,637 106,696,543
Electricity Bill 25,293,578 27,216,490 136,845,101
Electric lighting & fittings 1,283,156 801,155 3,603,675
Gas Bill 9,391,957 7,782,231 37,209,808
Entertainment 152,901 679,000 679,000
Insurance Premium on Fire and RSD 1,570,817 1,095,864 17,154,560
Other Production Materials - - 1,210,555
Office maintenance factory 61,435 487,289 510,848
Loading & unloading charge 504,505 941,505 69,220
Labour and carrying charge 329,129 329,118 4,765,243
Medical Expenses 75,508 30,550 39,422
Repair and Maintenance 2,641,108 2,704,039 33,274,503
Travel & conveyance 14,424 24,363 98,203
Postage & courier 17,813 - 36,500
Salary and Allowances 10,189,532 6,036,250 26,240,213
Telephone 2,000 7,751 218,776
Wages and Allowances 15,570,402 11,008,523 40,924,949
92,453,083 84,433,765 409,577,119
24.00 Administrative Expenses:
This amount consists as follows:
Audit Fee 500,250 100,000 442,750
Accounting software expenses 15,000 202,500 582,400
AGM Expenses - 516,750 2,590,800
Bond Stamp 3,300 8,370 37,065
Board Meeting Expenses 75,000 65,000 169,000
Business Development 167,500 266,000 2,657,514
Canteen Expenses 193,117 148,659 650,516
Consultancy & services charge 166,500 150,000 529,625
Conveyance 305,099 352,555 1,299,460
Director Remuneration 2,802,960 1,923,999 8,337,330
Depreciation 1,334,464 1,331,034 5,615,608
Donation 347,000 131,800 956,962
Electricity 75,000 362,000 963,639
Entertainment 479,528 673,764 4,889,799
Fees and Professional Charges 239,267 202,400 1,638,684
Tour &Travels Expenses 58,588 145,870 373,354
Tour expenses 631,171 364,944 670,011
Gift & Presentation - 219,854 460,988
Iftary Allowances - 281,250 959,250
Legal Fee 309,351 564,490 849,172
License and Renewal Fee 165,850 109,743 283,820
Liveries and Uniform 52,000 103,400 204,850
Miscellaneous Expenses 26,056 170,140 575,875
Medical Expenses 14,715 3,311 51,786
Newspaper and Periodicals 6,225 7,168 30,814
Office Rent 995,820 955,501 2,766,242
Office Refreshment Expenses 64,621 61,760 268,327
a) Salary and Allowance includes salary and allowances, bonus and leave pay / Notice pay.& Wages and allowances includes
Wages and overtime.
b) Repair and Maintenance includes Factory maintenance, Forklift maintenance, Generator maintenance, Machinery maintenance,
Boiler Machine maintenance, Factory building maintenance, Crane maintenance and Vehicle maintenance.
23

Amounts in Taka
30th September
2016 30th June 2016
Plantation 19,775 13,925 34,455
Postage and courier 3,323 5,248 381,243
Printing & Stationary 66,005 8,951 240,302
Rent, Rates and Taxes 899,867 140,000 1,004,055
Repairs and Maintenance 1,388,909 1,046,269 5,144,473
Salary and Allowances including PF contribution (Note: 24.01) 20,335,468 19,580,237 69,921,903
Stationery expenses 20,945 210,423 277,421
Stock exchange &fees /CDBL exp/BO A/c fees - 2,665,492
Telephone & Internet 747,488 334,196 2,574,278
Training Expenses 10,000 4,875 23,350
Traveling & Conveyance 24,870 1,298,120
Total 32,520,162 30,791,255 122,420,732
24.01 Key Management Personnel Compensation:
Short term employee benefits (Salary and other allowances) 5,025,000 4,121,323 16,503,823
Post employment benefits ( provident fund, gratuity etc.) 270,750 215,073 540,383
5,295,750 4,336,396 17,044,206
Key management personnel includes employees of the rank of Deputy Managers (DGM), DGM equivalent and above.
25.00 Selling and Distribution Expenses:
This amount consists as follows:
Advertisement 399,915 322,553 8,310,066
Delivery charges 1,344,608 570,761 5,779,437
Entertainment 79,283 27,854 4,335,429
Other Expenses 50,423 60,650 35,948
Traveling & Conveyance expenses 211,350 125,478 615,149
Salary and Allowances 2,342,640 2,962,364 6,273,349
Sales promotion expenses 1,079,470 791,666 9,264,271
Bad debts 2,707,612 1,306,795 12,663,991
Telephone Expenses 92,530 103,842 375,890
8,307,831 6,271,963 47,653,530
Note: Salary and allowance includes salary and allowance, Bonus, overtime and Leave pay.
26.00 Financial Expenses:
This amount consists as follows:
Bank Charge & Commission 122,667 403,943 4,586,117
Bank Guarantee Commission 954,270 175,731 2,592,701
Interest on bank Loan 123,594,681 102,856,267 383,530,678
Exchange Rate Fluctuation Loss/(Gain) (4,730,108) 549,744 5,842,810
Total 119,941,510 103,985,684 396,552,306
27.00 Non Operating Income:
This amount consists as follows:
Scrap sales and Others 28,562,351 36,566,850 78,268,024
2,440,686 2,343,043 3,520,573
Profit/(Loss) on Investment Note:27.02 - - (119,531)
Total 31,003,037 38,909,893 81,669,066
27.01 Income from Bank Interest:
This amount consists as follows:
Interest on Dividend Account 147,907.37 - -
Interest on FDR 2,292,779 2,343,043 3,520,573
2,440,686.37 2,343,043 3,520,573
Other Income-Interest Received/Receivable Note:27.01
Note: Salary and allowance includes salary and allowance, Bonus, overtime ,Profit sharing(WPPF) and Leave pay. Repair and
Maintenance includes maintenance of air condition, maintenance of office and maintenance of vehicles. Fees & Professional
Charge includes Professional fees, Fees & Fines, Renewal fees.
24

Amounts in Taka
30th September
2016 30th June 2016
27.02 Loss on Investment:
This amount consists as follows:
a) Phoenix Holding Ltd. - - 119,531
Total Loss on Investment - - 119,531
28.00 Taxation:
This amount consists as follows:
Current Tax expenses 69,969,679 74,427,755 166,714,792
- - (251,980,080)
Deferred Tax (income)/expenses (6,672,321) (6,655,168) (1,325,202)
Total 63,297,358 67,772,587 (86,590,490)
28.01 Prior year Income Tax Provision adjustment as per Tax Assessment ( BAS-8, Para 36 and BAS-37, Para 59)
Assessment Tax Liabilities
as Per
Provision
Surplus/
year Assessment (Shortage)
2009-2010 2010-2011 60,692,348 48,361,196 12,331,152
2010-2011 2011-2012 156,166,013 127,002,527 29,163,486
2011-2012 2012-2013 270,238,344 114,552,416 155,685,928
2012-2013 2013-2014 227,175,757 157,080,190 70,095,567
2013-2014 2014-2015 130,288,481 145,584,534 (15,296,053)
844,560,943 592,580,863 251,980,080
29.00 Earning Per Share:
This amount consists as follows:
The composition of earning per shares (EPS) is given below:
Profit after taxation 216,581,356 229,938,431 753,449,659
Number of ordinary share at the period end 322,000,000 287,500,000 322,000,000
Earnings Per Share (EPS) 0.67 0.80 2.34
Number of ordinary shares Considering the 2015-16 Stock Dividend 354,200,000 354,200,000 354,200,000
Earnings Per Share (EPS) (Restated) 0.61 0.65 2.13
30.00 Net Assets Value Per Share
This amount consists as follows:
The composition of net assets value per share is given below:
Total Assets 11,870,127,340 11,419,837,664
Non-Current Liabilities+Current Liabilities 4,125,361,498 3,891,653,179
Net Assets Value(NAV) including Revaluation surplus 7,744,765,842 7,528,184,485
322,000,000 322,000,000
Net Assets Value(NAV)per share including Revaluation surplus 24.05 23.38
Net Assets Value(NAV) excluding Revaluation surplus 6,603,187,653 6,386,606,296
Net Assets Value(NAV) Per Share excluding Revaluation surplus 20.51 19.83
Share of holding loss for the year ended 30 june 2016 Tk. 398,435 @30%
Provision as Per
Accounts
Tax Provision as per Assessment Order Note:28.01
Income Year
The Income Tax assessments for the following assessment years has been completed U/S-83(2),156/159/173of IT ordinance on
1984. The Accounting Income Tax provision was higher than those of the Tax Liability as per assessment order for those years by
learned Income Tax authority. Consequent upon the assessment order accounting treatment for excess/short provision has been
made as per ,BAS-8, Pragraph-36, and BAS-37, Paragraph 59
This has been calculated in compliance with the requirements of BAS 33: Earning per share is the basic earning dividing by the
weighted average number of ordinary shares outstanding the end of the year.
25

Amounts in Taka
30th September
2016 30th June 2016
31.00 Cash flow per share from operating activities July'16 to Sept'16 July'15 to Sept'15 30th june 2016
Net Operating Cash Flows per Share 0.22 0.72 3.65
Net Operating Cash Flows per Share- (Restated) for 354200000 Shares 0.20 0.58 3.32
considering the 2015-16 Stock Dividend
The composition of cash inflow/(outflow) value per share is given below:
Operating Cash Flow 69,458,059 206,137,770 1,176,130,388
Ordinary Number of Share 322,000,000 287,500,000 322,000,000
32.00 Related parties transaction
Name of the parties Relationship Nature of Outstanding
value
Phoenix Finance and Investments
Ltd.
Common
ShareholderTerm Loan 429,920,768
Phoenix Insurance Company Ltd.Common
ShareholderInsurance Nil
Eastern Dyeing and Calendaring
Works Ltd.
Common
ShareholderOffice Rent Nil
33.00 Employees:
Particulars Permanent ProvisionalTotal No. of
Employee
Below Basic Tk
6,000/-
Officer 131 0 131 -
Staff 90 2 92 51
Workers 232 0 232 126
Total 453 2 455 177
34.00 Proposal of dividend:
35.00 Approval of the Financial Statements:
These financial statements were authorized for issue in accordance with a resolution of the company's board meeting on 14th
November 2016.
As per Bangladesh Accounting standards (BAS) 24 "Related party Disclosure" , Parties are considered to be related if one of the
party has the ability to control the other party or exercise significant influence over the other party is making financial and operating
decision. APPOLLO ISPAT COMPLEX Ltd carried out transaction in the ordinary course of the business on an arm's length basis at
commercial rate with its related parties. During the year, the company carried out transactions with related parties.
The name of the related parties and nature of these transactions have been set out in accordance with the provisions of BAS-24.
Related parties disclosure are given below:
The Board of Directors recommended for the shareholders cash dividend @ 5% and Stock dividend @ 10% on 3,220,000,000
shares for the FY 2015-16. This will be considered for approval of the shareholders at the 22nd Annual General Meeting to be held
on th day of 22nd December 2016.
The Company had 453 Permanent and 2 provisional employees as on 30 September 2016 (2015:383) and a varying number of
seasonal and temporary workers (about 145) as required. The table given below shows the segregation of those employees:
Chief Financial Officer Managing Director Chairman
DirectorCompany Secretary
26