Embed Size (px)
Citation preview
AMSL Report No11105.2- annex LochaffortAugust 2018 EMBZ assessment
VWU14 ANDERSON MARINE SURVEYS
Report To: Marine Harvest ( Scotland) Ltd
Issued By: SJA
Date: 08 December 2018
ort
Farm Discharge Dispersion
dission A
Introduction
Marine Harvest ( Scotland) operates a freshwater farm production site nearLochailort, with a wastewater discharge to Loch Ailort authorized by SEPA under anexisting Controlled Activity Regulations ( CAR) licence'. Previous desktopassessments considered dispersion of effluent from an outfall to approximately MeanLow Water Springs ( MLWS) ( AMSL report 11/ 03. 1), and subsequently for analternative outfall, extended to a water depth of 20mCD ( AMSL report 11/ 05. 2 revl ).
The current discharge is via the 20mCD outfall. Previous assessments consideredinitial dilution, plume dispersion and changes to the numerical limits for Ammonia, Biological Oxygen Demand ( BOD) and Suspended Solids (SS); together withmedicine residues formaldehyde, bronopol ( pyceze) and chloramine - T.
The following supplementary assessment considers the potential environmentaleffects of Slice treatment ( active ingredient: emamectin benzoate, EMBZ) of smogsprior to transfer to sea. The maximum biomass that would be potentially held on sitewould be 320T and the proposed Slice treatment would involve the fish being fedwith 67kg of medicated feed ( 134g EMBZ) over a 7 day period.
The assessment is made on the basis that the onsite wastewater treatment systemachieves a solids removal efficiency of 50%; and that an equivalent proportion of
EMBZ is removed from wastewater. This is regarded as a conservative assumptionMH pers. comm.).
Treatment and Excretion
Treatment and excretion characteristics for EMBZ in salmon are complex andavailable information is outlined by SEPA ( 2005).
EMBZ treatment period is seven consecutive days. SEPA ( 2005, section H: 2. 2. 2)
states that it has been determined that 10% of the dose is excreted during the
Made under the Water Environment ( Controlled Activities) Regulations 2005
page
AMSL Report No11105. 2 - annex
August 2018
Lochailort
EMBZ assessment
treatment period. Of the remaining 90% of the chemical, approximately 99% isexcreted over the subsequent 216 days. This excretion has an exponential decayprofile such that 50% of the chemical remaining in the fish is released, on average,
over every 36- 37 day period.
Annex H ( section H: 3. 6.2) further summarises discharge characteristics for EMBZ
1. a quantity of medicated feed ( Fa) is fed to the fish over seven days, carrying anassociated applied chemical load ( Ma);
2. 97% of the medicated feed is consumed (Fc); the remainder (39/6) is wasted (Fw) and carries an associated chemical load ( Mw);
3. of the consumed medicated feed ( Fc), 10'0 of the active ingredient load is
excreted immediately (Mt);
4. the remaining 90% ( MO) of the active ingredient load, the body load, on theconsumed medicated feed (Fc) is excreted at an exponential rate, 50% of any
initial body load being excreted over 36 days.
Excretion rate can therefore be calculated from a half- life of 36 days,
Daily excretion = 1- e^( In( 0. 5)/ 36) = 1. 91%
Non -excreted ( retained) dose = e^( In( 0. 5)/ 36) = 98.09% of preceding day's body load
In relation to the proposed treatment of smolts at Lochailort, it is therefore possible to
calculate daily values of the following parameters:
Consumed dose = 97% of treatment dose ( 134g EMBZ over 7 days)
Wasted dose = 3% of treatment dose
Cumulative dose = consumed daily dose + preceding daily dose
Cumulative Body load = preceding day' s body load x e^( In( 0. 5)/ 36) + consumed
dose x 0. 9
Cumulative Excreted dose = cumulative dose - cumulative body load
Excreted dose = cumulative excreted dose - preceding day' s cumulative excreteddose
Discharged dose = (excreted dose + wasted dose) x filter efficiency (50%)
Percentage excreted dose = cumulative excreted dose / cumulative dose
page 2
AMSL Report No11105. 2 - annexAuqust2018
Lochailort
EMBZ assessment
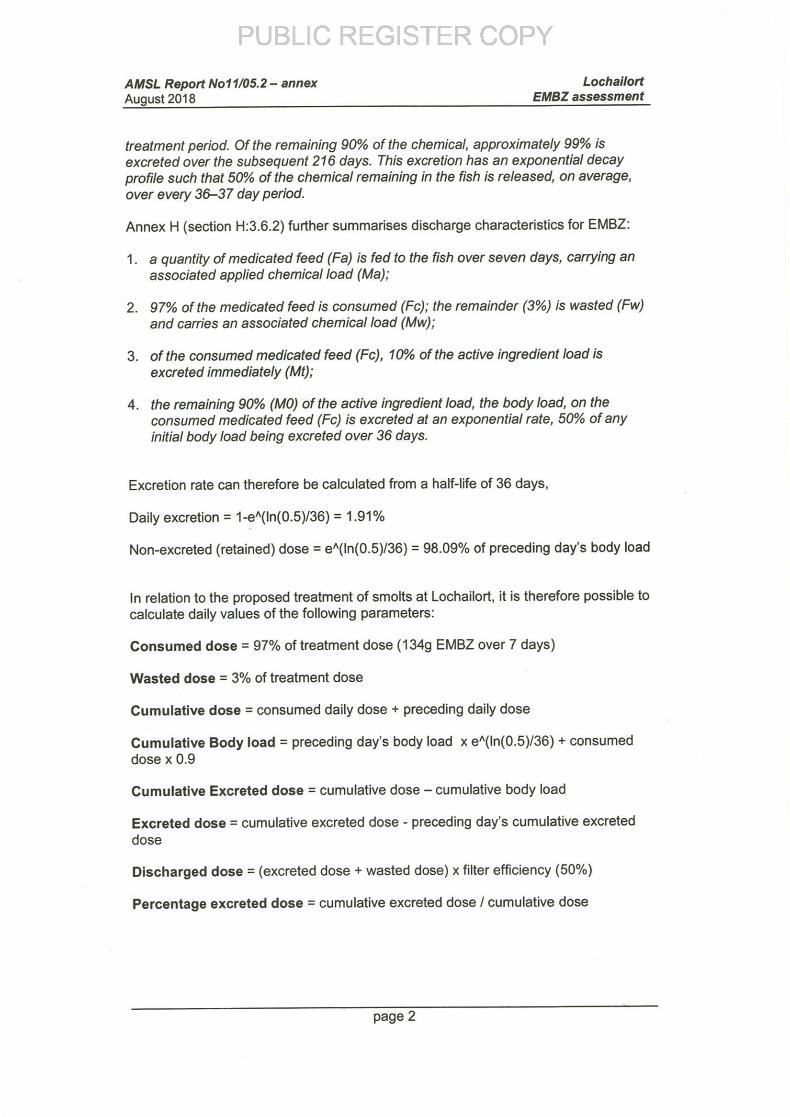
Time series plots for loads and doses are shown below: cumulative doses and loadtop), daily doses ( middle) and % excreted dose ( bottom). The latter shows
comparison with values from Annex H, Table 3. 1, indicating reasonable agreement.
140
im - -
100
y eo— cumuWw dose
a 60— cunuNYive hotly badr
40 — .. cumufz[ ive mreted dose
20 —[ U WKNe cWharaed dose
6
0 50 100 150 200 250 300 350 400 450
dop
20
1a
16
14 —
12
10—treaonerc lase
A a — Wastedd02
6 dose
4 -edcbse
2
e
0 50 100 150 200 250 300 350 400 450
dWS
ae
eareed dose
SBATade3. 1
0 50 100 150 200 250 300 350 400 450
days
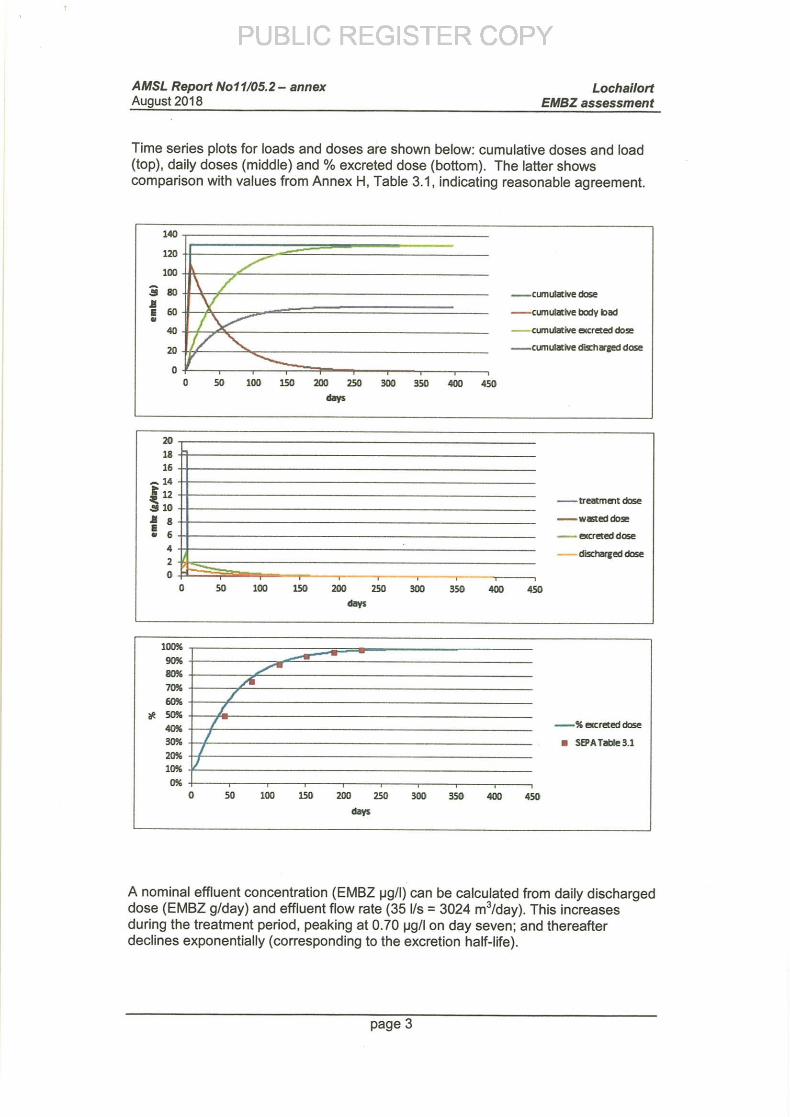
A nominal effluent concentration ( EMBZ pg/ 1) can be calculated from daily dischargeddose ( EMBZ g/ day) and effluent flow rate ( 35 I/ s = 3024 m3/ day). This increasesduring the treatment period, peaking at 0. 70 pg/ I on day seven; and thereafterdeclines exponentially ( corresponding to the excretion half - fife).
page 3
r
ae
eareed dose
SBATade3. 1
0 50 100 150 200 250 300 350 400 450
days
A nominal effluent concentration ( EMBZ pg/ 1) can be calculated from daily dischargeddose ( EMBZ g/ day) and effluent flow rate ( 35 I/ s = 3024 m3/ day). This increases
during the treatment period, peaking at 0. 70 pg/ I on day seven; and thereafterdeclines exponentially ( corresponding to the excretion half - fife).
page 3
AMSL Report No11105. 2— annex Lochailort
August 2018 EMBZ assessment
However, the majority of discharged dose will be in particulate forms, associatedeither with waste feed ( reducing from 24% to 14% of total daily discharge duringtreatment period) or faecal material ( increasing from 76% to 86% of total dailydischarge during treatment period; thereafter 100% post- treatment). In terms ofsubsequent discharge and dispersion of EMBZ residue, effluent concentration related
to volume ( EMBZ pg/ 1) is of limited relevance and assessment will focus onprocesses relevant to particulate solids ( e. g. settlement and re - suspension).
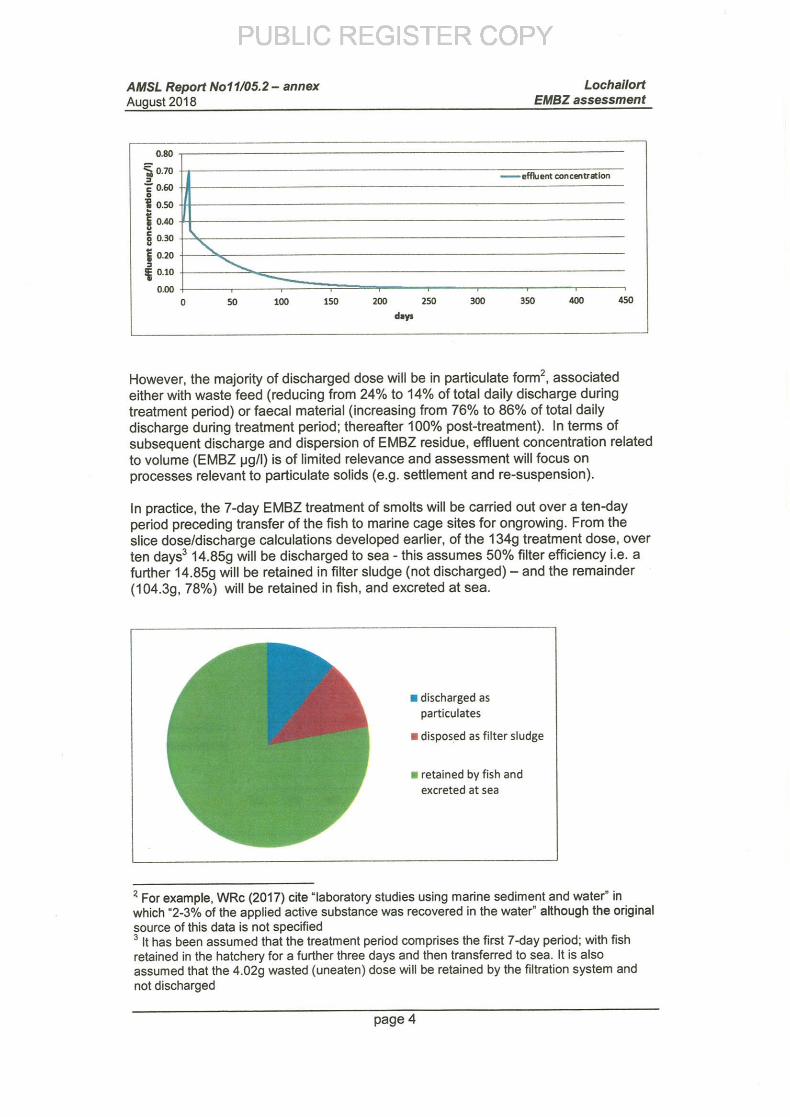
In practice, the 7 - day EMBZ treatment of smolts will be carried out over a ten- dayperiod preceding transfer of the fish to marine cage sites for ongrowing. From theslice dose/ discharge calculations developed earlier, of the 1348 treatment dose, overten days3 14. 85g will be discharged to sea - this assumes 50% filter efficiency i. e. afurther 14. 85g will be retained in filter sludge ( not discharged) — and the remainder
104. 3g, 78%) will be retained in fish, and excreted at sea.
discharged as
particulates
disposed as filter sludge
P retained by fish andexcreted at sea
I For example, WRc ( 2017) cite " laboratory studies using marine sediment and water" inwhich " 2- 3% of the applied active substance was recovered in the water" although the originalsource of this data is not specked
3 It has been assumed that the treatment period comprises the first 7 - day period; with fishretained in the hatchery for a further three days and then transferred to sea. It is alsoassumed that the 4. 02g wasted ( uneaten) dose will be retained by the filtration system andnot discharged
page
0.80
0.70effluent cmc. natwr,
C ow
e10.50OAA
g 0.300.10
0. 10
OAO
0 so 100 150 100 150 300 350 400 430
dar
However, the majority of discharged dose will be in particulate forms, associatedeither with waste feed ( reducing from 24% to 14% of total daily discharge during
treatment period) or faecal material ( increasing from 76% to 86% of total dailydischarge during treatment period; thereafter 100% post- treatment). In terms of
subsequent discharge and dispersion of EMBZ residue, effluent concentration related
to volume ( EMBZ pg/ 1) is of limited relevance and assessment will focus onprocesses relevant to particulate solids ( e. g. settlement and re - suspension).
In practice, the 7 - day EMBZ treatment of smolts will be carried out over a ten- dayperiod preceding transfer of the fish to marine cage sites for ongrowing. From the
slice dose/ discharge calculations developed earlier, of the 1348 treatment dose, overten days3 14. 85g will be discharged to sea - this assumes 50% filter efficiency i. e. a
further 14. 85g will be retained in filter sludge ( not discharged) — and the remainder
104. 3g, 78%) will be retained in fish, and excreted at sea.
discharged as
particulates
disposed as filter sludge
P retained by fish andexcreted at sea
I For example, WRc ( 2017) cite " laboratory studies using marine sediment and water" inwhich " 2- 3% of the applied active substance was recovered in the water" although the original
source of this data is not specked
3 It has been assumed that the treatment period comprises the first 7 - day period; with fishretained in the hatchery for a further three days and then transferred to sea. It is also
assumed that the 4. 02g wasted ( uneaten) dose will be retained by the filtration system andnot discharged
page
AMSL Report No11105. 2 — annex LochailortAugust 2018 EMBZ assessment
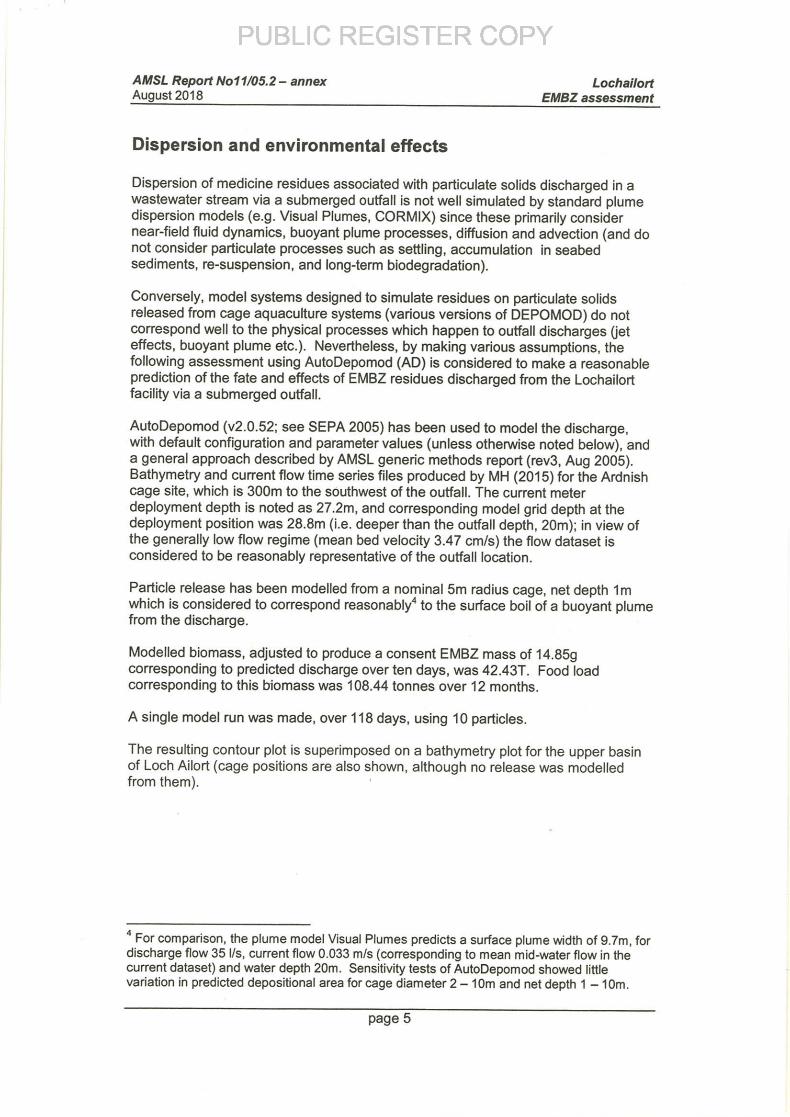
Dispersion and environmental effects
Dispersion of medicine residues associated with particulate solids discharged in awastewater stream via a submerged outfall is not well simulated by standard plumedispersion models ( e.g. Visual Plumes, CORMIX) since these primarily considernear -field fluid dynamics, buoyant plume processes, diffusion and advection ( and do
not consider particulate processes such as settling, accumulation in seabedsediments, re -suspension, and long-term biodegradation).
Conversely, model systems designed to simulate residues on particulate solidsreleased from cage aquaculture systems ( various versions of DEPOMOD) do notcorrespond well to the physical processes which happen to outfall discharges (jeteffects, buoyant plume etc.). Nevertheless, by making various assumptions, thefollowing assessment using AutoDepomod ( AD) is considered to make a reasonableprediction of the fate and effects of EMBZ residues discharged from the Lochailortfacility via a submerged outfall.
AutoDepomod ( v2. 0. 52; see SEPA 2005) has been used to model the discharge, with default configuration and parameter values ( unless otherwise noted below), and
a general approach described by AMSL generic methods report ( rev3, Aug 2005). Bathymetry and current flow time series files produced by MH ( 2015) for the Ardnishcage site, which is 300m to the southwest of the outfall. The current meter
deployment depth is noted as 27. 2m, and corresponding model grid depth at thedeployment position was 28.8m ( i.e. deeper than the outfall depth, 20m); in view ofthe generally low flow regime ( mean bed velocity 3. 47 cm/ s) the flow dataset isconsidered to be reasonably representative of the outfall location.
Particle release has been modelled from a nominal 5m radius cage, net depth 1 mwhich is considered to correspond reasonably° to the surface boil of a buoyant plumefrom the discharge.
Modelled biomass, adjusted to produce a consent EMBZ mass of 14. 85gcorresponding to predicted discharge over ten days, was 42. 43T. Food loadcorresponding to this biomass was 108. 44 tonnes over 12 months.
A single model run was made, over 118 days, using 10 particles.
The resulting contour plot is superimposed on a bathymetry plot for the upper basinof Loch Ailort ( cage positions are also shown, although no release was modelledfrom them).
4 For comparison, the plume model Visual Plumes predicts a surface plume width of 9.7m, fordischarge flow 35 I/ s, current flow 0. 033 m/ s ( corresponding to mean mid -water flow in thecurrent dataset) and water depth 20m. Sensitivity tests of AutoDepomod showed littlevariation in predicted depositional area for cage diameter 2 — 10m and net depth 1 — 1Orn.
page 5

AMSL Report No11/ 05.2— annexAuqust2018
783000
782000
781000
Lochailort
EMBZ assessment
The area of seabed affected ("footprint") can be considered as the area predicted tobe enclosed by a sediment concentration at the farrield EQS ( 0. 763 pg/ kg wet weightsediment). The modelled area affected is 12927m2, and mass balance ( i. e. EMBZresidue retained within the 1kM2 model grid) is 11g ( i. e. 74% retention). The EQSfootprint area is approximately circular and corresponds to a radius of 64. 1 m.
In relation to discharges from cage aquaculture, for new licences or variations toexisting licences where new or increased discharges of emamectin benzoate areproposed, SEPA have adopted an interim Position Statements. This species anenvironmental standard at mixing zone edge ( 100m from cage edge) of 0. 012 pg/ kgdry weight, based on a review by WRc ( 2017); although it should be noted that thisvalue is in fact based on a single measurement of toxicity to a freshwater insect. Therelationship between EMBZ concentration as pg/ kg wet weight ( as predicted byAutoDepomod) and pg/ kg dry weight has not been specked or discussed further byeither SEPA or WRc6.
s SEPA Position Statement to support the implementation of the WaterEnvironment (Controlled Activities) ( Scotland) Regulations 2011. https:// consultation. sepa. org. u k/ sector-
plan/ finfishaquaculture/ supporting_ documents/ SEPA_ position_ statement_im plementation% 2Oof% 20CAR. pdf
6 For example, WRc ( 2017), Table 6 and associated Figures 6. 1, 6.2 and 6.3 show residuelevels from SEPA monitoring data as pg/ kg without specifying wet or dry sediment; these arecompared to the proposed dry weight EQS without further comment.
page
AMSL Report Not 1105.2— annex LochailortAugust 2018 EMBZ assessment
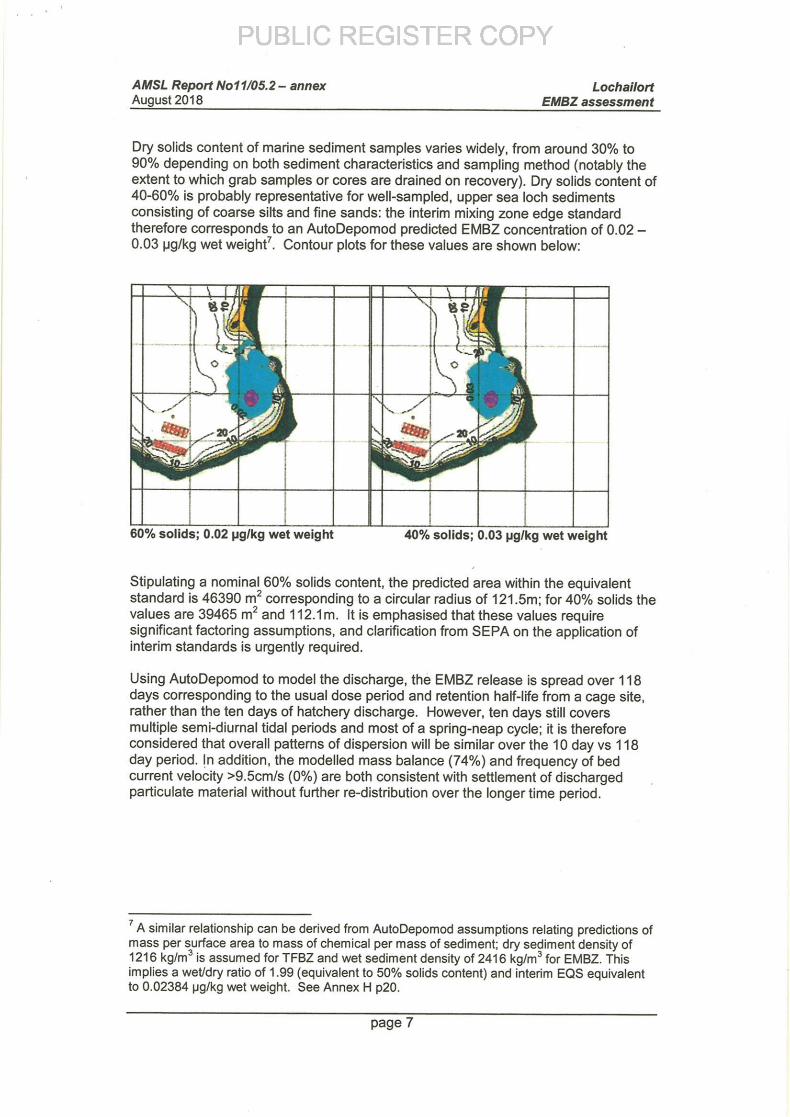
Dry solids content of marine sediment samples varies widely, from around 30% to90% depending on both sediment characteristics and sampling method ( notably theextent to which grab samples or cores are drained on recovery). Dry solids content of40- 60% is probably representative for well- sampled, upper sea loch sedimentsconsisting of coarse silts and fine sands: the interim mixing zone edge standardtherefore corresponds to an AutoDepomod predicted EMBZ concentration of 0. 02 — 0. 03 pg/ kg wet weight'. Contour plots for these values are shown below:
60% solids; 0. 02 pg/ kg wet weight 400/ 6 solids; 0. 03 pg/ kg wet weight
Stipulating a nominal 60% solids content, the predicted area within the equivalentstandard is 46390 mZ corresponding to a circular radius of 121. 5m; for 40% solids thevalues are 39465 mZ and 112. 1m. It is emphasised that these values requiresignificant factoring assumptions, and clarification from SEPA on the application ofinterim standards is urgently required.
Using AutoDepomod to model the discharge, the EMBZ release is spread over 118days corresponding to the usual dose period and retention half- life from a cage site, rather than the ten days of hatchery discharge. However, ten days still coversmultiple semi - diurnal tidal periods and most of a spring - neap cycle; it is thereforeconsidered that overall patterns of dispersion will be similar over the 10 day vs 118day period. In addition, the modelled mass balance ( 74%) and frequency of bedcurrent velocity > 9. 5cm/ s ( 0%) are both consistent with settlement of discharged
particulate material without further re - distribution over the longer time period.
A similar relationship can be derived from AutoDepomod assumptions relating predictions ofmass per surface area to mass of chemical per mass of sediment; dry sediment density of1216 kg/ m3 is assumed for TFBZ and wet sediment density of 2416 kg/ m3 for EMBZ. Thisimplies a wet/ dry ratio of 1. 99 ( equivalent to 50% solids content) and interim EQS equivalentto 0. 02384 pg/ kg wet weight. See Annex H p20.
page
r 14 1
60% solids; 0. 02 pg/ kg wet weight 400/ 6 solids; 0. 03 pg/ kg wet weight
Stipulating a nominal 60% solids content, the predicted area within the equivalentstandard is 46390 mZ corresponding to a circular radius of 121. 5m; for 40% solids the
values are 39465 mZ and 112. 1m. It is emphasised that these values requiresignificant factoring assumptions, and clarification from SEPA on the application of
interim standards is urgently required.
Using AutoDepomod to model the discharge, the EMBZ release is spread over 118days corresponding to the usual dose period and retention half- life from a cage site, rather than the ten days of hatchery discharge. However, ten days still covers
multiple semi - diurnal tidal periods and most of a spring - neap cycle; it is thereforeconsidered that overall patterns of dispersion will be similar over the 10 day vs 118
day period. In addition, the modelled mass balance ( 74%) and frequency of bedcurrent velocity > 9. 5cm/ s ( 0%) are both consistent with settlement of discharged
particulate material without further re - distribution over the longer time period.
A similar relationship can be derived from AutoDepomod assumptions relating predictions ofmass per surface area to mass of chemical per mass of sediment; dry sediment density of1216 kg/ m3 is assumed for TFBZ and wet sediment density of 2416 kg/ m3 for EMBZ. This
implies a wet/ dry ratio of 1. 99 ( equivalent to 50% solids content) and interim EQS equivalentto 0. 02384 pg/ kg wet weight. See Annex H p20.
page
AMSL Report N01105. 2 — annex Lochailort
Auaust 2018 EMBZ assessment
Conclusions
This assessment has considered the effects of possible emamectin benzoateEMBZ) treatment of smolts prior to transfer to sea. The maximum biomass that
would be potentially held on site would be 320T and to carry out a Slice treatmentwould involve the fish being fed with 67kg of medicated feed ( 134g EMBZ) over a 7day period. Treated wastewaters from the site are discharged to sea via an outfall, which is at a water depth of 20mCD.
Consideration of treatment and excretion characteristics for EMBZ in salmon, together with the predicted efficiency of the onsite wastewater treatment system, hasconcluded that of the 134g treatment dose, 14. 85g will be discharged via the outfall, and a further 14.85g will be retained in filter sludge ( not discharged). The remainder104. 3g, 78%) will be retained in fish, and excreted at the marine cage sites to which
the fish are transferred for ongrowing.
The majority of discharged medicine residue will be in particulate form, associatedmainly with faecal material and a smaller proportion of waste feed.
AutoDepomod ( v2. 0. 52) has been used to model the discharge, with hydrographicdata collected at the adjacent Ardnish cage site. Particle release has been modelledfrom a nominal 5m radius cage, net depth 1m which is considered to correspond
reasonably to the surface boil of a buoyant plume from the discharge.
At the established Far Field Environmental Quality Standard ( EQS) for EMBZ, 0. 763pg/ kg wet weight, the modelled footprint is 12927M2, corresponding to a circularradius of 64. 1 m. Although this has no statutory significance, it is substantially belowthe generally accepted mixing zone radius ( 100m) applied to sewage and industrialdischarges ( SEPA Supporting Guidance ( WAT- SG- 11) Modelling Coastal andTransitional Discharges).
In relation to new discharges from cage aquaculture, SEPA have recently adopted aninterim Position Statement, which specifies a mixing zone edge ( at 100m from cageedge) environmental standard of 0.012 pg/ kg dry weight. Although calculatingequivalent footprint areas and radius of effect from AutoDepomod requires variousassumptions, which have not been clarified by SEPA, an indicative radius at theinterim environmental standard would be in the range 112- 122m.
References
SEPA ( 2005) Regulation and Monitoring of Marine Cage Fish Farming in ScotlandAnnex H, Methods for Modelling In -feed Anti -parasitics and Benthic Effects ( issueNo. 2. 3, 18 May 2005).
WRc (2017). Review of Environmental Quality Standard for Emamectin Benzoate. Report Reference: UC12191. 03 February 2017
page
V19mire 15sponsible Be Vocal
Safe Systems of Work — Effluent Routines
Issue date: 24/ 1/ 17 Review date: 1/ 3/ 18 Review date due to significant change: Title: Effluent Routines
Creation Team: John Richmond
Review Team: Hatcheries Area Manager
Document( s) to Review: Effluent System Checks Record Form
Effluent Belt Filter and Drum Filter Maintenance — SSW
Effluent Sand Filter Operation and Maintenance — SSW
Backwashing and Rinsing Effluent Sand Filter — SSWPermit To Work:
PPE reouin
I Task steps: I Precautions/ considerations: I
Eye Check & inform
Hazard Identification
Safety Measures
Background
Always complete an Eye -Check Risk Assessmentl
Ensure all personnel are aware of the process taking place
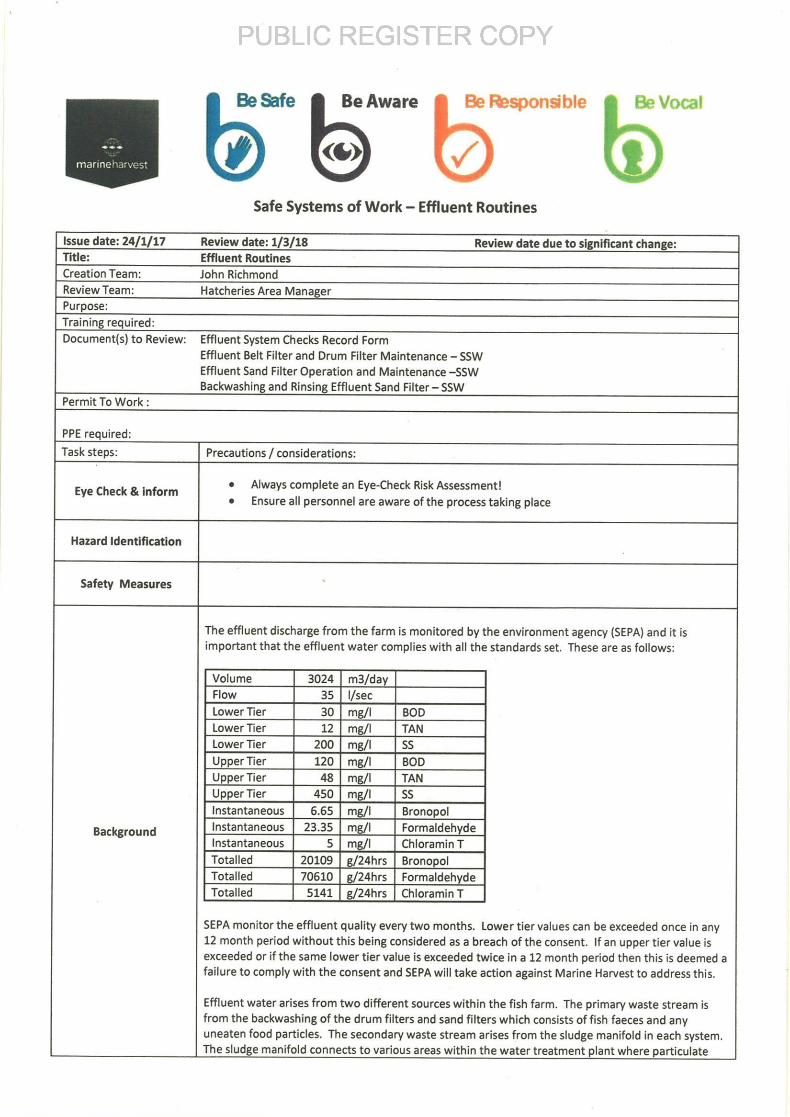
The effluent discharge from the farm is monitored by the environment agency (SEPA) and it isimportant that the effluent water complies with all the standards set. These are as follows:
Volume 3024 m3/ dayFlow 35 I/ sec
Lower Tier 30 mg/ I BOD
Lower Tier 12 mg/ I TAN
Lower Tier 200 mg/ I SS
Upper Tier 120 mg/ I BOD
Upper Tier 48 mg/ I TAN
Upper Tier 450 mg/ I SS
Instantaneous 6. 65 mg/ I Bronopol
Instantaneous 23. 35 mg/ I Formaldehyde
Instantaneous 5 mg/ I Chloramin T
Totalled 20109 g/ 24hrs BronopolTotalled 70610 g/ 24hrs FormaldehydeTotalled 5141 g/ 24hrs Chloramin T
SEPA monitor the effluent quality every two months. Lower tier values can be exceeded once in any12 month period without this being considered as a breach of the consent. If an upper tier value isexceeded or if the same lower tier value is exceeded twice in a 12 month period then this is deemed afailure to comply with the consent and SEPA will take action against Marine Harvest to address this.
Effluent water arises from two different sources within the fish farm. The primary waste stream isfrom the backwashing of the drum filters and sand filters which consists of fish faeces and anyuneaten food particles. The secondary waste stream arises from the sludge manifold in each system. The sludge manifold connects to various areas within the water treatment plant where particulate
waste might settle including the bottom of the submerged biofilters. Each day the pumps on thesludge manifold are turned on in order to remove the settled particulate. Every week a biofilter iscleaned in each system. During a biofilter cleaning event the waste generated from this is dischargedvia the sludge manifold.
The waste is all sent either directly or via one of the large buffer tanks to the conical tank and fromthere it is pumped to the polymer system. Polymer is mixed with the effluent water in order tocoagulate smaller particles together into larger particles which will be captured by the belt filter andremoved from the water. The ratio of polymer to effluent is critical to achieving the correct reaction
in order to form the coagulated particles. This procedure describes how to monitor and adjust thepolymer dose to ensure effective separation of the particulate from the water and how to check thecritical elements of the operation of the effluent system.
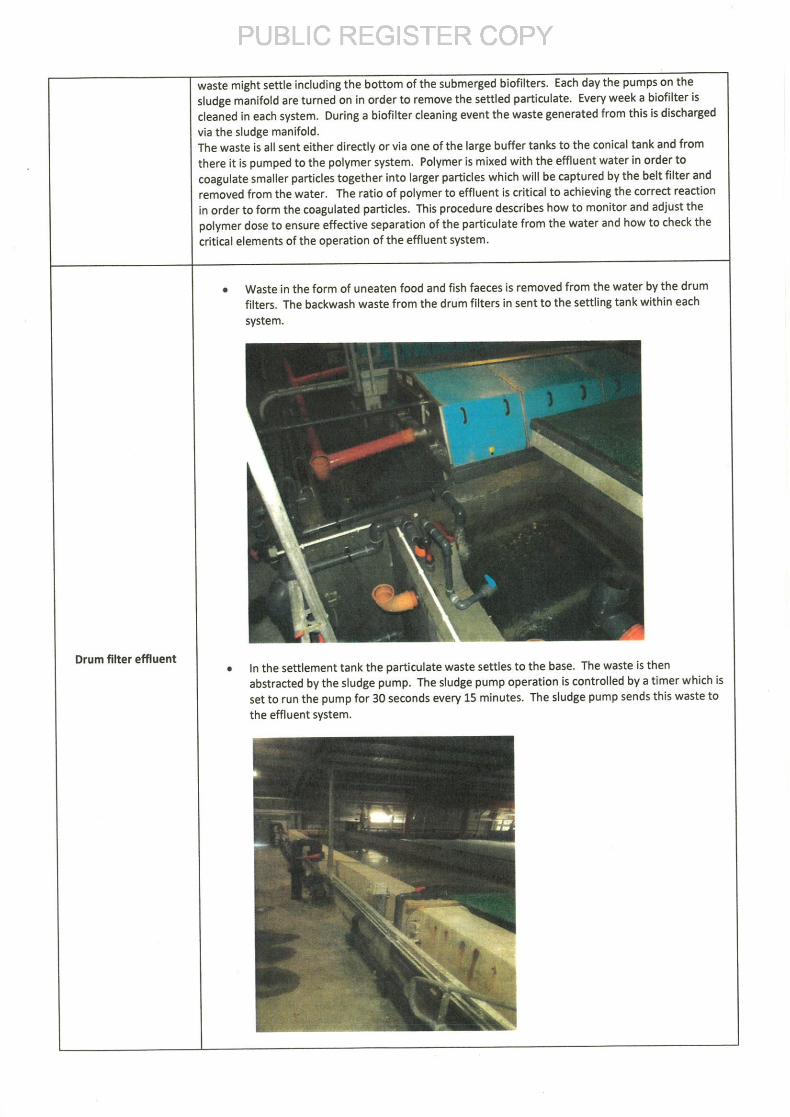
Waste in the form of uneaten food and fish faeces is removed from the water by the drumfilters. The backwash waste from the drum filters in sent to the settling tank within eachsystem.
Drum filter effluent
I . In the settlement tank the particulate waste settles to the base. The waste is then
abstracted by the sludge pump. The sludge pump operation is controlled by a timer which isset to run the pump for 30 seconds every 15 minutes. The sludge pump sends this waste tothe effluent system.
i
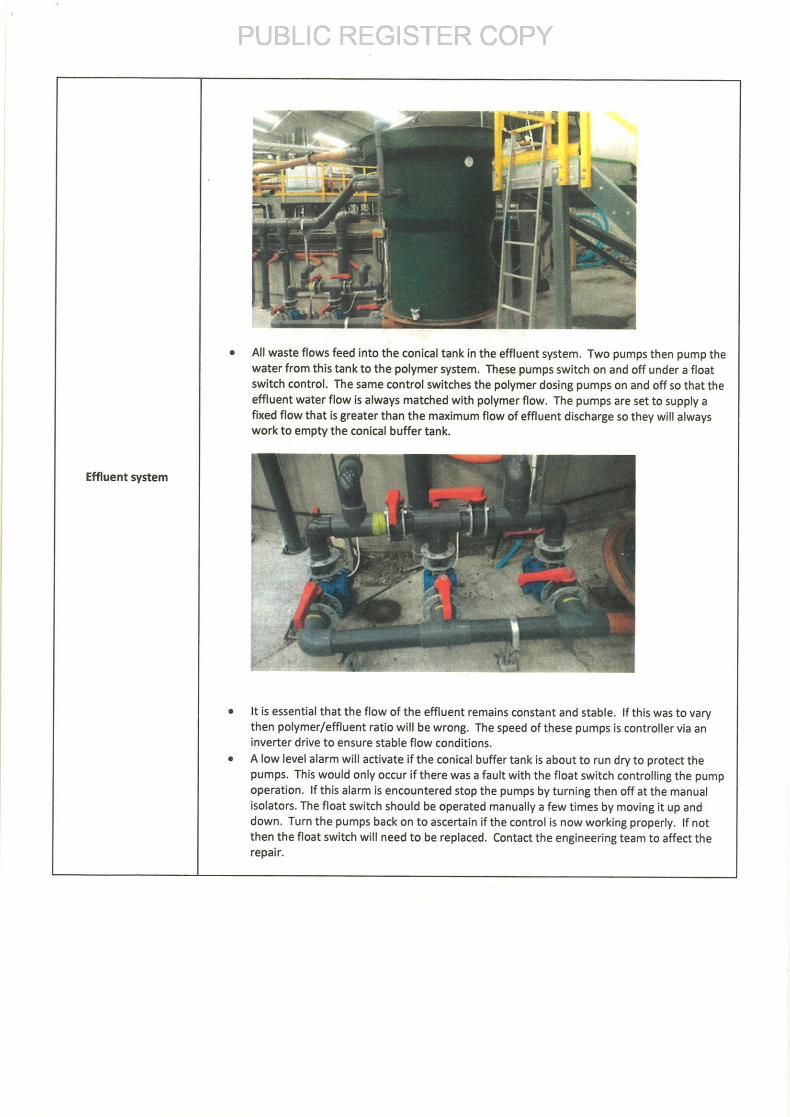
All waste flows feed into the conical tank in the effluent system. Two pumps then pump thewater from this tank to the polymer system. These pumps switch on and off under a float
switch control. The same control switches the polymer dosing pumps on and off so that theeffluent water flow is always matched with polymer flow. The pumps are set to supply afixed flow that is greater than the maximum flow of effluent discharge so they will alwayswork to empty the conical buffer tank.
Effluent system
It is essential that the flow of the effluent remains constant and stable. If this was to varythen polymer/ effluent ratio will be wrong. The speed of these pumps is controller via aninverter drive to ensure stable flow conditions.
A low level alarm will activate if the conical buffer tank is about to run dry to protect thepumps. This would only occur if there was a fault with the float switch controlling the pumpoperation. If this alarm is encountered stop the pumps by turning then off at the manualisolators. The float switch should be operated manually a few times by moving it up anddown. Turn the pumps back on to ascertain if the control is now working properly. If notthen the float switch will need to be replaced. Contact the engineering team to affect therepair.
Sludge manifold
discharge Into effluent
buffer tank
Isolation switches
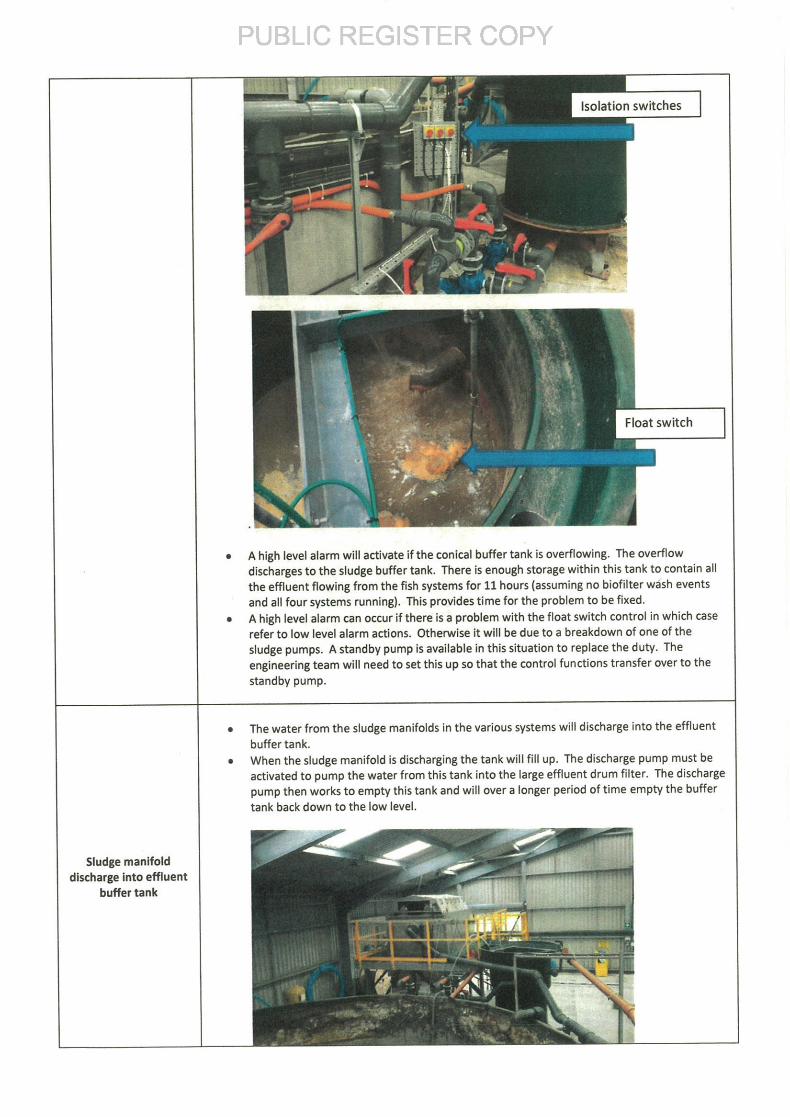
A high level alarm will activate if the conical buffer tank is overflowing. The overflow
discharges to the sludge buffer tank. There is enough storage within this tank to contain all
the effluent flowing from the fish systems for 11 hours ( assuming no biofilter wash eventsand all four systems running). This provides time for the problem to be fixed. A high level alarm can occur if there is a problem with the float switch control in which caserefer to low level alarm actions. Otherwise it will be due to a breakdown of one of the
sludge pumps. A standby pump is available in this situation to replace the duty. Theengineering team will need to set this up so that the control functions transfer over to thestandby pump.
The water from the sludge manifolds in the various systems will discharge into the effluentbuffer tank.
When the sludge manifold is discharging the tank will fill up. The discharge pump must beactivated to pump the water from this tank into the large effluent drum filter. The dischargepump then works to empty this tank and will over a longer period of time empty the buffertank back down to the low level.
When operating the sludge manifold in any one system the operative should first check thewater level in the buffer tank is at the lowest point, they should also use the radio to informthe rest of the staff that they are about to discharge effluent water to ensure that two
systems are not flowing at the same time. A high level alarm is installed in the buffer tank which will alert the operative if the waterlevel has increased so that it is about to go down the top of the overflow pipe. In thissituation the discharge from the particular sludge manifold should be stopped until thebuffer tank drains down.
The backwash water from the large effluent drum filter is discharged into the conical buffer
tank for onward processing.
It is necessary to check the operation of the drum filter and the backwash mechanism daily. Refer to Effluent Belt Filter and Drum Filter Maintenance - SSW. The check should be
recorded in the Effluent System Checks Record Form.
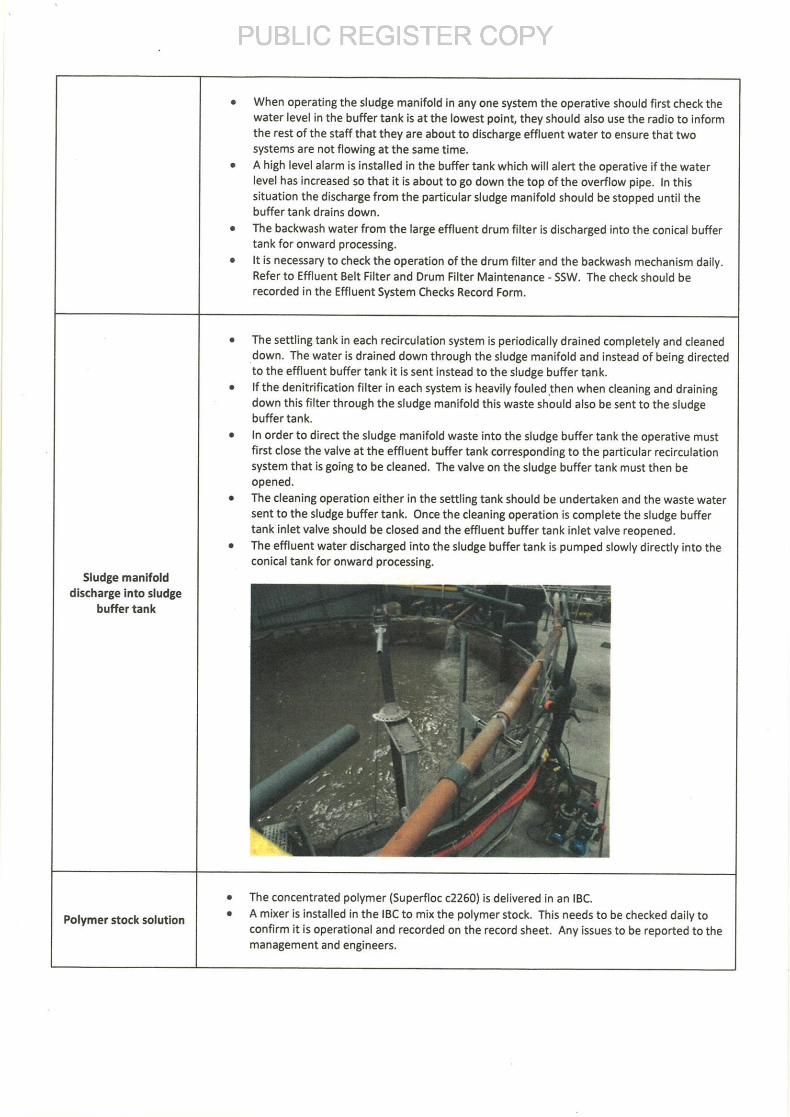
The settling tank in each recirculation system is periodically drained completely and cleaneddown. The water is drained down through the sludge manifold and instead of being directedto the effluent buffer tank it is sent instead to the sludge buffer tank.
If the denitrification filter in each system is heavily fouled then when cleaning and drainingdown this filter through the sludge manifold this waste should also be sent to the sludge
buffer tank.
In order to direct the sludge manifold waste into the sludge buffer tank the operative must
first close the valve at the effluent buffer tank corresponding to the particular recirculationsystem that is going to be cleaned. The valve on the sludge buffer tank must then beopened.
The cleaning operation either in the settling tank should be undertaken and the waste watersent to the sludge buffer tank. Once the cleaning operation is complete the sludge buffertank inlet valve should be closed and the effluent buffer tank inlet valve reopened.
The effluent water discharged into the sludge buffer tank is pumped slowly directly into theconical tank for onward processing.
Sludge manifold
discharge into sludge
buffer tank
The concentrated polymer (Superfloc c2260) is delivered in an IBC.
Polymer stock solution A mixer is installed in the IBC to mix the polymer stock. This needs to be checked daily toconfirm it is operational and recorded on the record sheet. Any issues to be reported to themanagement and engineers.
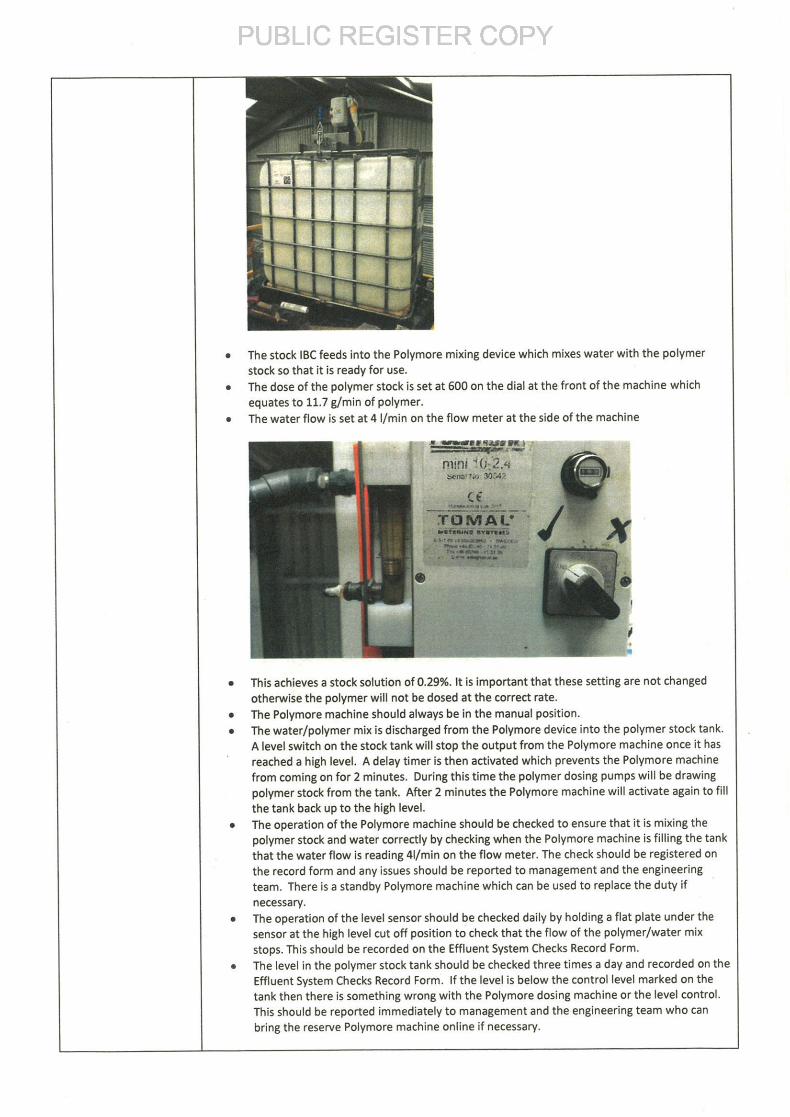
The stock IBC feeds into the Polymore mixing device which mixes water with the polymer
stock so that it is ready for use. The dose of the polymer stock is set at 600 on the dial at the front of the machine which
equates to 11. 7 g/ min of polymer. The water flow is set at 4 I/ min on the flow meter at the side of the machine
xn• i. Yl' as
CF
TOMAV
This achieves a stock solution of 0.29%. It is important that these setting are not changedotherwise the polymer will not be dosed at the correct rate.
The Polymore machine should always be in the manual position.
The water/ polymer mix is discharged from the Polymore device into the polymer stock tank.
A level switch on the stock tank will stop the output from the Polymore machine once it hasreached a high level. A delay timer is then activated which prevents the Polymore machinefrom coming on for 2 minutes. During this time the polymer dosing pumps will be drawingpolymer stock from the tank. After 2 minutes the Polymore machine will activate again to fill
the tank back up to the high level. The operation of the Polymore machine should be checked to ensure that it is mixing the
polymer stock and water correctly by checking when the Polymore machine is filling the tankthat the water flow is reading 41/ min on the flow meter. The check should be registered onthe record form and any issues should be reported to management and the engineering
team. There is a standby Polymore machine which can be used to replace the duty ifnecessary.
The operation of the level sensor should be checked daily by holding a flat plate under thesensor at the high level cut off position to check that the flow of the polymer/ water mix
stops. This should be recorded on the Effluent System Checks Record Form.
The level in the polymer stock tank should be checked three times a day and recorded on theEffluent System Checks Record Form. If the level is below the control level marked on the
tank then there is something wrong with the Polymore dosing machine or the level control. This should be reported immediately to management and the engineering team who can
bring the reserve Polymore machine online if necessary.
As the flow of effluent and the polymer stock solution concentration is fixed the onlyelement that can vary the polymer dose required is the quality of the effluent. The quality of the effluent will change gradually as the biomass in the recirculation systemsgrows and more dramatically when there is a de -stocking event or if a crop is undergoingwinter photoperiod.
The polymer/ effluent mix should be checked to fine tune the polymer dose with the effluentquality.
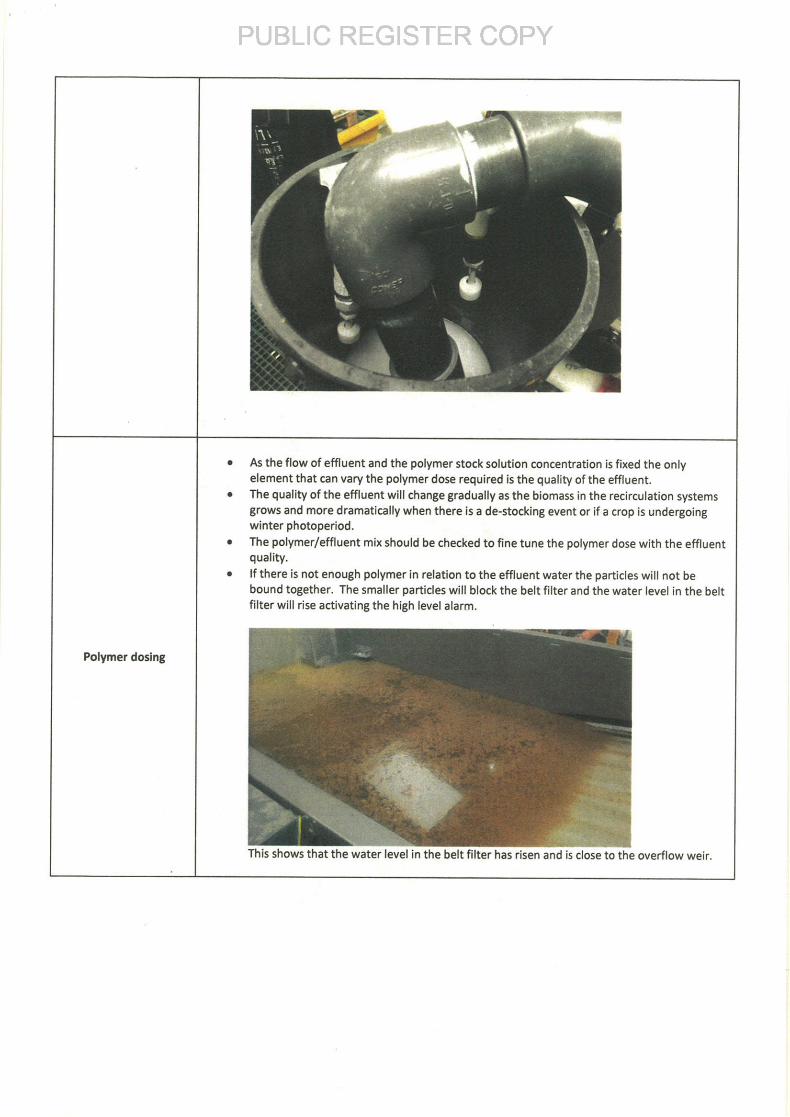
If there is not enough polymer in relation to the effluent water the particles will not bebound together. The smaller particles will block the belt filter and the water level in the beltfilter will rise activating the high level alarm.
Polymer dosing
This shows that the water level in the belt filter has risen and is close to the overflow weir.
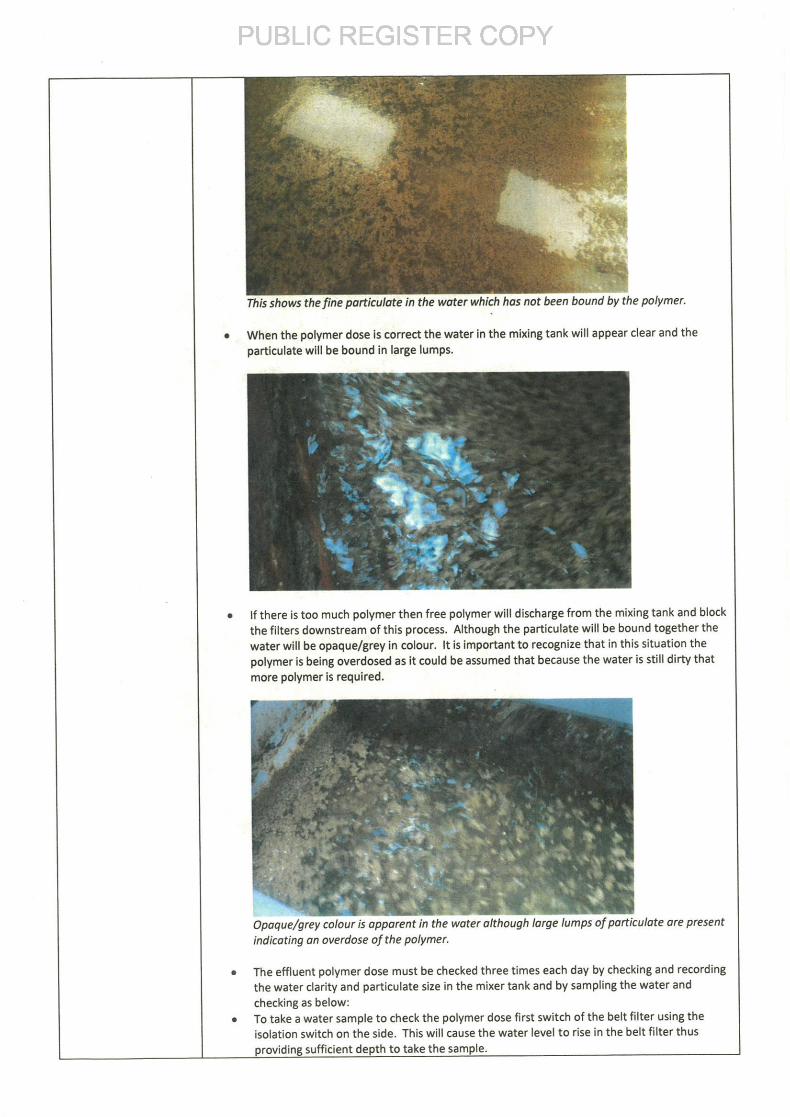
This shows the fine Particulate in the water which has not been bound by the polymer.
When the polymer dose is correct the water in the mixing tank will appear clear and theparticulate will be bound in large lumps.
If there is too much polymer then free polymer will discharge from the mixing tank and block
the filters downstream of this process. Although the particulate will be bound together the
water will be opaque/ grey in colour. It is important to recognize that in this situation thepolymer is being overdosed as it could be assumed that because the water is still dirty thatmore polymer is required.
Opaque/ grey colour is apparent in the water although large lumps of particulate are presentindicating on overdose of the polymer.
The effluent polymer dose must be checked three times each day by checking and recording
the water clarity and particulate size in the mixer tank and by sampling the water andchecking as below: To take a water sample to check the polymer dose first switch of the belt filter using theisolation switch on the side. This will cause the water level to rise in the belt filter thus
orovidina sufficient depth to take the sample. _
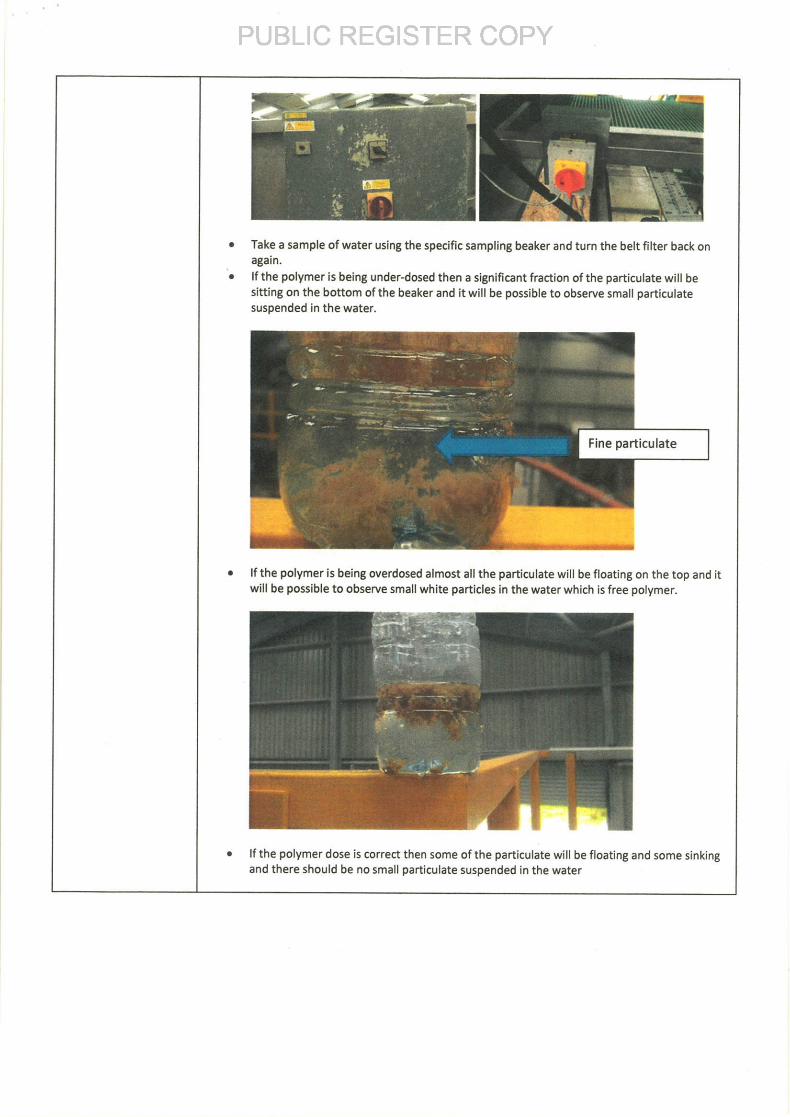
Take a sample of water using the specific sampling beaker and turn the belt filter back onagain.
If the polymer is being under -dosed then a significant fraction of the particulate will besitting on the bottom of the beaker and it will be possible to observe small particulatesuspended in the water.
If the polymer is being overdosed almost all the particulate will be floating on the top and itwill be possible to observe small white particles in the water which is free polymer.
If the polymer dose is correct then some of the particulate will be floating and some sinkingand there should be no small particulate suspended in the water
Polymer dose
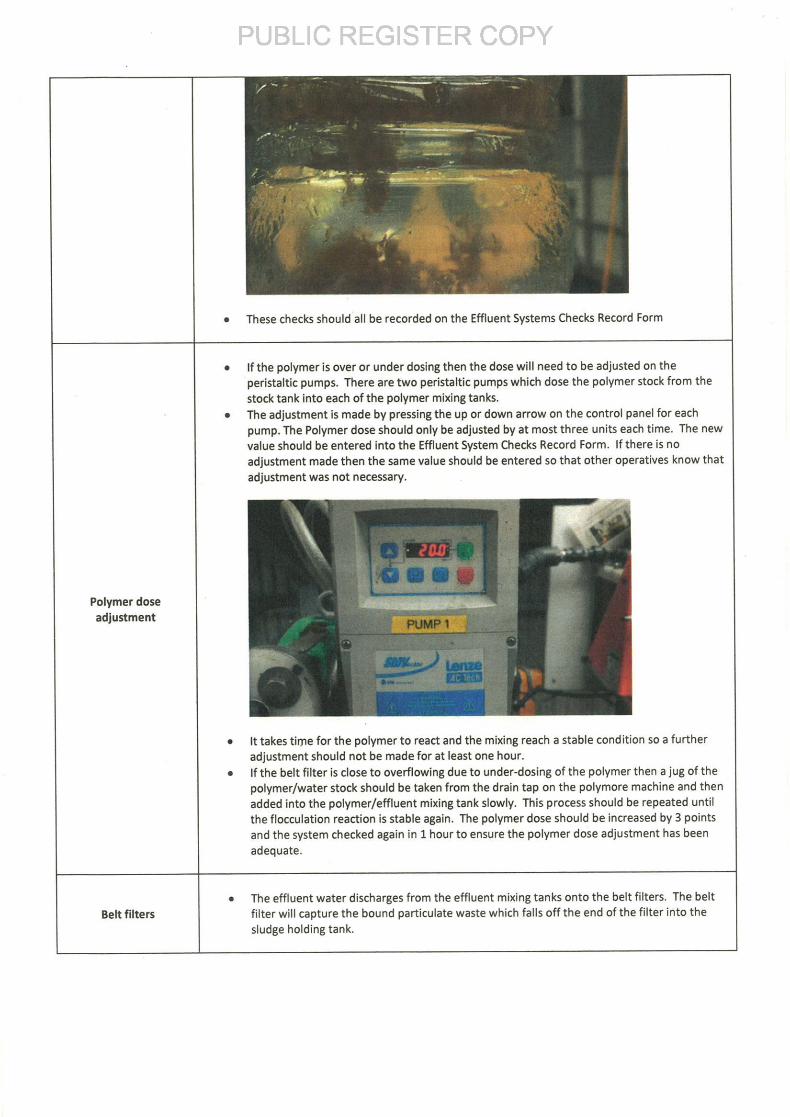
adjustment
These checks should all be recorded on the Effluent Systems Checks Record Form
If the polymer is over or under dosing then the dose will need to be adjusted on theperistaltic pumps. There are two peristaltic pumps which dose the polymer stock from the
stock tank into each of the polymer mixing tanks.
The adjustment is made by pressing the up or down arrow on the control panel for eachpump. The Polymer dose should only be adjusted by at most three units each time. The newvalue should be entered into the Effluent System Checks Record Form. If there is noadjustment made then the same value should be entered so that other operatives know that
adjustment was not necessary.
It takes time for the polymer to react and the mixing reach a stable condition so a furtheradjustment should not be made for at least one hour.
If the belt filter is close to overflowing due to under -dosing of the polymer then a jug of thepolymer/ water stock should be taken from the drain tap on the polymore machine and then
added into the polymer/ effluent mixing tank slowly. This process should be repeated untilthe flocculation reaction is stable again. The polymer dose should be increased by 3 pointsand the system checked again in 1 hour to ensure the polymer dose adjustment has beenadequate.
The effluent water discharges from the effluent mixing tanks onto the belt filters. The beltBelt filters filter will capture the bound particulate waste which falls off the end of the filter into the
sludge holding tank.
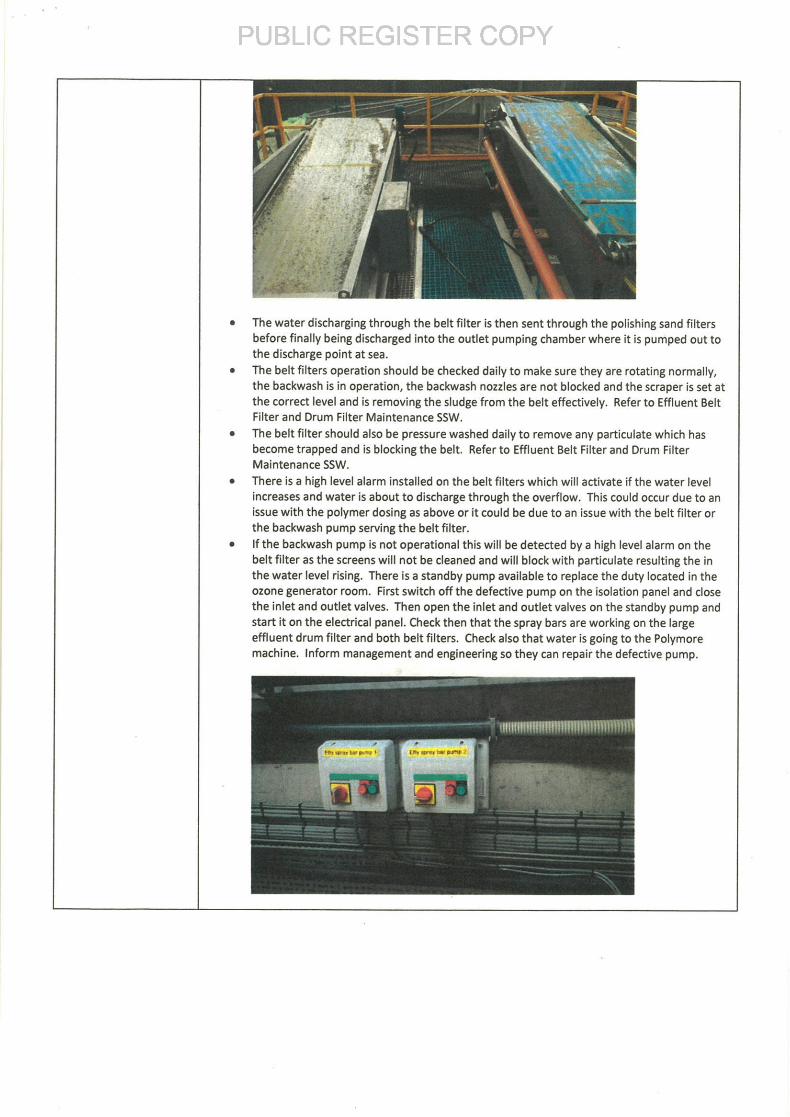
The water discharging through the belt filter is then sent through the polishing sand filtersbefore finally being discharged into the outlet pumping chamber where it is pumped out tothe discharge point at sea.
The belt filters operation should be checked daily to make sure they are rotating normally, the backwash is in operation, the backwash nozzles are not blocked and the scraper is set at
the correct level and is removing the sludge from the belt effectively. Refer to Effluent BeltFilter and Drum Filter Maintenance SSW.
The belt filter should also be pressure washed daily to remove any particulate which hasbecome trapped and is blocking the belt. Refer to Effluent Belt Filter and Drum FilterMaintenance SSW.
There is a high level alarm installed on the belt filters which will activate if the water levelincreases and water is about to discharge through the overflow. This could occur due to an
issue with the polymer dosing as above or it could be due to an issue with the belt filter orthe backwash pump serving the belt filter. If the backwash pump is not operational this will be detected by a high level alarm on thebelt filter as the screens will not be cleaned and will block with particulate resulting the inthe water level rising. There is a standby pump available to replace the duty located in theozone generator room. First switch off the defective pump on the isolation panel and closethe inlet and outlet valves. Then open the inlet and outlet valves on the standby pump andstart it on the electrical panel. Check then that the spray bars are working on the largeeffluent drum filter and both belt filters. Check also that water is going to the Polymoremachine. Inform management and engineering so they can repair the defective pump.
Polishing sand filters
M
1,
1
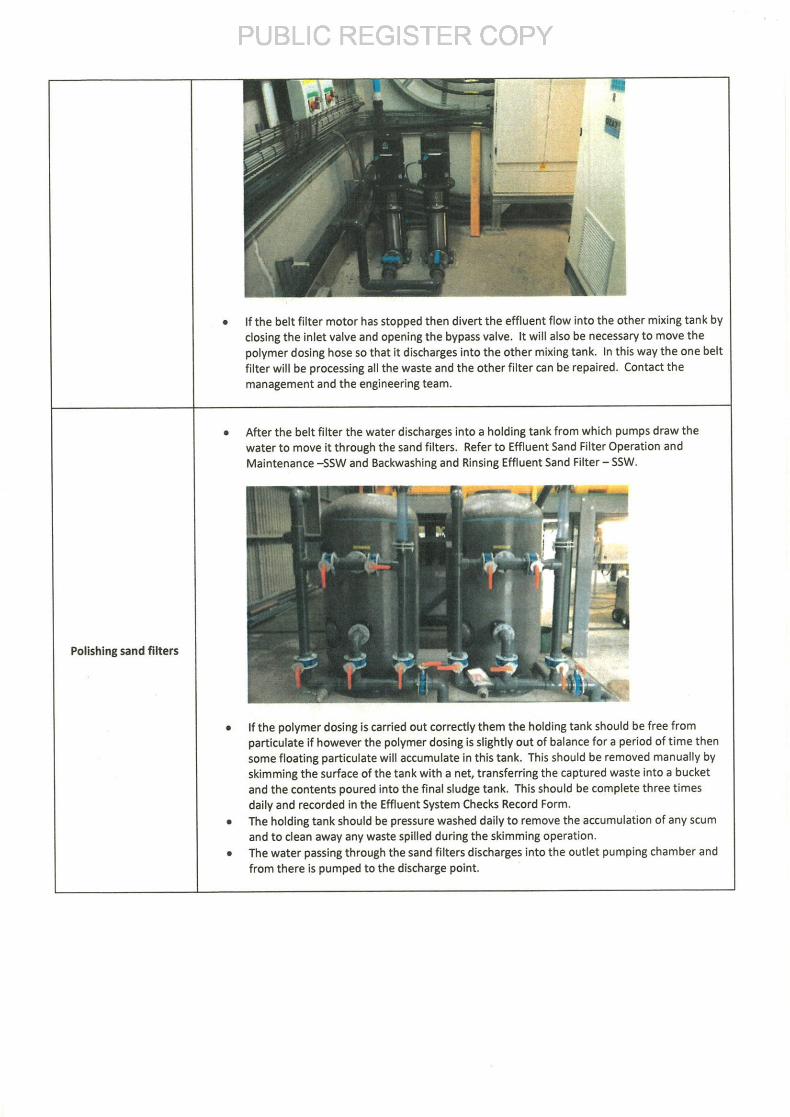
If the belt filter motor has stopped then divert the effluent flow into the other mixing tank by
closing the inlet valve and opening the bypass valve. It will also be necessary to move thepolymer dosing hose so that it discharges into the other mixing tank. In this way the one beltfilter will be processing all the waste and the other filter can be repaired. Contact themanagement and the engineering team.
After the belt filter the water discharges into a holding tank from which pumps draw thewater to move it through the sand filters. Refer to Effluent Sand Filter Operation and
Maintenance—SSW and Backwashing and Rinsing Effluent Sand Filter — SSW.
If the polymer dosing is carried out correctly them the holding tank should be free fromparticulate if however the polymer dosing is slightly out of balance for a period of time thensome floating particulate will accumulate in this tank. This should be removed manually byskimming the surface of the tank with a net, transferring the captured waste into a bucketand the contents poured into the final sludge tank. This should be complete three times
daily and recorded in the Effluent System Checks Record Form. The holding tank should be pressure washed daily to remove the accumulation of any scumand to clean away any waste spilled during the skimming operation. The water passing through the sand filters discharges into the outlet pumping chamber andfrom there is pumped to the discharge point.