Embed Size (px)
Citation preview
Amundi Funds Bond Global AggregateTapping value wherever it exists
This material is solely for the attention of "professional” investors(see more details and definitions at the end of the document).
Citywire BerlinNovember 2012
Amundi Funds Bond Global Aggregate - Citywire - November 2012 - page 2
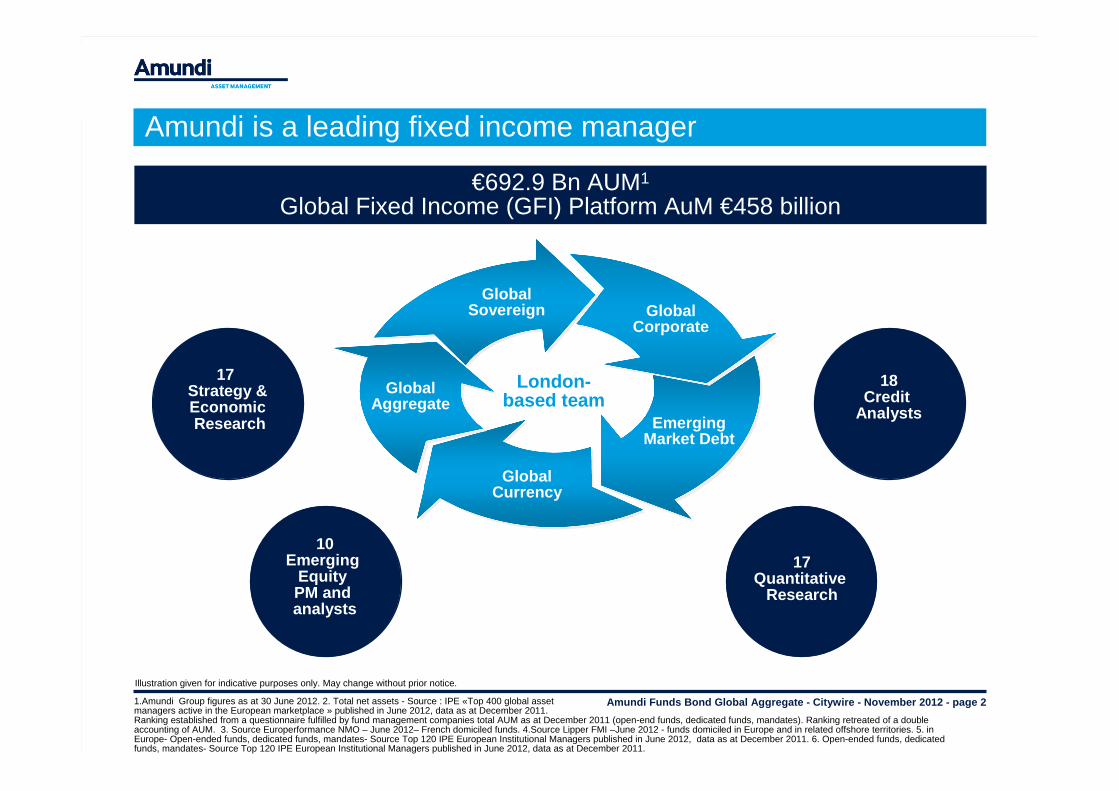
€692.9 Bn AUM1
Global Fixed Income (GFI) Platform AuM €458 billion
Illustration given for indicative purposes only. May change without prior notice.
1.Amundi Group figures as at 30 June 2012. 2. Total net assets - Source : IPE «Top 400 global assetmanagers active in the European marketplace » published in June 2012, data as at December 2011.Ranking established from a questionnaire fulfilled by fund management companies total AUM as at December 2011 (open-end funds, dedicated funds, mandates). Ranking retreated of a double accounting of AUM. 3. Source Europerformance NMO – June 2012– French domiciled funds. 4.Source Lipper FMI –June 2012 - funds domiciled in Europe and in related offshore territories. 5. in Europe- Open-ended funds, dedicated funds, mandates- Source Top 120 IPE European Institutional Managers published in June 2012, data as at December 2011. 6. Open-ended funds, dedicated funds, mandates- Source Top 120 IPE European Institutional Managers published in June 2012, data as at December 2011.
17Quantitative
Research
18Credit
Analysts
17 Strategy &EconomicResearch
Global Corporate
Global Aggregate
Emerging Market Debt
Global Currency
10Emerging
Equity PM and analysts
Global Sovereign
London-based team
Amundi is a leading fixed income manager
Amundi Funds Bond Global Aggregate - Citywire - November 2012 - page 3
2000 2001 2002 2003 2004 2005 2006 2007 2008 2009 2010 2011 YTD MTDEM external
debt 14.41%
US Credit 10.40%
EM external debt
13.12%
EM (MSCI) 51.59%
EM (MSCI) 22.45%
EM (MSCI) 30.31%
EM (MSCI) 29.18%
EM (MSCI) 36.48%
US Treasury 13.74%
EM (MSCI) 74.50%
EM (MSCI) 16.36%
US Treasury 9.81%
EM external debt
16.61%
EuroStoxx 4.89%
US Treasury 13.52%
US Treasury 6.75%
US Treasury 11.79%
Asia Pacific (MSCI) 38.07%
DM exp. US (MSCI) 17.59%
EuroStoxx 21.28%
DM exp. US (MSCI) 23.47%
Asia Pacific (MSCI) 12.28%
Euro Treasury 8.37%
Global High Yield
57.69%
Global High Yield
15.07%
EM external debt 8.46%
Global High Yield
16.34%
DM exp. US (MSCI) 2.36%
Euro Treasury 9.49%
EU Credit 6.47%
US Credit 10.52%
DM exp. US (MSCI) 35.28%
Asia Pacific (MSCI) 16.30%
Asia Pacific (MSCI) 21.04%
EuroStoxx 15.12%
US Treasury 9.01%
EU Credit -2.56%
Asia Pacific (MSCI) 34.46%
Asia Pacific (MSCI) 14.32%
US Credit 8.35%
S&P 500 15.88%
EM external debt 1.65%
US Credit 9.39%
Euro Treasury 5.54%
EU Credit 8.75%
Global High Yield
29.33%
Global High Yield
11.99%
DM exp. US (MSCI) 10.86%
Asia Pacific (MSCI) 14.51%
DM exp. US (MSCI) 8.62%
US Credit -3.08%
EM external debt
28.18%
S&P 500 12.78%
Global High Yield 3.63%
EuroStoxx 11.12%
Global High Yield 1.63%
EU Credit 6.35%
Global High Yield 2.44%
Euro Treasury 8.23%
S&P 500 26.38%
EM external debt
11.73%
EM external debt
10.73%
S&P 500 13.62%
EuroStoxx 6.79%
EM external debt
-10.91%
DM exp. US (MSCI) 27.75%
EM external debt
12.04%
Euro Treasury 2.63%
EU Credit 10.52%
S&P 500 1.16%
Global High Yield 1.28%
EM external debt 1.36%
Global High Yield 2.41%
EM external debt
25.66%
S&P 500 8.99%
Euro Treasury 6.48%
Global High Yield
12.20%
EM external debt 6.28%
Global High Yield
-25.24%
S&P 500 23.45%
US Credit 8.47%
EU Credit 2.17%
EM (MSCI) 9.92%
Euro Treasury 0.70%
EuroStoxx -2.69%
EM (MSCI) -4.91%
EM (MSCI) -7.97%
EuroStoxx 15.68%
EU Credit 7.47%
Global High Yield 5.65%
EM external debt 9.88%
US Credit 5.11%
S&P 500 -38.49%
EuroStoxx 21.14%
US Treasury 5.87%
S&P 500 0.00%
DM exp. US (MSCI) 9.48%
US Credit 0.66%
S&P 500 -10.14%
S&P 500 -13.04%
Asia Pacific (MSCI) -9.79%
US Credit 7.70%
Euro Treasury 6.94%
EU Credit 4.09%
US Credit 4.26%
S&P 500 3.53%
Asia Pacific (MSCI)
-43.23%
US Credit 16.04%
DM exp. US (MSCI) 4.90%
DM exp. US (MSCI) -
14.82%
US Credit 8.97%
Asia Pacific (MSCI) 0.59%
DM exp. US (MSCI)
-15.21%
EuroStoxx -20.25%
DM exp. US (MSCI)
-17.52%
EU Credit 6.34%
EuroStoxx 6.90%
S&P 500 3.00%
US Treasury 3.08%
Euro Treasury 3.07%
EuroStoxx -44.37%
EU Credit 14.41%
EU Credit 4.79%
EuroStoxx -17.05%
Euro Treasury 8.67%
EU Credit 0.53%
Asia Pacific (MSCI)
-29.20%
Asia Pacific (MSCI)
-21.84%
S&P 500 -23.37%
Euro Treasury 3.13%
US Credit 5.24%
US Treasury 2.79%
Euro Treasury 1.84%
Global High Yield 1.95%
DM exp. US (MSCI)
-45.09%
Euro Treasury 4.16%
Euro Treasury 1.02%
Asia Pacific (MSCI) -
17.31%
Asia Pacific (MSCI) 8.19%
EM (MSCI) 0.46%
EM (MSCI) -31.80%
DM exp. US (MSCI)
-22.61%
EuroStoxx -37.30%
US Treasury 2.24%
US Treasury 3.54%
US Credit 1.96%
EU Credit 0.47%
EU Credit 0.34%
EM (MSCI) -54.48%
US Treasury -3.57%
EuroStoxx -5.81%
EM (MSCI) -20.41%
US Treasury 1.42%
US Treasury -0.65%
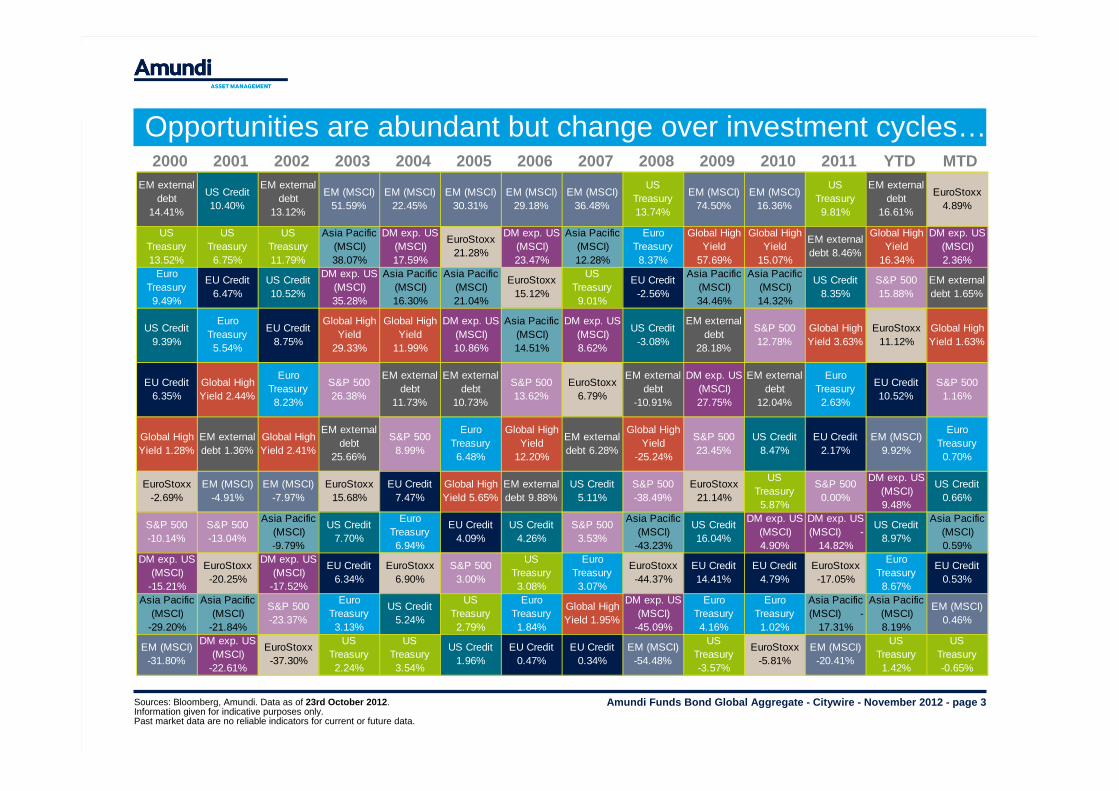
Sources: Bloomberg, Amundi. Data as of 23rd October 2012.Information given for indicative purposes only.Past market data are no reliable indicators for current or future data.
Opportunities are abundant but change over investment cycles…
Amundi Funds Bond Global Aggregate - Citywire - November 2012 - page 4
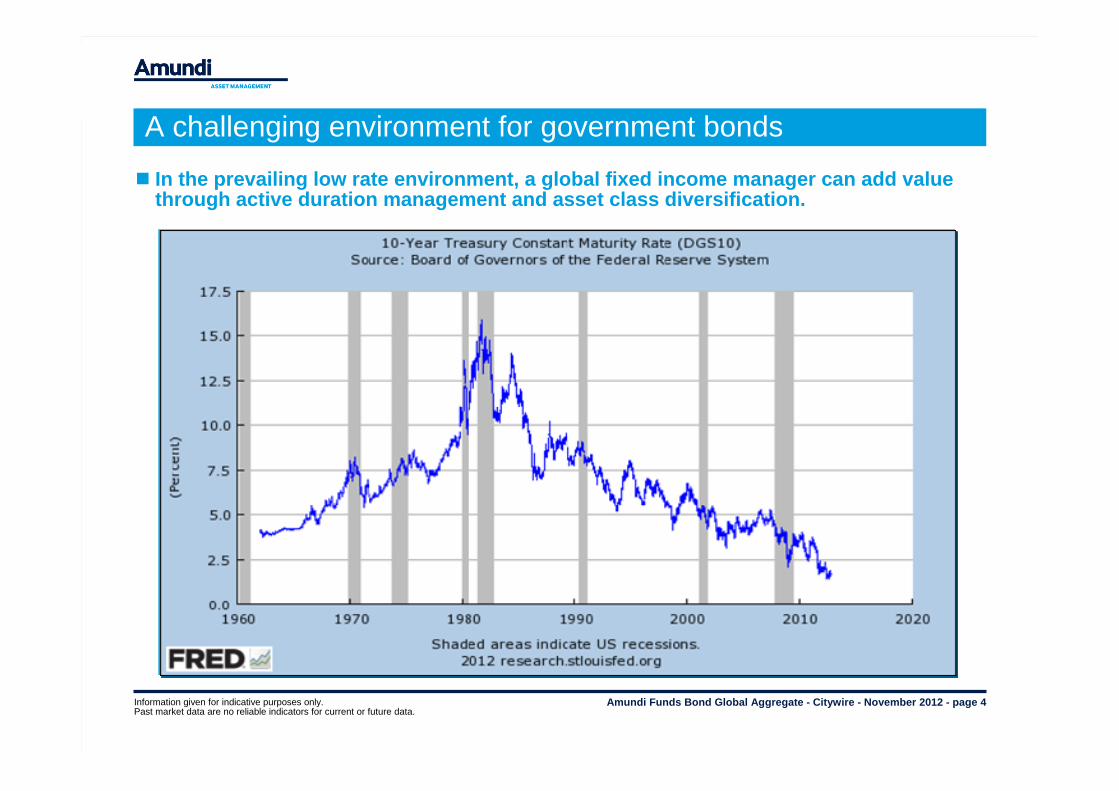
In the prevailing low rate environment, a global fixed income manager can add value through active duration management and asset class diversification.
A challenging environment for government bonds
Information given for indicative purposes only.Past market data are no reliable indicators for current or future data.
Amundi Funds Bond Global Aggregate - Citywire - November 2012 - page 5
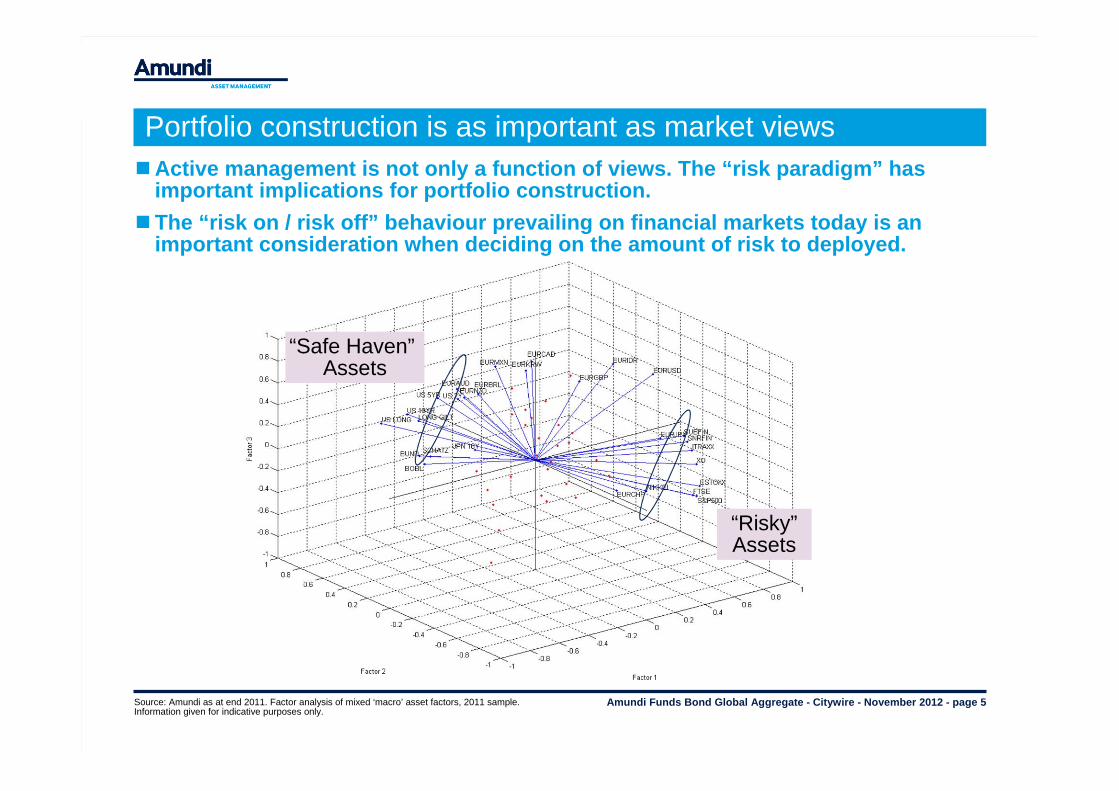
Portfolio construction is as important as market viewsActive management is not only a function of views. The “risk paradigm” has
important implications for portfolio construction. The “risk on / risk off” behaviour prevailing on financial markets today is an
important consideration when deciding on the amount of risk to deployed.
“Risky”Assets
“Safe Haven”Assets
Source: Amundi as at end 2011. Factor analysis of mixed ‘macro’ asset factors, 2011 sample.Information given for indicative purposes only.
Amundi Funds Bond Global Aggregate - Citywire - November 2012 - page 6
Government BondsGovernment Bonds
Global Global Investment GradeInvestment Grade
Global Global CurrenciesCurrencies
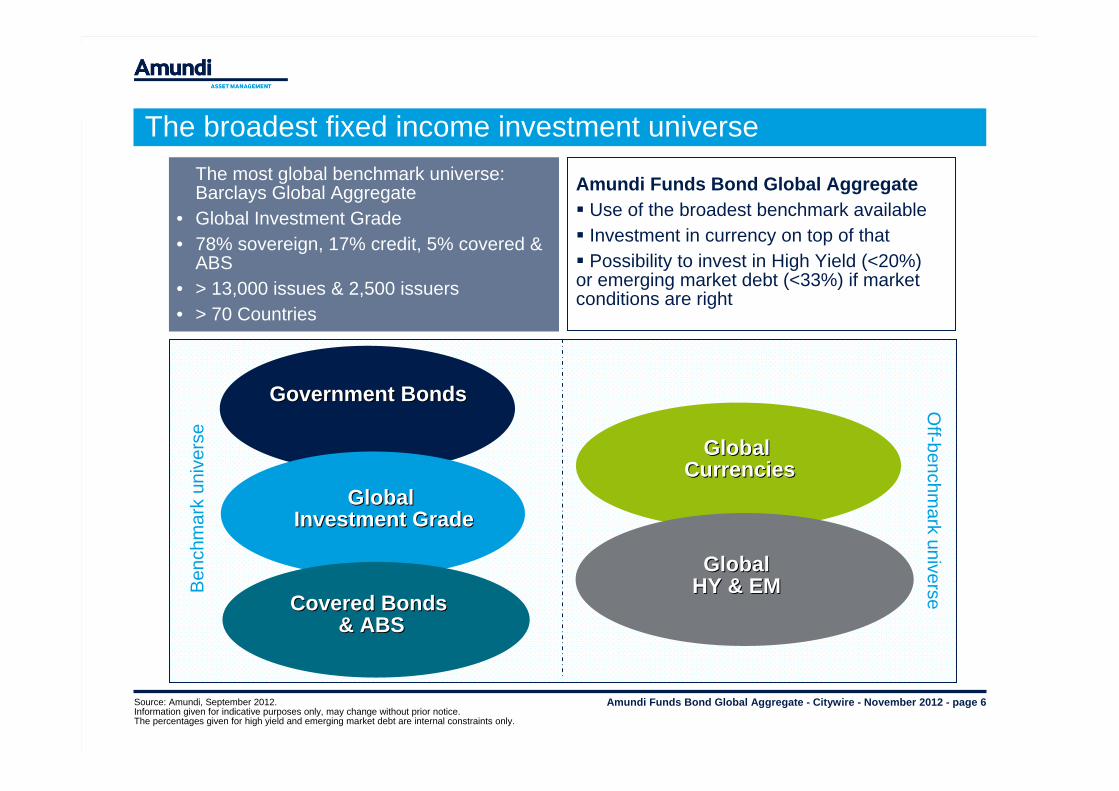
The most global benchmark universe: Barclays Global Aggregate
• Global Investment Grade• 78% sovereign, 17% credit, 5% covered &
ABS • > 13,000 issues & 2,500 issuers• > 70 Countries
Covered Bonds Covered Bonds & ABS& ABS
Global Global HY & EMHY & EMB
ench
mar
k un
iver
seO
ff-benchmark universe
Amundi Funds Bond Global Aggregate Use of the broadest benchmark available Investment in currency on top of that Possibility to invest in High Yield (<20%) or emerging market debt (<33%) if market conditions are right
Source: Amundi, September 2012. Information given for indicative purposes only, may change without prior notice.The percentages given for high yield and emerging market debt are internal constraints only.
The broadest fixed income investment universe
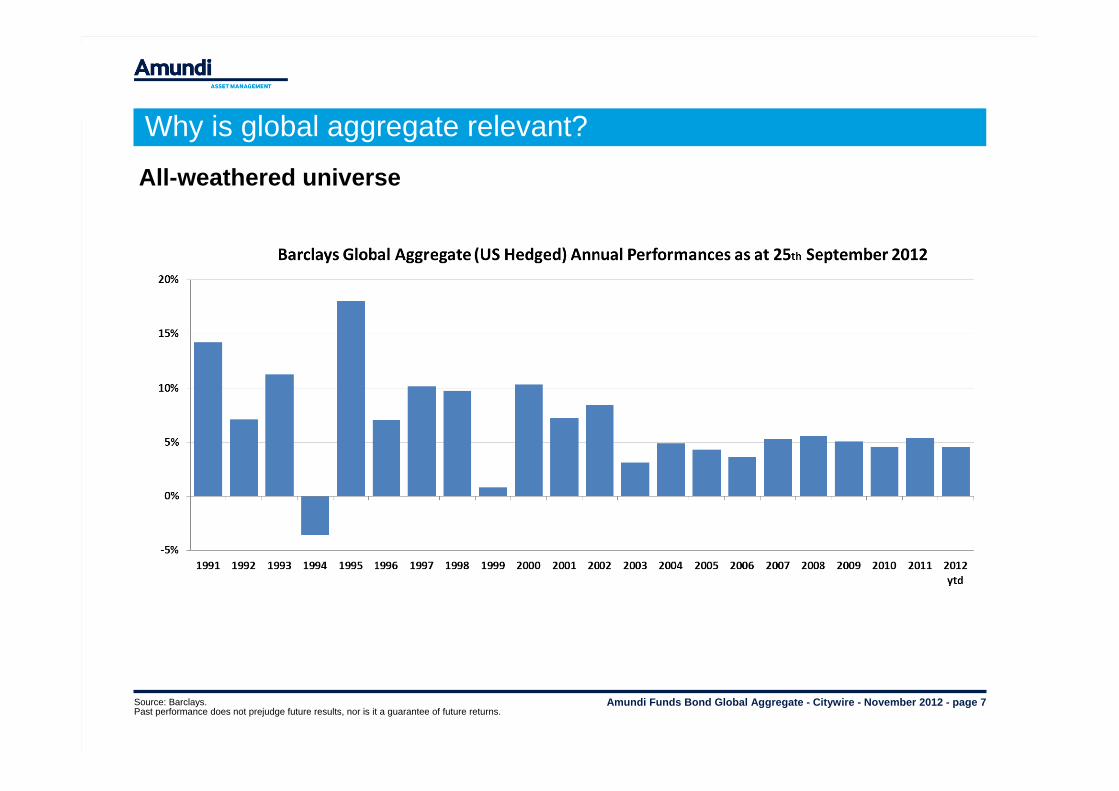
Amundi Funds Bond Global Aggregate - Citywire - November 2012 - page 7Source: Barclays.Past performance does not prejudge future results, nor is it a guarantee of future returns.
Why is global aggregate relevant?
All-weathered universe
Amundi Funds Bond Global Aggregate - Citywire - November 2012 - page 8
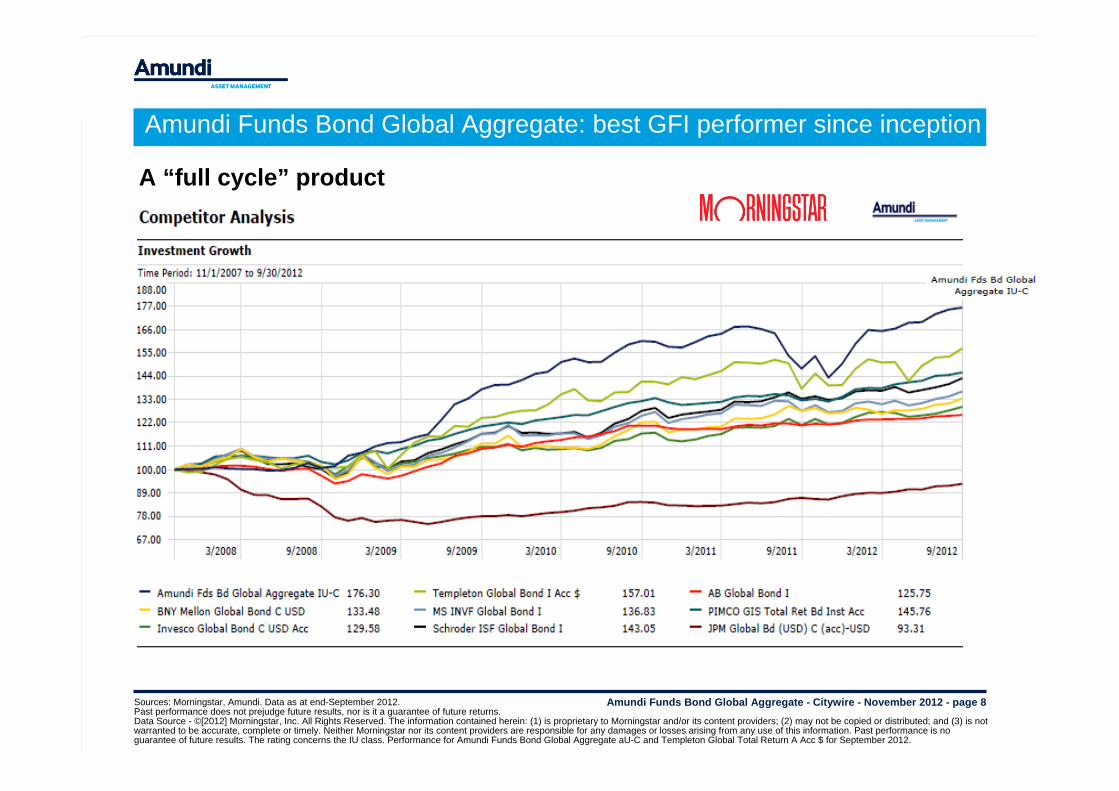
Amundi Funds Bond Global Aggregate: best GFI performer since inception
Sources: Morningstar, Amundi. Data as at end-September 2012.Past performance does not prejudge future results, nor is it a guarantee of future returns. Data Source - ©[2012] Morningstar, Inc. All Rights Reserved. The information contained herein: (1) is proprietary to Morningstar and/or its content providers; (2) may not be copied or distributed; and (3) is not warranted to be accurate, complete or timely. Neither Morningstar nor its content providers are responsible for any damages or losses arising from any use of this information. Past performance is no guarantee of future results. The rating concerns the IU class. Performance for Amundi Funds Bond Global Aggregate aU-C and Templeton Global Total Return A Acc $ for September 2012.
A “full cycle” product
Amundi Funds Bond Global Aggregate - Citywire - November 2012 - page 9
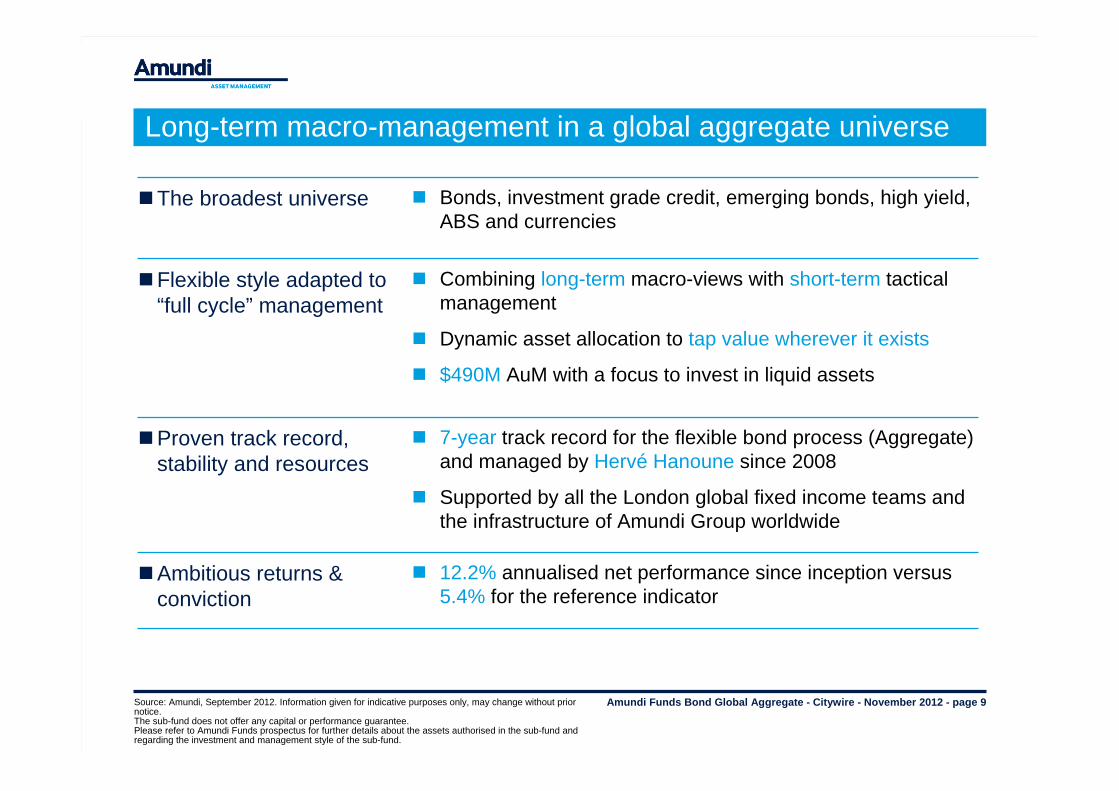
7-year track record for the flexible bond process (Aggregate) and managed by Hervé Hanoune since 2008
Supported by all the London global fixed income teams and the infrastructure of Amundi Group worldwide
Proven track record, stability and resources
The broadest universe Bonds, investment grade credit, emerging bonds, high yield, ABS and currencies
Flexible style adapted to “full cycle” management
Combining long-term macro-views with short-term tactical management
Dynamic asset allocation to tap value wherever it exists
$490M AuM with a focus to invest in liquid assets
Ambitious returns & conviction
12.2% annualised net performance since inception versus5.4% for the reference indicator
Source: Amundi, September 2012. Information given for indicative purposes only, may change without prior notice. The sub-fund does not offer any capital or performance guarantee. Please refer to Amundi Funds prospectus for further details about the assets authorised in the sub-fund and regarding the investment and management style of the sub-fund.
Long-term macro-management in a global aggregate universe
Amundi Funds Bond Global Aggregate - Citywire - November 2012 - page 10
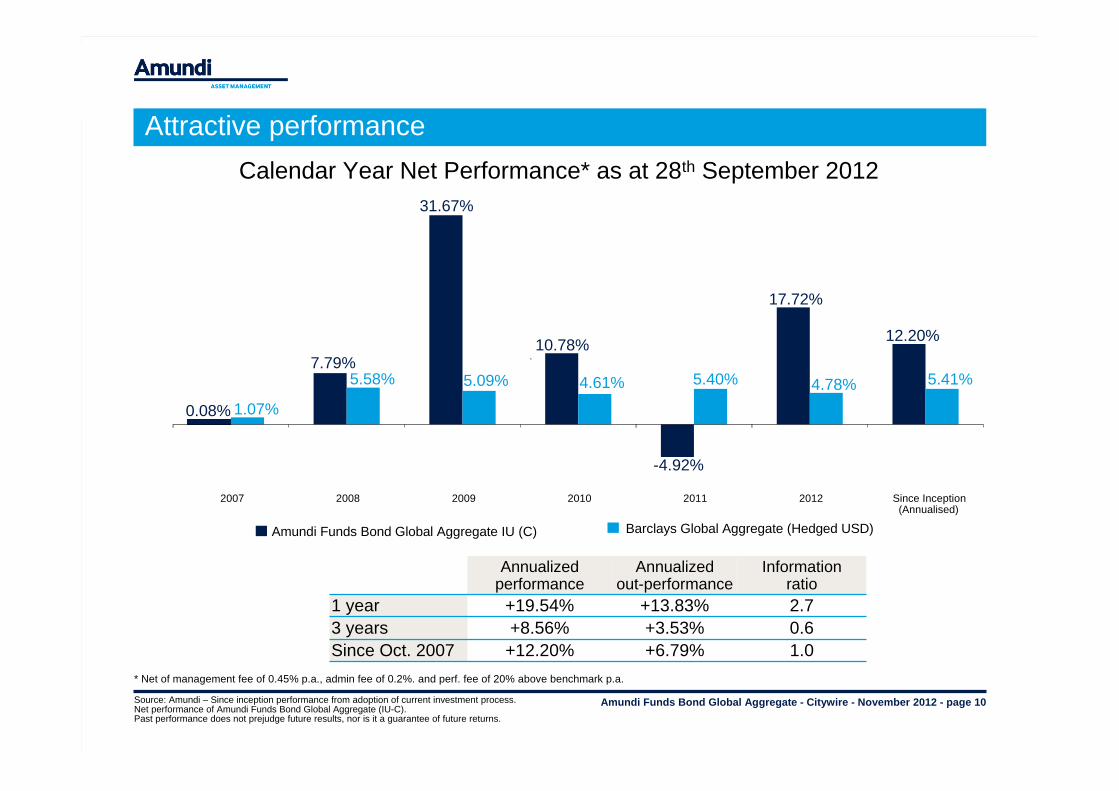
Attractive performanceCalendar Year Net Performance* as at 28th September 2012
Amundi Funds Bond Global Aggregate IU (C) Barclays Global Aggregate (Hedged USD)
0.08%
7.79%
31.67%
10.78%
-4.92%
17.72%
12.20%
1.07%
5.58% 5.09% 4.61% 5.40% 4.78% 5.41%
2007 2008 2009 2010 2011 2012 Since Inception(Annualised)
.
* Net of management fee of 0.45% p.a., admin fee of 0.2%. and perf. fee of 20% above benchmark p.a.
Source: Amundi – Since inception performance from adoption of current investment process.Net performance of Amundi Funds Bond Global Aggregate (IU-C).Past performance does not prejudge future results, nor is it a guarantee of future returns.
Annualized performance
Annualized out-performance
Information ratio
1 year +19.54% +13.83% 2.73 years +8.56% +3.53% 0.6Since Oct. 2007 +12.20% +6.79% 1.0
Amundi Funds Bond Global Aggregate - Citywire - November 2012 - page 11
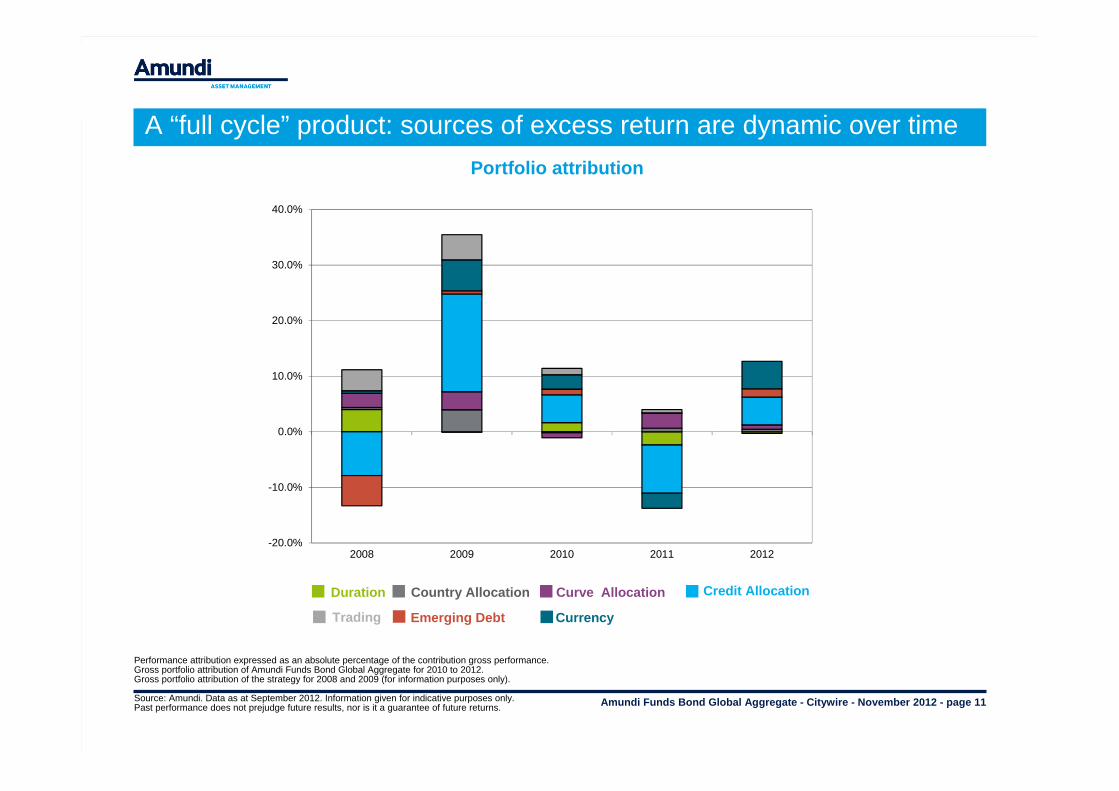
Portfolio attribution
-20.0%
-10.0%
0.0%
10.0%
20.0%
30.0%
40.0%
2008 2009 2010 2011 2012
Currency
Credit Allocation
Emerging Debt
Curve AllocationDuration Country Allocation
Trading
Performance attribution expressed as an absolute percentage of the contribution gross performance. Gross portfolio attribution of Amundi Funds Bond Global Aggregate for 2010 to 2012.Gross portfolio attribution of the strategy for 2008 and 2009 (for information purposes only).
Source: Amundi. Data as at September 2012. Information given for indicative purposes only.Past performance does not prejudge future results, nor is it a guarantee of future returns.
A “full cycle” product: sources of excess return are dynamic over time
Amundi Funds Bond Global Aggregate - Citywire - November 2012 - page 12
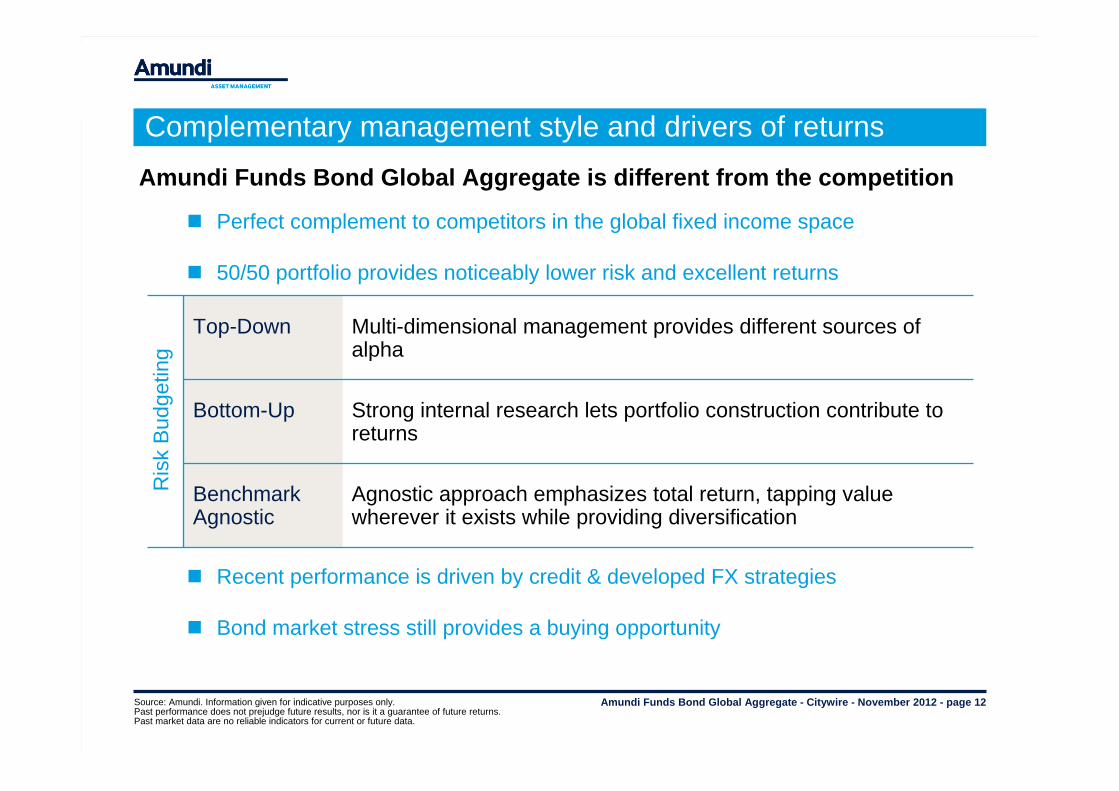
Amundi Funds Bond Global Aggregate is different from the competition
Perfect complement to competitors in the global fixed income space
50/50 portfolio provides noticeably lower risk and excellent returns
Recent performance is driven by credit & developed FX strategies
Bond market stress still provides a buying opportunity
Complementary management style and drivers of returns
Top-Down Multi-dimensional management provides different sources of alpha
Bottom-Up Strong internal research lets portfolio construction contribute to returns
Benchmark Agnostic
Agnostic approach emphasizes total return, tapping value wherever it exists while providing diversification
Ris
k B
udge
ting
Source: Amundi. Information given for indicative purposes only.Past performance does not prejudge future results, nor is it a guarantee of future returns. Past market data are no reliable indicators for current or future data.
Amundi Funds Bond Global Aggregate - Citywire - November 2012 - page 13
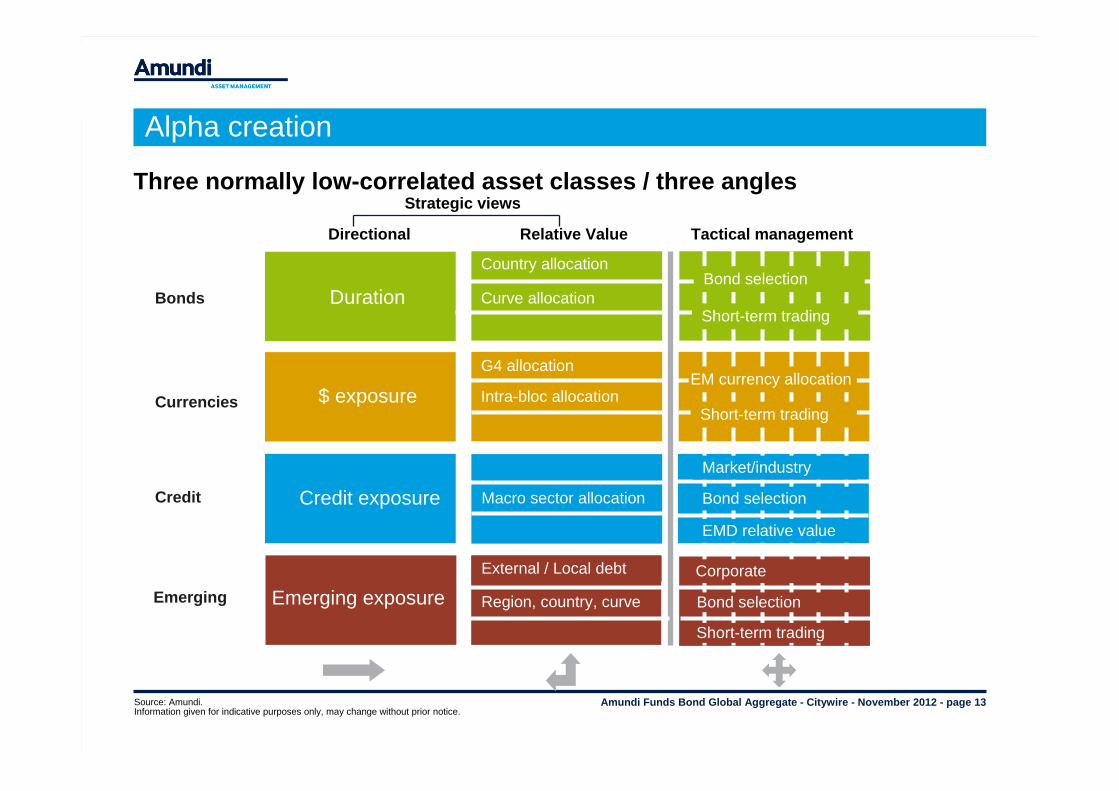
Alpha creation
Three normally low-correlated asset classes / three angles
Source: Amundi.Information given for indicative purposes only, may change without prior notice.
Directional Relative Value Tactical management
Bonds
Currencies
Credit
Duration
$ exposure
Credit exposure
Country allocation
Curve allocation
G4 allocation
Intra-bloc allocation
Macro sector allocation
Strategic views
Short-term trading
Bond selection
EM currency allocation
Short-term trading
Market/industry
Bond selection
EMD relative value
EmergingEmerging ExposureEmerging exposure
External / Local debt
Region, country, curve
Corporate
Bond selection
Short-term trading
Amundi Funds Bond Global Aggregate - Citywire - November 2012 - page 14
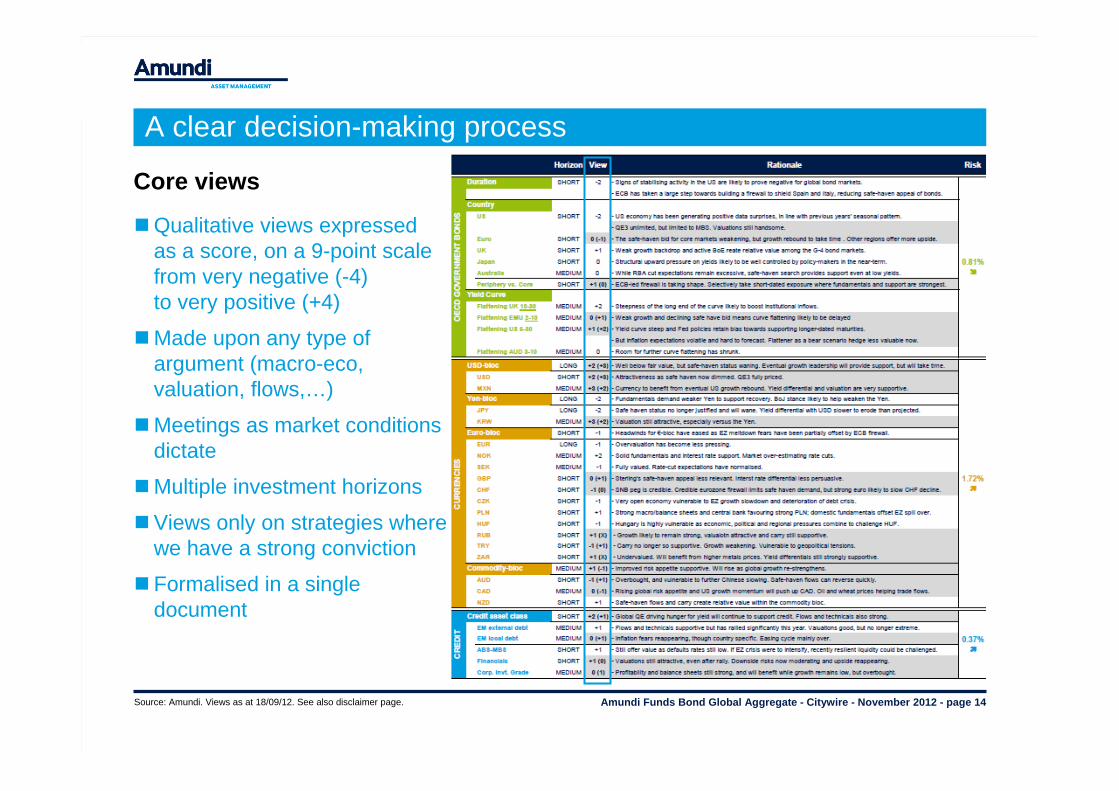
A clear decision-making process
Core views
Qualitative views expressed as a score, on a 9-point scale from very negative (-4) to very positive (+4)
Made upon any type of argument (macro-eco, valuation, flows,…)
Meetings as market conditions dictate
Multiple investment horizons
Views only on strategies where we have a strong conviction
Formalised in a single document
Source: Amundi. Views as at 18/09/12. See also disclaimer page.
Amundi Funds Bond Global Aggregate - Citywire - November 2012 - page 15
Strategic orientation 2012-2013
Global growth remains anaemic and heterogeneous. The Eurozone and the UK are flirting with recession while the Chinese and Japanese economies have surprised to the downside. The US, to the contrary, are continuing to deliver positive macro surprises.
G-4 central banks have taken monetary accommodation to a new level. As a result, financial and macroeconomic tail risks have been capped.
Overall, macro visibility has improved as risks from the negative confidence effect of the Eurozone crisis have eased and reduced tail risk has led to a reduction in uncertainty.
Strong flows continue to support emerging and credit the “hunt” for yield in a low rate environment.
As macro calls are disturbed by political decisions and unorthodox Central Bank policies, investment horizon has shortened.
High uncertainty and low visibility where active management & portfolio construction are key.
Source: Amundi. Information given for indicative purposes only.Past market data are no reliable indicators for current or future data.
Amundi Funds Bond Global Aggregate - Citywire - November 2012 - page 16
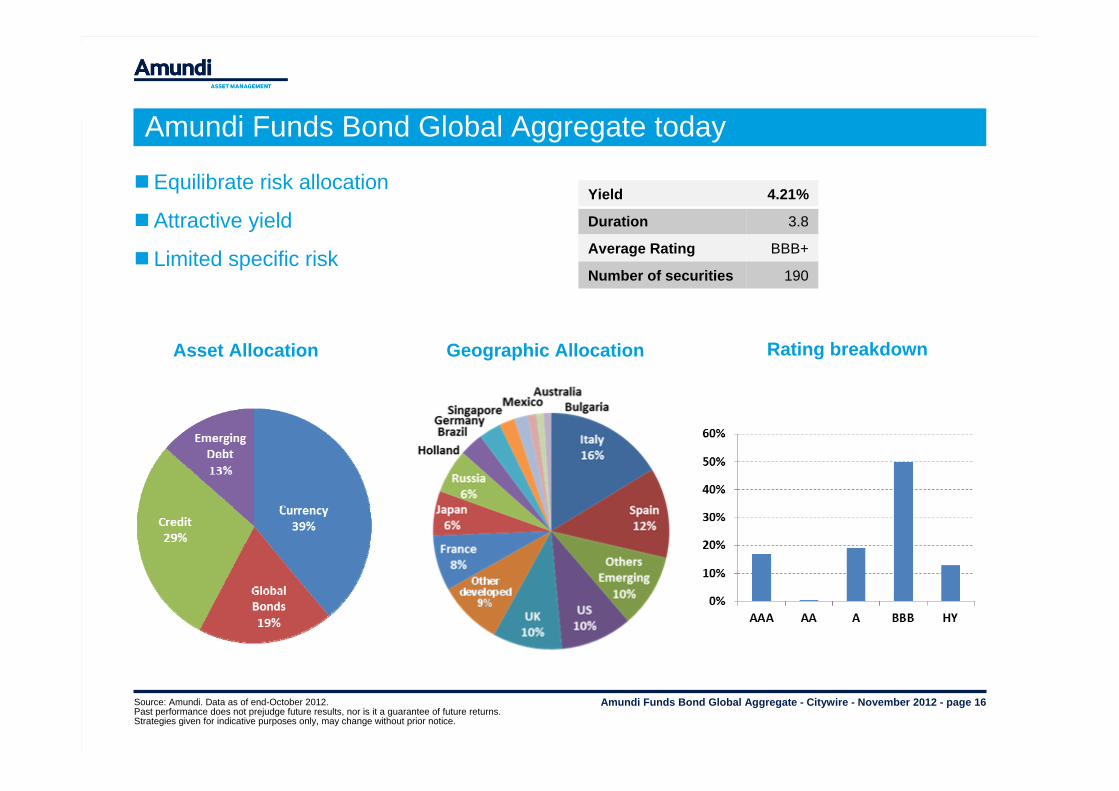
Amundi Funds Bond Global Aggregate today
Equilibrate risk allocation
Attractive yield
Limited specific risk
Geographic AllocationAsset Allocation Rating breakdown
Yield 4.21%
Duration 3.8
Average Rating BBB+
Number of securities 190
Source: Amundi. Data as of end-October 2012. Past performance does not prejudge future results, nor is it a guarantee of future returns. Strategies given for indicative purposes only, may change without prior notice.
Amundi Funds Bond Global Aggregate - Citywire - November 2012 - page 17
Breakdown by seniority
Source: Amundi. Portfolio data as of end-October 2012. Past performance does not prejudge future results, nor is it a guarantee of future returns. Strategies given for indicative purposes only, may change without prior notice.
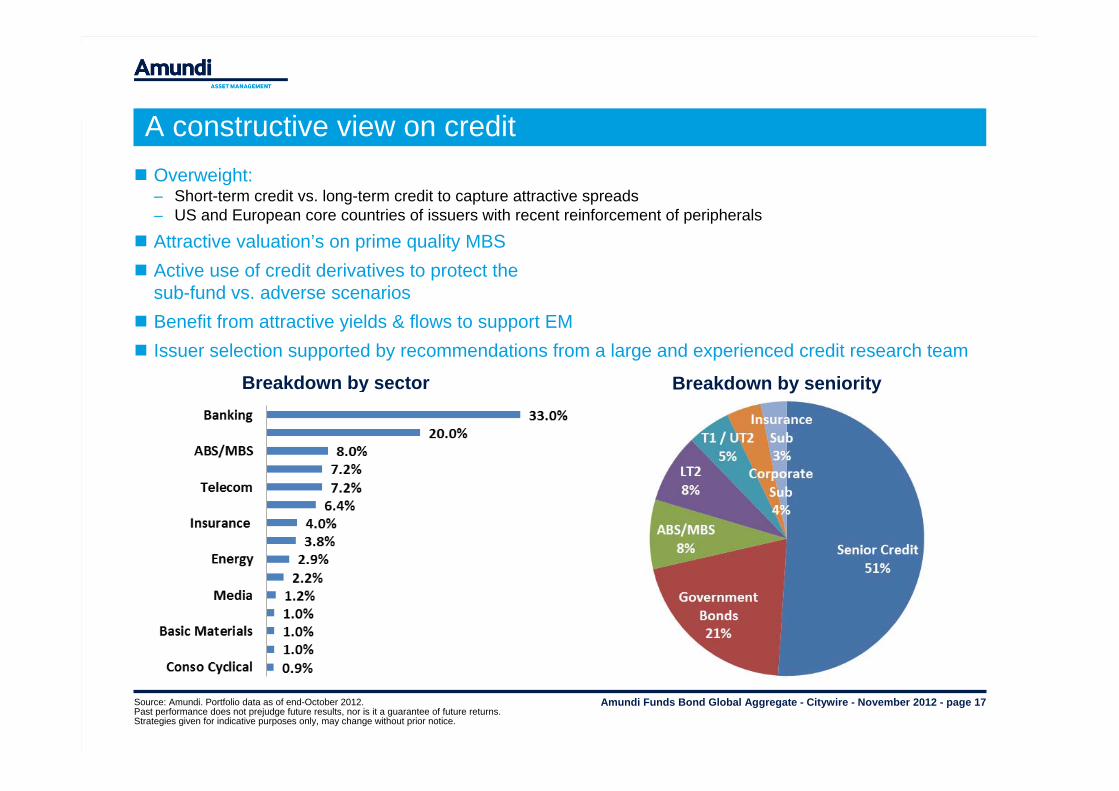
Overweight:– Short-term credit vs. long-term credit to capture attractive spreads– US and European core countries of issuers with recent reinforcement of peripherals
Attractive valuation’s on prime quality MBS Active use of credit derivatives to protect the
sub-fund vs. adverse scenarios Benefit from attractive yields & flows to support EM Issuer selection supported by recommendations from a large and experienced credit research team
Breakdown by sector
A constructive view on credit
Amundi Funds Bond Global Aggregate - Citywire - November 2012 - page 18
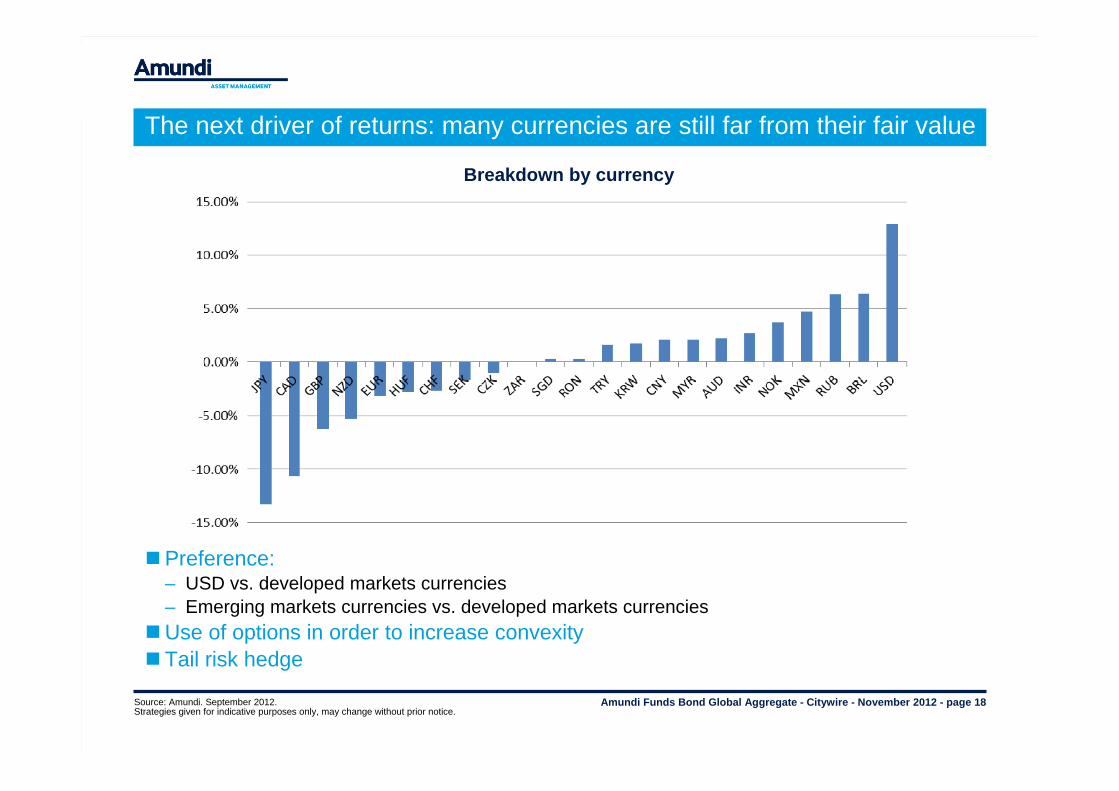
Preference: – USD vs. developed markets currencies – Emerging markets currencies vs. developed markets currencies
Use of options in order to increase convexityTail risk hedge
Breakdown by currency
The next driver of returns: many currencies are still far from their fair value
Source: Amundi. September 2012. Strategies given for indicative purposes only, may change without prior notice.
Amundi Funds Bond Global Aggregate - Citywire - November 2012 - page 19
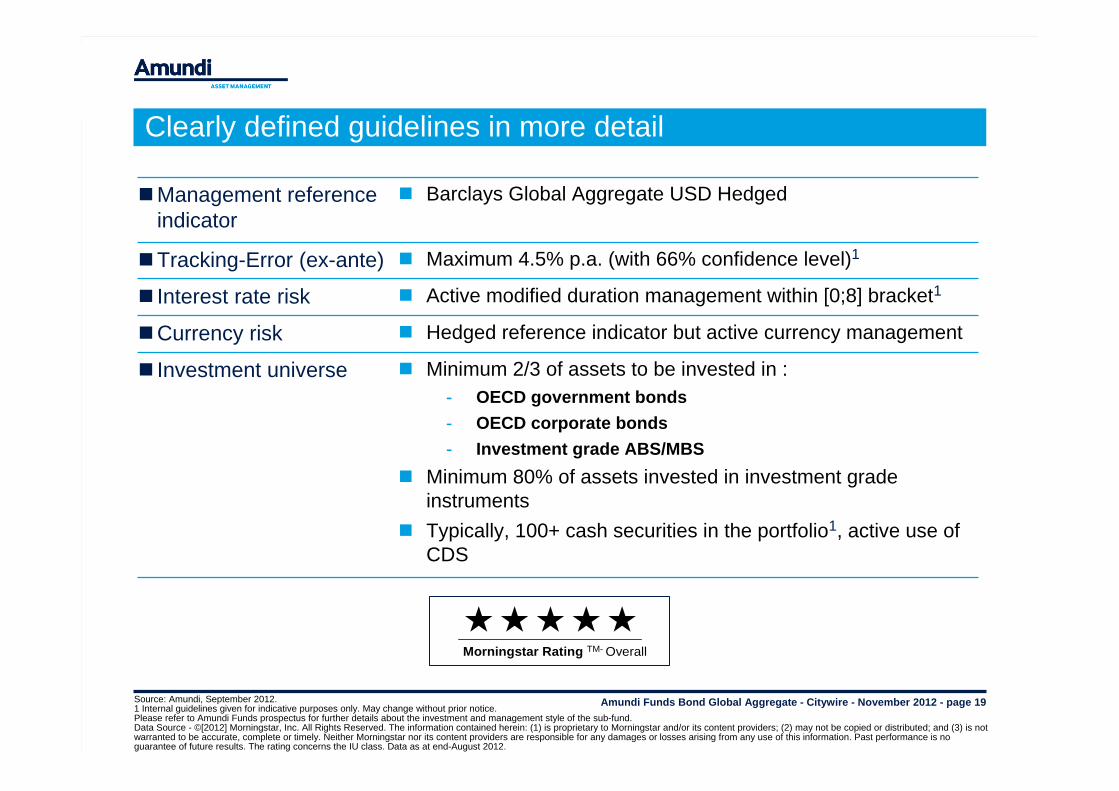
Clearly defined guidelines in more detail
Minimum 2/3 of assets to be invested in :- OECD government bonds - OECD corporate bonds- Investment grade ABS/MBS
Minimum 80% of assets invested in investment grade instruments
Typically, 100+ cash securities in the portfolio1, active use of CDS
Investment universe
Hedged reference indicator but active currency managementCurrency risk
Maximum 4.5% p.a. (with 66% confidence level)1Tracking-Error (ex-ante)
Management reference indicator
Barclays Global Aggregate USD Hedged
Interest rate risk Active modified duration management within [0;8] bracket1
Morningstar Rating TM- Overall
Source: Amundi, September 2012. 1 Internal guidelines given for indicative purposes only. May change without prior notice. Please refer to Amundi Funds prospectus for further details about the investment and management style of the sub-fund.Data Source - ©[2012] Morningstar, Inc. All Rights Reserved. The information contained herein: (1) is proprietary to Morningstar and/or its content providers; (2) may not be copied or distributed; and (3) is not warranted to be accurate, complete or timely. Neither Morningstar nor its content providers are responsible for any damages or losses arising from any use of this information. Past performance is no guarantee of future results. The rating concerns the IU class. Data as at end-August 2012.
Amundi Funds Bond Global Aggregate - Citywire - November 2012 - page 20
Amundi, French joint stock company (“Société Anonyme”) with a registered capital of € 584 710 755 and approved by the French Securities Regulator (Autorité des Marchés Financiers-AMF) under number GP 04000036 as a portfolio management company90 boulevard Pasteur -75015 Paris- France – 437 574 452 RCS Paris.
www.amundi.com- www.amundi-funds.com
This material is solely for the attention of institutional, professional, qualified or sophisticated investors and distributors. It is not to be distributed to the general public, private customers or retail investors in any jurisdiction whatsoever nor to “US Persons”.Moreover, any such investor should be, in the European Union, a “Professional” investor as defined in Directive 2004/39/EC dated 21 April 2004 on markets in financial instruments (“MIFID”) or as the case may be in each local regulations and, as far as the offering in Switzerland is concerned, a “Qualified Investor” within the meaning of the provisions of the Swiss Collective Investment Schemes Ordinance of 23 June 2006 (CISA), the Swiss Collective Investment Schemes Ordinance of 22 November 2006 (CISO) and the FINMA’s Circular 08/8 on Public Offering within the meaning of the legislation on Collective Investment Schemes of 20 November 2008. In no event may this material be distributed in the European Union to non “Professional” investors as defined in the MIFID or in each local regulation, or in Switzerland to investors who do not comply with the definition of “qualified investors” as defined in the applicable legislation and regulation.
DisclaimerThis document contains information about Amundi Funds Bond Global Aggregate (the “Sub-Fund”), a sub-fund of Amundi Funds (the “SICAV”), an undertaking for collective investment in transferable securities existing under Part I of the Luxembourg law of 17 December 2010, organised as a société d’investissement à capital variable and registered with the Luxembourg Trade and Companies Register under number B68.806. The SICAV has its registered office at 5, allée Scheffer, L-2520 Luxembourg.Amundi Funds has been authorised for public sale by the Commission de Surveillance du Secteur Financier in Luxembourg. Subscriptions in the Sub-Funds will only be accepted on the basis of the SICAV’s latest complete prospectus and/or the Key Investor Information Document (KIID) of the sub-fund, its latest annual and semi-annual reports and its articles of incorporation that may be obtained, free of charge, at the registered office of the SICAV or respectively at that of the representative agent duly authorized and agreed by the relevant authority of each relevant concerned jurisdiction. Consideration should be given to whether the risks attached to an investment in the Sub-Funds are suitable for prospective investors who should ensure that they fully understand the contents of this document. A professional advisor should be consulted to determine whether an investment in the Sub-Funds is suitable. The value of, and any income from, an investment in the Sub-Funds can decrease as well as increase. The Sub-Funds have no guaranteed performance. Further, past performance is not a guarantee or a reliable indicator for current or future performance and returns. The performance data do not take account of the commissions and costs incurred on the issue and redemption of units. This document does not constitute an offer to buy nor a solicitation to sell in any country where it might be considered as unlawful, nor does it constitute public advertising or investment advice. The information contained in this document is deemed accurate as at November 2012.