Embed Size (px)
Citation preview

AN ABSTRACT FOR THE THESIS OF
Kelley Tuel in Master of Science in Biology presented on March 27, 2013 by Emporia
State University.
Title: Development and Field Trial of a Molecular Biology Teaching Kit Utilizing
Halobacterium sp. NRC-1.
Abstract Approved: _______________________________________________________
A teaching kit entitled The Genotype-Phenotype Connection was created around a
novel mutant of Halobacterium sp. NRC-1 called KBT-1. The activities in the kit
recapitulate the isolation and characterization of KBT-1 and were optimized for use in
typical high school biology classrooms. Beginning with observations about the organism
on the petri plate and forming conclusions from a gel electrophoresis image, students
experience the relationship between genotype and phenotype while exploring molecular
biology hands-on. To determine if this kit was an effective teaching tool, I performed a
field trial with 13 different sections of AP Biology in fall 2012 consisting of 9 teachers
and 192 students. Overall, teachers and students had an overall positive response to The
Genotype-Phenotype Connection kit. The kit has been published by Carolina Biological
Supply Company and is now available for mainstream teacher purchase.
Key words: AP Biology, hands-on molecular biology, high school laboratory, Archaea,
halophile, Halobacterium sp. NRC-1

Development and Field Trial of a Molecular Biology Teaching Kit
Utilizing Halobacterium sp. NRC-1
----------------
A thesis presented to
The Department of Biological Sciences
EMPORIA STATE UNIVERSITY
----------------
by
Kelley Tuel
M.S. Degree Candidate
Department of Biological Sciences
Emporia State University
Emporia, Kansas 66801-5087, USA

i
____________________________
Approved by Department Chairperson
____________________________
Approved by Committee Member
____________________________
Approved by Committee Member
____________________________
Approved by Committee Member
____________________________
Approved by Dean of the Graduate School and Distance Education

ii
Acknowledgements
I gratefully thank the following:
Dr. Tim Burnett, Emporia State University for introducing me to Halobacterium and for
providing me the laboratory experience, resources and endless guidance during this
research.
Priya DasSarma at the University of Maryland, Baltimore for input, collaboration and
motivation for this Halobacterium project.
Dr. Shiladitya DasSarma at the University of Maryland, Baltimore for research ideas and
references to journal articles whenever I inquired.
Brenda Bott at Shawnee Mission West Biotechnology Signature Program for practical
input on applying this organism to the classroom.
Carolina Biological Supply Company for publishing the kits and providing them at cost
for the field trial. They also provided permissions for including The Genotype-Phenotype
Connection kit manual and protocols in this thesis.
Harold Durst Graduate Research Award and the Graduate Student Research Grant, both
administered through the Graduate School at Emporia State University.
Jolene Hund and Alyssa Floro, undergraduate students at ESU who worked with me on
Halobacterium experiments. They both provided feedback on the kit and teacher's
manual protocols.
The teachers who participated in kit field trial. I have much gratitude for this group of 9
people. They agreed to participate before knowing what changes the College Board
would make to the AP curriculum for fall 2013. They used the kit with great scheduling
flexibility and creativity, even as molecular biology now falls in the 2nd
semester under
the new AP guidelines. They and their students offered valuable feedback to improve the
kit.
My Graduate Committee of Dr. Tim Burnett, Dr. Richard Schrock, Dr. Matt Seimears &
Dr. Marshall Sundberg, Emporia State University, for guidance with my research and
thorough thesis comments.

iii
Preface
When I was teaching high school biology from 1998-2003, I faced the dilemma of
how to incorporate molecular and microbiology into my classroom. Hands-on molecular
biology seemed inapproachable unless I ordered expensive kits but even then, they often
included DNA samples sent in a tube precluding students from actually seeing or
understanding the organism from which the DNA was extracted. I wanted to teach my
students laboratory methods and microbiology/molecular concepts using a safe, living
microorganism but did not know where to start. My desire to involve students with
microbiology and molecular biology labs led me to investigate the potential of a
halophilic Archaean, Halobacterium sp. NRC-1, as a graduate project at Emporia State
University.
This thesis is organized around three chapters. The first chapter is an introduction
to attributes of Halobacterium sp. NRC-1 that make it an ideal model organism to use in
high school laboratories. Chapter two contains the results of characterization and
optimization experiments performed in the development of a teaching kit for Carolina
Biological Supply Company. Finally, chapter three details a field trial of the teaching kit
and the feedback from the teachers and students who tested it.
This paper is formatted in the manner required by the American Biology Teacher
publication.

iv
Table of Contents
Acknowledgements..................................................................................................................... ii
Preface ...................................................................................................................................... iii
List of Tables ............................................................................................................................. vii
List of Figures ........................................................................................................................... viiii
Chapter 1: Call for a Classroom Microbe..................................................................................... 1
Laboratory Activities Should Engage Students ......................................................................... 2
Potential Constraints to Hands-On Activities Involving Microbes ............................................. 3
A Model Classroom Organism: Halobacterium sp. NRC-1 ........................................................ 6
Halobacterium sp. NRC-1 Addresses the Issues of Cost and Contamination ............................. 6
Halobacterium sp. NRC-1 Addresses the Archaean Domain ..................................................... 7
Chapter 2: Genetics of Halobacterium sp. NRC-1 Gas Vesicles, Basis for Design of a Teaching Kit
................................................................................................................................................. 11
Gas Vesicles of Halobacterium sp. NRC-1............................................................................... 11
Development of the Teaching Kit .......................................................................................... 14
Materials and Methods ......................................................................................................... 14
PCR of gvpA region for pNRC100 ........................................................................................... 19
Identification, Isolation and Characterization of gvp Mutants ................................................ 19
Adapting protocols for use in high schools ............................................................................ 25
Pilot Study and Further Refinements ..................................................................................... 27
Gel Electrophoresis Protocol ................................................................................................. 30
Discussion ............................................................................................................................. 30
Chapter 3: Field Trial of The Genotype-Phenotype Connection Kit ............................................. 35
Materials and Methods ......................................................................................................... 36
Results .................................................................................................................................. 37
Teacher and School Participants ........................................................................................ 37
Equipment Needs of Field Trial Teachers ........................................................................... 39
Success with Kit Protocols ................................................................................................. 40
Teacher Perspectives......................................................................................................... 42
Breakdown of Concepts Presented in the Kit ..................................................................... 44

v
Teacher Perspectives of Student Guide ............................................................................. 44
Analysis of Student Pre/Post Test Scores ........................................................................... 46
Student Perspectives of the Kit Experience ........................................................................ 52
Discussion ............................................................................................................................. 58
References ................................................................................................................................ 62
Appendix A: Kit Manual ............................................................................................................ A1
Appendix B: Solicitation Email to Potential Field Trial Teachers .............................................. A55
Appendix C: Online Screening Survey for Potential Field Trial Teachers .................................. A58
Appendix D: Sample of Individualized Suggested Field Trial “Lesson Plan” .............................. A64
Appendix E: Student Field Trial Pre/Post-Tests ...................................................................... A67
Appendix F: Teacher Post-kit Evaluation ................................................................................. A71
Appendix G: Informed Consent Document ............................................................................. A76
Appendix H: Carolina Biological Copyright Permissions........................................................... A78
Appendix I: HaloWeb Copyright Permissions .......................................................................... A80

vi
List of Tables
Table 1. Primer sequences for each primer set.
Table 2. Percentage of student respondents for various components of the teaching.

vii
List of Figures
Figure 1. Gas vesicle protein gene region from pNRC100.
Figure 2. Halobacterium NRC-1 colonies of Vac+ and Vac-.
Figure 3. PCR amplicons using three different primer sets.
Figure 4. A sectored BSYC plate containing five possible gvpA mutants.
Figure 5. PCR amplicons of a wild type and two mutants.
Figure 6. A comparison of the gas vesicle gene regions of pNRC100 for sp. NRC-1,
KBT-1 and KBT-2.
Figure 7. Modified “Extremely Easy DNA Extraction” samples (lanes 2-4).
Figure 8. PCR of crude lysates prepared by lysing a single colony.
Figure 9. 1% agarose gel with PCR products that were in the thermal cycler for
approximately 55 minutes.
Figure 10. 1 kb DNA ladder used to quickly estimate size of dna fragments on a
0.8% agarose gel.
Figure 11. Example classroom gels provided by field trial teachers.
Figure 12. Teacher satisfaction with topics as presented in the kit.
Figure 13. Average student pre/post-test scores for matching vocabulary questions.
Figure 14. Comparison of average student pre/post-test multiple choice scores.
Figure 15. Comparison of average student short essay scores.

1
Chapter 1 Call for a Classroom Microbe
“While the 20th century was shaped largely by spectacular breakthroughs in the
fields of physics and chemistry, the 21st century will belong to the biological sciences”
(Rifkin, 1998).
With an explosion of discoveries in recent years, new fields of research have
evolved under the umbrella term of “molecular biology” (NRC, 2012, p. 11). To stay
relevant on the topics of science, technology and health, secondary education teachers
and students must be educated in the emerging sub-disciplines of molecular biology such
as bioinformatics, synthetic biology, molecular medicine or biomaterials engineering
(NRC, 2012, p. 39-64). Veteran teachers are unlikely to have had training in these sub-
disciplines and consequently are unlikely to effectively incorporate these topics into the
curriculum.
Organizations that encourage the advancement of science education advocate for
incorporation of these emerging fields of molecular biology by encompassing them in
testimonials and recommendations of pedagogical changes needed to drive biology
education forward. In the book, A New Biology for the 21st Century, the National
Research Council (NRC) relays recommendations to weave together emerging
technology, societal needs and governmental resources. The NRC refers to this as the
National New Biology Initiative (NRC, 2012, p. 87-89).
The most recent draft of the Next Generation Science Standards (NGSS),
developed through a collaborative effort between NRC, The National Science Teachers
Association (NSTA) and the American Association for the Advancement of Science

2
(AAAS), paves the way for inclusion of the new molecular biology sub-disciplines in
curriculum reform (Next, 2013). For example, one objective within the Core Idea of
Engineering, Technology and Applications of Science states, “Links among engineering,
technology, science, and society in the Engineering, Technology, and Applications of
Science” should be addressed (A Framework, 2012, p. 3-8; Next, 2013). The
technological applications of molecular concepts can address this objective.
Concepts encompassed by molecular biology can be difficult for students to
comprehend due their abstract nature and technical vocabulary. Comprehension can also
be a challenge due to the varying levels of genetic concepts which are often segmented
when they are typically presented to students. A study conducted by Duncan and Reiser
found that students were not connecting the individual concepts to the larger picture of
genetics (2007, p. 953-954). In another study, Lewis and Kattman present an interrelated
or scaffolding approach to help students make the necessary connections (2004, p. 196).
The book, America’s Lab Report: Investigations in High School Science, the NRC also
advocates for use of “integrated instructional units” in science classrooms. A key
component of this approach is to enhance the traditional means of teaching (lecture,
reading the text, classroom discussion, etc.) with laboratory investigative experiences
(Singer et al., 2006, p. 4-5).
Laboratory Activities Should Engage Students Designed appropriately to engage students in their learning, laboratory
investigative experiences hold the potential to aid enthusiasm for and mastery of course
objectives. In addition, proper design can improve students’ reasoning skills in science
(Singer et al., 2006, p. 2-3). Educational research clearly demonstrates that engaging

3
students actively in the process of learning fosters critical thinking and problem solving
(Taraban et al., 2007, p. 961).
A student-centered laboratory activity where students can be engaged in the
inquiry process through questioning, protocol design, data collection and analysis is the
most obvious way to involve the students in a science class (Marbach-Ad et al., 2010, p.
3; Yip, 2010, p. 485). Characteristics of student-centered labs include a direct means for
students to collect data, apply scientific principles to analyze and interpret data and
demonstrate learning though conclusions. This style of lab is in stark contrast to the
traditional style “cookbook” labs, which are so named because there is a set protocol to
follow without alteration. The end result in these types of labs typically has one
successful solution and lacks any opportunity for student exploration (Singer et al., 2006,
p. 123-124).
The use of living organisms in laboratory settings is another way to improve
student engagement. With their fast doubling time and simple preparation, bacteria offer
the potential for efficient open ended experiments. Bacterial cultures also offer the
benefit of being inexpensive and can be applied to many concepts covered in a typical
biology classroom (Johnson, 1958, p. 41; Peterson, 1973, p. 396). Because of their
ability to be easily manipulated in the lab they have easily accessible online genomic
data, microbes such as bacteria are an attractive model for use in laboratory activities
designed for teaching molecular biology.
Potential Constraints to Hands-On Activities Involving Microbes Microbes are an attractive research model to efficiently incorporate molecular
biology laboratory activities into the classroom but they are not often utilized at the high

4
school level (Yip, 2010, p. 485). The cost of the reagents and supplies required to work
with bacteria combined with the threat of possible contamination with pathogens are
restrictions that make hands-on labs difficult. Teacher experience with bacteria could
also be a limiting factor to classroom use. Although there are not any formal guidelines
in individual Kansas school districts, general safety recommendations are in place
(Schrock, 2013, pers. comm.).
The materials and equipment needed for molecular biology can be costly, thereby
limiting hands-on experiments. For schools to work with bacteria or other microbes, they
may require the use of an autoclave to sterilize equipment and safely dispose of live
cultures. However, the smallest portable industrial autoclave costs around $250 plus
shipping (Amazon, 2013). Nearly all experimental work involving DNA requires the use
of polymerase chain reactions (PCR). Thermal cyclers required for PCR cost $2,600 or
more. Standard equipment for biology classrooms such as micropipettes ($125 each),
microcentrifuges ($180 each) and gel electrophoresis chambers with power supply ($620
each) are extremely costly (MidSci, 2012). In addition to equipment, consumables and
reagents required for experimentation with microbes are often costly as well.
To fund their science classes, schools usually budget a specific amount of money
for the science department. Often, this amount is divided by the number of science
teachers within the department regardless of the number of laboratory activities each
teacher actually performs, the class size or number of sections taught. An informal poll
of Advanced Placement (AP) biology teachers who participated in the field trial (Chapter
3) revealed yearly budgets that ranged from $285 to $500 per teacher. Each of these
teachers taught two or more classes, often with more than one section per subject! Some

5
of these teachers were able to supplement their budgets by successfully competing for
within-district grants or learned how to stretch their budgets by finding creative ways to
save money. Clearly, the costs associated with doing molecular biology laboratories or
the burden of writing grants to supplement insufficient budgets lessens the likelihood that
effective hands-on instruction will take place in high school classrooms.
In addition to cost, safety is a classroom issue. Both The National Association of
Biology Teachers (NABT) and The National Science Teachers Association (NSTA) have
position statements on the role of safety in the laboratory. They state that appropriate
safety measures should be in place for all labs, including those that use microbes (NABT,
2012; NSTA, 2012, p. 1-6). In their position statement on laboratory safety, the NSTA
declares science teachers “must act as a reasonably prudent person would in providing
and maintaining a safe learning environment for their students.” (NSTA, 2012, p. 1). To
provide the safest possible environment, teachers need to be educated on appropriate
microbes to use and conduct the techniques themselves before teaching them in
laboratories. Statements from authoritative sources such as these are judicious but carry
the unintentional consequence of thwarting teachers’ desires to incorporate molecular
biology into their curriculum.
Teaching safety and aseptic technique using microbes can be an effective way for
students to experience guidelines common in research laboratories (Horn, 1993, p. 1).
However, mistakes in the lab can be dangerous and contamination of cultures or media
costly. The fear of contamination when using bacteria or other microbes in a classroom
faces teachers on two fronts. First, fear of the microbe being pathogenic (or even the
perceived threat of pathogenicity) could limit teachers’ use in the classroom (Johnson,

6
1958, p. 41). Secondly, the growth media used for most safe microbes are often the same
as that used to grow pathogenic organisms creating a situation where teachers or students
could unknowingly culture and perhaps spread truly dangerous pathogens. These
possibilities, however remote, are risks that most teachers are not willing to take with
their students.
A Model Classroom Organism: Halobacterium sp. NRC-1 Halobacterium sp. NRC-1 is a microbe representative of the third domain of life,
Archaea. It is a laboratory strain of Halobacterium halobium and one of the first
organisms to be completely sequenced (DasSarma and DasSarma, 2006, p. 6). Similar to
a bacterium, this organism offers ideal conditions for use in student labs by combining
properties that are typical of most microbes (motility, chemotaxis, mutation by strong
ultraviolet light, etc.). However, unlike bacteria, Halobacterium sp. NRC-1 is unique in
that it can be used as a microbial model organism without the usual risk factors
(DasSarma and DasSarma, 2005, p. 4).
Halobacterium sp. NRC-1 Addresses the Issues of Cost and Contamination It is relatively inexpensive to culture Halobacterium sp. NRC-1. A test tube of
this culture is approximately $10 from Carolina Biological Supply (Halobacterium sp.
tubes, 2013). The media can be easily made in the classroom in about an hour; it is
comprised of common chemicals, such as Magnesium Sulfate, Sodium Citrate and
Potassium Chloride, most of which are probably already found on most science
department shelves. Salt, Casamino Acids, Yeast Extract and the other media
components are reasonably priced. Even ordering every media component of BSYC, the

7
cost is less than $23 per liter, therefore, cost is not a restriction in using this microbe.
Because of the extreme salinity required by Halobacterium sp. NRC-1, less equipment is
required; an autoclave and sterile equipment are not necessary.
Halobacterium sp. NRC-1 avoids the potential for contamination of student
experiments because of the halophilic conditions required by this organism. The 4.3 M
NaCl BSYC media (Broth of Salt, Yeast and Casamino Acids) required when culturing
Halobacterium in a classroom is approximately ten times the salinity of the ocean.
Because of this extreme salinity, non-halophilic microorganisms are unable to grow in
these conditions thus contamination issues are avoided (DasSarma and DasSarma, 2005,
p. 4).
Halobacterium sp. NRC-1 is considered a “safe microbe” for laboratory use. The
American Type Culture Collection (ATCC) classifies NRC-1 as a Biosafety Level 1
(BSL-1) organism. Materials classified at BSL-1 “are not known to cause disease in
healthy adult humans” (American, 2013). In fact, Halobacterium will lyse if the salinity
dips below 1.0-2.0 M NaCl (DasSarma and DasSarma, 2005, p. 4). Since this is a far
higher concentration than any place on the human body (saline is ~0.15 M),
Halobacterium does not pose a threat to students.
Halobacterium sp. NRC-1 Addresses the Archaean Domain Until recent molecular evidence indicated otherwise, Archaea were grouped with
bacteria as under the term prokaryotes and were known as members of the kingdom
Monera. The former taxonomic classification challenged in 1977 when Carl Woese and
colleagues applied RNA sequencing data to describe cellular relationships (Postlewait
and Hopson, 2009, p. 340; Woese and Fox, 1977, p. 5088-5089). It was not until 1990
8
when Woese used the term “three-domains” that the concept became widespread (Woese
et al., 1990, p. 4578-4579; Postlewait and Hopson, 2009, p. 340). Domains are a higher
grouping than kingdoms in the previous taxonomic classification system. The three-
domain system consists of Bacteria (true bacteria), Eukaryota (cells with a nucleus) and
Archaea (formally known as Archaebacteria) (DasSarma, 1995, p. 4).
Archaea do share many physical attributes to bacteria such as cellular size and
ribosomal subunits size (Evans, 1983, p.141). They also share numerous genes,
especially those that are metabolic in nature, that are not shared with Eukaryota (Woese,
2000, p. 8393). However similar Archaea and Bacteria might appear morphologically,
they contain significant enough differences to each be classified into their own domain
(Doolittle, 1992, p. 6). Molecular evidence revealed these organisms have unique cell
membranes, cell walls and small-subunit ribosomal RNA (rRNA) sequence (Doolittle,
1992, p. 6; Kates, 1992, p. 51; Peirce, 1999, p. 132).
Archaean cell membranes are comprised of waxy molecules instead of the true fat
molecules found in eukaryotes and bacteria (Flannery, 1997, p. 371; Evans, 1983, p.
141). Extremely high temperatures, such as those environments in which many Archaea
thrive, are known to denature molecules. The Archaea that flourish under such
conditions contribute part of their success to these waxy membranes that do not melt as
easily as the fat containing membranes would (Flannery, 1997, p. 371).
However, it is the unique rRNA sequence that is most commonly used to define
the three domains and distinguish Archaea (Roberts et al., 2008, p. 13953-13954).
Ribosomal RNA is a universal molecule found in all living organisms. It universally has
the same function: to facilitate translation of mRNA into proteins. Ribosomal RNA

9
comprises both subunit structures of the ribosome in the cell (small subunit and large
subunit). The sequence of rRNA rarely mutates, thus is easy to use to determine
relatedness of organisms (Woese, 2000, p. 8392).
Teachers often explain that Archaea, such as Halobacterium sp. NRC-1, are the
“strange microbes” that they will never encounter. Many Archaea can live in
environments where normal life forms cannot live and are therefore are called
extremophiles. Euryarchaeota is the largest division within Archaea. Euryarchaeota has
three main subgroups: the methanogens, thermoacidophiles and halophiles (Woese et al.,
1990, p. 4578-4579).
The methanogens are Archaea which convert carbon dioxide (CO2) into methane
in a process to yield energy (Evans, 1983, p. 139-140). They are anaerobic and are found
in hydrothermal vents, swampland, and even animal digestive tracts (Evans, 1983, p.
139). Some methanogens, such as Methanococcus jannaschil, can survive in
hydrothermal vents at the depths of the ocean where the atmospheric pressure reaches up
to 200 atm and temperatures range from 48-94°C (Flannery, 1997, p. 370).
Thermoacidophiles are the second group within Euryarchaeota. They flourish in
acidic environments with high temperatures such as sulfur springs and smoldering coal
tailings (waste from coal mining). In these conditions, acidity levels commonly reach a
pH of 2 or less (Evans, 1983, p. 139). Thermoacidophiles have even been found in sulfur
rich volcanic lava flows with a pH of less than 1 (Flannery, 1997, p. 371).
Because of their extremophilic lifestyle, the methanogens and thermoacidophiles
require conditions that are difficult to maintain in a laboratory setting. However,
halophiles are easy to cultivate and observe. Halophiles (salt-loving Archaea),

10
commonly inhabit very salty lakes like the Great Salt Lake in Utah or the Dead Sea in the
Middle East. Excitingly, these halophilic Archaea are relatively easy to culture in the
classroom. Not only can students have an authentic example of an Archaea microbe to
discover evolution and explore taxonomy, but Halobacterium can be used in student
inquiry labs to teach the topics of safety and sterility, microbiology, cytology, molecular
genetics and bioinformatics. This microorganism can be used to teach the importance of
microbes in general, serving as a unifying organism to weave together concepts in cell
morphology, genetics and biotechnology (Evans, 1983, p. 142).

11
Chapter 2 Genetics of Halobacterium sp. NRC-1 Gas Vesicles:
Basis for Design of a Teaching Kit
Halobacterium sp. NRC-1 has a completely sequenced and well-studied genome
(Ng. et al., 2000, p. 12176-12177). It contains three replicons, one of which is the large
chromosome that is approximately 2 Mb in size. This microbe also contains two “mini-
chromosomes” that contain many essential genes and are much larger than typical
bacterial plasmids. These mini-chromosomes are named pNRC100 (191 kb) and
pNRC200 (365 kb) (Kennedy et al., 2001, p. 1641; Ng et al., 1998, p. 1131-1132).
Gas Vesicles of Halobacterium sp. NRC-1 Fourteen percent of the entire Halobacterium genome consists of DNA that is
duplicated elsewhere in the genome. The duplications occur in the form of transposons,
inverted repeats and regions found on both mini-chromosomes (Kennedy et al., 2001, p.
1641). Insertion sequences (or IS elements) are small segments of DNA that move
within the genome. They can range anywhere from 521 bp (ISH2) to 1402 bp (ISH8) in
size (Fileé et al., 2007, p. 126-127). It is the IS elements that play a role in altering the
genotype of the gas vesicle gene region within Halobacterium sp. NRC-1.
The Halobacterium cells use organelle-like structures called gas vesicles to
control buoyancy in their natural environment (such as the Great Salt Lake or Dead Sea).
Buoyancy offers a means for this Archaean to receive more sunlight and oxygen found
higher in the water column, used for aerobic respiration and/or phototropism. Without
gas vesicles, the Halobacterium cells sink.

12
Gas vesicles are constructed from multiple gene products. The gvp (gas vesicle
protein) gene cluster is found on the mini-chromosome, pNRC100 (Figure 1). It consists
of two divergent operons (one operon running rightward, one leftwards) and includes 12-
13 genes (nearly 21,000 bp) (DasSarma et al., 1994, p. 7647). Three of the gvp genes
(gvpACN) undergo transcription in the rightward direction while the remaining ten
(gvpDEFGHIJKLM) undergo transcription in the leftward direction (Halladay et al.,
1993, p. 684). The gvpACN operon produces the primary structural protein, GvpA, and a
minor protein, GvpC, found in the membrane of gas vesicles (DasSarma et al., 1988, p.
6861; Halladay et. al, 1993, p. 684). The leftward-transcribed genes are involved in gas
vesicle assembly (DasSarma, et al., 1994, p. 7649; Shukla, 2004, p. 3185).
A spontaneous mutation rate of approximately 1% of Halobacterium sp. NRC-1
cells has been documented to occur in the gvp gene cluster because of active IS elements
(DasSarma et al., 1988, p. 6861). These mutants lack gas vesicles due to an IS element
disruption, which is thought to occur in either the gvpA gene or the gvpACN promoter
region (Halladay et. al, 1993, p. 688 and 690; DasSarma et al., 1988, 6861). When the
genes involved in making the gas vesicles are disrupted by an IS element, the cells lose
their ability to produce the vesicles and are referred to as Vac- colonies (DasSarma and
Arora, 1997, p. 3-4; DasSarma et al., 1994, p. 7646-7647). Colonies with gas vesicles
intact are referred to as Vac+ colonies.
The gas vesicles of Halobacterium sp. NRC-1 cause refraction of light (bending
of light) within the cells to make them appear pink and opaque due to the presence of red
carotenoids in the plasma membrane (DasSarma, 1995, p. 4). However, when gas
vesicles do not form, the light is refracted differently and the cells appear red and

13
Figure 1. Gas vesicle protein gene region from pNRC100. Note the two divergent
operons (red and blue) and the IS elements that are shown downstream of the gvp gene
region. Other IS elements are found upstream in pNRC100 as well. Image based on
graphic from HaloWeb and used with permission (Halobacterium sp. NRC-1, 2013).

14
translucent (DasSarma, 1989, p. 65; DasSarma and Arora, 1997, p. 2-3; DasSarma et. al,
1994, p. 7646). Figure 2 demonstrates the physical difference between the two types of
colonies.
Development of the Teaching Kit The high mutability within the gvp gene cluster and the easily discernible
phenotypic differences of the colonies makes it relatively easy to find mutant colonies
that have disrupted gvp genes (Vac-) simply by color. These features served as the basis
for the development of a set of classroom activities in which students utilize molecular
biology techniques to relate genotype to phenotype.
To develop the molecular biology activities, I first had to isolate and characterize
a Vac- mutant using PCR and DNA sequencing. Then, high school friendly techniques
were developed that could effectively lead students through the activities of colony
morphology observations, DNA extraction, PCR, gel electrophoresis and data analysis.
This kit also includes a comprehensive teacher and student instruction guide (Appendix
A).
Materials and Methods Bacteria and Media
Halobacterium sp. NRC-1 was obtained from Carolina Biological Supply
Company (Burlington, NC). It was cultured in liquid Broth of Salt, Yeast and Casamino
Acids (BSYC) media or on BSYC containing 2.0% agar on plates at 37°C. When

15
Figure 2. Halobacterium NRC-1 colonies of Vac+ (closed arrows) and Vac- (open
arrows). The photomicrograph in panel A was photographed with top lighting to
illustrate the pink (closed arrow) and red (open arrow) of Vac+ and Vac- phenotypes.
Panel B is the same field of view lit from underneath to demonstrate the opacity of Vac+
colonies and the translucence of Vac- mutants.
A B

16
cultured on solid media they were incubated inside resealable plastic bags. Growth
typically took 4 days in liquid cultures or 7-10 days on plates.
Primer Design
Three primer sets were designed to amplify the gvpA gene region of
Halobacterium sp. NRC-1, pNRC100. The first primer set was designed by using
“Primer-BLAST Primer designing tool” on the intergenic region between gvpD and gvpA
of Halobacterium pNRC100 (National, 2011). These primers were predicted to produce
a 1792 bp amplicon. The remaining two primer sets were designed using the NCBI
nucleotide database for Halobacterium sp. NRC-1, plasmid pNRC100 (NCBI, 2011).
BLAST of potential primer sequences was executed using 20 bp increments from the
gvpD-gvpA intergenic region for the forward primers; gvpC and gvpN regions were used
for the reverse primers (NCBI, 2011). These final two primer sets were determined to
have the potential to amplify 1529 bp (primer set 2) and 721 bp (primer set 3). All
primers were ordered from IDT (Integrated DNA Technologies, San Jose, CA). Primer
sequences are shown in Table 1.
DNA Purification
DNA was obtained from individual colonies, lawn or broth cultures using a
commercially available DNA isolation kit (DNeasy, Qiagen. Germantown, MD), or by
lysis followed by ethanol precipitation. For lysis/ethanol precipitation, the procedure
known as “Extremely Easy DNA Extraction” (Carolina Biological Supply Company)

17
Table 1. Primer sequences for each primer set. Sequences are written in standard 5’ to 3’
notation.
Primer Set Fwd Sequence Rev Sequence
1 agtctgtgggcgggtgagct acggctctgtgatcgcccct
2 tacttcttctccagtcgatggc gtcatgttttatcatccggc
3 ccatacacatccttatgtgatg tgccgatatcttgtttgtct

18
was followed. Briefly, a lawn of bacteria on a petri plate was lysed with 5 mL water and
the lysate collected into a glass test tube. DNA was precipitated by adding 4 mL of
chilled 95% ethanol. After incubation on ice for 20 minutes, the DNA could be spooled
on a wooden spooling stick. Then, it was transferred to a microcentrifuge tube and
centrifuged for 1 min at 2,200 x g. After removing the DNA and allowing the pellet to
dry by evaporation for 15 minutes, it was resuspended in TE buffer (Tris and EDTA,
pH=7.5). DNA yield and purity was determined by absorbance at 260 nm using a
spectrophotometer.
Polymerase Chain Reaction (PCR) and Gel Electrophoresis
PCR was performed using purified DNA samples or from crude lysates of a single
colony. PCR reactions were performed in 50 L with 5 L template, 0.1 L of 100 M
forward and reverse primers, 19.8 L dH2O, 25 L of Taq Master Mix Kit (item 201443,
Qiagen, Alameda, CA) per reaction. PCR conditions for testing the primers were 3 min
initial denaturation at 94oC, 1 min denaturation at 94
oC, 1 min annealing at 60
oC and 3
min extension at 72oC with 5 min final extension. After 30 cycles, PCR products were
visualized by electrophoresis in Tris-Borate-EDTA (TBE) buffer on a 0.8% agarose gel
for 75 min containing 5 g/mL ethidium bromide in the gel and running buffer. When
protocols were optimized for high school use, gels were post-stained with
CarolinaBLU™ or GelGreen™ instead of ethidium bromide.

19
DNA sequencing
PCR products were purified using a Qiaquick PCR cleanup kit (Qiagen). They
were sequenced at the University of Arkansas Medical Center in both directions using the
same primers used for PCR.
Results PCR of gvpA region for pNRC100
Three primer pairs were designed to amplify a region of the Halobacterium sp.
NRC-1 genome containing gvpA. The primers were tested using template DNA prepared
from three different wild-type colonies using Qiagen DNeasy kit. All 3 primer sets
produced a single band of the expected size as determined by gel electrophoresis (Figure
3).
Identification, Isolation and Characterization of gvp Mutants Having the primers and PCR conditions validated, the next step was to identify
and isolate Vac- mutants with IS elements within the amplified regions. Seven day old
liquid cultures of Halobacterium sp. NRC-1 were serially diluted to 1:10,000,000 and
spread plated on BSYC agar. After 10 days of growth at 37°C, mutants were isolated by
subculturing red colonies. Red, translucent mutants (Vac-) were readily available. Fifty-
four mutant colonies were found and transferred via sterile inoculating loop onto sectored
BSYC plates for subculture (Figure 4). Thirty-five of these isolates grew out as pink,
opaque colonies with the remaining 19 isolates continuing to grow out as red.

20
Figure 3. PCR amplicons using three different primer sets. Each primer set is
numbered (1,2 and 3) and was used to amplified wild-type Halobacterium sp. NRC-1.

21
Figure 4. A sectored BSYC plate containing five possible gvpA mutants. All sectors
were inoculated with a red colony. On this plate in particular, 4 of 5 sectors resulted in
pink outgrowths. Only sector #13 shows a pure culture of red colony morphology.

22
The 19 red mutants of NRC-1 were tested to determine the presence of an IS
element within the gvpA gene. DNA was extracted using Qiagen DNA-easy extraction
kits and PCR was performed on each using primer set 1. PCR products were run on a 1%
TBE agarose gel alongside PCR products from wild type samples. Of the 19 mutants
tested, only two were found to produce a PCR amplicon different from the wild type. One
contained an estimated extra 520 bp and the other contained an extra 1400 bp. These
were named KBT-1 (Kansas Biology Teacher) and KBT-2 respectively (Figure 5).
Sequencing of KBT-1 and KBT-2 was done in both directions using the same
primers utilized in PCR. All four sequencing reactions produced reads of approximately
880 bp. The sequences were assembled using a sequence editor (HaloWeb) to determine
the reverse-complement of the sequences that were obtained using the reverse primer. A
BLAST of each sequence was done against the Halobacterium sp. NRC-1 and were
found to align with the genome locus containing gvpA to which the primers were
designed.
Analysis of the sequences revealed KBT-1 contained 533 bp inserted immediately
after position 129 in the gvpD/gvpA intergenic region. Using ntBLAST (NCBI), it was
determined that the inserted DNA in KBT-1 matched an IS element called ISH2.
Analysis of the assembled sequence of KBT-2 revealed it aligned for 73 bp with NRC-1
beginning at position 210 in the gvpD/gvpA intergenic region. Using ntBLAST data
(NCBI), it was determined that a portion of KBT-2 matched the first 119 bp of both ISH8
and ISH11 (Figure 6).

23
Figure 5. PCR amplicons of a wild type (lane 2) and Two Mutants (lanes 3 and 4).
Primer set 1 was used on all samples. Lane 2 (NRC-1) has a band of approximately 1750
bp, the band in lane 3 is approximately 2300 bp (KBT-1) and the band in lane 4 is
approximately 3200 bp (KBT-2).
Lane
1 2 3 4
4,000 bp
3,000 bp
2,500 bp
2,000 bp
1,500 bp

24
Figure 6. A comparison of the gas vesicle gene regions of pNRC100 for sp. NRC-1,
KBT-1 and KBT-2. Panel A shows the Vac+ genes of sp. NRC-1 (wild type). Panel B
shows the IS element, ISH2, which incorporated into the intergenic region between gvpD
and gvpA of KBT-1 (Vac-). Panel C shows the same region for KBT-2 which also had
ISH8/ISH11 insert into the intergenic region. Images not to scale.

25
Adapting protocols for use in high schools In order to develop a teaching kit for high school classrooms, it was essential to
develop an easy and inexpensive DNA extraction protocol and to validate the DNA
obtained was amenable to PCR. This is not a trivial set of experiments. Commercial kits
are optimized to limit the effects of DNases and there are shear forces in pipetting and
mixing, all of which limit the quality of DNA obtained. In addition, any contaminants
left behind from simple DNA protocols make quantification difficult and potentially
hinder the notoriously finicky PCR reactions.
The first method tested was based on a published protocol by the Carolina
Biological Supply Company called “Extremely Easy DNA Extraction.” Three plates
containing wild type Halobacterium NRC-1 were cultured for 7 days at 37°C to create a
lawn of growth. DNA was extracted from the lawn by lysis in water and subsequent
precipitation with ethanol. This procedure produced a large amount of DNA. It was
found to be 1.15 A260/A280 and with average yield 137.8 ng/L and determined by
spectrophotometer suitable for PCR if diluted to 12-30 ng/L with TE buffer. However,
because of the high mutability of Halobacterium sp. NRC-1, even DNA fragments from
wild type (pink) pure cultures contained multiple amplicons (Figure 7).
Although the modified "Extremely Easy DNA Extraction" method provided an
inexpensive way for high school students to extract Halobacterium DNA, it was not
expected that high school laboratories would be equipped with a sensitive enough
spectrophotometer to determine the appropriate amount of DNA for PCR. Furthermore,
the multiple bands from a lawn would be problematic for interpreting results. In order to
eliminate the measuring and diluting of DNA samples, PCR was tested using raw

26
Figure 7. Modified “Extremely Easy DNA Extraction” samples (lanes 2-4). These
samples were amplified by PCR then run on 1% TBE agarose gels. The samples in lanes
2-3 were each from plates containing 3 or 4 pure red cultures which shows the expected
multiple bands. However, lane 4 sample was extracted from a lawn of pure wild type
cells (pink) with the anticipated band at 1800 bp. An additional band is faintly visible at
approx. 3800 bp. Although pure cultures would typically have only one band, the
spontaneous mutation rate of approx. 1% in Halobacterium sp. NRC-1 means that
additional bands are not unlikely.
27
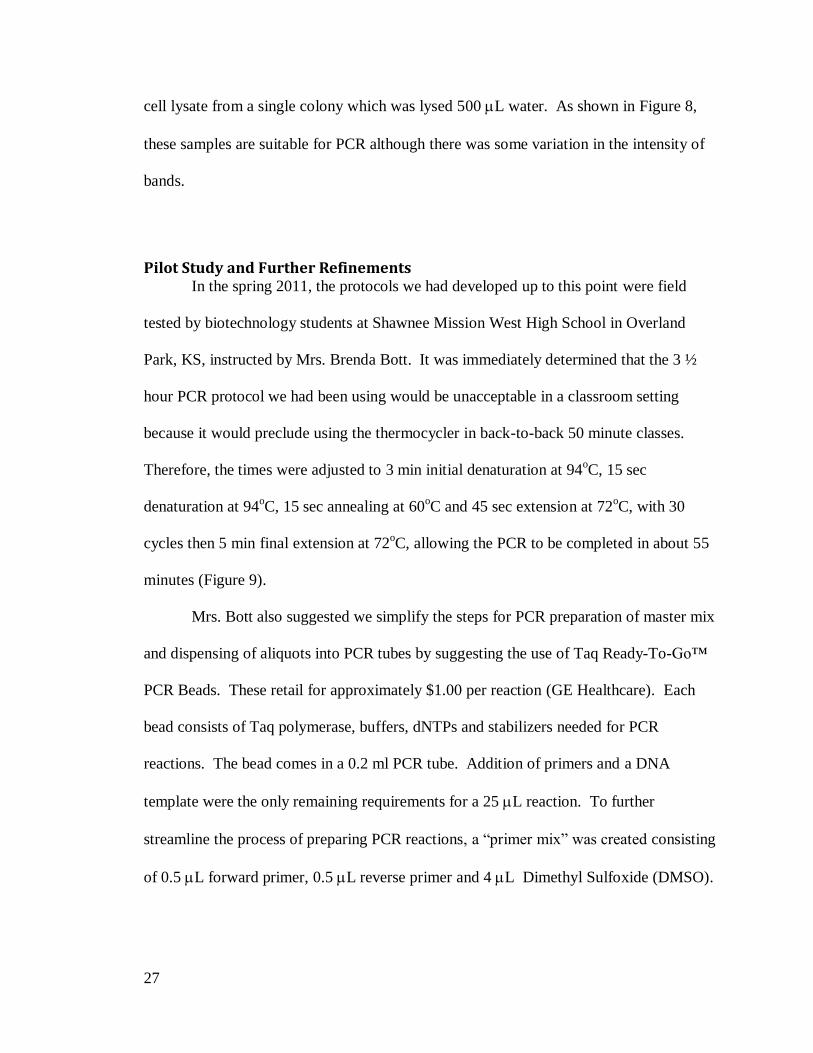
cell lysate from a single colony which was lysed 500 L water. As shown in Figure 8,
these samples are suitable for PCR although there was some variation in the intensity of
bands.
Pilot Study and Further Refinements In the spring 2011, the protocols we had developed up to this point were field
tested by biotechnology students at Shawnee Mission West High School in Overland
Park, KS, instructed by Mrs. Brenda Bott. It was immediately determined that the 3 ½
hour PCR protocol we had been using would be unacceptable in a classroom setting
because it would preclude using the thermocycler in back-to-back 50 minute classes.
Therefore, the times were adjusted to 3 min initial denaturation at 94oC, 15 sec
denaturation at 94oC, 15 sec annealing at 60
oC and 45 sec extension at 72
oC, with 30
cycles then 5 min final extension at 72oC, allowing the PCR to be completed in about 55
minutes (Figure 9).
Mrs. Bott also suggested we simplify the steps for PCR preparation of master mix
and dispensing of aliquots into PCR tubes by suggesting the use of Taq Ready-To-Go™
PCR Beads. These retail for approximately $1.00 per reaction (GE Healthcare). Each
bead consists of Taq polymerase, buffers, dNTPs and stabilizers needed for PCR
reactions. The bead comes in a 0.2 ml PCR tube. Addition of primers and a DNA
template were the only remaining requirements for a 25 L reaction. To further
streamline the process of preparing PCR reactions, a “primer mix” was created consisting
of 0.5 L forward primer, 0.5 L reverse primer and 4 L Dimethyl Sulfoxide (DMSO).
28
Figure 8. PCR of crude lysates prepared by lysing a single colony. Each colony was
lysed in 500uL water followed by microcentrifugation. Lanes 2 - 3 contain amplicons
from KBT-1. Lanes 4 – 5 contain amplified DNA from KBT-2. Lanes 6 - 7 contain
amplicons from NRC-1. Photo by J. Hund.

29
Figure 9. 1% agarose gel with PCR products that were in the thermal cycler for
approximately 55 minutes. Lanes 2-5 and 8-9 contain amplicons from NRC-1. Lanes 6-
7 contain amplicons from KBT-2. Lanes 10-11 contain amplicons from KBT-1.

30
These changes greatly reduced the number of pipetting steps thereby decreased PCR
setup time without compromising quality of PCR reactions (data not shown).
Gel Electrophoresis Protocol The next step was to determine the ideal agarose gel percentage for gel
electrophoresis. The DNA fragments for NRC-1 were 1792 bp and the fragments for
KBT-1 were 2325 bp. Various gels were run with 0.8% - 1.2% TBE agarose to
determine which had the best band separation with bands of this size in the time limits
imposed by a high school class. It was determined that 0.8% gels provided good band
separation when run at 115 V for 70 min (Figure 10).
A DNA ladder for gel electrophoresis was needed to allow the accurate
measurement of the sizes of the bands with sufficient resolution to distinguish a wild type
(1792 bp) from KBT-1 mutants (2325 bp). A DNA ladder with bands from 10,000 – 500
bp (1 kb DNA ladder, New England Biolabs) had bands in increments of 1,000 bp and
allowed easy visualization of the fragment size that was either larger or smaller than
2,000 bp (Figure 10).
Discussion Our results found that 35 of 54 isolated red mutants resulted in pink wild type
colonies upon sub-culture. This is likely either from contamination during isolation from
the other colonies on the plate or due to them being revertants (not true Vac- colonies).
Of the 19 red mutants that remained red during sub-culture, 17 were observed by gel
electrophoresis to have the same amplicon size as did the Vac+ controls. Although they

31
Figure 10. 1 kb DNA ladder used to quickly estimate size of DNA fragments on a 0.8%
agarose gel. Lane 1 is the DNA ladder. Lanes 2, 4 and 7 contain amplicons from NRC-1
(1792 bp). Lanes 3 and 6 contain amplicons from KBT-1 (2325 bp) while lane 5 contains
KBT-2 amplicons (approx. 3200 bp).

32
could have contained an IS element which caused a disruption to the gvp gene region,
they did not contain an IS element within the amplified primer region.
Two of the isolated red mutants had amplicons which produced larger bands
(approximately 2300 bp and 3200 bp) than the Vac+ controls (1792 bp). We named the
mutants KBT-1 and KBT-2, respectively. KBT-1 was determined to have an IS element,
ISH2, that had inserted just before the gvpA gene start. ISH2 contained 521 bp followed
by 12 bp direct repeat. Downstream of the direct repeat, the sequence of KBT-1 matched
NRC-1 and continued uninterrupted for approximately 200 bp downstream. After this,
there was incomplete sequence data for approximately 550 bp which was reconstructed
using the NRC-1 sequence. KBT-1 was determined by sequence data to contain 2325 bp
in the area amplified between primers. This was consistent with evaluations of gel
electrophoresis amplicon size.
ISH2 is typically 521 bp long with up to 19 bp inverted repeats on each. When
the insertion occurs, a sequence at the insertion site is duplicated from the beginning of
the insertion site and duplicated at the end of the IS element (Filée et al., 2007, p. 126).
This is called a direct repeat and was found to be 12 bp long in KBT-1. Thus, the entire
insertion was 533 bp, making the entire amplicon 2325 bp.
The other isolated mutant, KBT-2, was found to align 73 bp with NRC-1
beginning 210 bp after the start of the gvpD/gvpA intergenic region. After those 73 bp,
there were 113 bp that partially matched with both ISH8 and ISH11. Following the
partial IS element insertion, KBT-2 aligned with NRC-1 for the final 684 bp in the
amplified region. However, the construction of the sequence data is incomplete as it did
not contain approximately 3200 bp that was shown on multiple gels. It is possible that

33
KBT-2 does contain either or both complete ISH8 (1402 bp) or ISH11 (1068 bp)
sequences which would be consistent with the estimated 3200 bp. Alternatively, KBT-2
could contain partial sequences of either ISH8 or ISH11 or other IS elements which,
when combined, would be approximately 3200 bp (Filée et al., 2007, p. 126). However,
without complete sequence data, it is unknown. Both KBT-1 and KBT-2 sequences are
diagramed in Figure 6.
We have reported that single colonies of Halobacterium lysed in water followed
by crude purification were able to successfully undergo PCR. Using water as the only
reagent and a microcentrifuge as the only equipment required for DNA extraction made
the protocol inexpensive and simple for high school use. Single colony extractions were
necessary to ensure DNA is extracted from a single pure culture. Because of the
mutation rate of Halobacterium sp. NRC-1, extraction from a petri plate lawn of NRC-1
would not yield pure culture results, as Figure 7, lane 4 shows. In addition, it would be
more costly and time consuming for teachers to produce enough entire lawns for each
student to have one plate from which to extract DNA. Single colony extractions using
water and microcentrifuge made the process cheaper and easier.
Following the suggestions of the school that piloted the kit, we altered the PCR
kit protocols. Taq Ready-To-Go™ PCR Beads were used to simplify PCR preparation.
Students would only need to add DNA template to the PCR tubes which already contain
the Taq PCR bead. The thermal cycler times were also adjusted to run within a
traditional class period. Both changes allowed for a much more simplified way for
students to create a 25 L PCR reaction.

34
The aforementioned materials and protocols were optimized for the teaching kit,
The Genotype-Phenotype Connection: Basic Molecular Biology and Bioinformatic Skills,
now available through Carolina Biological Supply Company (Burlington, North
Carolina). Each protocol was written into a different lab activity found within the kit.
Students choose a colony to perform DNA extraction, either KBT-1 or NRC-1. They
then work through the activities of PCR, gel electrophoresis and data analysis to relate
the concept of genotype to phenotype of Halobacterium. With the assistance of the
DasSarma lab (Baltimore, MD), we also developed an extensive teacher’s manual
(Appendix A).

35
Chapter 3: Field Trial of
The Genotype-Phenotype Connection Kit
Engaging students in the process of learning will improve critical thinking and
problem solving; therefore it is important to involve students in their learning (Taraban et
al., 2007, p. 961). A student-centered laboratory activity where students can be engaged
in the inquiry process through questioning, protocol design, data collection and analysis
is the most obvious way to involve the students in a science class (Marbach-Ad et al.,
2010, p. 3; Yip, 2010, p. 485). Yet, it has traditionally been difficult to apply these ideals
when teaching molecular biology topics to high school students (Duncan et al., 2007, p.
938-939; Stieff, 2011, p. 1138).
Molecular biology concepts of DNA, transposable elements, bioinformatics, cell
lysis, PCR, genotype-phenotype relationships and gel electrophoresis are the subjects of
the hands-on laboratory teaching kit we designed for high school students called The
Genotype-Phenotype Connection. This kit weaves the technological applications of the
discipline of molecular biology with exploration of a living organism, Halobacterium sp.
NRC-1. The kit uses a hands-on, engaging approach to introduce students to concepts and
laboratory procedures they may not have experienced before such as Archaea,
bioinformatics, polymerase chain reaction (PCR), IS elements and gel electrophoresis.
To evaluate the kit as a teaching tool, we developed the following research questions with
teachers and students in mind:
Do teachers find this kit to be an effective molecular genetics & bioinformatics
teaching tool?
What suggestions would teachers have for improving it?
What are students’ reactions to laboratory exposure of these concepts?

36
Are the laboratory activities of the kit effective at teaching molecular biology
concepts to AP biology students?
Materials and Methods Potential field testing teachers were identified from the Kansas State Department
of Education (KSDE) database, which was compiled through statewide submissions by
principals the previous fall (Kansas, 2011). We sent an e-mail soliciting participation in
the study to 41 Advanced Placement (AP) Biology teachers (Appendix B). Teachers
were asked to complete an online screening survey (Appendix C). The survey was
conducted through Zoomerang and posted online through the Information Technology
Services department at Emporia State University. The survey collected logistical and
demographic information about the teacher and school so that selection of the field study
participants could be made. Ten teachers were invited to participate in the field study,
nine of which accepted the invitation. Three teachers taught two or more sections of AP
Biology, resulting in a total of 13 sections of AP biology classes committing to the study.
To control variability between classrooms, teachers were provided detailed instructions
and timelines for completing the activities. This included students reading the
background, completing the pre-labs, laboratory activities and the student follow-up
questions. A lesson plan suggestion for the week was provided to teachers to help them
with pacing of the kit components (Appendix D). To help identify variables in delivery
of kit materials teachers were asked to report any portions of the kit they were unable to
complete.
Student learning gains were assessed using short pre/post tests (Appendix E).
These tests were timed, allowing 12 minutes for completion. Although 206 students
participated in the kit field trial, 14 students' scores were omitted because they were

37
either missing the pre-test or post-test. Therefore, 192 students completed the pre/post
assessment of the field trial (n=192).
Scores for the objective portion of the student tests were tabulated by entering
each students responses into an Excel spreadsheet (Microsoft Office). One-tailed t-tests
were used to determine if student post-test scores held higher student achievement than
the pre-test scores. Results were tabulated for each question independently and
considered statistically significant if p<0.05. The student short answer responses were
evaluated by two independent evaluators using a rubric that distinguished three levels of
responses; partially correct answers = 0.5 points, correct answers = 1.0 points and upper
level answers = 1.5 points. Wrong or blank answers did not receive a score. Scores from
the two evaluators were averaged; agreement on point values between the two evaluators
was 97%.
Qualitative assessment was also performed. Teachers completed a post-kit
evaluation of various aspects of the kit and additional comments were solicited
(Appendix F). Students were also asked to provide general comments regarding their
experience with the kit. These comments were sorted by topic (background, lab
activities, etc.). Both teacher and student responses were tabulated in Excel.
Results Teacher and School Participants
Teachers and students completed an informed consent document (Appendix G).
All participating students (n=206) and teachers (n=9) filled out the informed consent
document prior to participating in the field trial.

38
The nine teacher participants provided facts about their teaching credentials and
experience with the topics of the teaching kit in the initial screening survey (Appendix
C). Combined, these teachers represented 176 years of teaching experience (median =
18 yr). They had a combined 76 years teaching AP Biology (median = 3 yr). This was
the first year for one participant to teach AP whereas another teacher indicated he had
been teaching AP for 50 years. This group also had a wide range of education and
teaching subject licenses. Nearly half (44%) of participants had a Bachelor of Science or
Bachelor of Arts degree, whereas the others (54%) had either a Master of Science or
Master of Arts graduate degree. All of the teachers indicated that they were licensed in
Biology with 56% also licensed in General Science. One third of participants had
additional teaching license in chemistry. One teacher indicated licensure in Botany while
another in Psychology.
The schools represented in this field trial are primarily public high schools.
However, one school (accounting for 4% of the participating students) was a private,
non-religious affiliated school. The sizes of schools ranged from 525 total student
enrollment to 2500 students, with median enrollment 1400 students.
There were striking similarities in the choice of textbooks among the schools
participating in this study. Eight of nine (89%) had adopted the textbook, Biology,
written by Neil Campbell and Jane Reece, published by Pearson. The remaining school
had adopted the book Biology, written by Sylvia Mader and published by McGraw-Hill.
Because various high schools had the potential of offering different programs
within the Advanced Placement class, teachers were asked to describe their AP biology
classes. Seven of the schools (78%) participating in this study described their class as AP

39
Biology only. Two schools (22%) explained their class as AP Biology/College Now
combination. College Now is a program offered through local community colleges or
universities that allow high school students to receive college credit for completion of
courses at their home high school. Both of the AP/College Now classes were offered by
larger schools with a mean school size of 1550 students. These classes comprised 4 of
the 13 class sections participating in this field trial, with 84 total students and mean class
size of 21 students.
Additionally, teachers were asked to identify the origin of their most effective
training in molecular biology techniques. Three of the teachers (33%) answered that they
learned at specialty clinics for molecular biology labs. Two of those teachers specifically
added that the specialty clinic was offered through Cold Springs Harbor (Cold Springs
Harbor Laboratories in Cold Springs Harbor, NY). Other teachers indicated that they
most effectively learned laboratory techniques through undergraduate coursework (22%)
or AP Biology training workshops (22%). One teacher (11%) found the most effective
way he learned molecular biology laboratory techniques was through a molecular biology
teaching course offered by his nearby university. The final teacher participant indicated
he learned molecular biology techniques from a variety of sources including graduate
coursework and local, district or national workshops.
Equipment Needs of Field Trial Teachers
Prior to the field trial, teachers were given a list of equipment required to
complete the kit activities. The equipment that schools lacked was loaned to them by
Emporia State University Department of Biology. Three of the participating schools
(33%) either had a thermal cycler in their building or access to one through their district;

40
six schools needed to borrow a thermal cycler (67% participants). Two of the nine
schools needed to borrow gel electrophoresis chambers and power supplies (22%). Three
schools (33%) did not have access to micropipettes. Two schools (22%) borrowed a
microcentrifuge, however one of those schools could have secured a microcentrifuge
through a local community college if the high school would not have been able to borrow
through ESU.
Success with Kit Protocols Following the timeline we provided, teachers guided their students through the
background reading, pre-labs, kit activities and discussion. The entire process took
approximately six classroom hours to complete. Success with the kit protocols was
indicated by the presence of visible bands on a gel containing PCR products from various
colonies. Five schools completed the kit procedures without significant problems as
evidenced by production of analyzable gels (Figure 11A). Two schools produced gels
but had difficulty in doing so. Two schools were unable to yield gels where students
could see bands for analysis (Figure 11B).
Two of the seven schools that had measureable bands on the gels did encounter
some challenges. One teacher ran out of time so he had his lab assistant combine the
reagents for the PCR reactions instead of the students doing this step. With nearly 50
reactions to prepare, the lab assistant left the cell lysate (extracted DNA) sitting at room
temperature longer than recommended. Therefore, the last 8 PCR reactions that the lab
assistant set up were unsuccessful (results not shown). The second school that
encountered a challenge was the one that requested GelGreen™ stain instead of Carolina
BLU™ stain. GelGreen™ requires ultraviolet light to see the bands. This teacher used

41
Figure 11. Example classroom gels provided by field trial teachers. Panel A is a typical
classroom gel with favorable results. The ladder is lane 1; wild type DNA fragments
(Halobacterium sp. NRC-1) are loaded in lanes 2, 3, 4 and 8. Mutant (KBT-1) fragments
are in lanes 5, 6 and 7. Figure B is a gel with slight movement of the DNA ladder but no
movement of the DNA fragments (barely visible in each lane).
A B

42
an ultraviolet aquarium light but found that the aquarium light was not intense enough to
see the bands, therefore the gel results could not be determined. However, this teacher
had CarolinaBLU™ on hand and after staining with it, the bands showed up faintly and
could be used in student analysis.
Out of the nine schools doing the field trial, two schools (22%) did not have any
DNA bands appearing on their gels (Figure 13B). It was not immediately clear why one
of the two schools had unfavorable results. The teacher was confident she and her
students followed all of the instructions within the kit. In addition, she was certain her
students kept the materials on ice when directed to do so, working briskly but carefully so
nucleases did not degrade the DNA. She allowed the gel to run for 75 minutes, yet the
material the students loaded into their wells did not migrate as would be expected.
A second school produced gels that the students could not analyze. Upon
interviewing the teacher, it was determined the students in this class loaded the gels on a
Friday afternoon and left the gel at room temperature over the weekend. Leaving the gels
overnight before running or staining is not recommended in the kit directions.
Teacher Perspectives Overall Post-Kit Evaluation
At the conclusion of the kit field trial, teachers completed an evaluation of the kit,
rating various aspects of the kit (Appendix F). Most questions, as described below, were
rated on a Likert scale from 5 through 1. Teachers rated their overall satisfaction with the
concepts presented in the kit (question 1) with an average of 4.1 (mostly satisfied). When
asked if the topics in this kit helped the teacher meet the course objectives (question 3),

43
teachers scored the kit an average of 4.3 on a 5.0 point scale with no individuals scoring
the kit below 4.
Teachers rated the entire kit an average of 4.3 (agree) when asked if the kit
information and activities within the kit were at an appropriate level for the AP Biology
class (question 4). Teachers found that the information provided in the teacher guide was
clearly stated and contained all necessary information (question 6) with an average 4.2
rating (agree). When asked if the time requirement for the various lab sections (as listed
in the kit teacher guide) was reasonably accurate (question 8), teachers rated the timeline
with 4.2 points. One teacher commented, “the timeline worked.” Another teacher that
scored this question as 4 (agree) commented that PCR preparation and gel loading took
more time than stated. One teacher mentioned that information about gel storage if the
schedule did not allow staining directly after running of the gel would have been helpful.
Teachers were asked about their comfort level with preparing the materials for the
lab (such as diluting the TBE buffer, pouring and running a gel, etc.) given the
information provided in the teacher instructions (question 7). Teachers rated their
comfort level of lab preparation with an average of 4.4 points (somewhat comfortable).
One teacher mentioned he had his students do the lab preparation and they followed right
along. Another teacher delegated the teacher preparation to a biotechnology class within
in his school. He reported that they had no problems with the preparation. Two teachers
mentioned they felt more comfortable because they could call me to ask questions about
any preparation issues in which they had uncertainty.
44
Breakdown of Concepts Presented in the Kit The major topics addressed in the kit are: Bioinformatics, Insertion Elements,
Microbiology, PCR and electrophoresis. The kit covers all of these topics both as “wet
lab,” and conceptually through the background reading and student guide questions. An
objective of this field trial was to determine if teachers would find this kit to be an
effective teaching tool of these topics. Presumably, teachers would find the kit to be
more effective at teaching concepts than their previous methods, particularly if the
previous methods did not include a “wet lab” component. Teacher satisfaction with each
topic as presented in the kit is shown in Figure 12.
Teacher Perspectives of Student Guide Since the primary student interaction with the kit was through the “student guide”
it was of interest to ascertain teachers’ impressions. Teachers rated the student guide by
answering two questions in the post-kit evaluation questionnaire. The first question
asked if the teacher found the instructions/protocols provided in the student guide to be
clearly stated and containing all necessary information (question 9). Teachers scored this
question with an average of 4.4 points (agree). One teacher commented that the
“instructions for the students were well-written.” Another teacher commented that visual
aids would facilitate the instructions. Another teacher mentioned that he would have
liked more directions and for it to be clearer where the lab was going. He also mentioned
that a crime scene investigation (CSI) approach would be interesting. Another teacher
commented that this was an “excellent student guide.”
The second question pertaining to the student guide asked the teachers if “the
descriptive information in the kit (background and within each activity) was sufficient for

45
Figure 12. Teacher satisfaction with topics as presented in the kit. scores were rated on a
Likert scale of 1-5 with n=9 teachers.
dissatisfied
slightly dissatisfied
neither
slightly satisfied
satisfied
colony morph. PCR gel electroph. DNA extract. sterile techn. IS elements

46
students to answer the student analysis questions” (question 12). Teachers scored this
question with an average of 4.2 points (agree). One teacher commented that his students
struggled with some questions, but were able to answer most of them. Another teacher
observed that the information to answer the questions was embedded in the background
for the most part but teacher instruction was needed to clarify the concepts.
Analysis of Student Pre/Post Test Scores To determine student knowledge and understanding of concepts, students
completed a short test before and after using the kit (Appendix E). The pre/post-tests
were divided into two portions: objective (multiple choice/matching) and short answer.
Objective Questions
On the objective portion of the tests, the first question entailed matching 5 PCR-
related vocabulary words with their meanings (question 1). A comparison of pre-test
compared to post-test scores for each student participant showed that students improved
their overall vocabulary scores by an average of 10% after completing the kit activities.
Two vocabulary words, however, scored lower on the post-test than the pre-test.
Students scored lower on average for the words “nucleotide” (-10%) and “DNA
polymerase,” (-6%). However, these differences were not statistically significant.
On the other hand, students scored higher on average for three words. For the
word “DNA”, students scored an average of 6% higher on the post-test and for the word
“primers,” students scored 8% higher. However, these differences were not statistically
significant at p<0.05. On the post-test, students scored higher for the word “buffer”
students scored 15% higher which was found to be statistically significant (Figure 13).

47
Figure 13. Average student pre/post-test scores for matching vocabulary questions. Only
the word indicated by asterisk, “buffer,” was found to be statistically significant. Score
differences between pre-test and post-test were not found to be statistically significant at
p<0.05 for the other vocabulary words.
0
10
20
30
40
50
60
70
80
DNA Polymerase
DNA Primers Nucleotide * Buffer
% o
f St
ud
ents
Res
po
nd
ing
Co
rrec
tly
Pre-test
Post-test
48
The remainder of the objective portion of the pre and post-tests was comprised of
7 multiple choice questions. A comparison of student individual pre versus post-test
scores indicated an average 35% overall increase in correct multiple choice answers after
the students were exposed to the kit (Figure 14). Paired 1-tailed t-tests comparing each
students’ pre-test score to his/her post-test score were completed for each of the 7
questions. Each question had statistically significant student achievement for the
multiple choice post-test at p<0.05. Question 2 addressed students’ knowledge of the
fundamentals of PCR. Question 3 assessed student understanding of band migration
during gel electrophoresis. Question 4 had students choose what would happen if a cell
was placed in a solution that was very salty (hypotonic solution). Question 5 asked the
students to choose appropriate primers from a diagram to amplify a gene region known to
contain IS elements. Question 6 also referred to the diagram from Question 5. Students
were asked to explain gel electrophoresis results that yielded bands the same size, even
though the mutant was known to contain an IS element. Question 7 described a case
study of a patient that suffered physiological effects of an IS element in his/her genome.
Question 8 asked students to identify characteristics of the Archaea Domain.
Short Essay Questions
The second portion of the pre and post tests included 3 short answer questions.
Question 9 was in 2 parts: students were asked to A) briefly explain one cause of a gene
disruption and B) explain the effects of that gene disruption. It became apparent during
the scoring of the tests that some students confused the cause with the effects. Because it
was more important to consider the students’ knowledge not their ability to read the

49
Figure 14. Comparison of average student pre/post-test multiple choice scores. The
post-test scores were found to be statistically significant for each of the 7 questions.
0
10
20
30
40
50
60
70
80
90
2: PCR stages
3: gel electroph
4: osmosis 5: PCR design
6: PCR/gel 7: case study
8: domains
% o
f St
ud
en
ts R
esp
on
din
g C
orr
ect
ly
Pre-test
Post-test

50
question carefully, both A and B were considered before a score for each was rendered.
Question 10 asked students to consider an evolutionary advantage of a genome that has
IS elements (transfer of knowledge).
The student short answer responses were evaluated by two independent evaluators
using a rubric that distinguished three levels of responses; partially correct answers = 0.5
points, clearly correct answers = 1.0 points and upper level answers = 1.5 points. Wrong
or blank answers did not receive a score. Scores from the two evaluators were averaged.
Comparing the pre-test to the post-test, approximately one-third of students went from 0
points (wrong or blank answer) on each essay question to receiving points for some form
of correct answer (partially correct, clearly correct or upper level answer). There were no
students (pre or post) that responded with an upper level answer on question 9A. Very
few students had an upper level answer on the other questions. Two students had
answered with upper level understanding on 9B on the pre-test, compared to 9 on the
post-test. Zero students had an upper level understanding on question 10 on the pre-test,
with 2 students demonstrating upper level understanding on the post-test.
Students improved their overall essay score on the post-test with an average of
22% (Figure 15). Student achievement for each short essay question on the post-test was
found to be statistically significant at p<0.05. Question 9A asked students to describe a
“cause of gene disruption.” Question 9B had students explain the “effect of the gene
disruption written in 9A”. Question 10 asked students to describe “an evolutionary
advantage ” of a genome that has transposons. This question was not specific to IS
elements but remained general with the term “transposon.”

51
Figure 15. Comparison of average student short essay scores. Student
achievement for each short essay question on the post-test was found to be statistically
significant.
0
10
20
30
40
50
60
70
80
9A: Cause 9B: Effect 10: Evol. Adv.
% S
tud
en
ts R
esp
on
din
g C
orr
ect
/Par
tial
ly
Co
rre
ct
Pre-test
Post-test

52
Student Perspectives of the Kit Experience Following the 12-minute post-test objective and short answer questions, students
were given additional time to provide open-ended comments about the kit. They were
asked to "please give me specific feedback regarding The Genotype – Phenotype
Connection: Molecular Genetics and Basic Bioinformatics Skills kit." The only
additional prompt offered was "I would love to have your thoughts about the various lab
activities, the pre-labs, the background information and the Student Analysis and Follow-
up Questions (good or bad)." Only ten percent of students either chose to leave this
section blank or wrote "no comment" while 90% responded with remarks (173 students).
Because they were given the opportunity to write as many comments as they wished, the
total number of comments exceeds the number of student respondents. A summary of
student remarks is found in Table 2.
Overall Impressions
There were 232 general remarks regarding this lab. Seventy-seven percent of
those comments were positive. Some of the positive comments included two students
that mentioned that they found the instructions in the kit clear and detailed so the labs
were easy to accomplish. Another student commented that this lab was "super fun",
while another mentioned that he/she thought it "was neat being able to do higher level
biotech labs." One student stated that he/she really enjoyed all the steps of the lab and
another student stated he/she was glad to do this lab because "it was good to do
something different, I have never done anything like this before." Other positive
comments included mention of the step by step instructions with information about why
each step was done was nice and another that stated he/she learned a lot about the

53
Table 2. Percentage of Student Respondents for Various Components of the Teaching
Kit. The overall responses (n=387) could be broken down into general comments or
various subtopics topics.
Topic Positive Comments Negative Comments Student Respondents
General Kit
Comments 77% 23% n=232
Hands-On Component 53% 47% n=34
Background Reading 61% 39% n=49
Pre-labs 36% 64% n=25
Student Data Analysis 83% 17% n=6
Follow-up Questions 54% 46% n=41

54
interaction between genotype and phenotype from this lab. One student commented that
he/she "definitely learned a lot from this lab, potentially more than any other lab I've
done in a science class."
Of the general comments regarding the kit, 23% of them were negative. Some of
the negative comments included "the general message was clear, just getting the
information in some areas wasn't understandable" and "confusing at first." One student
mentioned that he/she did what the sheet said but “wasn't really sure what I was doing."
Another student had a similar remark with "we'd do something and I wouldn't get why."
One student commented that he/she found the lab to be too hard and that it expected way
too much. There was a specific comment regarding the gel electrophoresis procedure
where the student said that more explanation of how gel electrophoresis works would
have been helpful in understanding.
Hands-On Approach
Thirty-four students commented specifically on the hands-on aspect of doing this
lab. Eighteen of those students mentioned a lab activity or equipment with which they
enjoyed working. Some students were general, mentioning that the hands-on component
of this lab was "really cool." Others were more specific such as one student who stated
that he/she "loved making our own experiment" by choosing which colony to extract
DNA from. Another student concurred by commenting, "I really liked being able to pick
my own colony, it made me feel like a scientist." Four students mentioned they liked
doing PCR, with one student commenting that now that he/she has seen it, it makes more
sense than just reading it. Other students mentioned that they especially enjoyed working

55
with bacteria, using micropipettes, doing gel electrophoresis and working with DNA.
Two students (who were in the class that the teacher had the lab assistant do the PCR
reactions for the class) mentioned that they felt they would have learned more and
understood how PCR worked if they would have been able to do it themselves.
Sixteen of the students that specifically mentioned the hands-on aspect of this lab
did so with a negative comment. One person mentioned that they did not like working
with the (halo)bacteria while another one stated "bacteria=smelly." One student stated
that it was difficult to load the DNA into the wells for gel electrophoresis because his/her
hand shook. Another student stated that he/she would rather have the lab explained
instead of doing it hands-on. Curiously, 11 of the 16 students who mentioned they did
not enjoy the hands-on component of the lab were all from the same school and had
nearly the same comments regarding the micro scale. These students had comments such
as, "if the amounts were larger, it would be easier to get results" or, "it was difficult to tell
if we even had anything."
Student Impressions about the Background Information
All of the students participating in the field trial were assigned the background
reading (either as homework or in-class). There were 49 student comments regarding
background information. Sixty-one percent of students who specifically commented on
the background information found it helpful. Some of the comments from students who
found reading of the background to be a positive experience included one student who
wrote that he/she could have referred back to the background to solidify the concepts.
One student stated that the "background information helped a lot" and another described

56
the background as "solid, helpful and clear." Another student found it informative and
well-organized.
Thirty-nine percent of students who commented on the background did not like it.
One student stated that he/she found some of the background information irrelevant to the
experiment. Another mentioned that he/she had to read through the background several
times to fully understand it. One student stated that the background was "confusing at
times" while another student commented that there was too much background
information to absorb all at once. Because it could be construed positively or negatively,
the 3 student comments that asked for more background information were omitted from
the background percentages.
Pre-lab Comments
There were three pre-labs found within the kit. The first pre-lab had the students
explore bioinformatics of gvpA online. The second pre-lab entailed students watching a
PCR tutorial online. Pre-lab 3 was a video for students to view loading a gel for
electrophoresis. Twenty-five students commented on the pre-labs. Over a third of those
students liked the pre-labs (36%) while nearly two-thirds (64%) did not find them
helpful. One student who liked the pre-labs mentioned that he/she found them to be very
informative. Some of the comments from students who did not like the pre-labs were
concise with "pointless" or "nothing learned." Three of the students that did not like the
pre-labs specifically mentioned pre-lab 1 (bioinformatics) as being "way too confusing"
or "wasn't sure how to connect pre-lab to the lab."

57
Student Analysis Comments
There were only 6 comments regarding the student analysis portion of the lab.
This was the portion of the kit that required individuals to report results to the rest of the
class. Results were a calculation of his/her band size with a discussion of the size related
to the original color of colony that the student chose. Five (83%) of the 6 were positive
comments with 1 (17%) being negative. One student commented that the student
analysis was fun while another wrote that the "student analysis was easy after the lab was
done." The negative comment was a student that stated that the "student analysis was
done as a class, I'd prefer to do it by myself." However, the nature of the student analysis
required sharing information by the class; therefore this would have been impossible.
Comments about Follow-up Questions
The student comments regarding the follow-up questions were polarized. There
were 41 comments with 54% of them positive (22 comments) and 46% negative (19
comments). Some of the positive comments included "the questions were helpful in
retaining information" and "the questions helped with understanding the lab." Three
students stated that the questions helped highlight/test what they had learned. Negative
comments regarding the follow-up questions included "I didn't enjoy the questions
compared to the rest of the lab" and that there were a few "stupid/non-covered questions."
Four students specifically mentioned that they found the questions confusing. A
summary of all student written comments is shown in Table 2.
58
Discussion Overall Results
Gel electrophoresis images were the end result of the kit laboratory activities and
served as a measure of “success” using the kit materials and instructions. Students
analyzed these gels to determine if their amplified DNA fragment had a potential IS
element. Eleven out of the thirteen classes had gel results that they could use for
analysis. The failure of two teachers to get results suggests a certain level of technical
expertise is required to complete the experiments successfully. Although teachers agreed
the information provided in the teacher guide was clearly stated and contained all
necessary information, one teacher used the incorrect voltage setting on the
electrophoresis equipment and the other allowed loaded gels to sit for several days. Two
other teachers had some technical issues that likely would have produced unreadable gels
had the issues not been resolved through communication with me. We conclude that the
kit worked without incident for five of the nine teachers. Perhaps it is not surprising that
the successful teachers were the most experienced and had received the most training in
molecular biology techniques.
Did teachers find the kit to be an effective teaching tool?
The teacher response to the kit was overall very positive. They were “mostly
satisfied” with the concepts presented in the kit. The responses on the evaluation
questionnaire indicated that teachers found the kit to be effective teaching the concepts.
Teachers indicated the kit activities met their course objectives. Even with teachers
“mostly satisfied” and finding that the kit did help them meet their course objectives, the
teachers offered some constructive ideas for improvement.

59
A few teachers offered suggestions for improving the kit. One teacher
specifically stated that pre-lab 1 (bioinformatics) was too confusing so it should be
altered. One teacher had commented that the PCR preparation and gel electrophoresis
both took too much time to load and run. This comment could be attributed to this
teacher’s inexperience as it was the first time the teacher had ever run either PCR or gel
electrophoresis.
Student Experience with Kit Concepts
Most students (77%) who provided comments about the lab were positive in their
experience to performing these activities in a laboratory setting. However, 16 students
commented specifically that the hands-on component of this lab was not enjoyable.
Eleven of the 16 students were from the same school. These 11 students mentioned the
small scale of the labs made it difficult to perform the steps and know if there was
anything happening. Because these comments were similar and from the same school,
there was likely teacher bias that influenced the 11 students comments. The teacher at
this school was inexperienced with molecular techniques and had never used a
micropipette, PCR or gel electrophoresis.
Student Comprehension of Concepts Presented by Kit
When comparing the pre-test results to the post-test results, it was determined that
the kit helped students learn the concepts. Their short answer, multiple choice and short
essay scores all showed statistically significant improvement after completing the kit

60
activities. However, the matching vocabulary section did not have a significant
difference in student achievement.
Closing Remarks
By contributing to this study, students and teachers had the opportunity to
participate as subjects in an authentic biology research project. They experienced a safe,
user-friendly microbe that exhibits properties that allow for learning microbiology,
molecular genetics and bioinformatics. Using the Genotype-Phenotype Connection Kit,
students and teachers gained insight into development of kits that are often used in AP
Biology classroom laboratories.
All 9 of the teacher participants were appreciative of the opportunity to use
technology or a microbe that they had not incorporated into their AP Biology classrooms
before. One teacher commented that without the complementary kit, his class would not
have been able to do any DNA or molecular biology wet labs this year due to budget
issues. Another teacher continued to use Halobacterium sp. NRC-1 in his classroom
throughout the rest of the school year.
As evidenced by the student comments, the teacher has the ability to make this or
any lab experience a positive one for the students by gauging student reactions and
responding appropriately. A teacher versed in molecular lab techniques can enhance the
materials found within the kit by encouraging students to trust the protocols, for example
that there is DNA present even if it is not seen. An experienced teacher also has the skills
to prepare the materials and run the equipment adequately. Checking for understanding

61
as the lab progresses will ensure students are not frustrated with these new concepts and
are beginning to form connections to the interrelatedness to the rest of the curriculum.
The Genotype-Phenotype Connection kit offered a means for students to
experience molecular biology and microbiology hands-on. Students used technology to
amplify a region of DNA from either a red or pink colony Halobacterium sp. NRC-1.
Beginning with observations about the organism on the petri plate and completing lab
protocols until completion at gel electrophoresis image, students were able to experience
the process of the relationship between genotype and phenotype. This experience
improves student learning of the concepts of colony morphology, cell lysis, DNA
extraction, PCR, gel electrophoresis and bioinformatics. By using tools for learning such
as this kit, the students will be better prepared for the new fields of biological research.
“I think the biggest innovations of the twenty-first century will be the intersection
of biology and technology. A new era is beginning, just like the digital one...”
- Steve Jobs, cofounder of Apple, Inc.
(Walter, 2013)

62
References
A Framework for K-12 Science Education: Practices, Crosscutting Concepts, and Core
ideas (Washington D.C.: National Academies Press, 2012), 3-8.
Amazon.com, “autoclave.” Accessed February 7, 2013. www.amazon.com.
American Type Culture Collection, “Halobacterium sp. NRC-1,” accessed February 3,
2013,
http://www.atcc.org/ATCCAdvancedCatalogSearch/ProductDetails/tabid/452/Default.asp
x?ATCCNum=700922&Template=bacteria (ATCC #700922).
Carolina Biological Supply Company, Technical Support, personal communication to
author, September 19, 2012.
DasSarma, Priya and Shiladitya DasSarma. Basic Microbiology Skills Part I (Burlington,
North Carolina: Carolina Biological Supply Company, 2005), 4.
DasSarma, Priya and Shiladitya DasSarma. Extremely Easy DNA Extraction (Burlington,
North Carolina: Carolina Biological Supply Company, 2006), 6.
DasSarma, Shiladitya, Halophilic Archaea: An Overview; or, Archaea A Laboratory
Manual: Halophiles by Frank T. Robb et al. (Plainview, New York: Cold Spring Harbor
Laboratory Press, 1995), 3-13.
DasSarma, Shiladitya. “Mechanisms of Genetic Variability in Halobacterium halobium:
The Purple Membrane and Gas Vesicle Mutations.” Canadian Journal of Microbiology
35(1989): 65-72.
DasSarma, Shiladitya, Priya Arora, Feng Lin, Elizabeth Molinari, and Lucy Ru-Siu Yin.
“Wild-Type Gas Vesicle Formation Requires at Least Ten Genes in the gvp Gene Cluster
of Halobacterium halobium Plasmid pNRC100.” Journal of Bacteriology 176 (1994):
7646-7652.
DasSarma, Shiladitya and Priya Arora. “Genetic Analysis of the Gas Vesicle Gene Cluster
in Haloarchaea.” FEMS Microbiology Letters 153 (1997): 1-10.
DasSarma, Shiladitya, John T. Halladay, Jeffery G. Jones, John W. Donovan, Paul J.
Giannasca, and Nicole Tandeau de Marsac. “High-Frequency Mutations in a Plasmid-
Encoded Gas Vesicle Gene in Halobacterium halobium.” Proceedings of the National
Academy of Sciences, USA 85 (1988): 6861-6865.
Doolittle, W. Ford. “What Are the Archaebacteria and Why Are They Important?,” In The
Archaeabacteria: Biochemistry and Biotechnology, edited by M. J. Danson, D. W.
Hough, and G. G. Lunt, 1-6, London: Portland Press, 1992.

63
Duncan, Ravit Golan and Brian J. Reiser. “Reasoning Across Ontologically Distinct Levels:
Students’ Understandings of Molecular Genetics.” Journal of Research in Science
Teaching (2007): 938-959.
Evans, Robert H. “Archaea: A New Primary Kingdom for Our Classrooms.” The American
Biology Teacher 45 (1983): 139-143.
Filée, J., P. Siguier, and M. Chandler. “Insertion Sequence Diversity in Archaea.”
Microbiology and Molecular Biology Reviews 71 (2007): 121-157.
Flannery, Maura C. “Back to Bacteria.” The American Biology Teacher 59 (1997): 370-373.
Halladay, John T., Jeffery G. Jones, Feng Lin, A. Bruce MacDonald, and Shiladitya
DasSarma. “The Rightward Gas Vesicle Operon in Halobacterium Plasmid pNRC100:
Identification of the gvpA and gvpC Gene Products by Use of Antibody Probes and
Genetic Analysis of the Region Downstream of gvpC.” Journal of Bacteriology 175
(1993): 684-692.
“Halobacterium, sp. NRC-1,” HaloWeb, accessed February 3, 2013,
http://halo4.umbi.umd.edu/.
“Halobacterium sp. tubes, Item Number 154800.” Carolina Biological Supply Company,
accessed February 3, 2013, http://www.carolina.com/archaea-
halobacterium/halobacterium-sp-
tube/154800.pr?catId=&mCat=&sCat=&ssCat=&question=halobacterium+sp.%2C+tube.
Horn, Toby. Working with DNA and Bacteria in Precollege Science Classrooms. Reston,
VA: NABT, 1993.
Johnson, Roy M. “The Use of Bacteria in High School Biology.” The American Biology
Teacher (1958): 41-42.
Kansas Department of Education (KSDE), “Certified Personnel Labels, AP Biology,”
accessed April 10, 2011, http://www.ksde.org/Default.aspx?tabid=230.
Kates, Morris. “Archaebacterial Lipids: Structure, Biosynthesis and Function.” In The
Archaeabactera: Biochemistry and Biotechnology, edited by M. J. Danson, D. W. Hough,
and G. G. Lunt, 51-72, London: Portland Press, 1992.
Kennedy, Sean P., Wailap Victor Ng, Steven L. Saltzberg, Leroy Hood, and Shiladitya
DasSarma. “Understanding the Adaptation of Halobacterium sp. NRC-1 to Its Extreme
Environment through Computational Analysis of Its Genome Sequence.” Genome
Research 11 (2001): 1642-1650.
Lewis, Jenny and U. Kattmann. “Traits, Genes, Particles and Information: Re-visiting
Students’ Understanding of Genetics.” International Journal of Science Education 26
(2004): 195-206.

64
Marbach-Ad, Gili, J. Randy McGinnis, Rebecca Pease, Amy H. Dai, Kelly A. Shalk, and
Spencer Brown. “Clarity in Teaching and Active Learning in Undergraduate
Microbiology Course for Non-Majors.” Bioscene 36 (2010): 3-6.
MidSci, quote 336135-0, October, 2012. www.midsci.com/.
National Association of Biology Teachers (NABT). “NABT Statement, Role of Laboratory
and Field Instruction in Biology Education.” Accessed December 8, 2012.
http://www.nabt.org/websites/institution/index.php?p=95.
National Center for Biotechnology Information (NCBI). “Halobacterium sp. NRC-1,
pNRC100”, accessed March, 2011, http://www.ncbi.nlm.nih.gov (Accession:
AF016485.1).
National Research Council (NRC). A New Biology for the 21st Century. Washington DC:
National Academies Press, 2012. http://www.nap.edu/catalog.php?record_id=12764.
National Science Teacher Association (NSTA). “NSTA Position Statement, Liability of
Science Teachers for Laboratory Safety.” Accessed December 8, 2012.
http://www.nsta.org/about/positions/liability.aspx.
“Next Generation Science Standards.” NGSS Public Release II, accessed February 4, 2013,
http://www.nextgenscience.org/next-generation-science-standards.
Ng, WaiLap V., Sean P. Kennedy, Gregory G. Mahairas, Brian Berquist, Min Pan, Hem
Dutt Shukla, Stephen R. Lasky, Nitin S. Baliga, Vestinn Thorsson, Jennifer Sbrogna,
Steven Swartzell, Douglas Weir, John Hall, Timothy A. Dahl, Russell Welti, Young Ah
Goo, Brent Leithauser, Kim Keller, Randy Cruz, Michael J. Danson, David W. Howugh,
Deborah G. Maddocks, Peter E. Jablonski, Mark P. Krebs, John L. Spudich, Kwang-
Hwan Jung, Maqsudul Alam, Tracey Freitas, Shaobin Hou, Charles J. Daniels, Patrick P.
Dennis, Arina D. Omar, Holger Ebhardt, Todd M. Lowe, Ping Liang, Monica Riley,
Leroy Hood and Shiladitya DasSarma. “Genome Sequence of Halobacterium species
NRC-1.” Proceedings of the National Academy of Sciences, USA 97 (2000): 12176-
12181.
Ng, WaiLap V., Stacy A. Clufo, Todd M. Smith, Roger E. Bumgardner, Dale Baskin, Janet
Faust, Barbara Hall, Carol Loretz, Jason Seto, Joseph Slagel, Leroy Hood and Shiladitya
DasSarma. “Snapshot of a Large Dynamic Replicon in a Halophilic Archaeon:
Megaplasmid or Minichromosome?” Genomic Research, 8 (1998): 1131-1141.
Peirce, Susan K., “Three Domains, Not Five Kingdoms, A Phylogenic Classification
System.” The American Biology Teacher 61 (1999): 132-136.
Peterson, Priscilla. “Microbiology as a High-School Elective.” The American Biology
Teacher 35 (1973): 396-397.
Postlewait, John H. and Janet Hopson, Modern Biology (New York: Holt, Rinehart and
Winston, 2009), 340-347.

65
Rifkin, Jeremy. “The Sociology of the Gene: Genetics and Education on the Eve of the
Biotech Century.” Phi Delta Kappan 79 (1998): 648-654.
Roberts, Elijah, Anaurag Sethi, Johathan Montoya, Carl R. Woese, and Zaida Luthey-
Schulten. “Molecular Signatures of Ribosomal Evolution.” Proceedings of the National
Academy of Sciences, USA 105 (2008): 13953-13958.
Schrock, John Richard, personal communication to author, January 10, 2013.
Shukla, Hem Dut and Shiladitya DasSarma. “Complexity of Gas Vesicle Biogenesis in
Halobacterium sp. Strain NRC-1: Identification of Five New Proteins.” Journal of
Bacteriology 186 (2004): 3182-3186.
Singer, Susan R., Margaret L. Hilton, and Heidi A. Scheweingruber, eds., America’s Lab
Report: Investigations in High School Science, National Research Council (Washington
D.C.: National Academies Press, 2006), accessed February 2, 2013,
http://www.nap.edu/openbook.php?isbn=0309096715.
Stieff, Mike. “Improving Representational Competence using Molecular Simulations
Embedded in Inquiry Activities.” Journal of Research in Science Teaching 48 (2011):
1137-1158.
Taraban, Roman, Cathy Box, Russell Myers, Robin Pollard, and Craig W. Bowen. “Effects
of Active-Learning Experiences on Achievement, Attitudes, and Behaviors in High
School Biology.” Journal of Research in Science Teaching (2007): 960-979.
"Walter Isaacson Quotes," Good Reads, Accessed February 13, 2013,
http://www.goodreads.com/author/quotes/7111.Walter_Isaacson
Woese, Carl R. “Interpreting the Universal Phylogenic Tree.” Proceedings of the National
Academy of Sciences, USA 97 (2000): 8392-8396.
Woese, Carl R. and George E. Fox. “Phylogenic Structure of the Prokaryotic Domain: The
Primary Kingdoms.” Proceedings of the National Academy of Sciences, USA 74 (1977):
5088-5090.
Woese, Carl R., Otto Kandler, and Mark L. Wheelis. “Towards a Natural System of
Organisms: Proposal for the Domains Archaea, Bacteria and Eucarya.” Proceedings of
the National Academy of Sciences, USA 87 (1990): 4576-4579.
Yip, Gheng-Wai. “A Basic Microbiology Course for High School Students.” The American
Biology Teacher 72 (2010): 485-488.

A1 Appendix
Appendix A: Kit Manual
A Teacher's Manual
and Student Guide
The Genotype-Phenotype
Connection:
Basic Molecular Genetics
and Bioinformatics Skills
By Kelley Tuel, Dr. Shiladitya DasSarma, Dr. Tim Burnett and Priya DasSarma

A2 Appendix
Table of Contents
Teacher’s Manual
Overview ..............................................................................................................................A4
Objectives ............................................................................................................................A4
Content Standards ................................................................................................................A5
Time Requirements ..............................................................................................................A5
Materials ..............................................................................................................................A6
Storage………………………………………………………………………………….......A7
Safety ...................................................................................................................................A7
Background ..........................................................................................................................A7
Detailed Teacher Preparation ...............................................................................................A8
Instructor notes.....................................................................................................................A10
Answers to Questions in the Student Guide ........................................................................A13
Extension Activities .............................................................................................................A19
References & Resources ......................................................................................................A21
Related Products ..................................................................................................................A22
Student Guide* *Photocopy the Student Guide as needed for use in your classroom.
Background ........................................................................................................................A23
Procedure ...........................................................................................................................A29
Pre-Lab for Activity 1 .......................................................................................................A29
Activity 1- Halobacteria Exploration and Lysis ...............................................................A31
Pre-Lab for Activity 2 ......................................................................................................A33
Activity 2 - PCR ..............................................................................................................A33
Pre-lab for Activity 3 .......................................................................................................A34
Activity 3 - Gel Electrophoresis ......................................................................................A34
Activity 4- Data Comparison and Analysis .....................................................................A35
Student Analysis and Follow-up Questions .....................................................................A37

A3 Appendix
Appendices
I. Primer locations in gvpA1 gene region ..........................................................................A43
II. Glossary ........................................................................................................................A45
III. Troubleshooting .........................................................................................................A48
IV. Sample class gel image ...............................................................................................A49
V. Class Data Chart..........................................................................................................A50
VI. Staining with GelGreen™ ..........................................................................................A51
VII. Staining with CarolinaBLU™ ...................................................................................A52
©2012 Kelley Tuel and Priya DasSarma/Printed in USA.

A4 Appendix
Overview Using the model microbe Halobacterium sp. NRC-1, students perform DNA extractions,
PCR (polymerase chain reaction), and gel electrophoresis. This activity is designed in inquiry
format to allow students to observe and experience the Achaean and extreme halophile (salt-
loving) microorganism, Halobacterium sp. NRC-1. Students will also work with a stable
mutant derivative, Halobacterium sp. KBT-1, which was identified by a Kansas Biology
Teacher (hence the name, KBT). The brightly colored microbial colonies and the organism's
extreme lifestyle will foster student interest and inspire inquiry. As part of these exercises,
students will formulate questions and hypotheses to explain observed differences in colony
phenotypes. To detect genetic differences responsible for the different phenotypes, students
will use PCR to analyze DNA from either a mutant (KBT-1), a wild-type (NRC-1), or a
sectored colony. To draw conclusions regarding the link between the molecular differences
they detect and the phenotypes observed, students will pool their data. They will then
demonstrate their comprehension of the concepts by working through questions in the student
guide. Since individual laboratory experience is essential to student learning and comprehension,
this kit was designed for 25 individual students to each complete all parts of the lab, though
the activities can be performed in small groups as well.
The Background Information section can be used by the teacher to either introduce or review
subtopics. Depending on the level of your students, you may want to omit sections of the
background or, with advanced students, have them individually research subtopics. The lab
has been divided into four related sections that can be done on consecutive days, or several
days apart.
Objectives Students will
• Learn and practice sterile (aseptic) technique
• Study colony phenotypes
• Learn and practice pipetting techniques • Extract DNA
• Perform polymerase chain reaction
• Perform agarose gel electrophoresis
• Analyze and draw conclusions from collected data
• Correlate genotype with phenotype
• Use basic bioinformatics tools
Content Standards: This kit is appropriate for students from high school to college and meets the following National Science
Content Standards:
Grades 9-12
Life Science • The cell
• Molecular basis of heredity
Science as inquiry • Abilities necessary to do scientific inquiry
Science and Technology • Abilities of technological design (if extension activities are done)
• Understandings about science and technology
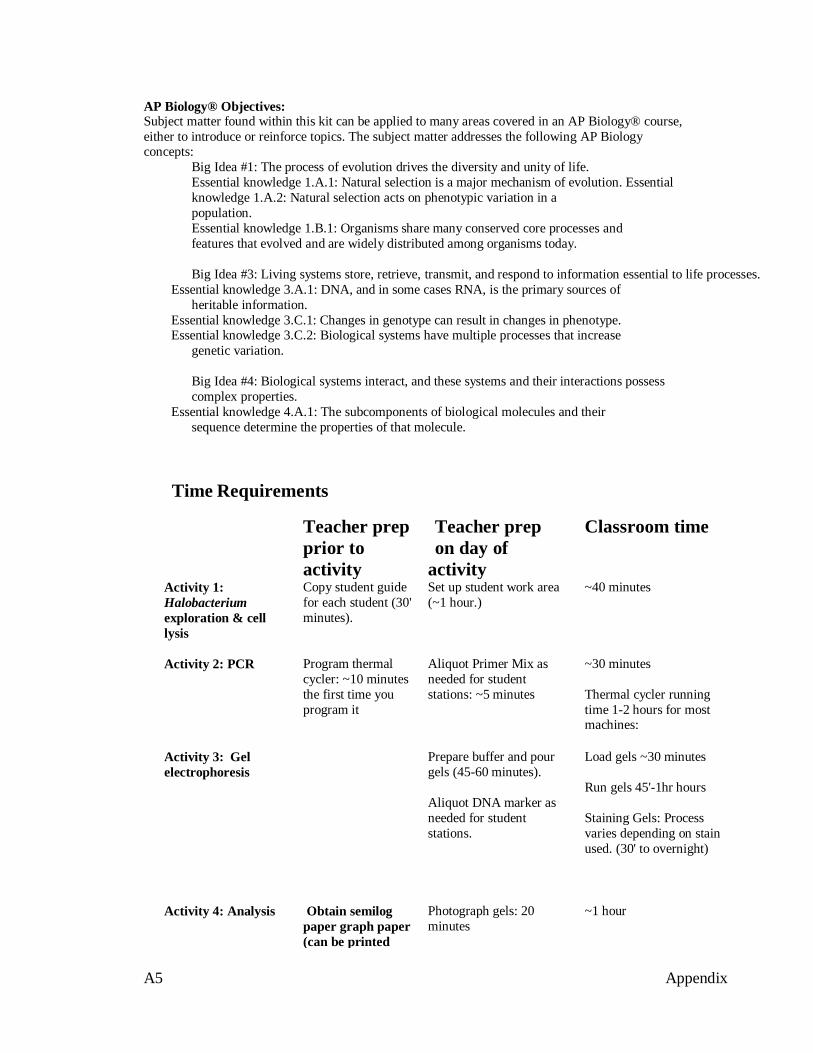
A5 Appendix
AP Biology® Objectives: Subject matter found within this kit can be applied to many areas covered in an AP Biology® course,
either to introduce or reinforce topics. The subject matter addresses the following AP Biology concepts:
Big Idea #1: The process of evolution drives the diversity and unity of life.
Essential knowledge 1.A.1: Natural selection is a major mechanism of evolution. Essential
knowledge 1.A.2: Natural selection acts on phenotypic variation in a
population.
Essential knowledge 1.B.1: Organisms share many conserved core processes and
features that evolved and are widely distributed among organisms today.
Big Idea #3: Living systems store, retrieve, transmit, and respond to information essential to life processes.
Essential knowledge 3.A.1: DNA, and in some cases RNA, is the primary sources of
heritable information.
Essential knowledge 3.C.1: Changes in genotype can result in changes in phenotype. Essential knowledge 3.C.2: Biological systems have multiple processes that increase
genetic variation.
Big Idea #4: Biological systems interact, and these systems and their interactions possess
complex properties.
Essential knowledge 4.A.1: The subcomponents of biological molecules and their
sequence determine the properties of that molecule.
Time Requirements
Teacher prep
prior to
activity
Teacher prep
on day of
activity
Classroom time
Activity 1:
Halobacterium
exploration & cell
lysis
Copy student guide
for each student (30'
minutes).
Set up student work area
(~1 hour.)
~40 minutes
Activity 2: PCR
Program thermal
cycler: ~10 minutes
the first time you
program it
Aliquot Primer Mix as
needed for student
stations: ~5 minutes
~30 minutes
Thermal cycler running
time 1-2 hours for most machines:
Activity 3: Gel
electrophoresis
Prepare buffer and pour
gels (45-60 minutes).
Aliquot DNA marker as
needed for student
stations.
Load gels ~30 minutes
Run gels 45'-1hr hours
Staining Gels: Process
varies depending on stain
used. (30' to overnight)
Activity 4: Analysis Obtain semilog
paper graph paper
(can be printed
from many
websites)
Photograph gels: 20
minutes
~1 hour

A6 Appendix
Materials The materials in this kit are supplied for the use with the educational exercises described in
this kit only. For the success of this lab, it is critical that your students conduct their
exercises using safe and correct lab practices. Carolina Biological Supply Company
disclaims all responsibility for other uses of these materials.
Included in the kit: teacher’s Manual with reproducible Student Background & Student Guide (with follow-up
questions)
3 plates with colonies of Halobacterium sp. NRC-1 (wild type)
2 plates with colonies of Halobacterium sp. KBT-1 (mutant) 25 PCR tubes containing Ready-To-Go Beads™, 0.2 mL capacity
1 vial Primer/Loading Dye Mix
1 30 uL vial 1 kb ladder/DNA marker (Kits with GelGreen™)
OR
4 30 uL vial 1 kb ladder/DNA marker (Kits with CarolinaBLU)
Kits with electrophoresis material also contain:
2 g agarose
1 50mL of 20X TBE buffer in a bottle
1 250mL bottle CarolinaBLU ™ Final Stain (only in kits with CarolinaBLU ™)
1 7mL vial CarolinaBLU ™ Gel and Buffer Stain (only in kits with CarolinaBLU ™)
1 100 uL vial GelGreen™ (only in kits with Gel Green)
1 tube 1.5 mL 5 M NaCl (only in kits with Gel Green)
4 staining trays
4 pairs of disposable gloves
Needed, but not supplied: pipettes (2 uL – 500 uL capacity) with sterile tips. Alternatively, if adjustable pipettes are not
available, fixed volume pipetting-devices for accurately pipetting 4, 10, 20, 100 and 500 uL may
be used.
permanent fine-tip markers microscope or hand lens (optional)
microcentrifuge with adaptors for holding 0.2-mL tubes*
ice (in beakers or plastic cups per student)
vortex (optional)
thermal cycler
power supplies
gel electrophoresis chamber(s) (to accommodate enough gels for each student to load 1 lane plus
extra lanes per gel for the DNA ladder and to reload misloaded samples)
gel tray(s)
gel comb(s)
a microwave or a heatable stirplate and stirbar or a boiling waterbath UV trans-illuminator, fluorescent white light box, or blue light box
UV safety goggles or blue light safety goggles or screen camera to capture gel images
bleach solution (10%) or autoclave gloves
lab coats or aprons (based on school policy)
*Adaptors for 0.2 mL tubes can be made by removing the lids from 1.5 mL and 0.5 mL
microcentrifuge tubes, and nesting the 0.5 mL tube inside the 1.5 mL tube in the centrifuge.

A7 Appendix
Storage Upon delivery, store petri plates with Halobacterium colonies in heavy-duty sealed plastic
bags or sealed plastic containers in the refrigerator, where they can be stored for a couple
months. It is critical that the bags or containers are sealed well, since loss of moisture
leads to formation of salt crystals in the agar.
The primer/loading dye mix and DNA marker should be stored in a freezer. Everything else
can be stored at room temperature.
Safety Always ensure that each student understands and adheres to safe laboratory practices when
performing any activity in the classroom or laboratory. Demonstrate the protocol for
correctly using the instruments and materials necessary to complete the activities, and
emphasize the importance of proper usage.
The American Type Culture Collection (ATCC) classifies Halobacterium sp. NRC-1 as a
BioSafety Level 1(BSL-1) organism. Materials classified at BSL-1 “are not known to cause
disease in healthy adult humans”. Halobacterium sp. NRC-1 and KBT-1 do not survive
outside of their extreme environment and few if any other organisms can survive the high
salt of the media. These organisms are destroyed by exposure to the low salt concentrations
found in the human body, tap water and even sea water. Even so, we always recommend
treating microbes as though they could be pathogenic. We recommend the use of personal
protective equipment (gloves, goggles, and lab apron or coat) when working in a biology or
chemistry laboratory setting.
There is an odor associated with the media and cultures. The odor can easily be washed out of
any clothing the cultures or media may be spilled on, but lab coats or aprons can prevent
spills from getting on student clothing.
We suggest that you follow standard good laboratory microbiology laboratory practice and
autoclave labware (or soak it in a 10 % bleach solution) before disposal.
Background Refer to the Student Guide to obtain the relevant background material.
To learn more about Halobacterium sp. NRC-1 and about molecular genetics in general,
familiarize yourself with the websites HaloEd and MolGenT prior to these activities.
HaloEd: http://halo4.umbi.umd.edu/~haloed/ or access from a search engine by searching
for “the HaloEd Project.” HaloEd was created to give educators, students and the general
public insight into Halophiles and their environment as well as give teaching tips and more.
HaloWeb: http://halo4.umbi.umd.edu or access from a search engine by searching for
“HaloWeb”. HaloWeb was created to facilitate viewing and understanding the genome of
Halobacterium sp. NRC-1 and related organisms.
GelGreen™ should be stored in the dark
MolGenT: http://halo4.umbi.umd.edu/~haloed/MOLGENT/index.htm or access from a
search engine by searching for “MolGenT”. The Molecular Genetics Tutor at MolGenT is
particularly helpful for students to strengthen their understanding and visualize the vital
concepts required for this activity.

A8 Appendix
Pre-labs The “Pre-labs” are recommended exercises to be completed prior to each laboratory activity.
They review concepts necessary for a more complete understanding and learning
experience. You may want to enhance your students’ background knowledge by working
through the pre-lab exercises either in class or as homework prior to each lab activity.
Detailed Teacher Preparation
1. Photocopy “Student Guide” for each student.
2. Program the thermal cycler with the following times and temperatures:
Step I. 3 minutes at 94°C
Step II. 15 seconds at 94°C
Step III. 15 seconds at 60°C
Step IV. 45 seconds at 72°C
Step V. Return to Step II – Step IV, repeating 30 times
Step VI. 5 minutes at 72°C
Step VI. Infinitely held at 4°C (Note: some machines do not have this capacity and
you may have to be present at the end of the cycle to transfer the samples to a
refrigerator or freezer.)
Note: If you are using a machine that employs multiple blocks held at different
temperatures in place of the more common single block that cycles between the
different temperatures please use the program below.
Step I. 3 minutes at 94°C
Step II. 15 seconds at 94°C
Step III. 15 seconds at 60°C
Step IV. 45 seconds at 72°C
Step V. Return to Step II – Step IV, repeating 30 times
Step VI. 5 minutes at 72°C
Step VI. Infinitely held at 4°C
The PCR reaction will take approximately 1 hour or more to run. The time it takes
will vary with the machine.
3. Prepare 0.8% gel(s) and running buffer according to the volumes specified for your
type of gel chambers. If you are using Carolina Blu to stain your gels, please refer to
Appendix VII when pouring the gel and making the running buffer. You will add the stain
to both (when pouring the gel and to running buffer prior to gel electrophoresis).
The directions below are written for making 4 gels for medium-sized gel chambers (the
gels are approximately 9cm X 9cm). Modify these instructions to suit the size of your gel
chambers. The number of gels you require depends on the number of student samples and
the number of wells you have per gel. For each gel reserve a lane for the1 kb ladder (the

A9 Appendix
molecular weight marker) and plan to have an empty lane to allow students to re-load
in a different lane if they make a mistake in loading the first time.
Preparation of 1X TBE buffer from the 20X TBE stock (provided)
Determine the number of gels and chambers required for your class.
A. Determine the volume of buffer you need. Typically, you will need
approximately 300-500 mL of 1X TBE buffer per gel chamber.
B. To make 2.0 liters of 1X TBE: combine 100 mL 20X TBE with 1900
mL of distilled or deionized water.
Preparation of agarose gels. Prepare the 0.8% agarose solution at least 40 minutes prior to running the gel, as it
takes about 15-30 minutes at room temperature for the gel to set. You can also make
gels a day ahead and store them covered with TBE buffer in the electrophoresis
chambers until you are ready to use them. Review the CarolinaBLU™ staining
protocol in appendix VII to see if you want to add CarolinaBLU Gel stain.to gel.
A. Again, assuming you are making 4 gels, add 2 g of agarose to a 500ml flask.
B. Add 250 mL 1X TBE buffer.
C. Dissolve the agarose using one of the methods described below. Be aware
that the time it takes to dissolve the agarose will vary greatly depending
upon the volume prepared and the equipment used.
Microwave: Heat the agarose and 1X TBE in a microwave until no
particulate matter can be seen in the solution or stuck to the bottom of the
flask after a gentle swirl of the hot flask (~10-30 seconds.) To prevent
boiling over during heating, watch carefully and swirl the flask at the first
sign of boiling and periodically thereafter.
Hot Plate: The agarose can also be dissolved using a hot plate. If possible,
use a stirring hot plate that will enable you to stir using a magnetic stir bar.
Otherwise, swirl the solution frequently to prevent boiling over and
scalding, and to help disperse the agarose. Heat until no particulate matter
can be seen in suspension or stuck to the bottom of the flask.
Boiling Water Bath: A boiling water bath can also be used. Make sure the
water in the water bath is at least level with the agarose solution in the flask.
Heat until no particulate matter can be seen in solution or stuck to the bottom
of the flask. This usually takes 5-10 minutes. Allow additional time for the
water bath to come to boiling.
D. On a level surface, pour an appropriate volume of the solution into each of
the gel trays and add combs with the appropriate number of teeth.
E. Once the gels have set, place the gel tray into the electrophoresis chamber
filled with TBE and gently pull the combs from the gels.
4. Staining of Gels
See Appendix VI and VII for staining protocols for Gel Green and CarolinaBLU™.

A10 Appendix
Instructor Notes Activity 1
1. To make the activity more efficient, steps 1.2-1.3 can be done while students wait
their turn for the various Halobacterium plates.
2. Students do not need to take much Halobacterium to get good results. As long as
the quantity they take is visible and is even evenly dispersed in the water, they
should get adequate results. If they take too much Halobacterium, their lane on the
gel may appear smeared and overloaded.
3. Tube #1 can be thrown in the trash.
4. Cell lysates should be frozen (–20°C) in a freezer. It is advisable to store in a constant
temperature freezer instead of a frost-free freezer. If the lysate is left at room temperature
too long, the enzymes (nucleases) in the lysate will lyse the nucleic acids (see 1.11).
5. You may stop the lab for the day at the end of this activity or continue with the exercise.
Pre-Lab Activity 2 If you assign this Pre-Lab Activity as homework, you may want to lead a class
discussion the following day to reinforce the concepts addressed in the tutorial.
Activity 2 1. Prior to class, aliquot the vial of Primer Mix into several other microcentrifuge
tubes to avoid bottlenecks in the classroom.
2. Students should write their initials on both the hinge or lip of the tube lid and the
side of the tube. (Writing only on the side risks having the writing rub off.) The
students are instructed to retain their cell lysate tube on ice (see above) in case you
would like to do additional reactions using the same lysate. You may also store the
lysates in the freezer for later use by the students or other classes; otherwise, it may be
thrown in the trash. Note: Because of the presence of nucleases even if it is kept
frozen, the DNA in the lysate will, with time, not produce as much PCR product as it
did originally.
3. See Appendix I for primer annealing locations.
Pre-Lab Activity 3
We recommend watching the suggested video as a class. If you assign it as homework, you
may want to lead a class discussion the following day to reinforce what students watched in
the video. Ask questions to make sure that your students understand such as
• the specifics about loading the specific pipettes that your class will use.
• what happens if the bottom of the well is punctured.
• the importance of using a new pipette tip for loading each lane.

A11 Appendix
Activity 3
1. Dilute the 20X TBE buffer to 1X and pour the gels, allowing them to solidify at least
15–30 minutes prior to class.
2. To avoid bottlenecks in the classroom, prior to class, aliquot the DNA marker into
several microcentrifuge tubes.
3. Note that students should load 5 µL of their PCR reaction and 5 µL of the DNA ladder if
the gels are being stained with GelGreen™ or a stain with similar sensitivity (e.g., ethidium
bromide), and 10 µL of their PCR reaction and 25 µL of the DNA ladder if the gels are
being stained with CarolinaBLU™ or a similar stain.
4. If more than one gel is required per class period, distinguish the different gels to
avoid confusion during analysis by loading the 1 kb ladder in different lanes on each gel
and/or by removing specific corner(s) of each gel. Make sure that students record the
distinguishing characteristic of the gel on which their sample is loaded.
5. As a confirmation of student records, the teacher should use the following chart to
record students’ gel lanes. Insert student name or initials and colony type in the
appropriate box. Also indicate which lane the 1 kb ladder is loaded in.
6. Refer to the manufacturer’s instructions for your gel chamber for the voltage to use and
the approximate time the gel should be run. For example, when using TBE buffer with a
0.8% gel, in a standard Carolina gel chamber (item 213641 or 213654), run the gel(s) at
135 volts for 45–60 minutes.
7. The gels need to be stained right way. Decide if the students will stain the gels, or if you
will do it. Instruct them appropriately. See the instructions for CarolinaBLU™ or
GelGreen™ stain in the Appendix.
Lane 1 Lane 2
Lane 3
Lane 4
Lane 5
Lane 6
Lane 7
Lane 8
Lane 9
Lane 10
Gel 1
Gel 2
Gel 3
Gel 4

A12 Appendix
Activity 4
1. Appendix IV includes a picture of an ideal gel. Should your students fail to get results,
you may photocopy the picture from Appendix IV to provide students with data to analyze.
2. Lead a class discussion asking students to point out the banding pattern in their lane
and describe the colony they isolated. Collect the class data using the chart in Appendix
V or some other method and make it available to the whole class for either individual or
group analysis.
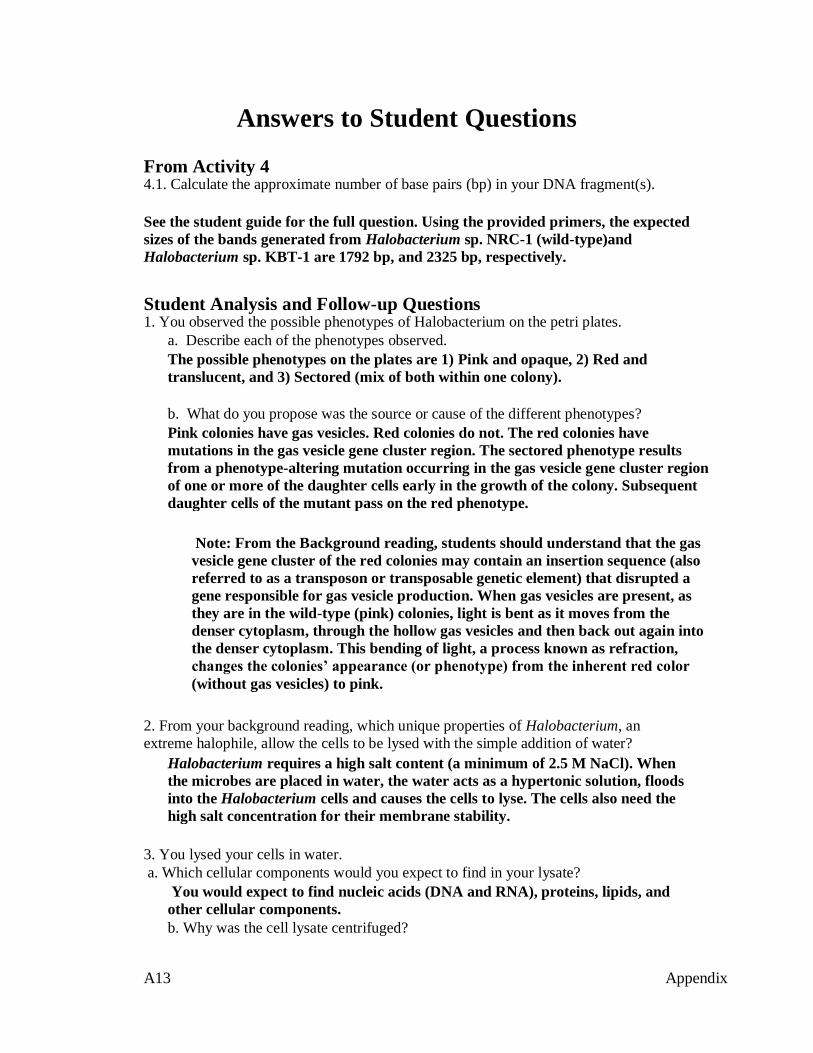
A13 Appendix
Answers to Student Questions
From Activity 4 4.1. Calculate the approximate number of base pairs (bp) in your DNA fragment(s).
See the student guide for the full question. Using the provided primers, the expected
sizes of the bands generated from Halobacterium sp. NRC-1 (wild-type)and
Halobacterium sp. KBT-1 are 1792 bp, and 2325 bp, respectively.
Student Analysis and Follow-up Questions 1. You observed the possible phenotypes of Halobacterium on the petri plates.
a. Describe each of the phenotypes observed.
The possible phenotypes on the plates are 1) Pink and opaque, 2) Red and
translucent, and 3) Sectored (mix of both within one colony).
b. What do you propose was the source or cause of the different phenotypes?
Pink colonies have gas vesicles. Red colonies do not. The red colonies have
mutations in the gas vesicle gene cluster region. The sectored phenotype results
from a phenotype-altering mutation occurring in the gas vesicle gene cluster region
of one or more of the daughter cells early in the growth of the colony. Subsequent
daughter cells of the mutant pass on the red phenotype.
Note: From the Background reading, students should understand that the gas
vesicle gene cluster of the red colonies may contain an insertion sequence (also
referred to as a transposon or transposable genetic element) that disrupted a
gene responsible for gas vesicle production. When gas vesicles are present, as
they are in the wild-type (pink) colonies, light is bent as it moves from the
denser cytoplasm, through the hollow gas vesicles and then back out again into
the denser cytoplasm. This bending of light, a process known as refraction,
changes the colonies’ appearance (or phenotype) from the inherent red color
(without gas vesicles) to pink.
2. From your background reading, which unique properties of Halobacterium, an
extreme halophile, allow the cells to be lysed with the simple addition of water?
Halobacterium requires a high salt content (a minimum of 2.5 M NaCl). When
the microbes are placed in water, the water acts as a hypertonic solution, floods
into the Halobacterium cells and causes the cells to lyse. The cells also need the
high salt concentration for their membrane stability.
3. You lysed your cells in water.
a. Which cellular components would you expect to find in your lysate?
You would expect to find nucleic acids (DNA and RNA), proteins, lipids, and
other cellular components.
b. Why was the cell lysate centrifuged?

A14 Appendix
This crudely separates the insoluble cellular debris from the other soluble
cellular components, including the nucleic acids (DNA and RNA).
c. What purpose was served by removing 100 uL of supernatant and transferring
it to another tube?
The supernatant contains the nucleic acids. Moving the supernatant to another tube
helps ensure that the unwanted cellular components spun to the bottom of the tube
are not added to the PCR reaction along with the DNA. These unwanted cellular
components include proteins such as nucleases, which are enzymes that break down
DNA and RNA, as well as other cellular components that may inhibit the PCR
reaction.
4. What are the necessary components in the PCR reactions? List the components
and the purpose of each.
• PCR bead (contains Taq polymerase, the nucleotides necessary for synthesizing
new DNA, and the salts and buffer needed for creating the appropriate conditions
for Taq polymerase.)
• DNA template (provides the starting material from which more DNA is made). • primer mix (provides both the forward and reverse primers needed to
specifically target DNA replication to a specific sequence and to provide the
start point for the polymerase to begin DNA synthesis).
5. You mixed the PCR bead, primers and cell lysate sample thoroughly before
placing the reaction in the thermal cycler. Why was thorough mixing necessary?
It is necessary to mix the PCR beads, primers and template so that all of the
needed reaction components are evenly distributed in the reaction; i.e., the
mixture must be homogenous. Even mixing ensures that the primers, template
DNA, and polymerase are in close enough proximity for the reaction to proceed.
6. A polymerase chain reaction goes through several cycles of temperature changes. List
each step of a cycle, and describe what occurs during each step.
Denaturation: the DNA strands are heated so that they separate from one another.
Annealing: the primers anneal or attach to their complementary region on the template DNA.
Extension: the polymerase extends the sequence out from the primer sequence, thus
replicating the targeted sequence of the DNA in your sample.
7. Why did you place your nucleic acid extract and PCR reagents on ice until the PCR
reaction was set up and placed in the thermal cycler?
The main concern is that any remaining nucleases, naturally occurring cellular
enzymes present in the cell lysate containing the template DNA, could break down
the DNA template. Keeping the reaction on ice until it is placed in the thermal
cycler also prevents the polymerase from starting to synthesize DNA before the
primer has annealed in the correct location.
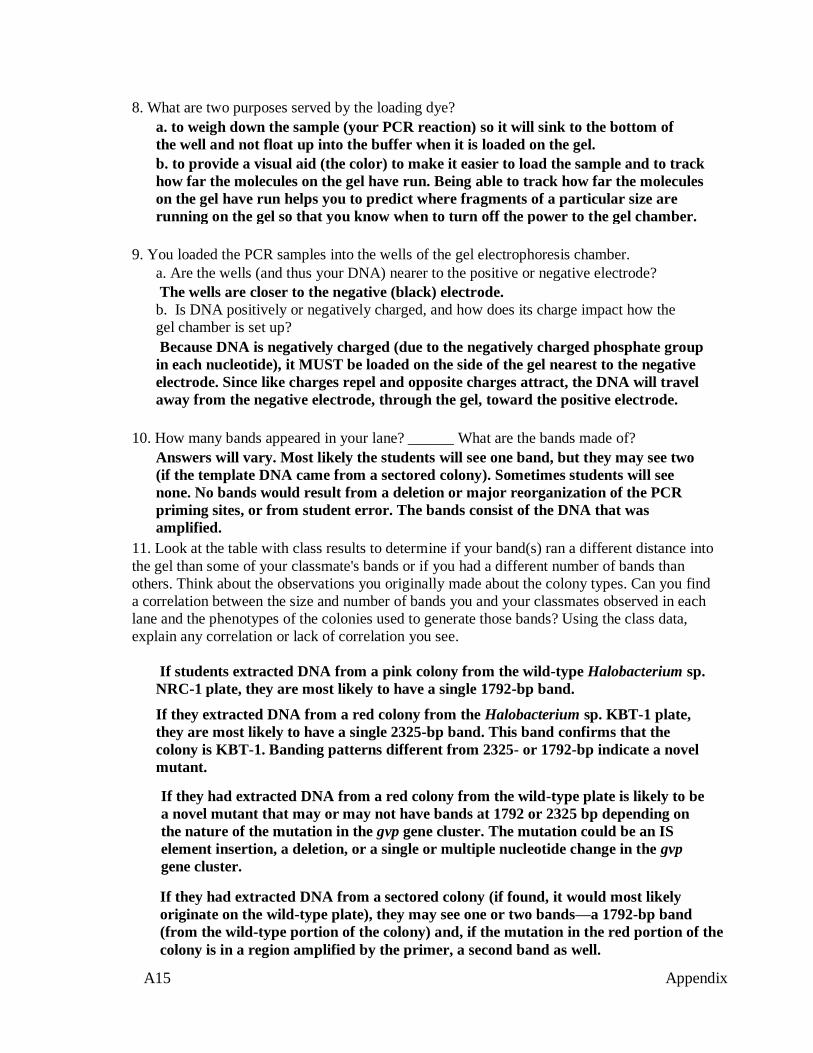
A15 Appendix
8. What are two purposes served by the loading dye?
a. to weigh down the sample (your PCR reaction) so it will sink to the bottom of
the well and not float up into the buffer when it is loaded on the gel.
b. to provide a visual aid (the color) to make it easier to load the sample and to track
how far the molecules on the gel have run. Being able to track how far the molecules
on the gel have run helps you to predict where fragments of a particular size are
running on the gel so that you know when to turn off the power to the gel chamber.
9. You loaded the PCR samples into the wells of the gel electrophoresis chamber.
a. Are the wells (and thus your DNA) nearer to the positive or negative electrode?
The wells are closer to the negative (black) electrode.
b. Is DNA positively or negatively charged, and how does its charge impact how the
gel chamber is set up?
Because DNA is negatively charged (due to the negatively charged phosphate group
in each nucleotide), it MUST be loaded on the side of the gel nearest to the negative
electrode. Since like charges repel and opposite charges attract, the DNA will travel
away from the negative electrode, through the gel, toward the positive electrode.
10. How many bands appeared in your lane? ______ What are the bands made of?
Answers will vary. Most likely the students will see one band, but they may see two
(if the template DNA came from a sectored colony). Sometimes students will see
none. No bands would result from a deletion or major reorganization of the PCR
priming sites, or from student error. The bands consist of the DNA that was
amplified.
11. Look at the table with class results to determine if your band(s) ran a different distance into
the gel than some of your classmate's bands or if you had a different number of bands than
others. Think about the observations you originally made about the colony types. Can you find
a correlation between the size and number of bands you and your classmates observed in each
lane and the phenotypes of the colonies used to generate those bands? Using the class data,
explain any correlation or lack of correlation you see.
If students extracted DNA from a pink colony from the wild-type Halobacterium sp.
NRC-1 plate, they are most likely to have a single 1792-bp band.
If they extracted DNA from a red colony from the Halobacterium sp. KBT-1 plate,
they are most likely to have a single 2325-bp band. This band confirms that the
colony is KBT-1. Banding patterns different from 2325- or 1792-bp indicate a novel
mutant.
If they had extracted DNA from a red colony from the wild-type plate is likely to be
a novel mutant that may or may not have bands at 1792 or 2325 bp depending on
the nature of the mutation in the gvp gene cluster. The mutation could be an IS
element insertion, a deletion, or a single or multiple nucleotide change in the gvp
gene cluster.
If they had extracted DNA from a sectored colony (if found, it would most likely
originate on the wild-type plate), they may see one or two bands—a 1792-bp band
(from the wild-type portion of the colony) and, if the mutation in the red portion of the
colony is in a region amplified by the primer, a second band as well.
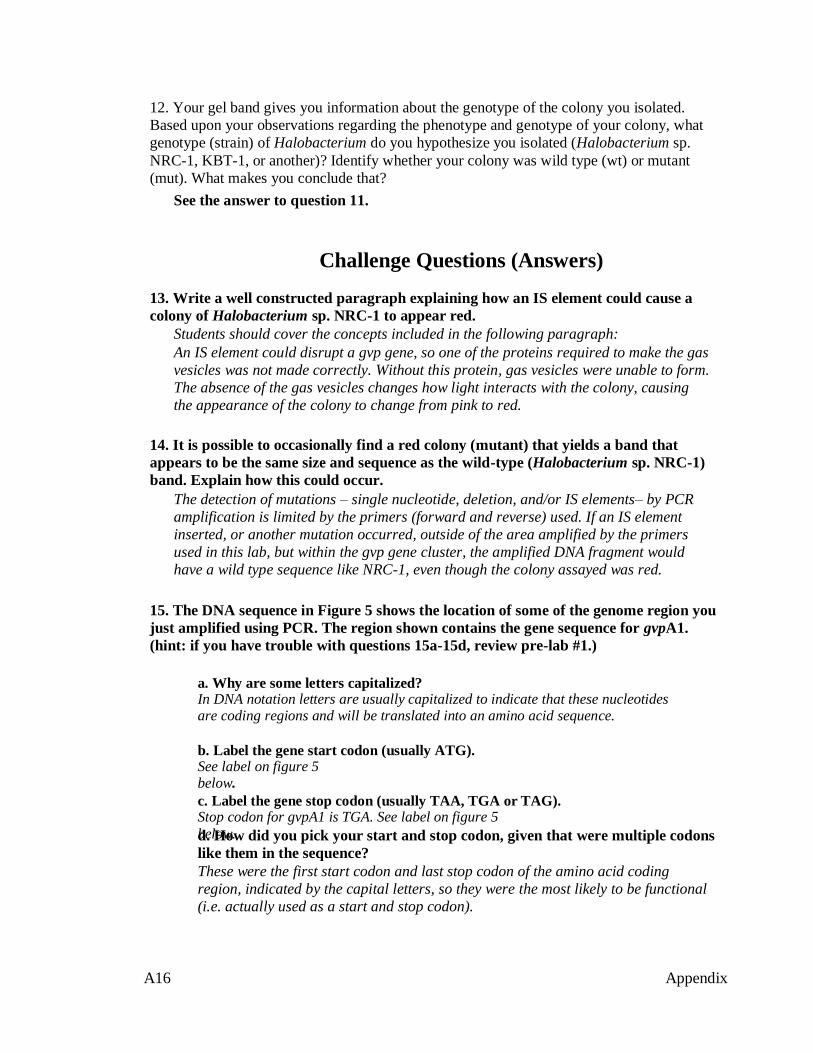
A16 Appendix
12. Your gel band gives you information about the genotype of the colony you isolated.
Based upon your observations regarding the phenotype and genotype of your colony, what
genotype (strain) of Halobacterium do you hypothesize you isolated (Halobacterium sp.
NRC-1, KBT-1, or another)? Identify whether your colony was wild type (wt) or mutant
(mut). What makes you conclude that?
See the answer to question 11.
Challenge Questions (Answers)
13. Write a well constructed paragraph explaining how an IS element could cause a
colony of Halobacterium sp. NRC-1 to appear red.
Students should cover the concepts included in the following paragraph:
An IS element could disrupt a gvp gene, so one of the proteins required to make the gas
vesicles was not made correctly. Without this protein, gas vesicles were unable to form.
The absence of the gas vesicles changes how light interacts with the colony, causing
the appearance of the colony to change from pink to red.
14. It is possible to occasionally find a red colony (mutant) that yields a band that
appears to be the same size and sequence as the wild-type (Halobacterium sp. NRC-1)
band. Explain how this could occur.
The detection of mutations – single nucleotide, deletion, and/or IS elements– by PCR
amplification is limited by the primers (forward and reverse) used. If an IS element
inserted, or another mutation occurred, outside of the area amplified by the primers
used in this lab, but within the gvp gene cluster, the amplified DNA fragment would
have a wild type sequence like NRC-1, even though the colony assayed was red.
15. The DNA sequence in Figure 5 shows the location of some of the genome region you
just amplified using PCR. The region shown contains the gene sequence for gvpA1.
(hint: if you have trouble with questions 15a-15d, review pre-lab #1.)
a. Why are some letters capitalized? In DNA notation letters are usually capitalized to indicate that these nucleotides are coding regions and will be translated into an amino acid sequence.
b. Label the gene start codon (usually ATG). See label on figure 5 below.
c. Label the gene stop codon (usually TAA, TGA or TAG). Stop codon for gvpA1 is TGA. See label on figure 5
below. d. How did you pick your start and stop codon, given that were multiple codons
like them in the sequence?
These were the first start codon and last stop codon of the amino acid coding
region, indicated by the capital letters, so they were the most likely to be functional
(i.e. actually used as a start and stop codon).

A17 Appendix
forward primer: agtctgtgggcgggtgagct 5’ atgaaaaactggctgagctcgcgggggaataacacgattccggtgtagtctgtgggcgggtgagctagattgggtgaact 3’
3’ TACTTTTTGACCGACTCGAGCGCCCCCTTATTGTGCTAAGGCCACATCAGACACCCGCCCACTCGATCTAACCCACTTGA 5’
5’ cattacttctctccagtcgatggcggtagagcactcccgactagtaggtgaggctttcttcgcttcacgactgtctaaga 3’
3’ GTAatgaagagaggtcagctaccgccatctcgtgagggctgatcatccactccgaaagaagcgaagtgctgacagattct 5’
end of gvpD1
5’ agctttacactctccgtacttagaagtacgactcattacaggagacataacgactggtgaaaccatacacatccttatgt 3’
3’ tcgaaatgtgagaggcatgaatcttcatgctgagtaatgtcctctgtattgctgaccactttggtatgtgtaggaataca 5’
Start codon for gvpA1
Start codon for gvpA1
5’ gatgcccgagtatagttagagatgggttaatcccagatcaccaATGGCGCAACCAGATTCTTCAGGCTTGGCAGAAGTCC 3’
3’ ctacgggctcatatcaatctctacccaattagggtctagtggttaccgcgttggtctaagaagtccgaaccgtcttcagg 5’
5’ TTGATCGTGTACTAGACAAAGGTGTCGTTGTGGACGTGTGGGCTCGTGTGTCGCTTGTCGGCATCGAAATCCTGACCGTC 3’
3’ aactagcacatgatctgtttccacagcaacacctgcacacccgagcacacagcgaacagccgtagctttaggactggcag 5’
5’ GAGGCGCGGGTCGTCGCCGCCTCGGTGGACACCTTCCTCCACTACGCAGAAGAAATCGCCAAGATCGAACAAGCCGAACT 3’
3’ ctccgcgcccagcagcggcggagccacctgtggaaggaggtgatgcgtcttctttagcggttctagcttgttcggcttga 5’
Stop codon for gvpA1
Stop codon for gvpA1
5’ TACCGCCGGCGCCGAGGCGGCACCCGAGGCCTGAcgcacaggcctcccttcggcccggcgtaagggaggtgaatcgcttg 3’
3’ atggcggccgcggctccgccgtgggctccggactgcgtgtccggagggaagccgggccgcattccctccacttagcgaac 5’
Start codon for gvpC1
5’ caaaccatactattaacacccttctcgggtacacactaatcccATGAGTGTCACAGACAAACGCGACGAGATGAGTACTG 3’
3’ gtttggtatgataattgtgggaagagcccatgtgtgattagggtactcacagtgtctgtttgcgctgctctactcatgac 5’
Figure 5. A portion of the wild type Halobacterium sp. NRC-1 gvpA1 gene region sequence
amplified using the primers in this kit.
16. Translate the capitalized sequence for gvpA1 (from question 15, Figure 5) into an amino
acid sequence. Use the sequence editor function on HaloWeb to help you do this.
Be aware that some students may remember from Prelab exercise 1 that they can get the amino
acid sequence directly from the HaloWeb site without having to use the sequence editor.
Go to HaloWeb and click the “search” tab. Search for gvpA1, get the sequence, copy and paste
into the sequence editor window. Students should enter in the top strand sequence (all in capital
letters) for gvpA1 from the start to stop only. Sequence editor gives the following amino acid
sequence (in one letter abbreviations) after clicking “translate it”:
M A Q P D S S R N P D R R G A G R R R L G G H L P P L R R R N R Q D R T S R
T Y R R R R G G T R G L
M = methionine, A=Alanine, Q=Glutamine, etc.
forward primer annealing location
IS Element (ISH2) inserts between these 2 nucleotides

A18 Appendix
17. When the gvpA1 gene region was amplified from KBT-1 and sequenced, the
sequence in Figure 6 was obtained. How does the KBT-1 sequence shown here differ
from the NRC-1 sequence used for question 15 (Figure 5)?
forward primer: agtctgtgggcgggtgagct
5’ atgaaaaactggctgagctcgcgggggaataacacgattccggtgtagtctgtgggcgggtgagctagattgggtgaact 3’
3’ TACTTTTTGACCGACTCGAGCGCCCCCTTATTGTGCTAAGGCCACATCAGACACCCGCCCACTCGATCTAACCCACTTGA 5’
5’ cattacttctctccagtcgatggcggtagagcactcccgactagtaggtgaggctttcttcgcttcacgactgtctaaga 3’
3’ GTAatgaagagaggtcagctaccgccatctcgtgagggctgatcatccactccgaaagaagcgaagtgctgacagattct 5’
end of gvpD1
5’ agctttacactctccgtacttagaagtacgactcattacaggagacataacgactggtgaaaccatacacatcccattcg 3'
3’ tcgaaatgtgagaggcatgaatcttcatgctgagtaatgtcctctgtattgctgaccactttggtatgtgtagggtaagc 5'
5' tctttagttaagaaatcgcgtgacagcggtaggatctcttcgctgtgcaagacgcggctgagatctcttttgataatatt 3'
3' agaaatcaattctttagcgcactgtcgccatcctagagaagcgacacgttctgcgccgactctagagaaaactattataa 5'
3’ ttaacctaaatcgaaataagacgataatcttaccgtgcacccggtgcacgtatttctaagagcgtctaagactatggctc 5’
5’ aattggatttagctttattctgctattagaatggcacgtgggccacgtgcataaagattctcgcagattctgataccgag 3’
3’ gaaccaaaatgggcgtctccatccgaactgaactcgttgatgaactcgattcactcgtcgatgagtgttcagatctcgga 5’
5’ cttggttttacccgcagaggtaggcttgacttgagcaactacttgagctaagtgagcagctactcacaagtctagagcct 3’
3’ gcaagccgctccgagatcgttgaagccatcctcacagcatattttcagaacgatgaagaccaaatcaaacagacgcgaga 5’
5’ cgttcggcgaggctctagcaacttcggtaggagtgtcgtataaaagtcttgctacttctggtttagtttgtctgcgctct 3’
3’ gctgattatccgcaacagaaaacgctctaactcgtagagaagttcgtgcaccgagtgcacgaacttcttagagcgtcatt 5’
5’ cgactaataggcgttgtcttttgcgagattgagcatctcttcaagcacgtggctcacgtgcttgaagaatctcgcagtaa 3’
3’ caaaaccacgacctagctaaattaatatcggattggtcttgggcgaatagaaatcttctcttcactgttcagccctacgc 5’
5’ gttttggtgctggatcgatttaattatagcctaaccagaacccgcttatctttagaagagaagtgacaagtcgggatgcg 3’
3’ catgtggcggtttcgctcttaactaaagacgaatgccatacacatccttatgtgatgcccgagtatagttagagatgggt 5’
5’ gtacaccgccaaagcgagaattgatttctgcttacggtatgtgtaggaatacactacgggctcatatcaatctctaccca 3’
Start codon for gvpA1 gvpA1
5’ taatcccagatcaccaATGGCGCAACCAGATTCTTCAGGCTTGGCAGAAGTCCTTGATCGTGTACTAGACAAAGGTGTCG 3’
3’ attagggtctagtggttaccgcgttggtctaagaagtccgaaccgtcttcaggaactagcacatgatctgtttccacagc 5’
5’ TTGTGGACGTGTGGGCTCGTGTGTCGCTTGTCGGCATCGAAATCCTGACCGTCGAGGCGCGGGTCGTCGCCGCCTCGGTG 3’
3’ aacacctgcacacccgagcacacagcgaacagccgtagctttaggactggcagctccgcgcccagcagcggcggagccac 5’
5’ GACACCTTCCTCCACTACGCAGAAGAAATCGCCAAGATCGAACAAGCCGAACTTACCGCCGGCGCCGAGGCGGCACCCGA 3’
3’ ctgtggaaggaggtgatgcgtcttctttagcggttctagcttgttcggcttgaatggcggccgcggctccgccgtgggct 5’
Figure 6. Halobacterium sp. KBT-1 sequence of gvpA1 gene region. The boldfaced region indicates an IS
sequence. The underlined sequence on either side of the insertion element are the direct repeats. The direct
repeat result from the insertion element copying the 12 nucleotides located just before the insertion site and
repeating these nucleotides at the end of the IS as it inserts.
forward primer annealing location

A19 Appendix
Optional Extension Activities
1. Use bioinformatics tools to design your own primers for amplifying the gas vesicle
protein genes. Do this in theory or have a commercial lab produce your primers so you can
try them out! To design a primer to amplify a sequence, do the following:
d. The output sequence in the lower window will be the reverse complimentary
sequence to the 3' end sequence that you entered. This is the sequence you use to order
the reverse primer e. It is standard when placing primer orders to write the sequence 5’
to 3’.
c. To design the reverse primer (e.g. gvpA1Reverse), paste the 3’ sequences you
highlighted on the coding strand(the upper strand) into the sequence editor and click
on “reverse compliment” and then “Do it.” Remember that the sequence editor can be
found on the left sidebar on the NRC-1 HaloWeb page
(http://halo4.umbi.umd.edu/cgi-bin/haloweb/nrc1.pl).
b. If the gene is located on the top strand you should name the primer that is 5' of the
sequence you want to amplify, the forward primer (i.e. gvpA1 forward). Because DNA
replication proceeds 5' to 3', the sequence of the primer 5' to the gene will have a sequence
that is identical to a sequence in the coding strand and the reverse compliment of a
sequence in the non-coding strand.
a. Looking at the top strand only, select about 20 bases before (5’) and after (3’) the
region of interest and highlight them. Note that by convention the top strand is depicted
5' to 3' from left to right. In addition, if the gene you are working with is on the top
strand, the top strand is referred to as the coding, or sense strand, and the bottom strand
is referred to as the non-coding or anti-sense strand.
e. In the laboratory, the following guidelines are followed to design a primer that will
work well:
i. The primer should have a relatively low GC content (<60%) because the GC
bond is harder to break than the AT bond.
ii. The primer should not have a run of bases of the same kind – especially Gs
or Cs (e.g. GGGG).
iii. There should not be any predicted hairpin turns (usually the website where you
order from can provide information regarding this) – especially not at the 3’ end.
iv. Most importantly: the primer sequence should be unique—not found
anywhere else in the genome—check for this by BLASTing the desired primer
sequence using the HaloWeb page (the BLAST tool can be found on the left
sidebar; see “BLAST NRC-1 genome”). The primer sequence should only have
homology to the region you are targeting. If it is not unique to the region, then
you will have to choose another set of bases farther 5’ or 3’ from the region you
are interested in.

A20 Appendix
2. Experiment with how gas vesicles from Halobacterium sp. NRC-1 respond to pressure.
First, obtain a liquid culture of Halobacterium sp. NRC-1. Wearing safety goggles and lab
aprons, fill two microcentrifuge tubes to the brim with a stationary phase (pink) liquid culture
of Halobacterium sp. NRC-1. Quickly snap the cap shut on one of them and observe. What
happens to the color of the culture in the closed tube? What do you think happened to the gas
vesicles? You can look at the cells under the phase microscope and see the difference in their
appearance. Also, you can let the two tubes sit for a few weeks on the bench and then see
what happens.
3. There is an abundance of topics that can be researched involving Halobacterium. For
instance, what do this organism have to do with potential life on the planet Mars? How is
Halobacterium metabolism different from that of other organisms? Research these or other
aspects of Halobacterium that may have sparked your interest from the background reading.

A21 Appendix
References and Resources
Printed Materials
GW Cook, MK Konkel, JD Major III, JA Walker, K Han and MA Batzer. 2011. Alu
pair exclusions in the human genome. Mobile DNA, 2:10.
HE Creighton and B McClintock. 1931. A correlation of cytological and genetical crossing-
over in Zea mays. Proc. Natl. Acad. Sci., USA. 17: 492-497.
S DasSarma 1989. Mechanisms of genetic variability in Halobacterium halobium: the purple
membrane and gas vesicle mutations. Canadian Journal of Microbiology, 35:(1) 65–72.
S DasSarma 2006. Extreme halophiles are models for astrobiology. Microbe. 1(3):120–6.
S DasSarma 2007. Extreme microbes. American Scientist 95(3):224-231.
S DasSarma, and P Arora. 2002. Halophiles. Encyclopedia of Life Sciences. 8:458–66.
London: Nature Publishing Group.
S DasSarma, P Arora, F Lin, E Molinari, and LR Yin. 1994. Wild-Type Gas Vesicle
Formation Requires at Least Ten Genes in the gvp Gene Cluster of Halobacterium
halobium Plasmid pNRC100. Journal of Bacteriology. 176 (24): 7646–52.
S DasSarma and P Arora. Genetic analysis of the gas vesicle gene cluster in haloarchaea.
1997. FEMS Microbiology Letters. 153(1): 1–10.
SL DasSarma, MD Capes, P DasSarma, and S DasSarma. 2010. HaloWeb: the haloarchaeal
genomes database. Saline Systems. 6:12.
S DasSarma and P DasSarma. 2008. On the origin of prokaryotic “species”: the
taxonomy of halophilic Archaea. Saline Systems. 4:5.
S DasSarma, T Damerval, JG Jones, and N Tandeau de Marsac. 1987. A Plasmid-
encoded gas vesicle gene in a halophilic archaebacterium. Molecular Microbiology 1(1):
365–70.
S DasSarma. 2006. Extreme halophiles are models for astrobiology. Microbe 1(3): 120–6.
NV Fedoroff. 1984. Transposable genetic elements in maize. Scientific American. 250: 84–98.
JG Jones, NR Hackett, JT Halladay, DJ Scothorn, C Yang, W Ng and S DasSarma. 1989.
Analysis of insertion mutants reveals two new genes in the pNRC100 gas vesicle gene cluster
of Halobacterium halobium. Nucl. Acids Res. 17 (19): 7785–93.
HG Khorana. 1965. Polynucleotide synthesis and the genetic code. Fed. Proc. 24: 1473–78.

A22 Appendix
H Minegishi, T Mizuki, A Echigo, T Fukushima, M Kamekura and R Usami. 2008.
Acidophilic haloarchaeal strains are isolated from various solar salts
B McClintock. 1950. The Origin and Behavior of Mutable Loci in Maize. PNAS USA
36(6): 344–55.
B McClintock 1961. Some parallels between gene control systems in maize and in bacteria.
Am. Naturalist. 95: 265–77.
WV Ng, SP Kennedy, GG Mahairas, B Berquist, M Pan, HD Shukla, SR Lasky, NS Baliga,
V Thorsson, J Sbrogna, S Swartzell, D Weir, J Hall, TA Dahl, R Welti, YA Goo, B
Leithauser, K Keller, R Cruz, MJ Danson, DW Hough, DG Maddocks, PE Jablonski, MP
Krebs, CM Angevine, H Dale, TA Isenbarger, RF Peck, M Pohlschroder, JL Spudich, K
Jung, M Alam, T Freitas, S Hou, CJ Daniels, PP Dennis, AD Omer, H Ebhardt, TM Lowe, P
Liang, M Riley, L Hood, and S DasSarma. 2000. Genome sequence of Halobacterium
species NRC-1. PNAS USA. 97(22):12176–181.
http://www.ncbi.nlm.nih.gov/pmc/articles/PMC17314/
JD Watson and F Crick. 1953. Molecular structure of Nucleic Acids: A
Structure for Deoxyribose Nucleic Acid. Nature 171:737–8.
Web Sites
At the time of this printing, the Web sites given below were active.
http://halo4.umbi.umd.edu/~haloed/
http://halo4.umbi.umd.edu /~haloed/MOLGENT/index.htm
http://www.ncbi.nlm.nih.gov/
http://www.nobelprize.org/
http://www.the-aps.org/education/k12 curric/pdf/mcclintock.pdf
Related Products The following is a list of related items available from Carolina Biological Supply Company.
For more information, please refer to the most recent Carolina™ Science catalog, call toll
free 800-334-5551, or visit our Web site at www.carolina.com.
154771 Basic Microbiology Skills Kit, Part 1
154772 Basic Microbiology Skills Kit Part 2
154776 Antibiotics in Action Kit
154773 Extremely Easy DNA Extraction Kit
154770 Introduction to Life in an Extreme Environment Kit
821449 Halobacterium Broth, 5-mL tubes, Pack of 10
154777 Culture Packet of Brine Salt Inclusions
154800 Halobacterium sp. NRC-1, Tube
154801 Halobacterium sp. NRC-1, Plate

A23 Appendix
Name:____________________ Student Guide Period:___________
Background
1. Nucleic Acids
Deoxyribonucleic Acid (DNA) is a polymer of nucleotide subunits. Each nucleotide contains
a 5-carbon sugar (deoxyribose), a negatively charged phosphate group, and a nitrogenous
base. Because of the way the nucleotides that form the DNA molecule are linked together,
one end of the DNA molecule ends in a phosphate and the other in a hydroxyl group. The end
with the phosphate group is always referred to as the 5' end, and the end with the hydroxyl
group as the 3' end. The 3' and 5' designations derive from how the carbons in an organic
molecule are described; they are described as either 1', 2', 3', etc., depending upon their
position in the molecule. The hydroxyl group at the 3' end of a DNA molecule is attached to
the 3' carbon on the deoxyribose sugar. The phosphate group at the 5' end is attached to the 5'
carbon on the deoxyribose sugar. This 5' and 3' notation is important when studying the
replication of DNA and designing primers for molecular biology experiments. New
nucleotides are always added to the end with the hydroxyl group. Thus, a single-stranded
piece of DNA (such as a primer) can be extended only from the 3' end (5' to 3').
When the nucleotides are joined together to form a polymer strand of DNA, the sugar and
phosphate groups link in an alternating pattern to form a sugar–phosphate backbone. DNA
is a double-stranded structure in which the two strands of DNA are joined together, in an
antiparallel arrangement, meaning that, one strand runs in the 5' to 3' direction, while the
other runs in the 3' to 5' direction. The nitrogenous bases are complementary to each other,
with adenine (A) pairing with thymine (T) and guanine (G) pairing with cytosine (C).
For the sake of simplicity, the DNA double helix is often depicted in a simplified two-
dimensional form (like a ladder or a railroad track). DNA is actually three-dimensional and
helical (like a twisted ladder) with 10.5 base pairs per turn as described by Francis Crick,
James D. Watson and Maurice Wilkins who won a Nobel prize in 1962 for the discovery of
the DNA double helix. (Watson and Crick, 1953) Their discovery was made possible by X-ray
diffraction images created by Rosalind E. Franklin.
During the process of transcription, DNA is used as a template to create strands of messenger
ribonucleic acid (mRNA). Like DNA, RNA is a polymer composed of four base types,
except that in RNA, uracil is used in place of thymine. In addition, unlike DNA, RNA is
single stranded and the nitrogenous bases are attached to ribose rather than deoxyribose.
During translation, mRNA is used to code for the amino acids that form proteins. This
process is carried out by the ribosome which reads the mRNA nucleotides in groups of three.
Each group of three nucleotides (a triplet) is called a codon and designates which amino acid
will be added to the growing polypeptide chain. This process was deciphered by Robert W.
Holley, H. Gobind Khorana and Marshall W. Nirenberg and secured them a Nobel Prize in
1968 (Khorana, 1965).

A24 Appendix
2. Genotype, Phenotype
The central dogma of molecular genetics is that information is transferred from DNA to
mRNA to protein. The genotype of an organism is the nucleotide sequence of its DNA. The
nucleotide sequence dictates, through transcription and translation, which proteins are
produced. The proteins carry out many of the specialized functions of the cell and thus
determine the organism's phenotype.
This laboratory exercise uses the microorganism Halobacterium, and focuses on how the
cell’s genotype, with respect to the gas vesicle protein (gvp) gene cluster, dictates whether
the cells produce intracellular gas-filled vesicles (GVs) or not. Depending on the DNA
sequence of the gvp genes, the colonies of cells appear pink (wild-type colonies of
Halobacterium sp. NRC-1), red (mutant derivatives of Halobacterium sp. NRC-1 such as
KBT-1) or sectored (a mixture of sectors of pink and red cells within one colony). The
presence or absence of the vesicles and the resulting color is a colony's phenotype.
3. Colony Phenotype
Each cell landing on a surface of an agar plate gives rise to a colony by exponentially
dividing into “identical” daughter cells (clones) via binary fission. Colony morphology, the
visual appearance of colonies, has long been used by microbiologists to determine the
nature of organisms that they observe. Details they look for include:
A) the perimeter of the colony: is it smooth, wavy, rough or uneven?
B) the surface of the colony: is it glossy, matte, smooth or rough?
C) the height of the colony: is it raised or flat?
D) the color of the colony
E) opacity or transparency of the colony
4. Haloarchaea
Haloarchaea are evolutionary relics thought to be ancient life forms that may have existed
since early earth. They are classified as members of the Archaea, prokaryotes that constitute
one of the three domains of life (the others are the Eukaryotes and Eubacteria). You may
sometimes see the Archaea referred to by their original name, the Archaebacteria, but the
Archaea are no longer considered “bacteria” at all. Many Archaea grow in unusual
environments, and are extremophiles (extreme-loving microbes). For example, heat-loving
thermophiles from which enzymes used in PCR are isolated, live at extremely high
temperatures. You will be working with a halophile (halo=salt, phile=loving).
Halophilic microbes, called ‘Haloarchaea’, include, Halobacterium, sp. NRC-1 (sp. meaning
“species.”) These microbes require extremely high salt concentrations in order to maintain
their membrane stability, and grow in media with NaCl concentrations up to 5.2 M
(saturation). Their ability to grow in environments with high salt concentrations as well as
other mechanisms for handling harsh environments (i.e. those with toxic metals and high
levels of radiation) allows these organisms to persist in surprising places. They can sometimes
even be isolated from table and rock salt! Few other organisms would survive such salty,
harsh conditions! However the

A25 Appendix
unique adaptations required to survive these extreme conditions makes them incapable of
surviving in what humans consider “normal” environments. Halobacterium sp. NRC-1
lyses (bursts open) when salinity levels around it are lowered to less than about 2 M
NaCl. For comparison, sea water has a total salinity of 0.6 M, while human blood
contains only 0.14 M NaCl.
Halobacterium sp. NRC-1 has been well studied for decades, and was one of the first
microbes to have its genome sequenced (Ng et al, 2000). The DasSarma laboratory led the
sequencing effort and created the HaloWeb genome website (http://halo4.umbi.umd.edu/) as
a repository of information on the sequence of Halobacterium sp. NRC-1's genome. At
HaloWeb anyone can explore the whole genome of Halobacterium – from gene locations,
to gene sequences, to protein sequences and more. The Web site also includes access to
other, more recently sequenced, haloarchaeal genomes (SL DasSarma et al, 2010.)
5. Gas Vesicles
When Halobacterium sp. NRC-1 cultures are observed on an agar plate, most colonies
appear pink (pink is the “wild-type” phenotype). However, red or sectored colonies may also
be found. A sectored colony looks like a red or pink pie with one or more slivers of the other
color in it. The red color is the inherent color of the cells (see cover image). However, the
wild-type cells produce a type of organelle called a gas vesicle (GV), that refracts light,
changing the red translucent appearance of the colonies or liquid cultures to an opaque pink
(see cover image). Refraction is the bending of light as it moves through materials of
different density. In this case, the materials the light travels through are the cytoplasm and
the hollow gas vesicles of the cell. GVs allow the cells to float to the surface of their briny liquid environments (like the Great
Salt Lake in Utah) in order to access light and oxygen. Access to plenty of light and oxygen
allows the organisms to more efficiently utilize the mechanisms they use to generate energy.
In addition to using respiration, these extraordinary microbes also use a process called
phototrophy to obtain energy directly from sunlight. The process is analogous to, but distinct
from, photosynthesis in plants (chloroplasts are not utilized). In addition, Halobacterium can
respire anaerobically using chemicals other than oxygen, though the process is not as energy-
efficient as aerobic respiration. The GVs allow Halobacterium to float to the top of its liquid
environment, where oxygen for aerobic respiration as well as sunlight for phototrophy are
more plentiful.
GVs are very unique in nature, as they are an organelle that is a membrane-like structure
made solely of protein and filled only with ambient gas – hence the name “gas vesicle”. The
13 genes that code for gas vesicle proteins or GVPs (the P standing for proteins) are
organized into two, divergent operons (operons are sets of genes which are expressed
together; divergent means transcription from the operons goes in opposite, or divergent,
directions) (DasSarma, et. al., 1994; DasSarma and Arora, 1997).
6. Transposable/Mobile Genetic Elements
In 1983, at age 81, Barbara McClintock received a Nobel Prize for her work in genetics
discovering transposable elements (McClintock, 1961; Fedoroff, 1984). Transposable
elements are segments of DNA that may relocate to other areas of a genome with the
transposon usually

A26 Appendix
showing little, if any specificity as to where in the genome it integrates. Some transposable
elements actually make a copy of themselves and the copy then inserts into a different part of
the genome, while the original transposable element stays in place.
You have transposable genetic elements in your genome. More than 10% (by mass) of your
human genome can be attributed to transposable elements! These relocating segments of
DNA include the Alu gene family of mobile elements (Cook et al, 2011). In prokaryotic
microorganisms, there is a specific class of transposable elements known as Insertion
Sequence (IS) elements.
When a transposon integrates into a vital region of the genome, the effect of this mutation
may be observed phenotypically. For example, in the case of Halobacterium sp. NRC-1,
disruption of critical areas in any of the genes coding for gas vesicle proteins can cause a
change in color of the organism (approximately 1% of NRC-1 colonies spontaneously show
evidence of this kind of genotypic/phenotypic change.)
Research into the apparent ease with which Halobacterium could change from a pink to a red
phenotype led to the discovery of transposable insertion sequences in Halobacterium. It was
found that the insertion sequences commonly inserted at certain “hot spots,” such as in the
gas vesicle gene region. These insertion sequences were named Insertion Sequences in
Haloarchaea (ISH) (DasSarma et al 1987, Jones et al 1989, DasSarma 1989).
7. PCR
Polymerase Chain Reaction (PCR) is the primary way scientists can amplify (make copies of)
genetic sequences for molecular cloning, sequencing, and other molecular analysis. Forensics,
medical diagnostics, and environmental testing laboratories use PCR for DNA fingerprinting and
species identification. The method uses primers and the enzyme DNA polymerase (a heat stable
DNA polymerase, called Taq polymerase, is used) along with a series of temperature changes to
amplify DNA.
The primers used in PCR are short segments of DNA (around 20 bp) that are designed to amplify a
specific genetic sequence. Two primers are used: a forward primer and a reverse primer. The forward
primer is composed of sequence from the 5' end of the coding strand of the sequence to be amplified,
and the reverse primer is the reverse complement of the 3' end of the coding strand Note: By
convention the top strand is depicted 5' to 3' from left to right. If the gene you are working with is on
the top strand, the top strand is referred to as the coding strand. If the gene were on the bottom
strand, the bottom strand would be referred to as the coding strand. Using the primers as a starting
point, the DNA polymerase synthesizes DNA 5’ to 3’. After multiple rounds of amplification, the
polymerase chain reactions results in amplification only of the DNA that is between the forward and
reverse primers. See Figure 1.
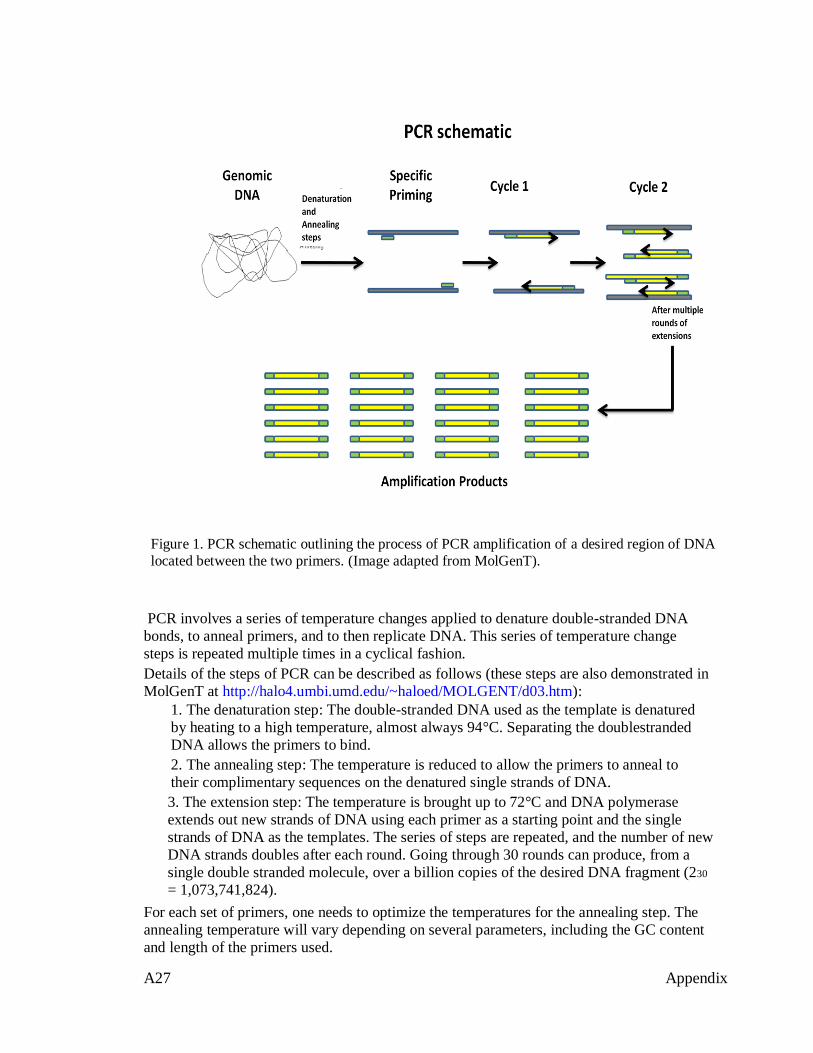
A27 Appendix
Figure 1. PCR schematic outlining the process of PCR amplification of a desired region of DNA
located between the two primers. (Image adapted from MolGenT).
PCR involves a series of temperature changes applied to denature double-stranded DNA
bonds, to anneal primers, and to then replicate DNA. This series of temperature change
steps is repeated multiple times in a cyclical fashion.
Details of the steps of PCR can be described as follows (these steps are also demonstrated in
MolGenT at http://halo4.umbi.umd.edu/~haloed/MOLGENT/d03.htm):
1. The denaturation step: The double-stranded DNA used as the template is denatured
by heating to a high temperature, almost always 94°C. Separating the doublestranded
DNA allows the primers to bind.
2. The annealing step: The temperature is reduced to allow the primers to anneal to
their complimentary sequences on the denatured single strands of DNA.
3. The extension step: The temperature is brought up to 72°C and DNA polymerase
extends out new strands of DNA using each primer as a starting point and the single
strands of DNA as the templates. The series of steps are repeated, and the number of new
DNA strands doubles after each round. Going through 30 rounds can produce, from a
single double stranded molecule, over a billion copies of the desired DNA fragment (230
= 1,073,741,824).
For each set of primers, one needs to optimize the temperatures for the annealing step. The
annealing temperature will vary depending on several parameters, including the GC content
and length of the primers used.

A28 Appendix
8. Electrophoresis
Electrophoresis is a process by which DNA molecules can be separated by size. During
electrophoresis, DNA is drawn through an agarose gel matrix by an electric current. Agarose
is a highly purified seaweed extract that forms a gel when heated in water and cooled. The
agarose is dissolved in buffer and heated. When the solution is poured into the gel tray, it
solidifies, forming a matrix through which the DNA is run. Because DNA has an overall
negative charge (due to the negatively charged phosphate groups in its backbone) the DNA,
which was placed into the wells in the end of the gel closest to the negative electrode, moves
through the gel toward the positive electrode of the gel chamber. DNA fragments move
through the gel matrix at different rates depending on their size. Larger fragments take longer
than shorter fragments to move through the gel, so larger fragments are seen closer to the
wells than smaller fragments. Fragments of the same size will form discrete bands since they
pass through the matrix at the same rate.
The gel is made with and immersed in a salt buffer to provide the ions necessary to produce
the electric current that runs through the gel. In this exercise we will use TBE (containing
Tris, Boric Acid, EDTA).
To make the gel loading process go more smoothly in the classroom, loading dye will be
added directly to the reaction mix prior to PCR. There is sugar (in this case, sucrose) in the
loading dye to make the DNA sample more dense than the buffer, so it will sink to the
bottom of the well. The loading dye used in this lab also contains a dye called Cresol Red
(which, unlike most other dyes, does not inhibit the action of Taq polymerase). On a 0.8%
gel, cresol red runs through the gel at approximately the same rate as a 1.5 kB DNA
fragment. Watching the progress of the dye helps you track where your DNA fragments
should be running on the gel, so you know when to turn off the power supply. A DNA
ladder, or another set of DNA markers, containing DNA fragments of known size, is loaded
into one lane of a gel. Comparing the amplified PCR fragments to the fragments of known
size in the marker allows you to determine the approximate size of the amplified fragments.
9. Bioinformatics
Bioinformatics is a branch of biology that combines molecular biology data with computer
databases that hold information from scientists worldwide. Bioinformatics came about after
the amount of data generated by biological experiments and data collection became so
overwhelming that biologists needed help analyzing, organizing, and archiving the
information. For example, the Halobacterium sp. NRC-1 genome is about 2.5 million base
pairs in size, and codes for about 2500 proteins! Imagine organizing the data that generated
this entire sequence and analyzing it without the aid of computer programs and
programmers to write the code to organize and interpret the data.
This lab will use bioinformatics to evaluate information regarding the gas vesicle gene
region. Bioinformatics tools such as those found on HaloWeb (http://halo4.umbi.umd.edu/)
will help you explore the genotype of the red and pink colonies of Halobacterium sp. NRC-
1.

A29 Appendix
Name:_________________ Student Guide Period: __________________
The Genotype-Phenotype Connection:
Basic Molecular Genetics and Bioinformatics Skills
Following these instructions, you will use the model microbe, Halobacterium, to perform four
related activities: 1) Determination of Colony Phenotype and Cell Lysis, 2) Polymerase Chain
Reactions (PCR), 3) Gel Electrophoresis, and 4) Data Comparison and Analysis. In the
analysis, you and your classmates will compare data. It is your careful observations of the
Halobacterium colony phenotypes at the beginning of this lab that will provide clues in
deciphering your PCR/gel electrophoresis results at the conclusion.
Pre-Lab for Activity 1 HaloWeb is a haloarchaeal-specific bioinformatics resource tool that has been publically
available for over a decade, and be can used it to explore the genomes of several
Haloarchaea, including Halobacterium sp NRC-1.
Use HaloWeb to explore Halobacterium gas vesicle genes.
1. Go to the HaloWeb gateway page (http://halo4.umbi.umd.edu or access from a search
engine, by searching for “HaloWeb”).
2. Click on “Halobacterium sp. NRC-1” to go to the individual genome web page.
3. Click on the “search” tab to search the genome.
4. In Search, "Keyword in", the “both” button is already preselected for you.
5. Type in “gvpA1” into the annotation search box, in order to search for the gvpA1 gene
related to gas vesicle assembly.
6. Click on the search button on the end of the page or hit
return.
7. Select “gvpA1”, one of the gas vesicle protein genes that is integral in the formation of
gas vesicles. You may choose gvpA1 for either replicon (plasmid).
8. Now you are on the gene web page. Here you can explore all aspects related to the gene
and the regions around it. Try out some of the options listed on the page:
“Get data for this gene” gives the DNA sequence of gvpA1 and also the amino
acid sequence.
Either “BLAST” option could be chosen if you had a DNA/RNA or protein
sequence you wanted to compare to the gvpA1 nucleotide or amino acid sequence to
find similarities or differences between the sequences.
9. You can expand or shrink the region you want to see on the gene map that is at the
bottom of the page – for example, use the dropdown menu “Number of genes in this
neighborhood” and select 23 genes for the region you want to see. Scroll down to see all 23
genes in the gvpA1 gene region. Just below the chart of surrounding genes, scroll down to
look at the gene map. Notice that there are other gvp genes surrounding gvpA1. Notice the
location of gvpD1. Also note that there are insertion elements (ISH8-1, ISH3-2, etc. just
downstream of gvpA1. You

A30 Appendix
10. Now look at the nucleotide and consequent amino acid sequences for however many
genes you have chosen in the neighborhood of gvpA1 by clicking on the “submit” button at
the bottom of the screen. Note: your computer must be able to open a popup for this
function, so be sure to check if pop-ups are enabled if at first you do not get a sequence.
11. Look at the DNA sequence that has come up in the pop-up window. You will notice that
some of the bases are capitalized, and some are not. Bases that are transcribed into RNA are
capitalized; untranscribed areas, known as intergenic regions, are shown in lower case.
12. Go back to the gene webpage and “select top strand only” at the bottom of the screen,
then hit “submit” as before. Now you will get a single-stranded version of the gene
region.
13. You can also see if there are other, similar regions in the genome. Copy the whole or
partial sequence and then click on the “BLAST NRC-1 Genome” link on the main page.
may wish to select fewer than 23 genes or more than 23 genes in the area around gvpA1
to get a different view.
14. Paste in your sequence into the “Enter Query Sequence” box towards the bottom of the
page, followed by clicking on “Begin Search” button near the bottom of the page. Your
sequence is the query sequence (referenced below)
The BLAST function on the HaloWeb site is carried out at the NCBI (National Center for
Biotechnology Information). A BLAST allows you to compare a DNA sequence you are
curious about to the sequences already in the genome databases. The homologous (similar)
regions between the sequence you submit and any sequences in the database are identified
and scores indicating the probability that they are truly homologous are assigned to them.
15. Click on “View report” and you will see the NCBI
results.
“Graphic summary” shows you how similar the sequence you copied is to other
sequences within Halobacterium sp. NRC-1.
The “Descriptions” chart includes a query coverage which tells you what
percentage of your query sequence is found elsewhere in NRC-1.
“Alignments” gives you a base pair alignment of your query to the subject
(Halobacterium sp. NRC-1.) Vertical lines between the two sequences indicate exact
matches. Spaces between the vertical lines mean there was not an exact match.
Dashes tell you that there was a misalignment and space was added to get the
sequences to align from that point forward.

A31 Appendix
Activity 1 – Halobacteria Exploration and Cell Lysis
Materials (per student unless otherwise noted) 2 sterile microcentrifuge tubes, 1.5-mL capacity
permanent fine-tip marker
5 petri plates with Halobacterium culture(s), shared among the class
1 micropipet for measuring 100 uL and 500 uL (per student or student group) with sterile tips
sterile distilled water
vortexer (not essential)
microcentrifuge
dissecting scope or hand lens (not essential)
gloves
Laboratory Procedure 1.1 Set up a clean, sterile work area as your teacher instructs.
1.2 Obtain your microcentrifuge tubes. With permanent insoluble marker, label the tubes
with your initials and each of the following: “#1” and “#2 extract.” Set the tube labeled “#2
extract” aside for later use.
1.3 Add 500 uL of sterile distilled water to your microcentrifuge tube labeled “#1.”
1.4 Observe a petri plate of Halobacterium colonies by holding the plates up to a light. To
make more detailed observations you can view them using a dissecting microscope or a
hand lens if they are available.
1.5 Describe at least two different-looking colonies. Include color and colony morphology
(do they have raised/irregular borders, are they raised or flat, are they matte or glossy, etc?)
1.6 While observing the various Halobacterium colonies, select one colony from which to
extract DNA. Use a permanent marker on the bottom outside of the petri plate to circle
your colony and mark it with your initials. Your colony information will be compared
with that of your classmates. It is the compilation of all the data that will allow you to
form an analysis of the genotype of your colony.
Colony description (color, etc.): Colony morphology observations:
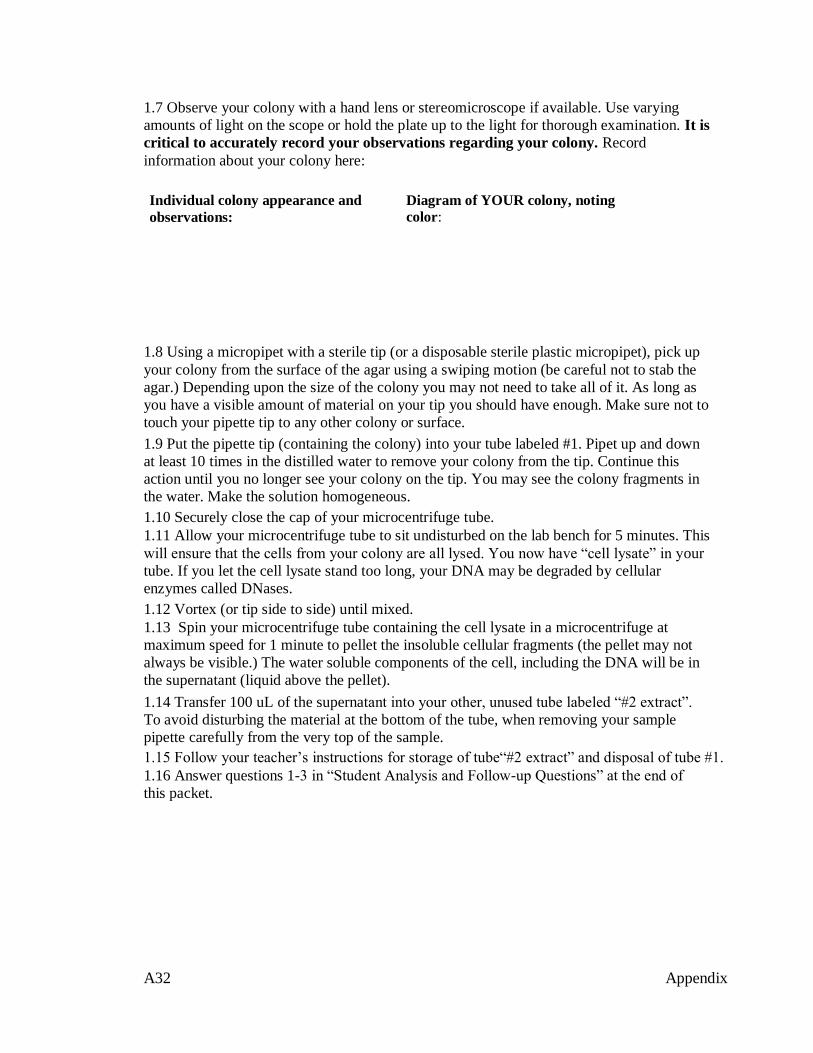
A32 Appendix
1.7 Observe your colony with a hand lens or stereomicroscope if available. Use varying
amounts of light on the scope or hold the plate up to the light for thorough examination. It is
critical to accurately record your observations regarding your colony. Record
information about your colony here:
1.8 Using a micropipet with a sterile tip (or a disposable sterile plastic micropipet), pick up
your colony from the surface of the agar using a swiping motion (be careful not to stab the
agar.) Depending upon the size of the colony you may not need to take all of it. As long as
you have a visible amount of material on your tip you should have enough. Make sure not to
touch your pipette tip to any other colony or surface.
1.9 Put the pipette tip (containing the colony) into your tube labeled #1. Pipet up and down
at least 10 times in the distilled water to remove your colony from the tip. Continue this
action until you no longer see your colony on the tip. You may see the colony fragments in
the water. Make the solution homogeneous.
1.10 Securely close the cap of your microcentrifuge tube.
1.11 Allow your microcentrifuge tube to sit undisturbed on the lab bench for 5 minutes. This
will ensure that the cells from your colony are all lysed. You now have “cell lysate” in your
tube. If you let the cell lysate stand too long, your DNA may be degraded by cellular
enzymes called DNases.
1.12 Vortex (or tip side to side) until mixed.
1.13 Spin your microcentrifuge tube containing the cell lysate in a microcentrifuge at
maximum speed for 1 minute to pellet the insoluble cellular fragments (the pellet may not
always be visible.) The water soluble components of the cell, including the DNA will be in
the supernatant (liquid above the pellet).
1.14 Transfer 100 uL of the supernatant into your other, unused tube labeled “#2 extract”.
To avoid disturbing the material at the bottom of the tube, when removing your sample
pipette carefully from the very top of the sample.
1.15 Follow your teacher’s instructions for storage of tube“#2 extract” and disposal of tube #1.
1.16 Answer questions 1-3 in “Student Analysis and Follow-up Questions” at the end of
this packet.
Individual colony appearance and
observations:
Diagram of YOUR colony, noting
color:

A33 Appendix
Pre-Lab for Activity 2
Go to the MolGenT (Molecular Genetics Tutor) website to watch the unit on PCR:
http://halo4.umbi.umd.edu/~haloed/MOLGENT/index.htm
NOTE: this activity requires that you have QuickTime installed on your computer in order to
view the units.
1. Go to Part D: Recombinant DNA and Society.
2. Click on the PCR amplification tutorial link (on the left menu) and push "play".
This narrated animation demonstrates how PCR works.
Activity 2 – PCR
Materials (per student unless otherwise noted)
Student microcentrifuge tube from Activity 1 containing nucleic acid extract (labeled #2 extract)
1 PCR tube containing Ready-To-Go Bead™, 0.2-mL capacity
Permanent fine-tip insoluble marker
Micropipet (4- to 20-uL capacity) with sterile tips
Ice (in beaker or plastic cup)
1 vial Primer Mix, shared among several students
Procedure
2.1 Set up a clean work area as your teacher instructs.
2.2 Collect your individual supplies. Notice that the PCR microcentrifuge tube contains a
white bead. The bead contains the reagents that are necessary for synthesizing the new
DNA, including a DNA polymerase called Taq polymerase, dNTP's, and buffer
components.
2.3 Keep your microcentrifuge tube (#2 extract) containing the cell lysate from Activity 1
on ice. It should remain on ice while you are working.
2.4 Label your PCR tube (containing the bead) with your initials as your teacher instructs.
You will be adding reagents to this tube from here on. Work with this tube on ice as much as
possible until you place it in the thermal cycler.
2.5 Obtain Primer/Loading Dye Mix from your teacher. It contains a forward primer and
reverse primer as well as gel electrophoresis loading dye (purple-pink color). The loading
dye is added now to make your later steps easier. Pipet 20 uL of the Primer Mix into your
PCR tube
2.6 Allow the tube with the PCR bead and primer to sit on ice for 1-2 minutes.
2.7 With a new sterile tip (or new microcapillary pipette), add 4 uL lysate from the
microcentrifuge tube (#2 extract) from Activity 1 to the liquid in the bottom of the PCR
tube and gently pipette up and down several times to mix the contents.
2.8 Follow your teacher’s instructions for placement of your PCR tube into the thermal cycler.
2.9 Answer questions 4–8 in “Student Analysis and Follow-up Questions” at the end of
this packet.
A34 Appendix
Pre-Lab for Activity 3
Watch the Carolina Video (5 minutes, 46 seconds) explaining how to load a gel. Find
Teacher Resources on www.carolina.com. In the educational videos, select
“Biotechnology,” and in that category, click on “Loading a Gel for Electrophoresis."
Determine which type of pipette you will be using (micropipette, fixed
volume pipette, microcapillary, etc.).
Activity 3 – Gel Electrophoresis
Materials per student
your PCR tube from Activity 2 (it has already undergone PCR)
ice (in beaker or plastic cup)
micropipette (for pipetting 10 uL) with sterile tips or 1 disposable microcapillary pipette
stain
staining tray
gloves
To Be Shared
gel electrophoresis chamber
1X TBE running buffer
agarose gel poured and ready
1 vial 1 kb DNA ladder
white light or BLUe light
Procedure
3.1 Obtain your individual materials. Keep your PCR tube on ice when possible during
the following steps.
3.2 Your teacher or another student should pipette 5.0 uL (if you are using GelGreen™ or a
stain of similar sensitivity) or 25 uL (if you are using CarolinaBLU™ or a stain of similar
sensitivity) of the DNA ladder into the appropriate lane.
3.3 Following your teacher’s instructions, carefully pipette your PCR sample into your
assigned gel well. Load 10 µL if you are staining with CarolinaBLU. Load 5 µL if you are
using Gel Green.
3.4 Because each student is evaluating a different colony, it is important to know which
lane in the gel belongs to you. Record the gel and the lane number in which your sample is
loaded.
Gel (if more than one gel ran during
your class period):
I pipetted my sample into Lane #:

A35 Appendix
3.5 Run your gel according your instructor's directions. Before staining, measure the
distance from the front edge of the well to the front edge of the dye front and record here.
______________cm
3.6 Follow your teacher’s instructions for staining your gel. Staining makes the DNA visible.
3.7 Answer questions 9-11 in “Student Analysis and Follow-up Questions” at the end of
this packet.
Figure 4. Labeled DNA marker
Activity 4 – Data Comparison and Analysis
Materials (per student unless otherwise noted)
Photos of various gels (or gels themselves)
Procedure
4.1 Calculate the approximate size [in base pairs (bp)] of your DNA fragment(s).
a. You will interpolate the molecular weights of your PCR products by using a
standard curve created using the 1 kb ladder. For this exercise use either a photo of
the gel or a representation created by placing a piece of acetate over the gel and
tracing around the location of each band. The size of the DNA bands in the ladder are
given in figure 4.
b. Using your own gel, a photograph, or a representation of the gel traced on acetate,
carefully measure the distance (in mm) each DNA band in the DNA ladder traveled from
the

A36 Appendix
well. Also measure the distance traveled by the bands in the lane loaded with your sample.
Measure from the front edge of the well to the front edge of each band. Enter the distances
into the table.
c. Calculate the Rf for each fragment. Rf is calculated by dividing the distance traveled by
a given band by the distance traveled by the dye front (measured in step 3.5), and is used
when calculating molecular weight.
d. Set up semilog graph paper with Rf as the x-(arithmetic) axis and the base-pair length as
the y- (logarithmic) axis. Then, plot the Rf versus the base-pair length for each of the DNA
bands in the marker.
f. Connect the data points with a best-fit line. This best fit line is the standard curve.
g. Locate on the x-axis the Rf for one of the DNA bands in the lane loaded with your
sample. Using a ruler, draw a vertical line from this point to its intersection with the
standard curve (the best fit line.)
h. Extend a horizontal line from this point on the standard curve to the y-axis. This gives
the base-pair size of this band.
i. Repeat steps g and h for each band in the lane loaded with your sample and write
the answers below.
4.2 Share the observations you wrote down regarding the morphology of your colony (while
it was still on the agar plate) with your class. While your classmates are looking at the gel (or
photo), indicate the location of your lane and describe the size of the band in that lane.
4.3 Record the class data in a chart so that it can be easily observed. Your teacher may
provide you with a chart to use.
4.4 Answer questions 11 and 12 in “Student Questions” at the end of this packet. Your
teacher may also assign some or all of the challenge questions, questions 13-18.
DNA
band 0.5 kb 1.0 kb 1.5 kb 2.0 kb 3.0 kb 4.0 kb 5.0 kb 6.0 kb 8.0 kb 10.0
kb
PCR
product
PCR
product
Distance
traveled
Rf

A37 Appendix
Name:_________________ Student Guide Period: __________________
Student Analysis and Follow-up Questions (hint: if you are stumped on any question, go back and re-read the background section)
1. You observed the possible phenotypes of Halobacterium on the petri plate.
a. Describe each of the phenotypes observed.
b. What do you propose was the source/cause of the different phenotypes?
2. From your background reading, which unique properties of Halobacterium, an
extreme halophile, allows the cells to be lysed with the simple addition of water?
3. You lysed your cells in water.
a. Which cellular components would you expect to find in your
lysate?
b. Why was the cell lysate
centrifuged?
c. What purpose was served by removing 100 uL of supernatant and transferring
it to another tube?
4. What are the necessary components in the PCR reactions? List the components and
the purpose of each.
5. You mixed the PCR bead, primers, and lysate sample thoroughly before placing the
reaction in the thermal cycler. Why was thorough mixing necessary?

A38 Appendix
6. A Polymerase Chain Reaction goes through several cycles of temperature changes. List
each step of a cycle, and describe what occurs during each step.
7. Why did you place your nucleic acid extract and PCR reagents on ice until the PCR
reaction was set up and placed in the thermal cycler?
8. What are 2 purposes served by the loading dye?
9. You loaded the PCR samples into the wells of the gel electrophoresis chamber.
a. Are the wells (and thus your DNA) nearer to the positive or negative electrode?
b. Is DNA positively or negatively charged, and how does its charge impact how the
gel chamber is set up?
10. How many bands appeared in your lane? ______ What are the band(s) made of?
11. Look at the table with class results to determine if your band(s) ran a different distance
into the gel than some of your classmate's bands or if you had a different number of bands
than others. Think about the observations you originally made about the colony types. Can
you find a correlation between the size and number of bands you and your classmates
observed in each lane and the phenotypes of the colonies used to generate those bands? Using
the class data, explain any correlation or lack of correlation you see.

A39 Appendix
12. Your gel band gives you information about the genotype of the colony you isolated.
Based upon your observations regarding the phenotype and genotype of your colony, what
genotype (strain) of Halobacterium do you hypothesize you isolated (Halobacterium sp.
NRC-1, KBT-1, or another)? Identify whether your colony was wild type (wt) or mutant
(mut). What makes you conclude that?
Challenge Questions
13. Write a well constructed paragraph explaining how an IS element could cause a red
colony of Halobacterium sp. NRC-1 to appear red.
14. It is possible to occasionally find a red colony (mutant) that yields a band that appears to
be the same size and sequence as the wild-type (Halobacterium sp. NRC-1) band. Explain
how this could occur.
15. The DNA sequence in Figure 5 (on the following page) shows the location of some of
the genome region you just amplified using PCR. The region shown contains the gene
sequence for gvpA1. (hint: if you have trouble with questions 15a-15d, review pre-lab #1.)
a. Why are some letters capitalized?
b. Label the gene start codon (usually ATG).
c. Label the gene stop codon (usually TAA, TGA or TAG).
d. How did you pick your start and stop codon, given that were multiple codons like
them in the sequence?

A40 Appendix
forward primer: agtctgtgggcgggtgagct
5’ atgaaaaactggctgagctcgcgggggaataacacgattccggtgtagtctgtgggcgggtgagctagattgggtgaact 3’
3’ TACTTTTTGACCGACTCGAGCGCCCCCTTATTGTGCTAAGGCCACATCAGACACCCGCCCACTCGATCTAACCCACTTGA 5’
5’ cattacttctctccagtcgatggcggtagagcactcccgactagtaggtgaggctttcttcgcttcacgactgtctaaga 3’
3’ GTAatgaagagaggtcagctaccgccatctcgtgagggctgatcatccactccgaaagaagcgaagtgctgacagattct 5’
end of gvpD1
5’ agctttacactctccgtacttagaagtacgactcattacaggagacataacgactggtgaaaccatacacatccttatgt 3’
3’ tcgaaatgtgagaggcatgaatcttcatgctgagtaatgtcctctgtattgctgaccactttggtatgtgtaggaataca 5’
start of gvpA1
5’ gatgcccgagtatagttagagatgggttaatcccagatcaccaATGGCGCAACCAGATTCTTCAGGCTTGGCAGAAGTCC 3’
3’ ctacgggctcatatcaatctctacccaattagggtctagtggttaccgcgttggtctaagaagtccgaaccgtcttcagg 5’
5’ TTGATCGTGTACTAGACAAAGGTGTCGTTGTGGACGTGTGGGCTCGTGTGTCGCTTGTCGGCATCGAAATCCTGACCGTC 3’
3’ aactagcacatgatctgtttccacagcaacacctgcacacccgagcacacagcgaacagccgtagctttaggactggcag 5’
5’ GAGGCGCGGGTCGTCGCCGCCTCGGTGGACACCTTCCTCCACTACGCAGAAGAAATCGCCAAGATCGAACAAGCCGAACT 3’
3’ ctccgcgcccagcagcggcggagccacctgtggaaggaggtgatgcgtcttctttagcggttctagcttgttcggcttga 5’
end of
gvpA1 5’ TACCGCCGGCGCCGAGGCGGCACCCGAGGCCTGAcgcacaggcctcccttcggcccggcgtaagggaggtgaatcgcttg 3’
3’ atggcggccgcggctccgccgtgggctccggactgcgtgtccggagggaagccgggccgcattccctccacttagcgaac 5’
start of gvpC1
5’ caaaccatactattaacacccttctcgggtacacactaatcccATGAGTGTCACAGACAAACGCGACGAGATGAGTACTG 3’
3’ gtttggtatgataattgtgggaagagcccatgtgtgattagggtactcacagtgtctgtttgcgctgctctactcatgac 5’
Figure 5. A portion of the wild type Halobacterium sp. NRC-1 gvpA1
gene region sequence amplified by PCR
16. Translate the entire capitalized sequence for gvpA1 (from question 15, Figure 5) into
an amino acid sequence. Use the sequence editor function on HaloWeb (or your textbook)
to help you do this.
17. When the gvpA1 gene region was amplified from KBT-1 and sequenced, the sequence in
Figure 6 (on the following page) was obtained. How does the KBT-1 sequence shown (figure
6) differ from the NRC-1 sequence used for question 15 (Figure 5)?
forward primer annealing location
IS Element (ISH2) inserts between these 2
nucleotides

A41 Appendix
forward primer: agtctgtgggcgggtgagct
5’ atgaaaaactggctgagctcgcgggggaataacacgattccggtgtagtctgtgggcgggtgagctagattgggtgaact 3’
3’ TACTTTTTGACCGACTCGAGCGCCCCCTTATTGTGCTAAGGCCACATCAGACACCCGCCCACTCGATCTAACCCACTTGA 5’
5’ cattacttctctccagtcgatggcggtagagcactcccgactagtaggtgaggctttcttcgcttcacgactgtctaaga 3’
3’ GTAatgaagagaggtcagctaccgccatctcgtgagggctgatcatccactccgaaagaagcgaagtgctgacagattct 5’
end of gvpD1
5’ agctttacactctccgtacttagaagtacgactcattacaggagacataacgactggtgaaaccatacacatcccattcg 3' 3’ tcgaaatgtgagaggcatgaatcttcatgctgagtaatgtcctctgtattgctgaccactttggtatgtgtagggtaagc 5'
5' tctttagttaagaaatcgcgtgacagcggtaggatctcttcgctgtgcaagacgcggctgagatctcttttgataatatt 3'
3' agaaatcaattctttagcgcactgtcgccatcctagagaagcgacacgttctgcgccgactctagagaaaactattataa 5'
3’ ttaacctaaatcgaaataagacgataatcttaccgtgcacccggtgcacgtatttctaagagcgtctaagactatggctc 5’
5’ aattggatttagctttattctgctattagaatggcacgtgggccacgtgcataaagattctcgcagattctgataccgag 3’
3’ gaaccaaaatgggcgtctccatccgaactgaactcgttgatgaactcgattcactcgtcgatgagtgttcagatctcgga 5’
5’ cttggttttacccgcagaggtaggcttgacttgagcaactacttgagctaagtgagcagctactcacaagtctagagcct 3’
3’ gcaagccgctccgagatcgttgaagccatcctcacagcatattttcagaacgatgaagaccaaatcaaacagacgcgaga 5’
5’ cgttcggcgaggctctagcaacttcggtaggagtgtcgtataaaagtcttgctacttctggtttagtttgtctgcgctct 3’
3’ gctgattatccgcaacagaaaacgctctaactcgtagagaagttcgtgcaccgagtgcacgaacttcttagagcgtcatt 5’
5’ cgactaataggcgttgtcttttgcgagattgagcatctcttcaagcacgtggctcacgtgcttgaagaatctcgcagtaa 3’
3’ caaaaccacgacctagctaaattaatatcggattggtcttgggcgaatagaaatcttctcttcactgttcagccctacgc 5’
5’ gttttggtgctggatcgatttaattatagcctaaccagaacccgcttatctttagaagagaagtgacaagtcgggatgcg 3’
3’ catgtggcggtttcgctcttaactaaagacgaatgccatacacatccttatgtgatgcccgagtatagttagagatgggt 5’
5’ gtacaccgccaaagcgagaattgatttctgcttacggtatgtgtaggaatacactacgggctcatatcaatctctaccca 3’
Start of gvpA1
5’ taatcccagatcaccaATGGCGCAACCAGATTCTTCAGGCTTGGCAGAAGTCCTTGATCGTGTACTAGACAAAGGTGTCG 3’
3’ attagggtctagtggttaccgcgttggtctaagaagtccgaaccgtcttcaggaactagcacatgatctgtttccacagc 5’
5’ TTGTGGACGTGTGGGCTCGTGTGTCGCTTGTCGGCATCGAAATCCTGACCGTCGAGGCGCGGGTCGTCGCCGCCTCGGTG 3’
3’ aacacctgcacacccgagcacacagcgaacagccgtagctttaggactggcagctccgcgcccagcagcggcggagccac 5’
5’ GACACCTTCCTCCACTACGCAGAAGAAATCGCCAAGATCGAACAAGCCGAACTTACCGCCGGCGCCGAGGCGGCACCCGA 3’
3’ ctgtggaaggaggtgatgcgtcttctttagcggttctagcttgttcggcttgaatggcggccgcggctccgccgtgggct 5’
5’ GGCCTGAcgcacaggcctcccttcggcccggcgtaagggaggtgaatcgcttgcaaaccatactattaacacccttctcg 3’
3’ ccggactgcgtgtccggagggaagccgggccgcattccctccacttagcgaacgtttggtatgataattgtgggaagagc 5’
Start of gvpC1
5’ ggtacacactaatcccATGAGTGTCACAGACAAACGCGACGAGATGAGTACTG 3’
3’ ccatgtgtgattagggtactcacagtgtctgtttgcgctgctctactcatgac 5’
Figure 6. Halobacterium sp. KBT-1 sequence of gvpA1 gene region. The area between the brackets
indicates an IS sequence. Shaded nucleotides indicate the nucleotides between which the IS sequence
inserted. The underlined sequence on either side of the insertion element are the direct repeats. The direct
repeats result from the insertion element copying the 12 nucleotides located just before the insertion site
and repeating these nucleotides at the end of the IS as it inserts.
forward primer annealing location

A42 Appendix
18. On the HaloWeb genomes page (halo4.umbi.umd.edu), click on Halobacterium NRC-1,
then on the Resources link. Click on the Insertion Sequence elements (IS elements). Based on
the size difference between the sequences listed for questions 16 and 18 (Figures 5 and 6),
which IS element do you predict may have inserted? Note that the length of the IS element as
shown in the chart does not include either direct repeat.

A43 Appendix
Appendix I Primer locations in the gvpA1-gvpN1 gene
region
forward primer:5'agtctgtgggcgggtgagct 3'
5’ atgaaaaactggctgagctcgcgggggaataacacgattccggtgtagtctgtgggcgggtgagctagattgggtgaact 3’
3’ TACTTTTTGACCGACTCGAGCGCCCCCTTATTGTGCTAAGGCCACATCAGACACCCGCCCACTCGATCTAACCCACTTGA 5’
5’ cattacttctctccagtcgatggcggtagagcactcccgactagtaggtgaggctttcttcgcttcacgactgtctaaga 3’
3’ GTAatgaagagaggtcagctaccgccatctcgtgagggctgatcatccactccgaaagaagcgaagtgctgacagattct 5’
end of gvpD1
5’ agctttacactctccgtacttagaagtacgactcattacaggagacataacgactggtgaaaccatacacatccttatgt 3’
3’ tcgaaatgtgagaggcatgaatcttcatgctgagtaatgtcctctgtattgctgaccactttggtatgtgtaggaataca 5’
start of gvpA1
5’ gatgcccgagtatagttagagatgggttaatcccagatcaccaATGGCGCAACCAGATTCTTCAGGCTTGGCAGAAGTCC 3’
3’ ctacgggctcatatcaatctctacccaattagggtctagtggttaccgcgttggtctaagaagtccgaaccgtcttcagg 5’
5’ TTGATCGTGTACTAGACAAAGGTGTCGTTGTGGACGTGTGGGCTCGTGTGTCGCTTGTCGGCATCGAAATCCTGACCGTC 3’
3’ aactagcacatgatctgtttccacagcaacacctgcacacccgagcacacagcgaacagccgtagctttaggactggcag 5’
5’ GAGGCGCGGGTCGTCGCCGCCTCGGTGGACACCTTCCTCCACTACGCAGAAGAAATCGCCAAGATCGAACAAGCCGAACT 3’
3’ ctccgcgcccagcagcggcggagccacctgtggaaggaggtgatgcgtcttctttagcggttctagcttgttcggcttga 5’
end of
gvpA1 5’ TACCGCCGGCGCCGAGGCGGCACCCGAGGCCTGAcgcacaggcctcccttcggcccggcgtaagggaggtgaatcgcttg 3’
3’ atggcggccgcggctccgccgtgggctccggactgcgtgtccggagggaagccgggccgcattccctccacttagcgaac 5’
start of gvpC1
5’ caaaccatactattaacacccttctcgggtacacactaatcccATGAGTGTCACAGACAAACGCGACGAGATGAGTACTG 3’
3’ gtttggtatgataattgtgggaagagcccatgtgtgattagggtactcacagtgtctgtttgcgctgctctactcatgac 5’
5’ CCCGCGATAAGTTCGCAGAATCACAGCAGGAGTTCGAATCATACGCTGACGAGTTTGCAGCCGATATCACGGCAAAGCAA 3’
3’ gggcgctattcaagcgtcttagtgtcgtcctcaagcttagtatgcgactgctcaaacgtcggctatagtgccgtttcgtt 5’
5’ GACGATGTCAGCGACCTTGTCGATGCGATCACCGACTTCCAGGCGGAGATGACCAACACGACGGATGCATTTCACACATA 3’
3’ ctgctacagtcgctggaacagctacgctagtggctgaaggtccgcctctactggttgtgctgcctacgtaaagtgtgtat 5’
5’ TGGTGACGAGTTCGCCGCTGAGGTTGACCACCTCCGTGCCGATATTGACGCCCAGCGGGACGTGATCCGTGAGATGCAGG 3’
3’ accactgctcaagcggcgactccaactggtggaggcacggctataactgcgggtcgccctgcactaggcactctacgtcc 5’
5’ ATGCGTTCGAGGCATATGCTGACATCTTCGCTACAGATATCGCAGACAAACAAGATATCGGCAATCTTCTGGCTGCGATT 3’
3’ tacgcaagctccgtatacgactgtagaagcgatgtctatagcgtctgtttgttctatagccgttagaagaccgacgctaa 5’
5’ GAGGCGCTCCGAACAGAGATGAACTCAACCCACGGGGCATTCGAAGCATATGCGGACGACTTCGCAGCCGATGTCGCTGC 3’
3’ ctccgcgaggcttgtctctacttgagttgggtgccccgtaagcttcgtatacgcctgctgaagcgtcggctacagcgacg 5’
forward primer annealing location
IS Element (ISH2) inserts between these 2 nucleotides

A44 Appendix
5’ GCTCCGTGATATATCTGATCTGGTTGCAGCAATCGACGACTTCCAAGAGGAATTCATCGCCGTGCAGGACGCATTTGACA 3’
3’ cgaggcactatatagactagaccaacgtcgttagctgctgaaggttctccttaagtagcggcacgtcctgcgtaaactgt 5’
5’ ACTACGCTGGTGACTTCGATGCGGAGATCGACCAGCTCCACGCTGCCATCGCTGACCAGCACGACAGCTTCGACGCTACC 3’
3’ tgatgcgaccactgaagctacgcctctagctggtcgaggtgcgacggtagcgactggtcgtgctgtcgaagctgcgatgg 5’
5’ GCGGACGCCTTCGCAGAGTACCGAGATGAGTTCTATCGCATAGAGGTGGAAGCACTGCTTGAGGCGATCAACGACTTCCA 3’
3’ cgcctgcggaagcgtctcatggctctactcaagatagcgtatctccaccttcgtgacgaactccgctagttgctgaaggt 5’
5’ GCAGGACATCGGTGACTTCCGAGCGGAGTTTGAAACGACTGAGGACGCGTTCGTTGCCTTCGCCCGTGACTTCTAgatgg 3’
3’ cgtcctgtagccactgaaggctcgcctcaaactttgctgactcctgcgcaagcaacggaagcgggcactgaagataccgg 5’
5’ ACGAGATCACGGCCGAGGAAGGCGCCGCCGAAGCGGAAGCCGAACCCGTCGAGGCTGACGCGGACGTCGAAGCGGAAGCA 3’
3’ tgctctagtgccggctccttccgcggcggcttcgccttcggcttgggcagctccgactgcgcctgcagcttcgccttcgt 5’
5’ GAAGTCTCTCCAGACGAAGCTGGCGGAGAATCCGCCGGTACCGAGGAAGAAGAGACAGAGCCGGCCGAGGTGGAAACAGC 3’
3’ cttcagagaggtctgcttcgaccgcctcttaggcggccatggctccttcttctctgtctcggccggctccacctttgtcg 5’
5’ GGCTCCAGAAGTAGAGGGGAGTCCTGCGGACACGGCAGACGAAGCGGAAGATACGGAAGCAGAGGAGGAGACAGAGGAAG 3’
3’ ccgaggtcttcatctcccctcaggacgcctgtgccgtctgcttcgccttctatgccttcgtctcctcctctgtctccttc 5’
5’ AGGCACCGGAAGACATGGTGCAGTGCCGGGTGTGCGGCGAATACTATCAGGCCATCACGGAGCCCCATCTCCAGACCCAT 3’
3’ Tccgtggccttctgtaccacgtcacggcccacacgccgcttatgatagtccggtagtgcctcggggtagaggtctgggta 5’
gvpN1
5’ GATATGACGATTCAGGAGTACCGCGACGAGTACGGTGAGGATGTCCCCCTTCGGCCGGATGATAAAACATGAcgaacgag 3’
3’ ctatactgctaagtcctcatggcgctgctcatgccactcctacagggggaagccggcctactattttgtactgcttgctc 5’
5’ tcccgtaaacgcaaggtacgagggtcgcagatccgctcctcacgcggcgacaagaaacaggggcgatcacagagccgtga 3’
3’ agggcatttgcgttccatgctcccagcgtctaggcgaggagtgcgccgctgttctttgtccccgctagtgtctcggcact 5’
Reverse Primer: 5'acggctctgtgatcgcccct 3'
5’ tgataaggagatcgagcgtctcgagaggcagaacgacgctcgtggccaggagtcgtctacccacgtcgacgaggg…
3’ actattcctctagctcgcagagctctccgtcttgctgcgagcaccggtcctcagcagatgggtgcagctgctccc…
reverse primer annealing location

A45 Appendix
Appendix II Glossary
Amino Acid (AA): monomer unit of proteins. Amino acids have the same basic structure with the
exception of a “R group” that is variable. The R group gives each amino acid a different chemical
property.
Amplify: with respect to PCR - the process of making more copies of a specific segment of DNA.
Annealing: attachment by base pairing of one strand of nucleotides to its complementary strand (such
as a DNA primer base pairing with the complementary DNA template).
Antiparallel: a term used to describe DNA strands that run in opposite directions in a double-
stranded molecule.
Archaea: a classification (or Domain) of prokaryotic life distinct from the Eubacteria (commonly known
as bacteria) and higher organisms (Eukaryotes). This domain includes many organisms from extreme
environments, e.g. extreme halophiles (organisms that grow in high-salt environments); methanogens (anaerobes that produce methane); and thermophiles (organisms that thrive in high-temperature
environments).
Bioinformatics: The use of computers and related tools to store, manage, and analyze biological data.
The use of a computer in this way is especially common in molecular biology, genetics, and genomics.
Clones: organisms that are genetically identical.
Codon: a group of three nucleotides in a DNA or RNA polynucleotide chain that, depending upon their
sequence, serves as either a start or stop signal for the translation of a protein, or as a code for a specific
amino acid to be added to the growing polypeptide during translation.
Colony: a visible clonal population of microbial cells on an agar or other surface, resulting from many
generations of cell division of a founder (mother) cell.
Complementary: in DNA, nucleotide sequences which can be joined by base pairing, to form double-
stranded DNA.
Denature: to separate double-stranded DNA into two single strands, usually by heating or
exposure to alkaline conditions.
Deoxyribonucleic acid (DNA): a chemical substance found in all cells, consisting of two
polynucleotide chains forming a double-helix with Watson and Crick pairing of the nucleotide bases.
DNA functions as the hereditary or genetic material of the cell. It contains genetic information stored
as triplet codons.
DNA polymerase: an enzyme, found in all cells, which functions in the replication and repair of DNA.
Domain: one of the three broadest categories of life forms in current biological taxonomy:
Eukaryotes, Eubacteria, and Archaea.
Double helix: the structure of DNA, in which two chains are wrapped around each other like the sides of
a twisted ladder.
DNA ladder: also called a DNA Marker. A sample of DNA containing multiple DNA fragments most of
which increase in size in regular increments. For example, a ladder may have fragments of the following
sizes: 500 bp, 1000 bp, 1500 bp, etc. When the fragments are separated using gel electrophoresis, they
create a banding pattern that resembles a ladder and can be used for measuring the size and quantity of
other DNA fragments on the gel.

A46 Appendix
Electrophoresis: The process by which molecules are separated by size or charge by being drawn
through a matrix by an electric current (e.g. DNA molecules are often separated by size by drawing them
through a matrix formed by agarose).
Eubacteria: the Domain of “true” bacteria. Eubacteria are prokaryotic, single celled microbes and
may have a cell wall made of peptidoglycan.
Eukaryotes: the Domain also referred to as “Eukarya.” These cells have nucleic acid surrounded by a
nuclear membrane, and membrane-bound organelles. The eukaryotic organisms are often, but not always
multi-celled.
Forward primer: a short sequence of DNA designed to amplify a specific genome region. The forward
primer is a composed of sequence from the 5’ end of the coding strand of the sequence you want to
amplify. You need both a forward and a reverse primer to amplify the template DNA.
Gas vesicles (GVs): organelles found in many microorganisms, including the Archaeon,
Halobacterium sp. NRC-1. They consist of a rigid protein structure, filled with ambient gas. These
vesicles give buoyancy to this organism, allowing it to float in the hypersaline aquatic environment
in which it is found and thus giving it access to more oxygen and sunlight.
Gel: for the purposes of this lab, the word refers to the agarose gel used in gel electrophoresis. See
also electrophoresis.
Genome: all of the genetic information contained in one cell.
Genotype: the genetic makeup of an organism, either in total or in terms of one or a few sets of genes.
Halobacterium sp. NRC-1: an extremely halophilic microorganism (an Archaeon) found in extremely
salty environments all over the world. It is used as a model organism for research and teaching.
Halophile: an organism that requires salt concentrations above that found in seawater for optimal
growth. Those that require nearly saturating salinity are called “extreme halophiles.”
Insertion sequences (IS elements): also see transposable element. DNA sequences that insert into the
genome; also known as “jumping genes.” When IS elements insert into a new location of the genome, they cause mutations that can bring about phenotypic change.
Insertion Sequences in Haloarchaea (ISH): Insertion sequences in Haloarchaea, (first identified in
Halobacterium) that commonly insert at certain “hot spots,” such as in the gas vesicle gene
region.Loading dye: pigments and sugars (e.g. sucrose, ficoll, glycerol, etc.) mixed and added to a DNA
sample before it is run on a gel. The pigment makes it easier to see the sample while you are loading and
helps you judge the location of the DNA fragments on the gel. The sugar adds density to the sample so it
sinks to the bottom of the well.
Lysate: the solution/mixture of cell components that results after cells are broken open (lysed).
Lyse: to cause the breaking open of a cell so that that the contents are released and the cell dies (the
breaking open itself is referred to as “lysing.”
mRNA: messenger RNA is a polynucleotide chain of ribonucleotides transcribed from DNA and,
through the process of translation (by ribosomes), used to make proteins.
Mutation: a change in the genetic code. A mutation can result from the addition or removal of one or
more nucleotides into the DNA sequence. These types of mutations are called insertion or deletion mutations respectively. Mutations can also occur if one or more base pairs in the DNA sequence are
changed to a different base pair(s).
Nitrogenous base: one of three components that makes up a nucleotide. The nitrogenous base is called
such because it contains nitrogen. A DNA nucleotide can contain any of four different

A47 Appendix
nitrogenous bases: adenine (A), thymine (T), guanine (G) or cytosine (C). Adenine will pair with thymine
and guanine will pair with cytosine. In RNA, uracil is found in place of thymine.
Nucleotide: any one of the building blocks of DNA (deoxyribonuclotides) or RNA (ribonucleotides). A
nucleotide is composed of a phosphate group, a sugar, and a nitrogen base.
Operon: a group of linked genes or segments of DNA that are transcribed together and often
regulated together.
Phenotype: observable characteristic or trait of an organism, e.g., brown, blue, or green eyes in people,
or colony color or opacity in microorganisms.
Phototrophy: an energy-generating pathway similar to, but distinct from photosynthesis that uses
sunlight and the protein, bacteriorhodopsin. The pathway allows an organism to use sunlight to produce
energy.
Polymer: A chain of monomer units that link together, usually through dehydration synthesis, to make a
longer strand. Proteins, carbohydrates, DNA, and RNA are all polymers.
Polynucleotide: a chain of nucleotides forming a strand of DNA or RNA.
Polymerase Chain Reaction (PCR): a process for amplifying a specific segment of DNA from a few
copies of that DNA. PCR is a powerful tool which simplifies and, in many cases, makes possible, the
manipulation and analysis of specific sequences of DNA.
Precipitate: to cause a dissolved material to come out of a solution or suspension often so that it can be
physically collected at the bottom of a vessel.
Primer: in DNA replication, a short RNA or RNA/DNA fragment which serves to prime DNA synthesis.
DNA polymerase attaches the first nucleotide in DNA synthesis to the primer. In PCR, an artificially
made DNA fragment (oligonucleotide) is used as a primer for DNA synthesis. See also forward primer
and reverse primer.
Protein: a biomolecule made of chains of amino acids. Peptide bonds link the amino acids in the chain.
Proteins can function as enzymes, structural molecules, and signal molecules and can have other
functions as well.
Reverse primer: is the reverse complement of the 3’ end of the coding strand to be amplified by PCR.
See also forward primer.
Ribonucleic Acid (RNA): a chemical substance found in all cells, which is synthesized by using parts of
the DNA sequence in the cell as a template. RNA is synthesized in a process called transcription. One type of RNA, mRNA, is used as a template in translation; other types of RNA serve other functions.
Sectored colony: an occasionally observed colony that contains slivers of microbes with
different phenotypes. The sectors are often reminiscent of slices of a pie.
Transcription: the process of DNA being used as a template to form a new RNA molecule with a
sequence complimentary to the original DNA template. The process is carried out by RNA polymerase.
Translation: the process in which messenger RNA (mRNA) is used to code for the synthesis of an
amino acid chain. This process is carried out by the ribosome which reads the mRNA nucleotides in
groups of three. Each group of three nucleotides is called a codon and designates which amino acid is to
be added to the growing polypeptide chain. Different codons code for different amino acids.
Transposable element: segment of DNA that can either relocate to other areas of a genome, or copy
and insert the copy into other areas of a genome.

A48 Appendix
Appendix III Troubleshooting
A student had a band that is larger or smaller than KBT-1 or NRC-1. For examples of this see Figure 8, lanes 7, 9, and 10 below. Also see the answer to student question 11. If a lane is overloaded it can also alter the apparent mobility of DNA bands in the sample.
The bands are so faint, they are difficult to see. This could be caused by students having very little DNA extracted and thus very little amplified. It may also be a result of the student not getting enough of their sample into the well of the gel.
The bands are very bright and there is a great deal of smearing visible. This is likely caused by loading too much DNA in the lane. Either too much template DNA was added to the PCR reaction, or too much DNA was loaded into the lane. Students may end up with too much template DNA if they used too much halobacterium for their DNA isolation.
Some of my students do not have any band(s) in their gel lane. All of the following are possible explanations for this occurring:
1. Students made a pipetting error when they were setting up their PCR reaction.
2. When the students removed the supernatant (in step 1.14) during the DNA purification, they remove part of the "pellet" at the bottom of the tube. The pellet contains enzymes (nucleases) that can degrade the DNA and other cellular components that could inhibit the PCR reaction. Nuclease activity can especially be a problem if the sample is not chilled sufficiently. Chilling slows the activity of the enzyme.
3. There was a loading error.
Other possible problems as illustrated in figure 8:
* Lanes 2 and 3 show bands amplified from NCR-1 and KBT-1 respectively.
I Lanes 4, 6, 8 appear empty. Suggesting that either the student did not successfully load the lane, or that their PCR reaction did not work.
* Lane 11 is empty, but the two bands in the adjacent lane 10 suggest the possibility that lane 10 is double loaded and one student loaded the wrong lane. Two bands may also be seen if the student who
loaded lane 10 picked a sectored colony.
* In lane 12, there is a faint band above the main band, the most likely causes of this are a student
picking and amplifying DNA from a sectored colony in which cells with a red phenotype are not numerous, or contamination of the PCR reaction.
* Lanes 5, 7, 9, 10, and to a certain extent, lane 12 all have too much DNA loaded in them. Overloading
allows you to see the smearing and the background bands that you see in the majority of these lanes. It also causes smearing of predominant bands.
Figure 8. Shows some possible student mistakes that can occur in the classroom. Photo by Jolene Hund, Emporia State
University.

A49 Appendix
Appendix IV Sample Class Gel Image
ane
1 2 3 4 5 6 7:
Figure 9. A sample class gel image with DNA marker, Halobacterium sp. NRC-1, KBT-1
and unknown mutant. PCR products for sample class gel provided by Shawnee Mission West Biotechnology Students, Overland Park,
KS.
Lane 1: 1 kb DNA ladder (DNA marker)
Lane 2: Halobacterium sp. NRC-1
Lane 3: Halobacterium sp. KBT-1
Lane 4: Halobacterium sp. NRC-1
Lane 5: an unknown red mutant containing an insertion sequence larger than KBT-1
yet still found within the region amplified by the primers in this kit.
Lane 6: Halobacterium sp. KBT-1
Lane 7: Halobacterium sp. NRC-1

A50 Appendix
Appendix V Class Data Chart
Student name: Colony color: Approximate size of PCR band(s) in
base pairs amplified in your sample:

A51 Appendix
Appendix VI Staining With GelGreen™
Note: View and photograph gels stained with Gel Green within an hour or two of staining. If
left in solution longer, the bands begin to diffuse and are not as sharp. If bands are faint, diffusion can make them even more difficult or impossible to see.
Storage and Handling: Store the 10,000X aqueous solution in the dark at room temperature. The 3X working solutions should also be stored in the dark at room temperature and is good for at least one year. If precipitation of the dye occurs, heat the solution in a
45–55°C water bath for two minutes and/or vortex.
Safety Information: While studies by the manufacturer and independent labs have shown GelGreen™ to be nonmutagenic, noncytotoxic, and unable to cross the cell membrane barrier, as is prudent when using any chemical in the classroom, it is suggested that caution be used and gloves and any other required personal protective equipment be worn when handling this stain. The appropriate orange filter or orange safety goggles should be kept between the viewer's eyes and blue light when viewing the gel.
Staining Protocols:
1. To make the needed volume of 3X staining solution, dilute the GelGreen™ 10,000X stock solution ~3,300 times in 0.1 M NaCl.
Mix: 15 uL GelGreen 10,000X stock solution
5 mL 1 M NaCl
45 mL water
2. Place the gel in a suitable polypropylene container or staining tray and add just enough of the 3X staining solution to cover the gel.
3. Soak the gel for 30 minutes with constant, gentle agitation, if possible. If constant, gentle agitation is not possible, agitate every 5-10 minutes by hand.
Viewing and Photographing the Gel 1. Because GelGreen has a UV absorption peak between 250 nm and 300 nm and a stronger adsorption peak around 500 nm, it can be visualized with either a 254-nm UV transilluminator or a "blue light" transilluminator.
2. Photograph the gel using any suitable imaging equipment. Use a long path green filter such as a SYBR** filter or GelStar** filter for photography. Note: Some "blue light" transilluminators incorporate filters appropriate for photography. The stain's peak emission occurs between approximately 500 and 550 nm.
GelGreen and its uses are covered by pending US and international patents.
**SYBR is a registered trademark of Molecular Probes Inc. and GelStar is a registered trademark of FMC.

A52 Appendix
Appendix VII Staining with CarolinaBLU™
Adding CarolinaBLU™ to the gel and buffer allows you to faintly see many of the bands in the gel while the gel is running. This can be instructive for the student, as they can actually see the bands
move through the gel. However, be aware, you will still have to use the final stain to see all of the
bands clearly.
Stain can be added using the dropper bottle. Alternatively, if a calibrated pipette
is available, the lid of the dropper bottle can be removed for quicker addition of
larger volumes.
While CarolinaBLU™ is not toxic, we recommend that students wear gloves
to prevent staining of skin.
Step 1: Addition of CarolinaBLU™ to Agarose
The dropper bottle provided delivers 40 uL/drop.
A. In a beaker, prepare the agarose solution required. Cool the molten agarose to about 60°C
by placing the beaker in a 60°C water bath or allowing it to stand at room temperature for
several minutes. Swirl the beaker occasionally so that the agarose will cool evenly throughout. The quantity of stain to add to the agarose and the buffer depends on the voltage
used for electrophoresis. At voltages less than 50, a slightly lower concentration is used than
at voltages greater than 50. Refer to the following chart:
Voltage Agarose Volume Stain Volume *
<50 volts 30 mL 40 uL 50 mL 70 uL (1 drop) 400 mL 533 uL(8 drops) >50 volts 50 mL 70 uL (1 drop) 400 mL 640 uL(9 drops)
B. After you add the stain to the agarose, swirl to mix and then pour the gel immediately. Gels
can be prepared 1 day ahead of the lab day, if necessary. Gels stored longer than 1 day tend to
fade and lose their ability to stain bands during electrophoresis. Store the gels covered (in a
plastic bag or plastic container with a lid) with a small amount of buffer (leave the masking tape or dam in place).
Alternatively, store them covered with buffer in the gel box. Do not use more stain than
recommended in your gel. This leads to precipitation of the DNA in the wells and/or
aggregation of DNA to form artificial bands in the gel.
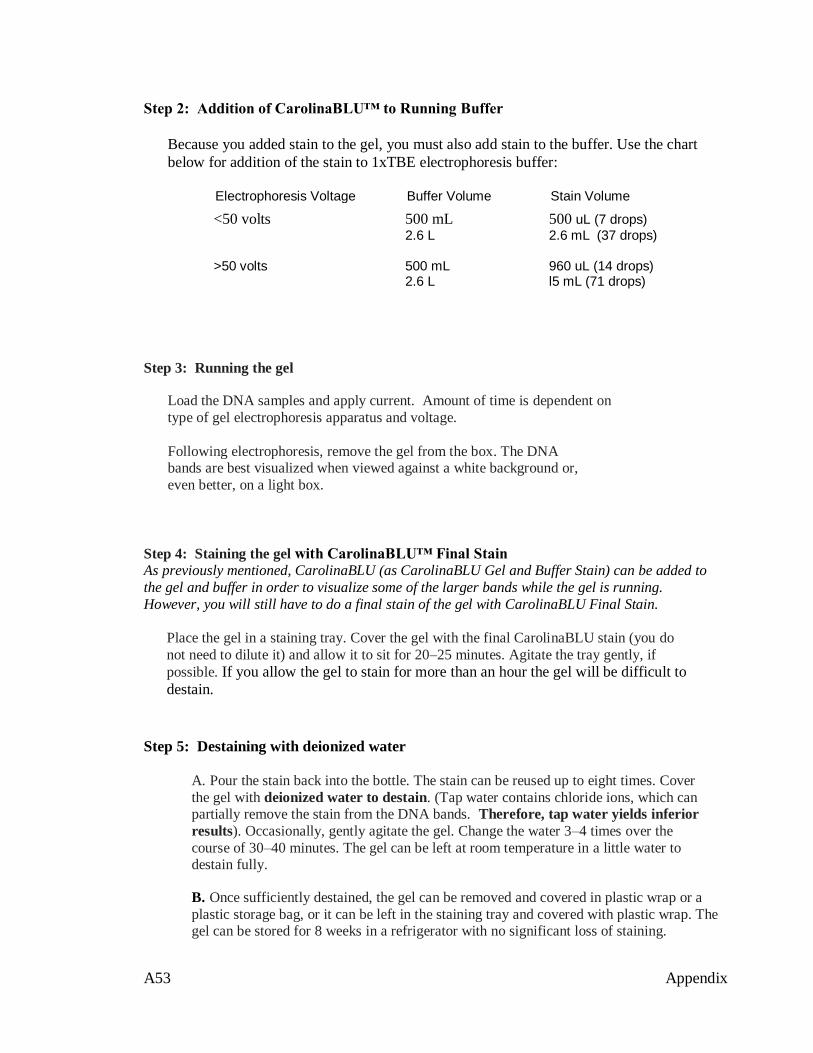
A53 Appendix
Step 2: Addition of CarolinaBLU™ to Running Buffer
Because you added stain to the gel, you must also add stain to the buffer. Use the chart
below for addition of the stain to 1xTBE electrophoresis buffer:
Electrophoresis Voltage Buffer Volume Stain Volume
Step 3: Running the gel
Load the DNA samples and apply current. Amount of time is dependent on
type of gel electrophoresis apparatus and voltage.
Following electrophoresis, remove the gel from the box. The DNA bands are best visualized when viewed against a white background or,
even better, on a light box.
Step 4: Staining the gel with CarolinaBLU™ Final Stain As previously mentioned, CarolinaBLU (as CarolinaBLU Gel and Buffer Stain) can be added to
the gel and buffer in order to visualize some of the larger bands while the gel is running.
However, you will still have to do a final stain of the gel with CarolinaBLU Final Stain.
Step 5: Destaining with deionized water A. Pour the stain back into the bottle. The stain can be reused up to eight times. Cover
the gel with deionized water to destain. (Tap water contains chloride ions, which can partially remove the stain from the DNA bands. Therefore, tap water yields inferior
results). Occasionally, gently agitate the gel. Change the water 3–4 times over the
course of 30–40 minutes. The gel can be left at room temperature in a little water to destain fully.
B. Once sufficiently destained, the gel can be removed and covered in plastic wrap or a
plastic storage bag, or it can be left in the staining tray and covered with plastic wrap. The gel can be stored for 8 weeks in a refrigerator with no significant loss of staining.
<50 volts 500 mL 500 uL (7 drops)
2.6 L 2.6 mL (37 drops) >50 volts 500 mL 960 uL (14 drops) 2.6 L l5 mL (71 drops)
Place the gel in a staining tray. Cover the gel with the final CarolinaBLU stain (you do
not need to dilute it) and allow it to sit for 20–25 minutes. Agitate the tray gently, if
possible. If you allow the gel to stain for more than an hour the gel will be difficult to
destain.

A54 Appendix
Step 6: Viewing and Photographing Gels with CarolinaBLU™
Transillumination, in which light passes up through the gel, gives superior viewing of gels
stained with CarolinaBLU™. White light tranilluminators are available from Carolina.
Alternatively, a fluorescent light box for viewing slides and negatives provides ideal
illumination for blue-stained gels. An overhead projector may also be used. Cover the surface
of the light box or projector with plastic wrap to keep liquid off the apparatus. An instant or
digital camera can be used to photograph the gels

A55 Appendix
Appendix B: Solicitation Email to Potential Field Trial Teachers
Hello,
I am a graduate student at Emporia State University, working on my master’s degree in biology. I taught biology and AP biology for a number of years before taking sabbatical. As part of my
thesis research, my advisor and I developed a new lab that would be appropriate for use in AP
Biology classes. We are looking for AP teachers to test this lab and give us feedback. This lab has
been formatted as a kit that utilizes Halobacterium sp. NRC-1 which is an Archaean and extreme halophile, making it ideal to use in high schools.
We call the kit, “The Genotype-Phenotype Connection: Basic Molecular Genetics and
Bioinformatics Skills.” It covers the following concepts as a hands-on lab that takes the students
through the process from organism to gel electrophoresis image analysis:
Archaeon lifestyles DNA structure (review) Gas vesicle organelles (structure and function) Colony morphology Phenotype/Genotype connection Bioinformatics Transposons (Insertion Elements) Gel electrophoresis Polymerase Chain Reaction (PCR)/primers
The development of the kit was the first part of my research. Part 2 involves AP Biology teachers
conducting a field trial of the kit.
We are in need of AP Bio teachers to try this kit out with their students Fall 2012 (with all
components completed by October 10, 2012). I realize that with the changing AP Framework, this does not come at a very convenient time, however if you are willing (and chosen to
participate after filling out the eligibility survey – see attached), this kit will be provided free of
charge to you for use this fall with your students. I would also provide my email and cell phone to you if you require any “technical support” while preparing and using the kit.
I am excited to have teachers try this kit because it takes students from the entire organism (a colony on a petri dish) through the process of DNA extraction, all the way to PCR and gel
electrophoresis. Students will be able to link the gel image (genotype) to the phenotype of the
colony they selected. I found that while teaching AP Biology, so many kits were compartmentalized into their specific topic and the idea of the “whole organism” was lost.
If you are interested, please check out the attachment for more details as well as a link to the online eligibility survey. It would be great to have you participate!
Thank you! Kelley Tuel MS Biology Degree Candidate Emporia State University
attachment: field trial details and timeline

A56 Appendix
Field Trial Details and Timeline
If chosen to participate based on your online eligibility survey (link below), you would receive
the kit materials and agree to follow the kit directions to facilitate it with your students, completed by October 10, 2012.
Time line:
Spring 2012
April – Teacher eligibility online survey completed (10 minutes)
May – Teachers notified if they were selected to be in test group. Project information sheet given to teachers to share with their administration/district.
Summer 2012 August – Participating teachers contacted to set up kit shipping date and confirm
study participation. “Informed consent document” emailed to teachers for
student and teacher to fill out.
Fall 2012 (At your own pace, completing prior to Oct. 10)
Before lab: 1. Teachers complete class logistical survey prior to kit administration (<10
minutes).
2. Confirm that all students have completed the “informed consent document” prior to participation and that your administration/district
knows of your participation.
During lab: Teachers facilitate kit pre-labs, homework and labs (based on ~50 minute class
periods, can be combined for block periods):
Day 1: Pre-test of concepts by taking multiple choice pre-test (10 minutes).
Begin “background reading” found within the kit and discussion (it’s a
great review!) and assign any reading not completed as student homework.
Day 2:
Complete “pre-lab 1” (as class or in computer lab) with discussion of
bioinformatics and time for students to explore website attributes. Day 3:
Determination of Colony Phenotype and Cell Lysis/DNA Extraction.
Student homework: complete “pre-lab 2” (PCR tutorial online, 10 minutes or less).
Day 4:
PCR activity (teacher aliquots material prior to class) (~25 minutes, plus
~55 minutes thermal cycler running time). Optional homework: depending on student experience, you may assign “pre-lab 3” (how to
load gels).

A57 Appendix
Day 5:
Gel Electrophoresis activity (teacher dilutes buffer and pours gel prior to class). Time for additional class work while gel running.
Day 6:
Data Comparison and Analysis (~25 minutes).
After lab completed:
1. Teachers complete kit evaluation and write additional
comments/suggestions (~15 minutes) 2. Students complete multiple choice “post-test” of concepts with additional
comments (15 minutes)
3. Teacher mails back class logistical survey, teacher evaluation and student “pre/post tests” in postage pre-paid envelope.
Depending on the number of teachers that respond, not everyone will be able to participate in the study. However, if you agree to the timeline and are interested in being in the pool of teachers
participating in this study (selection of teacher participants will be made depending on amount of
returned surveys and responses to get an appropriate test group), please click on the following
link to fill out an anonymous eligibility survey. Your email will be the only personal
information required at this time so that I can contact you to inform you if you are selected or not.
http://www.zoomerang.com/Survey/WEB22FECYD9U9S
Please complete the survey by May 5 (Cinco de Mayo!) so all surveys can be evaluated and I inform participants before the end of the school year.
I am very excited about this research and would be thrilled to have you participate. Thank you in advance! If you have any further questions about what your participation would entail, please
feel free to contact me.
Thank you! Kelley Tuel
MS Biology Degree Candidate
Emporia State University [email protected]
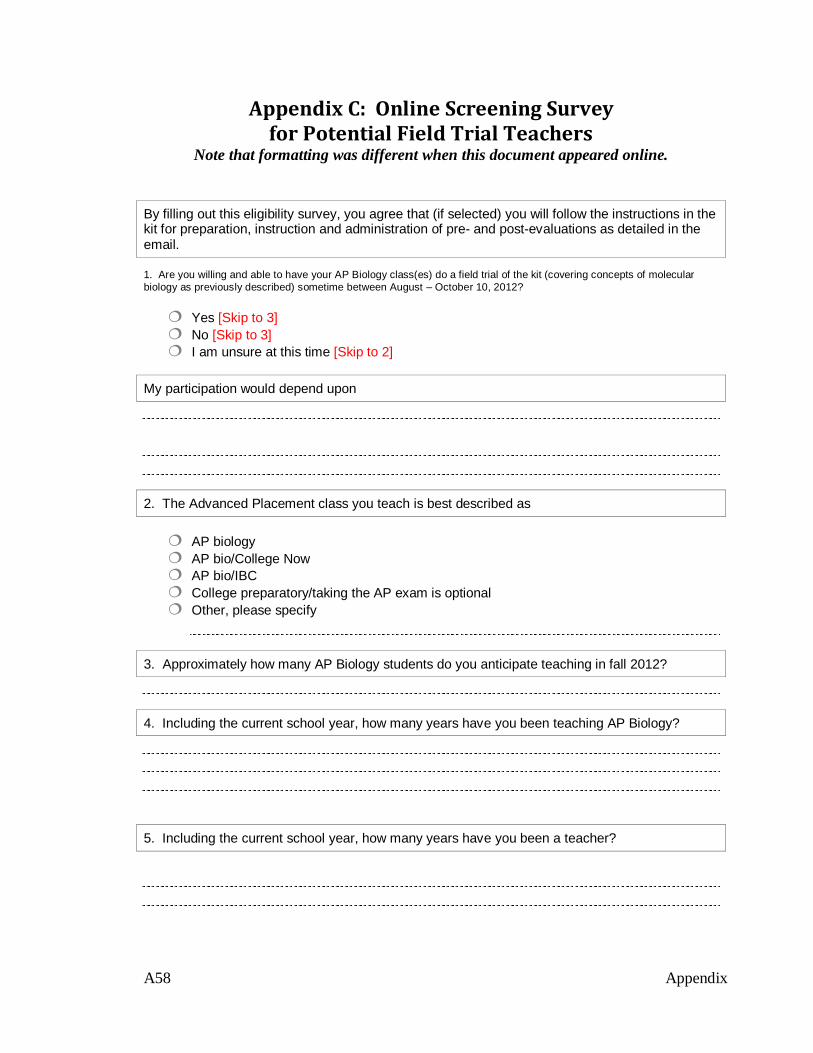
A58 Appendix
Appendix C: Online Screening Survey for Potential Field Trial Teachers
Note that formatting was different when this document appeared online.
By filling out this eligibility survey, you agree that (if selected) you will follow the instructions in the kit for preparation, instruction and administration of pre- and post-evaluations as detailed in the email.
1. Are you willing and able to have your AP Biology class(es) do a field trial of the kit (covering concepts of molecular
biology as previously described) sometime between August – October 10, 2012?
Yes [Skip to 3]
No [Skip to 3]
I am unsure at this time [Skip to 2]
My participation would depend upon
2. The Advanced Placement class you teach is best described as
AP biology
AP bio/College Now
AP bio/IBC
College preparatory/taking the AP exam is optional
Other, please specify
3. Approximately how many AP Biology students do you anticipate teaching in fall 2012?
4. Including the current school year, how many years have you been teaching AP Biology?
5. Including the current school year, how many years have you been a teacher?
A59 Appendix
6. What is your highest degree?
B.S./B.A.
M.S./M.A.
Ed.S.
Ph.D./Ed.D.
7. What textbook does your AP Biology class use?
Title ________________________________________________________________
Description (example: green/7th edition) _____________________________________
Author _______________________________________________________________
Publisher ____________________________________________________________
8. As it reads on your teaching certificate, what are you certified to teach? (check all that apply)
Agriculture
Biology
Chemistry
Earth and Space Science
General Science
Enter an answer
Other, please specify
9. How many students attend your school?
10. Your school is best described as
Public high school
Private, secular (non-religious)
Private, religion affiliated
Enter an answer
Other, please specify
11. Does your school have access to a thermocycler (“PCR Machine”) for your use?
Yes
No (answering no does not automatically exclude you from the trial. We may have one you could borrow)

A60 Appendix
12. Your training in molecular biology laboratory techniques has most effectively come from
Undergraduate coursework
Graduate coursework
Local/district workshops/training
State workshops/training (KATS, KABT, etc.)
Laboratory experience in industry
AP Biology Training workshops
Specialty clinics for molecular biology labs
Other (please specify): _________________________________________________________
The following questions refer to your AP Biology classroom only: 13. How do you cover the topic of Bioinformatics in your AP Biology classroom (BLAST, sequence alignments done on the computer, using NCBI for primer design, etc.)? Check all that apply.
I do not cover
Computer analysis with wet lab
As a simulated lab or on computer
In lecture/conceptually
14. How do you cover the topic of Transposons in your AP Biology classroom (Insertion Sequences, Insertion Elements, Transposable Genetic Elements, etc.)? Check all that apply.
I do not cover
As a wet lab
As a simulated lab
In lecture/conceptually
15. How do you cover the topic of PCR (Polymerase Chain Reaction) in your AP Biology classroom? Check all that apply.
I do not cover
As a wet lab
As a simulated lab
In lecture/conceptually
16. How do you cover the topic of Gel Electrophoresis in your AP Biology classroom? Check all that apply.
I do not cover
As a wet lab
As a simulated lab
In lecture/conceptually

A61 Appendix
17. How do you cover the topic of Microbiology Techniques (aseptic technique, plating, etc.) in your AP Biology classroom? Check all that apply.
I do not cover
As a wet lab
As a simulated lab
In lecture/conceptually
18. How do you cover the topic of Archaeon lifestyles (Archaea domain) in your AP Biology classroom? Check all that apply.
I do not cover
As a wet lab
As a simulated lab
In lecture/conceptually
19. Rank your students’ difficulty grasping the following concepts:
Great difficulty Moderate difficulty Some difficulty Slight difficulty No difficulty N / A
Transposons (Insertion sequences/IS elements/Transposable genetic elements, etc. )
PCR/primers (annealing, extension 5’ to 3’, etc.)
Bioinformatics (sequence alignment using NCBI, BLAST, etc.)
A r c h a e a a n d d o m a i n s o f l i f e

A62 Appendix
20. Rate your comfort level teaching these biology laboratory skills:
Very uncomfortable Slightly uncomfortable N e u t r a l Somewhat comfortable Very comfortable
C o l o n y m o r p h o l o g y
P C R
G e l e l e c t r o p h o r e s i s
D N A e x t r a c t i o n
M i c r o b i o l o g y t e c h n i q u e
I n s e r t i o n s e q u e n c e s / I S e l e m e n t s
E n t e r a n a n s w e r
21. Rate your satisfaction with labs you have previously used that cover these techniques:
Very uncomfortable Slightly uncomfortable N e u t r a l Som ewhat comfortable Very comfortable
C o l o n y m o r p h o l o g y
PCR/primers (annealing, extension 5’ to 3’, etc.)
G e l e l e c t r o p h o r e s i s
D N A e x t r a c t i o n
M i c r o b i o l o g y t e c h n i q u e
Insertion sequences/IS elements

A63 Appendix
22. What email address is best to contact you for correspondence pertaining to this kit? Note: I will only use this email for contact concerning the field trial of the kit. I respect your need for confidentiality. As the researcher, I will know which teacher/school the information is coming from (so that I can correlate all the data to that teacher/school and so I can ship you the kit). However, all analyses will be written confidentially, referring to teacher/school by number. I am the only one that will know which teacher/school participated and your responses.
Email address:
Thank you for your participation! I will contact you mid-May (at the email address you provided) to inform you if you are selected to be in the field trial participation group. Kelley Tuel [email protected]

A64 Appendix
Appendix D: Sample of Individualized Suggested Field Trial “Lesson Plan”
This school has 51 minute class periods 4 days a week and a double/block period 1 day
a week.
Teacher instructions:
Copy PRIOR TO day 1 (for each student):
Student background information (in student section of manual)
Student section of manual: protocols, etc.. This includes pre-labs, activities &
student questions.
Items in grey can be completed as homework assignment OR in class.
Suggested Lesson Plans:
Day 1:
1. Pre-test of concepts by (10-12 minutes).
Make sure you pre-test BEFORE they read the “background” from the student
section in the teacher’s manual.
2. Homework: “Background”
assign reading student homework with discussion next time.
Day 2:
1. Have “Background" discussion. ~10-15 minutes. I like to use pink balloons to
explain the gas vesicle concepts. I’ll bring some for you when I bring the
Thermal Cycler.
2. “Pre-lab 1” ~30 minutes
(as class on big computer screen or on student laptops) with discussion of
bioinformatics. I would only do steps 1-12 of Pre-lab 1 in class. However, if
they are really into it and got that far quickly, feel free to give them time to
continue all of the pre-lab.
3. Homework: if you didn’t get all the way through the pre-lab, assign it as
homework (since your kids are brighter than most, I’d love their feedback if they
understood how to do steps 13-15. They’ll need to repeat a little bit of the
previous steps to get the sequence on their home computers, but I think your kids
will be able to do this just fine.
Day 3 (double class period):

A65 Appendix
1. “Activity 1: Determination of Colony Phenotype and Cell Lysis/DNA
Extraction”.
Allow ~35 minutes for this. On Activity 1, procedure 1.5, notice the red colonies
are translucent, the pink colonies are opaque.
Keep the extract (which will be your DNA template for PCR) on ice until needed
for “Activity 2”.
2. “Activity 2: PCR” (~20 minutes for students to put reactants into PCR tubes).
Have students load their samples in the thermal cycler AND you start it right after
they have loaded their samples.
Thermal cycler will run for 53 minutes-65 minutes (depends on heating up
between cycle time).
When program is complete, place samples into the fridge until tomorrow.
3. Students prep the buffer & gels for tomorrow: Your kids are so good, you could
have them dilute the buffer and make/pour the gels! If you want to, you could do
it instead of them Wednesday prior to class.
4. Student homework (or do in class if you don’t want them to do the buffer/gel
prep): complete “pre-lab 2” (PCR tutorial online, 10 minutes or less). That way,
they know what is going in the thermal cycler while they are gone!
5. Optional homework, depending on student experience: complete “pre-lab 3” (how
to load gels, 5-10 minutes).
Day 4:
1. “Activity 3: Gel Electrophoresis”. Hopefully, you have some gel chambers that
are more efficient than when I was there – they used to take overnight!! UGH!
2. Time for additional class work (moving on to another chapter, working on kit
student analysis questions, etc.) while gel running.
3. If they haven’t seen a gel run before, it’s kind of neat to take a peak every 10 min
or so to see the progress.
4. If gel only takes an hour (newer gel chambers than when I was there), put gels
into gel trays and cover with buffer. Slide gel tray (with buffer & gel) into Ziploc
and seal. Store in fridge overnight.
A66 Appendix
Day 5:
1. Gel staining and destaining.
2. If you have a digital camera, take a picture! – if you can, please send me the
digital image!!!
3. “Activity 4: Data Comparison and Analysis”. Depending on how long the
staining takes, you may or may not get to the first questions of this (graphing).
4. Homework idea?? If you get the gel stained & photographed, it would be nice to
email them a digital copy of the gel (or print out a hard copy for each student), so
they could go home and attempt to graph, determining the approximate bp of their
fragment. You can choose to have them do this on Excel or with pencil on semi-
log paper. It would be a good way to see how good they are at graphing on their
own!
Day 6:
1. Complete “Activity 4: Data Comparison and Analysis”.
2. Discuss results and wrap-up.
3. EITHER today OR Monday: “Post-test” for students, last 15-18 minutes of class
(12 minutes timed for post-test, additional 3+ minutes for their open-ended
comments).

A67 Appendix
Appendix E: Student Field Trial PRE and POST-Tests
Directions: Please place the letter of the correct answer on the line provide. Write all
letters in CAPITAL letters. You will have 12 minutes to complete the “test”. Because this
field trial is interested in which answer you choose, do not guess. If you do not know an
answer, select the option “I do not know” (if that is a choice).
1. Match the following components of PCR with their function. Write your answer in capital letters on
the lines provided.
Component: Function:
____DNA A. provides appropriate reaction conditions
____DNA polymerase B. define the 3’ and 5’ end of the replicon
____primers C. enzyme that carries out extension of DNA
____nucleotide D. the “raw material” added to create a new DNA
molecule
____buffer E. template for PCR
2. ____ A Polymerase Chain Reaction goes through several cycles of temperature changes. What
occurs during the annealing stage?
A. DNA strands are heated and separate from one another.
B. the primers attach to the targeted DNA.
C. the targeted sequence of the DNA in your sample is replicated.
D. All of the above are correct.
E. None of the above are correct.
F. I do not know.
3. ____ Which of the following gel electrophoresis images would correctly show the band labeled “X” as the larger DNA fragment?
Negative electrode is positioned on top of each image.
A. B. C. D. E. I do
not
know
Positive electrode is positioned at the bottom of each image.
X
Y
Z
Y
X
Z
Z
Y
X
Z
Y
X
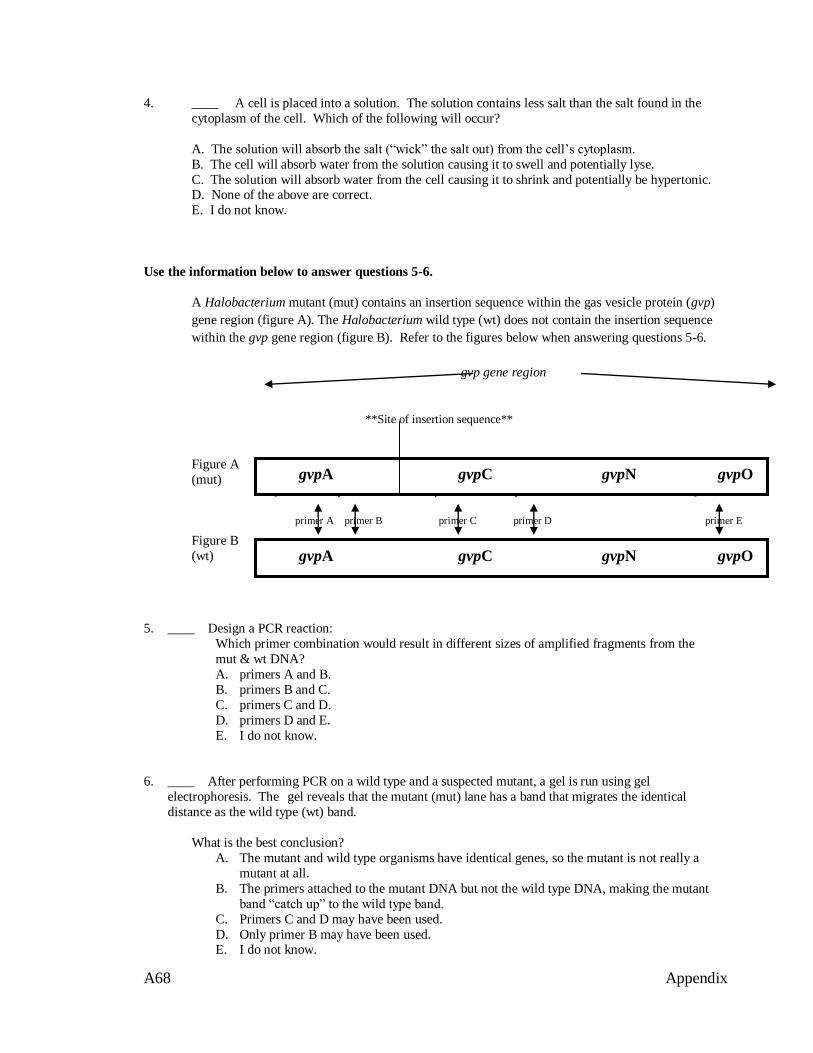
A68 Appendix
primer A primer B primer C primer D primer E
4. ____ A cell is placed into a solution. The solution contains less salt than the salt found in the
cytoplasm of the cell. Which of the following will occur?
A. The solution will absorb the salt (“wick” the salt out) from the cell’s cytoplasm.
B. The cell will absorb water from the solution causing it to swell and potentially lyse.
C. The solution will absorb water from the cell causing it to shrink and potentially be hypertonic. D. None of the above are correct.
E. I do not know.
Use the information below to answer questions 5-6.
A Halobacterium mutant (mut) contains an insertion sequence within the gas vesicle protein (gvp)
gene region (figure A). The Halobacterium wild type (wt) does not contain the insertion sequence
within the gvp gene region (figure B). Refer to the figures below when answering questions 5-6.
gvp gene region
Figure A
(mut)
Figure B
(wt)
5. ____ Design a PCR reaction:
Which primer combination would result in different sizes of amplified fragments from the
mut & wt DNA?
A. primers A and B.
B. primers B and C.
C. primers C and D.
D. primers D and E.
E. I do not know.
6. ____ After performing PCR on a wild type and a suspected mutant, a gel is run using gel
electrophoresis. The gel reveals that the mutant (mut) lane has a band that migrates the identical
distance as the wild type (wt) band.
What is the best conclusion?
A. The mutant and wild type organisms have identical genes, so the mutant is not really a
mutant at all.
B. The primers attached to the mutant DNA but not the wild type DNA, making the mutant
band “catch up” to the wild type band.
C. Primers C and D may have been used.
D. Only primer B may have been used. E. I do not know.
gvpA gvpC gvpN gvpO
gvpA gvpC gvpN gvpO
**Site of insertion sequence**
primer A primer B primer C primer D primer E

A69 Appendix
7. ____ Neurofibromatosis (NF) is a human autosomal dominant disorder. Patients with NF develop
numerous small tumors on the skin and within the body caused by a defect in neurofibromin. The
neurofibromin gene of an affected patient is approximately 6000 base pairs longer than the normal
neurofibromin gene. Additionally, the mutant gene appears to be out of reading frame because the
amino acid sequence only matches the normal protein for a short stretch at the beginning of the
sequence. Which conclusion explains the cause of the longer gene of NF affected patients?
A. Additional telomeres
B. A polygenic trait
C. A defect in polymerase during transcription
D. An insertion sequence
E. I do not know.
8. ____ Which of the following statements is unique to the domain Archaea?
A. Often lives in extreme environments. Single-cellular organisms.
B. Lives in aqueous environments. Multi-cellular or single celled organisms.
C. Contains cell membranes and nuclear envelope. Multi-cellular or single celled organisms.
D. Can contain cell walls or cell membranes but not both. Does not have a true nucleus.
E. I do not know.
9. Short Answer.
a) Briefly explain one cause of a gene disruption.
__________________________________________________________________________________
b) Explain the effects of that gene disruption.
__________________________________________________________________________________
__________________________________________________________________________________
10. Short Answer.
What might be an evolutionary advantage of a genome that contains transposable elements?
__________________________________________________________________________________
__________________________________________________________________________________
__________________________________________________________________________________
A70 Appendix
POST-Test Additional Questions
Please give me specific feedback regarding “The Genotype – Phenotype Connection:
Molecular Genetics and Basic Bioinformatics Skills” kit.
I would love to have your thoughts about the various lab activities, the pre-labs, the
background information and the Student Analysis and Follow-up Questions (good or
bad):
_______________________________________________________________________________
_______________________________________________________________________________
_______________________________________________________________________________
_______________________________________________________________________________
Thank you for your participation!

A71 Appendix
Appendix F: Teacher Post-kit Evaluation
Please complete the following questions at the conclusion of all lab components with your students. Please
remember that all of your responses will be reported anonymously. Any comments you make will help me interpret your experience.
1. Rate your satisfaction with this kit as a teaching tool for each of the following concepts as they
were presented in the kit:
5=strongly satisfied 4=mostly satisfied 3=neither satisfied nor dissatisfied 2=slightly dissatisfied 1= strongly
dissatisfied
Colony morphology 5 4 3 2 1
PCR 5 4 3 2 1
Gel electrophoresis 5 4 3 2 1
DNA extraction 5 4 3 2 1
Sterile technique 5 4 3 2 1
Insertion sequences/IS elements 5 4 3 2 1
Comments:
2. During this field trial, you were given a “timeline” of what kit sections to cover. Please indicate
the level you were able to execute each section.
5=covered it as kit directions indicated 3=skimmed or touched on as a group 1=did not cover
Background reading 5 3 1
Pre-lab 1: Bioinformatics 5 3 1
Activity 1: Determination of colony phenotype 5 3 1
Activity 1: Cell lysis/DNA extraction 5 3 1
Pre-lab 2: PCR tutorial 5 3 1
Activity 2: PCR 5 3 1
Pre-lab 3: how to load gels 5 3 1
Activity 3: Gel electrophoresis 5 3 1
Activity 4: Data comparison & analysis 5 3 1
Comments:

A72 Appendix
3. The topics covered in this kit helped you meet your course objectives.
___Strongly agree
___Agree
___Disagree
___Strongly disagree ___No opinion
Comments:
4. The kit information and activities were presented to the students at an appropriate level.
___Strongly agree
___Agree
___Disagree ___Strongly disagree
___No opinion
Comments:
5. When you received the kit materials, they were packaged so that it was clear how to store supplies
until use.
___Strongly agree
___Agree
___Disagree
___Strongly disagree
___No opinion
Comments:
6. The information provided in the teacher guide was clearly stated, containing all necessary information.
___Strongly agree
___Agree
___Disagree
___Strongly disagree
___No opinion
Comments:
Would you make any changes to the teacher guide information? If so, what changes would you
make?

A73 Appendix
7. After reading the teacher instructions (teacher guide), how comfortable were you to prepare the
lab materials (pour gels, aliquot primer mix, stain the gels, etc.) for your students?
___Very comfortable
___Somewhat comfortable
___Neutral ___Slightly uncomfortable
___Very uncomfortable
___None of the above. I did not read the teacher guide.
Comments:
8. The time requirement for the various lab sections (as listed in the teacher guide) was reasonably
accurate.
___Strongly agree
___Agree
___Disagree
___Strongly disagree
___No opinion
Comments:
9. The instructions/protocols provided in the student guide was clearly stated, containing all
necessary information.
___Strongly agree
___Agree
___Disagree
___Strongly disagree
___No opinion
Comments:
10. Rate your students’ difficulty grasping these techniques as presented in the kit:
5=great difficulty 4=moderate difficulty 3=some difficulty 2=slight difficulty 1= no difficulty
Colony morphology 5 4 3 2 1
PCR 5 4 3 2 1
Gel electrophoresis 5 4 3 2 1
DNA extraction 5 4 3 2 1
Sterile technique 5 4 3 2 1
Insertion sequences/IS elements 5 4 3 2 1
Comments:
A74 Appendix
11. How did you use the student analysis questions (check all that apply)?
___Students completed individually, assigned as homework or self-check.
___Assigned for small groups/partners to discuss and work on.
___Not assigned formally, but used for class discussion.
___Used to occupy students while they were waiting to load gel, etc.
___As test questions following the lab.
___I assigned all of them EXCEPT the Challenge Questions.
___I did not use any of them.
___I omitted a few of the regular level (non-challenge) questions. Please state which were
omitted and your reasons:
Comments:
12. The descriptive information in the kit (background and within each activity) was sufficient for
students to answer the student analysis questions.
___Strongly agree
___Agree
___Disagree
___Strongly disagree
___No opinion
Comments:
13. Please briefly answer to following questions to help me define your experience with the
“Genotype-Phenotype Connection” kit:
a) What portion(s) of the lab went well?
b) Did anything go wrong? Explain.
c) Where there any substitutions or alterations you had to make? If so, why?

A75 Appendix
d) What would you change about this lab?
e) Describe any additional information or section(s) that you think are needed to aid in:
classroom management
materials management
facilitating of the lab activities
other
Thank you for your participation in this field
study!

A76 Appendix
Appendix G: Informed Consent Document For field trial of “Genotype-Phenotype Connection” teaching kit
Your student’s AP biology classroom has been chosen to participate in a field trial of a
newly developed teaching kit to enhance their laboratory experience. Not only will your
student experience cutting edge laboratory techniques in their AP classroom, but they
will also be participating in real science as subjects in a research project for a thesis at
Emporia State University.
Purpose of study
To have AP biology classrooms experience and evaluate the “Genotype-Phenotype
Connection” molecular biology laboratory kit.
Description of participation
All of the laboratory activities within the kit (colony exploration, DNA extraction,
Polymerase Chain Reaction, gel electrophoresis and analysis) will be facilitated by your
student’s AP Biology teacher as per the instructions within the kit. This will be done as
part of their classroom experience and, other than a possible homework assignment, will
not extend beyond classroom time.
The students will use the safe microbe Halobacterium sp. NRC-1 which is similar to
bacteria, but technically a halophilic Achaean (it is only viable when grown with
extremely salty conditions). They will view colony differences of the wild type and
mutant varieties on a Petri dish. Students will then extract DNA from their chosen
colony and perform PCR and gel electrophoresis. The resulting gel image will be
compared to the data collected by classmates to determine the genetics involved in their
colony. Bioinformatics (computer gene analysis of Halobacterium) will also be utilized.
Your student will take a “pre-test” evaluating their knowledge of biology laboratory skills
and concepts prior to experiencing the kit. Later, your student will fill out a “post-test”
evaluating their knowledge upon completion of the kit with their class, along with the
opportunity to provide feedback of their experience.

A77 Appendix
Participation risk
Halobacterium sp. NRC-1 is deemed safe to use with human subjects. The American
Type Culture Collection (ATCC) classifies NRC-1 as a BioSafety Level 1(BSL-1)
organism. All biological components are sent to us by Carolina Biological Supply
Company.
Benefit of study
Students will use a microbe, Halobacterium sp. NRC-1 in their classroom. By following
procedures within the kit, they will make the connection between the physical
appearances of Halobacterium sp. NRC-1 (phenotype) to the gel electrophoresis image
analysis (genotype). Most other kits at this level do not provide the students the
opportunity to experience the intact organism, allowing students to do all the procedures,
finishing with gel electrophoresis.
Confidentiality
The names and schools of student participants will be kept confidential when reporting
results of this field trial in a thesis at Emporia State University and to Carolina Biological
Supply.
Questions regarding this project may be directed to your student’s AP Biology teacher.
-------------------------------Please detach and return the portion below to class---------------
"I have read the above statement and have been fully advised of the procedures to be
used in this project. I have been given sufficient opportunity to ask any questions I had
concerning the procedures and possible risks involved. I understand the potential risks
involved and I assume them voluntarily.”
____________________________________ ___________________________
Student Date
____________________________ ___________________________
Parent or Guardian Date

A78 Appendix
Appendix H: Carolina Biological Copyright Permissions
CAROLINA BIOLOGICAL SUPPLY COMPANY 2700 YORK ROAD
BURLINGTON, NC 27215
January 11, 2013
Kelley Tuel
15669 S. Rene St.
Olathe, KS 66062
Dear Ms. Tuel,
Conditional Copyright Permission Carolina Biological Supply Company has received your request to reprint information
found in several of our products from Carolina Biological Supply Company in a number
of publications, specifically as a part of your thesis and also in an article being submitted
to The American Biology Teacher.
It is our understanding that you will be submitting manuscripts for an article which will
explain uses for Halobacterium sp. NRC-1 to The American Biology Teacher, published
by the NABT. You would like to include the following:
BSYC media protocol, PCR temperature and settings, modified large scale DNA
extraction protocol from Carolina's "Extremely Easy DNA Extraction", and small scale
DNA extraction protocol from "Genotype-Phenotype" kit.
You will also include the above information in your thesis, as well as a reprint of the
"Genotype-Phenotype" kit manual as an appendix in the thesis. You would like
permission to reprint all or portions of the above material.
Lastly, you would also like to include a portion of the material as a reprint for a Science
Pioneers presentation that you are likely to do in February.
As you are asking to reproduce this content in printed form in a not-for-profit
publication, in support of these efforts to help teachers and students, Carolina by this
letter grants a royalty-free permission on the following conditions:
A79 Appendix
The information may be used only in the above indicated used. If you with to use
this information in any other form or in any other publication, then you will
request Carolina’s permission for those uses at a later date.
You may not authorize the use of this information by any other business, school,
or individual without Carolina Biological Supply Company expressed written
permission.
Each of the segments of information so used must display a copyright statement
in a clearly visible location, such statement to read as follows:
Carolina Biological Supply Company, Used by permission only.
Carolina would also appreciate your willingness to mention any of our products in
the publications.
Please acknowledge your acceptance of this permission and agreement to the above by
returning an e-mail with this e-mail attached stating your agreement to the terms.
Yours very truly,
CAROLINA BIOLOGICAL SUPPLY
COMPANY
Roger E. Phillips, Jr.
Director of Anatomical Operations & Senior
Scientist

A80 Appendix
Appendix I: HaloWeb Copyright Permissions
Hi Ms Tuel,
Nonprofit usage of HaloWeb is fine, as long as the source is attributed, i.e.:
Graphic generated using HaloWeb <http://halo4.umbi.umd.edu>
Full Citation:
DasSarma SL, Capes MD, DasSarma P, DasSarma S. HaloWeb: the haloarchaeal
genomes database. Saline Systems. 2010;6:12.
Regards,
Satyajit DasSarma
HaloWebMaster
On 7 March 2013 17:05, Kelley Tuel wrote:
Hello, Satyajit,
I have been working with Priya DasSarma on the Genotype-Phenotype Connection lab
manual that we published, along with Dr. Shil DasSarma and Dr. Tim Burnett. We will
be submitting an article to the journal, The American Biology Teacher next month. We
would like to use a graphic from HaloWeb in the article that we will submit next month.
The graphic shows the gene map of the gvpA1 region. May we have your permission to
use it for publication in ABT (a non-profit publication)?
In addition, I have written my Master's thesis about Halobacterium sp. NRC-1 and would
like to use the same graphic in my thesis. The thesis is through Emporia State University
in Emporia, KS. May I have your permission to use the same gene map graphic for
publication in my thesis as well?
I have enjoyed using the HaloWeb - very user friendly!
Thank you,
Kelley Tuel
A81 Appendix
I, Kelley Tuel, hereby submit this thesis to Emporia State University as partial fulfillment
of the requirements for an advanced degree. I agree that the Library of the University
may make it available to use in accordance with its regulations governing materials of
this type. I further agree that quoting, photocopying, digitizing or other reproduction of
this document is allowed for private study, scholarship (including teaching) and research
purposes of a nonprofit nature. No copying which involves potential financial gain will
be allowed without written permission of the author. I also agree to permit the Graduate
School at Emporia State University to digitize and place this thesis in the ESU
institutional repository.
________________________________________
Signature of Author
________________________________________
Date
________________________________________
Title of Thesis
________________________________________
Signature of Graduate School Staff
________________________________________
Date Received