Embed Size (px)
Citation preview

AnInternationalCenter for
Soil Fertilityand
AgriculturalDevelopment
An Action Plan for DevelopingAgricultural Input Marketsin Ghana

i
An Action Plan forDeveloping Agricultural Input
Markets in Ghana
Prepared by
IFDC—An International Center forSoil Fertility and Agricultural Development
Sponsored by
Directorate of Crop Services (DCS)Ministry of Food and Agriculture (MOFA)
Government of Ghana (GOG)
Funded by
Sasakawa Global 2000 (SG 2000)United States Agency for International Development (USAID)
Directoraat Generaal voor Internationale Samenwerking (DGIS)

i i
IFDC—An International Center for Soil Fertility and Agricultural DevelopmentP.O. Box 2040Muscle Shoals, AL 35662 (U.S.A.)
Telephone: +1 (256) 381-6600Telefax: +1 (256) 381-7408E-Mail: [email protected] Site: www.ifdc.org
IFDC publications are listed in IFDC Publications, General Publication IFDC–G-1; the publications catalog isfree of charge.
Library of Congress Cataloging-in-Publication Data
An action plan for developing agricultural input markets in Ghana / prepared by IFDC-anInternational Center for Soil Fertility and Agricultural Development ; sponsored byDirectorate of Crop Services (DCS), Ministry of Food and Agriculture (MOFA) Government ofGhana (GOG).
p. cm.Report prepared by B.L. Bumb, policy economist and team leader (IFDC) and others. Includesbibliographical references. ISBN 0-88090-130-6 1. Agriculture--Economic aspects--Ghana. 2. Agriculture and state--Ghana. I. Bumb,Balu. II. International Center for Soil Fertility and Agricultural Development. III.Ghana. Directorate of Crop Services. HD2146.Z8D48 2002 338.1’8667--dc21
2002154410

iii
Preface
In 1991, Ghana liberalized and privatized the import and marketing of fertilizers and divested inputs under thecontrol of the Ministry of Food and Agriculture (MOFA). In the same year, the Ghana Seed Company (GSC) wasprivatized, and the production of improved seed became the responsibility of stakeholders in the private sector,including farmers. These policy reforms have contributed to the general involvement of the private sector in the seedand fertilizer business. However, in spite of 10 years of progress, farmers continue to face difficulties in accessingagricultural inputs on time and in a cost-effective manner. Even the private-sector dealers have been facing con-straints to expanding their business in rural areas. Prompted by these considerations, an assessment of the agricul-tural input supply systems was conducted and an Action Plan developed for an orderly development of agriculturalinput markets (AIMs) in Ghana.
In 1999, IFDC, in collaboration with other institutions, prepared a strategic framework for developing sustainableinput supply systems in sub-Saharan Africa (SSA). Since the Framework was generic in nature, it was decided toprepare country specific action plans to test the validity of the Framework. Consequently, six countries were se-lected: Malawi, Nigeria, Ghana, Uganda, Tanzania, and Zambia. So far action plans have been completed for Malawi,Nigeria, and Uganda. Thus, Ghana’s Action Plan is a part of this broader group of action plans being prepared fordeveloping AIMs in Africa.
A team consisting of the following members conducted the assessment and prepared the Action Plan:
1. B. L. Bumb, Policy Economist and Team Leader, IFDC2. S. K. Debrah, Marketing Economist, IFDC3. P. Annequin, Crop Protection Product (CPP) Specialist, IFDC4. A. M. Babandi, Seed Specialist, Project Coordinating Unit (PCU), Nigeria5. K. Awuah-Peasah, Finance Specialist, Ministry of Finance (MOF), Ghana6. L. L. Delimini, Seed Specialist, MOFA7. G. Dimithe, Agricultural Economist, IFDC8. K. Kyei-Brobby, Inputs Trader, AGLOW9. A. Manu-Addae, Input Specialist/National Coordinator, MOFA
10. Ohenese A. Sakyi, Input Specialist, SG 200011. M.Owusu Ansah, Finance Specialist, Agricultural Development Bank (ADB), Ghana
The assessment team visited Ghana in April/May 2001. To ensure that we consulted with all stakeholders andvisited various parts of the country, the team was divided into three groups: policy and finance, fertilizers andpesticides, and seed and technology transfer. The team visited with various stakeholders including farmers, dealers,importers, wholesalers, bankers, donors, nongovernmental organizations (NGOs), and policymakers. Field visitswere made to Ashanti, Brong Ahafo, Central, Eastern, Greater Accra, Northern, Volta, and Western regions. The firstdraft of the report was discussed at a stakeholders’ workshop organized in Accra on September 12-13, 2001, to builda consensus for the proposed actions and policy measures to strengthen the input delivery system in Ghana. Com-ments and suggestions made at the workshop are reflected in the report.
This report provides an assessment of the functioning of AIMs in Ghana, identifies constraints faced by the privatesector participants in expanding their input business, and suggests policies and programs to strengthen the function-ing of the input and output markets. A holistic approach focusing on the policy environment, human capital develop-ment, access to finance and information, and regulatory frameworks is recommended for making AIMs moreeffective and efficient. The proposed recommendations are consistent with the efforts initiated by MOFA under itsAgricultural Services Sub-Sector Investment Programme (AgSSIP).
The assessment work was funded by USAID, the IFDC Africa Division’s Favourable Socio-Economic and PolicyEnvironments (FASEPE) program funded by DGIS, and IFDC/SG 2000 partnership work in the field of fertilizermarkets. The logistic and counterpart support that MOFA and SG2000/Ghana provided is gratefully acknowledged.USAID/Ghana, DGIS, and the Food and Agriculture Organization of the United Nations (FAO) funded the stakehold-ers’ workshop.1
1. The views and interpretations expressed in this document are those of the Study Team and should not be attributed to thefunding or sponsoring agencies.

iv

v
Contents
Preface .................................................................................................................................................. iiiExecutive Summary ................................................................................................................................ xi
I. Introduction .................................................................................................................................... 1I.1. Role of Agriculture in the Socioeconomic Development of Ghana .................................. 1I.2. AIMs and Agricultural Development ................................................................................ 3I.3. Goal, Scope, and Objectives of the Action Plan ................................................................ 3I.4. Outline of the Report ......................................................................................................... 4
II. An Assessment of the AIMs in Ghana .......................................................................................... 4II.1. Introduction ........................................................................................................................ 4II.2. Policy Issues: Macropolicy and Market Development Issues ................................................. 4II.3. Financial Support Services ................................................................................................ 5II.4. The Seed Market ................................................................................................................ 7II.5. The Fertilizer Market ......................................................................................................... 19II.6. The Crop Protection Product Market ................................................................................. 29II.7. Factors Constraining the Performance of the Private Sector ................................................ 36
III. An Action Plan for Developing AIMs in Ghana ............................................................................... 37III.1. Rationale for the Action Plan .............................................................................................. 37III.2. Components of the Action Plan .......................................................................................... 38
IV. Implementation of the Action Plan: A Holistic Approach .................................................................. 52IV.1. Functional Integration ......................................................................................................... 52IV.2. Private-Public Sector Partnership ....................................................................................... 63IV.3. Institutional Arrangements ................................................................................................... 64
References ........................................................................................................................................... 65

vi
Tables
Table 1. Share of Rice, Maize and Wheat in Total Cereal Imports, Ghana (1995-99) ..................... 2Table 2. Terms and Conditions of Financial Institutions .................................................................. 8Table 3. Constraints to Financial Support Services for AIMs in Ghana .......................................... 9Table 4. Varieties of Selected Crops Released in Ghana (1971-97) ............................................... 12Table 5. Types and Sources of Supply of Improved Seeds and Planting Materials ........................ 13Table 6. Annual Certified Seed Production, 1990-2000 .................................................................... 15Table 7. Improved Seed Adoption Rates (% Total Crop Area) .......................................................... 15Table 8. Annual Requirement and Estimated Demand for Improved Seed in Ghana ............................ 16Table 9. Market Prices of Improved Seed, by Crop, 1994-2000 ...................................................... 16Table 10. Imports of Crop Protection Products by Ghana, 1995-99 ................................................... 30
Figures
Map 1. Administrative Regions of Ghana ...................................................................................... 3Figure 1. Structure of the Ghana Seed Industry ............................................................................... 10Figure 2. The Seed Marketing Chain ............................................................................................... 11Figure 3. Foundation Seed Production Trends for Selected Crops, 1991-2000 ............................... 14Figure 4. Ghana Fertilizer Imports, 1960-2000 ............................................................................... 19Figure 5. Market Shares by Major Importers, 1997-2000 ................................................................. 22Figure 6. Exchange Rate and Price of Maize and Selected Fertilizers, 1986-2000 ............................... 23Figure 7a. Urea:Crop Price Ratio Trends, 1989-2000 ......................................................................... 24Figure 7b. Ammonium Sulfate:Crop Price Ratio Trends, 1989-2000 .................................................... 24Figure 7c. NPK (15-15-15):Crop Price Ratio Trends, 1989-2000 ...................................................... 25Figure 8. VCR Trends for Fertilizer Use in Maize Production, 1989-2000 .......................................... 25Figure 9. Distribution Channels for Crop Protection Products in Ghana ............................................... 33Figure 10. Insecticides and Fungicides Purchased by the Cocoa Sector, 1986-2000 ............................. 34Figure 11. Price and Quantity Relationship ........................................................................................... 37Figure 12. The Agribusiness System ..................................................................................................... 61
Action Plan Matrices
Action Plan Matrix 1. Policy and Market Development Issues ........................................................... 40Action Plan Matrix 2. Finance ........................................................................................................... 43Action Plan Matrix 3. Seed ............................................................................................................... 53Action Plan Matrix 4. Fertilizers ........................................................................................................ 57Action Plan Matrix 5. Crop Protection Products ................................................................................ 60

vii
Abbreviations and Acronyms
AAGDS Accelerated Agricultural Growth and Development StrategyAgSSIP Agricultural Services Sub-Sector Investment ProgrammeADB Agricultural Development BankADF African Development FundADPA Association des Distributeurs des Produits Agro-PharmaceutiquesADRA Adventist Relief AgencyAFD Agence Française de DéveloppementAfDB African Development BankAFSTA African Seed Trade AssociationAgDiv Agricultural Diversification ProjectAIBDF Agricultural Inputs Business Development FundAIIF Agricultural Inputs Importation FundAIMs Agricultural Input MarketsAN Ammonium NitrateAPF Agricultural Production FundAS Ammonium SulfateASIP Agricultural Sector Investment ProjectBAT British American TobaccoBBG Barclays Bank of Ghana Ltd.BOG Bank of GhanaBOPP Benso Oil Palm PlantationBT BiotechnologyCARE Cooperation for Assistance and Relief EverywhereCEC Cation Exchange CapacityCedi ¢CEPS Customs, Excise and Preventive ServicesCIC Cocoa Inputs Company Ltd.COCOBOD Cocoa Marketing BoardCPHAOC Comité Phytosanitaire d’Afrique de l’Ouest et du CentreCPP Crop Protection ProductCRB Credit Reference BureauCRI Crops Research InstituteCSD Cocoa Services DivisionCSIR Council for Scientific and Industrial ResearchCU Credit UnionDADU District Agricultural Development UnitDAES Directorate of Agricultural Extension ServicesDAI Development Alternatives IncorporatedDAP Diammonium PhosphateDCS Directorate of Crop ServicesDFID Department for International DevelopmentDFR Department of Feeder Road
viii
DGIS Directoraat Generaal voor Internationale SamenwerkingDMB Deposit Money BankEC Emulsionable ConcentrateECOWAS Economic Community of West African StatesEPA Environmental Protection AgencyERP Economic Recovery ProgramEU European UnionFAO Food and Agriculture Organization of the United NationsFASCOM Farmer’s Services CompanyFASEPE Favourable Socio-Economic and Policy EnvironmentsFFH Freedom from HungerFOB Free on Boardg gramGAEC Ghana Atomic Energy CommissionGAFCO Ghana Agro Food CompanyGCB Ghana Commercial Bank Ltd.GCC Ghana Cotton CompanyGCCSFA Ghana Cocoa, Coffee and Sheanut Farmers’ AssociationGDP Gross Domestic ProductGIDA Ghana Irrigation Development AuthorityGLDB Grains and Legumes Development BoardGMO Gene Modified OrganismGOG Government of GhanaGPHA Ghana Ports and Harbors AuthorityGREL Ghana Rubber Estates Ltd.GSB Ghana Standards BoardGSBV Ghana Standards Bureau VeritasGSC Ghana Seed CompanyGSE Ghana Stock ExchangeGSID Ghana Seed Inspection DivisionGSS Ghana Statistical ServicesGTZ Deutsche Gesellschaft für Technische Zusammenarbeit
(German Technical Assistance)GVLC Ghana Varietal Release Committeeha hectare(s)HIPC Heavily Indebted Poor CountryHSMU Hybrid Seed Multiplication UnitICI Imperial Chemical IndustriesIFAD International Fund for Agricultural DevelopmentIFDC An International Center for Soil Fertility and Agricultural DevelopmentIITA International Institute for Tropical AgricultureIMF International Monetary FundIPM Integrated Pest ManagementIRRI International Rice Research InstituteISTA International Seed Trade Association
ix
kg kilogram(s)KKCU Kuapa Kookoo Credit Unionkm kilometer(s)KR-II Kennedy Round IIL litersLC Letter of CreditLIBOR London Inter-Bank Offered RateMEPRI Ministry of Economic Planning and Regional IntegrationMEST Ministry of Environment, Science and TechnologyMFI Microfinance InstitutionMIS Market Information SystemmL millilitersMOEST Ministry of the Environment, Science and TechnologyMOF Ministry of FinanceMOFA Ministry of Food and AgricultureMOH Ministry of HealthMOP Muriate of PotashMRH Ministry of Roads and Highwaysmt metric ton(s)MTADP Medium Term Agricultural Development ProgrammeMTC Ministry of Transport and CommunicationMTL Masdar Technology LimitedNBFI Non-Bank Financial InstitutionsNGO Nongovernmental OrganizationNIB National Investment BankNPK Nitrogen, Phosphate, Potassium compound fertilizerNRCD National Root Crops DivisionNSC National Seed CommitteeNSFMAP National Soil Fertility Management Action PlanNSS National Seed ServiceOECD Organization for Economic Cooperation and DevelopmentOPV Open Pollinated VarietyPCU Project Coordinating Unit, NigeriaPIP Public Investment ProjectPPRSD Plant Protection and Regulatory Services DirectoratePVP Plant Variety ProtectionRFSP Rural Financial Services ProjectROSCAs Rotating Savings and Credit AssociationsS&LCO Savings & Loans CompanySAFGRAD Semi-Arid Food Grain Research and DevelopmentSARI Savanna Agricultural Research InstituteSAT Sinapi Aba TrustSCB Standard Chartered Bank (Ghana) Ltd.SG 2000 Sasakawa Global 2000SGA Seed Growers’ Association of Ghana

x
SGS Société Général de SurveillanceSMU Seed Multiplication UnitSOP Sulfate of PotashSRI Soil Research InstituteSRID Statistical, Research and Information DirectorateSSA Sub-Saharan AfricaSSB Social Security Bank Ltd.SSMS Smallholder Seed Multiplication SchemeSSP Single SuperphosphateTOPP Twifo Oil Palm Plantations Ltd.TPSL Technical Product Specification ListTSP Triple SuperphosphateTTB The Trust Bank Ltd.ULV Ultra Low VolumeUNDP United Nations Development ProgramUR Upper RegionUSAID United States Agency for International DevelopmentUST University of Science and TechnologyVAT Value Added TaxVCR Value:Cost RatioVIP Village Infrastructure ProjectVRC Varietal Release Committee (National)WASDU West Africa Seed Development UnitWHO World Health OrganizationWVI World Vision International

xi
An Action Plan for DevelopingAgricultural Input Markets in Ghana
Executive Summary
I. Introduction
The agricultural sector in Ghana employs about 70% of the labor force, contributes about 36% of the GDP,and accounts for 57% of the country’s foreign exchange earnings. Thus, the sector is an important engine foreconomic growth in Ghana. Despite its critical importance the sector has not performed to its potential, primarilybecause of the general lack of support for agriculture and the unfavorable macroeconomic conditions, particu-larly the high rate of inflation, high interest rates, and the rapid depreciation of the Cedi (¢). To reverse thedeclining trends in agricultural productivity and to increase the sector’s contribution to economic development,the Government of Ghana (GOG) set targets under its Vision 2020 program in the early 1990s; these targetswere recently revised during the National Economic Forum in May 2001.
The agricultural sector is once again challenged to drive the economy towards ensuring food security, reduc-ing poverty, and protecting the environment. In fulfilling these goals, improved seeds and planting material,fertilizers, and crop protection products (CPPs) are critical, and the private sector now has the primary respon-sibility for procuring and distributing these inputs through sustainable agricultural input markets (AIMs).
II. An Assessment of AIMs
Ghana has made considerable progress toward deregulation and liberalization of the agricultural input supplysystems, and in recent years the private sector has played a dominant role in supplying various inputs. Neverthe-less, agricultural input markets are not operating efficiently, and farmers do not have easy access to inputs ataffordable prices. Several factors continue to constrain the development of efficient AIMs. These factors can bedivided into two broad groups, namely, macropolicy issues and market development issues.
In the macropolicy group, devaluation of the Ghanaian Cedi, limited availability of foreign exchange, highinterest rates, and poor rural roads constrain the development of input markets. The devaluation of the Cedi notonly increases the prices of imported seeds, fertilizers, and CPPs, but it also discourages investments in businessdevelopment due to associated risks. Limited availability of foreign exchange constrains the import of inputs.Poor infrastructure in rural areas makes the transportation of goods and services difficult and costly and therebylimits the supply of much-needed inputs. These factors have contributed to the concentration of suppliers in urbanand peri-urban areas, consequently forcing farmers to travel 10-50 km to purchase inputs.
The market development issues consist of policy-induced uncertainty, inadequate human capital and marketinformation, lack of affordable finance, and poor enforcement or absence of regulatory frameworks for inputsmarketing. The unresolved issues associated with well-intentioned government-supported programs such as ten-dering for supplying inputs by the Agricultural Development Bank (ADB) and the zoning of cotton productionareas in northern Ghana create uncertainty in the marketplace. Consequently, these programs tend to discourageprivate-sector investment in the input business.1 Inadequate human capital (technical and business skills) andmarket information restrict the supply of products in the marketplace and result in high prices. There is generally
1. The Ministry of Food and Agriculture (MOFA) is engaged in resolving the zoning issue. It is expected that such resolutionmay contribute to creating a positive environment for input dealers, provided the final agreed-upon arrangements are effec-tively enforced.

xii
a lack of input dealers in the rural areas. The seed and fertilizer markets are largely concentrated in towns andcities and are served by a limited number of enterprises. High interest rates and stringent collateral requirements,coupled with the lack of financial service providers in rural areas, severely limits the availability of finance forbusiness development. Although Ghana has laws on seed and fertilizers, the implementation of these laws hasbeen far from satisfactory, largely because important amendments have not yet been enacted into law and theregulatory agencies are constrained by limited human and financial resources.
III. An Action Plan for Developing AIMs
In developing the Action Plan, the team assessed various options available to improve the supply of inputs andconcluded that a free market system should be used to supply inputs to the farmers because this approach isrelatively more efficient and sustainable and does not strain the fiscal resources of the country. The team recog-nized that although AIMs have been liberalized in Ghana they are not operating efficiently. The team recom-mends that, to develop sustainable agri-input supply systems in Ghana, the liberalized markets must be strength-ened by undertaking activities in the areas of policy reform and human capital development and by improvingfinancial services, market information systems, and regulatory frameworks. The team also recommends thatthese activities be undertaken in a holistic manner so that the synergies of various activities can be captured.
Furthermore, the team assessed the potential of the private sector in undertaking marketing activities in acompetitive market environment. The private sector has latent potential to assume the responsibility of marketingagricultural inputs in an efficient and sustainable manner. However, for this potential to be realized, constraintsaffecting their activities need to be removed. In developing the Action Plan, special attention was paid to thealleviation of these constraints.
The main activities proposed in the Action Plan are identified in the Action Plan Matrix 1 and are brieflysummarized below.
Macropolicy ReformOverall, the macropolicy environment should be conducive to the market development process. Macroeco-
nomic stability and sufficient supply of foreign exchange are essential. It is recommended that the Bank of Ghana(BOG), the Ministry of Finance (MOF), and their international partners implement appropriate monetary, fiscal,and exchange rate policies. Similarly, foreign exchange availability should be ensured in that Ghana will requireapproximately US $45 million/year to import the necessary inputs during the 2001-2005 period.
Because the poor quality of rural roads adds cost to inputs and discourages traders from penetrating ruralmarkets, the Ministry of Roads and Highways (MRH) and the District Assemblies are encouraged to developlong-term programs for constructing and maintaining rural roads.
Market DevelopmentSkills, knowledge, and information (human capital) needed to make input markets efficient are inadequate at all
levels of the marketing chain. Importers do not have adequate knowledge about the conditions prevailing in theglobal input markets; wholesalers and retailers lack the necessary skills for enterprise management and businessdevelopment; and most importantly, there are few independent dealers involved in marketing inputs in rural areas.Even the bankers are not fully equipped to effectively play their role in financing the import and marketing ofinputs. Developing the human capital necessary for making input markets perform efficiently constitutes the coreof the activities under this Action Plan and will be accomplished by focusing on the following activities:1. Training programs for dealers (wholesalers and retailers), importers, and bankers.2. Technical assistance in enterprise development to newly trained dealers.3. Study tours for dealers, importers, and bankers.4. Policy workshop and study tours for policymakers.5. Access to market information.
xiii
To make dealers a dynamic force in the economy, various associations of input traders will be encouraged.Training and technical assistance for associations will be essential. In addition to developing human resources forcompetitive markets, training and technical assistance will be needed for building technical capacity in the seedsector—training for seed growers, capacity for inspection and quality control, and enterprise development.
Financial Support ServicesFinance is the lifeblood of any business activity. Without adequate access to and availability of finance, com-
petitive markets cannot function efficiently. At the present time, difficulties in obtaining adequate foreign ex-change to cover procurements from overseas currently estimated at about US $31.9 million/year are constrainingestablished and new-entrant importers alike. Currently, foreign exchange available (mostly from ADB) for theimportation of agricultural inputs has been maintained at a level equivalent to only 19% of the annual require-ments. To make funds available, and factoring in market expansion, it is recommended that the African Develop-ment Bank (AfDB) Group, USAID, Department for International Development (DFID), International Fund forAgricultural Development (IFAD), Agence Française de Développement (AFD), and GOG (using indirect re-ceipts from the Heavily Indebted Poor Country [HIPC]) constitute a US $45 million Agricultural Inputs Importa-tion Fund (AIIF) over a period of 5 years for importers to supplement and generate available foreign exchangeneeded in establishing Letters of Credit (LCs) with foreign banks. BOG should manage the fund lodged in aforeign bank. The borrower should contribute 30% of the cost of the inputs paid in foreign exchange Cedisequivalent. Commercial banks would provide LCs for 100% financing of the cost of the inputs under a risk-sharing mechanism between the lender (40%) and the fund (30%). A number of stakeholders at the workshopnoted that a requirement of 30% contribution from the borrower is likely to be a constraint. However, the assess-ment team feels that a 30% contribution from the borrower is essential to make this arrangement successful andsustainable. The fund should provide guaranteed foreign exchange support up to a maximum of US $1.5 millionper importer per year.
Input wholesalers and retailers similarly face financial constraints in their operations, and potential marketparticipants without adequate financial resources are unable to enter the market. To alleviate this constraint, theDistrict Assembly Common Fund (Poverty Alleviation Fund), BOG, and the African Development Bank Facilityare to be used to constitute a ¢70 billion Agricultural Inputs Business Development Fund (AIBDF) to covercommercial bank lending to local agricultural inputs wholesaler and retailers. BOG should manage the fund.Commercial banks would provide 70% financing of the cost of the inputs with 30% guaranteed from the fund. Inaddition, it is recommended that training programs be organized for borrowers and lenders to minimize the risks ofdefault, and databases for borrowers should be created at a Credit Reference Bureau. As in the case of the AIIF,a number of stakeholders at the validation workshop noted that a requirement of 30% contribution from theborrower is likely to be a constraint. As a result, the use of warehouse collateral (bonded warehouse) should alsobe considered during the implementation to reduce the burden of liquidity on the borrower.
Market Information System (MIS)Information is crucial for the functioning of the market. Dealers and importers need information about local,
regional, and global markets. Because every stakeholder will need the information about prices, stocks, andavailability of inputs in various markets, MOFA’s present MIS should be strengthened and linked with otherregional web-based agricultural input information systems.
Other Input-Specific IssuesSeed and Planting Material
Apart from seed of cereals and some other food crops, most of the improved seeds, particularly vegetableseeds, are imported. Ghana can benefit from stronger linkages to the international market and access to newvarieties of seeds. The seed market is thin, and it lacks the presence of large seed companies and adequate dealeroutlets. Recommendations are made in the Action Plan to address these issues. In particular, efforts should bemade to help potential entrepreneurs (scientists, seed farmers, seed growers’ association, and others) to establish

xiv
viable seed enterprises—buying seed from farmers, packaging it with a brand name, and distributing or selling itto retail outlets for farmers to buy.
FertilizersAlmost all the fertilizer used in Ghana is imported; hence, a primary bottleneck in the subsector is that of
financing at the level of importers, wholesalers, and retailers. The Action Plan has therefore proposed theestablishment of the AIIF and AIBDF to cater to importers and dealers, respectively. A major problem constrain-ing the use of fertilizers is the small effective demand due to unfavorable fertilizer/output ratios arising from highfertilizer costs and low product prices. Actions have been recommended to improve the effective demand forfertilizers.
CPPsWith the uncontrolled status of the Ghana CPP market, a substantial quantity of obsolete and dangerous
materials can be found in Ghana. Furthermore, serious adulteration and abuse of truth in labeling are common atthe retail level. Consequently, a safe and environmentally sound disposal of the obsolete stock of pesticides andenforcement of laws and regulations have received top priority in the Action Plan, which also calls for propermonitoring, research, and education to avoid harm to human health and the environment. Additionally, effortsshould be made to (1) strengthen the capacity of the Environmental Protection Agency (EPA) and the PlantProtection and Regulatory Services Directorate (PPRSD) to accelerate product registration and enforcement ofthe pesticide legislation, (2) design training programs to educate extension agents and end users about the prod-ucts and their safe use, (3) conduct residue testing on food products, (4) initiate negotiations for a regionalharmonization of the testing and registration of pesticides, (5) strengthen the capacity of the health services todeal with cases of pesticide poisoning, and (6) support research and extension on biocontrol and integrated pestmanagement (IPM).
IV. Potential Benefits of the Action Plan
The implementation of the Action Plan will generate several socioeconomic benefits for the Ghanaian society.It will promote food security and environmental protection by lowering the prices of inputs, making inputs easilyaccessible to farmers in rural areas, and improving access to new production technologies. In addition, it willencourage economic activity at microenterprise level, improve smallholder incomes, and expand bank sectoractivity to include input markets. The contribution of the Action Plan to foreign exchange earnings will also besignificant through crop diversification and increased food production.
Because it focuses on the development of AIMs, the present Action Plan is an important component ofGhana’s strategy for improving food security while protecting the environment. In this regard, this Action Plansupports and complements (a) the 1998 National Soil Fertility Management Action Plan (NSFMAP), (b) the 2001Accelerated Agricultural Growth and Development Strategy (AAGDS), and (c) the targets set for agriculturaldevelopment in the national economic dialogue of May 2001.
V. Implementation Arrangements
In implementing the Action Plan, care must be taken to preserve the holistic nature of the proposed measures.It is recommended that core activities dealing with policy reform, dealer development, and financial services beimplemented as a project. Other activities could be implemented as subproject activities. The project activitiesshould be implemented by an autonomous project entity reporting to the Chief Director, MOFA.
To facilitate the implementation of the Action Plan, an Advisory Committee consisting of stakeholders fromthe private sector (including farmers), donor community, and the government should be created. The AdvisoryCommittee will provide broad policy and program guidance about the project to the Chief Director, MOFA.MOFA will make the necessary arrangements for the Advisory Committee meetings and stakeholders’ workshops.

1
I. Introduction
I.1. Role of Agriculture inthe Socioeconomic Development of Ghana
Agriculture plays important roles in the socioeco-nomic development of Ghana. It contributes to ensur-ing food security, provides raw materials for local in-dustries, generates foreign exchange, and provides em-ployment and incomes for most of the population,thereby contributing to poverty reduction. In 2000, forexample, the agricultural sector employed about 70%of the labor force, contributed about 36% to gross do-mestic product (GDP), and accounted for over 57% ofthe country’s foreign exchange earnings (GOG/WorldBank, 2000; PriceWaterHouseCoopers, 2001; andMOFA, 2001). Furthermore, the agriculturally depen-dent rural households (72% of the population) formthe largest potential domestic market for output fromother sectors of the economy.
Despite its critical and strategic importance to theeconomy, the performance of the agricultural sectorhas varied over the years. The first country in colonialAfrica to gain its independence in 1957, Ghana wasone of the brightest hopes in Africa as it enjoyed thehighest per capita income on the continent and an av-erage economic growth rate of 4% heavily driven bycocoa.1 But, the respectable gains of the 1960s wereeroded by two decades of state monopoly and patron-age, political turmoil, and short-lived reforms. Thisresulted in a situation of large fiscal deficit, deterio-rating balance of payments, hyperinflation, and short-age of goods and services starting in the early 1970s.Between 1970 and 1980, the country experienced adecline in agricultural output while at the same timepopulation was increasing at 2.4% to 3% per annum.However, the agricultural share of GDP remained high(at 56.2% in 1977).
Following the 1981/82 economic debates, the GOG,supported by a stand-by arrangement with the Interna-tional Monetary Fund (IMF) and a multisector reha-bilitation credit from the World Bank, introduced acomprehensive economic recovery program (ERP) toreverse the downward economic spiral. Under the ERP,the country experienced significant improvements ineconomic activities in all sectors except in food pro-duction and manufacturing. Though the negative trendin agricultural growth rates was reversed, it had grownby an average of only 2.4% per annum by 1988.
To consolidate the progress achieved under the ERPand promote a sustained 4% annual growth rate, theGOG initiated a Medium Term Agricultural Develop-ment Programme (MTADP) in 1988 (for the period1991-2000) with the support of the World Bank. TheMTADP provided a framework to support a market-led growth of the agricultural sector through institu-tional reforms and a more efficient allocation of gov-ernment resources to public goods and services, par-ticularly feeder roads, market infrastructure, irrigation,research, and extension. In spite of these efforts, agri-cultural growth remained slow, averaging 2.7% perannum over the period 1988-98. This was largely dueto the general lack of support for agriculture and themacroeconomic conditions, particularly the high rateof inflation, the high interest rates, and the rapid de-preciation of the domestic currency (MOFA, 2001).Consequently, the agricultural share of GDP fell from50.6% in 1987 to 35.8% in 1997 (GOG/World Bank,2000).2
The unsatisfactory performance of the agriculturalsector, particularly in the early 1990s, prompted theGOG in 1995 to launch a 25-year perspective plan(Vision 2020)3 with the objective of attaining a middle-income status by the year 2020. To reach this goal,Ghana undertook the daunting task of making its over-
2. This structural change is different from a classical structuraltransformation of the economy since the agricultural share ofGDP is expected to increase (at least in the short term) if thetargeted growth rate is achieved.3. MOFA. 1995. Ghana’s Vision 2020.
1. At the independence in 1957, Ghana cocoa exports repre-sented 70% of foreign exchange earnings. Averaging one-thirdof world supply in the late 1950s, Ghana was the world’s larg-est cocoa producer.
An Action Plan for Developing SustainableAgricultural Input Markets in Ghana

2
all GDP grow at over 8% per year4 (MOFA, 2001). Inthis perspective plan, the GOG clearly restated the criti-cal role agriculture has to play in bringing about thetargeted economic growth, increased employment, andreduction in poverty. In particular, the plan emphasizedthat such a high GDP growth rate requires at least a4% annual growth of the agricultural sector throughimproved agricultural productivity and competitive-ness (MOFA, 2001). The recognition of the criticalrole of agriculture was reinforced in MOFA’s recentAccelerated Agricultural Growth and DevelopmentStrategy (AAGDS). In the AAGDS, the MOFA stressesthat a higher annual growth rate of about 6% over theperiod 2001-2010 is required to achieve the Vision2020’s targets on economic growth, food security, andpoverty reduction.
Although the agricultural sector grew annually at aremarkable rate of 4.4% during the second half of the1990s5 —compared with a dismal 1.1% during the firsthalf—much remains to be done. Food imports con-tinue to be high, particularly for rice and maize. Riceimports accounted for between 25% and 72% of thetotal cereal imports between 1995 and 1999 whilemaize represented between 25% and 50% of total ce-real imports over the same period (Table 1). Concernedabout the level of food importation into the country,the government in its budget for 2001 set a goal ofreplacing 30% of rice imports with a domestic pro-
duction of 72,000 mt. For maize, the target is to in-crease domestic production by 10% by expanding thearea under cultivation by 70,000 ha (Government ofGhana, 2001).
In general, the growth in agricultural production hashistorically been achieved primarily through increasesin area cultivated (MOFA, 2001). Given the current2.6% population growth per annum, the availabilityof agricultural land per capita is projected to decreasefrom its current 0.77 ha to 0.38 ha by the year 2020(MOFA, 2001). This implies that the current level ofagricultural productivity would have to be nearlydoubled simply to maintain the current level of foodsecurity and nutritional requirements.
Currently, about 29% of the population lives belowthe national poverty line. The most affected are therural poor and women who perform about 40% of allagricultural activities, especially in the food cropsubsector. This is partly due to the low productivitylevel arising from comparatively lower uptake of fer-tilizers in Ghana. The average plant nutrient uptakein Ghana is 3.1 kg/ha compared with 12.8 kg/ha inneighboring Togo. Given the strong link between ag-riculture and rural poverty,6 poverty reduction wouldremain a mirage without significant improvement inthe sector’s performance. The challenge for Ghana isto develop its currently inadequate irrigation infrastruc-ture (only 0.05% of area cultivated), improve the poorlydeveloped rural roads and markets, and reverse the ac-celerated land degradation (FAO/World Bank, 2000).
4. . Under the ERP, when the economy was performing at itshistorical best, annual growth rates never exceeded 5.5%.5. The agricultural sector grew at 4.3% in 1997, 4.7% in 1998,and 4.5% in 1999, but the agricultural share of GDP remainedaround 36% (GOG/World Bank, 2000).
Table 1. Share of Rice, Maize, and Wheat in Total Cereal Imports, Ghana (1995-99)
Source: FAOSTAT for the year 1998 and GSS based on data from Customs, Excise and Preven-tive Services (CEPS) for the other years.
6. According to the 1998 Ghana Living Standard Survey, 54%of Ghana’s poor are food crop farmers.
Share in Total Cereal Imports (%)
Year
Total Cereal Imports
(mt) Rice Maize/Wheat 1995 142,237 25 25 1996 99,936 35 50 1997 121,268 31 57 1998 378,121 72 26 1999 226,189 31 39
3
I.2. AIMs and Agricultural Development
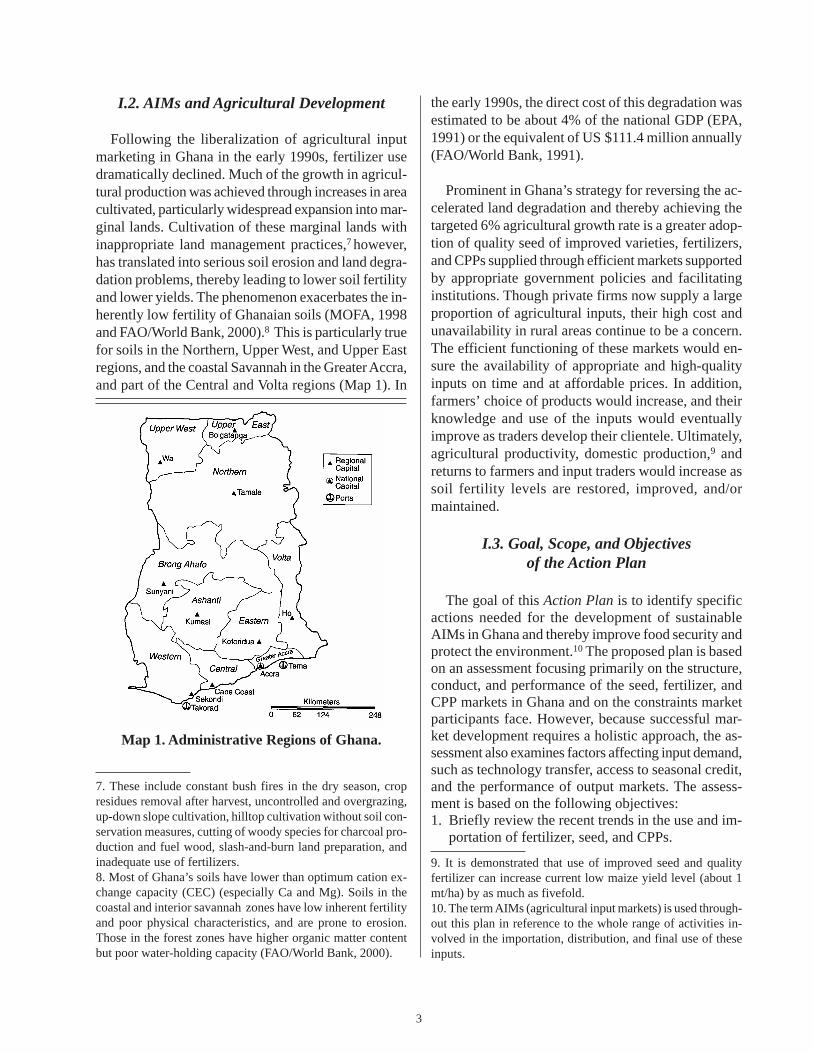
Following the liberalization of agricultural inputmarketing in Ghana in the early 1990s, fertilizer usedramatically declined. Much of the growth in agricul-tural production was achieved through increases in areacultivated, particularly widespread expansion into mar-ginal lands. Cultivation of these marginal lands withinappropriate land management practices,7 however,has translated into serious soil erosion and land degra-dation problems, thereby leading to lower soil fertilityand lower yields. The phenomenon exacerbates the in-herently low fertility of Ghanaian soils (MOFA, 1998and FAO/World Bank, 2000).8 This is particularly truefor soils in the Northern, Upper West, and Upper Eastregions, and the coastal Savannah in the Greater Accra,and part of the Central and Volta regions (Map 1). In
7. These include constant bush fires in the dry season, cropresidues removal after harvest, uncontrolled and overgrazing,up-down slope cultivation, hilltop cultivation without soil con-servation measures, cutting of woody species for charcoal pro-duction and fuel wood, slash-and-burn land preparation, andinadequate use of fertilizers.8. Most of Ghana’s soils have lower than optimum cation ex-change capacity (CEC) (especially Ca and Mg). Soils in thecoastal and interior savannah zones have low inherent fertilityand poor physical characteristics, and are prone to erosion.Those in the forest zones have higher organic matter contentbut poor water-holding capacity (FAO/World Bank, 2000).
the early 1990s, the direct cost of this degradation wasestimated to be about 4% of the national GDP (EPA,1991) or the equivalent of US $111.4 million annually(FAO/World Bank, 1991).
Prominent in Ghana’s strategy for reversing the ac-celerated land degradation and thereby achieving thetargeted 6% agricultural growth rate is a greater adop-tion of quality seed of improved varieties, fertilizers,and CPPs supplied through efficient markets supportedby appropriate government policies and facilitatinginstitutions. Though private firms now supply a largeproportion of agricultural inputs, their high cost andunavailability in rural areas continue to be a concern.The efficient functioning of these markets would en-sure the availability of appropriate and high-qualityinputs on time and at affordable prices. In addition,farmers’ choice of products would increase, and theirknowledge and use of the inputs would eventuallyimprove as traders develop their clientele. Ultimately,agricultural productivity, domestic production,9 andreturns to farmers and input traders would increase assoil fertility levels are restored, improved, and/ormaintained.
I.3. Goal, Scope, and Objectivesof the Action Plan
The goal of this Action Plan is to identify specificactions needed for the development of sustainableAIMs in Ghana and thereby improve food security andprotect the environment.10 The proposed plan is basedon an assessment focusing primarily on the structure,conduct, and performance of the seed, fertilizer, andCPP markets in Ghana and on the constraints marketparticipants face. However, because successful mar-ket development requires a holistic approach, the as-sessment also examines factors affecting input demand,such as technology transfer, access to seasonal credit,and the performance of output markets. The assess-ment is based on the following objectives:1. Briefly review the recent trends in the use and im-
portation of fertilizer, seed, and CPPs.
Map 1. Administrative Regions of Ghana.
9. It is demonstrated that use of improved seed and qualityfertilizer can increase current low maize yield level (about 1mt/ha) by as much as fivefold.10. The term AIMs (agricultural input markets) is used through-out this plan in reference to the whole range of activities in-volved in the importation, distribution, and final use of theseinputs.

4
2. Assess the suitability, adequacy, and efficiency ofthe organizational arrangements—public, private,and NGO enterprises involved in the marketing anddistribution of inputs.
3. Evaluate the policy and regulatory environments andtheir impact on input marketing and distribution.
4. Analyze the availability of and access to financefor input marketing and distribution.
5. Evaluate donor-funded and government-supportedprograms for input supply and their impact onprivate-sector participation in input marketing.
6. Identify constraints to marketing and distributionof inputs.
7. Develop a plan identifying the specific actionsneeded to address the identified constraints and therole of key stakeholders and thereby strengthen thefunctioning of competitive input markets in Ghana.
The assessment focuses on the identification of theconstraints affecting the supply side of the input mar-ket largely because the system changed from a public-sector monopoly to a private-sector-based competitivemarket that has failed to perform as expected. More-over, earlier work by IFDC and others has indicatedthat the transaction costs associated with the supplyof agricultural inputs to farmers are high in many Af-rican countries. Consequently, alleviating the under-lying constraints and strengthening the capacity of theprivate sector could lead to a significant reduction inthese costs and thereby enhance input supply and theprofitability of their use. Focusing on the supply sideis not to suggest that the demand-side factors are notimportant; limited resources and work on the supply-side issues necessitated that the assessment focus onthe supply side of the market equation.
Because it focuses on the development of AIMs,the present Action Plan is an important component ofGhana’s strategy for improving food security whileprotecting the environment. In this regard, this ActionPlan supports and complements (a) the 1998 NationalSoil Fertility Management Action Plan (NSFMAP),(b) the 2001 AAGDS, and (c) the targets set for agri-cultural development in the national economic dialogueof May 2001.
I.4. Outline of the Report
The body of the report is divided into three sections.Section II deals with the assessment of AIMs in Ghanawith a special focus on private-sector participation. It
focuses on the functioning of the markets and con-straints affecting their performance. The measuresneeded to improve the performance of the markets areincluded in Section III. The last section covers the is-sues dealing with the implementation of the ActionPlan in a holistic manner.
II. An Assessment of theAIMs in Ghana
II.1. Introduction
The AIMs in Ghana have been studied extensivelysince the structural adjustment period beginning in themid-1980s (Bumb et al., 1994; Gerner et al., 1995;Visker et al., 1995; Kempkes, 1997; Delimini andWobil, 1998; Ocran et al., 1998; Schiere, 1998, Safoet al., 1999; Debrah, 2000). However, in-depth analy-ses of the AIMs have focused on the fertilizer market,taking into account the situation before the structuraladjustment period until the mid-1990s. Although themarketing system for fertilizers and other inputs is fullyprivatized, there are second-generation constraints thatcurrently hinder the full development of the privatesector.
As a way of promoting broad-based rural develop-ment and poverty alleviation in Ghana, a joint FAO-World Bank mission was fielded in June 2000 to iden-tify constraints that limit farmers’ use of these inputsand to identify practical solutions for alleviating suchconstraints. The study focused on developments in thefertilizer and other agrochemicals sector during theperiod 1995 to 2000, but important gaps remained tobe filled. These gaps related to seed and CPP marketsand financial services and are addressed in this assess-ment. This section provides a summary of the assess-ment findings. More details are included in the back-ground report.11
II.2. Policy Issues: Macropolicyand Market Development Issues
Macropolicy IssuesRapid depreciation of domestic currency—the Cedi
(¢)—has been a significant macropolicy factor affect-ing the functioning of input markets, especially the
11. IFDC. 2001. “Developing Agricultural Input Markets inGhana: Background Information to the Action Plan.” IFDCinternal document.

5
fertilizer market. Because Ghana does not have facili-ties for domestic production of fertilizers, it has todepend on imports to meet its fertilizer requirements.With a depreciating exchange rate, the value of im-ported goods increases in direct proportion to the de-preciation of currency. Between 2000 and May 2001,the value of the Cedi depreciated from ¢3,944/$ to¢7,000/$. Such depreciation not only adds to the costof inputs but also prevents investment in business de-velopment by creating risk and uncertainty in the busi-ness environment.
High interest rates, associated currency depreciationand inflation, and stringent collateral requirementsmake borrowing for business development almost im-possible and/or unreasonable. For example, interestrates in Ghana varied between 42% and 56% in May2001. At such high interest rates, recovery of invest-ment may require near doubling of prices in a singlecropping season. Very high prices discourage demandand therefore lead to reduced incentive for investmentin the input business. Few traders can afford to bor-row from banks. The high risk of investing in agricul-ture and agribusiness has discouraged commercialbanks from lending minimal funds to agriculture oragribusiness. Thus, the lack of funds for business de-velopment is a serious constraint to the private-sectorparticipation in the input market development.
Difficulties caused by a depreciating exchange rateand high interest rates are compounded by the lack ofinfrastructure, especially feeder roads, in rural areas.The paucity of rural roads makes the expansion ofdealer networks into rural areas difficult. As a result,most of the input retailers remain concentrated in ur-ban or peri-urban areas, and many farmers have totravel 30-50 km for a bag of fertilizers or seed.
Market Development IssuesA well-functioning competitive market requires a
conducive policy environment, adequate availabilityof human capital at all levels in both the private andpublic sector, easy access to finance and information,and effective implementation of regulatory systems andcontract enforcement mechanisms. In Ghana, variousreforms of the 1990s have created an enabling policyenvironment for private-sector participation in the mar-ketplace, and there are few distorting policies in place.However, skills available for efficient functioning ofinput markets are limited because policy reforms werenot accompanied by the development and strenthening
of human capital, institutional support, and marketinginfrastructure. There is a general lack of dealer net-works in rural areas, which acts as a severe constraintfor farmers to access inputs. Many of the dealers whoare currently involved in the input business do not haveadequate marketing and management skills, and theirtechnical understanding of product characteristics isalso limited.
Finance is the lifeblood of business advancement.Yet, access to finance for importing fertilizers and otherinputs and for developing small and medium-size mar-keting businesses is not easy. As mentioned earlier,commercial banks are reluctant to provide funds foragriculture-related activities, and in situations wherethey are willing to loan funds, collateral requirementsare so stringent and interest rates are so high that fewdealers can afford to borrow. Likewise, dealers andimporters have limited information about prices, sup-plies, and other market conditions in the national, re-gional, and global markets. In this context, the ADB/Ghana efforts in helping importers to have easier ac-cess to foreign exchange are laudable. However, theassessment team strongly believes that tenderingmechanisms used by ADB/Ghana may not be the bestway to help importers. Rather than selecting import-ers to supply fertilizers to cotton-producing compa-nies, the bank may consider creating a fund for theimportation of inputs and allowing eligible importersto access this fund.12
Ineffective implementation of regulatory mecha-nisms for seed and CPPs, especially truth in labeling,has facilitated the proliferation of the sale of poor-quality or outdated pesticides and has discouragedhonest traders from entering the input business. Insti-tutional mechanisms and trained staff are needed toenforce existing regulations, and new laws should beenacted to further strengthen the legal backing of theregulatory services’ activities.
II.3. Financial Support Services
Financial InstitutionsThe landscape of financial institutions dealing with
agriculture in Ghana includes both formal- and informal-
12. A number of stakeholders did not accept this position dur-ing the validation workshop. They argued that identifying andresolving the problems associated with the current tenderingprocess is preferable to ending the practice of tender.
6
sector institutions. The formal-sector institutions canbe grouped into banking and non-banking institutions.At present, banking institutions consist of BOG—theCentral Bank, 17 deposit money banks (DMBs), and113 rural banks. The DMBs consist of nine commer-cial banks,13 five merchant banks,14 and three devel-opment banks.15 Three of the commercial banks,namely GCB, SSB, and SCBSCB, are listed on theGhana Stock Exchange (GSE). The GOG has equityinterests in the NIB (86.42%), GCB (46.8%), and ADB(51.83%). The BOG owns the remaining ADB shares(47.17%). The other DMBs are all privately owned.The rural banks are privately owned, with the BOGholding preferential shares in some; individuals andcorporate bodies hold ordinary shares.
The main non-bank financial institutions (NBFIs)of any relevance to agriculture and input markets arethe credit unions (CUs) and the savings & loans com-panies (S&LCOs). The CUs mobilize savings fromtheir members only and grant loans exclusively to thesemembers. There are about 225 CUs with a total mem-bership of about 70,000 and cumulative savings ofabout ¢40.0 billion. About 30% of the CUs are basedin rural areas. Notable among them is Kuapa KookooCredit Union (KKCU), with a membership of about6,000 cocoa farmers and a total savings of about¢1.5 billion. There are eight S&LCOs, which are basedin urban and peri-urban areas. They provide financialservices to micro, small, and medium enterprises, in-cluding petty traders.
In addition to CUs and S&LCOs, there are someNGOs with microfinance focus that provide financialservices to the agricultural sector. The main ones areSinapi Aba Trust (SAT), Adventist Relief Agency(ADRA), World Vision International (WVI), Freedomfrom Hunger (FFH), and TechnoServe.
Besides the formal financial sectors, there are nu-merous informal financial institutions such as the Ro-tating Savings and Credit Associations (ROSCAs) and‘Susus’, which also provide financial services to farm-ers and other entrepreneurs engaged in agriculture.
Regional DistributionBy year-end 1999, the DMBs had about 302
branches distributed throughout the country. However,the spatial distribution of the branches was skewedand is still skewed in favor of the Greater Accra (32%),Western (13.6%), and Ashanti (9.6%) regions. On theother hand, the regional distribution of rural banks wasmore dispersed: 22 in Ashanti, 18 in Brong Ahafo, 20in Central, 19 in Eastern, 6 in Greater Accra, 3 in North-ern, 2 in Upper West, 3 in Upper East, 8 in Volta, and12 in Western. However, a significant number of theserural banks are not doing well. The distribution of theCUs as of December 2000 is also much better spreadacross the regions with 28 in Ashanti, 29 in BrongAhafo, 26 in Central, 19 in Eastern, 65 in GreaterAccra, 5 in Northern, 15 in Upper West, 9 in UpperEast, 11 in Volta, and 18 in Western. The regional dis-tribution of these financial institutions reveals that theregions with the least number of branches of the ma-jor banks also have the least number of rural banks.
Distribution of Bank Lending by SectorAvailable data indicate that, despite its critical role
in the national economy, the agricultural sector (in-cluding forestry and fishery) gets only a small propor-tion of the total DMB lending. According to the BOG(1999), as of the end of 1999, for example, the DMBlending to agriculture stood at ¢340.1 billion (i.e., aboutUS $97.12 million). This represented about 11.8% oftotal outstanding credit to all sectors, estimated to beabout ¢2883.9 billion (US $823.8 million). The cor-responding outstanding credit to other sectors of theeconomy was ¢717.1 billion (24.9%) for the manu-facturing sector and ¢451.4 billion (15.7%) for com-merce and finance. DMBs’ outstanding credit to agri-culture in 1997 and 1998 was 11.9% and 12.2%,respectively.
With regard to rural banks, the sectoral distributionof loans and advances is also heavily skewed towardnonagricultural trading businesses. In 1999, for ex-ample, only 18.9% of the total outstanding credit of
13. These are Ghana Commercial Bank Ltd. (GCB), StandardChartered Bank (Ghana) Ltd. (SCB), Barclays Bank Ghana Ltd.(BBG), Social Security Bank Ltd. (SSB), Metropolitan and Al-lied Bank, International Commercial Bank, Stanbic Bank GhanaLtd., The Trust Bank Ltd. (TTB), and Unibank Ghana Ltd.14. These are Merchant Bank Ghana Ltd., Ecobank Ghana Ltd.,CAL Merchant Bank Ltd., First Atlantic Merchant Bank Ltd.,and Amalgamated Bank. In addition to being a commercialbank, TTB also plays the role of a merchant bank.15. These are the ADB, Prudential Bank Ltd., and NationalInvestment Bank (NIB).

7
¢10.07 billion from 72 rural banks went into agricul-ture (Bank of Ghana, 1999). This represented an aver-age credit to the agricultural sector of about¢138.89 million per rural bank. The data also indicatedthat as much as 71.1% went into trading activities andloans to salaried workers.
The relatively small agricultural share of total out-standing credit of DMBs and rural banks is largely adirect result of the high risks associated with high de-fault levels in the agricultural sector, as well as theinvestment opportunity in risk-free Treasury Bills,which also offer high yields and lower cost manage-ment. The main factors contributing to the high de-fault levels in the agricultural sector include a highlevel of willful default and the decreasing profitabil-ity of agricultural production due to the unfavorableand increasing input/output price ratios and continu-ing high cost of capital.
Dominance of the ADB in Agricultural LendingThere is strong evidence that the ADB provides the
bulk of lending to agriculture. Its share of the totalDMB credit outstanding to the agricultural sector forthe years 1997, 1998, and 1999 was 80.4%, 82.5%,and 77.7%, respectively.16 The dominant role the ADBplays in agricultural lending is largely explained bythe fact that, as a government bank, ADB is more fa-vorably disposed to accessing often-subsidized gov-ernment loans from external sources than are otherDMBs. For example, between 1980 and 1999, ADBhas accessed four lines of credit from the African De-velopment Bank (AfDB) Group worth aboutUS $80.0 million and others from International Fundfor Agricultural Development (IFAD) and AgenceFrançaise de Développement (AFD).
Availability of Finance for Agricultural InputTrade
The ADB, BBG, and SCB are the main financialinstitutions that provide foreign exchange support forthe importation of fertilizers and CPPs. Imports of veg-etable seeds by AGLOW and AgriMat are normallyeffected through suppliers’ credit arrangements. TheADB, SSB, SCB, and BBG handle local bank transac-
tions of input dealers. The ADB, rural banks, and someGCB branches in rural areas provide limited credit atthe local retailers’ level. At the farmers’ level, ADB,rural banks, microfinance institutions (MFIs) such ascredit unions, and some NGOs with microfinance fo-cus are the key suppliers of credit. Clearly, there areno specific lending products for either input dealersor importers. This is largely attributed to a lack ofproper understanding of the input markets by the banksand input dealers, as well as the associated risks. De-pending on the loan amount and the risk involved, anauthorized person or committee approves the loan.
The total annual foreign exchange needed for agri-cultural inputs is estimated to be about US $31.9 mil-lion (i.e., US $12.5 million for fertilizers, US $1 mil-lion for seed, and US $18.4 million for CPPs). Nettingout the yearly allocation of US $6.0 million from AfDBGroup (which is drawn on the US$ 20 million line ofcredit from ADF), there is a deficit of about US $25.9million to be filled. In other words, foreign exchangeavailable from ADB for the importation of agriculturalinputs has been maintained at a level equivalent to only19% of the annual requirements. The balance of 81%finance comes mainly from CitiBank Line of Creditto ADB, BBG, SCB, and Suppliers’ Credit.
Terms and Conditions for Agricultural InputLending
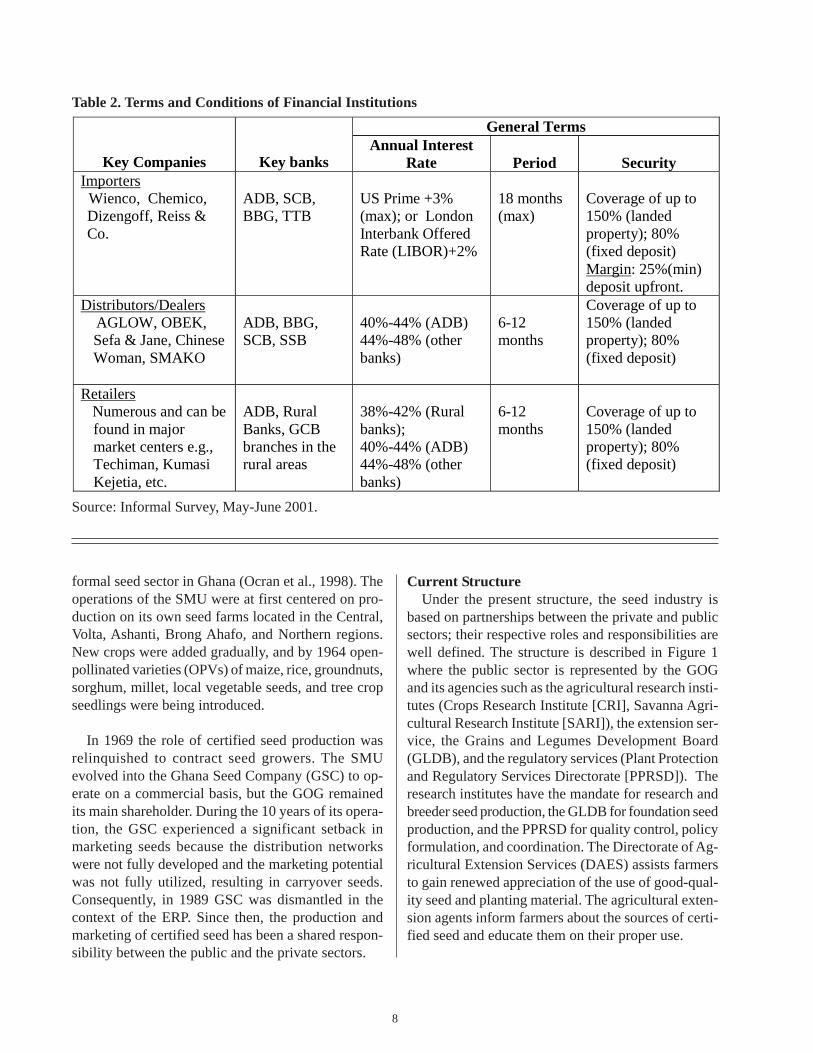
The terms and conditions of financial institutionsfor lending to agri-input dealers are summarized inTable 2.
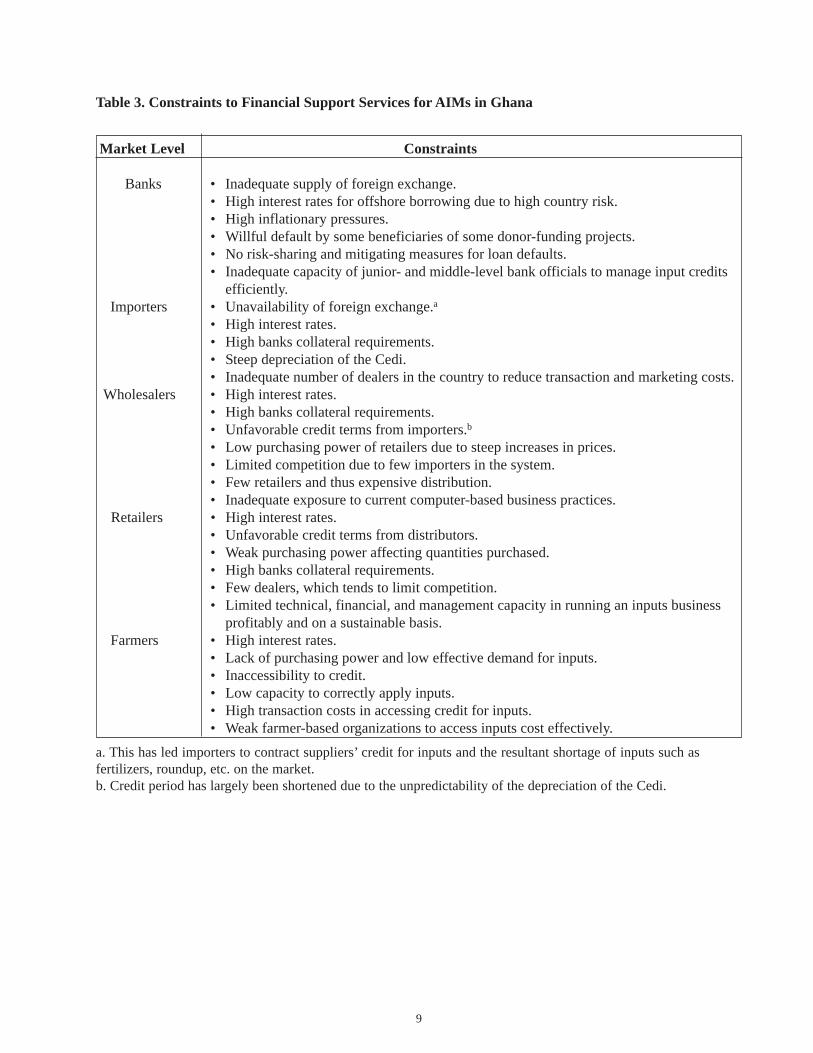
Development Potential and Principal ConstraintsFrom the perspective of the key stakeholders in the
input market chain, there are numerous financial fac-tors that constrain the operation of an efficient agri-cultural input market; these constraints to financial sup-port services are identified in Table 3.
II.4. The Seed Market
Evolution of the IndustryThe institutionalized seed multiplication program
in Ghana started in the late 1950s with hybrid maize.In 1958, the Hybrid Seed Multiplication Unit (HSMU)was established within the Ministry of Agriculture. In1961 the HSMU evolved into the Seed MultiplicationUnit (SMU), and this signaled the beginning of the
16. ADB’s outstanding credit (in nominal terms) to agricul-ture in 1997, 1998, and 1999 was ¢124.0 billion, ¢182.53 bil-lion, and ¢264.29 billion, respectively.
8
Table 2. Terms and Conditions of Financial Institutions
Source: Informal Survey, May-June 2001.
formal seed sector in Ghana (Ocran et al., 1998). Theoperations of the SMU were at first centered on pro-duction on its own seed farms located in the Central,Volta, Ashanti, Brong Ahafo, and Northern regions.New crops were added gradually, and by 1964 open-pollinated varieties (OPVs) of maize, rice, groundnuts,sorghum, millet, local vegetable seeds, and tree cropseedlings were being introduced.
In 1969 the role of certified seed production wasrelinquished to contract seed growers. The SMUevolved into the Ghana Seed Company (GSC) to op-erate on a commercial basis, but the GOG remainedits main shareholder. During the 10 years of its opera-tion, the GSC experienced a significant setback inmarketing seeds because the distribution networkswere not fully developed and the marketing potentialwas not fully utilized, resulting in carryover seeds.Consequently, in 1989 GSC was dismantled in thecontext of the ERP. Since then, the production andmarketing of certified seed has been a shared respon-sibility between the public and the private sectors.
Current StructureUnder the present structure, the seed industry is
based on partnerships between the private and publicsectors; their respective roles and responsibilities arewell defined. The structure is described in Figure 1where the public sector is represented by the GOGand its agencies such as the agricultural research insti-tutes (Crops Research Institute [CRI], Savanna Agri-cultural Research Institute [SARI]), the extension ser-vice, the Grains and Legumes Development Board(GLDB), and the regulatory services (Plant Protectionand Regulatory Services Directorate [PPRSD]). Theresearch institutes have the mandate for research andbreeder seed production, the GLDB for foundation seedproduction, and the PPRSD for quality control, policyformulation, and coordination. The Directorate of Ag-ricultural Extension Services (DAES) assists farmersto gain renewed appreciation of the use of good-qual-ity seed and planting material. The agricultural exten-sion agents inform farmers about the sources of certi-fied seed and educate them on their proper use.
General Terms
Key Companies Key banks Annual Interest
Rate Period Security Importers Wienco, Chemico, Dizengoff, Reiss & Co.
ADB, SCB, BBG, TTB
US Prime +3% (max); or London Interbank Offered Rate (LIBOR)+2%
18 months (max)
Coverage of up to 150% (landed property); 80% (fixed deposit) Margin: 25%(min) deposit upfront.
Distributors/Dealers AGLOW, OBEK,
Sefa & Jane, Chinese Woman, SMAKO
ADB, BBG, SCB, SSB
40%-44% (ADB) 44%-48% (other banks)
6-12 months
Coverage of up to 150% (landed property); 80% (fixed deposit)
Retailers Numerous and can be
found in major market centers e.g., Techiman, Kumasi Kejetia, etc.
ADB, Rural Banks, GCB branches in the rural areas
38%-42% (Rural banks); 40%-44% (ADB) 44%-48% (other banks)
6-12 months
Coverage of up to 150% (landed property); 80% (fixed deposit)
9
Table 3. Constraints to Financial Support Services for AIMs in Ghana
a. This has led importers to contract suppliers’ credit for inputs and the resultant shortage of inputs such asfertilizers, roundup, etc. on the market.b. Credit period has largely been shortened due to the unpredictability of the depreciation of the Cedi.
Market Level Constraints
Banks • Inadequate supply of foreign exchange.• High interest rates for offshore borrowing due to high country risk.• High inflationary pressures.• Willful default by some beneficiaries of some donor-funding projects.• No risk-sharing and mitigating measures for loan defaults.• Inadequate capacity of junior- and middle-level bank officials to manage input credits
efficiently. Importers • Unavailability of foreign exchange.a
• High interest rates.• High banks collateral requirements.• Steep depreciation of the Cedi.• Inadequate number of dealers in the country to reduce transaction and marketing costs.
Wholesalers • High interest rates.• High banks collateral requirements.• Unfavorable credit terms from importers.b• Low purchasing power of retailers due to steep increases in prices.• Limited competition due to few importers in the system.• Few retailers and thus expensive distribution.• Inadequate exposure to current computer-based business practices.
Retailers • High interest rates.• Unfavorable credit terms from distributors.• Weak purchasing power affecting quantities purchased.• High banks collateral requirements.• Few dealers, which tends to limit competition.• Limited technical, financial, and management capacity in running an inputs business
profitably and on a sustainable basis. Farmers • High interest rates.
• Lack of purchasing power and low effective demand for inputs.• Inaccessibility to credit.• Low capacity to correctly apply inputs.• High transaction costs in accessing credit for inputs.• Weak farmer-based organizations to access inputs cost effectively.

10
Seed production in Ghana does not involve corpo-rate bodies or multinational companies but is confinedto progressive farmers who are registered seed grow-ers and to seed dealers and some NGOs. These groupshave the responsibility for the production and market-ing of certified seeds. Currently, there are 164 regis-tered seed growers and 127 registered seed dealersthroughout the country. Seed growers are loosely or-ganized into seed grower associations, namely, north-ern, middle, and southern sectors. Although most ofthe growers belong to the associations, membership isvoluntary. The main objective of these associations isto offer members an opportunity to share ideas and insome cases resources and to serve as a lobby group toprotect their common interest. These associations havereceived some support from NGOs such as SG 2000,Deutsche Gesellschaft für Technische Zusammenarbeit(GTZ), TechnoServe, and Cooperative for Assistanceand Relief Everywhere (CARE) International in termsof organizing regular meetings and training in busi-ness management.
Figure 1. Structure of the Ghana Seed Industry.
Regional Distribution of Seed Growers andDealers
Registered seed growers are dispersed in all the re-gions of Ghana. Regional distribution is as follows: 4in Greater Accra, 9 in Eastern, 7 in Central and West-ern, 14 in Ashanti, 22 in Brong Ahafo, 25 in Northern,7 in Upper East, 5 in Upper West, and 11 in Volta.
The distribution of dealers by region is as follows:16 in Greater Accra, 11 in Eastern, 15 in Central andWestern, 19 in Ashanti, 12 in Brong Ahafo, 6 in North-ern, 5 in Upper East, 3 in Upper West, and 30 in Volta.The large seed dealers are AGLOW and AgriMat inthe Greater Accra region and OBEK and Sefa and Janein the Ashanti region.
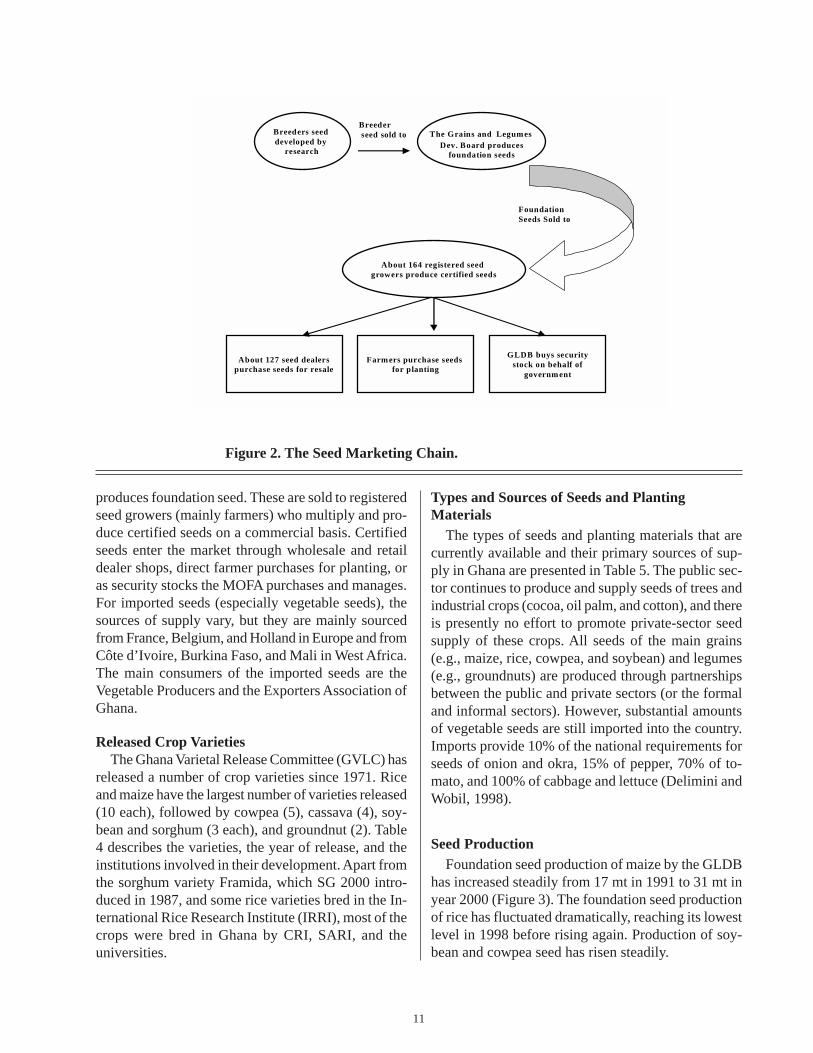
Seed Marketing ChainThe marketing channel for domestically produced
seeds begins with breeding, with the major players be-ing the crops research institutes and the universities(Figure 2). Once the variety is released, the GLDB
Ministry of Food and Agriculture(MOFA)
National Seed Committee(NSC)
National Seed Service(NSS)
Research Institutes &Universities
Grains & Legumes
DevelopmentBoard
Ghana SeedInspection Division of
PPRSD
AgriculturalExtension
Services ofMOFA
Private SectorSeed Growers
(farmers)
Private SectorSeed Dealers
(traders)
NGO SupportGrowers and
Dealers
Public Sector Participation Private Sector Participation
11
Figure 2. The Seed Marketing Chain.
produces foundation seed. These are sold to registeredseed growers (mainly farmers) who multiply and pro-duce certified seeds on a commercial basis. Certifiedseeds enter the market through wholesale and retaildealer shops, direct farmer purchases for planting, oras security stocks the MOFA purchases and manages.For imported seeds (especially vegetable seeds), thesources of supply vary, but they are mainly sourcedfrom France, Belgium, and Holland in Europe and fromCôte d’Ivoire, Burkina Faso, and Mali in West Africa.The main consumers of the imported seeds are theVegetable Producers and the Exporters Association ofGhana.
Released Crop VarietiesThe Ghana Varietal Release Committee (GVLC) has
released a number of crop varieties since 1971. Riceand maize have the largest number of varieties released(10 each), followed by cowpea (5), cassava (4), soy-bean and sorghum (3 each), and groundnut (2). Table4 describes the varieties, the year of release, and theinstitutions involved in their development. Apart fromthe sorghum variety Framida, which SG 2000 intro-duced in 1987, and some rice varieties bred in the In-ternational Rice Research Institute (IRRI), most of thecrops were bred in Ghana by CRI, SARI, and theuniversities.
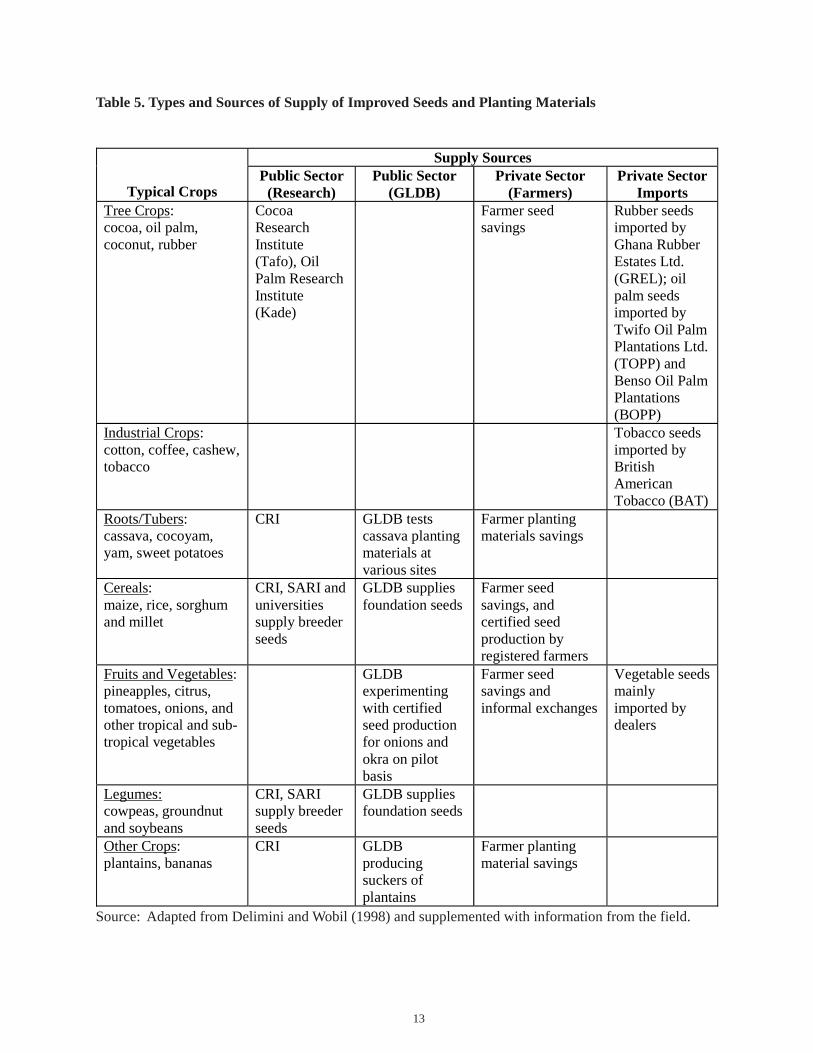
Types and Sources of Seeds and PlantingMaterials
The types of seeds and planting materials that arecurrently available and their primary sources of sup-ply in Ghana are presented in Table 5. The public sec-tor continues to produce and supply seeds of trees andindustrial crops (cocoa, oil palm, and cotton), and thereis presently no effort to promote private-sector seedsupply of these crops. All seeds of the main grains(e.g., maize, rice, cowpea, and soybean) and legumes(e.g., groundnuts) are produced through partnershipsbetween the public and private sectors (or the formaland informal sectors). However, substantial amountsof vegetable seeds are still imported into the country.Imports provide 10% of the national requirements forseeds of onion and okra, 15% of pepper, 70% of to-mato, and 100% of cabbage and lettuce (Delimini andWobil, 1998).
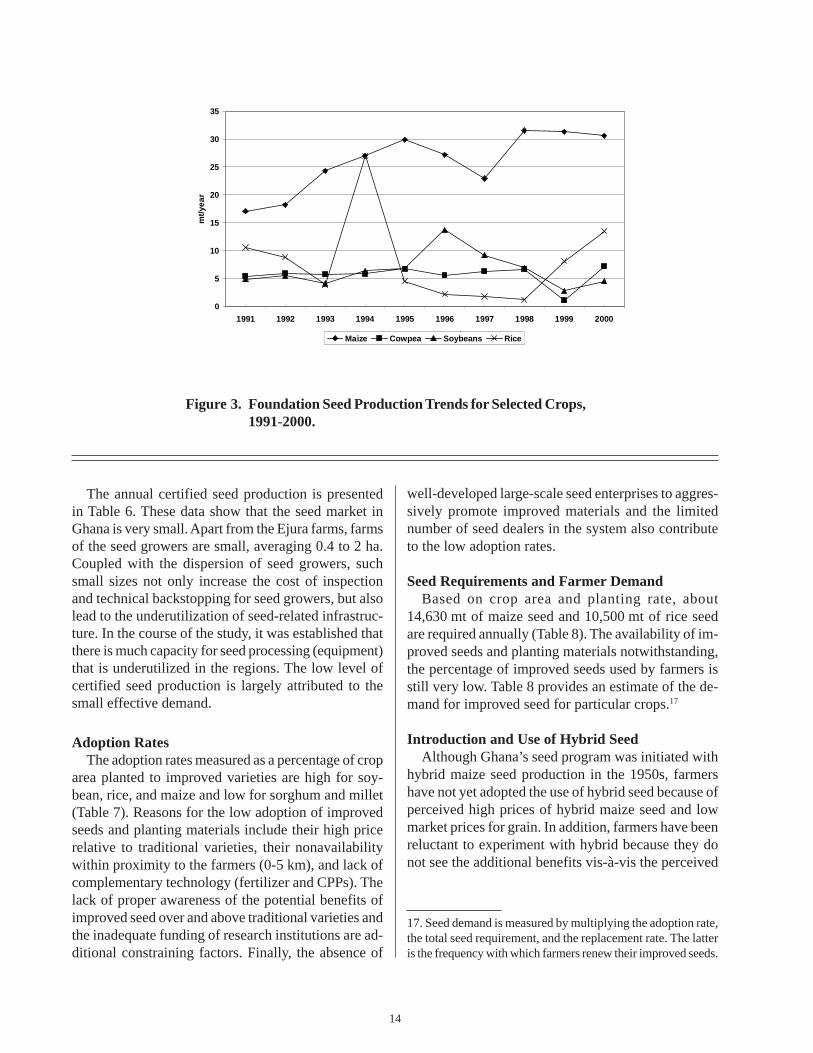
Seed ProductionFoundation seed production of maize by the GLDB
has increased steadily from 17 mt in 1991 to 31 mt inyear 2000 (Figure 3). The foundation seed productionof rice has fluctuated dramatically, reaching its lowestlevel in 1998 before rising again. Production of soy-bean and cowpea seed has risen steadily.
Breeders seed developed by
research
Breeder seed sold to The Grains and Legum es
Dev. Board producesfoundation seeds
About 164 registered seed growers produce certified seeds
FoundationSeeds Sold to
About 127 seed dealerspurchase seeds for resale
Farm ers purchase seeds for planting
GLDB buys securitystock on behalf of
governm ent

12
Table 4. Varieties of Selected Crops Released in Ghana (1971-97)
Source: Ghana Seed Inspection Division (GSID) data taken from Delimini and Wobil, 1998.
CROP Variety Year of Release
Known % of Total
Seed Planted
Breeding Institution Comments
Aburotia 1983 - CRI Kumasi Replaced by Abeleehi Dobidi 1984 - CRI Kumasi Replaced by Okomasa
Okomasa 1988 7.5 CRI Kumasi Widely available to farmers
Abeleehi 1990 10 CRI Kumasi Widely available to farmers
Obatanpa 1992 30 CRI Kumasi Widely available to farmers
Dorke SR 1992 2.5 CRI Kumasi Widely available to farmers
Dodzie 1997 - CRI Kumasi Dadaba 1997 - CRI Kumasi Hybrid Mamaba 1997 - CRI Kumasi
MAIZE
Cidaba 1997 - CRI Kumasi C 463 1971 - IRRI IR 20 1972 - IRRI IR 5 1972 - IRRI IR 442 1975 - SARI IR 8 1982 - Univ. of Ghana IR 3278 1983 - Univ. of Ghana GR 18 1986 - SARI Available Bengbie 1993 - SARI GR 21 1986 - SARI Available
RICE
Sikamu 1997 - CRI Kumasi Amatin 1983 Traces CRI Kumasi Soronko 1983 Traces CRI Kumasi Asontem 1987 60 CRI Kumasi Ayiyi 1992 10 CRI Kumasi
COWPEA
Bengpla 1992 30 CRI Kumasi Anidaso 1992 35 CRI Kumasi Salina 1 1992 20 SARI SOYBEAN Salina 2 1993 25 SARI F-MIX 1986 - SARI GROUNDNUT Sinkazie 1986 - SARI Naga-White 1973 - SARI
Framida 1987 - SG 2000 introduced SORGHUM
Kapaala 1998 Traces SARI Gblemoduade 1992 - CRI Available Abasafitaa 1992 - CRI Available Afisiafi 1992 - CRI Available CASSAVA
Tek Bankyi 1997 - UST Available
13
Table 5. Types and Sources of Supply of Improved Seeds and Planting Materials
Source: Adapted from Delimini and Wobil (1998) and supplemented with information from the field.
Supply Sources
Typical Crops Public Sector
(Research) Public Sector
(GLDB) Private Sector
(Farmers) Private Sector
Imports Tree Crops: cocoa, oil palm, coconut, rubber
Cocoa Research Institute (Tafo), Oil Palm Research Institute (Kade)
Farmer seed savings
Rubber seeds imported by Ghana Rubber Estates Ltd. (GREL); oil palm seeds imported by Twifo Oil Palm Plantations Ltd. (TOPP) and Benso Oil Palm Plantations (BOPP)
Industrial Crops: cotton, coffee, cashew, tobacco
Tobacco seeds imported by British American Tobacco (BAT)
Roots/Tubers: cassava, cocoyam, yam, sweet potatoes
CRI GLDB tests cassava planting materials at various sites
Farmer planting materials savings
Cereals: maize, rice, sorghum and millet
CRI, SARI and universities supply breeder seeds
GLDB supplies foundation seeds
Farmer seed savings, and certified seed production by registered farmers
Fruits and Vegetables: pineapples, citrus, tomatoes, onions, and other tropical and sub-tropical vegetables
GLDB experimenting with certified seed production for onions and okra on pilot basis
Farmer seed savings and informal exchanges
Vegetable seeds mainly imported by dealers
Legumes: cowpeas, groundnut and soybeans
CRI, SARI supply breeder seeds
GLDB supplies foundation seeds
Other Crops: plantains, bananas
CRI GLDB producing suckers of plantains
Farmer planting material savings
14
The annual certified seed production is presentedin Table 6. These data show that the seed market inGhana is very small. Apart from the Ejura farms, farmsof the seed growers are small, averaging 0.4 to 2 ha.Coupled with the dispersion of seed growers, suchsmall sizes not only increase the cost of inspectionand technical backstopping for seed growers, but alsolead to the underutilization of seed-related infrastruc-ture. In the course of the study, it was established thatthere is much capacity for seed processing (equipment)that is underutilized in the regions. The low level ofcertified seed production is largely attributed to thesmall effective demand.
Adoption RatesThe adoption rates measured as a percentage of crop
area planted to improved varieties are high for soy-bean, rice, and maize and low for sorghum and millet(Table 7). Reasons for the low adoption of improvedseeds and planting materials include their high pricerelative to traditional varieties, their nonavailabilitywithin proximity to the farmers (0-5 km), and lack ofcomplementary technology (fertilizer and CPPs). Thelack of proper awareness of the potential benefits ofimproved seed over and above traditional varieties andthe inadequate funding of research institutions are ad-ditional constraining factors. Finally, the absence of
Figure 3. Foundation Seed Production Trends for Selected Crops,1991-2000.
well-developed large-scale seed enterprises to aggres-sively promote improved materials and the limitednumber of seed dealers in the system also contributeto the low adoption rates.
Seed Requirements and Farmer DemandBased on crop area and planting rate, about
14,630 mt of maize seed and 10,500 mt of rice seedare required annually (Table 8). The availability of im-proved seeds and planting materials notwithstanding,the percentage of improved seeds used by farmers isstill very low. Table 8 provides an estimate of the de-mand for improved seed for particular crops.17
Introduction and Use of Hybrid SeedAlthough Ghana’s seed program was initiated with
hybrid maize seed production in the 1950s, farmershave not yet adopted the use of hybrid seed because ofperceived high prices of hybrid maize seed and lowmarket prices for grain. In addition, farmers have beenreluctant to experiment with hybrid because they donot see the additional benefits vis-à-vis the perceived
17. Seed demand is measured by multiplying the adoption rate,the total seed requirement, and the replacement rate. The latteris the frequency with which farmers renew their improved seeds.
0
5
10
15
20
25
30
35
1991 1992 1993 1994 1995 1996 1997 1998 1999 2000
mt/y
ear
Maize Cowpea Soybeans Rice
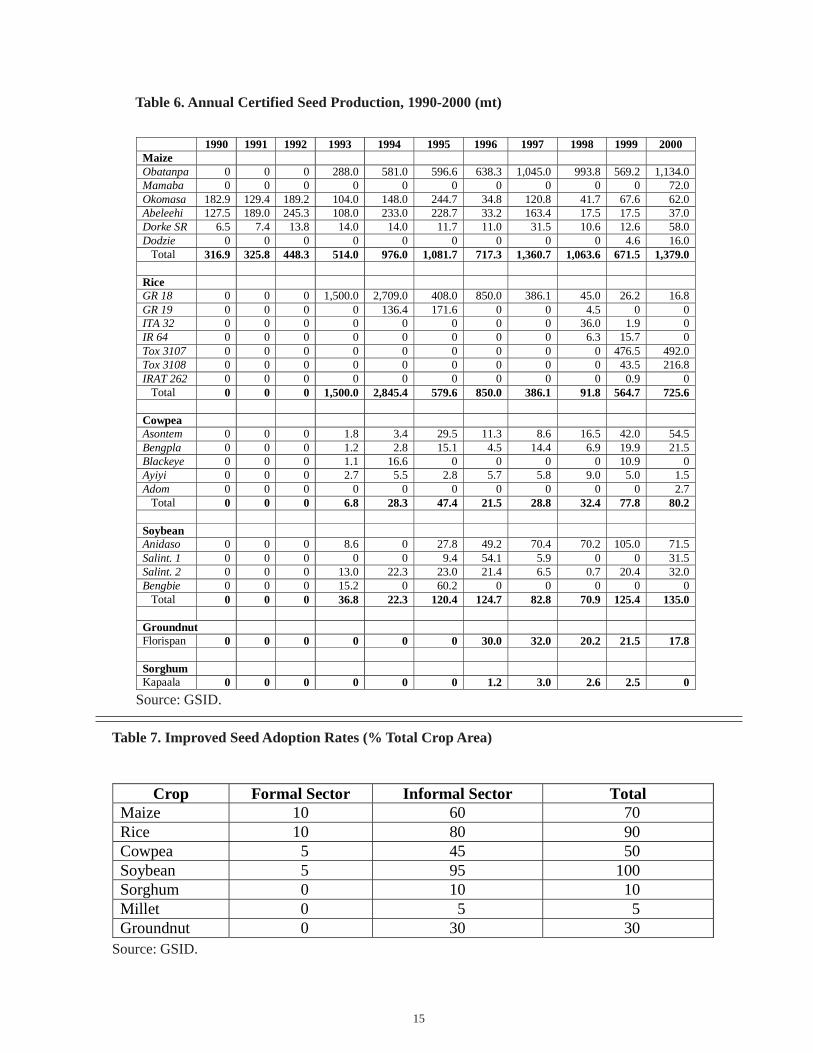
15
Table 6. Annual Certified Seed Production, 1990-2000 (mt)
Source: GSID.
Source: GSID.
Table 7. Improved Seed Adoption Rates (% Total Crop Area)
Crop Formal Sector Informal Sector Total Maize 10 60 70 Rice 10 80 90 Cowpea 5 45 50 Soybean 5 95 100 Sorghum 0 10 10 Millet 0 5 5 Groundnut 0 30 30
1990 1991 1992 1993 1994 1995 1996 1997 1998 1999 2000 Maize Obatanpa 0 0 0 288.0 581.0 596.6 638.3 1,045.0 993.8 569.2 1,134.0 Mamaba 0 0 0 0 0 0 0 0 0 0 72.0 Okomasa 182.9 129.4 189.2 104.0 148.0 244.7 34.8 120.8 41.7 67.6 62.0 Abeleehi 127.5 189.0 245.3 108.0 233.0 228.7 33.2 163.4 17.5 17.5 37.0 Dorke SR 6.5 7.4 13.8 14.0 14.0 11.7 11.0 31.5 10.6 12.6 58.0 Dodzie 0 0 0 0 0 0 0 0 0 4.6 16.0 Total 316.9 325.8 448.3 514.0 976.0 1,081.7 717.3 1,360.7 1,063.6 671.5 1,379.0 Rice GR 18 0 0 0 1,500.0 2,709.0 408.0 850.0 386.1 45.0 26.2 16.8 GR 19 0 0 0 0 136.4 171.6 0 0 4.5 0 0 ITA 32 0 0 0 0 0 0 0 0 36.0 1.9 0 IR 64 0 0 0 0 0 0 0 0 6.3 15.7 0 Tox 3107 0 0 0 0 0 0 0 0 0 476.5 492.0 Tox 3108 0 0 0 0 0 0 0 0 0 43.5 216.8 IRAT 262 0 0 0 0 0 0 0 0 0 0.9 0 Total 0 0 0 1,500.0 2,845.4 579.6 850.0 386.1 91.8 564.7 725.6 Cowpea Asontem 0 0 0 1.8 3.4 29.5 11.3 8.6 16.5 42.0 54.5 Bengpla 0 0 0 1.2 2.8 15.1 4.5 14.4 6.9 19.9 21.5 Blackeye 0 0 0 1.1 16.6 0 0 0 0 10.9 0 Ayiyi 0 0 0 2.7 5.5 2.8 5.7 5.8 9.0 5.0 1.5 Adom 0 0 0 0 0 0 0 0 0 0 2.7 Total 0 0 0 6.8 28.3 47.4 21.5 28.8 32.4 77.8 80.2 Soybean Anidaso 0 0 0 8.6 0 27.8 49.2 70.4 70.2 105.0 71.5 Salint. 1 0 0 0 0 0 9.4 54.1 5.9 0 0 31.5 Salint. 2 0 0 0 13.0 22.3 23.0 21.4 6.5 0.7 20.4 32.0 Bengbie 0 0 0 15.2 0 60.2 0 0 0 0 0 Total 0 0 0 36.8 22.3 120.4 124.7 82.8 70.9 125.4 135.0 Groundnut Florispan 0 0 0 0 0 0 30.0 32.0 20.2 21.5 17.8 Sorghum Kapaala 0 0 0 0 0 0 1.2 3.0 2.6 2.5 0

16
Table 8. Annual Requirement and Estimated Demand for Improved Seed in Ghana
na: not available1broadcastSource: GSID.
higher costs of investments in hybrids in terms of fer-tilizers and other crop husbandry practices. While tosome extent these reasons may be valid, it appears thatfarmers need to be educated that under the same con-ditions and agronomic practices hybrid seeds will stilloutyield open-pollinated and self-pollinated varieties.To boost agricultural production and significantly im-prove the profitability of seed production, there is needto improve farmer perception of the potential benefitsof hybrid seeds by creating awareness through dem-onstrations and publicity.
Seed PricesSince the liberalization of input markets, market
forces have determined seed prices. Table 9 shows thatbetween 1994 and 2000 seed prices have been increas-
ing. The price of maize seed almost quadrupled overthis period; that of cowpea seed tripled while soybeanseed price doubled. There is a direct relationship be-tween grain and seed prices. Seed prices are generallytwice the prevailing grain prices, and in years whengrain prices collapse, the demand for seeds decreases.Because of the grain-seed price relationship, seedgrowers usually use prevailing grain prices as leadingindicators of the level of seed prices in the followingyear and hence plan their production accordingly.
The Legal and Regulatory Framework andInstitutional Support
Officially, the 1972 Certification and Standards De-cree and the 1973 Certification and Standards Regula-
Table 9. Market Prices of Improved Seed, by Crop, 1994-2000
Source: GSID.
Crop
Crop Area (ha)
Seeding Rate
(kg/ha)
Total Seed Requirement
(mt) (a)
Adoption Rate (%)
(b)
Replenishment Rate (%)
(c)
Total Seed Demand
(mt) (abc)
Maize 665,000 22 14,630 70 20 2,048 Cowpea 100,000 20 2,000 90 33 594 Rice 105,000 100 10,500 50 10 525 Soybean 2,000 50 1001 na Sorghum 314,000 12 3,708 na Millet 190,000 6 1,140 na
Cedis/kg of Seed Year Maize Cowpea Soybean Rice 1994 700 1,150 600 225 1995 1,100 1,175 900 250 1996 1,750 2,350 1,000 312.5 1997 2,400 2,800 1,200 375 1998 2,000 3,000 1,200 400 1999 2,000 3,000 1,200 400 2000 3,000 3,500 1,500 450

17
tions govern the production, importation, and market-ing of seed in Ghana. However, these instruments wereamended in the early 1990s. Although the amendedlegislation has been taken through the administrativeprocess leading to its enactment, it is yet to be enactedby an Act of Parliament. Nevertheless, GSID, whichwas mandated to implement the amended laws andsupporting regulations in collaboration with NSS, hasbeen functioning. GSID and the entire seed industryare complying with the revised legislation pending itsenactment. However, GSID does not have the legalbacking to prosecute violators of the seed laws. Thelegislation imposes restrictions on the importation ofseeds into the country and requires that all seed im-porters, growers, and processors be registered.
In terms of institutional support, GSID is a divisionwithin PPRSD responsible for the registration of seedproducers and dealers and for field inspections andrejection or approval of seed lots. In addition, it is re-sponsible for monitoring seed dealers at storage andsale periods and for seed certification, and it offerstraining of seed inspectors and producers in internalseed quality assurances, seed processing, marketing,and packaging. It also fixes fees for seed certificationand testing, monitors the supply of seeds for purposesof seed security, organizes training courses on all as-pects of the seed industry, and coordinates the activi-ties of the different agencies involved in the seed in-dustry program. Finally, GSID operates a national seed-testing laboratory. Other regional satellite laboratoriesare located at Ho, Winneba, Kumasi, Tamale, Wa, andBolgatanga.
The NSS is the technical arm of the seed industry.As part of the Directorate of Crop Services (DCS) ofthe MOFA, the NSS provides leadership and techni-cal support for the development of seed productionand commercialization. The NSS serves as secretariatof the NSC, which is responsible for policy issues.The NSC has a subcommittee (the National VarietalRelease Committee—VRC) responsible for releasingnew varieties and deleting obsolete varieties from theofficial variety list based on the NSC’s criteria.
Main ConstraintsThe following seven factors are the main constraints
affecting the development of the seed market in Ghana:
Inadequate Resources for Supporting InstitutionsInadequate, irregular, and late release of funds to
the research institutes, GLDB, and other agencies re-lated to seed production affects the implementation ofany meaningful seed development strategy becauseseed production activities are time bound. During thecourse of the field visits, it was established that thepublic-sector institutions are severely strained and re-quire some policy interventions to become effectivepartners in the seed industry. For example, the CRI’slands for trials are being taken over by landowners.The research staff is inadequate, overworked, andpoorly motivated; their research budget is limited, andthe bureaucratic procedures during the disbursementof funds lead to delays in research operations. Capac-ity in the research institutes to produce vegetable seedsis lacking; hence, there is a total dependence on im-ports of vegetable seeds from Europe and neighboringWest African countries. Most of the cold storage fa-cilities are nonfunctional.
The GLDB is inadequately staffed and may not beable to meet large demands for foundation seeds with-out increasing and strengthening staff. There are fewseed inspectors in the GSID to service the large num-ber of farmers. In addition, they are poorly equippedto reach farmers who are dispersed over large areas.
Limited Marketing Skills of Seed DealersDespite 10 years of private-sector involvement in
certified seed production, there is a limited number ofseed dealers in the system and few private wholesale/retail traders in seeds for rice, beans, cowpea, ground-nut, sorghum, and most other crops. Consequently, theformal seed sector is supplying only about 10% of to-tal seed demand, leaving the bulk (about 90%) of seedin the hands of the informal sector. This means thatthe Ghanaian farmer has very limited access to im-proved crop varieties.
The thin market for the Ghanaian seed industry isnot conducive to the emergence of large seed compa-nies in the country. With no developed seed companyand a limited number of seed dealers and retail out-lets, some aspects of the seed industry are not yet welldeveloped. Much of the seed of limited crop varietiesis produced by a handful of seed growers’ associations.There is need for the seed dealers/companies to be moreaggressive in contracting smallholders (seed growers’

18
associations) to produce seed of specific crop variet-ies that would be sold under their company logo. Cur-rently, few potential dealers can communicate withfarmers to determine what they want through on-farmtests and demonstrations. Similarly, few dealers havethe marketing skills to establish a brand name, adver-tise and demonstrate the technology to farmers, con-tract for seed production, process and package seed,and market through independent retail outlets. Furtherdown the marketing chain, potential seed dealers needto learn about all the possible sources for seed andmarketing strategies (e.g., demonstrations).
Along with the insufficient number of dealers andretail outlets, the government and dealers are not ap-plying enough effort to determining what farmers wantand educating them about new varieties and the use ofhybrid seeds through on-farm tests and demonstrations.Given the large number of farmers, the number of fielddemonstrations is inadequate.
Lack of Effective Linkages Between SeedProducers and Dealers or Other End Users
Maize and cowpea seed producers are organized intoseed growers’ associations and benefit from technicalbackstopping from extension and GSID. However,there are no effective linkages between these organizedseed growers and the seed dealers mainly because thereis a lack of trust as well as a lack of respect for salescontracts established between them. An important con-sequence of the lack of organized seed production andits weak linkage with the dealers is the irregular sup-ply of both domestically produced and imported seeds.
Examples of strong, successful linkages between in-put supply and market outlets were identified duringthe field study for the industrial crop companies. Inthese cases, the companies contract with producers topurchase their products; hence, they invest in the ac-quisition and use of inputs. These arrangements arecommon in the rubber plantations (GREL), the oil palmcompanies (TOPP and BOPP), tobacco (BAT), and tosome extent, cotton (Ghana Cotton Company [GCC]).For successful development of a viable seed industry,farmers must be assured of the markets for their prod-ucts in that the demand for seed and other inputs largelydepends on the demand for the outputs.
Financial ConstraintsSeed producers and dealers face credit constraints
in terms of access to financial capital from the com-
mercial banks. Interest rates are approximately 42%-45%, and sometimes the requirements for the credit(e.g., collateral) are stringent and beyond the capacityof farmers. Moreover, the prices at which the productsare sold do not provide enough incentive for farmersto invest in the production or in the marketing of im-proved seeds and planting materials.
Lack of Market InformationPresently, the Statistical, Research and Information
Department (SRID) is responsible for the systematiccollection, analysis, and diffusion of information oninventories, sales, imports, distribution, and consump-tion of agricultural inputs and products. With limitedhuman and financial resources, the SRID has not ef-fectively performed this task. This has affected theproper functioning of the seed market because deal-ers, importers, and other participants in the marketingchain do not have reliable information about local, re-gional, and global market situations for inputs andproducts. One important area where information ismost lacking is in the area of seed demand forecast-ing. In the absence of a reliable system, the seed grow-ers currently depend on signals from the grain market(grain price trends) as leading indicators of the fol-lowing year’s demand. This has resulted in difficul-ties in making production and marketing plans.
Unprofitable Seed Production Due to UnattractiveProduct Prices
The demand for improved seeds is a derived de-mand. It is derived from the demand for the productfor which the improved seeds are required. Farmers’motivations to use modern inputs (fertilizers, improvedseeds, and crop protection chemicals) depend in parton the marketing outlet availability and the demand.Except in a few cases where contracts exist betweenthe supplier and the buyer, there is generally a weakrelationship between seed growers and seed dealers.Most of the seed growers therefore face an uncertainmarket where the prices of improved seeds are deter-mined by the demand for the grains (and therefore theirprices). The grain prices have been low in Ghana andthus do not provide incentives for grain producers toinvest in the use of improved seeds. In addition, farm-ers have cited the high costs of acquiring seed and otherassociated inputs, including labor and transportation,as the main determinants of the profitability of seedproduction.
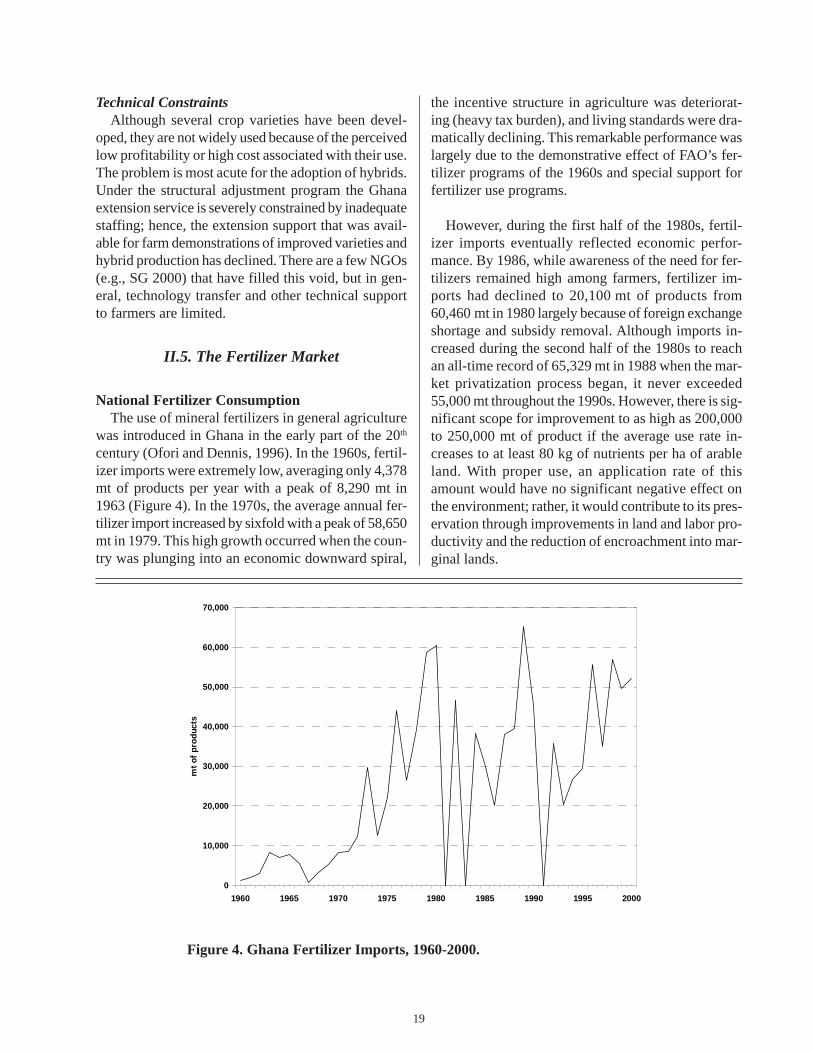
19
Technical ConstraintsAlthough several crop varieties have been devel-
oped, they are not widely used because of the perceivedlow profitability or high cost associated with their use.The problem is most acute for the adoption of hybrids.Under the structural adjustment program the Ghanaextension service is severely constrained by inadequatestaffing; hence, the extension support that was avail-able for farm demonstrations of improved varieties andhybrid production has declined. There are a few NGOs(e.g., SG 2000) that have filled this void, but in gen-eral, technology transfer and other technical supportto farmers are limited.
II.5. The Fertilizer Market
National Fertilizer ConsumptionThe use of mineral fertilizers in general agriculture
was introduced in Ghana in the early part of the 20th
century (Ofori and Dennis, 1996). In the 1960s, fertil-izer imports were extremely low, averaging only 4,378mt of products per year with a peak of 8,290 mt in1963 (Figure 4). In the 1970s, the average annual fer-tilizer import increased by sixfold with a peak of 58,650mt in 1979. This high growth occurred when the coun-try was plunging into an economic downward spiral,
the incentive structure in agriculture was deteriorat-ing (heavy tax burden), and living standards were dra-matically declining. This remarkable performance waslargely due to the demonstrative effect of FAO’s fer-tilizer programs of the 1960s and special support forfertilizer use programs.
However, during the first half of the 1980s, fertil-izer imports eventually reflected economic perfor-mance. By 1986, while awareness of the need for fer-tilizers remained high among farmers, fertilizer im-ports had declined to 20,100 mt of products from60,460 mt in 1980 largely because of foreign exchangeshortage and subsidy removal. Although imports in-creased during the second half of the 1980s to reachan all-time record of 65,329 mt in 1988 when the mar-ket privatization process began, it never exceeded55,000 mt throughout the 1990s. However, there is sig-nificant scope for improvement to as high as 200,000to 250,000 mt of product if the average use rate in-creases to at least 80 kg of nutrients per ha of arableland. With proper use, an application rate of thisamount would have no significant negative effect onthe environment; rather, it would contribute to its pres-ervation through improvements in land and labor pro-ductivity and the reduction of encroachment into mar-ginal lands.
Figure 4. Ghana Fertilizer Imports, 1960-2000.
0
10,000
20,000
30,000
40,000
50,000
60,000
70,000
1960 1965 1970 1975 1980 1985 1990 1995 2000
mt o
f pro
duct
s

20
20. The standard fertilizer application rate that the extensionservice recommends for cotton is a basal application of five50-kg bags of NPK and two 50-kg bags of AS as topdressing.For maize, the recommended rate is two 50-kg bags of 15-15-15 for basal application and two 50-kg bag of AS for topdressingor one basal 50-kg bag of 15-15-15 and one 50-kg bag of ureafor topdressing. For rice the standard recommendation is one50-kg bag of 15-15-15 and one 50-kg bag of AS or urea.
Product MixBefore the 1960s, straight fertilizers (ammonium
sulfate [AS], single superphosphate [SSP], triple su-perphosphate [TSP], muriate of potash [MOP], sul-fate of potash [SOP]) were the most commonly usedproducts in Ghana. Beginning in the late 1960s, com-pound fertilizers were introduced. Today, the domi-nant products are NPK compound fertilizers (especially15-15-15 and 20-20-0)18 that are applied as basic fer-tilizers and topdressed with AS and, to a lesser de-gree, urea. These grades are expensive on a nutrientbasis relative to high analysis formulations. Further-more they do not allow fertilizer to fully capture cropyield potential (IFDC, 1986; Ofori, 1999). Further-more, since 1954 AS has been the most importantsource of N and S although continuous use of AS islikely to lead to soil acidification, especially on thepoorly buffered soils of northern Ghana. Urea and cal-cium ammonium nitrate (CAN) are less acidifying andmore cost effective than AS. Finally, Ghana uses fer-tilizer formulations that are different from those usedin the neighboring countries with similar agro-ecolo-gies.19 This situation limits the scope for regional mar-ket development.
Blended fertilizers are not promoted in the Ghana-ian market for historical reasons and lack of education(product knowledge) on the part of farmers and agri-cultural extension agents. Historically, blended fertil-izers were excluded under the public monopoly regimein the Technical Product Specification List (TPSL) onthe grounds that they do not contain N in nitrate form.Similarly, diammonium phosphate (DAP), which is oneof the most cost-effective fertilizers in terms of nitro-gen and phosphorus, is only marginally used in Ghanaand was excluded in the TPSL. Because of this exclu-sion, farmers are not accustomed to using these fertil-izers. Currently, however, MOFA prohibits only thesale of fertilizers with the potential to harm the soil(heavy metal).
Uses by CropReliable data on farmers’ fertilizer use by crop are
not readily available in Ghana. Nevertheless, it is gen-erally admitted that fertilizer is used mainly on cotton
(slightly over 50%), maize, rice, and high-value cropssuch as pineapple, tobacco, and tomatoes. However,use on maize and other cereals is drastically decliningin favor of high-value cash crops (export crops). Fer-tilizer use on root crops, tree crops, and cocoa isminimal.
Uses by RegionMuch of the use is concentrated in the Northern,
Upper East, and Upper West regions of the country.However, apart from cotton and rice, fertilizer use ongrains, vegetables, and export crops is higher in thesouth than in the north.
Intensity of UseGhana used 8.8 kg of nutrients per hectare of area
cultivated in 1978. Ten years later, when the processof liberalizing the fertilizer market was launched in1988, Ghana used less than 7.5 kg of plant nutrientsper hectare of area cultivated. In 1993 this rate fell to2.9 kg and has remained low, averaging 3.0 kg in 2000.Very often, farmers use less than the recommendedamounts, largely because of the high cost of the fertil-izers.20 This low use intensity is particularly acuteamong small-scale subsistence farmers who use 0-20 kg of products per hectare, compared with about80-120 kg for large-scale farms and plantations. Con-sequently, Ghana’s soil nutrients are being rapidly de-pleted; yields are either stagnating, rising slightly, orin some cases dropping, and good arable land for agri-culture is becoming scarce, particularly in the West-ern, Eastern, Ashanti, and Upper East regions. Fallowperiods have shortened from 6-10 years to 0-3 years.By some estimates, Ghana’s average nutrients require-ments should be at least 80 kg of N-P2O5-K2O per hect-are, which is roughly 200-250 kg of fertilizer prod-ucts per hectare. In other words, potential crop yieldincreases are substantial and can be achieved throughbetter soil fertility management strategies, includingthe use of mineral fertilizers.
Private-Sector ParticipationWith few exceptions, MOFA controlled fertilizer
supply to Ghanaian farmers prior to 1988. Through
18. Other compound fertilizers include 23-15-5 and special pur-pose products such as 11-5-27+ 5MgO for pineapple, 0-22-18+7S+6MgO for cocoa, and 11-0-37 for plantain and banana.19. Mali uses 14-22-12-7-1 (NPK+SB) on cotton and 18-46-0(NPK) on food crops while Burkina Faso and Côte d’Ivoireuse 14-23-14-6-1 and 5-15-15-6-1 (NPK+SB), respectively.

21
the Crop Services Directorate, MOFA determined re-quirements and arranged procurement, importation,and distribution using its network of national, regional,district, and subdistrict outlets. Beginning in 1988, asthe fertilizer subsector underwent significant policychanges, the private sector was allowed to be directlyinvolved in the importation and marketing of fertiliz-ers. To date, as much as 95% of the imported fertilizerproduct is brought in by private operators. The remain-ing 5% comes in as aid-in-kind (mostly urea21) throughMOFA.
Product SourcingAll of the mineral fertilizer products used in Ghana
are imported from abroad. Currently, the importedproducts are sourced through direct private importa-tion primarily from Western Europe—particularly fromFrance (HydroAgri) and in a lesser degree from Hol-land (Cheminex) and Ireland (Dynochem). A small pro-portion is imported from Côte d’Ivoire (Hydrochem),Russia, Belgium, Morocco, Bulgaria, Israel, and Tu-nisia. Fertilizers are imported mainly through the portof Tema where large storage facilities are available.However, sea freight of imported fertilizer products toAbidjan is much lower than to Tema becauseHydrochem and STEPC benefit from economies ofscale of bulk transport and competitive procurement.Because there is little suitable warehouse storage forbulk fertilizer products in the Tema port, most of theimports come in 50- and 25-kg labeled bags. Amongall importers, only Wienco (Gh) Ltd. imports shiploadsof 15-15-15, 20-20-0, and 23-15-5 in bulk; bags themat the Tema port quay; and transports the bagged prod-ucts to warehouses in Tema, Kumasi, and Tamale.Trucks transport the imported products to different des-tinations throughout the country. Fertilizer delivery tothe north using the Volta River (e.g., Wienco in thepast) is not operational due to multiple handling is-sues and associated costs that substantially increasethe price of the product at the final destination.
Domestic Suppliers and the Marketing ChainFollowing the liberalization of the fertilizer import
in 1991, six large companies imported fertilizers fortheir own distribution, namely Wienco (Gh) Ltd.,Chemico Ltd., Dizenghoff, Jasmedi Group Ltd.,Watraco Gerber, and Farmer’s Services Company(FASCOM) (Upper Region [UR]) Ltd.22 Large farm-
ing companies also imported some of their require-ments (e.g., Ghana Oil Palm Development Corpora-tion, Pioneer Tobacco Company). Watraco Gerber in1992 and Jasmedi Group in 1997 exited the fertilizerimport business, largely as a result of their weakerfinancial backing. More than a decade after the liber-alization, fertilizer import in Ghana involves only twolarge private companies, namely Wienco and Chemico,and to a lesser degree Primark and Dizenghoff. Withabout 48% of the market share, Wienco is currentlythe largest importer and has been the market leadersince the liberalization of fertilizer marketing. How-ever, Wienco’s market share has been decreasing, par-ticularly in the last two years, as Chemico and Primarkshares have increased (Figure 5).
The main private importers have wholesale outletsto deliver directly to end-users, primarily in the oilpalm, tobacco, and cotton subsectors and in the largerice irrigation projects. In fact, Wienco has been ableto successfully integrate the sale of fertilizer and thepurchase of cotton by entering into an exchange orswap agreement with cotton companies. Importers alsosell their products through a few registered wholesal-ers/retailers who are independent dealers. These reg-istered wholesalers/retailers take delivery from Temawarehouses for distribution to the network of rural re-tailers in the districts and farming communities. Themain registered wholesalers/retailers include Sefa andJane (Kumasi), AGLOW (Accra), AgriMat (Accra),Chinese Woman (Kumasi), Obek Agro Services(Kumasi), SMAKO (Nsawam), Iddissal (Tamale), andDagx Agrofarma (Accra-North). The exact number ofrural retailers is not well known; however, some stud-ies estimate that there are 600-800 wholesalers andrural retailers throughout Ghana (Debrah, 2000). Theseretailers are generally agrochemical shops operated byindividuals such as the agrochemical sellers of Kumasi.In addition to 25- and 50-kg bags, most of the retailersrebag fertilizer products for sale in 1-kg, 2-kg, and 5-kg bags. They also sell from open 50-kg bags.
Market OutreachWhile Wienco has established a decent retail net-
work of its own,23 the overall retail network of the coun-try is not well-developed. Most wholesalers and re-tailers are concentrated in urban centers, forcing farm-ers to travel long distances to purchase fertilizers.
23. Wienco sale points are concentrated in the Greater Accra,Ashanti, Brong Ahafo, and Northern Regions.
21. Ghana received 1,250 mt of urea as Kennedy Round II(KR–II) commodity grant in 1996.22. Prior to 1991, Wienco, Chemico, and Dizengoff suppliedfertilizers to the government on tender.
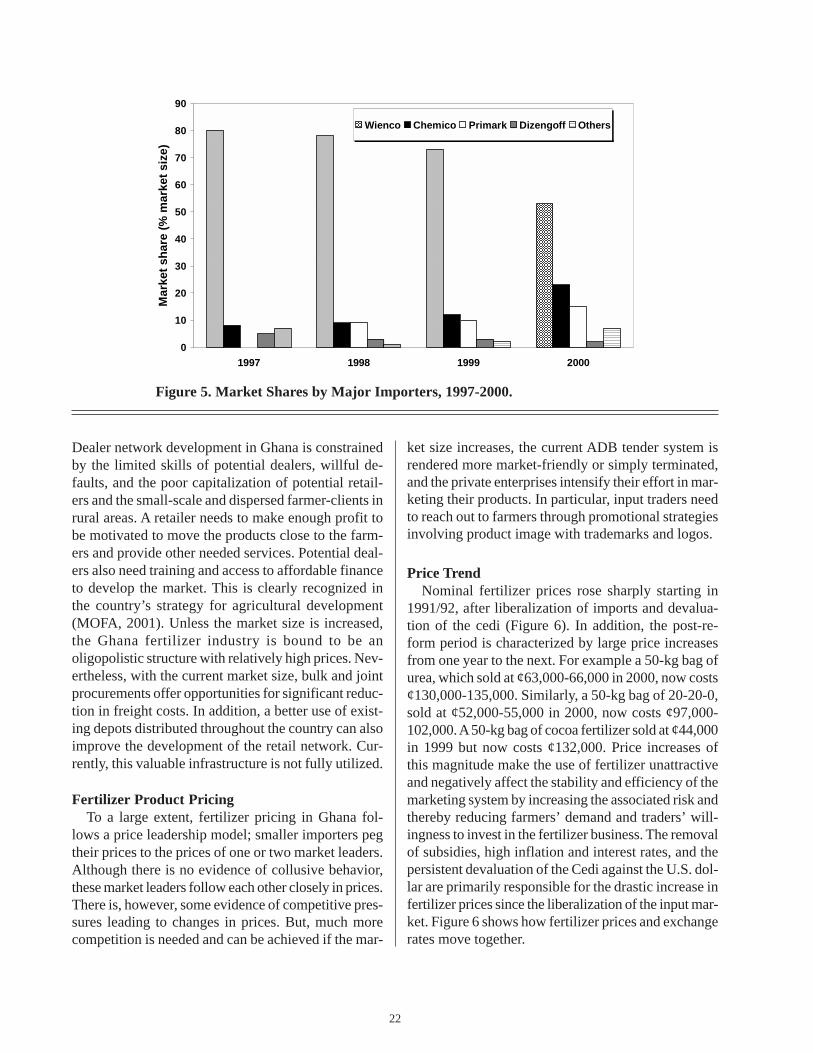
22
Dealer network development in Ghana is constrainedby the limited skills of potential dealers, willful de-faults, and the poor capitalization of potential retail-ers and the small-scale and dispersed farmer-clients inrural areas. A retailer needs to make enough profit tobe motivated to move the products close to the farm-ers and provide other needed services. Potential deal-ers also need training and access to affordable financeto develop the market. This is clearly recognized inthe country’s strategy for agricultural development(MOFA, 2001). Unless the market size is increased,the Ghana fertilizer industry is bound to be anoligopolistic structure with relatively high prices. Nev-ertheless, with the current market size, bulk and jointprocurements offer opportunities for significant reduc-tion in freight costs. In addition, a better use of exist-ing depots distributed throughout the country can alsoimprove the development of the retail network. Cur-rently, this valuable infrastructure is not fully utilized.
Fertilizer Product PricingTo a large extent, fertilizer pricing in Ghana fol-
lows a price leadership model; smaller importers pegtheir prices to the prices of one or two market leaders.Although there is no evidence of collusive behavior,these market leaders follow each other closely in prices.There is, however, some evidence of competitive pres-sures leading to changes in prices. But, much morecompetition is needed and can be achieved if the mar-
ket size increases, the current ADB tender system isrendered more market-friendly or simply terminated,and the private enterprises intensify their effort in mar-keting their products. In particular, input traders needto reach out to farmers through promotional strategiesinvolving product image with trademarks and logos.
Price TrendNominal fertilizer prices rose sharply starting in
1991/92, after liberalization of imports and devalua-tion of the cedi (Figure 6). In addition, the post-re-form period is characterized by large price increasesfrom one year to the next. For example a 50-kg bag ofurea, which sold at ¢63,000-66,000 in 2000, now costs¢130,000-135,000. Similarly, a 50-kg bag of 20-20-0,sold at ¢52,000-55,000 in 2000, now costs ¢97,000-102,000. A 50-kg bag of cocoa fertilizer sold at ¢44,000in 1999 but now costs ¢132,000. Price increases ofthis magnitude make the use of fertilizer unattractiveand negatively affect the stability and efficiency of themarketing system by increasing the associated risk andthereby reducing farmers’ demand and traders’ will-ingness to invest in the fertilizer business. The removalof subsidies, high inflation and interest rates, and thepersistent devaluation of the Cedi against the U.S. dol-lar are primarily responsible for the drastic increase infertilizer prices since the liberalization of the input mar-ket. Figure 6 shows how fertilizer prices and exchangerates move together.
Figure 5. Market Shares by Major Importers, 1997-2000.
0
10
20
30
40
50
60
70
80
90
1997 1998 1999 2000
Mar
ket s
hare
(% m
arke
t siz
e)
Wienco Chemico Primark Dizengoff Others

23
Not surprisingly, prices of fertilizer increased muchmore than prices of the crop output. For example, be-tween 1991 and 1995, the prices of urea, AS, and 15-15-15 increased by 733%, 416%, and 400%, respec-tively, compared with a corresponding average priceincrease of only about 142% for maize and 190% forrice. The same trend persisted in the second half of the1990s but with a much smaller magnitude. Between1995 and 2000, the price of AS and 15-15-15 increasedby 176% each, compared with a corresponding aver-age price increase of only about 123% for maize and34% for rice.
Fertilizer:Grain Price RatiosThe input/output price ratios show a more favor-
able incentive for the use of fertilizers on rice than onmaize because the ratios for rice are consistently lowerthan those for maize (Figures 7a-c). In the early 1990sless than 1 kg of maize could buy 1 kg of urea, AS, orNPK (15-15-15); currently, it takes about twice asmuch maize to buy the same quantity of urea, AS, orNPK. This suggests that the market for a domesticallytraded crop such as maize may not be working effi-ciently, and farmers cultivating such crops bear a muchhigher burden from the increase in the price of fertilizer.
Profitability of Fertilizer UseThe value-cost ratios (VCRs) for fertilizer use on
maize production reflect the trend noted using theinput/output price ratios. Using the available outputprices (i.e., weighted average wholesale prices), theVCR associated with the use of basal 15-15-15topdressed with AS was higher than 2.0 in the late1980s. Following the input market liberalization, theVCR remained below 2.0, except in 1997 and 1998when it reached 3.2 and 2.8, respectively (Figure 8).Similarly, the VCR associated with the use of 15-15-15 topdressed with urea was higher than 2.0 in the late1980s. This ratio has remained below 2.0 since theinput market liberalization, except in 1997 and 1998when it reached 3.5 and 2.9, respectively. However,the VCR associated with the use of urea as topdressinghas been higher than that obtained using AS.
The low VCRs are largely due to unfavorable in-put/output price ratios, less than recommended fertil-izer application rates, lower crop response to fertil-izer, and the output price used to estimate the VCRs.Using farm-gate prices would yield higher VCRs. Arecent FAO/World Bank (2000) analysis shows thatthe VCRs are higher for irrigated rice. The same analy-
Figure 6. Exchange Rate and Price of Maize and Selected Fertilizers,1986-2000.
0
10000
20000
30000
40000
50000
60000
70000
1986 1988 1990 1992 1994 1996 1998 2000
Pric
e (C
edis
per
50-
kg b
ag)
0
500
1,000
1,500
2,000
2,500
3,000
3,500
4,000
4,500
Exch
ange
Rat
e (C
edi/U
S $)
Urea AS 15-15-15 Maize cedis/$

24
Figure 7a. Urea:Crop Price Ratio Trends, 1989-2000.
Figure 7b. Ammonium Sulfate:Crop Price Ratio Trends, 1989-2000.
0.0
0.5
1.0
1.5
2.0
2.5
3.0
1989 1990 1991 1992 1993 1994 1995 1996 1997 1998 1999 2000
Ure
a-C
rop
Pric
e R
atio
Urea/Maize Urea/Rice
0.0
0.2
0.4
0.6
0.8
1.0
1.2
1.4
1.6
1.8
2.0
1989 1990 1991 1992 1993 1994 1995 1996 1997 1998 1999 2000
AS-C
rop
Pric
e R
atio
AS/Maize AS/Rice

25
Figure 8. VCR Trends for Fertilizer Use in Maize Production, 1989-2000.
Figure 7c. NPK (15-15-15):Crop Price Ratio Trends, 1989-2000.
0.0
0.5
1.0
1.5
2.0
2.5
3.0
1989 1990 1991 1992 1993 1994 1995 1996 1997 1998 1999 2000
NPK
(15-
15-1
5)-M
aize
Pric
e R
atio
NPK/Maize NPK/Rice
0.0
0.5
1.0
1.5
2.0
2.5
3.0
3.5
4.0
4.5
5.0
1989 1990 1991 1992 1993 1994 1995 1996 1997 1998 1999 2000
VCR
Rat
io
15-15-15+AS 15-15-15+Urea

26
sis also shows that the profitability of fertilizer usedon maize when valued at the world price is much morefavorable and higher than that of rice. This result sug-gests a latent potential that Ghana needs to tap; givenbetter crop markets and lower fertilizer prices, domes-tic maize and rice production can be increased signifi-cantly, thereby reducing their importation and savingscarce foreign exchange.
Opportunities for Improving ProfitabilityFertilizers are imported into Ghana at a high free-
on-board (FOB) price, largely because of smallshiploads and reliance on expensive import sources.Although Chemico and Dizengoff import primarilyfrom Eastern Europe, importers should be tappingmuch more into the cheap markets in that region ofthe world and in the Middle East.24 The procurementcost constitutes the most important factor influencingfertilizer price, averaging between 54% and 56% ofthe final retail price (Schiere, 1998). Obviously,Ghana’s high cost of finance and high freight costsassociated with small shiploads also influence thesehigh procurement costs.
Importers’ margins vary between 16% and 20%. Re-tailers’ margins are in the neighborhood of 3% to 5%.With such margins, trading fertilizer alone is a riskybusiness. As a result, many retailers also sell crop pro-tection chemicals partially because their margins aremuch higher.
The decreased profitability of fertilizer use has ledto decreased demand and consequently to adverse ef-fects on soil fertility, productivity, food security andthe environment. Under these conditions of low prof-itability and poor soil fertility, improving the efficacyof fertilizer use becomes very important. This impliesrefining the obsolete fertilizer recommendations, whichfor the most part date as far back as 1973, and usingmore cost-effective products as discussed earlier. Af-ter almost three decades, it is only logical to realizethat the amount of nutrients and their ratios in Ghana-ian soils have changed and so have crop varieties, yieldexpectations, and relative prices.
Improving the efficacy of fertilizer use also impliescritical improvement in farmers’ technologies, includ-ing greater use of improved seed and integrated soilfertility management strategies as discussed in the na-tional soil fertility action plan. In other words, signifi-cant research efforts need to be supported at the SoilResearch Institute (SRI), the CRI, and the universi-ties. Similarly, the practice of soil testing for site-spe-cific recommendations needs to be promoted. The needfor such initiatives was clearly recognized in the strat-egy documents (i.e., MTADP and AAGDS) that haveguided government policies and programs for trigger-ing a demand-led growth of the agricultural sectorsince the structural adjustment program was launched.The national soil fertility management action plan thathas specific activities to tackle soil-related problemsis yet to be implemented.
There have been calls to reintroduce subsidies inGhana. This was the case, for example, recently in thenational economic forum of May 2001. Resorting tosubsidies as a way to deal with high fertilizer prices isnot the appropriate solution to the problem. Ghana’sexperience with subsidies has demonstrated that, be-sides being an inefficient allocation of resources, subsi-dies are fiscally not sustainable and have often led toabuses and product smuggling into neighboring coun-tries. A better and more sustainable solution would beto use resources on initiating and intensifying moreefficient demand-inducing activities. Such activitiesinclude demonstration of results and methods pertain-ing to fertilizer use and crop varieties, as well as dealernetwork and output market development (includingagroprocessing) to increase the market size, therebyproviding opportunity to reduce prices through lowerlanded unit prices, greater competition, and bulk blend-ing. It is estimated that ¢3,500 to ¢5,600 per 50-kgbag can be saved through bulk importation of at least10,000 mt shiploads of product to be bagged at thelocal port. Taking advantage of this cost reduction op-portunity would require setting up a shipside baggingfacility at the port of Tema and reducing the waitingtime, thus minimizing demurrage costs.
In addition, farmers could organize themselves forthe acquisition of inputs to take advantage of lowercosts of large quantity purchases while District As-semblies could invest in local feeder roads. Finally,reduction or elimination of unnecessary harbor charges
24. During the stakeholders’ workshop, some delegates didnot consider fertilizer import costs to be unusually high inGhana, thereby arguing that importers are well linked to theinternational markets.
27
will further reduce prices. One particular example isthe unnecessary fee applied for the shore handling ofsome types of fertilizers like urea that are classified asdangerous products in port handling documents.Declassifiying urea as a hazardous product would behelpful.
Policy EnvironmentSignificant progress has been made in Ghana to cre-
ate a policy environment that offers incentives for in-vestments in fertilizer marketing. In particular, the gov-ernment has created a conducive investment environ-ment with neither direct import duties nor special salestax (value-added tax [VAT]). The only exception isthe 0.5% levy imposed by the Economic Communityof West African States (ECOWAS). However, muchremains to be done. The unstable macroeconomic in-dicators (exchange rate, inflation, and interest rates)directly affect the fertilizer market and do not favorinput dealers’ development. The uncertainty createdby the ADB fertilizer tender (accounts for about 40%of fertilizer market) and the issue of zoning in the cot-ton sector25 (accounts for 50%-58% of the fertilizermarket) is a hindrance to the development of the fer-tilizer market. MOFA efforts to resolve the outstand-ing issues associated with zoning are encouraging.
Regulatory FrameworkThe procurement and distribution of fertilizer in
Ghana are completely liberalized. Import restrictionson the product type and its source no longer exist; how-ever, importers are required to communicate intendedorders to MOFA for monitoring purposes. There ex-ists no legislation, let alone accompanying regulations,to govern the marketing of fertilizer products in thecountry. Furthermore, although required in the inspec-tion guidelines, there is no product inspection and sam-pling in Ghana. Yet, there are currently four surveycompanies operating in the country, namely, SociétéGénéral de Surveillance (SGS), Cotecna, Gateway Ser-vices, and Ghana Standards Bureau Veritas (GSBV).Importers rely on survey and inspection at the point ofloading only. The PPRSD has 30 pesticide inspectorsand 34 seed inspectors who are not equipped to in-
spect or sample fertilizer products and are not man-dated to do so.
The Ghana Irrigation Development Authority(GIDA), an agency under the MOFA, has the onlychemical analytical capability of the Ministry. Unlikemany sub-Saharan African countries, Ghana does havenumerous laboratories with varying capacity to ana-lyze fertilizer samples; 26 however, no mechanism ex-ists at the dealer level to take advantage of this impor-tant physical capital base. Although the EPA is man-dated to collect samples at the port for analysis, this isusually not done. When it is done, it usually results inunnecessary delays of the ships and associated costs.
Given the aforementioned limitations, the qualityof fertilizer sold in the Ghanaian market is not guaran-teed, particularly in terms of its nutrient content, thenet product weight, and its physical quality. Currently,however, evidence of adulterated products is foundonly among small-scale illegal imports that come intothe country by land. Nevertheless, it is important torecognize that quality control and truth in labeling arecritical to the proper development of any fertilizermarket, particularly when it is becoming as diverseand dynamic as the Ghanaian market. Quality controlprotects farmers by ensuring that fertilizer productsare not nutrient deficient, adulterated, or sold in shortweight bags. Furthermore, it provides a rationale forstandardizing pricing. Finally, quality control protectshonest fertilizer dealers. For example, effective con-trols are likely to reduce illegal trade practices (adul-teration and bogus products) and allow importers touse cheaper domestically produced packages. A recentIFDC assessment in collaboration with the MOFA(IFDC, 2001a) has proposed a draft legislation (IFDC,2001b) and regulations (IFDC, 2001c) as well as nec-essary investments and organizations that could help ad-dress these problems if these documents are enacted intolaw and implemented effectively.
25. Zoning is a process of dividing the cotton production areainto zones and, for each zone, designating a specific cottoncompany to be the exclusive supplier of inputs (on credit) andbuyer of cotton output. This process is being proposed in Ghanato deal with the issue of farmers who get seasonal input creditfrom one company and sell their output to another and therebydefault on their credit.
26. A recent IFDC assessment of the requirement for establish-ing a fertilizer regulatory system in Ghana (IFDC, 2001a) re-viewed the analytical capacity of the following nine laboratories:SRI Accra Center, the GSB in Accra, the Soil Science Depart-ment of the University of Ghana, the Ghana Atomic EnergyCommission in Kwabenya, the Soil Science Department of theNkwame Nkrumah University of Science Technology inKumasi, the SRI in Kwadaso, the SARI in Nyankpala, and theSGS in Tema.

28
Market Development-Related ConstraintsMore than a decade after the liberalization of fertil-
izer marketing in Ghana, the performance of the mar-ket remains below what was expected when reformswere launched. In addition to the absence of monitor-ing for truth in labeling, the following are some keyconstraints that limit its development to a more ac-ceptable level:
High Cost of Financial Capital and Limited CreditAvailability
High interest rates (30%-40% per annum), requir-ing a return unusually high for such an investment inthe agricultural sector to be profitable, limit marketdevelopment. Similarly, stringent requirements forobtaining an LC (i.e., 100% of the deposit) and exces-sive bank charges (up to 6.5% of loan value) deter pri-vate interests in fertilizer trade. Consequently, manyretailers handle small volumes.
High Transportation and Communication CostsThese costs are a consequence of the poor condi-
tion of rural roads, the high prices of spare parts, andthe high cost of energy and communication coupledwith its low coverage and frequent shortages. Therehave been some significant investment efforts in thelast decade under the Agricultural Sector InvestmentProject (ASIP), the Agricultural Diversification Project(AgDiv), the Village Infrastructure Project (VIP), andthe Department of Feeder Road (DFR), but, the ruralroad infrastructure is still inadequate (low coverage)and in bad condition, particularly in the Northern andWestern regions. The rail transport that could have beenthe cheapest transport mode is not reliable. For theNorthern region, it would be useful to assess the re-quirement for developing the Volta River transportroute that was once used by Wienco. A good illustra-tion of the impact of infrastructure such as roads andcommunication is the pattern of fertilizer consump-tion across regions. Much of fertilizer use is concen-trated in the Northern, Upper Eastern, and Westernregions. This regional pattern is not only influencedby soil characteristics and cropping systems but alsoby the distribution of the infrastructure during the statemonopoly regime, which emphasized the transition andthe interior savannah zones (Ofori and Dennis, 1996).
Unfavorable Fertilizer:Crop Price RatiosUnfavorable fertilizer/crop price ratios are a seri-
ous constraint to input market development in Ghana.Compared with international market prices, fertilizerprices in Ghana are high due to the small size of themarket and its limited development. At the same timeoutput prices are lower, compared to fertilizer prices,due to inefficient markets.
Uncertainty Associated with the ADB TenderSystem
The ADB fertilizer tender system, which was startedin 1998 to create opportunity for bulk importation, ac-counts for 40% of the total fertilizer market. With sucha large market share, an unsuccessful tender processintroduces an element of uncertainty, especially whenthe process is delayed. This uncertainty is due to theforeign exchange risk associated with fertilizer inven-tory resulting from making an investment in fertilizerimportation only to find that the enterprise has failedto win the tender. Such an occurrence would force im-porters to carry unnecessary fertilizer stocks while theCedi is depreciating. As a result, most importers donot place their order until the tender results are issued.Furthermore, tenders have often been awarded at a timewhen international prices of fertilizers are high andsupply usually comes in later than when farmers needthe product the most. Finally, the current standoff inthe tender outcome clearly demonstrates that the sys-tem has weaknesses that some participants use to bringit to a halt.
Lack of Market Information and Poor Linkagewith the International Market
Information on sales, inventories, and warehouseconditions is either not available or incomplete andpoorly recorded. There is no systematic collection anddissemination of local and international market infor-mation. Some importers and dealers are not willing togive out information, while others would quote priceshigher than the acquisition prices. To be effective, im-porters and distributors need information about de-mand, stocks, supply sources, and prices in the do-mestic and international markets. The availability andaccessibility of timely market information improve de-cision-making and induce greater private investmentas transaction costs decline, resulting in net gain toinput suppliers and farmers. The absence of such in-

29
formation imposes on the traders unwarranted searchand transaction costs and often leads to importation ofexpensive products.
Similarly, bankers need information about the creditworthiness of potential borrowers. With limited infor-mation, bankers, importers, and distributors must in-vest in screening out potential defaulters when extend-ing credit to avoid the problem of adverse selection,thereby increasing transaction costs. Finally, the lackof information on requirements from neighboring coun-tries prevents regional collaboration and consolidationthrough major ports to achieve economies of scale andon-shore bagging of bulk fertilizers (Debrah, 2000).
Limited Marketing Skills of Potential DealersA decade after the liberalization of fertilizer mar-
keting, the number of dealers and retail outlets in therural area is limited. Consequently, many farmers haveto travel long distances to obtain supplies. Potentialdealers lack the knowledge of how to effectively reachout to the farmers to sell their products and how tobring finance into the business through their own ar-rangements. They also lack the knowledge for plan-ning and forecasting quantities, timing, and prices ac-cording to the market situation and the needs of thefarmers of the area. Consequently, the rural marketsin the business are still undeveloped. The independentdealer in rural areas is an essential part of the fertilizermarketing and distribution chain. If properly motivatedand trained, this dealer can turn into a very effectiveagent of change who can develop the market in thelocal area.
II.6. The Crop ProtectionProduct Market
Need for Pest Control and National StrategyPests and diseases are common problems in Ghana’s
agriculture (MOFA/PPRSD, 2000a-c). They affectmost crops grown in the country; however, their inci-dence varies from region to region. Some of these pestsand diseases have become significant economic and/or environmental problems. Crop production losses dueto pests and diseases are estimated to be about 30% inthe field and at least 5% during the storage of cerealsand tubers. The use of chemical pesticides, principallyto control sucking pests of cocoa trees, was the crop
protection strategy used in Ghana for decades. Duringthe 1990s, however, MOFA introduced the integratedpest management (IPM) as the national strategy. Nev-ertheless, chemical control remains the dominantstrategy.
Product UseOver 140 different commercial products are sold in
Ghana. The mix of available products varies by loca-tions and time periods; however, the same active in-gredients are offered under different labels by variousimporters, substantially reducing the available techni-cal choice. For example, there are about sevenendosulfan-based formulations and six brands of cop-per-based fungicides.
Insecticides are widely used to control insects incocoa (mirids), vegetables (tomatoes, okra, and egg-plants), cotton production, and grain stocks (maize andrice). Fungicides are principally used to control blackpod. Chemical weed control is particularly used withnonselective herbicides in perennial plantations (palmand cocoa) or additional clearing in rice and maizefields. The control of migratory and perennial pestssuch as armyworms has been the sole responsibilityof the government with donors’ support. CPPs are alsoused in public health (e.g., insecticides against mos-quitoes, aerosols, anti-cockroach products and roden-ticides) and in animal health (e.g., anti-tick products).
Private-Sector ParticipationThe CPPs used in Ghana are supplied either through
direct bulk importation of ready-to-use formulationsby the private sector or through domestic formulation.Based on the PPRSD and the Ghana Statistical Ser-vices (GSS) data, KR-II aid-in-kind CPPs representon average only 1.7% of total CPPs imported intoGhana annually. Herbicides (53%), insecticides (27%),and fungicides (20%) dominate KR-II imports. Theprivate sector imports the KR-II CPPs, and the PPRSDmanages the supply. The procedure for allocating theKR-II supplies in Ghana is reasonably transparent tothe extent that input dealers are informed. However,the practices of wholesale price “fixing” and supplyallocation (no matter how genuine) limit private-sec-tor development in market segments with the greatestgrowth potential (e.g., rice herbicides).

30
Import Volume and Product MixAccording to FAO data, before the early 1980s, an-
nual CPP imports into Ghana were worth less than US$5 million. Over the last two decades, however, im-ports have increased steadily to reach more than US$30 million in 1999. Between 1995 and 1999, Ghanaimported an average of 5,326 mt of CPPs annually es-timated to be worth about US $16.3 million (Table10). Insecticides account for 80% of the imports, fol-lowed by fungicides (11%). Insecticides are mainlyused in cocoa and cotton production. The importanceof cocoa production and the need for protecting theirtrees explain the relatively high importation and useof fungicides.
Domestic Formulation Capacity Limited toInsecticides for Cocoa
Ghana has two formulation plants that produce onlyinsecticides and produce exclusively for the cocoa sec-tor: the Abuakwa and Chemico formulation plants.
The Abuakwa Formulation Plant established inKumasi has an annual production capacity of 2 mil-lion liters of insecticides in the form of emulsionableconcentrate (EC) or SL. The Cocoa Marketing Board(COCOBOD) owned the plant until 1997 and has al-ways been its sole client. So far, the plant has exclu-sively formulated Unden 200 EC (Propoxur) for thecontrol of cocoa mirids. Until 1997, the COCOBODsupplied the necessary substances, solvents, and pack-aging to the plant. The COCOBOD imported this ma-terial from Bayer, owner of the active ingredient. TheAbuakwa Formulation Plant also has a chemical analy-sis laboratory (solely for carbamates) and significantstorage capacities at the site.
Bayer holds 51% of shares against 49% for theCOCOBOD. Privatization, followed by the completeremoval of subsidies, has dealt a serious blow to thecompany. In particular, the raw material has not beensupplied to the company since 1997, and the companyhas not been able to move its stocks and to produceminimum quantities of new products. However, thereseems to be some hope with the project to formulate anew anti-miride insecticide, Confidor (Imidacloprid),on behalf of Bayer. Wienco would supply this newproduct. It is expected to replace Propoxur, which isfeatured on the list of severely restricted pesticides.Furthermore, subject to further investments, the avail-able technical expertise and the existing installationscould help diversify the plant production and the re-packaging of liquid, powdered, or granulated productsfor other sectors.
The Chemico Formulation Plant was founded in1958 under the Imperial Chemical Industries (ICI),which became Chemico in 1975. Currently, Chemicoand the GOG jointly own the company. Its initial pro-duction was limited to the supply of Gammalin 20 (200g/L of lindane). Although the annual formulation ca-pacity is higher than 1.5 million liters, production vol-umes over the past 3 years have been below capacity.However, Chemico is about to revamp its activitieswith a new and more environment-friendly insecticide(Cocostar). This product will replace lindane. Chemicoalso has a small packaging plant for powdered andgranulated products.
A Market Dominated by Four ImportersSince the late 1980s, four dominant importers have
been involved in the importation and distribution of
Table 10. Imports of Crop Protection Products by Ghana, 1995-99 (mt)
1995-99 Pesticide Products 1995 1996 1997 1998 1999 Average Share (%)
Insecticides 2,130 1,974 5,418 9,006 2,728 4,251 80 Fungicides 186 939 578 566 718 597 11 Herbicides 79 249 402 205 195 226 4 Others 168 296 244 307 245 252 5 Total 2,563 3,458 6,642 10,084 3,886 5,326

31
CPPs in Ghana: Chemico, Wienco, Reiss & Co., andDizengoff. As in many West African countries, thesecompanies get their supplies of ready-to-use CPPs frombig multinational firms. Generally, they operate in thesame market segment and have relatively similar pro-curement and sale conditions. Notably, their suppliersoffer 90- to 120-day credit and marketing and techni-cal support. Their most important deals are negotiateddirectly with their clients (cocoa, cotton, plantationsand projects). Each company offers 30- to 360-daycredit to their clients. They generally sell on a cashbasis, to wholesalers and retailers. However, they of-fer a 15- to 30-day credit to some well-establishedwholesalers.
Chemico is the most important of the four main CPPsuppliers. Since 1975, Chemico has broadened its rangeof CPPs by relying mainly on its parent supplier, ICI,and then on Zeneca. Other important suppliers areFMC for insecticides and nematicides and Sanachem/Dow Agro Science for herbicides and insecticides.Chemico holds a leading position in the cocoa sectorand directly participates in tenders for the cotton sec-tor. Through the private distribution network, Chemicois also actively involved in the two market segments(horticulture and cereals) that consume the most CPPs.Besides CPPs, Chemico is a long-standing fertilizerimporter.
As a long-standing leader in the fertilizer market,Wienco diversified its portfolio to include CPPs dur-ing the last decade. In the CPP market, Wienco’s de-velopment strategy is focused on the supply of a fewstrategic products, namely, cocoa fungicides and fu-migants, maize and pineapple herbicides, and cottoninsecticides. The company sources its CPPs from Cal-liope (France) or its subsidiary Callivoire (Côted’Ivore) and from Bayer. CPP supplies from Bayerwill soon include a new cocoa insecticide (Confidor)to be formulated in the Abuakwa plant. Wienco’s big-gest sales are direct supplies to clients in the cotton,cocoa, and pineapple subsectors. The company usesits fertilizer distribution network to market other ac-cessible CPPs (e.g., maize and rice herbicides, andproducts for stock treatment) without any additionalinvestment.
Reiss & Co. is a Dutch company established inGhana almost 50 years ago. The company started do-ing business in Ghana in general trade (textiles, dyes,
polish, etc.) before shifting to the agricultural sectoras a representative of Ciba Geigy in the country in theearly 1970s. Today, Reiss & Co. represents Novartisfor the sale of cotton insecticides, the cocoa fungicideRidomil, and selective herbicides used in maize andrice production. Reiss & Co. also represents Griffinfor the sale of the cocoa fungicide Kocide. The de-clining herbicide market and the introduction of com-petitive and generic cocoa fungicide and insecticideproducts in the Ghanaian CPP market have forced thecompany to diversify its activities. As a result, in ad-dition to CPPs, Reiss & Co. also participates in fertil-izer tenders and supplies sprayers (Micron Sprayers)and seed industry equipment. However, sales of elec-trical, computer science, and air conditioner equipmentseem to be more important than sales to the agricul-tural sector.
Dizengoff is a joint venture of British (51%) andIsraeli (49%) interests operating in Ghana for over 40years. It operates in the radio-communication(Motorola), electrical engineering equipment, air con-ditioning, and agricultural sectors. In the agriculturalsector, it supplies irrigation equipment, self-protectionequipment, poultry farming equipment, sprayers, seeds,fertilizers, and CPPs. Dizenghoff has two major CPPsuppliers, namely Makteshim Agan (Israel) andMonsanto. The company relies on the existing distri-bution network to market about 10 different products.Roundup is its leading product.
Minor CPP Market ParticipantsApart from the four main importers, there are other
participants in the CPP market that may be catego-rized into the following three classes:
• Small importers who are linked to internationalcompanies, for example, AgriMat and Kuruma whoare linked to Aventis and Chimac/Agriphen, respec-tively. The clients of these small importers are mostlywholesalers and retailers operating in the food cropand vegetable subsectors. Typically, they import insmall quantities under relatively less favorable creditterms (e.g., 60- to 90-day letter of credit) and resellthrough cash transactions.
• Kumasi wholesalers who travel to Côte d’Ivoire tosource products such as rice herbicides, Roundup,and Maneb directly from the Ivorian CPP compa-nies (STEPC, Callivoire, Aventis) on a cash basis.
32
• Illegal importers who source their products fromthe black markets in West Africa. These productsinclude, in particular, cotton insecticides and KR-IIdonations. Some of these illegal importers are whole-salers in Kumasi. To a large extent, the network ofillegal importers is responsible for the alarming saleof large volumes of obsolete products found in Ghanaas inventoried by FAO RAF (2000).
A Distribution Network Concentrated in UrbanAreas
The number of registered CPP retailers increasedfrom 351 in 1989 to 656 in 1990 and 866 in 1991.However, only about 10% of them were actually ac-tive in the market. The list of authorized distributors,which the EPA published in May 2001, reveals thatthere are only 77 registered companies currently oper-ating in Ghana. Between 15 and 20 of the retailers areconsidered to be wholesalers. They are predominantlyestablished in the big cities, particularly Accra (5),Kumasi (3), Tamale, Wa, Tumu, Techiman,Bolgatanga, Bawku, and Bimbila. They all sell fertil-izers, CPPs, sprayers, and seeds for vegetable produc-tion with no exclusive supply right. The more estab-lished wholesalers benefit from a 15- to 30-day creditfor the purchase of CPPs from their suppliers. Thesewholesalers are at the same time retailers at their salespoint and suppliers to small networks of about ten ru-ral retailers operating in the region.
Retailers operate in big cities and in small town-ships. Their activity is often seasonal, especially inthe North (4 to 5 months). They buy their supplies incash from wholesalers. Those who have a good sup-ply system operate in rural areas, while the rest areforced to compete with their own suppliers in the cit-ies such as in the Kejetia market in Kumasi. In theirquest to outperform other retailers and to increase theirrevenues, some of the retailers resort to various un-conventional practices such as sales of obsolete prod-ucts, smuggling, product adulteration by dilution,changing of labels, and illegal repackaging. In manycases, they lack the necessary knowledge of products,and their storage (ventillation) and handling conditions(including covering hands with a simple plastic bagand the use of dust masks as protection against chemi-cals) offer limited protection. Many complain of skinrashes, headaches, and dizziness. The main clients ofthese retailers are individuals or cereal and vegetable
producers’ groups. The main products sold are nonse-lective herbicides (glyphosate and paraquat), maizeherbicides (atrazine and alachlore), basic fungicides(maneb, mancozeb, and copper), multiple insecticides(cypermethrin, lambdacyalothrin, endosulfan, andchlorpyriphos ethyl), and stock protection chemicals(pyrimiphos methyl).
A Segmented CPP MarketThe CPP market in Ghana is segmented by crop
subsectors (Figure 9). The cocoa and cotton subsectorsare the most important in terms of market share. Thesetwo subsectors have completely independent input sup-ply systems.
In the cocoa subsector, the COCOBOD single-handedly managed the cocoa sector up to 1997.Through the Cocoa Services Division (CSD), it hadthe monopoly to supply insecticides, fungicides, har-vesting and self-protection equipment, and farm ma-chinery to cocoa farmers. Insecticides were sourcedexclusively on the local market. This was the case forGamalin sourced from Chemico, Unden fromAbuakwa, and fungicides from Reiss & Co., Wienco,and Chemico. These inputs were sold on a cash basisto cocoa producers who were members of the GhanaCocoa, Coffee and Sheanut Farmers’ Association(GCCSFA) through a network of 70 shops distributedacross the different production zones.
In 1995, input supply responsibility was transferredfrom the CSD to the GCCSFA. The GCCSFA suppliesinput to cocoa farmers through its subsidiary the Co-coa Inputs Company Ltd. (CIC). The COCOBOD de-ducts a percentage on each kilogram of cocoa a mem-ber sells. This money is deposited in a compensationfund that the GCCSFA uses to subsidize the prices ofCPPs that the CIC sells. This subsidy can be as high as50% of producer prices. The differential between thesubsidized and the full market prices has increased dur-ing the last 3 years. During this period, stocks carriedover from 1997 and 1998 were sold at constant priceswhile the Cedi (¢) was losing more than 50% of itsvalue. The decline in world prices for cocoa duringthe past years seriously affected the activities of theCIC, and since 1998 stocks have not been significantlyreplenished (Figure 10). It is highly probable that sincethen, a substantial proportion of farmers have beengetting their supplies of pesticides from rural retail-

33
Figure 9. Distribution Channels for Crop Protection Products in Ghana.
WIENCO DIZENGHOFF REISS & CO. CHEMICO
MULTINATIONALS (EUROPE / USA /
SOUTH AFRICA / ISRAEL)
REGIONAL REPRESENTATIONS (COTE D’IVOIRE)
COCOA SECTOR
MINOR DISTRIBUTORS
IMPORTERS
COCOA INPUTS COMPAGNY LTD
PLANTATIONS & PROJECTS
PINEAPPLE * PALM *
HEVEA * RICE *
BANANA TOBACCO
AFFILIATED GROWERS *
AFFILIATED GROWERS GCCSFA
70 DISTRICTS STORES
COTTON SECTOR
15 - 20 WHOLESALERS ABUAKWA FORMULATION
PLANT
8 COTTON COMPANIES ( ADB TENDER
AND/OR SWAP)
FOOD CROP SECTOR
MAIZE RICE
LEGUMES FRUITS TUBERS
VEGETABLES
@ 100 RETAILERS
GROWERS & GROUPS
TENDERS & SALES ON CREDIT SALES ON CASH
AFFILIATED GROWERS
MAJOR IMPORTERS / DISTRIBUTORS WIENCO DIZENGHOFF REISS & CO. CHEMICO
MULTINATIONALS (EUROPE / USA /
SOUTH AFRICA / ISRAEL)
REGIONAL REPRESENTATIONS (COTE D’IVOIRE)
COCOA SECTOR
MINOR DISTRIBUTORS
IMPORTERS
COCOA INPUTS COMPAGNY LTD
PLANTATIONS & PROJECTS
PINEAPPLE * PALM *
HEVEA * RICE *
BANANA TOBACCO
AFFILIATED GROWERS *
AFFILIATED GROWERS GCCSFA
70 DISTRICTS STORES
COTTON SECTOR
15 - 20 WHOLESALERS ABUAKWA FORMULATION
PLANT
8 COTTON COMPANIES ( ADB TENDER
AND/OR SWAP)
FOOD CROP SECTOR
MAIZE RICE
LEGUMES FRUITS TUBERS
VEGETABLES
@ 100 RETAILERS
GROWERS & GROUPS
TENDERS & SALES ON CREDIT SALES ON CASH
AFFILIATED GROWERS
MAJOR IMPORTERS / DISTRIBUTORS

34
ers, without guarantee of the quality and origin of theproducts used (especially for insecticides).
In the cotton subsector, cotton companies supplypesticides to their producers or their respective pro-ducer associations. These companies source the prod-ucts through the ADB tender from the four main im-porters. The CPPs are part of an input package includ-ing fertilizers, seeds, and labor charges that are offeredon credit (10 to 12 months) to growers. The cost ofsuch packages is uniform for all companies. In 2000,this package was estimated to cost about ¢335,000 peracre (about US $55). This amount is deducted at thesource during the sale of cotton at the end of the grow-ing season. For the 2001/2002 season, 104,000 litersof ultra-low-volume (ULV) insecticides and 168,500liters of EC were required in the tender the ADB is-sued on behalf of the cotton companies. These quanti-ties valued at about US $1,270,000 helped cover ap-proximately 55,000 ha of cotton fields.
Currently, cotton companies face difficulties recov-ering credit extended to producers. The recovery rateis about 70%. This low recovery rate is attributable todefaults created by two significant problems. In somecases, in the absence of an effective contract enforce-ment mechanism, there are farmers who sell their cot-ton harvest to rival companies from which they did
not get their inputs and thereby willfully default ontheir input credit. In other cases, farmers use cottoninputs (especially fertilizers) on their food crops,thereby reducing cottonseed yield and their effectiverepayment capacities. MOFA has considered a num-ber of alternatives to address this issue. The principleof exclusive zone of intervention (zoning)27 for eachcompany, which is currently being adopted, has cre-ated some uncertainty in the marketplace as it contin-ues to be debated. However, a successful resolution ofthe outstanding issues will soon be achieved.
Associated with the zoning issue is the ADB tendersystem, which was started in 1998 to create opportu-nity for bulk importation. It appears that the system isnot unanimously accepted among input suppliers andcotton companies. This leads to nonmarket-friendlydelays in the tender awards, as conflicts fueled by in-put suppliers and companies taking advantage of ex-isting weaknesses in the tender system are resolved.Because these tenders constitute a large share of themarkets, most importers do not place their order untilthe tender results are issued. In 2001, the tender is-
Figure 10. Insecticides and Fungicides Purchased by the Cocoa Sector, 1986-2000.
27. Zoning is a process of dividing the cotton production areainto zones and assigning a specific cotton company the soleresponsibility to supply inputs to farmers on credit against pur-chasing their cotton output.
0
200
400
600
800
1,000
1,200
1,400
1,600
1986 1988 1990 1992 1994 1996 1998 2000
Inse
ctic
ides
( x
1.00
0 lit
ers)
0
50
100
150
200
250
300
350
400
Fung
icid
es (x
100
0 kg
)
INSECTICIDES
FUNGICIDES

35
sued in March was finally cancelled in early June, withcompanies deciding to get direct supplies from Wienco.Delays in the award process are also associated withhigher input prices and supply shortages.
Legal and Regulatory FrameworkThere are laws governing the certification, approval,
importation, transportation, sale, storage, and use ofCPPs in Ghana.28 Normally, the EPA provides productcertification. Application for product certification issubject to a fixed fee of US $500. In practice, the cer-tification is issued 6 months to 1½ years after the ap-plication submission and is valid for 5 years.29 Fur-thermore, the certification is issued for a specific for-mulation of a specific commercial product with spe-cific intended uses. A certification can be extended,but the process must be repeated. Importers are re-quired to register with the EPA and obtain an importlicense. Once at the port, the EPA clears the productupon inspection by the Custom, Excise, and Preven-tive Services (CEPS). The PPRSD monitors salesthrough the different outlets.
However, subsequent amendments to the laws havenot been enacted. Furthermore, the supporting regula-tions have not been approved. As a result, as of May2001, only one product was certified. Importation ofpesticides is therefore done under the provision of tem-porary permits. Such a provision does not ensure ac-curate control. Because there is no legal basis for imple-menting regulations, sanctions are hardly applied inestablished fraud cases or for illegal practices or envi-ronmental pollution. As a result, CPPs are extensivelyused with little regard for the appropriateness of theproduct to the pests or for the health hazards they pose.
Main ConstraintsLack of Effective Enforcement of CPP Law—
The lack of an effective enforcement mechanism dis-
courages private-sector investments as it has led to theproliferation and use of cheap substandard and/or in-appropriate products. These products have potentiallysignificant public health and environmentalconsequences.
Inadequate and Distorted Market Information—There is no efficient system of data collection, analy-sis, and dissemination concerning importation, stocks,and the use of CPPs.
A Poorly Monitored Cross-Border Trade and Il-legal Practices That Hurt the Formal Sector—A par-allel market of CPPs has developed in Ghana throughunapproved or illegal importation of products broughtin from neighboring countries. A visit to certain retail-ers during the field trip revealed the following factsthat discourage private investments:1. Over 80% of products sold do not meet the stan-
dards defined by the EPA.2. Many products found in the market are obsolete.
This is particularly true for cotton insecticides(binary pyrethrinoids/organophosphorus) ac-quired on the black market in Côte d’Ivoire andproduced in 1997, 1998, and 1999. These obso-lete products have French labels, and retailerswrongly recommend their use on tomato andcocoa. They are sold at a very low price (¢10,000/250 mL) compared with equivalent authorizedproducts (¢25,000 to ¢27,000/250 mL).
3. Many of the products duly purchased from bigfirms in Côte d’Ivoire also have French labels(e.g., Decis, Thiodan, Roundup, Gramoxone,etc.).
4. Retailers relabel some products locally, notablyglyphosate-based products (e.g., Calliope’sKalach, relabeled Monsanto’s Roundup). Retail-ers involved in this illegal practice often do so tosell equivalent products that are usually cheaperthan the original.
5. Some products are diluted, mixed, or replaced(e.g., Karate, diluted, or Roundup, replaced by2,4D) despite measures manufacturers take toprevent adulteration (e.g., impregnable stopper,sealed cap).
6. Retailers locally repackage most powdered orgranulated products (e.g., maneb, atrazine,carbofuran), and labels, when they exist, are rudi-mentary and have been photocopied. Consequently,product adulteration exists (e.g., atarazine or diu-
28. These are (1) Act 490 of 1994 creating the EPA; (2) Act528 of 1996 “Pesticides Control and Management Act,” thatcontrols the importation, manufacture, distribution, handlingand use of pesticides including pesticide approval procedures,and registration procedures for importers and distributors; and(3) Act 572 of 2000 that updated sanctions and fines appli-cable according to law 528 of 1996. The 1996 Pesticide Con-trol and Management Act was amended in 1997.29. However, the US $500 fee and the period of issuance onlyrelate to the administrative aspect of the certification. Prelimi-nary studies (research station and on-farm trials, various analy-sis) can account for several thousands of US$ and extend overa period of up to 5 years.

36
ron mixed with inert products). Because thebuyer does not have the capacity to verify theproduct quality and quantity at the time of thetransaction, only original packages or effectivecontrol can guarantee truth in labeling.
The lack of effective enforcement of the laws and,to a lesser degree, a supply shortage associated withtenders facilitate such practices.
Insufficient Business and Technical Skills—Eventhough most of the retail shops were established dur-ing the early years of privatization, retailers in par-ticular have limited business and technical skills. Tech-nically, recommendations (about application rates, tim-ing, and pests targeted), and instructions about theiruse are not clearly provided. Similarly, retailers paylittle attention to environmental and safety aspects (e.g.,management of empty packages, safe use, storage con-ditions at the shop and in the farms). Most retailerslack the basic understanding of the requirements forappropriate product management. For example, theylack strong stock management and general accountingskills.
Difficult Access to Affordable Credit—At all lev-els of the industry, access to credit constitutes a sig-nificant constraint. For importers, the difficult accessto foreign exchange and the lack of trust by supplierstranslate into less than favorable terms of payment atalmost prohibitive interest rates (42% to 48% per an-num). Such terms include 60- to 90-day letter of creditand payment before delivery. While successful whole-salers can obtain 15- to 30-day credit, retailers andend-users are compelled to pay cash. Only producerswho are affiliated with big plantations, private com-panies (i.e., palm, rubber, and cotton companies) orconnected to projects (i.e., rice and pineapple projects)have access to seasonal input credit.
Lack of Demand by Small-Scale Producers—Theweak CPP demand by small-scale producers is partlyexplained by the difficult access to finance through-out the sector. Other factors include (1) unfavorableinput/output price ratios during the last decade, par-ticularly in the food crop sector, (2) the low levels ofproductivity and intensification, and (3) the limitednecessary services that the private sector provides tosmall-scale farmers (e.g., establishing sale points inremote areas, providing relevant technical advice and
appropriate packaging, and ensuring product qualityand efficacy).
II.7. Factors Constrainingthe Performance of the Private Sector
The private-sector input supply system consists ofimporters, wholesalers, and retailers of fertilizers,CPPs, and imported seeds. Registered seed growersproduce the bulk of the cereal seeds in the private sec-tor in Ghana, and vegetable seed growers produce andexport vegetables to overseas markets. In general, anunfavorable macroeconomic environment (high do-mestic inflation, depreciation of the currency, high in-terest rates, etc.) constrains the functioning of the pri-vate sector. There is also a weak partnership betweenthe public and the private sectors mainly because theprivate sector is not yet organized into trade or pro-ducer associations capable of dialoguing effectivelywith government.
For importers, the greatest problem is that of for-eign exchange availability and the accompanying de-preciation of the cedi-dollar exchange rate in Ghana.Importers also face high costs of borrowing funds tofinance imports because of high interest rates. Otherconstraints are lack of market information, particularlyinformation on the sources of supply, low volumes andhence high unit costs of imports, and inadequate whole-sale outlets developed in most regions in the country.Besides, there are relatively few reliable retail outletsfor inputs.
In addition to the general constraints the private sec-tor faces, input dealers (wholesalers and retailers) andimporters also have inadequate access to bank financ-ing for their operations. As a result, input dealers areincapable of extending credit facilities to farmers. Be-cause of inadequate infrastructure (roads and ware-housing facilities), inputs are generally not availableon time. Dealers also face a low demand for inputsbecause of unavailability of inputs in smaller packag-ing and their high cost. Registered input dealers alsoface stiff competition from operations of illegal im-porters, especially importers of CPPs.
Registered seed growers are constrained by the lackof access to financing and by low and irregular de-mand for their products. Although the seed growersare organized in associations, there is a weak linkage

37
between the associations and the input dealers. Be-cause of this, there are generally no contractual andsale agreements between the producers and dealers;therefore, seed growers resort to the open market tosell their seeds. The association of vegetable seed pro-ducers and exporters is faced with the constraints ofsourcing vegetable seeds from outside Ghana (mostof the vegetable seeds are imported) and also with theproblem of markets for their products that are by na-ture perishable.
III. An Action Plan forDeveloping AIMs in Ghana
III.1. Rationale for the Action Plan30
The proposed Action Plan for strengthening the lib-eralized input markets and for encouraging greater par-ticipation of the private sector is based on the ratio-nale of shifting the supply curve to the right. The as-sessment of all three subsectors has clearly demon-strated that the private sector has not responded asexpected to the liberalization of input marketing inGhana. The assessment stressed that macroeconomicinstability leading to devaluation and high interestrates, lack of marketing skills and affordable finance,and inadequate regulatory systems continued to limittheir active involvement in input marketing.
This slow private-sector response may misleadpolicymakers, donors, and various stakeholders to re-vert to the old practice of subsidizing agricultural in-puts and involving the public sector in their procure-ment and distribution. Such a move would be prema-ture because it would divert the attention from remov-ing the constraints to the participation of the privatesector. The assessment of the AIMs in Section II clearlydemonstrates that deregulation and liberalization arenecessary but not sufficient to encourage private-sec-tor participation. Years of discrimination and neglecthave left the private sector underdeveloped and theinput markets fragmented. Rather than returning to thepast, Ghana and donors should stay the course and in-vest resources in building the necessary human capi-tal and marketing infrastructure and in strengthening
the policy environment to further facilitate the private-sector participation in input and output marketing. Theprivate sector has considerable latent potential to per-form marketing activities in an efficient manner; torealize that potential, however, structural and capac-ity constraints restricting its development should beremoved.
Shifting the Supply Curve to the Right—Figure11 illustrates the typical supply and demand curvesthat economists use in explaining the behavior of pricesin a free market situation. The horizontal axis indi-cates the quantity of input (e.g., fertilizer), and the ver-tical axis measures the corresponding price. The de-mand curve D slopes downward from left to right in-dicating that the quantity of fertilizer that farmers de-mand increases as the price of the fertilizer decreasesand vice-versa. The supply curve S1 slopes upwardfrom left to right indicating that as the price increases,the quantity of fertilizers that traders/manufacturerssupply increases. At price OP1, quantity demandedequals quantity supplied (OQ1). Therefore, OP1 isreferred to as an equilibrium price and point A as anequilibrium point.
Assuming that the price OP1 is very high (e.g., $177/mt of 15-15-15), the quantity traded is low (e.g.,12,000 mt of 15-15-15). Because the resource-poorfarmers in Ghana and other developing countries can-not afford to purchase fertilizers at such a high price,
30. This section is adapted from IFDC/DAI/MTL (2000), pp.22-24. Figure 11. Price and Quantity Relationship.
S2
S1
Q1OQuantity
Price
Q2
P2
P1
D
A
B

38
one possible solution is to provide a subsidy (e.g., $70/mt), and reduce the price to OP2 ($107/mt). At thisprice, the demand outstrips the supply and, therefore,some mechanism for rationing is required to allocatethis limited quantity among all farmers. This solutionwas tried by many African countries, including Ghana,but could not be sustained due to budget deficits. Inaddition, it led to an inefficient use of resources, cre-ated parallel (black) markets, and induced smugglingof inputs into neighboring countries.
The position of the supply curve S1 on the verticalaxis indicates that the minimum price at which the sup-pliers are willing to offer any quantity is high. In thecase of Ghana, this is true because the market is smalland suppliers incur high costs in procuring and ship-ping small quantities, thereby not benefiting from theeconomies of scale in procurement and transportation.Also, the suppliers are not sufficiently tapping into thecheapest source in the global market due to limitedaccess to information and finance. Because of all theseconstraints, the supply price is generally very high.
Rather than following the subsidy route, the priceof fertilizers can be reduced by shifting the supplycurve to the right—from S1 to S2. Such a shift in thesupply curve is possible if the economies of scale inprocurement and shipping can be realized and the fer-tilizers can be procured from cheaper sources throughbetter access to information and finance. By shiftingthe supply curve to the right (point B), prices can bereduced, and the quantity of fertilizer farmers use canbe increased, thereby promoting food security at bothhousehold and national levels. Such a move also re-duces the need for subsidies and ensures a higher re-turn on the capital invested in business (because un-der the S2 supply situation, the fixed cost per unit soldis lower). Thus, by shifting the supply curve to theright, benefits can be created for all stakeholders—farmers, traders, and the country at large.
Can the supply curve for agricultural inputs in gen-eral and fertilizers in particular be shifted to the rightin Ghana? The analysis of various constraints in thisreport suggests that these constraints have kept thesupply curve at S1 position in Ghana. The removal ofthese constraints can help in shifting the supply curveto the right. Therefore, the proposed Action Plan em-bodies the measures needed to shift the supply curveto the right and thereby realize the latent potential of
the private sector in supplying various inputs efficientlyin a sustainable manner. The activities proposed in theareas of policy reform, human capital formation, im-proved financial services, market information system,and regulatory frameworks are all geared to shiftingthe supply curve to the right and to helping the privatesector in realizing its potential.
Although the primary focus of the Action Plan is onshifting the supply curve, which will help the farmersby reducing prices and making inputs easily accessible,technology transfer activities are expected to help thefarmers in realizing more benefits and higher yieldsfrom the same amount of inputs. Thus, this activitywill help the farmers in realizing more incomes byshifting the demand curve and improving nutrient useefficiency.
III.2. Components of the Action Plan
This plan recommends that a free market system beused to supply inputs in rural areas because such asystem is efficient and sustainable and does not strainthe fiscal resources of the country. To strengthen thefunctioning of the AIMs, concurrent actions, with ap-propriate sequencing and phasing, are proposed in thefollowing areas:• Supportive Policy Environment.• Market Development Activities.• Technology Transfer Activities.• Output Market Development.• Association Building.
Supportive Policy EnvironmentA conducive policy environment is essential for
strengthening private-sector participation in input mar-kets in Ghana. As indicated earlier, during the reformsof the 1990s, Ghana removed most of the distortionsthat government interventions had introduced in themarketing and pricing of inputs. However, the creationof macroeconomic stability has persistently eludedGhana. The exchange rate has depreciated from ¢400/$ in 1990 to over ¢7,000/$ in 2001. Such depreciationis counterproductive for input market development.High interest rates also discourage private-sector in-volvement in the input business.
Issues related to monetary and fiscal policies arebeyond the scope of this Action Plan; however, it is

39
stressed that the GOG should leave “no stone unturned”to stabilize its exchange rate. Without stability in theexchange rate, investment in input business may notbe forthcoming and without such investments, farm-ers will not have an easy access to affordable inputsthat are so badly needed to modernize agriculture, raiseincomes in rural areas, and protect the environment.Likewise, the development of rural infrastructure, es-pecially feeder roads, is essential for reducing the trans-action costs associated with the supply of inputs (Ac-tion Plan Matrix 1).
Making foreign exchange available for importingfertilizers requires special attention on assessing andchanging commercial banking practices. Actionsneeded in this area are included under financial ser-vices in the following section on market development.It should be stressed that ADB’s current practice ofinviting tenders for supplying fertilizers to cotton com-panies should be discontinued and replaced by the cre-ation of a foreign exchange fund for facilitating theimports of fertilizers in bulk for all crops, rather thanone crop, namely, cotton.31 Similarly, current thinkingabout creating zones for cotton-producing areas to im-prove input loan recovery and contract enforcementwarrants reassessment on the part of MOFA in a waythat will not create more distortions in the marketplaceand hamper the development of efficient and well-func-tioning input markets. MOFA’s current efforts to re-solve the outstanding zoning issues are likely to yieldpositive results, provided the final agreed-upon ar-rangements are effectively enforced.
The current CIC practice of providing subsidies oninputs used for cocoa production discourages the en-try of retailers into the input business in cocoa-grow-ing areas. Because COCOBOD is a state-owned en-terprise involved in purchasing cocoa beans and im-posing a surcharge on cocoa sales to subsidize inputs,such a subsidy issue becomes an important policy is-sue and should be addressed accordingly to strengthenthe development of input markets. Because the farm-ers in the cocoa-growing areas are financially well-endowed, they can provide incentive for dealers to
develop retail networks in these areas and to supplyinputs at reduced prices to both cocoa growers andfood crop producers by reducing transaction costs.
Market Development ActivitiesIn addition to a supportive policy environment, well-
functioning AIMs mandate actions in the followingareas:1. Development of Human Capital and Dealer
Networks.2. Strengthening of Financial Services.3. Creation and Operation of the Market Information
System (MIS).4. Implementation of Regulatory Systems.
Development of Human Capital and DealerNetworks
Post-reform experiences in many African countrieshave indicated that human capital needed for makingcompetitive markets function efficiently does not de-velop overnight or by itself. Conscious efforts areneeded to nurture the cadre of dealers at all levels—import, wholesale, and retail trade. Dealers involvedin these activities will have to be trained in marketingand management skills, business development knowl-edge, and technical understanding of the products—seed, fertilizers, and pesticides.
To create a cadre of dealers needed for making in-put markets effective and efficient, training and tech-nical assistance programs should be implemented.Training should focus on both technical and manage-ment issues. Training programs should be conductedfor importers, wholesalers, and retailers. At the retaillevel, people interested in developing an input busi-ness should be trained in all aspects of product knowl-edge, financial management, and business develop-ment. Local retailers (general merchants) and retiredextension workers could be tapped for training in in-put business development. After providing training,newly trained dealers should be helped to have accessto funds. Approaching banks with adequate loan pro-posals will require technical assistance. A business de-velopment fund suggested under the financial servicessection will be needed for these people to enter intobusiness.
The creation of a large number of dealers and dealernetworks will not only help in improving access to
31. This position was not accepted by a number of stakehold-ers during the validation workshop. They argued that identify-ing and resolving the problems associated with the currenttendering process is preferable to ending the practice of tender.

40
Action Plan Matrix 1. Policy and Market Development Issues
31. A number of stakeholders did not accept this position during the validation workshop. They argued that identifying and resolving the problems associated with thetendering process is preferable to ending the practice of tender. The fertilizer syndicate group recommended that if ADB has the willingness and capacity, it should continuethe tender; otherwise MOFA should facilitate the establishment of a neutral council to handle the tender. However, if ADB should continue, then all the bottlenecks identifiedwith the system should be addressed especially the timing of the tender. The most appropriate time for inviting tenders is November, so that fertilizer products are availablein the market before the start of the planting season.
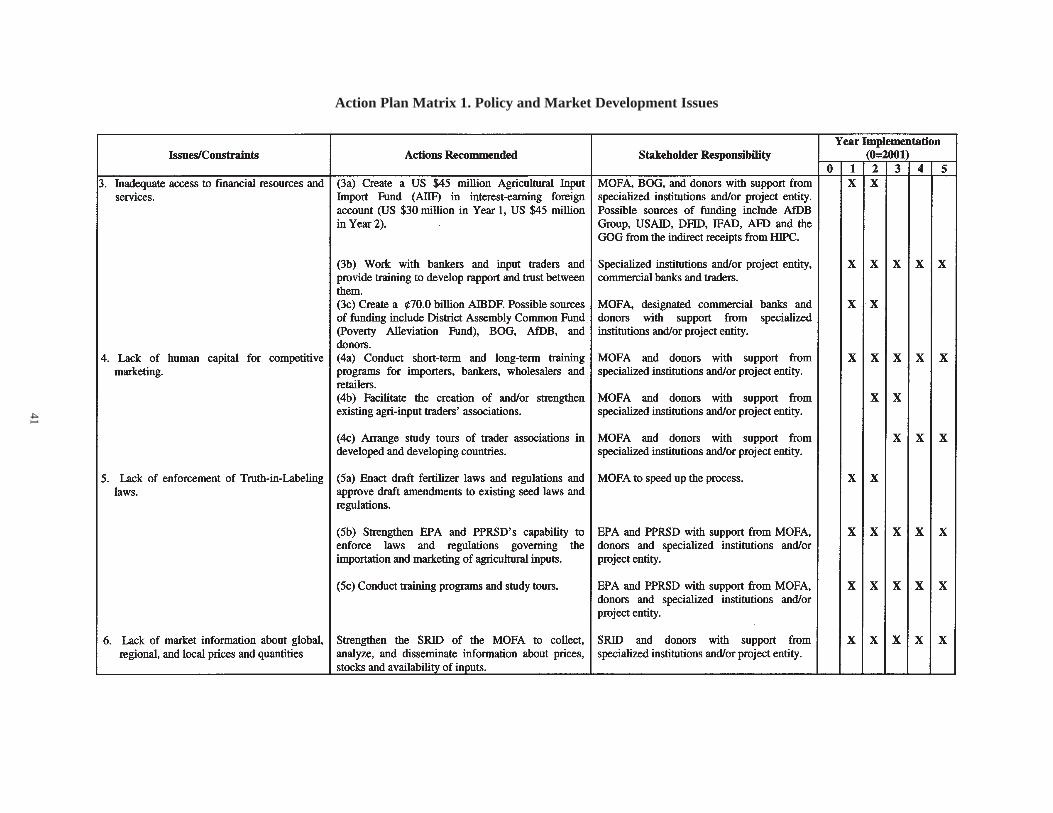
41
Action Plan Matrix 1. Policy and Market Development Issues
42
inputs by farmers in rural areas but also may create anew cadre of technology transfer agents. With soundtechnical and business knowledge, these dealers couldbecome the first source of information about new tech-nologies of production and help in reducing the bur-den on extension workers. In the long run, dealers couldcomplement public sector extension agents. MOFAcould focus its resources on preparing subject matterspecialists who could pass on the new knowledge todealers who will transmit it to farmers. Such an ar-rangement will create a true partnership between thepublic and private sectors.
With proper training in financial management, thesedealers could also become a potential source of creditfor farmers. These dealers would be located closer tofarmers and would have first-hand knowledge of thosefarmers who are most likely to repay loans. Hence, ifthese dealers get loans from the proposed businessdevelopment fund (see next section), they can use partof these funds to sell input on credit to farmers duringthe cropping season. As dealers begin to extend creditto farmers, this will in effect supplement any formalbank credit available to farmers and could reduce boththe risk of loan default and the transaction cost of ad-ministering loans in rural areas.
Importers and wholesalers should also be trained inall aspects of business development and provided in-formation on business linkage opportunities. Establish-ing linkages with the global and regional markets willbe essential for importers to get low import prices fortheir inputs. Currently, few importers in the Ghanamarkets have full knowledge of the functioning of re-gional and global markets and the cheapest sources ofsupply of inputs. Through a multipronged program oftraining and technical assistance and through improvedaccess to finance and information, importers shouldbe trained to access the cheapest source of fertilizersand CPPs and thereby reduce transaction costs.
The existing capacity of MOFA and EPA for en-forcing quality control regulation and enforcement isalso insufficient. Manpower and supporting structuresneeded to randomly check truth-in-labeling of prod-ucts for fertilizers, seeds, and pesticides are in limitedsupply. Training and technical assistance for qualitycontrol inspectors should be provided. Such training
programs should focus on the nature of products, qual-ity and measurement standards, mechanisms for qual-ity control assessment and truth-in-labeling, and otherassociated activities.
Strengthening of Financial ServicesThe earlier assessment of the financial services
showed that access to finance remains a significantbottleneck for all dealers (wholesalers, retailers, andimporters) involved in input marketing in Ghana. Toalleviate this constraint, certain measures are proposedin the form of business development funds. One of theunderlying rationales for the proposed funds is thatfood security, poverty reduction, and environmentalprotection are national goals and the risks involved inachieving these goals should be shared by variousstakeholders, not just by farmers or agri-input dealers.Another rationale for the fund is its educational di-mension because reducing risks to the banks and pro-viding training to both bankers and dealers (import-ers, wholesalers, and retailers) helps to bring these twogroups together as they learn to deal with each otherand the input marketing business. Typically, over ashort period of time, banks would develop a better un-derstanding of the input business and more effectiveways to finance it, thereby making financial supportto input marketing sustainable. Based on that shared-risk principle and the educational objective, the fol-lowing measures are proposed to improve access tofinance (Action Plan Matrix 2):1. Establishment of an Agricultural Inputs Importa-
tion Fund (AIIF).2. Establishment of an Agricultural Business Devel-
opment Fund (AIBDF).3. Improving financial services outreach in rural areas.4. Reducing willful default.
Establishment of AIIF—To improve access to for-eign exchange for importing inputs, especially aforeign-exchange-intensive input like fertilizer, it isproposed that an AIIF be created with the followingfeatures:• Amount: US $45 million.• Principal Stakeholders: Banks, importers, govern-
ment/BOG and Guarantee Fund Manager.• Risk-Sharing Mechanism/Modus Operandi: Com-
mercial banks will provide LC for 100% financing
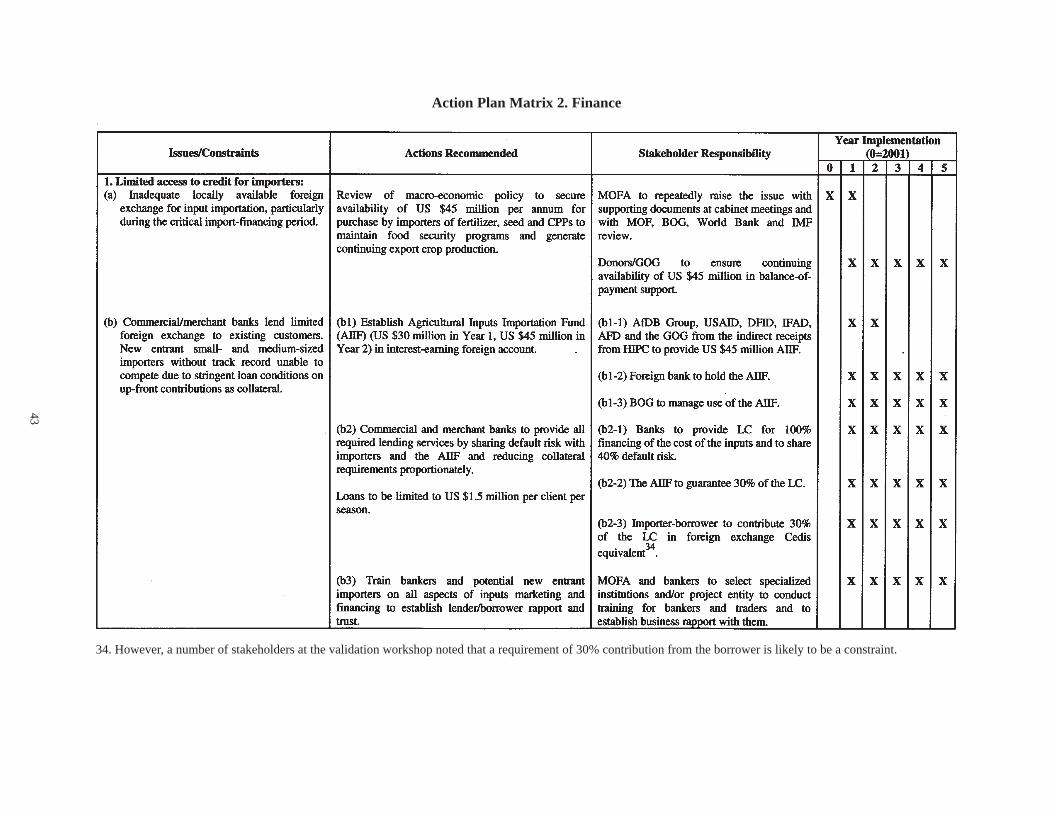
43
Action Plan Matrix 2. Finance
34. However, a number of stakeholders at the validation workshop noted that a requirement of 30% contribution from the borrower is likely to be a constraint.

44
Action Plan Matrix 2. Finance
35. As in the case of the AIIF, a number of stakeholders at the validation workshop noted that a requirement of 30% contribution from the borrower is likely to be aconstrained. As a result, the use of warehouse collateral (bonded warehouse) should also be considered during the implementation to reduce the burden of liquidity on theborrower.
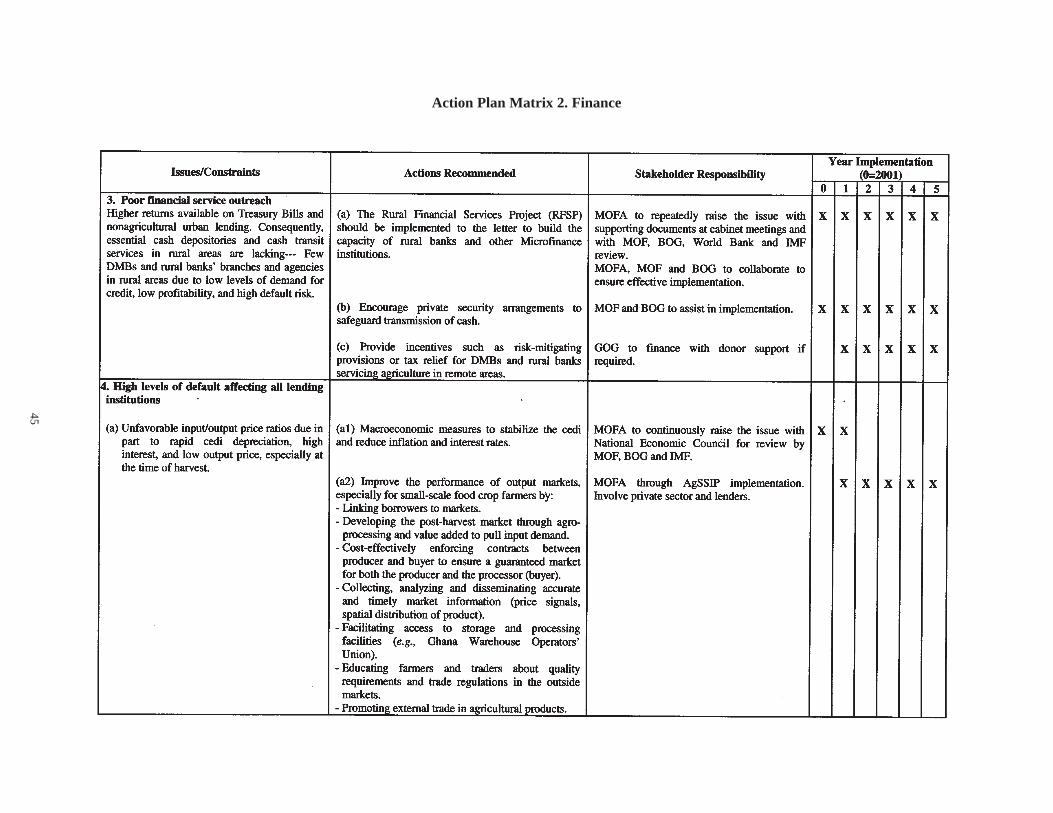
45
Action Plan Matrix 2. Finance

46
Action Plan Matrix 2. Finance

47
of the cost of inputs, but the borrower will contrib-ute 30% paid in foreign exchange Cedis equivalent,and the AIIF will guarantee 30% of the LC.33
• Sources of Funding: AfDB Group, USAID, DFID,IFAD, AFD and the GOG from the indirect receiptsfrom HIPC.
• Beneficiaries: Input importers.• Management: BOG.• Maximum guaranteed foreign exchange support:
US $1.5 million/importer/year.
The main attributes of AIIF include a risk-sharingand mitigating system, availability of foreign exchangeto support imports, a savings mechanism based on thecash margin, reduced or no collateral requirements,no subsidy, enhanced outreach, and increased compe-tition among importers. The fund will be managed bythe BOG, who will nominate a fund manager for inter-acting with commercial banks. Coupled with appro-priate training for bankers and importers to establishrapport and trust, these features are designed to en-sure the sustainability of the financial support to theimportation of agricultural inputs and its operationwithout any element of direct subsidy. The fund willgreatly enhance the ability of Ghanaian importers toaccess low-cost fertilizers and other inputs in the glo-bal market.
AIBDF—To improve access to bank finance by ex-isting and newly trained dealers (wholesalers and re-tailers), an AIBDF is proposed. Unlike its counterpartfor input importation, this fund will be in local cur-rency and will be used by dealers in the country todevelop an input business. The main features of theAIBDF include:• Objectives: To promote input business development
by providing guarantee for distributors and retailersin leveraging loans from the banks.
• Amount: ¢70.0 billion.• Principal Stakeholders: Banks, dealers, district as-
semblies, guarantee fund manager.• Risk-Sharing Mechanism: Dealers to cover 30% of
cost of the inputs. Commercial banks to provide theremaining 70% of the needed funds with a 30%
33. However, it should be noted that a number of stakeholdersat the validation workshop noted that a requirement of 30%contribution from the borrower is likely to be a constraint.
34. As in the case of the AIIF, a number of stakeholders at thevalidation workshop noted that a requirement of 30% contri-bution from the borrower is likely to be a constraint. As a re-sult, the use of warehouse collateral (bonded warehouse) shouldalso be considered during the implementation to reduce theburden of liquidity on the borrower.
guarantee from the fund. Thus, the concerned com-mercial banks will be exposed to only 40% risk.34
• Sources of Funding: District Assembly CommonFund (Poverty Alleviation Fund), BOG, AfDB, anddonors.
• Beneficiaries: Dealers, grain merchants, seed grow-ers, and associations interested in developing an in-put business.
• Management: BOG.
The fund can be recycled, if needed, at least twicein every year in that the credits are very likely to beshort term in nature. Coupled with appropriate train-ing for bankers and input dealers to establish rapportand trust, the fund is designed to ensure thesustainability of the financial support to the domesticmarketing of agricultural inputs and its operation with-out any element of direct subsidy. The fund greatlyenhances the ability of Ghanaian dealers to accessfunds, thereby engendering competition and ultimatelybetter services at competitive prices for farmers. It willalso create jobs.
Improving Financial Services Outreach—In thecash crop sectors, such as cocoa and cotton, access tofinance is enhanced through credit unions (e.g.,KKCU) and commercial banks. However, in the foodcrop areas there is a need for MFIs to penetrate intorural areas and provide services such as savings andcredit products. The rural banks in particular shouldplay a strategic role in this direction. However, to beable to operate and provide financial services, they willneed some incentives such as tax reductions and otherrisk-mitigating provisions. In this context, nucleus and“master” farmers could serve as financial intermedi-aries between banks and smallholder farmers. Owner-ship, transparency, and accountability should be pro-moted to ensure sustainability. Other motivating ini-tiatives include deposit mobilization assistance to fi-nancial institutions to develop innovative ways for mo-bilizing deposits from smallholders. This will includefostering associations between formal-sector institu-tions and informal savings and loans associations andinput suppliers.

48
Reducing Willful Default by Borrowers—The oc-currence of willful default is one of the factors inhib-iting credit providers’ willingness to loan funds to theirpotential clients in the agricultural sector. To minimizethis risk and ensure profitable operations, the follow-ing are recommended:
• Educating farmers about bank operations, both bor-rowing and lending.
• Encouraging group lending. However, steps shouldbe taken to ensure that group formation, develop-ment, and animation are expertly done.
• Involving well-respected opinion leaders (i.e., tra-ditional leaders or chief farmers and, if possible,spiritual heads) in any particular community in thecredit delivery and recovery processes.
• Establishing a reliable system of identification ofcreditworthy clients.
• Involving the unit committee structures or the dis-trict assemblies in the credit-delivery process.
• Forming or strengthening cohesive associations orsocieties among farmers of common crops to encour-age the sharing of best practices and common prob-lems and experiences with access to credit and re-payment.
• Encouraging the culture of savings through the for-mation of credit unions and savings and loans asso-ciations among existing farmers associations andthus helping to create savings, which can be used toleverage credit by the societies.
• Encouraging financial institutions to place timelysanctions on defaulting borrowers as a message toother farmers and input dealers.
• Ensuring that workable, cost-effective, and enforce-able legislation exists to prosecute defaulters.
• Creating credit reference bureaus for exchanginginformation about borrowers and lenders.
Creation and Operation of MISsInformation is crucial for the proper functioning of
agricultural inputs and product markets. Dealers, im-porters, and other participants in the marketing chainneed information about local, regional, and global mar-ket situations for inputs and outputs. Presently, thereis no organization solely responsible for the system-atic collection, analysis, and diffusion of informationon inventories, sales, imports, distribution, and con-sumption of agricultural inputs and products in Ghana.
Rather, different directorates of the MOFA collectand manage different types of agricultural data. TheCrop Services Directorate keeps data on fertilizer im-porters, quantities imported, and prices at which theyare sold at the wholesale level. The PPRSD keeps simi-lar information on crop protection chemicals and seedswhile the recently created SRID keeps market infor-mation on crop prices. Outside the agricultural sub-sector, the CEPS and the Ghana Statistical Services(GSS) keep import data on agricultural inputs. Datarelated to crop response rates, profitability of fertil-izer use, farmers’ fertilizer use by crop, and fertilizerrecommendations are diffused among the agriculturalresearch institutes and the universities.
Based on the recommendation in the FAO-IFDCstudy (Debrah, 2000) and information obtained dur-ing the field work, the following actionable plan forstrengthening the market information system isproposed:
1. SRID of MOFA to be encouraged and providedwith the necessary resources to the present SRIDof MOFA to play the role of a one-stop center ofexcellence for agricultural statistics and other in-formation in Ghana.
2. SRID to collaborate with relevant departments thatdeal with agricultural statistics and with input deal-ers and their associations in the collection and dif-fusion of agricultural market information.
3. SRID to create and manage a country agriculturalmarket information system website containing in-formation relative to:• Statistics
– Fertilizer consumption, import, export, pro-duction (annual).
– Monthly regionwise/districtwise fertilizer re-tail prices (urea, MOP, SOP, TSP, DAP, AS,15-15-15 in local currency, US$ and ex-change rate).
– Monthly regionwise/districtwise prices ofCPPs.
– Monthly regionwise/districtwise prices ofseeds (maize, cowpea, etc.).
– Monthly regionwise/districtwise prices ofthe main staples (maize, rice, sorghum, mil-let, cowpea, cassava, groundnuts, etc.).
– Fertilizer marketing cost based on periodmarketing studies.

49
• Monthly international fertilizer prices (urea,MOP, SOP, TSP, DAP, AS, 15-15-15 in localcurrency and/or in U.S. dollars).
• News/market update (e.g., Tender notice).• Regulatory and trade information.• Bulletin Board (buy and sell announcements,
conferences, meetings).• Overview of agricultural inputs and output
marketing in the country.• Information about SRID (profile, staff e-mails,
etc.).• Publications.
4. SRID to be linked up with the regional agricul-tural market information system and other relevantwebsites for access to regional and internationalmarket information.
5. SRID staff to be trained regularly in using currenttechniques of information collection, analysis, anddiffusion.
A well-functioning agricultural MIS will benefittraders, farmers, government policy decisionmakers,international and regional trade organizations, donoragencies, the community at large, and bankers. To en-sure that the information reaches the end users on time,it should be diffused at regular intervals through dif-ferent media, e.g., a Ghana Agricultural Market Infor-mation Network website, the print media, radio, andtelevision. Meanwhile, input dealers in Ghana shouldbe encouraged and organized to form a trade associa-tion and be linked with other associations in the re-gion. As the association grows, it could assume a largershare of responsibilities in the public-private partnershipfor the management of agricultural market information.
Implementation of Regulatory SystemsThe PPRSD was established by an act of parliament
in 1965 with the mandate to organize, regulate, imple-ment, and coordinate plant protection services inGhana. In this function, the PPRSD has responsibil-ity among others to provide advice on pesticide man-agement, monitoring and sales, safe use, registration,and regulation.
Seed—Legislation on seeds has existed in Ghanasince 1972 (NRCD 100, 1972: Seed Inspection andCertification Decree). It was reviewed in 1991 to con-sider the seed market privatization (following theabolishing of the GSC). Although the revision to theseed regulations has yet to go through parliament for
the necessary legal backing, the GSID of the PPRSDhas been providing useful and professional servicesfor seed growers, dealers, and importers. The servicesinclude seed grower and dealer registration, seed cer-tification, and quality control in the field, dealers’ ware-houses and retail shops, and the laboratory. An actionplan to overcome the problems constraining the imple-mentation of seed legislature includes the following:
• Enacting the revised seed legislation into law to pro-vide the legal backing for seed inspectors.
• Strengthening the capacity of the seed inspectionstaff through training of existing staff and throughnew recruitment.
• Upgrading the PPRSD/GSID facilities— such as thecold rooms and seed-testing laboratory.
• Providing logistical resources for inspectors to reachseed growers and dealers who are dispersed overlarge distances in the country.
CPPs—Legislation on pesticides has existed inGhana since 1996 (Act 528, 1996: The Pesticides Con-trol and Management Act). The PPRSD works closelywith the EPA for the management of pesticides in thecountry. The regulatory services provided include reg-istering new products, licensing importers, licensingdealers, supervising trade and use of pesticides, in-specting and removing obsolete chemicals, and train-ing in safe use. The process of registering new prod-ucts has been very slow due to lack of manpower. Also,despite the efforts of the PPRSD and EPA, there isevidence of product adulteration, dealers operatingunder expired licenses, nonrespect for truth in label-ing, sale of obsolete products, and use of productswithout regard for their appropriateness to the pestsor for health hazards, particularly at the retail level.Actionable plans necessary for the implementation ofthe pesticide legislation include the following:
• Steps to have the pesticide regulations approved andenacted to give the legal backing for enforcement.
• Reinforcement of the capacity of staff at EPA andPPRSD to accelerate the product registration, licens-ing, monitoring, and enforcement of the pesticidelegislation, and to undertake residue testing on foodproducts.
• Public education for safe use and medical supportservices for CPP-induced poisoning.
• Investment in research and extension for develop-ing and promoting IPM.

50
Fertilizer—There is currently no fertilizer legisla-tion in the country, but the Crop Services Directoratekeeps a registry of importers, more for the purpose ofgenerating data on fertilizer importation and consump-tion than for quality control. In July 2000, MOFA re-quested IFDC to advise on the requirements neces-sary for the establishment of a fertilizer regulatorysystem in Ghana. The assessment report (IFDC, 2001a)and the proposed bill and regulations (IFDC, 2001band IFDC, 2001c) were submitted to the MOFA in May2001. The actionable plans necessary to implement thefertilizer quality control regulatory framework includethe following:
• Approval of the draft fertilizer laws and regulationsby the cabinet and their enactment by the parliament.
• Identify appropriate department within MOFA andappoint a national fertilizer regulatory chief and allstaff to implement and administer the Ghana Fertil-izer Act and supporting Regulations.
• Develop a Fertilizer Inspection and Fertilizer Ana-lytical Manual for Ghana.
• Develop all report forms corresponding to actionprocedures in the Act and Regulations and the Fer-tilizer Inspection and Analytical Manuals.
• Identify and designate an analytical laboratory. Re-furbish or upgrade facilities for quality controlanalysis.
• Procure and ship all equipment (analytical, inspec-tion, and administrative).
• Organize a study tour for the Ghana fertilizer regu-latory supervisory officials. The study tour shouldinclude visits to one or two countries to observe andlearn how the fertilizer regulatory systems in thosecountries are managed and how they function.
• Conduct a training program in Ghana for inspectors,chemists, technicians, and administrative personnel.
Technology Transfer ActivitiesAlthough efforts to improve the supply side of the
market equation are the focus of this plan, adequateefforts to promote demand through technology trans-fer activities are recommended. New technologies ofcrop production are science-based and knowledge-in-tensive, but the uneducated farmers do not have therequisite skills to incorporate and use the knowledgeembodied in the new technologies of crop production.A greater knowledge about and exposure to these tech-nologies will induce an increased demand for inputs.To disseminate knowledge and educate farmers about
the proper use of new methods of cultivation, activi-ties in the following areas should be promoted:
1. Farm-Level Demonstrations: Farm-level demon-strations should be conducted to teach farmers aboutthe proper use of improved seed and fertilizers.Technology transfer activities promoted by SG 2000should be extended to more areas in the country.Demonstrations are generally the most effectivetools for disseminating new practices because theyembody the principle of “seeing is believing.” Suchdemonstrations should be conducted on the farm-ers’ fields and should educate farmers about theproper use of the technology, including product se-lection, seeding rate, and timely application. Boththe public and private sectors have roles to play.
2. Promoting the Use of Hybrid Seeds: The use ofhybrid seed of maize and other cereals is limited.Through the use of nucleus farmers and the devel-opment of seed enterprises, concerted efforts areneeded to promote the use of hybrids because cropyields are much higher from hybrids than fromopen-pollinated varieties. Through education anddemonstrations and through the timely supply ofinputs and output market development, propaga-tion and dissemination of hybrids should beencouraged.
3. Strengthening Extension Activities: Becausemany farmers do not have high levels of literacyand education, extension agents and subject matterspecialists become important media for knowledgetransfer. In addition to strengthening extension de-partment activities, efforts should be made to tapinto creating new dealers as technology changeagents. MOFA should run training programs fordealers about new methods of cultivation so thatthese dealers can transfer that knowledge to farm-ers. With limited resources, MOFA could focus ondevoting its resources on upstream activities—link-ing with research institutes and transferring thatknowledge to subject matter specialists, who, inturn, could pass that information on to dealers fortransmission to farmers. Such an approach will op-timize returns on MOFA’s limited resources andbuild an effective partnership between the publicand private sectors.

51
4. Improving Fertilizer Recommendations: Farm-ers in Ghana have traditionally relied on fertilizerrecommendations based on the products introducedin the late 1960s and the early 1970s. Such prod-ucts include SSP, AS and NPK (15-15-15). NPK isa balanced fertilizer product supplying all three nu-trients; AS and SSP are low-analysis products. Thecost per unit of nutrient supplied when using theseproducts is higher than that associated with high-analysis products such as urea (46% N), DAP (18%N and 46% P2O5) and MOP (60% K2O). Conse-quently, because (a) the use of high-analysis prod-ucts can reduce the cost of nutrients supplied and(b) relative prices, yield expectations, and theamount of nutrients and their ratios in Ghanaiansoils have changed, there is a need to revise fertil-izer recommendations to consider products’ cost-effectiveness in supplying the required nutrients.Also, there is need to improve crop-specific rec-ommendations. Admittedly, extensive and appro-priate demonstrations should support the introduc-tion of new fertilizer recommendations. Declassi-fying urea as a hazardous product is recommended.
5. Soil Fertility Management: Increased populationpressures in many parts of the country are believedto have led to reduced fallow and continuous culti-vation of soils. Without adequate replenishment ofnutrients, many soils are suffering from nutrientdepletion and becoming degraded. Naturally, cropyields from such soils are also decreasing. To pro-mote and sustain soil productivity, a soil fertilityaction plan was prepared in 1997 (MOFA, 1998).Recommendations of that plan should be imple-mented to strengthen the efforts in technologytransfer areas.
6. Environmental Impacts: Fertilizer use levels inGhana are very low, and increasing the amount offertilizer used to as much as 200 kg of product perhectare is not likely to cause any significant dam-age to the environment. Contrary to the view heldby proponents of organic farming, low use of min-eral fertilizers is inducing soil degradation and willcontinue to do so because nutrients removed in har-vested crops are not adequately replenished. Re-ferring to sub-Saharan Africa, Henk Bremen (inIFDC 2000b) stresses that there might be some dan-gers associated with the nonappropriate use ofchemical fertilizers, but the dangers for not usingthem under the condition of inherently low soil fer-
tility are even greater. This concern clearly appliesto Ghana as well. Henao and Baanante (1999) esti-mated that during the mid-1990s, approximately 80kg/ha of nutrients (N+P2O5+K2O) was lost throughnutrient depletion in the cultivated areas of Ghana.Unless checked through proper management of nu-trients from both organic and mineral sources, suchnutrient losses may spell environmental disaster inthe long run. Soils are losing vegetative covers, andthus reliance on organic sources alone cannot sat-isfy the nutrient requirements. Increased use ofmineral fertilizers to supply nutrients is indispens-able. In a much broader framework, the implemen-tation of the integrated plant nutrient managementcomponent of the national action plan for soil fer-tility management is essential.
Output Market DevelopmentThe demand for agricultural inputs is a derived de-
mand, derived from the demand for the product forwhich the inputs are required. Farmers’ motivationsto use modern inputs (fertilizers, improved seeds, andCPPs) depend, in part, on the availability of a market-ing outlet and the demand for their product. The sup-ply and use of inputs on large-scale commercial farmsare regular and sustainable because the farms usuallycontract the sale of their produce with agroprocessingplants. This is the case, for example, with Ejura Farms,which supplies maize to the Ghana Agro Food Com-pany (GAFCO) for processing composite flour for thebaking industry. Ejura Farms also contracts with Nestléto supply cowpea for processing into baby food andwith the breweries to supply maize grits for the manu-facture of beer. The supply and use of modern inputsis equally regular on plantations such as oil palm, cot-ton, rubber, and tobacco because the companies buythe produce for industrial processing, thereby offer-ing farmers an ensured marketing outlet. The oil palmestates (Benso and Twifo), GCC, GREL, and BAT usu-ally conclude predetermined product prices with theirfarmers prior to the season; hence, input use is not aproblem for their farmers.
Outside the plantations and the large-scale food cropcommercial farms, input supply and use are irregularbecause of the market and price risks that most farm-ers face. Some NGOs (e.g., TechnoServe) are assist-ing farmers to develop post-harvest strategies such asthe inventory credit and storage schemes to reduce

52
risks. If a private-sector-led input distribution systemis to be sustainable, the post-harvest markets (valueadded) should be developed to pull the demand forinputs.
Actionable plans for the development of the outputmarkets include the following:
• Developing the post-harvest market through agro-processing and value added to pull the demand forinputs.
• Enforcing contracts between producers and buyersto ensure a guaranteed market for both the farmer(producer) and the processor (buyer).
• Improving access to market information (price sig-nals and spatial distribution of product).
• Improving access to storage and processing facili-ties (e.g., Ghana Warehouse Operators Union).
• Providing effective quality control and trade regula-tory knowledge to facilitate access to the outsidemarkets.
• Promoting external trade in agricultural products.
Association BuildingTo galvanize the energies of farmers and dealers
scattered all over the country, farmers and agri-inputdealers’ associations should be formed and/or strength-ened. The farmers’ associations will be trained in pool-ing farmers’ resources in buying inputs and selling cropproduce to get a better price. They will also assist indeveloping linkages with banks and policymakers andserve as group collateral for bank loans by members.Appropriate training and technical assistance shouldbe given to association members to operate the asso-ciation in an accountable and transparent manner.
The agri-input dealers’ association should act as areservoir of information and policy guidance for mem-bers. In the long term, such an association could oper-ate its MIS and set up a self-monitoring mechanism todevelop a reputation for ensuring the quality of inputssold by its members. It can develop its brand nameand logo that farmers will associate with the good qual-ity of products sold by its members. It can be equippedto conduct dealer training and farm demonstrations andto provide extension advice to farmers.
Action Plan Matrices for Seed, Fertilizers, andCPPs
In addition to the market development efforts pro-posed earlier, there are certain input-specific measures
that should be undertaken to develop input markets.Action Plan Matrices 3, 4, and 5 summarize all mea-sures recommended for seed, fertilizer, and CPP mar-kets, respectively.
IV. Implementation of the ActionPlan: A Holistic Approach
The implementation of the Action Plan requires aholistic approach. Such an approach should focus onfunctional integration, private-public dector partner-ship, and institutional arrangements.
IV.1. Functional Integration
Important reforms have been implemented in Ghanato allow the private sector to assume responsibility foragricultural inputs marketing after the government’swithdrawal from their direct procurement and distri-bution in the context of the ERP and the follow-upstrategies (i.e., the structural adjustment program andthe MTADP). The privatization process (for fertilizerdistribution) was initiated in selected regions and thenextended to the entire country.
Earlier reforms on the exchange rate regime and theinterest rate liberalization launched in 1986 were alsointended to contribute to the private-sector involve-ment in agricultural input supply. More than a decadeafter this process was launched, total fertilizer con-sumption remains low and input prices are higher. Fur-thermore, the seed industry remains dormant with noprivate seed enterprise operating in country. Very fewoperators are involved in the importation of fertilizer.Similarly, there are few retailers offering inputs to farm-ers in rural areas. Public health has never been so en-dangered by obsolete or inappropriate use of chemi-cal products.
Many of the changes have focused on policy re-forms. Clearly, as in many other countries that haveadopted this reform path, policy reforms are neces-sary but not sufficient for the development of efficientand effective input markets in systems previously un-der public-sector monopoly. This is largely becausesuch an approach to market development does not con-sider issues related to other components of theagribusiness system. The agribusiness system com-prises the manufacture, production, or procurement ofinputs, the marketing of these to farmers (including

53
Action Plan Matrix 3. Seed
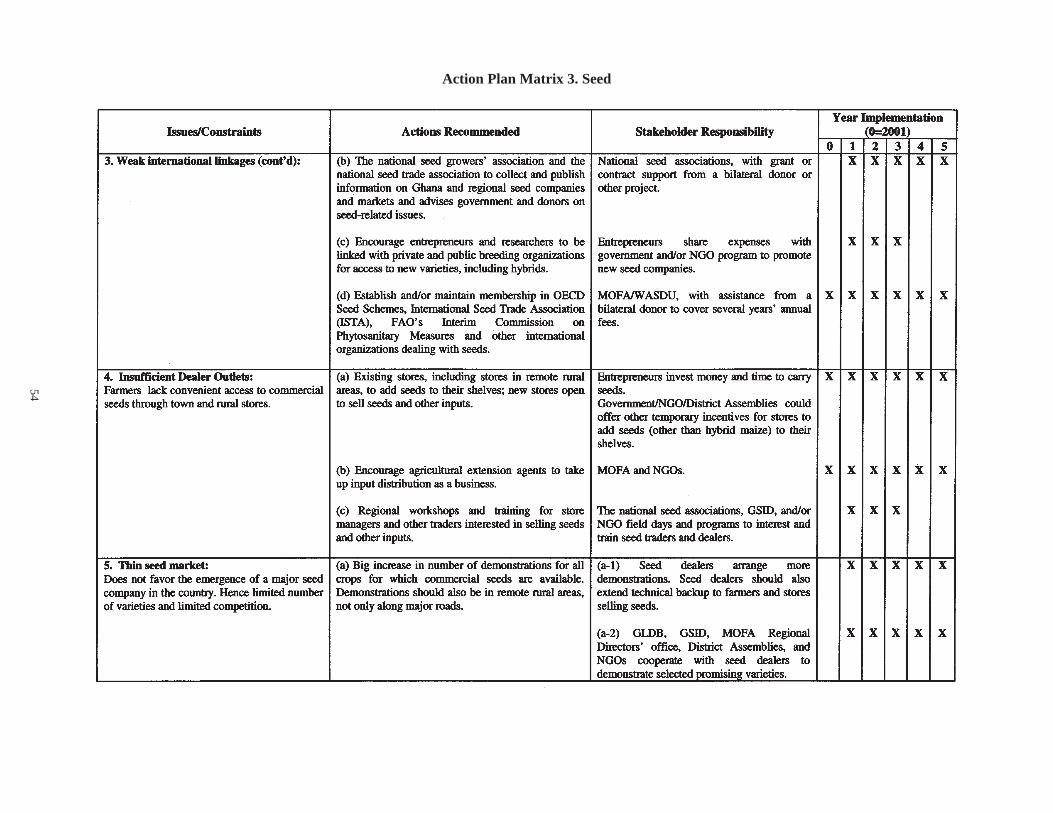
54
Action Plan Matrix 3. Seed

55
Action Plan Matrix 3. Seed

56
Action Plan Matrix 3. Seed

57
Action Plan Matrix 4. Fertilizers
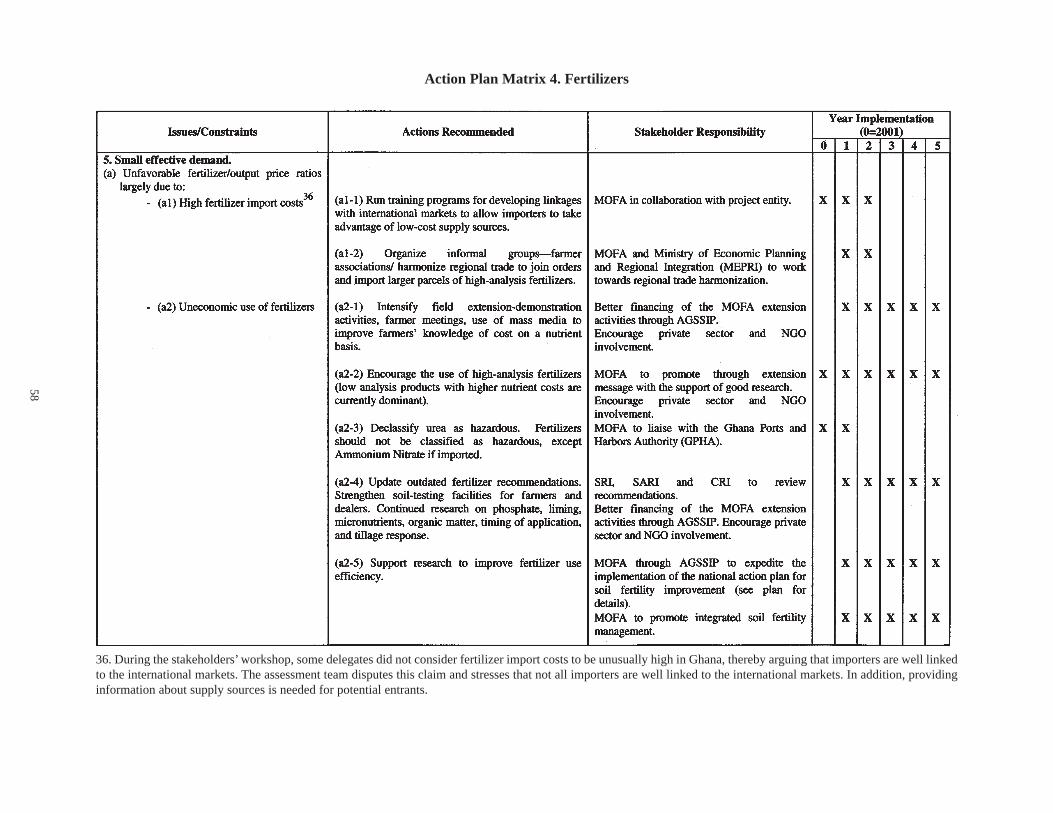
58
Action Plan Matrix 4. Fertilizers
36. During the stakeholders’ workshop, some delegates did not consider fertilizer import costs to be unusually high in Ghana, thereby arguing that importers are well linkedto the international markets. The assessment team disputes this claim and stresses that not all importers are well linked to the international markets. In addition, providinginformation about supply sources is needed for potential entrants.

59
Action Plan Matrix 4. Fertilizers

60
Action Plan Matrix 5. Crop Protection Products

61
Action Plan Matrix 5. Crop Protection Products
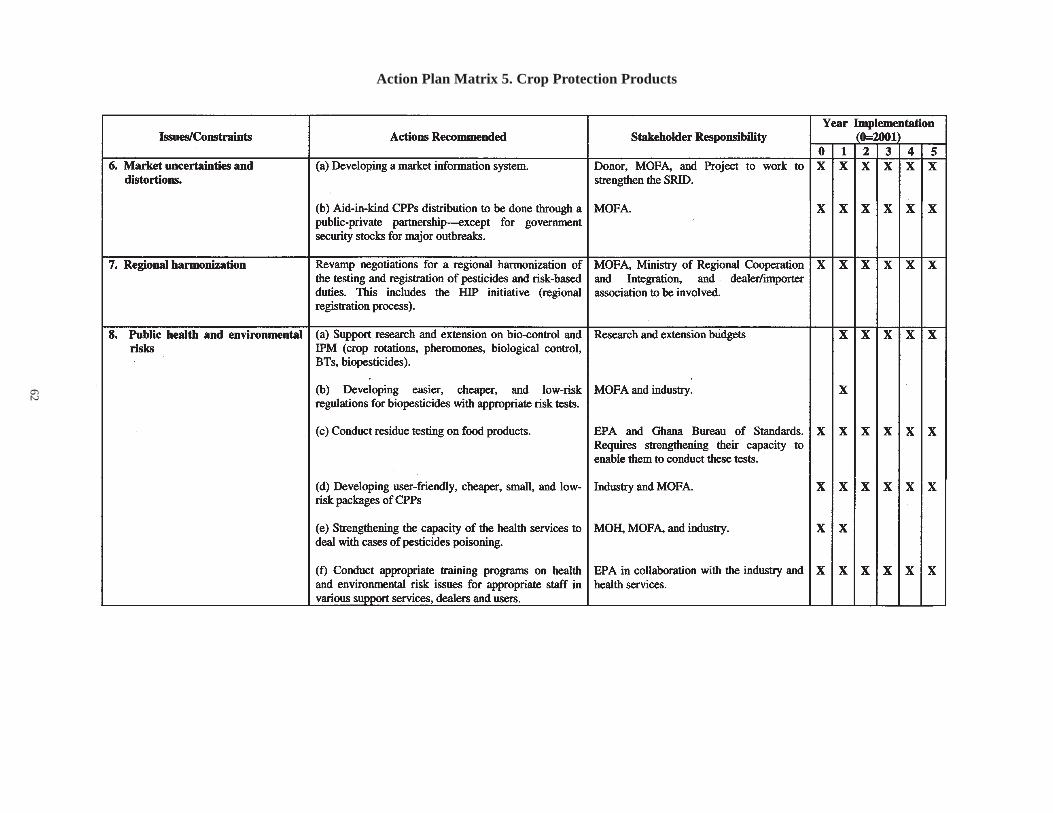
62
Action Plan Matrix 5. Crop Protection Products

63
the provision of technical advisory services to farm-ers), and the use of these inputs by farmers in cropproduction to enhance agricultural productivity andfarm income (Figure 12). It also involves the sale andvalue-added sorting, grading, storage, processing, andmarketing of foods and fibers as food products for live-stock or human consumption or as inputs for other in-dustrial manufacturers.
Farmers and farm production are at the center ofthe total system with both vertical and horizontal dy-namic linkages among all the subcomponents and thefacilitating services required for each of the sub-components. The performance of an agricultural inputsupply system is only as robust as the weakest link inthe total agribusiness system. As a result, to ensurethat these links are strengthened, a holistic approachto promoting sustainable input marketing systems isimperative.
Therefore, to realize the full benefits of the activi-ties proposed in this plan, they should be implementedin a holistic manner so that the synergy of various ac-tivities can be captured. Developments in the finan-cial sector, market information, monitoring and regu-lation in the marketplace, and human capacity build-ing should support activities in policy reform. With-out financial resources, trained entrepreneurs cannotput their training to work. Likewise, laws and regula-tions about truth in labeling should be fully enforcedso that unscrupulous traders do not compromise the
Figure 12. The Agribusiness System.
good reputation of law-abiding traders and the qualityof the products they sell. To integrate various segmentsof the market efficiently, these traders should also haveaccess to the information about national, regional, andglobal markets.
IV.2. Private-Public Sector Partnership
As in most SSA countries, inward-looking state-leddevelopment strategies dominated Ghana’s policychoices in the 1960s and 1970s. In Ghana, this strat-egy resulted in deteriorating terms of trade (largelydue to falling cocoa price) and balance of payment,and a large fiscal deficit and declining use of mineralfertilizers and agricultural productivity. The ensuingdisenchantment gave way to reforms that replaced thestate intervention, ownership, and protection with pri-vate incentives and ownership and with market-basedinput supply systems. Although these reforms initiallydelivered a strong agricultural growth and enthusias-tic participation of the private sector in input supply,they eventually failed to yield the expected resultsbecause the reform process was too sudden and failedto build the necessary institutional and infrastructuresupport for competitive markets. Furthermore, therewas not enough domestic leadership and broad-basedconsultations on the reform process. It has now be-come clear that the private sector cannot develop in-put markets on its own to an efficient level without thepublic-sector support through appropriate policies andinstitutions.

64
The public and private sectors have interlinked rolesto play, and they need to work together as equal part-ners, each party bringing its strengths to the relation-ship. For input market development as in other sub-sectors of the economy, both the private and publicsectors need a greater understanding of which func-tions remain in the public-sector domain and whichones in the private- sector domain. Working in part-nership in developing input markets facilitates discus-sion as to the main issues and how well they might beresolved successfully. Furthermore, such a partnershiphelps achieve the following:
1. Offering the opportunity to develop a commonagenda and to exchange information and data, andthereby operate off the same base.
2. Facilitating the development of input markets inan efficient and cost-effective manner for both thepublic and private partners by offering the oppor-tunity to best leverage their combined resourcesand creativity.
3. Enabling MOFA and the GOG to devote more oftheir resources to their core functions, the deliveryof essential public services and regulations, therebyallowing for better use of public resources and en-abling MOFA and GOG to operate within theirmeans.
4. Increasing the efficiency of the public sector byallowing it to access, in an orderly and disciplinedmanner, and benefit from the private-sector exper-tise with respect to the efficient execution and ad-ministration of certain functions.
5. Ensuring that preferences of the private sector arereflected in the choices and design of interventions.
6. Transferring useful expertise and skills to the pri-vate sector, thereby creating economic opportuni-ties in the private sector.
7. Improving implementation, transparency, andaccountability.
However, it is important to understand that estab-lishing public-private partnership and communicationis not a singular act or that of few meetings. It is andshould be a continuous process. Furthermore, it is notand would not always be easy to bring both public andprivate interests together as equals. What is critical isthe parties’ willingness to come together and discussissues and try new ideas with the understanding that
not everything is going to be a success and successesbreed second-generation problems that need to be ad-dressed also. The occurrence of problems throughoutthe process usually does not offset the benefits ofcollaboration. This rule fails only when one side istrying to take advantage of the other.
In Ghana, there are several opportunities for public-private partnership in both the short and long terms.These include:1. Partnership in sharing the use of existing govern-
ment infrastructure (silos, warehouses, depot, andcold storage facilities).
2. Partnership in managing the MIS.3. MOFA and trained dealers working together to
share demonstrations/extension responsibility.4. Encouraging retired extension officers to work as
input dealers and financial intermediaries betweenrural banks and farmers.
IV.3. Institutional Arrangements
The implementation of the proposed Action Planwill require some new institutional arrangements be-cause it is essential that various components be imple-mented in a concurrent fashion so that the synergy ofdifferent efforts can be harnessed. If different compo-nents are implemented in a disjointed manner, result-ing efforts may not produce the necessary synergy andcohesiveness. It is therefore recommended that an au-tonomous project entity be created to implement theAction Plan. The Project Leader should have the re-sponsibility of implementing the project activities andliaise with the Chief Director of the MOFA. The ChiefDirector should provide general monitoring andguidance.
In addition, a Steering Committee should be cre-ated to provide policy guidance. The Steering Com-mittee will be an advisory body to the project throughthe Chief Director, MOFA. It should consist of stake-holders from the private sector, farmer/representatives,donor community, and the government. The MOFAshould coordinate the Steering Committee’s activitiesand assist in making the necessary arrangements forstakeholders’ meetings.
As the Action Plan focuses heavily on working withthe private sector, the project entity should remain au-tonomous and outside MOFA. Otherwise, actors in the

65
private sector may feel hesitant to approach the projectstaff for necessary help and may perceive the projectas another approach by MOFA to interfere in the func-tioning of the agricultural input markets.
It is envisaged that the implementation of the Ac-tion Plan will require three long-term experts, namely,a market development specialist, a seed specialist, anda finance specialist. This core group of experts will besupported by 10 national experts and 20-25 adminis-trative and support staff members. This team will re-ceive help, when needed, from short-term specialistsin the area of policy, regulatory system, MIS, finance,project management, and agronomic issues.
References
Asante, E. O. 1999. “Liberalization of Agricultural In-put and Output Markets: Experience of Ghana,” INS. K. Debrah. and W. G. Koster (Eds.). Linking SoilFertility Management to Agricultural Input and Out-put Market Development: The Key to SustainableAgriculture in West Africa. Miscellaneous FertilizerStudies No. 16, IFDC-Africa, Lomé, Togo.
Asenso-Okyere, W. K. 1994. Fertilizer Pricing and Dis-tribution Policy in Ghana.
Bank of Ghana. 1999. Annual Report.
Bonsu, M., K. Y. Fosu, and K. Kwakye. 1996. SoilManagement Action for Ghana. World Bank, Wash-ington, DC, U.S.A.
Bumb, B. L., J. F. Teboh, J. K. Atta, and W. K. Asenso-Okyere. 1994. Ghana: Policy Environment and Fer-tilizer Sector Development. Technical Bulletin IFDCT-41, Muscle Shoals, AL, U.S.A.
Debrah. S. K. 2000. A Review and Analysis of theAgricultural Input Supply and Distribution Systemin Ghana. Contribution to “FAO/World Bank. 2000.Ghana: Agricultural Input Study.”
Delimini, L. L., and J. Wobil. 1998. Ghana Seed Sec-tor Analysis, International Institute for Tropical Ag-riculture (IITA)/GTZ Project on Promotion of SeedProduction and Marketing in West Africa, Ministryof Food and Agriculture.
EPA. 1991. Environmental Action Plan, Volumes I andII, Environmental Protection Council, Accra, Ghana.
FAO RAF. 2000. Revised Inventory of Obsolete Pes-ticides in Ghana, FAO Regional Office for Africa,January 2000.
FAO/World Bank. 1991. Ghana - Land Resource Man-agement Study. Identification Mission Volume I,FAO/World Bank Cooperative Program.
FAO/World Bank. 2000. Ghana: Agricultural InputStudy.
Gerner, H., E. O. Asante, E. Owusu-Bennoah, and K.Marfo. 1995. Ghana Fertilizer Privatization Scheme:Private Sector Roles and Public Sector Responsi-bilities in Meeting Needs of Farmers, IFDC Fertil-izer Sector Studies in Africa, Vol. 5, Technical Bul-letin IFDC T-56, IFDC Africa, Lomé, Togo.
Government of Ghana (GOG). 2001. The Budget State-ment and Economic Policy for the 2001 FinancialYear. Budget presented to Parliament by the Minis-ter of Finance (9 March 2001).
Government of Ghana and The World Bank/Ghana.2000. Country Assistance Strategy for Ghana: 2000-2003.
Henao, J., and C. Baanante. 1999. Estimating Rates ofNutrient Depletion in Soils of Agricultural Lands ofAfrica, Technical Bulletin IFDC T-48, MuscleShoals, AL, U.S.A.
IFDC. 1986. Ghana Fertilizer Privatization Study.Muscle Shoals, Alabama, U.S.A.
IFDC. 2000a. A Strategic Framework for African Ag-ricultural Inputs Supply System Development, Tech-nical Bulletin IFDC T-63.
IFDC. 2000b. “To Inherit the Earth: A Question ofSurvival.” IFDC Video.
IFDC. 2001a. Assessment of the Requirements for Es-tablishing a Fertilizer Regulatory System in Ghana,Final Report prepared for the MOFA under IFDC-Africa’s Policy and Market Development Program.
IFDC. 2001b. Proposed Draft Bill on the FertilizerControl Act, 2001 for Ghana. Draft prepared for theMOFA under IFDC-Africa’s Policy and Market De-velopment Program.
IFDC. 2001c. Proposed Draft Regulations under theFertilizer Control Act, 2001 for Ghana. Draft pre-pared for the MOFA under IFDC-Africa’s Policy andMarket Development Program.

66
Lessons, and Challenges,” held in Cape Town, SouthAfrica, October 16-20, 2000.
Ofori, F., and E. A. Dennis. 1996. “Fertilizer Use, Pro-curement and Marketing in Ghana: Past andPresent,” IN F. Ofori and E.Y. Safo (Eds.), Proceed-ings of the National Workshop on Soil Fertility Man-agement Action Plan for Ghana, held at Cape Coast,Ghana, July 205, 1996, organized by Ministry ofFood and Agriculture in conjunction with the Min-istry of Environment, Science, and Technology, theMinistry of Lands and Forestry, the University ofCape Coast, and IFDC-Africa, Special PublicationIFDC SP-33.
Ofori, F., and F. Fianu. 1996. “Sustaining Soil Fertil-ity in Ghana: An Integrated Nutrient ManagementApproach,” IN F. Ofori and E. Y. Safo (Eds.), Pro-ceedings of the National Workshop on Soil FertilityManagement Action Plan for Ghana, held at CapeCoast, Ghana, July 2-5, 1996, organized by Minis-try of Food and Agriculture in conjunction with theMinistry of Environment, Science, and Technology,the Ministry of Lands and Forestry, the Universityof Cape Coast, and IFDC-Africa, Special Publica-tion IFDC SP-33.
Policy Planning, Monitoring and Evaluation/MOFA.1999. Agriculture in Ghana: Facts and Figures.Accra, Ghana.
PriceWaterHouseCoopers. 2001. The 2001 GhanaBudget Highlights, March 2001.
Ramatu, M. Al-Hassam. 2000. Inventory of Agricul-tural Production Support and Financial Services.Semi-Arid Food Grain Research and Development(SAFGRAD)/Council for Scientific and IndustrialResearch (CSIR) Draft Final Report.
Safo, E. Y, K. A. Marfo, J. A. Poku, and T. Ahima.1999. Agricultural Inputs Supply Systems in Ghana.Report prepared in collaboration with IFDC-Africa,April 1999.
Schiere, M. 1998. The Ghanaian Fertilizer Market. MSThesis, Department of Development Economics,Wageningen Agricultural University and IFDC-Af-rica, Lomé, Togo.
Tsikata, Y. M. 1999. Aid and Reform in Ghana.Visker, C., D. Rutland, and K. Dahoui. 1996. The Qual-
ity of Fertilizers in West Africa (1995), IFDC-Africa,Lomé, Togo, Technical Bulletin IFDC T-45.
IFDC/DAI/MTL. 2000. An Action Plan for Develop-ing Sustainable Agricultural Input Supply Systemsin Malawi, Volume I--Main Report. Report submit-ted to the Malawi Ministry of Agriculture andIrrigation.
Kempkes, Y. 1997. Impact of Structural AdjustmentProgrammes on Fertilizer Use: The Case of Ghanaand Burkina Faso. MS Thesis, Department of De-velopment Economics, Wageningen AgriculturalUniversity and IFDC-Africa, Lomé, Togo.
MOFA. 1995. Ghana’s Vision 2020.MOFA. 1998. National Soil Fertility Management Ac-
tion Plan, Accra, Ghana.MOFA. 2001. Accelerated Agricultural Growth and
Development Strategy in Support of Ghana’s Vision2020.
MOFA/Plant Protection and Regulatory Services Di-rectorate. 2000a. Handbook of Crop Protection Rec-ommendations in Ghana: An IPM Approach, Vol. 1,Cereals and Pulses, Accra, Ghana.
MOFA/Plant Protection and Regulatory Services Di-rectorate. 2000b. Handbook of Crop Protection Rec-ommendations in Ghana: An IPM Approach, Vol. 2,Vegetables, Accra, Ghana.
MOFA/Plant Protection and Regulatory Services Di-rectorate. 2000c. Handbook of Crop Protection Rec-ommendations in Ghana: An IPM Approach, Vol. 3,Root & Tuber Crops Plantations, Accra, Ghana.
MOFA/SRID. 2001. Agriculture in Ghana: Facts andFigures, Accra, Ghana.
Ocran, V. K., L. L. Delimini, R. S. Asuboah, and E. A.Asiedu. 1998. Seed Management A Manual forGhana. DFID-funded project report, Ministry ofFood and Agriculture.
Ofori, F. 1999. “Developing a Soil Fertility Manage-ment Action Plan for Ghana,” IN S. K. Debrah andW. G. Koster (Eds.). Linking Soil Fertility to Agri-cultural Input and Output Market Development: TheKey to Sustainable Development in West Africa, Mis-cellaneous Fertilizer Studies No. 16, IFDC-Africa,Lomé, Togo, pp. 204-219.
Ofori, F. 2000. Economic Reforms and AgriculturalInput Markets: A Case Study of Ghana. Paper pre-sented at the International Workshop on Policy Re-forms and Agricultural Input Markets: Experiences,

Paper Series IFDC—P-24December 20021M
IFDCP.O. Box 2040Muscle Shoals, Alabama 35662 (U.S.A.) ISBN 0-88090-130-6