Embed Size (px)
Citation preview
An Agency of the Health and Safety Executive
www.hsl .gov .ukAn Agency of the Health and Safety Executive
www.hsl .gov .ukAn Agency of the Health and Safety Executive
Risk Assessment Methodology for CO2 Pipelines: latest work from HSL
Dr Diego LisbonaMajor Hazards Unit, HSL
An Agency of the Health and Safety Executive
CO2 pipelines – so what?
• Previous work by HSL has shown that:
• There are significant hazards:Connolly & Cusco “Hazards from high pressure carbon dioxide releases during carbon dioxide sequestration processes”. 12th International Symposium on Loss Prevention and Safety Promotion in the Process Industries, Edinburgh, 22-24 May 2007.
• There are significant risks:Wilday, McGillivray,Harper & Wardman “A Comparison of Hazard and Risks for CO2 and Natural Gas Pipelines” Hazards XXI Symposium, Manchester, 10-12 November 2009.
An Agency of the Health and Safety Executive
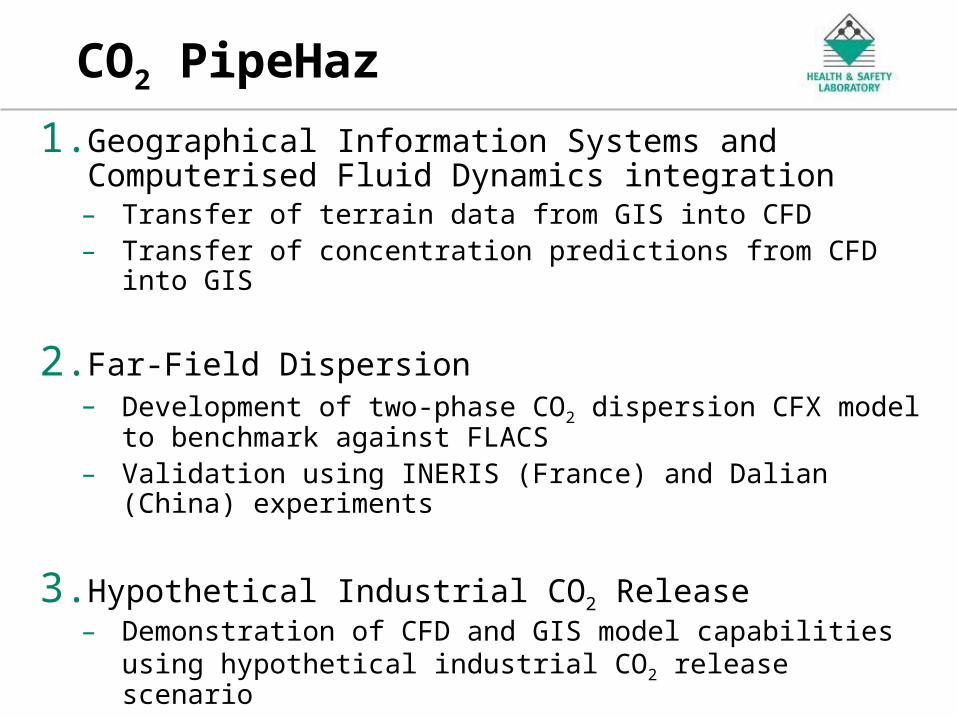
CO2 PipeHaz
1. Geographical Information Systems and Computerised Fluid Dynamics integration– Transfer of terrain data from GIS into CFD– Transfer of concentration predictions from CFD into GIS
2. Far-Field Dispersion– Development of two-phase CO2 dispersion CFX model
to benchmark against FLACS– Validation using INERIS (France) and Dalian (China)
experiments
3. Hypothetical Industrial CO2 Release– Demonstration of CFD and GIS model capabilities using
hypothetical industrial CO2 release scenario
An Agency of the Health and Safety Executive
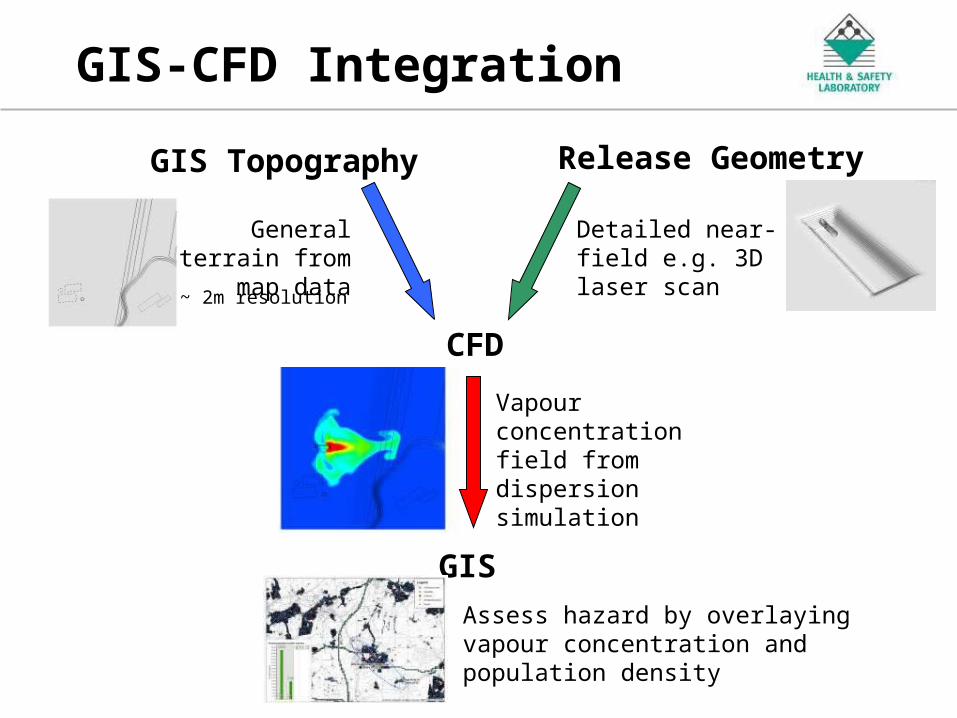
GIS-CFD Integration
GIS Topography
CFD
GIS
General terrain from map data
Detailed near-field e.g. 3D laser scan
Release Geometry
Vapour concentration field from dispersion simulation
Assess hazard by overlaying vapour concentration and population density
~ 2m resolution

An Agency of the Health and Safety Executive
Decision Support Tools
Objectives– Incorporate the predictive capabilities
developed in previous Work Packages, as well as current knowledge and good practice, into decision support tools.
– Demonstrate the usefulness of tools to identify potential hazards and to assess their capability to predict and model consequences
An Agency of the Health and Safety Executive
Description of work
• Review and refinement of good practice guidelines
• Safety and risk assessment tools
– Review of risk assessment approaches
– Integral consequence assessment methodology
– Risk assessment methodology based on ARAMIS
– Short-cut risk assessment methodology incorporating topography
• Test cases
An Agency of the Health and Safety Executive
CO2 risk assessment
• Overall aim: To develop a risk assessment methodology for CO2 pipelines
• Incorporate new knowledge from CFD and experiments
• Precautionary estimates applied and discussed for any remaining knowledge gaps
• To perform consequence modelling for a test case high pressure CO2 pipeline using Phast and/or other appropriate tools if applicable
• Apply individual and societal risk assessments to the hazard footprints

An Agency of the Health and Safety Executive
CO2 risk assessment
1. METHODOLOGY OF SAFETY STUDY OF CO2 PIPELINES BASED ON ARAMIS
2. QUALITATIVE RISK ASSESSMENT
a) Hazard identificationb) Causes of loss of containment
3. QUANTITATIVE RISK ASSESSMENT FAILURE FREQUENCY CALCULATION:
a) Calculation of Ffailure based on incidents in existing CO2 pipelines (US DOT database)
b) Comparison between CO2 and natural gas in US: Ffailure for CO2 pipelines and Ffailure for CO2 pipelines
c) Extrapolate
An Agency of the Health and Safety Executive
Quantitative risk analysis: Frequency calculations
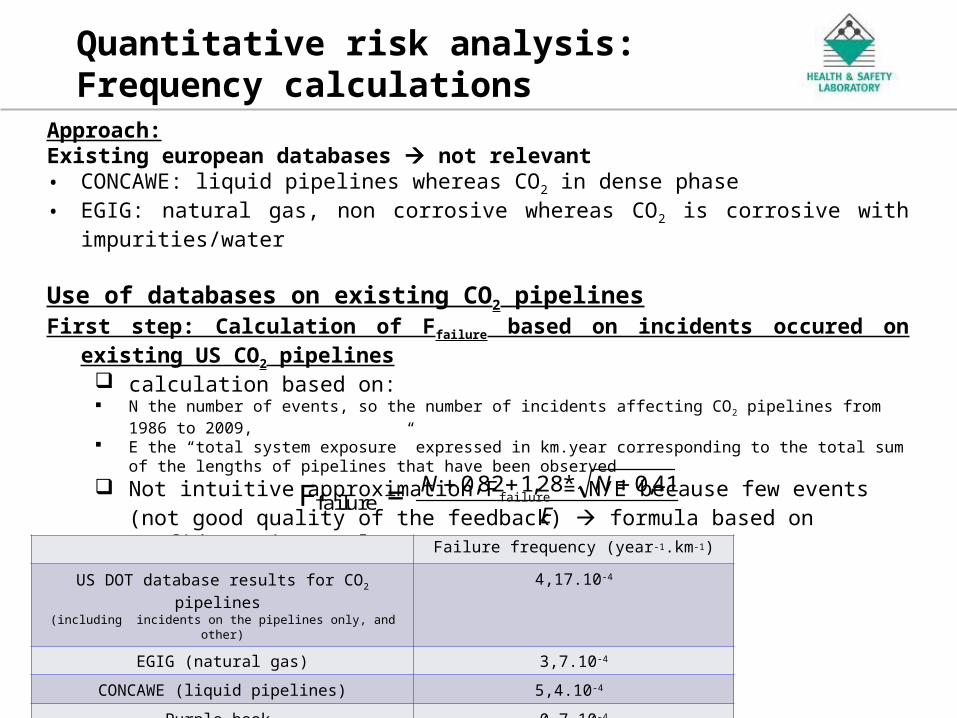
Approach:Existing european databases not relevant• CONCAWE: liquid pipelines whereas CO2 in dense phase• EGIG: natural gas, non corrosive whereas CO2 is corrosive with impurities/water
Use of databases on existing CO2 pipelinesFirst step: Calculation of Ffailure based on incidents occured on existing US CO2
pipelines calculation based on: N the number of events, so the number of incidents affecting CO2 pipelines from 1986 to 2009, E the “total system exposure” expressed in km.year corresponding to the total sum of the lengths of pipelines
that have been observed
Not intuitive approximation Ffailure = N/E because few events (not good quality of the feedback) formula based on confidence intervals
Ffailure = E
NN 41,0*28,182,0
Failure frequency (year-1.km-1)
US DOT database results for CO2 pipelines (including incidents on the pipelines only, and other)
4,17.10-4
EGIG (natural gas) 3,7.10-4
CONCAWE (liquid pipelines) 5,4.10-4
Purple book 0,7.10-4
An Agency of the Health and Safety Executive
Quantitative risk analysis : Comparison natural gas/CO2 in the US
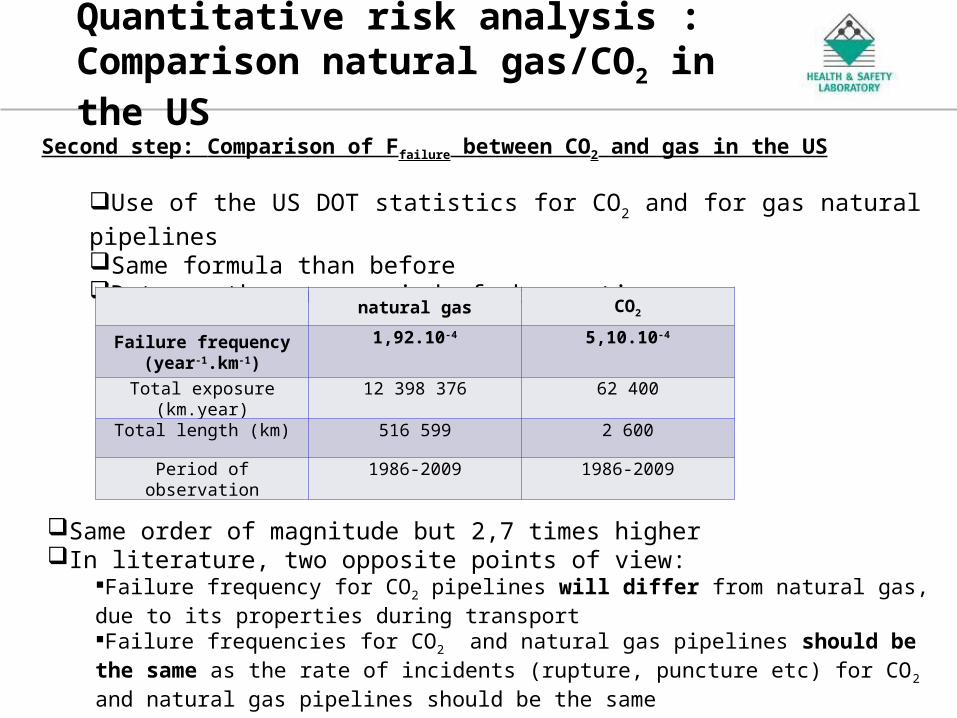
Second step: Comparison of Ffailure between CO2 and gas in the US
Use of the US DOT statistics for CO2 and for gas natural pipelinesSame formula than before Data on the same period of observation
natural gas CO2
Failure frequency(year-1.km-1)
1,92.10-4 5,10.10-4
Total exposure (km.year)
12 398 376 62 400
Total length (km) 516 599 2 600
Period of observation 1986-2009 1986-2009
Same order of magnitude but 2,7 times higherIn literature, two opposite points of view:
Failure frequency for CO2 pipelines will differ from natural gas, due to its properties during transportFailure frequencies for CO2 and natural gas pipelines should be the same as the rate of incidents (rupture, puncture etc) for CO2 and natural gas pipelines should be the same
An Agency of the Health and Safety Executive
Quantitative risk analysis: Extrapolation of the comparison EU/US natural gas frequencies to EU/US CO2 frequencies
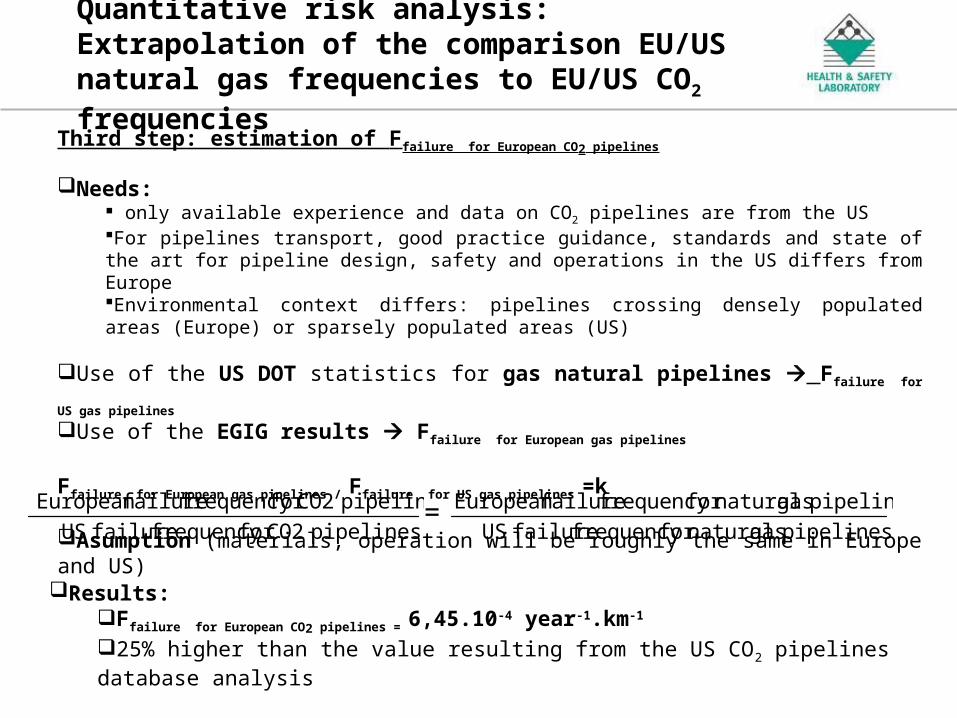
Third step: estimation of Ffailure for European CO2 pipelines
Needs: only available experience and data on CO2 pipelines are from the USFor pipelines transport, good practice guidance, standards and state of the art for pipeline design, safety and operations in the US differs from EuropeEnvironmental context differs: pipelines crossing densely populated areas (Europe) or sparsely populated areas (US)
Use of the US DOT statistics for gas natural pipelines Ffailure for US gas pipelines
Use of the EGIG results Ffailure for European gas pipelines
Ffailure for European gas pipelines / Ffailure for US gas pipelines =k
Asumption (materials, operation will be roughly the same in Europe and US)
pipelines CO2for frequency failure US
pipelines CO2for frequency failureEuropean = pipelines gas naturalfor frequency failure US
pipelines gas naturalfor frequency failureEuropean
Results: Ffailure for European CO2 pipelines = 6,45.10-4 year-1.km-1
25% higher than the value resulting from the US CO2 pipelines database analysis
An Agency of the Health and Safety Executive
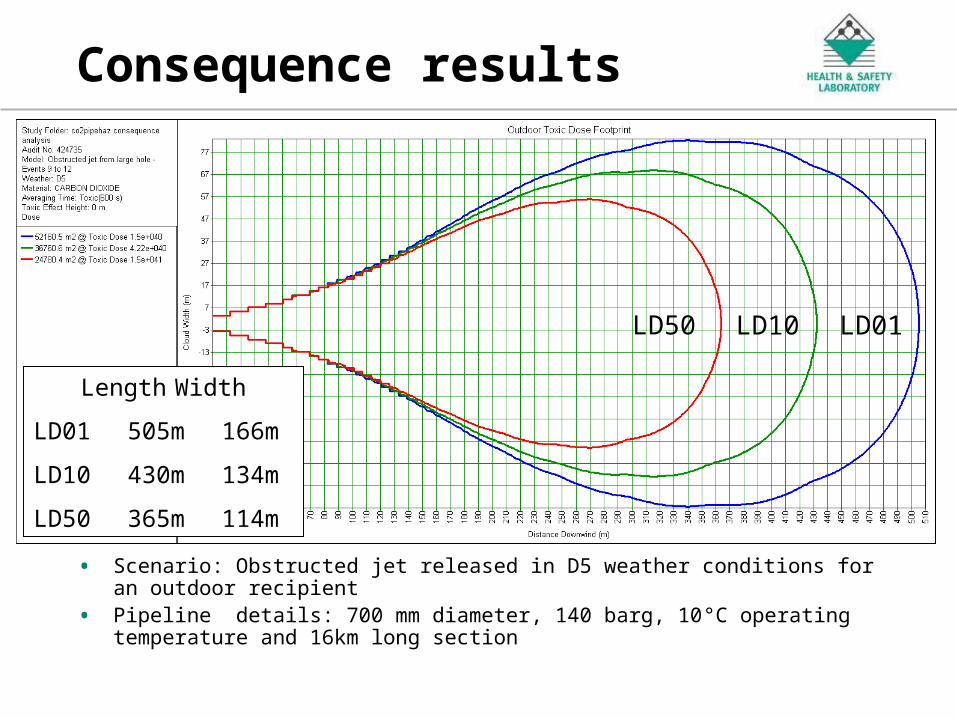
Consequence results
• Scenario: Obstructed jet released in D5 weather conditions for an outdoor recipient
• Pipeline details: 700 mm diameter, 140 barg, 10°C operating temperature and 16km long section
LD01LD10LD50
Length Width
LD01 505m 166m
LD10 430m 134m
LD50 365m 114m
An Agency of the Health and Safety Executive
Societal risk assessment
5
10
15
20
25
30
35
40
45
50
55
60
65
70
75
80
85
90
95
100
Pipeline trajectory
Population density (persons per ha)
An Agency of the Health and Safety Executive
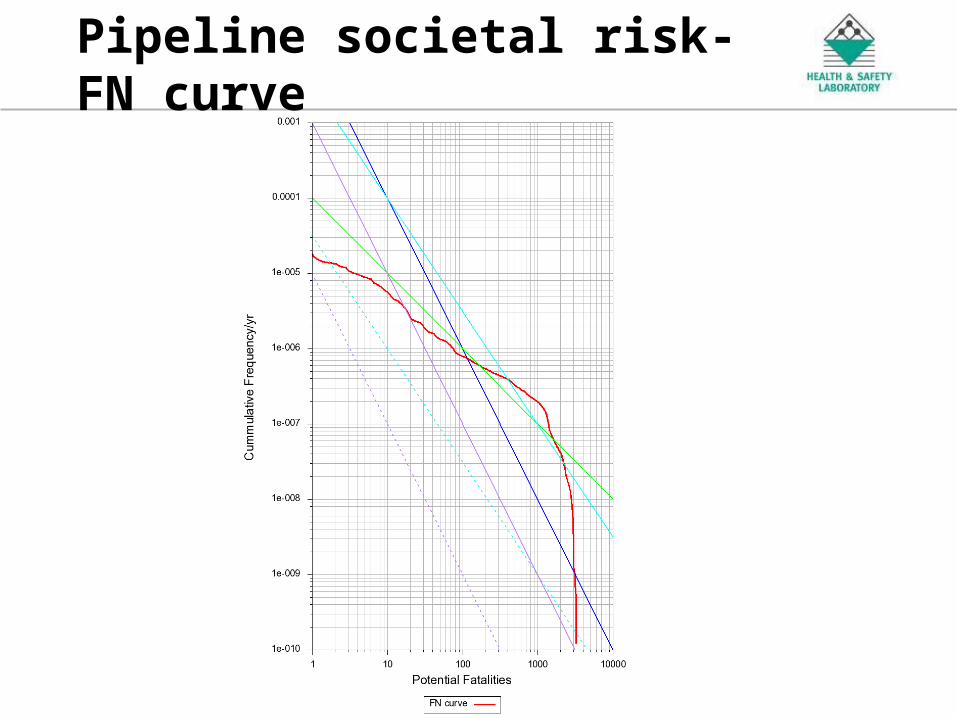
Pipeline societal risk- FN curve

An Agency of the Health and Safety Executive
Risk assessment incorporating topography
1) Literature review Identified two publicly available dispersion models for testing
– QUIC (Los Alamos National Security, U.S. Department of Energy's)
– Twodee-2 (Hankin, 2003-04)
2) Test models using wind tunnel data (Schaztmann)
– QUIC
– TWODEE-2
– CFD models
3) Test case pipeline assessment
4) Dose calculation and overlay with population data in HSL risk assessment tool QuickRisk
An Agency of the Health and Safety Executive
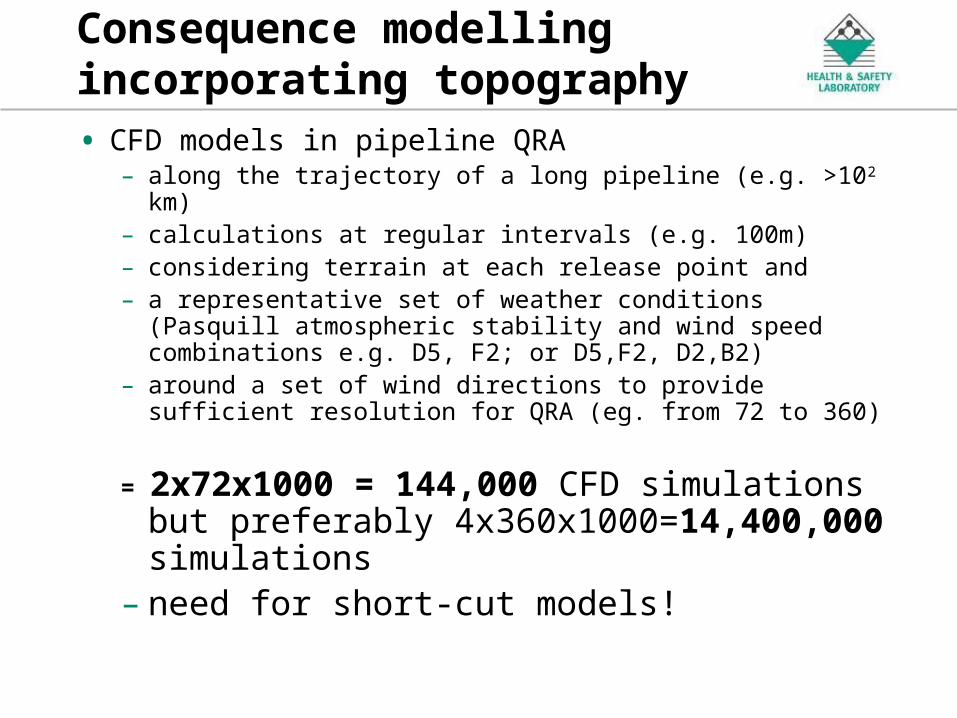
Consequence modelling incorporating topography
• CFD models in pipeline QRA– along the trajectory of a long pipeline (e.g. >102 km) – calculations at regular intervals (e.g. 100m)– considering terrain at each release point and– a representative set of weather conditions (Pasquill
atmospheric stability and wind speed combinations e.g. D5, F2; or D5,F2, D2,B2)
– around a set of wind directions to provide sufficient resolution for QRA (eg. from 72 to 360)
= 2x72x1000 = 144,000 CFD simulations but preferably 4x360x1000=14,400,000 simulations
– need for short-cut models!

An Agency of the Health and Safety Executive
Short-cut topography models
• TWODEE-2: Shallow layer model– PROS:
• topography• open source• standard ASCII text format inputs and outputs• concentration and dose outputs (ASCII text grd
file)• it can be run non-interactively
– CONS:• mesh dependency; source term definition• run time increases with mesh resolution• queries on detail of earlier versions
An Agency of the Health and Safety Executive
Short-cut topography models
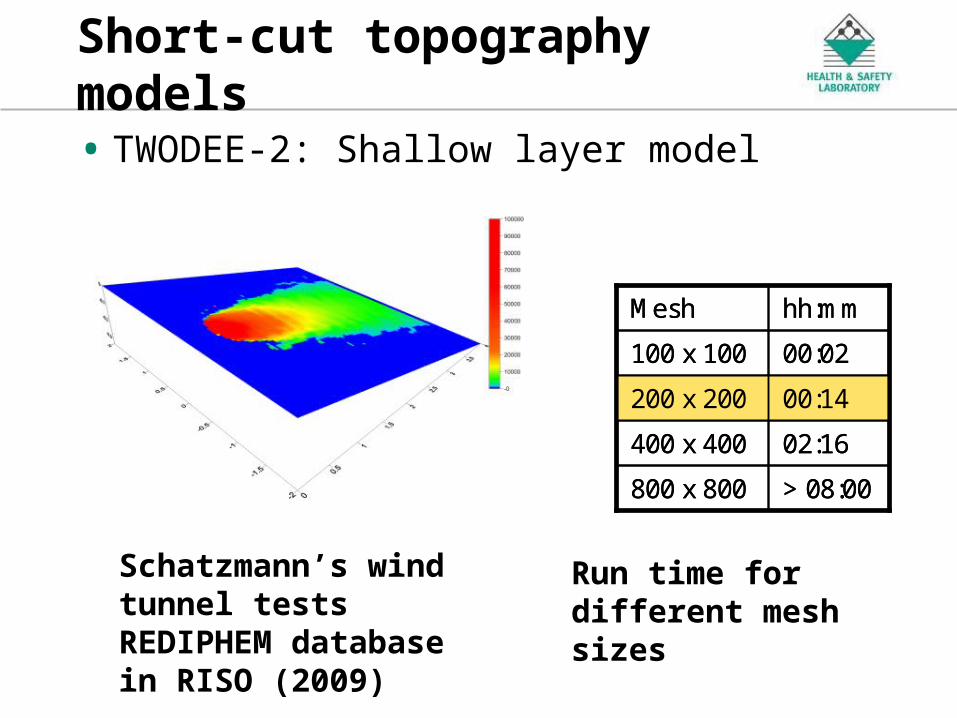
• TWODEE-2: Shallow layer model
Run time for different mesh sizes
02:16400 x 400
00:14200 x 200
00:02100 x 100
> 08:00800 x 800
hh:mmMesh
02:16400 x 400
00:14200 x 200
00:02100 x 100
> 08:00800 x 800
hh:mmMesh
Schatzmann’s wind tunnel tests REDIPHEM database in RISO (2009)
An Agency of the Health and Safety Executive
Short-cut topography models
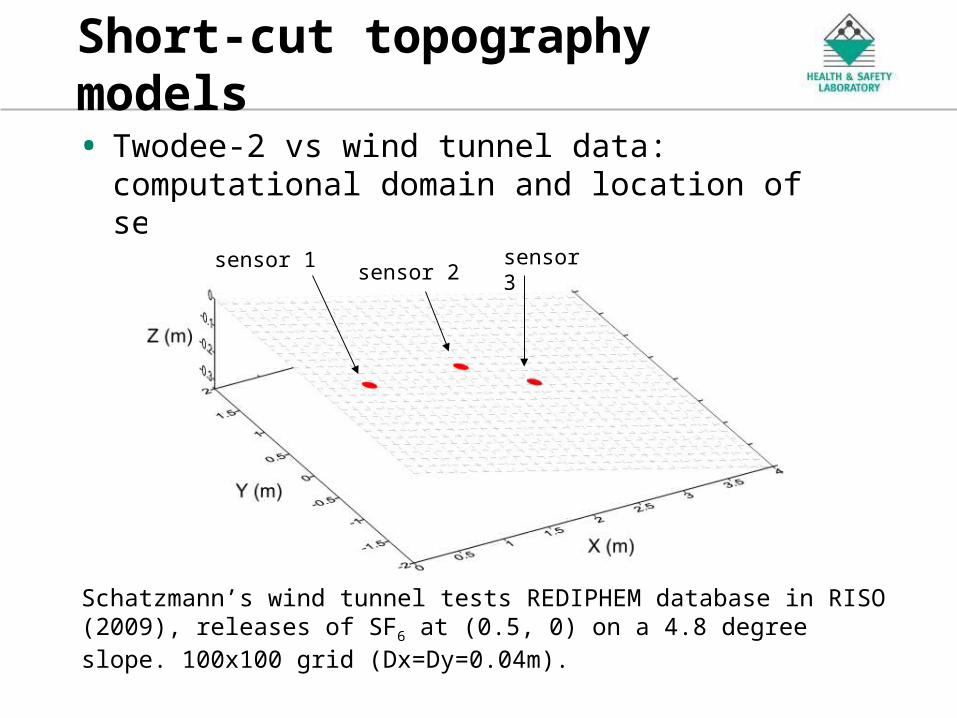
• Twodee-2 vs wind tunnel data: computational domain and location of sensors
Schatzmann’s wind tunnel tests REDIPHEM database in RISO (2009), releases of SF6 at (0.5, 0) on a 4.8 degree slope. 100x100 grid (Dx=Dy=0.04m).
sensor 1sensor 2
sensor 3
An Agency of the Health and Safety Executive
Short-cut topography models
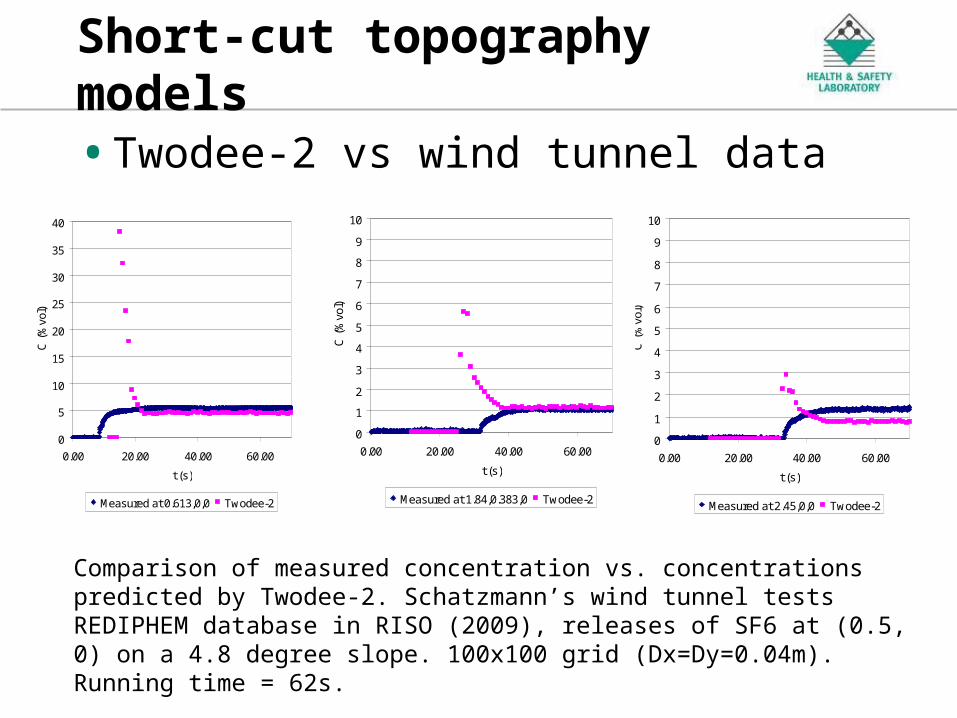
• Twodee-2 vs wind tunnel data
0
1
2
3
4
5
6
7
8
9
10
0.00 20.00 40.00 60.00
t (s)
C (
%vo
l)
Measured at 2.45,0,0 Twodee-2
0
5
10
15
20
25
30
35
40
0.00 20.00 40.00 60.00
t (s)
C (
%vo
l)
Measured at 0.613,0,0 Twodee-2
0
1
2
3
4
5
6
7
8
9
10
0.00 20.00 40.00 60.00
t (s)
C (
%vo
l)
Measured at 1.84,0.383,0 Twodee-2
Comparison of measured concentration vs. concentrations predicted by Twodee-2. Schatzmann’s wind tunnel tests REDIPHEM database in RISO (2009), releases of SF6 at (0.5, 0) on a 4.8 degree slope. 100x100 grid (Dx=Dy=0.04m). Running time = 62s.
An Agency of the Health and Safety Executive
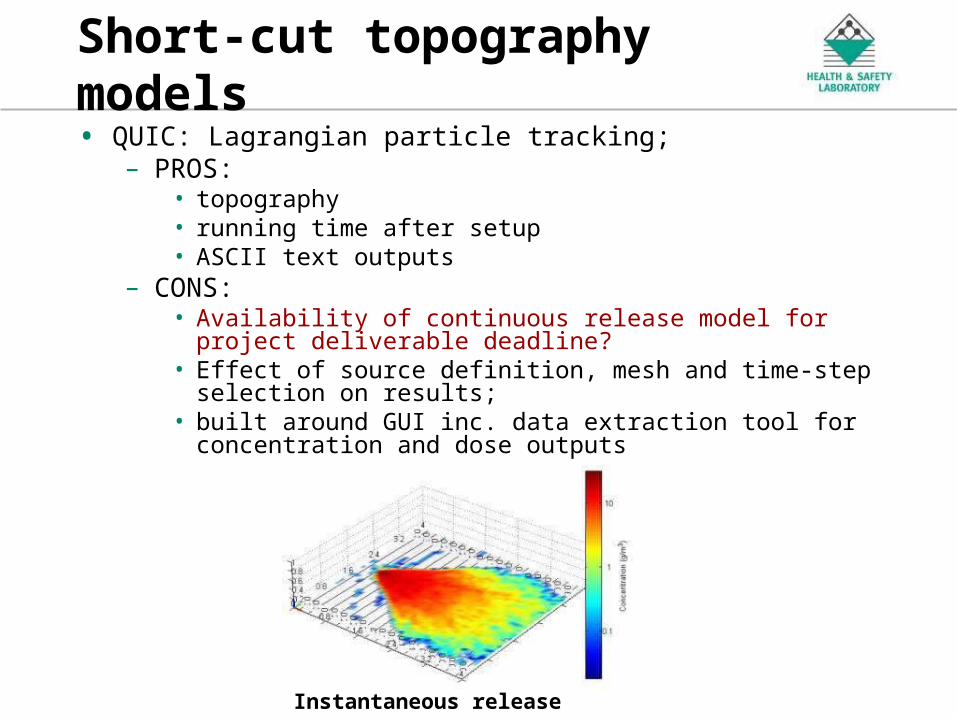
Short-cut topography models• QUIC: Lagrangian particle tracking;
– PROS: • topography• running time after setup• ASCII text outputs
– CONS: • Availability of continuous release model for project deliverable
deadline? • Effect of source definition, mesh and time-step selection on
results; • built around GUI inc. data extraction tool for concentration and
dose outputs
Instantaneous release

An Agency of the Health and Safety Executive
Short-cut risk assessment methodology
– Inputs• Topography data• Population• Scenarios (frequency)• Dispersion modelling (Twodee-2, QUIC)• Dose contours
– Societal risk calculation (QuickRisk)
An Agency of the Health and Safety Executive
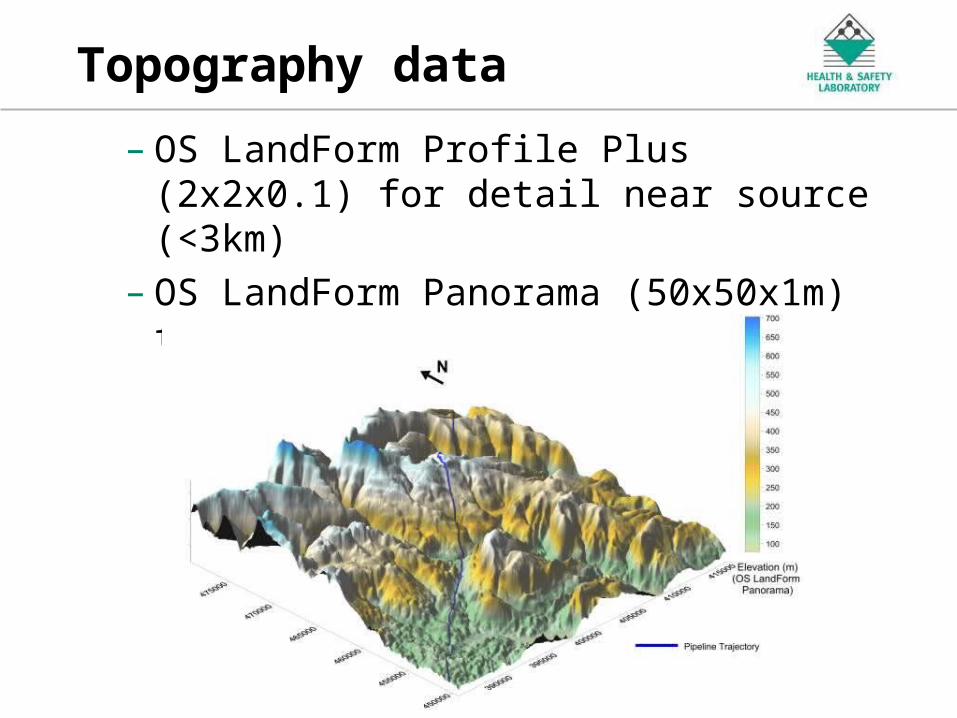
Topography data
– OS LandForm Profile Plus (2x2x0.1) for detail near source (<3km)
– OS LandForm Panorama (50x50x1m) to 15 km from source
An Agency of the Health and Safety Executive
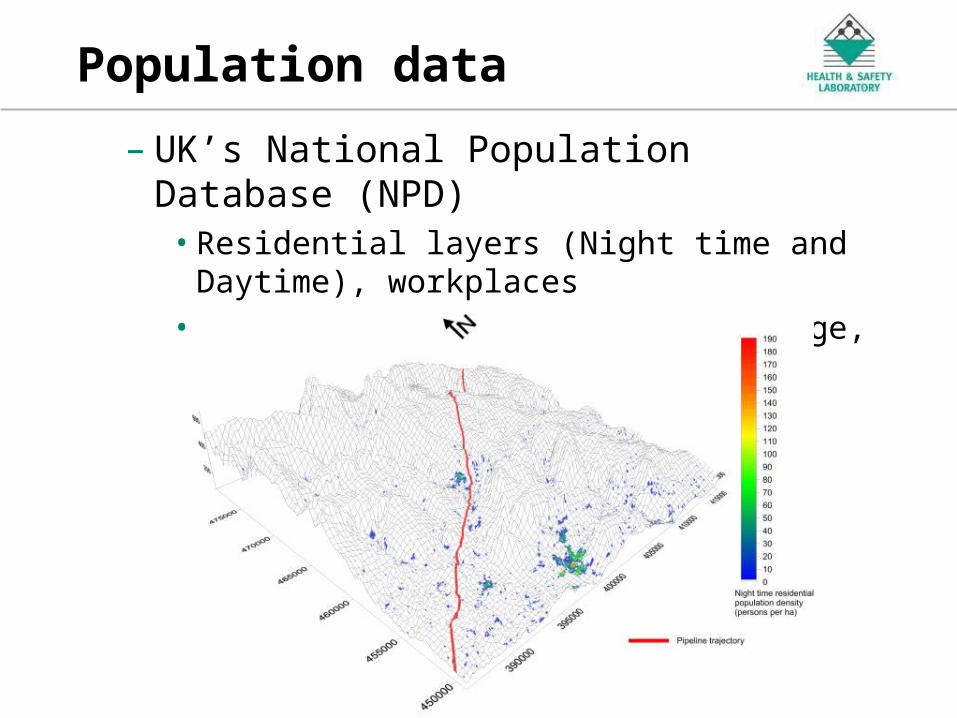
Population data
– UK’s National Population Database (NPD)• Residential layers (Night time and Daytime),
workplaces• Schools, Hospitals, Roads (average, peak flow),

An Agency of the Health and Safety Executive
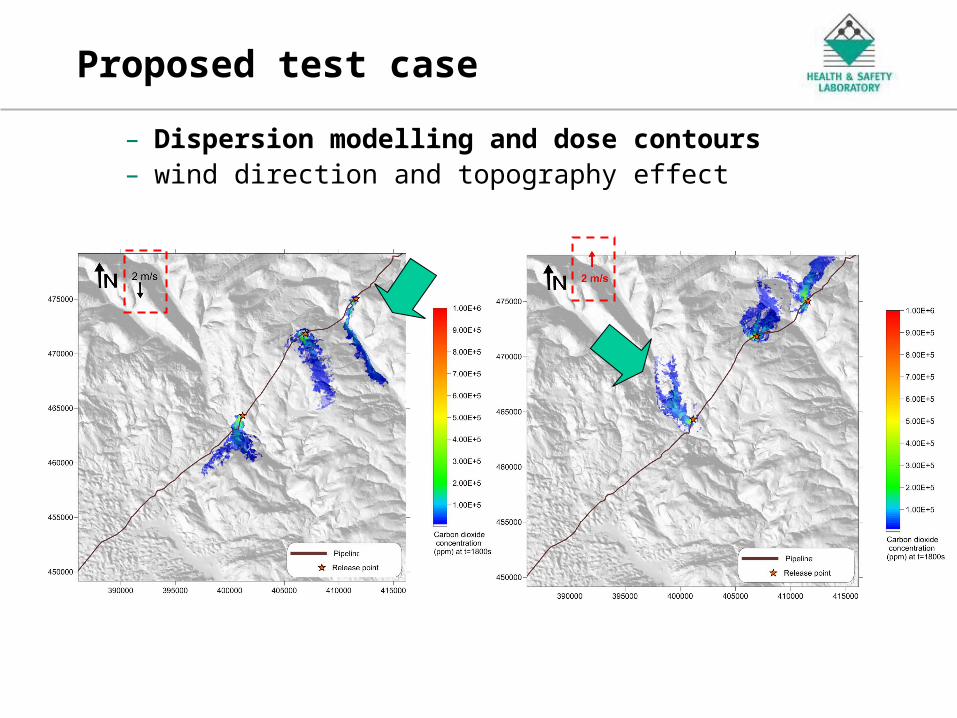
Proposed test case
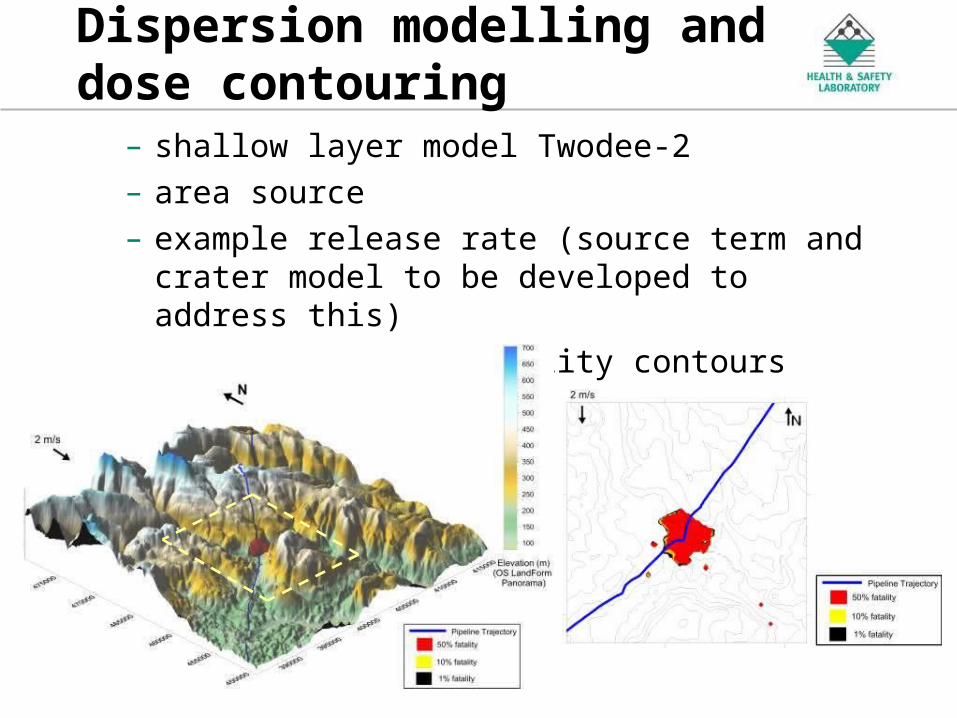
• Dispersion modelling – e.g. shallow layer model Twodee-2– area source– example release rate (source term and crater model to be
developed to address this)– Calculations repeated at regular interval along the pipeline
(e.g. 100m distance) and weather conditions (e.g. D5 and F2) and a series of wind directions (12 wind directions minimum)
– Groups of dose contours generated for each release point (1, 10 and 50% fatality levels from HSE toxicity data)
• 2 weather conditions, 36 wind directions, 6 harm levels (1%, 10% and 50% fatality, indoor and outdoor) = 432 dose contours per release point
An Agency of the Health and Safety Executive
Proposed test case
– Dispersion modelling and dose contours– wind direction and topography effect
An Agency of the Health and Safety Executive
Dispersion modelling and dose contouring
– shallow layer model Twodee-2– area source– example release rate (source term and crater
model to be developed to address this)– 1%, 10% and 50% fatality contours
An Agency of the Health and Safety Executive
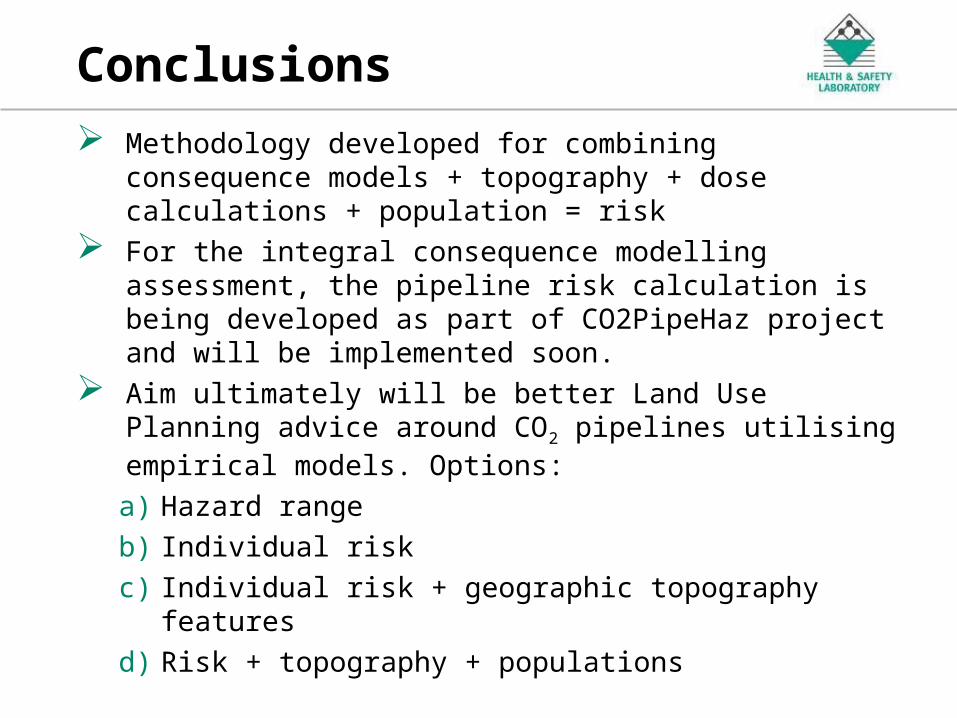
Conclusions
Methodology developed for combining consequence models + topography + dose calculations + population = risk
For the integral consequence modelling assessment, the pipeline risk calculation is being developed as part of CO2PipeHaz project and will be implemented soon.
Aim ultimately will be better Land Use Planning advice around CO2 pipelines utilising empirical models. Options:
a) Hazard range
b) Individual risk
c) Individual risk + geographic topography features
d) Risk + topography + populations
An Agency of the Health and Safety Executive
Acknowledgements
Colleagues in HSL: Simon Gant Ju Lynne Saw Mike Wardman Alison McGillivray
Partners in the CO2PipeHaz project