Embed Size (px)
Citation preview

AN ALTERNATE CONCENTRATION LIMIT PROPOSAL
FOR THE GROUND WATER RESOURCES
AT THE
BEAR CREEK URANIUM MILL
Bear Creek Uranium ACL 2011
Table of Contents
Executive Summary
1.0 Background Information/Chronological sequence of events
2.0 Model Review Summary/In-house Data Review
3.0 Hazard Evaluation.
4.0 Proposed Action
References
Appendix: Risk Assessment
2Bear Creek Uranium ACL 2011

Executive Summary
This application for alternate concentration limits (ACL) is being submitted inresponse to the Nuclear Regulatory Commission's (NRC) letter to AnadarkoPetroleum Corporation (APC) dated November 30, 2010 requesting that a new risk-based ACL application be submitted incorporating the ground water data collectedover the 13 years since the original ACL application.
APC embarked on parallel paths to study and evaluate the discrepancy between thepredicted concentrations of uranium at MW-14 and the observed results.
First, TetraTech GEO the consulting firm that had done the ground water modelingfor the 1997 ACL application was retained to re-evaluate the previous model resultsutilizing the ground water monitoring data collected during the past 13 years. There-evaluation of the transport model is attached under separate cover.
Secondly, an in-house review of the corrective action program, ground watermonitoring data, well completion data and operating conditions observed at the BearCreek Uranium Company (BCUC) site was conducted by APC personnel.
It is APCs consensus that the anomaly noted in NRCs review and subsequent letteris a singular event created by the early time-frame seepage under the tailings dam,subsequent ponding of low pH water behind the catchment basin dam located about600 feet below the tailings dam and use of recovery wells located downstream of thetailings area in Lang Draw. By extending the POE for each drainage plume to theproperty boundary located just north of wells MW-109 and MW-lll and utilizingcurrently measured water quality data at those points for estimating peakconcentrations of contaminates, it would not require a change to the ACLs, whichhave never been exceeded, nor would this increase risk to the general public.
Bear Creek Uranium ACL 2011
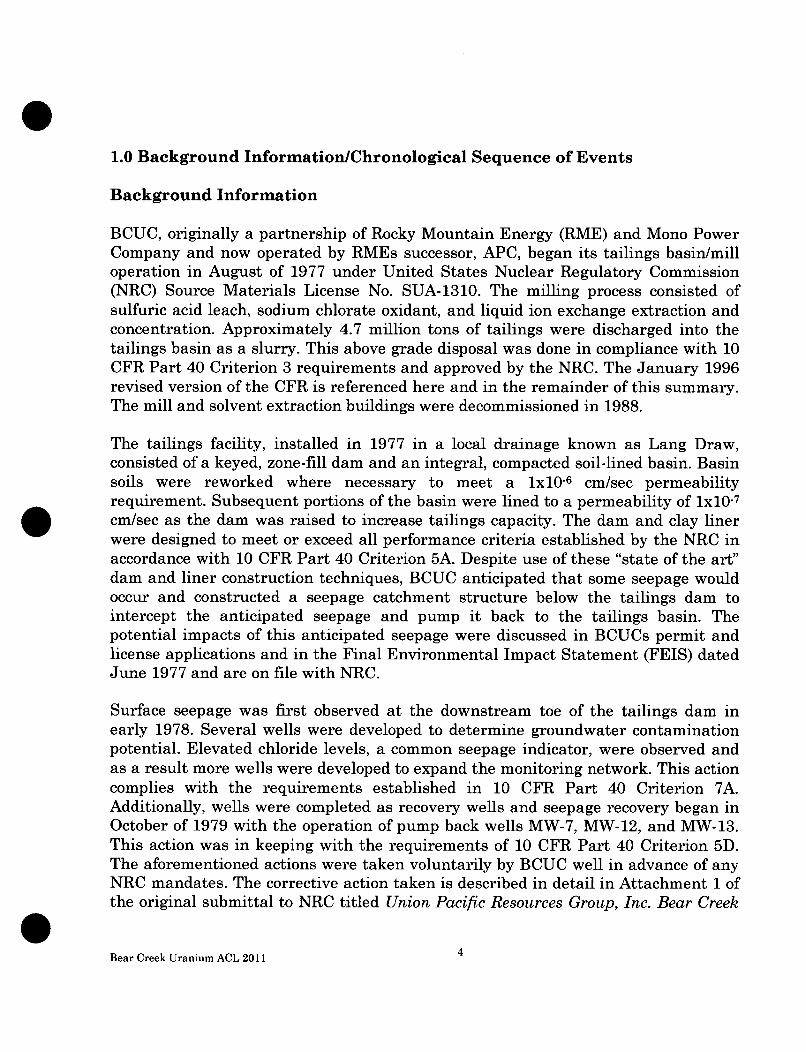
1.0 Background Information/Chronological Sequence of Events
Background Information
BCUC, originally a partnership of Rocky Mountain Energy (RME) and Mono PowerCompany and now operated by RMEs successor, APC, began its tailings basin/milloperation in August of 1977 under United States Nuclear Regulatory Commission(NRC) Source Materials License No. SUA-1310. The milling process consisted ofsulfuric acid leach, sodium chlorate oxidant, and liquid ion exchange extraction andconcentration. Approximately 4.7 million tons of tailings were discharged into thetailings basin as a slurry. This above grade disposal was done in compliance with 10CFR Part 40 Criterion 3 requirements and approved by the NRC. The January 1996revised version of the CFR is referenced here and in the remainder of this summary.The mill and solvent extraction buildings were decommissioned in 1988.
The tailings facility, installed in 1977 in a local drainage known as Lang Draw,consisted of a keyed, zone-fill dam and an integral, compacted soil-lined basin. Basinsoils were reworked where necessary to meet a lxl0-6 cm/sec permeabilityrequirement. Subsequent portions of the basin were lined to a permeability of lx10-7
cm/sec as the dam was raised to increase tailings capacity. The dam and clay linerwere designed to meet or exceed all performance criteria established by the NRC inaccordance with 10 CFR Part 40 Criterion 5A. Despite use of these "state of the art"dam and liner construction techniques, BCUC anticipated that some seepage wouldoccur and constructed a seepage catchment structure below the tailings dam tointercept the anticipated seepage and pump it back to the tailings basin. Thepotential impacts of this anticipated seepage were discussed in BCUCs permit andlicense applications and in the Final Environmental Impact Statement (FEIS) datedJune 1977 and are on file with NRC.
Surface seepage was first observed at the downstream toe of the tailings dam inearly 1978. Several wells were developed to determine groundwater contaminationpotential. Elevated chloride levels, a common seepage indicator, were observed andas a result more wells were developed to expand the monitoring network. This actioncomplies with the requirements established in 10 CFR Part 40 Criterion 7A.Additionally, wells were completed as recovery wells and seepage recovery began inOctober of 1979 with the operation of pump back wells MW-7, MW-12, and MW-13.This action was in keeping with the requirements of 10 CFR Part 40 Criterion 5D.The aforementioned actions were taken voluntarily by BCUC well in advance of anyNRC mandates. The corrective action taken is described in detail in Attachment 1 ofthe original submittal to NRC titled Union Pacific Resources Group, Inc. Bear Creek
Bear Creek Uranium ACL 2011

Uranium Company Alternate Concentration Limit (ACL) Application dated February28, 1997
On May 7, 1985 the NRC issued License Amendment No. 6 requiring theimplementation of a groundwater detection monitoring program with MW-12 as thepoint of compliance (POC) well and MW-9 as the background well. This was incompliance with the requirements of 10 CFR Part 40 Criterion 7A. Indicatorparameters were designated as Arsenic, Selenium and pH. It was not until 1985 thatthe NRC formally shifted its attention to the "first underlying aquifer" or N-sandformation. Wells MW-12 and MW-9 are both alluvial N-sand wells. It should benoted that pre-milling groundwater data was focused on the ore sand.
Threshold values were established at 0.005 mg/L and 0.001 mg/L for As and Serespectively. A threshold value of 6.8 s.u. was picked for pH. These values weredesignated in License Condition 47E issued in Amendment No. 15 September 10,1987.
The NRC was notified on October 19, 1987 that pH and selenium threshold valueshad been exceeded at MW-12 and in 1989 a corrective action plan (CAP) andmonitoring program were submitted by BCUC and approved by the NRC. This actionwas required by 10 CFR Part40 Criterion 7A.
Groundwater protection standards were established by the NRC, in accordance with10 CFR Part 40 Criterion 5D and 13, and implemented by Amendment No. 10,issued on September 12 1990, to BCUCs Source Materials License SUA-1310.
MW-74 was designated, by the NRC, as the POC well in the direction of the northernflow path in January of 1992. This is in compliance with 10 CFR Part 40 Criterion7A.
In February of 1992, the NRC approved the BCUC tailings reclamation plan. Thisfollows 10 CFR part 40 Criterion 6 requirements.
An application for alternate concentration limits (ACLs) was submitted on February28, 1997 in accordance with 10 CFR Part 40, Appendix A, Criterion 5B(5), whichstates that at the point of compliance, the concentration of a hazardous constituentmust not exceed the NRC approved background concentration, the Table 5C value oran alternate concentration limit established by the NRC. At that time, allconcentrations of hazardous constituents, with the exception of uranium, met thelicense established background values as measured at the point of compliancelocations. However, modeling data, included in Attachment 2 of the 1997 ACL
5Bear Creek Uranium ACL 2011

application, suggested that the low pH plume would eventually reach the POCsbefore it was completely neutralized and would result in elevated levels of U-nat, Ra-226 and nickel.
A corrective action program (CAP), found in Attachment 1 of the 1997 ACLapplication, was implemented in response to elevated levels of hazardousconstituents found to exist at the NRC approved background location. The up-gradient edge of the tailings impoundment coincides with the near surfaceformations which could encounter tailings seepage, locally known as the alluviumand the N-sand. Due to this, the NRC selected well MW-9, which resides in a down-gradient setting, as a representative background location. Background values ofrepresentative hazardous constituents were derived from this well during a timethat the pH was neutral and total dissolved solids concentrations were low.
The CAP was operational for over ten years. During that time, the programrecovered 301,000,000 gallons of seepage waters, containing 6.5 tons of heavy metalsas well as 9,993 tons of sulfate and chloride. These waters plus an additional165,000,000 gallons of tailings solution were lost to the atmosphere, by way of anenhanced evaporation system. In total, the system was responsible for the treatmentand evaporation loss of 466,000,000 gallons of tailings solution. These effortsresulted in dewatering of the tailings and adjoining formations, to levels consistentwith the pre-milling groundwater gradient. Based upon the ground-water qualitymeasured at that time, the resulting water levels, and the mass of constituents thatwere recovered, it was concluded that concentrations of hazardous constituents were"as low as reasonably achievable" (ALARA), considering the practicable correctiveactions. The ALARA evaluation is found in Attachment 3 of the 1997 ACLapplication. The CAP was discontinued in 1996 in accordance with NRC LicenseAmendment No. 39 in order to facilitate final reclamation of the tailings area.Monitoring of the remaining wells was conducted annually from that time on.
Although the corrective action program was successful in removing hazardousconstituents and re-establishing the pre-milling water levels, predictive modelingsuggested that within 40 to 60 years following termination of the CAP, the values ofnickel, radium 226+228 (radium), and uranium would eventually increase to levelsthat would be in excess of the background concentrations at the POC locations. Themodifications in water quality would accompany a slowly advancing acid front thatwould pass the POC and reach the point of exposure (POE) over the next 80 to 400years. The rate at which the water quality would be modified would be dependentupon the individual constituent and the preferential flow path that is selected. Theground water modeling summary referenced in this paragraph is included inAttachment 2 of the 1997 ACL application.
6Bear Creek Uranium ACL 2011

It was also determined that additional corrective actions would have little or noeffect on the eventual movement of the acid front. The CAP was successful indecreasing the areal extent of the seepage plume to within the tailings impoundmentarea. The CAP also reduced the saturated thickness of the alluvium, the N-sand, andthe tailings making the recovery of additional acidic solutions technicallychallenging and expensive. Consequently ACLs that are protective of human healthand the environment were proposed for nickel, radium, and uranium.
To determine the potential for hazardous constituent transport the seepage recoverywells were temporarily shut down from September 1994 to January of 1995. Theground-water level response was monitored and used as the basis for a transportassessment. Additionally, geochemical data were collected by coring the alluviumand the N-sand which are the formations that have encountered tailings seepage.These cores were analyzed for their attenuation capacity. Following the developmentof these data, the amount of alluvium and N-sand attenuation capacity weresimulated to encounter the remaining acidic seepage from the tailings andunderlying formation. The simulation indicated that the acid front would carrynickel, radium, and uranium beyond the POCs. Significant attenuation would occurbetween the POCs and the points of potential exposure (POEs). It was predicted thatthe attenuation would be sufficient to reduce the concentrations of nickel, radium,and uranium to levels that would be protective human health and the environment.
Predictive modeling indicated that the maximum concentration of nickel, radium,and uranium, at the POC locations, would be 3.8 mg/i, 46 pCi/l, and 2038 pCi/1,respectively through the flow paths. Similarly, maximum concentrations of nickel,radium, and uranium at the POEs, would be 0.055 mg/1, 13 pCi/1, and 45 pCi/1respectively. Background concentrations for these constituents, defined at MW-9,were 0.05 mg/1 Ni, 9.7 pCi/1 Ra-226, and 98.7 pCi/1 U-nat. It should be noted that theACLs at the POCs have not been exceeded to date.
The modeling predicted times to reach peak concentrations at the POC locationswould range from 40 to 60 years following termination the CAP. Attenuation beyondthese locations would slow the movement of constituents. Consequently, followingtermination of the CAP, peak concentrations at the POE locations would be seenfrom 260 to 400 years for nickel, 80 to 100 years for radium, and 80 to 130 years foruranium, dependent upon which of the two preferential flow paths was selected. Thepredictive modeling was terminated following the 400 year point. This period of timewas sufficient to simulate the arrival of the peak concentrations of nickel, radium,and uranium. Radium and uranium arrive and decline to background concentrationsprior to the arrival of the nickel plume.
Bear Creek Uranium ACL 2011

To determine the risk associated with water use having these concentrations ofhazardous constituents potential use locations were defined and the POEs weredetermined. The POE was the down-gradient edge of the land mass that contains thereclaimed tailings as well as the area that contains the buried mill debris.Consequently, it represented the minimal land area necessary to assure long-termcontrol of the reclaimed by product materials. This land mass generally coincidedwith the original restricted area boundary, does not utilize the "distant POE"concept, and is the area that was determined to accompany an amendmentapplication for a general license. Two POE locations, MW-14 and MW-74, weredefined for the Bear Creek site. The POE locations are within the Northern andLang Draw flow paths. The Union Pacific Resources(UPR) Group Bear CreekUranium Company Amendment request(AR 1996) to SUA-1310; Docket No. 40-8452,submitted to NRC May 30, 1996, requested that the POEs be located at the furthestpoint of the property owned by UPR, now Anadarko. The NRC, did not approve thatrequest due to trying to keep the land transfer required by UMTRCA to a small area.The land transfer to the Department of Energy (DOE) ultimately became muchlarger, for DOEs ease of land management, and now includes the POEs currentlybeing requested. The 1996 document also contains a map of the proposed locations ofthe POEs, a model summary of hydrogeologic and chemical transport analysis whichwas conducted by GeoTrans in March of 1995, and maps showing the environmentalsample locations and tailings area well locations.
There are no records of past water use associated with the alluvium and the N-sand,which are the formations encountering tailings seepage at the Bear Creek site. Thisis due to there being little water in these formations prior to the milling operation aswell as the limited extent of these formations. Similarly, there is no present orpredicted future use of the limited amount of water that now resides in theseformations. Groundwater development in the region has been limited to stockwatering by windmills. These wells are developed to depths of 400 to 500 feet whichhave a more reliable source of water with better well yield and water quality.
An exposure assessment indicated that there was no present or predicted futurewater use associated with the formations that have encountered tailings seepage.Similarly, the water residing in the alluvium and the N-sand is not hydraulicallyconnected to any surface water resource. This is due to the limited extent of thealluvium and the N-sand as well as the lack of surface water resources in the area ofthe mill.
It is questionable if the alluvium can be considered an aquifer because of low wellyield. However, for the purpose of compliance with EPA guidelines for ACL
Bear Creek Uranium ACL 2011 8
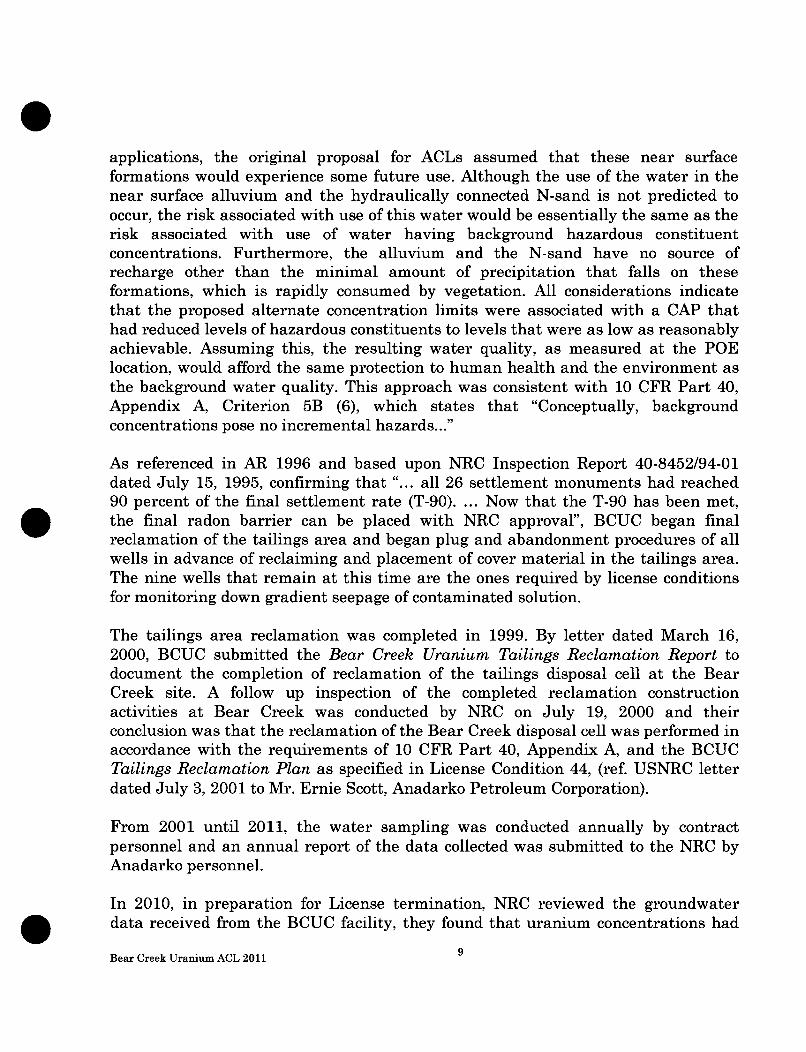
applications, the original proposal for ACLs assumed that these near surfaceformations would experience some future use. Although the use of the water in thenear surface alluvium and the hydraulically connected N-sand is not predicted tooccur, the risk associated with use of this water would be essentially the same as therisk associated with use of water having background hazardous constituentconcentrations. Furthermore, the alluvium and the N-sand have no source ofrecharge other than the minimal amount of precipitation that falls on theseformations, which is rapidly consumed by vegetation. All considerations indicatethat the proposed alternate concentration limits were associated with a CAP thathad reduced levels of hazardous constituents to levels that were as low as reasonablyachievable. Assuming this, the resulting water quality, as measured at the POElocation, would afford the same protection to human health and the environment asthe background water quality. This approach was consistent with 10 CFR Part 40,Appendix A, Criterion 5B (6), which states that "Conceptually, backgroundconcentrations pose no incremental hazards..."
As referenced in AR 1996 and based upon NRC Inspection Report 40-8452/94-01dated July 15, 1995, confirming that "... all 26 settlement monuments had reached90 percent of the final settlement rate (T-90). ... Now that the T-90 has been met,the final radon barrier can be placed with NRC approval", BCUC began finalreclamation of the tailings area and began plug and abandonment procedures of allwells in advance of reclaiming and placement of cover material in the tailings area.The nine wells that remain at this time are the ones required by license conditionsfor monitoring down gradient seepage of contaminated solution.
The tailings area reclamation was completed in 1999. By letter dated March 16,2000, BCUC submitted the Bear Creek Uranium Tailings Reclamation Report todocument the completion of reclamation of the tailings disposal cell at the BearCreek site. A follow up inspection of the completed reclamation constructionactivities at Bear Creek was conducted by NRC on July 19, 2000 and theirconclusion was that the reclamation of the Bear Creek disposal cell was performed inaccordance with the requirements of 10 CFR Part 40, Appendix A, and the BCUCTailings Reclamation Plan as specified in License Condition 44, (ref. USNRC letterdated July 3, 2001 to Mr. Ernie Scott, Anadarko Petroleum Corporation).
From 2001 until 2011, the water sampling was conducted annually by contractpersonnel and an annual report of the data collected was submitted to the NRC byAnadarko personnel.
In 2010, in preparation for License termination, NRC reviewed the groundwaterdata received from the BCUC facility, they found that uranium concentrations had
Bear Creek Uranium ACL 2011

exceeded the predicted concentration at well MW-14 by more than ten times andrequested that a new risk-based ACL be submitted. Although the value predicted bythe modeling had been exceeded, at no time did the uranium concentrations exceedthe approved ACLs.
TetraTech Geo the consulting firm that had done the ground water modeling for the1997 ACL application was retained to re-evaluate the previous model results basedupon the ground water monitoring data collected during the past 13 years.
In-house evaluation of historical ground water data, operational events, tailings damconstruction, well completion and well log data was conducted to assist in this task.Figure 1 shows the general location of the site boundaries and wells.
FIGURE 1BEAR CREEK URANIUM
[n P1~ "m Id W Lof or" LwW 0100"e OF owb --m F%• PKL Low-w noDiuWt of 6A 0#4% VS.a "W0' *Wr pefs. Nu
E~ tpt of GS N IoJw W 0 .(v'CL LMATW.4, peth MI
Long Draw f-3 Northern
flow POINT OF COMPLIANCEWELLS
n"3n"•"j ] P I"m * MONITOR WELLS
_j_ N-SAND GROUND-WATER PHCONTOUR
COCA=K C& WT. T79M
10Bear Creek Uranium ACL 2011

Chronological Sequence of Events
Although the CAP was not officially implemented until 1989, other tailingsmanagement practices were successful in minimizing the seepage that wasencountered at the seepage collection dam and at the downstream monitor wells.Similarly, tailings management practices implemented prior to the CAP weresuccessful in limiting the amount of tailings seepage. Additional action and changesimplemented during the time frame from 1982 to 2000 that impacted the project arepresented here in chronological order. The impact of these changes can be observedin the attached graphs of static water levels and chemical parameters measured inthe down gradient monitor wells.
1980 & 1984 Two dam raises were completed and the addition of wings to the eastand west portion of the tailings dam allowing increase mill through-put to 2000 tpd.
1985-1989 Utilize monitor/recovery wells in the seepage control basin to pumpaccumulated seepage to the mill and/or tailings pond. The seepage rate measured atthe toe of the dam was 17 gpm in 1985 and decreased to <0.5 gpm in 1988 with nomeasurable seepage in 1989. It should be noted that the recovery well casingslocated in the catchment basin were slotted from top to bottom and at times somewere under seepage water. This had an impact at down gradient monitor wells.
1986 Mill shut down. Recovery wells and enhanced evaporation system operational.
1988 Placement of interim cover to prevent blowing tailings and construction of theNumber 1 clay lined evaporation pond.
1990 Placement of more interim cover to prevent blowing tailings. Construction ofthe Number 2 clay lined evaporation pond. Start construction of the Number 3 claylined evaporation pond.
1991 Complete construction of the Number 3 evaporation pond. Shut down enhancedevaporation system and direct all water from the recovery well system to the claylined ponds. All surface areas were then covered with enough clay to prevent furtherrecycling of tailings solution back into the tails sands and prevent windblowntailings.
1992-1994 Shut off down gradient seepage recovery wells to prevent pullingcontaminated solution away from the tailings pond.
11Bear Creek Uranium ACL 2011

1994 In September of 1994, GeoTrans consultants shut down all recovery wells for102 days to compare model determined final static water level (SWL) recovery levelsagainst measured levels. GeoTrans predicted 12 foot recovery in SWL at MW-12with no potential for mounding when the system was shut down for finalreclamation of the tailings area. (Hydrogeological and Geochemical TransportAnalysis, UPR BCU Mill Tailings Impoundment, GeoTrans, Inc., March 7, 1995).
Measurements of the SWL at MW-12 conducted after reclamation of the tailingsarea actually show a recovery of almost 22 feet as shown in the graph below.
MW-12Bear Creek Uranium
5090.00
5085.00
5080.00
5065.00
u.. 5060.00
5055.00
5050.00 1 "1 1 . . i .s i ........ N ......... . . ., , U 11.ri ..
Year
U SWL
1996 The recovery well system was shut down for final reclamation of the tailingsarea. (License Amendment Request dated May 30, 1996, NRC License AmendmentNo. 39)
1997-1999 Plugged and abandoned all wells not necessary for monitoring of theBCUC mill tailings area site and mining areas. (License Amendment Request datedMay 30, 1996; License Amendment No. 45 1996; Report to the Wyoming StateEngineer's Office 1999)
12Bear Creek Uranium ACL 2011

1997-1999 Placement of over one million tons of cover material in the tailings areabetween the ridge line and the tailings dam. This material was placed after themodeling was completed and report submitted with the 1997 ACL application.
2000-2011 Annual water sampling conducted in compliance with Source MaterialsLicense SUA-1310 Condition 47, annual survey of land use within two kilometers ofthe site and reporting as required by License Condition 21, Department of Energy(DOE) site visits and collection of water samples, additional engineering surveysrequired by DOE for site access, weed control as required.
2.0 Model Review Summary/In-House Data Review
Model Review Summary
In compliance with NRCs requests that a new risk-based ACL application besubmitted incorporating the ground water data collected over the 13 years since theoriginal ACL application, Anadarko contracted with TetraTech GEO (formerlyGeoTrans) to complete a new predictive transport model. The transport model isattached under separate cover. The new model has two significant advantages overthe 1995 model. First, data are available regarding the transport of uranium andother constituents along Lang Draw and the Northern Pathway for use in calibrationof the model. The 1995 model was performed in a predictive mode, withoutinformation on transport rates at the site. Second, modeling technology hasimproved allowing direct incorporation of the chemical reactions into the transportmodel. Separate models were constructed for Lang Draw and for the NorthernPathway.
As noted by NRC, the 1995 model under predicted the U concentrations that wouldreach MW-14. The 1995 model in BIOID used the observed concentrations as themodeling initial conditions down-gradient from the low pH part of the plume. For theupstream boundary condition, the model used the observed uranium concentrationat the downstream edge of the pH front, 92 pCi/L. The assumption that was madewas that this concentration was a good estimate of future uranium concentrations.As observed in Figure 10B of the attached 2011 model, MW-12 had a uraniumconcentration of approximately 110 pCi/L in 1994, while MW-9 had a concentrationof around 80 pCi/L. Because the modeling was only addressing transport downgradient of the pH front, these values appeared to be reasonable, based on themeasurements at that time.
13Bear Creek Uranium ACL 2011
What the modelers did not consider was the effect of dilution during the recoverypumping on the observed concentrations. The recovery pumping was causing steepergradients west of Lang Draw than present after the pumping was stopped. Thesteeper gradients produced more water moving into the Lang Draw area than wouldoccur after pumping stopped and water levels recovered. When pumping stopped, thedilution provided by this lateral inflow decreased. This water probably assisted inthe neutralization of the acidic plume. The net result was that after water levelsrecovered, the uranium concentrations increased. Because the 1995 model used anup-gradient boundary condition that was based on concentrations that were"artificially" low because of the recovery well pumping. It is the ,modeler's contentionthat this underestimated the peak concentrations that were to develop.
In-House Data Review
The early time-frame seepage from the tailings dam is estimated to have been amajor factor that would have influenced the higher than expected uranium valuespredicted at MW-14 in the first model. A drawing of the tailings dam cross sectionshowing dam raises, drain blanket, and core trench is shown as Figure 2. Figure 3shows a general cross section of the tailings area.
14Bear Creek Uranium ACL 2011

01
5200
SI1nn
5200
5100
-400-300-200-100 0 10 200 300 400 500 600 700 800 900 1000 1100 1200 1300 1400 1500 700 1900 2000 2100 2200 2300 2400 2500
TRUE SCALE CROSS SECTION OF TAILINGS DISPOSAL AREAAT B-B'
-500 -400 -300 -200 -100 0 100 200 300 400 500 600 700 800 900 1000 1100 1200 1300 1400 1500 1600 1700 1800 1900 2000 2100 2200 2300 2400 2500
U P R S14..l•FA : ! 1 . ... . . . ./. . . ... T.......m L _L __
5190 -- --- --- F1
5180 ---- ---- -------- -- -------- +---- ------- --- ---- F----- ---- I F---- I--- ---- ---- I--[ -1___I F I .. g..opdo , *I
-lo wlk F HWLocalFPMF ,wI Ofl@o .. F-- Tol F5170 ----- - ------- "-------- 45170
5140------------------------o ....it.- O-. DQ- ---------- .....---....---------- . .5140
Rq ri ~logtin q,++ +1 oT ri• r.; i F F F F F F" F
5160 56
F" • -r, -,,-F iF F roF F Fil F F I
05+C-0071, , , , . . . .
510 I + ---- - + ........ I F ,+A1 I I - -- I- 5120
51F0 ------------------- -. i . t " I ,
FAI I I , Ii, I F F F F F F F F
5100 t I'l 4,11) I'L ,j - 1 5100• + ,, ,
100 200 300 400 500 600 700 800 900 1000 1100 1200 1300 1400 1500 1600 1700 1800 1900 2000 2100 2200 2300 2400 2500
EXISTING DRAIN BLANKETEXISTING DAM------
CROSS SECTION OF TAILINGS DISPOSAL AREA AT B-B'
VERTICAL EXAGGERATION 10:1All measurements in feet NOTE: Croase s 8-ton8-B' osm chornel o•fon at Sto 66+48.52Alm uNomnh Fork owoe at Sto 25+10.52, tailngs South Fork swal.
atto" 124430.79
ft" I In" bIE E E AANADARKO PETROLEUM CORP.
F ig rBEAR CREEK URANIUMF ig u re 2TNUN;S OtSPOSAL AREA
""ffi CROSS SECTION OF TAIUNGS

A A I
5200
5180
5160
5140
5120
5100
5080
5060
5040
0 400 800 (f.et)
V.dt .o Exagger7tionxioDFir 3 Nions Lfr 1
Figure 3 . N Sand/alluvium potentiometric-surface elevations for 1986, 1990, and 1995 along geologic section A-A'.
16Bear Creek Uranium ACL 2011

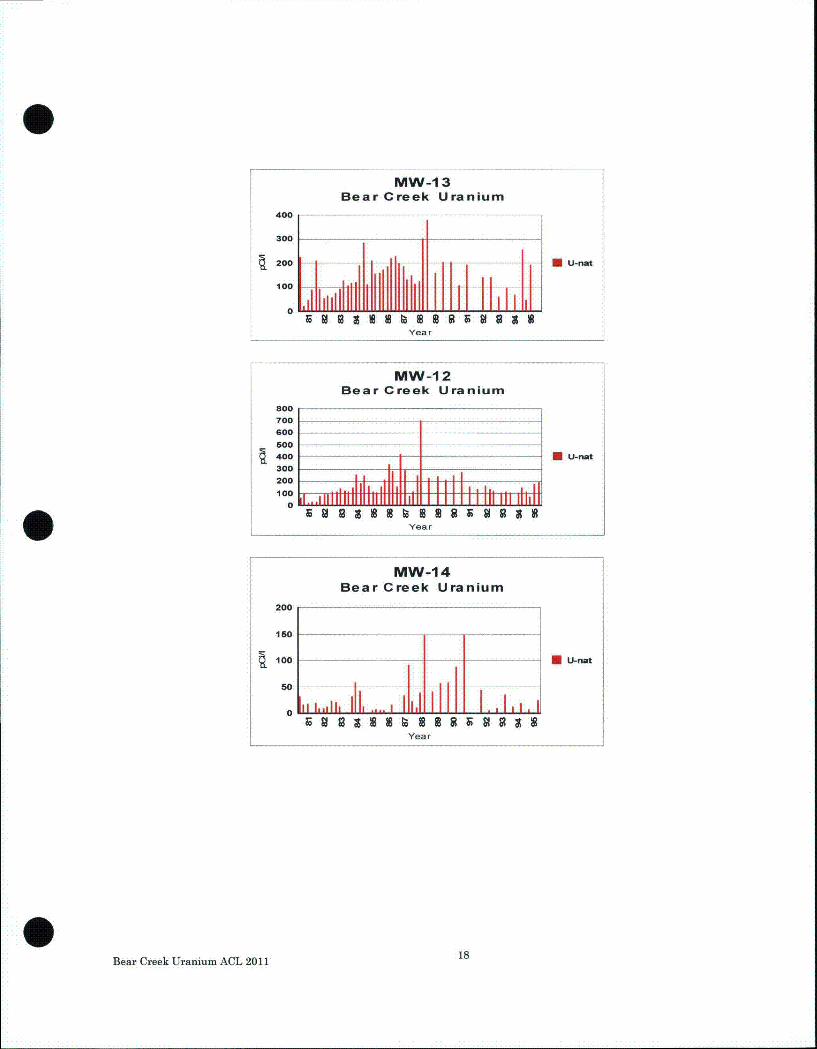
As referenced in the Background Information, seepage was first noticed at the toe ofthe dam in 1978. Three wells were drilled to monitor groundwater down gradientfrom the tailings dam. The wells were designated MW-7(completed Oct. 1980), MW-12 (completed Feb. 1981) and MW-13 (completed Feb 1981). The wells were alsoused as recovery/pump-back wells, with MW-12 only used for a short period of time.MW-7 and MW-12 were located down gradient from the catchment basin (a map ofthe N-sand well locations is provided for reference at the end of this section). MW-12 was to later become the point of compliance well. Several wells were drilled andcased in the catchment basin to be used for monitoring and/or recovery wells. Thewell casings were perforated from top to bottom. As the rate of seepage increased,MW-37 (completed Oct. 1981), which was located in the low spot in the catchmentbasin near the catchment basin dam, became the major recovery well along withMW-7, MW-13, MW-38, MW-39 and MW-22 located in the Lang Draw flow path.Low pH solution recovered from these wells was pumped to a sump and from therepumped back to the tailings basin. During the time frame of 1978 through 1985 theamount of seepage recovered in the catchment basin and pumped back to thetailings pond was estimated to be 75 million gallons. In 1984 a weir was installednear the toe of the tailings dam and used to more accurately measure seepage flow.Measured flows were 17 and 14 gallons per minute during 1985 and 1986respectively. During the early use of the pump-back system in the catchment basinimproper operation combined with periodic power failures of the system wouldtemporarily allow ponding of seepage water in the catchment basin. The wells withperforated casing from top to bottom became conduits for the low pH solution toenter the groundwater. The only thing that held this solution in check, i.e. from notreporting to down gradient monitor wells, was the continued use of the recoverywell system combined with the drawdown impact from tailings basin recovery wells.The catchment basin recovery wells were pumped until 1994. When the tailingsdewatering system was shut down in 1996, the overall hydraulic gradient in thetailings basin increased and the solution previously held in check in the catchmentbasin was then free to migrate down gradient. (see MW-13, MW-12 and MW-14 U-nat graphs note peak concentration difference and the well locations on the N-sandwell location map and Figure 3)
Bear Creek Uranium ACL 2011 17

THIS PAGE IS ANOVERSIZED DRAWING OR
FIGURE,THAT CAN BE VIEWED AT THE
RECORD TITLED:DRAWING NO.:
N-Sand-W-ph-conts.dwg,"BEAR CREEK URANIUM
TAILINGS DISPOSAL BASINN-SAND
WELL LOCATIONSWITH Ph CONTOURS"
WITHIN THIS PACKAGE... OR,BY SEARCHING USING THE
DOCUMENT/REPORTDRAWING NO.
N-Sand-W-ph-conts.dwg
D-01
MW-1 3Bear Creek Uranium
400
300
200
100
0
Yea r
•U-not
MW-12Bear Creek Uranium
800
700
600
500400
300
200
100
0
II400IUU-na
....lli.lh Il l lE ... ,I0 U-nat
m .,
iwYea r
MW-14Bear Creek Uranium
200
150
100
50
0
1 U-nat
Year
18Bear Creek Uranium ACL 2011

Uranium measured at MW-14 shows similar peaks with high concentrations overthree times higher than the 45 pCi/l predicted level at the Lang Draw POE in the1997 ACL model.
Use of these recovery wells in the catchment basin would also explain theartificially reduced water levels measured in the catchment basin monitor wellsduring operation of the mill until 1994 when the catchment basin recovery wellswere temporarily shut down(i.e. the predicted water level recovery at MW-12 was12 feet after recovery wells were shut off). In 1996 the tailings basin recovery wellswere shut down and the water levels in the catchment basin monitor wellsrecovered to higher levels than what were seen in these wells during operation ofthe mill at peak levels.
MW-12Bear Creek Uranium
5090.005085.00
5080.00
5075.00 'A
5070.00 M --111
5 065.005060.005055.005050.00
50 A0 '
Year
Another event that was not considered in the model was the impact of fresh waterdilution on the low pH solution located beneath the tailings in the N-sand. Theneutralization impact could have been under estimated. Draw down data fromwells MW-61 and MW-64 located 1000 to 1200 feet west of the tailings recoverywells and MW-31 located -1000 feet east of the tailings recovery wells indicate acone of depression a half mile in diameter lateral to the tailings basin.
Bear Creek Uranium ACL 2011 1_9

MW-61 & MW-64 SWLsBear Creek Uranium
E
U.
5150514551405135
5130 MW
51255120 ..4...
0 MVV-61
-0- MW-64
YEAR
MW-31 SWLBear Creek Uranium
5140
5120S"--'-- MW-31
05100
Y. 508o
Year
These three wells had good well yields >5 gallons per minute, 7.0-7.2 pH, -1000 mg/lTDS, -500 mg/I S04, -15 mg/I Cl, 25 pCi/l U-nat. It should be noted that even thesewells would not meet Wyoming Class 1 or 2 water standards because of TDS andSulfate levels. The estimated gradient, using wells MW-61 to MW-86, was 0.017 ft/ftfrom southwest to northeast. This is about a 20% increase in gradient compared withthe MW-36a to MW-86 south to north gradient of 0.014 ft/ft used in both models.Conservative estimates, or not including the impact from the recovery wells,enhanced evaporation, clay cover over exposed tailings, clay lined evaporation ponds(preventing recirculation of recovered solution)and potential for dilution may haveoverestimated the remaining volume of <5 pH solution in the tailings area.
The static water level graphs show the extent of the actual down gradient drawdownin these wells.
20Bear Creek Uranium ACL 2011

MW-12Bear Creek Uranium
5090.00
5080.00
5080.00
5075.00
5070.00
5065.00
5055.00
5050.00
Year
FOwL
MW-9
Bear Craak Uranium
509000
5085.00
5080.00
5075.00
E 507000
5065.005060 00
5055.00
5050.00
Year
MW-14Bear Creek Uranium
5090.00
5085.00
5080.00
5075.00
E 5070.00 *S506500
5060,00
5055.00
5050.00
Year
MW-74
Bear Creek Uranium
511000
5100.00 A
S5090.00
5080.00
Year
MW-43
Bear Creek Uranium
511D
0105
5100
15095
5085S5000
5075
5070
Year
Figure 4 was constructed to see if solution contained in the slimes at the bottom ofthe tailings sand would follow the declining level of solution in the N-sand or staybound in the slimes as predicted, i.e. pumping in the slimes area was estimated bybench testing, to get to a point of diminishing returns (about 30% saturation) andwould not readily seep out or be pumped out of the tailings sand. Static water levelsmeasured across the tailings basin (see Figure 4) shows visible separation betweenthe bottom of the saturated zone of the tailings sand and top of the saturated zone ofthe N-sand. A pH of greater than 6.2 was measured at MW-107 in 1994 (Attachment1, Section 2.a operational year 1994 of UPR Group, Inc. Alternate ConcentrationLimit Application Feb 28, 1997) indicating that substantial neutralization was
21Bear Creek Uranium ACL 2011

taking place in the N-sand beneath the low pH solution in the tails sand. MW-107was completed in the N-sand about midway between TS-2 and TS-4 (see Figure 4)and directly in line with flow to the toe of the dam and down Lang Draw. MW-85,also an N-sand well, had a pH of 7. Two other wells, MW-106 and MW-105, werecompleted in 1994 and were used as N-sand recovery wells as their pH values were5.6. They were located near the north east section of the dam. Comparing this graphto the attached N-sand Well Location map gives a better perspective to what washappening beneath the saturated zone of the tailings sand. Figure 2 is a crosssection looking from north to south through the dam and includes the approximatelocation of the cut off trench superimposed. The cutoff trench keeps water containedin the west part of the basin as it (the cutoff trench) was completed about 5 feet intothe claystone located below the N-sand. This helped create a somewhat confinedlarge source of 7 pH solution that was drawn toward the cone of depression createdby the N-sand recovery wells in the tailings basin. Using the N-sand well locationmap and Figure 3 puts Figure 4 in three dimensional perspective. The mainobjective of Figure 4 is to show the hydraulic gradient from southwest to northeastand point out the failure of the cut off trench in the northeast section to get belowthe N-sand into the claystone. It also shows the potential for overestimating thevolumes of low pH solution used in the original 1997 ACL Application model (see1997 ACL App., Attachment 2, Figure. 3-1)
22Bear Creek Uranium ACL 2011

Figure 4
EiW CROSS SECTION THROUGH DAM/TAILINGS
5170 OBSERVED STATIC WATER LEVELS FEBRUARY 1995
MW-78 MW-10 TS-2 MW-85 MW-69
1 UNIT - 5FT VERTICAL & 5OFT HORIZONTAL [ SATURATED TAILS SAND
Figure 4 shows where low pH solution was able to seep through and can be seen inwell MW-77 (see the N-sand Well Location map in map pocket). When the staticwater level in the N-sand goes below -5085 feet, which was defined as the bottom ofthe N-sand in the northeast corner of the tailings dam, the seepage to the Northernflow path may subside.
The highest potential for seepage from the tailings to the N-sand was estimated tobe in the up-gradient, southern, extent of the tailings impoundment where the sandbegins to outcrop. The area was graded and lined with clay prior to the dam raise in1980. By 1996, the low pH solution was located well within the confines of thetailings dam.
In 1991 all of the recovered low pH solution was pumped to clay lined ponds and allof the tails sands were covered with clay material so there was no potential forrecirculation of low pH solution back to the tailings sand during the last 5 years of
23Bear Creek Uranium ACL 2011

dewatering of the tailings and N-sand. An estimated 100 million gallons of low pHsolution was recovered and evaporated during that time frame.
The table below contains the background concentrations, and predictedbreakthrough maximum concentrations (PBMC) for uranium, radium, and nickel asshown in Figures 18A., 18E.,18F., 21A.,21E.,and 21F of the 2011 model for the LangDraw flow path and the Northern flow path Also included in the table are the resultspredicted in the 1997 ACL model.
Hazardous Lang Draw Lang Draw Northern Northern Backgroundconstituent PBMC year of flow path flow path concentrations
PBMC PBMC year of PBMCUranium *460 pCi/l 2015 75 pCi/l 2032 98.7 pCi/I2011 modelRadium 2.1 pCi/1 2015 5.8 pCi/1 2040 9.7 pCi/I2011 modelNickel 0.032 mg/l 2015 0.034 mg/l 2039 0.05 mg/I2011 modelUranium 45 pCi/1 2075 45 pCi/1 2125 98.7 pCi/l1997 ACL modelRadium 13 pCi/1 2075 10 pCi/l 2095 9.7 pCi/l1997 ACL modelNickel 0.053 mg/1 2255 0.055 mg/I 2395 0.05 mg/I1997 ACL model
* 2011 model for uranium in Lang Draw does not match any measured data for MW-109, MW-108 or
MW-9 (see Figure 18A. Predicted Breakthrough of Uranium Lang Draw, Re-Evaluation of MetalsTransport At Bear Creek Uranium October 2011)
The 2011 model predicted levels of radium and nickel are less than background inboth flow paths and compare well with predicted levels of radium and nickel in the1997 ACL model. The 2011 model predicted uranium in the Northern flow path to beabout 67% higher, still less than background concentrations, than the predictedlevels in the 1997 model; however, uranium in the 2011 model for the Lang Drawflow path POE is predicted to be almost 11 times higher, in year -2015, than whatwas predicted in the 1997 ACL model. The uranium value measured at MW-109 in2011 was 60 pCi/1 compared to the 2011 model predicted value of -325 pCi/1. MW-108 and MW-9 show comparable results, 3 to 12 times higher respectively, inpredicted versus measured results for uranium.
For a uranium risk assessment calculation at the Lang Draw POE the average valueunder the curve (see Figure 18A of the 2011 model) of 166 pCi/1 for uranium,converted to U238, at MW-109 was used. The calculated risk was 3.8E-4 for achronic exposure over a 75 year time frame versus 2.3E-4 for the background
24Bear Creek Uranium ACL 2011

concentration. The combined (U238+D and Ra-226+D) radiological cancer risk forthe POE on Lang Draw is 4.2E-4 while the combined risk for the same backgroundparameters is 4.3E-4. All parameters, other than uranium at the Lang Draw POE,for both flow paths were predicted to be less than background in the 2011 model atthe extended POEs.
Water sampling in both monitor wells MW-108 and MW-109 takes three days toobtain a sample after two casing volumes have been pumped. Measured static waterlevels prior to pumping took at least 24 hours to recover before another casingvolume could be pumped. The 5 inch well bore holds 1 gallon per foot and staticwater levels indicated 13 to 15 gallons of water in the wells. The estimated wellyields on wells MW-108 and MW-109 are <0.01 gallons per minute.
3.0 Hazard Evaluation
The physical setting of the former mill site and the reclaimed tailings is located in aremote semi-arid section of central Wyoming. Annual precipitation measured overtwenty years on site averaged 10 inches. The land use is limited to open range usedfor grazing cattle and sheep. The ranches that encompass the Bear Creek project areeach generally thousands of acres or more in size and have been in existence foralmost a hundred years. They are now in their third and fourth generation of familyoperation with no change in the land use scenario. The nearest ranch headquartersis located 4 miles from the project. When homesteads were claimed, the ranch housewas normally built close to an artesian spring with good water quality as most"streams," i.e., forks of Bear Creek and the Dry Fork of the Cheyenne River, in theregion are intermittent. The towns and cities throughout Wyoming are typicallyfound along the major water ways which are located nearly 50 miles away from theBear Creek site in any direction.
The ranchers are adamantly opposed to man camps and people living on site withintheir property boundaries. There is no reason to believe that the land use willchange.
The first shallow potential aquifer within 40 feet of the original ground surfacebelow the tailings impoundment has been referred to as the N-sand. The low pHtailings solution that has seeped into this formation travels in a north to northeastdirection. There is no history of this upper zone of the Wasatch formation being usedfor a domestic or livestock water supply in this region of the Powder River Basin inWyoming. All of the regional livestock wells are completed to depths of 300 to 500feet in an aquifer that is separated from the N-sand by an aquitard hundreds of feetthick. Water quality is generally influenced by the presence or absence of
25Bear Creek Uranium ACL 2011

mineralized zones and stringers of lignite/coal which are scattered throughout theWasatch formation in the Powder River Basin. Wells completed into water bearingformations containing lignite or coal are generally marginal for livestock use in thisarea due to high dissolved solids, Sulfate and Selenium.
The estimated well yield for monitor wells MW-108 and MW-109 are <0.01 gallonsper minute which would not be sufficient for daily residential or livestock use. Thereare several existing stock water wells completed to 430 to 515 foot depths, in whichthe water bearing formations are separated from the N-sand by hundreds of feet ofclaystone, located within a mile or less of the proposed POE locations on Lang Drawand the Northern flow path. These wells provide water at 2-3 gallons per minute andthe water is utilized for livestock. All three are windmill driven and have beensampled in the past for groundwater parameters. The wells GW-8, GW-10 and GW-15 are located <1/2 mile south-west of the POE on Lang Draw, <1 mile north of bothLang Draw and the Northern flow path, and - 1 mile north-west of the Lang Drawflow path POE respectively. Water samples were collected on these wells andreported to the Wyoming Department of Environmental Quality in required annualreports during operation of the mine.
With the mine, mill and tailings sites having been totally reclaimed and re-vegetatedthe only potential exposure pathway is from drinking water and ingestion ofirrigated garden products contaminated by utilizing the water from this shallowformation. There is no potential for airborne inhalation or external exposure increaseabove background. There has not been in the past and there is no expected use ofthis water now or in the future.
Several options were considered to meet the as low as reasonably achievabledemonstration (ALARA) in 1997 prior to final reclamation of the tailings area (Letterto J.J. Holonich USNRC dated May 13, 1997). Continue to pump and evaporate,passive reactive barriers (one in each plume), pump and treat with reverse osmosisand reinjection, and fresh water injection were considered. All were cost prohibitiveat that time and would be even more so now that the site is reclaimed.
A conservative risk analysis was performed and submitted with the 1997 ACLapplication. The calculated risk to human health at that time for all of the hazardousconstituents were in the E-4 range for predicted and background levels of radioactivecontamination of groundwater at the POEs. Uranium in the Lang Draw flow path isthe only parameter that is estimated in the 2011 model to exceed the level predictedin the 1997 model. It is still within the E-4 risk range. As previously stated, thepredicted uranium value in the 2011 model is at least 5 times higher than themeasured levels of uranium in the MW-109 monitor well in the same time frame.
26Bear Creek Uranium ACL 2011
The only potential exposure pathway to be considered is from intake of contaminatedgroundwater as the there is no potential for airborne or external exposure since thesite is completely reclaimed.
In 1997, boreholes were drilled by S.M.Stoller north of the POEs located near MW-14(Lang Draw) and MW-lll (Northern flow path) and south of the Anadarko propertyboundary. Significant water was not encountered in any of the boreholes along LangDraw at the time of drilling. Only boreholes near MW-108 in Lang Draw were foundto contain wet sands. It was Stoller's opinion that "it is very unlikely that thealluvium will produce enough water to satisfy the NRC definition of an aquifer". Twowells, drilled north of the proposed POEs (MW-109 and MW-lll), designatedManning B.C.18 (GW-18, Permit NO. U.W. 64632 completed Aug. 1983) and HardyNo. 4 (U.W. Well permit No.1365 drilled 1947), which were completed to depths of432 feet and 443 feet respectively, show no water present in the N-sand in the welllogs. Both wells are located north of the POEs in Section 9, T 38N, R 73 W. (sourceon internet "State of Wyoming, State Engineer's Office, Water Rights Data Base,Search by Well Location, ground water information only").
The lithologies encountered north of the Bear Creek Tailings Facility are typical ofsediments deposited in a fluvial environment. These deposits are characterized byinterbedded sand, silt, and clay units which vary in thickness due to different modesof deposition. The geometry of the stream, at the time of deposition, controlled thesefacies changes (increasing silt and clay) where sands are typical of stream channeldeposits and silts and clays are typical of over-bank deposition. The fining andthinning of the N-sand controls groundwater movement through the study area.Facies changes in boreholes located between Lang Draw and the Northern flow pathrestricts groundwater flow and separates the study area into two differentgroundwater flow environments. It is suspected that the facies changes are reflectedin the current division of plume migration evident near the tailings facility and mayretard flow to the southeast in the Northern flow path. (Stoller 1997).
The water in the Northern flow path is not predicted, in the 2011 model, to exceedbackground concentrations for the hazardous constituents of interest. Criterion5B(5) of Appendix A states that conceptually, background concentrations "...pose noincremental hazards..."
There is no known past or current use of this shallow aquifer and no surfaceexpression or communication with lower aquifers or surface water in the area. Theremedial action costs are high in relation to the long term benefit. The mine, millsite, tailings area, and five miles of access road were reclaimed and revegetated overten years ago. All additional monitor wells and piezometer wells were plugged and
27Bear Creek Uranium ACL 2011

abandoned ahead of the reclamation sequence. There is also no likelihood ofbuildings or structures being placed in the area. The groundwater in this shallowformation should qualify for supplemental standards according to criterion cited inEPA 40 CFR 192.21(b).
The following information was taken from the Department of Energy SiteObservational Work Plan For the UMTRA Project Site At Spook, Wyoming which islocated on the Dry Fork of the Cheyenne River about 2 miles south of the Bear CreekUranium site. The State of Wyoming held title to the surface area over the disposalcell at the Spook site.
Regional background water quality data from sandstones in the Wasatch Formationwere collected by Rocky Mountain Energy (RME) from 22 domestic wells andmonitor wells during the period between 1974 and 1977. The data were collected aspart of a mining permit application for the RME Bear Creek Project. The regionaldata demonstrate that ground water from the altered sandstones has uranium andselenium concentrations generally greater than those in the unaltered sandstonesand that the altered sandstones contain ground water with ambient uranium andselenium concentrations in excess of the MCLs for UMTRA Project sites.
The Spook work plan concluded that there is no apparent risk to human health andthe environment because there are no known exposure pathways for contaminatedground water from the uppermost aquifer to lower aquifers or the surface. No one isusing the ground water from this aquifer for any purpose and there is no dischargeof ground water from the uppermost aquifer to the surface or to surface water. Abaseline risk assessment of site-related contamination was not performed for theSpook site because of the lack of exposure pathways for the uppermost aquifer andbecause of the naturally contaminated nature of background water from thataquifer.
The rationale being that "ground water in the uppermost aquifer (also the zone ofcontamination) being classified as limited use, which allows the application ofsupplemental standards. No one is using or is projected to use the ground water fromthis aquifer for any purpose; there is no discharge of ground water from theuppermost aquifer to deeper aquifers used for domestic and agricultural purposes orto the surface or to surface water."
28Bear Creek Uranium ACL 2011

4.0 Proposed Action
The recalibrated ground water model predicts that the currently approved ACLs willnot be exceeded and the risk assessment confirms there is no unacceptable risk tothe public. Therefore, there is no need to change the ACLs.
29Bear Creek Uranium ACL 2011

References:
Final Environmental Statement related to operation of Bear Creek Project (FEIS),NUREG-0129 Docket No. 40-8452 June 1977
Staff Technical Position, Alternate Concentration Limits for Title 11 Uranium Mills,Standard Format and Content Guide, and Standard Review Plan for AlternateConcentration limit Applications, January 1996.
Union Pacific Resources Group, Bear Creek Uranium Company, Amendment Requestto SUA-1310; Docket No. 40-8452, May 30,1996Union Pacific Resources Group, Inc., Bear Creek Uranium Company, AlternateConcentration Limit Application, February 28, 1997
Union Pacific Resources Letter dated May 13, 1997 to Joseph J. Holonich, ChiefUSNRC, Attn: Charlotte Abrams, containing additional information relating toSection 3.5 of Bear Creek Uranium Company's Alternate Concentration LimitApplication.
Union Pacific Resources, Bear Creek Uranium Mill Tailings Impoundment,Hydrogeologic and Geochemical Transport Analysis, GeoTrans Project #8386-000,March 7, 1995
Fate and Transport Modeling Analysis of Tailings Water Constituents, Bear CreekUranium Mill Site, Converse County Wyoming, HSI GEOTRANS, June 30, 1998
2011 Edition of the Drinking Water Standards and Health Advisories, EPA 820-R-11-002, Office of Water, U.S. Environmental Protection Agency, Washington, DC
Code of Federal Regulations (CFR), Energy, 10 Parts 0 to 50, Revised as of January1, 1996.
Wyoming Department of Environmental Quality, Water Quality Rules andRegulations, Chapter 8, Adoption Date: March 16, 2005.
EPA Risk Assessment Guidance for Superfund, Vol. 1 Human Health EvaluationManual (Part A and B), Environmental Protection Agency (EPA), 1989 (RAGS)
EPA Integrated Risk information System (IRIS), U.S. Environmental ProtectionAgency, New Assessments and Reviews, 2011
30Bear Creek Uranium ACL 2011

EPA Cancer Risk Coefficients for Environmental Exposure to Radionuclides, FederalGuidance Report No. 13, Sept. 1999
EPA Radionuclide Table: Radionuclide Carcinogenicity Slope Factors, FederalGuidance Report No. 13, Morbidity Risk Coefficients in units of picocuries, U.S.Environmental Protection Agency, April 16, 2001
EPA Limiting Values of Radionuclide Intake and Air Concentration and DoseConversion Factors for Inhalation, Submersion, and Ingestion, Table 2.2,U.S.Environmental Protection Agency, Federal Guidance Report No. 11, 1988
Delineation of N-sand and Lang Draw Alluvium - Bear Creek Uranium S.M. StollerCorporation, April 7, 1997
Site Observational Work Plan For The UMTRA Project Site At Spook, WyomingPrepared by the U.S. Department of Energy Albuquerque, New Mexico May 1995DOE/AL/62350-156 Rev. Oc.1
Re-Evaluation of Metals Transport at Bear Creek Uranium, Converse CountyWyoming prepared by Tetra Tech Geo, Louisville, Colorado, October 13, 2011
RESRAD 2.6 Release date July 7, 2010, Argonne National Laboratories
31Bear Creek Uranium ACL 2011

A COMPREHENSIVE RISK ASSESSMENT
FOR THE
PREDICTED CONCENTRATIONS
OF
NICKEL, RADIUM AND URANIUM
AT THE
BEAR CREEK URANIUM COMPANY SITE
Bear Creek Uranium Risk Assessment 2011

TABLE OF CONTENTS
EXECUTIVE SUMMARY
1.0 HUMAN HEALTH EVALUATION
1.1 Introduction1.2 Selection of Contaminants for Risk Evaluation Toxicity1.3 Toxicity Information for Noncarcinogenic and Carcinogenic Effects1.4 Dose Conversion Factors and Exposure Pathways1.5 Ground Water Concentrations1.6 Future Land Use1.7 Quantification of Potential Risk1.8 Risk Characterization1.9 Uncertainties in the Characterization of Risk
2.0 CONCLUSIONS
LIST OF TABLES
Table 1.3.1 Toxicity Values for Hazardous ConstituentsTable 1.5.1 Hazardous Constituents Concentrations at the POE LocationsTable 1.6.1 Potentially Exposed Populations and Exposure RoutesTable 1.7.1 Radionuclides Expressed in Terms of Effective DoseTable 1.8.1 Lifetime Intake of Hazardous ChemicalsTable 1.8.2 Carcinogenic Risks to ResidentsTable 1.8.3 Noncarcinogenic Hazard Quotients for ResidentsTable 1.8.4 Total Radionuclide Risk of Developing Cancer for ResidentsTable 1.8.5 Total Nickel Hazard Quotient for Residents
Bear Creek Uranium Risk Assessment 20112

EXECUTIVE SUMMARY
This assessment of risk is being prepared in support of a request from the NuclearRegulatory Commission for a risk-based alternate concentration limit (ACL). Themeasured level of uranium at the point of exposure (POE) down Lang Draw hasexceeded the 1997 ACL submittal prediction by a factor of 10. Although the valuepredicted by the modeling had been exceeded, at no time did the uraniumconcentrations exceed the approved ACL's.
To determine the risk associated with water use with the predicted maximumconcentrations of nickel, radium, and uranium, a residential use scenario wasassumed to exist. There is no current use of the affected water resource and none isexpected at this site.
Environmental Protection Agency (EPA) Federal Guidance Report (FGR) No. 13Morbidity Risk Coefficients, in Units of Picocuries were used to determineradionuclide carcinogenicity risks for Uranium and Radium concentrations indrinking water based upon chronic intake over a 75 year life time. Nickel is notcurrently listed as a contaminate in drinking water by either the State of Wyoming,which defaults to the National Primary Drinking Water Standard, or the EPAPrimary Drinking Water Standards which remanded Ni from drinking waterstandards in 1996. Prior to 1996, the Maximum Concentration Limit (MCL) for Ni indrinking water was listed as 0.1 mg/l with an oral reference dose (RFD) of 0.02(mg/kg/day). The current, January 2011, EPA lifetime health advisory (LHA) MCLfor Ni is listed as 0.1 mg/l. A lifetime HA is defined as: "The concentration of achemical in drinking water that is not expected to cause any adverse non-carcinogenic effect for a lifetime exposure. The lifetime HA is based on exposure of a70kg adult consuming two liters of water per day." Nickel was not listed in Table 5cof the Nuclear Regulatory Commission regulations contained in 10 CFR Part 20 forhazardous constituents in drinking water and was based on the EPA nationaldrinking water standards listing prior to 1996. For purposes of determination ofrelative risk from Ni in groundwater, the EPA's remanded standard was used alongwith an oral reference dose for soluble Nickel from studies that were conducted andreported on EPA's Integrate Risk Information System (IRIS) web site. The mostrecent model completed in October of 2011 has predicted nickel and Uraniumconcentrations to be below background at the points of exposure down Lang Drawand in the Northern flow path.
The carcinogenic risks for individual radionuclide constituents were assessed. Therisk associated with radium and uranium was found to be within a reasonable rangeof E-4. The risk associated with nickel was found to be acceptable because allexpected levels of Ni were less than previously remanded EPA standard of 0.1 mg/LBear Creek Uranium Risk Assessment 2011
3

MCL and an oral RFD for soluble nickel. To determine the relative incrementalincrease in risk due to the reclaimed mill tailings, the risk associated withconsumption of water having background concentrations of nickel, radium, anduranium was calculated and compared to the predetermined background levels, theEPA recommended MCL for each constituent and the expected concentration foreach constituent at the point of exposure. The assessment of total risk associatedwith the background conditions indicated that nickel concentrations were withinacceptable limits, while radium and uranium were on the order of E-4. Thesummation of the predicted concentrations of nickel, radium, and uranium did notchange the risk order of magnitude.
The exposure assessment indicated that there is no exposed population and it isreasonable to assume that there will be no future exposed populations. However tosupport the calculation of risk, a hypothetical population was assumed to exist. Thisscenario demonstrated that the total risk associated with the utilization ofbackground water was within the order of magnitude for the risk associated with thepredicted water quality and MCL's for uranium and radium.
1.0 HUMAN HEALTH EVALUATION
1.1 Introduction
This document evaluates the potential risks to human health associated withgroundwater water use at the POE locations in the Northern and Lang Draw flowpaths. The risk assessment is based on the United States Environmental ProtectionAgency's (EPA) Risk Assessment Guidance for Superfund, Vol.1 Human HealthEvaluation Manual (Part A and B) 1989 (RAGS), the EPA Integrated RiskInformation System (IRIS), EPA Cancer Risk Coefficients for EnvironmentalExposure to Radionuclides, Federal Guidance Report No. 13, the Radionuclide Table:Radionuclide Carcinogenicity Slope Factors Federal Guidance Report No.13Morbidity Risk Coefficients, and the Federal Guidance Report Number 11: LimitingValues of Radionuclide Intake and Air Concentration and Dose Conversion Factorsfor Inhalation, Submersion, and Ingestion, Table 2.2., EPA 2011 Edition of theDrinking Water Standards and Health Advisories
1.2 Selection of Hazardous Constituents for Risk Evaluation
Predictive modeling associated with information collected from monitoring of thecorrective action program (CAP) was utilized to determine the parameters for riskevaluation. This predictive modeling indicated that nickel, radium, and uranium
Bear Creek Uranium Risk Assessment 20114

would require alternate concentration limits and an evaluation of risk at the point ofexposure (POE) locations.
The modeling information indicated that although other hazardous constituents arepresent in the water found in the Northern and Lang Draw flow paths, theconcentrations are below the license-established standards. Evaluation of pastconcentrations and current concentrations indicate that, in the near term, they willremain below the license-established standards and eventually diminish to belowthese concentrations.
1.3 Toxicity Information for Non-carcinogenic and Carcinogenic Effects
The only carcinogenetic toxicity information found for Nickel was from air intake.There is no source for airborne Nickel at the Bear Creek site. Due to the fact thatNickel was remanded from EPA Primary Drinking Water Standards in 1995, acomparison was made to the maximum concentration level (MCL) listed prior to thattime and the oral RFD listed in IRIS in an attempt to show relative risk for ingestednickel. Exposures were assumed to be chronic over a 75 year life span. The primaryhealth effect associated with Radium and Uranium is from radioisotope exposureand the resulting potential for cancer although it is commonly accepted that theprimary health effect of Uranium ingestion is chemical toxicity to the kidney.
The EPA assumes that there is essentially no level of exposure to a chemical thatdoes not pose a finite possibility, no matter how small, of generating a carcinogenicresponse. In evaluating carcinogenic effects, no threshold value can be assumed. TheEPA uses a two part evaluation in which the substance is first assigned a weight ofevidence classification defined by the EPA as a plausible upper-bound estimate ofthe probability of a response per unit intake of a chemical over a lifetime. Followingthis, a slope factor is calculated. This value is multiplied by the chronic daily intakeof the chemical to produce an estimate of probability of an individual developingcancer due to exposure to that chemical.
Exposure to radioisotopes requires that the slope factor is multiplied by the chronicdaily intake over the life span of the individual. These calculations were carried outfor Nickel, Radium and Uranium. Slope factors and weight-of-evidenceclassifications for these constituents are included in Table 1.3.1.
Bear Creek Uranium Risk Assessment 20115

Table 1.3.1 Toxicity Values for Hazardous Constituents
Hazardous Constituent Uranium-238+D Radium-226+D Radium-228 Nickel
Oral Slope Factor 8.71E-11 3.86E-10 1.04E-9 8.4E-1
(risk/pCi) (risk/pCi) (risk/pCi) (mg/kg-day)- 1
Weight of Evidence Carcinogen per EPA Carcinogen per EPA Carcinogen per EPA non-stochastic
Chronic Oral RfD None None None 2E-2
(mg/kg-day)
Uncertainty Factor None None None 300
Reference FGR No.13 FGR No. 13 FGR No. 13 EPA lifetime HA
2011
Target Organ System Skeletal system Skeletal system Skeletal system Whole body,
major organs
There are inherent uncertainties in the toxicity data used to assess risk in this andany other evaluation. For instance, using dose-response information from effectsobserved at high doses to predict the health effects that may occur followingexposure to the low levels of hazardous constituent Concentrations introducesuncertainties. Similarly, using animal studies to predict human response and theuse of short-term studies to predict the effects of a lifetime exposure add to theuncertainties.
Experimental studies of animal populations coupled with studies of healthy humanpopulations are used to predict the response likely to be observed in a populationconsisting of individuals with a wide range of sensitivities.
Uncertainty factors which may overestimate potential risk, and are used to calculaterisk, are presented along with toxicity values in Table 1.3.1. These values give anindication of the confidence in experimental data used to determine the associatedrisk. The greater the uncertainty factor, the greater the uncertainty associated withthe experimental data.
Bear Creek Uranium Risk Assessment 20116

1.4 Exposure Pathways
This assessment considered risk to future populations at a POE in the Northern flowpath and a POE in the Lang Draw flow path. Ground water within the range forNickel, Radium, and Uranium concentrations predicted to be present at these pointswere assumed to be utilized by humans. The exposure matrix assumed that water atthe POEs would be a drinking water source and would nourish consumable foodproducts.
Intake of hazardous constituents as a result of exposure to contaminated soils wasnot considered, as there are no contaminated soils at the BCUC site because the sitehas been reclaimed. Similarly, dermal and inhalation exposure were not considereda probable exposure pathway and not included in the assessment.
1.5 Ground Water Concentrations
The concentrations of nickel, radium, and uranium that are predicted to occur in theNorthern and Lang Draw flow paths were used in this risk assessment. The POElocations are established at the down gradient edge of the land mass that willaccompany an amendment application for a general license. Consequently, this landmass is the minimal amount of land that is necessary to assure long term control ofthe reclaimed byproduct materials. Additional information on the predictivemodeling is contained in the modeling summary.
The values for nickel, radium, and uranium that were utilized were predicted toreach their maximums at times in the future varying from 18 to 44 years, from thetime that the CAP was terminated. Information for the concentrations of hazardousconstituents and the years to attain these concentrations are shown in Table 1.5.1.
Bear Creek Uranium Risk Assessment 20117

Table 1.5.1 Hazardous Constituent Concentrations at the POE Locations
Hazardous Lang Draw Lang Draw Northern Flow Northern Flow EPA MCL @ POE Background StandardConstituent Max. Conc. Year of Max. Path Max. Path Year of
Cone. Cone. Max. Conc.
Nickel 0.032 mg/I 2015 0.034 mg/I 2039 0.10 mg/I 0.05 mg/i
Ra-226 + 2.1 pCi/1 2015 5.8 pCi/l 2040 5 pCi/1 9.7 pCifl
Ra-228
Uranium 166 pCi/l* 2015 75.0 pCi/l 2032 20 pCi/l 98.7 pCi/l
* The value for uranium was the average of the model projected curve which is used as the chronic
exposure for 75 years.
The values for nickel, radium, and uranium shown in Table 1.5.1 represent thelevels that risk was assessed for and represent the entire range of hazardousconstituents that are predicted to occur. The risk for nickel was assessed for thebackground concentration of 0.050 mg/I as well as the predicted maximumconcentrations of: 0.034 mg/I and 0.032 mg/1; 0.10 mg/i, which was the previousMCL; and the listed RFD to demonstrate the relative incremental risk associatedwith these concentrations in nickel. Similarly, the background concentrations ofradium and uranium, the recommended MCL concentrations, and the predictedconcentrations at the POE's were assessed for relative risk. The entire range ofvalues was evaluated in the Northern and Lang Draw flow paths.
1.6 Future Land Use
Although no exposed populations currently exist within four miles of the BCUC siteand none are predicted to be in the area in the future, residential land use wasconsidered in the risk assessment. Lesser exposure scenarios would have resulted inno exposed populations. Although this is the likely scenario it is inconsistent withthe ACL guidance document. Exposure pathways considered for future populationsinclude ingestion of contaminated ground water and consumption of vegetablesusing contaminated ground water for irrigation. Table 1.6.1 summarizes thepotential for exposure to future residents across the routes of exposure.
Bear Creek Uranium Risk Assessment 20118

Table 1.6.1 Potentially Exposed Populations and Exposure Routes
Potentially Exposed Exposure Route, Pathway Selected for Reason for Selection or Exclusion
Population Medium, and Exposure Evaluation?
Point
Residential Ingestion of contaminated Yes Wells developed in the alluvium and the N-
ground water sand
The site and the surrounding area is in a
Residential Ingestion of home-grown Yes rural location, increasing the potential for
vegetables home gardening. The only source of irrigation
water is wells developed in the alluvium and
the N-sand.
NA Dermal absorption through No According to the EPA, dermal uptake of
bathing radionuclides and metals is generally not an
important route of uptake (EPA RAGS,
1989).
NA Inhalation of contaminated No The soil at the BCUC site is not
dust contaminated. The site has been reclaimed.
NA Dermal contact with No The soil at the BCUC site is not
contaminated soil contaminated.
NA Inhalation of airborne No There are no volatile hazardous constituents
(vapor phase) chemicals at the BCUC site.
NA Ingestion of contaminated No The soil at the BCUC site is not
soils contaminated. The site has been reclaimed
1.7 Quantification of Potential Risk
The quantification of risk for nickel utilized standard EPA equations and themethodology as discussed in RAGS, 1989 and HEAST tables. Included in thissubsection are explanations of the calculations which were performed for eachpathway. The equations that were utilized are shown below. EPA FGR No. 13 wasused for radionuclides.
Bear Creek Uranium Risk Assessment 20119

Intake of nickel by ingestion of ground water was calculated by using the followingequation:
CWxIRxEFxEDIntake (mg/kg-day) = BW x AT
Where: CW = Nickel concentration in ground water (mg/1)IR Ingestion Rate (liters/day)EF = Exposure Frequency (days/year)ED Exposure Duration (years)BW Body Weight (kg)AT = Average Time (days)
Intake of Nickel due to ingestion of home grown produce irrigated withcontaminated ground water was calculated by using the following equation:
CW x IR x FIx EF x EDIntake (mg/kg-day) BW x AT
Where: CW = Nickel concentration in ground water (mg/kg)IR = Ingestion Rate (kg/meal)FI = Fraction ingested from Contaminated Source (unitless)EF = Exposure Frequency (days/year)ED = Exposure Duration (years)BW = Body Weight (kg)AT = Average Time (days)
For calculation of ingestion of radionuclides, average time (AT) and body weight(BW) were deleted and the resulting intake was multiplied by the dose conversionfactor (DCF) in mrem/pCi. The units of intake are therefore discussed in terms ofeffective dose and expressed as fractions of radiation equivalent man (mrem) over a75 year time frame and are shown in Table 1.7.1
Bear Creek Uranium Risk Assessment 2011l0

Table 1.7.1 Radionuclides Expressed in Terms of Effective Dose
Hazardous Ingestion of groundwater Ingestion of home grown Ingestion of groundwaterConstituent plants
Lang Draw Northern Lang Draw Northern Background MCLflow path flow path flow path flow path
U-238+D 1192 540 2.9 1.4 710 147(mrem)
Ra-226+D 155 422 0.4 1.1 706 364(troem)
1.8 Risk Characterization
The carcinogenic and non-carcinogenic risk associated with exposure to Nickel,Radium, and Uranium under the residential future land use scenario serve as thecharacterization for this assessment. Although there is no current indication thatthe ground water in the Northern flow path and the Lang Draw flow path will beutilized under a residential scenario, this type of use was assumed to take place.This use scenario incorporates the most conservative exposure values; i.e., length ofresidence, and duration of exposure.
If exposure to Nickel, Radium, and Uranium under this land use scenariodemonstrates no significant increase in risk of development of cancer and non-cancerillnesses, then it will be assumed to be the case for all other land use scenarios.
A lifetime exposure of 75 years was used for the calculations. FGR 13 riskcoefficients for ingestion of radionuclides in tap water or food are expressed as theprobability of radiogenetic cancer morbidity per unit intake, where the intake isaveraged over all ages and both genders. The exposure pathways under theresidential land use scenario include the ingestion of contaminated ground waterand the ingestion of home grown produce irrigated with contaminated ground water.The lifetime intake of potentially hazardous chemicals by residents is summarized inTable 1.8.1
Bear Creek Uranium Risk Assessment 201111

Table 1.8.1 Lifetime Intake of Hazardous Chemicals
Hazardous Ingestion of groundwater Ingestion of home grown Ingestion of groundwater
constituent plants
Lang Draw Northern Lang Draw Northern background MCLflow path flow path flow path flow path
U-238 (pCi) 4.4E+6 2.OE+6 11.OE+3 5.OE+3 2.64E+6 0.5E+6
Ra-226 (pCi) 1.24E+5 3.2E+5 3.OE+2 8.OE+2 5.31E+5 2.74E+5
Nickel 1.51E-3 1.57E-3 7.6E-5 7.8E-5 1.4E-3 2.9E-3(ng/kg-day)
The potential risk for residents from the predicted nickel concentrations in thegroundwater, is provided by the product of the slope factor and the intake. Thepotential risk to residents to develop cancer from radium and uranium is determinedby the product of the estimated ingested activity in pCi and the slope factor(risk/pCi). The potential risk for residents to develop cancer due to exposure to sitecontaminants is summarized in Table 1.8.2.
Table 1.8.2 Carcinogenic Risks to Residents
Pathway Hazardous Resident Risk (unitless) background MCLconstituent
Lang Draw Northern flowflow path path
Ingestion of U-238+D 3.8E-4 1.OE-4 2.3E-4 0.4E-4groundwater
Ingestion of Ra-226+D 0.4E-4 1.2E-4 2.OE-4 1.OE-4groundwater
Ingestion of Ni 1.26E-3 1.34E-3 1.18E-3 2.4E-3groundwater
Ingestion of U-238+D 9.5E-7 2.6E-7 4.OE-7 1.OE-7home grown
produce
Ingestion of Ra-226+D 1.OE-7 3.OE-7 5.01E-7 2.6E-7home grown
produce
Ingestion of Ni 6.OE-5 6.7E-5 5.9E-6 1.2E-4home grown
produce
Bear Creek Uranium Risk Assessment 201112
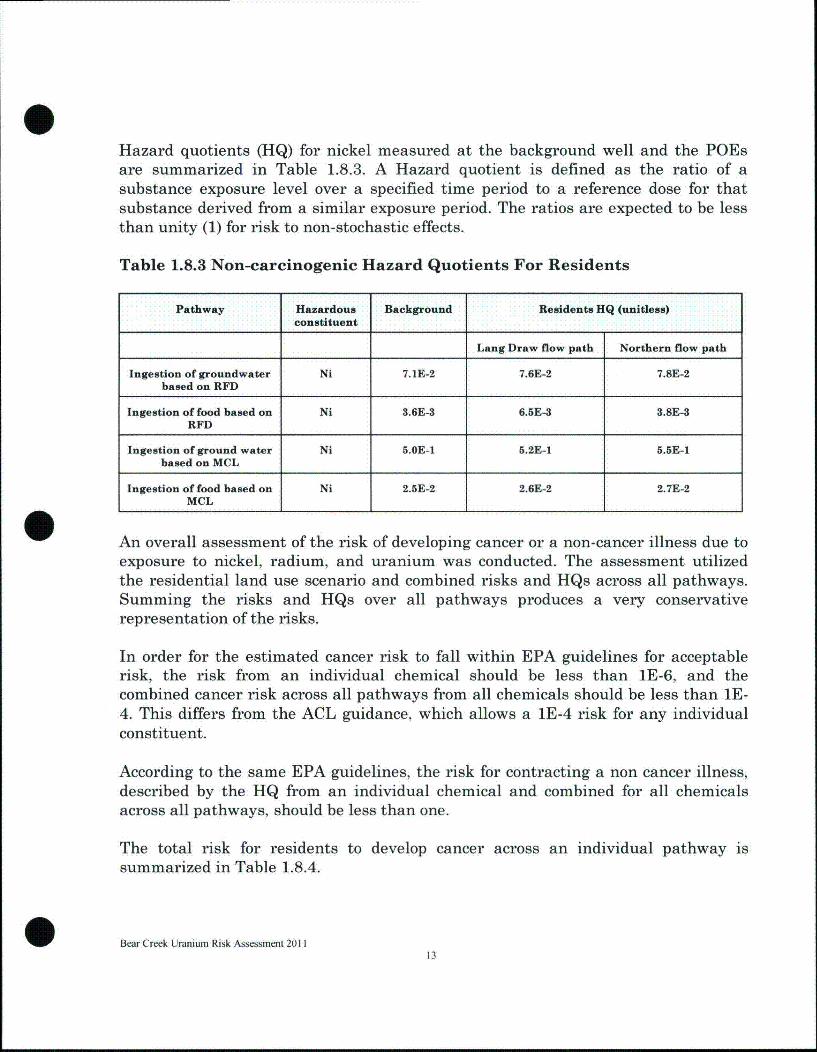
Hazard quotients (HQ) for nickel measured at the background well and the POEsare summarized in Table 1.8.3. A Hazard quotient is defined as the ratio of asubstance exposure level over a specified time period to a reference dose for thatsubstance derived from a similar exposure period. The ratios are expected to be lessthan unity (1) for risk to non-stochastic effects.
Table 1.8.3 Non-carcinogenic Hazard Quotients For Residents
Pathway Hazardous Background Residents HQ (unitless)constituent
Lang Draw flow path Northern flow path
Ingestion of groundwater Ni 7.1E-2 7.6E-2 7.8E-2based on RFD
Ingestion of food based on Ni 3.6E-3 6.5E-3 3.8E-3RFD
Ingestion of ground water Ni 5.OE-1 5.2E-1 5.5E-1based on MCL
Ingestion of food based on Ni 2.5E-2 2.6E-2 2.7E-2MCL
An overall assessment of the risk of developing cancer or a non-cancer illness due toexposure to nickel, radium, and uranium was conducted. The assessment utilizedthe residential land use scenario and combined risks and HQs across all pathways.Summing the risks and HQs over all pathways produces a very conservativerepresentation of the risks.
In order for the estimated cancer risk to fall within EPA guidelines for acceptablerisk, the risk from an individual chemical should be less than 1E-6, and thecombined cancer risk across all pathways from all chemicals should be less than 1E-4. This differs from the ACL guidance, which allows a 1E-4 risk for any individualconstituent.
According to the same EPA guidelines, the risk for contracting a non cancer illness,described by the HQ from an individual chemical and combined for all chemicalsacross all pathways, should be less than one.
The total risk for residents to develop cancer across an individual pathway issummarized in Table 1.8.4.
Bear Creek Uranium Risk Assessment 201113

Table 1.8.4 Total Radionuclide Risk of Developing Cancer for Residents
Pathway Risk (unitless)
Lang Draw flow Northern flow Background MCLpath path
Total Risk 4.2E-4 2.2E-4 4.3E-4 1.4E-4
The HQ is obtained by dividing the intake of nickel (units of mg/kg-day) by the RfDfor nickel (units of mg/kg-day) and measured levels of Ni in mg/1 divided by thelifetime HA MCL. A summary of chronic HQs across each exposure pathway is givenin Table 1.8.5.
Table 1.8.5 Total Nickel Hazard Quotient for Residents
Pathway HQ (Unitless)
Lang Draw flow Northern flow path Backgroundpath
Ni HQ RFD-based 8.2E-2 8.2E-2 7.5E-2
Ni HQ MCL-based 5.4E-1 7.8E-1 5.2E-1
The overall risk for individuals residing at the POE locations to develop cancer iswithin the range of the 1E-4 required by Alternate Concentration Limits for Title IIUranium Mills (ACL) guidance. Including nickel for the potential carcinogenic riskdoes not appear to be warranted as there is no data to support cancer risk to humansand currently no listed MCL for nickel in the EPA primary or secondary drinkingwater standards. Nickel concentrations are less than the MCL and the MCLcalculated risk is 2.4E-3. Including this in the summation skews the overall riskevaluation.
The calculations indicate that all hazard quotients for nickel are withinrecommended levels. Therefore, they are not a contributor to the overall risk. Thedriving factor for risk is the predicted development of cancer due to the presence ofradionuclides in the ground water in the Northern and Lang Draw flow paths.
Bear Creek Uranium Risk Assessment 201114

1.9 Uncertainties in the Characterization of Risk
There are many uncertainties inherent in calculating the risk of developing cancerand non-cancer illnesses due to exposure to Nickel, Radium, and Uranium. Includedare the site specific uncertainty factors associated with characterizing the physicalsetting, and determining the fate and transport, as well as toxicity.
The concentrations of Nickel, Radium, and Uranium that are currently in thebackground water, as well as the concentrations of those constituents predicted tooccur at the POE locations, were utilized in the risk assessment.
Utilizing the ground water model introduces levels of uncertainty in the data,particularly extending the time frame of the model to over a hundred years.
Significant site data gaps occur when site specific data is unavailable or unknown.This specifically occurs when estimating the exposure to future populations. Forexample, when estimating what the exposure to a future resident will be, there areno current residents upon which to base the estimates of exposure parameters;therefore, the EPA recommended values have been used to estimate exposure toresidents. When several options are available, the most conservative value wasutilized.
A certain amount of uncertainty exists with the slope values and references dosesthat were used in the calculation of risk. These values were obtained from EPAsources. The references acknowledge the uncertainty associated with the lack ofhuman or animal data and the extrapolation that is necessary. The uncertaintyfactors generally overestimate the calculated risk.
2.0 Conclusions
The EPA RAGS methodology, HEAST tables, and EPA January 2011 Edition of theDrinking Water Standards and Health Advisories were implemented in the riskassessment for nickel. The Federal Guidance Report No. 13 was used to estimaterisk and dose for radionuclides. The objective of this procedure was to assess thedegree of risk associated with the possibility of future residential land use at thePOE locations.The assessment assumed that the maximum predicted concentrations would berealized at the POE locations. The exposure routes included ingestion ofcontaminated ground water and ingestion of home grown vegetables or produceirrigated with contaminated ground water.
Bear Creek Uranium Risk Assessment 201115

Under a residential land use scenario, the overall risk across all pathways forresidents to develop cancer was evaluated at the POE locations. The risk is withinthe 1E-4 order of magnitude for cumulative pathways for radionuclides.
Although the nickel calculated risk were higher than those observed in theradionuclide constituents, they were within the same order of magnitude as thehazard quotients for nickel found in the background well and less than the risk forthe remanded EPA MCL for nickel.
The predicted concentrations of uranium and radium in the ground water will causea minimal increase in the acceptable risk of cancer to future residents from theingestion of ground water. Risks of developing cancer from ingesting ground waterand eating produce irrigated with water containing uranium are 2.2E-4 and 4.2E-4in the Northern flow path and the Lang Draw flow path respectively. These risks arewithin acceptable ACL guidance levels.
The exposure estimates for the exposure pathways were determined by using themost conservative values recommended by the EPA. They represent the worst casescenario and overestimate the potential exposure, i.e. the nickel drinking waterequivalent level of 0.7 mg/I listed in EPA's 2011 Edition of the Drinking WaterStandards and Health Advisories which is defined as:" A lifetime exposureconcentration protective of adverse, non-cancer health effect, which assumes that allof the exposure to a contaminant is from drinking water." That level is seven timeshigher than the one used here to estimate potential risk from nickel.
Bear Creek Uranium Risk Assessment 201116