Embed Size (px)
Citation preview

An Alternative Approach to Measuring Horizontal and Vertical Equity in School Funding
By Robert K. Toutkoushian and Robert S. Michael
abstr act
Although the notions of vertical and horizontal equity are straightforward, con-structing valid measures of each has proven difficult in states that make revenue adjustments for multiple factors. In this article we introduce an alternative ap-proach for assessing horizontal and vertical equity that addresses this problem. This approach is based on the multivariate relationships between a school district’s per-pupil revenues and the various factors used to determine per-pupil funding in the district’s state. The vertical equity metrics are based on how close the linear relationships between per-pupil funding and vertical equity factors are to their intended values. We examine horizontal equity by looking at the unexplained variations in per-pupil funding levels from the same model. This leads to im-proved measurement of “equal treatment of equals” without assuming that all school districts have comparable funding needs. We use data for 292 public school districts in Indiana to illustrate how the new measures can be implemented and whether changes in the state’s foundation program in 2005 resulted in gains in horizontal and vertical equity.
introduction
In one form or another, equity in school funding has been a major concern in K–12 education finance discussions since the early 1970s. Studies such as the National
Robert K. Toutkoushian is an associate professor of educational leadership and policy studies at Indi-ana University. Robert S. Michael is a statistician with the Center for Evaluation and Education Policy at Indiana University. This project was funded in part through the grant “Extending Indiana’s Capacity for School Finance Analysis,” provided by the state of Indiana. An earlier version of this article was presented at the annual meetings of the American Education Finance Association, Louisville, Kentucky, March 2005.
journal of education finance | 32 :4 spring 2007 395–421 395
123456789
10111213141516171819202122232425262728293031323334353637383940

396 journal of education finance
Education Finance Project (Johns and Salmon, 1971) and the School Finance Co-operative (Berne, 1977, 1978) were conducted to examine whether school funding was equitable from the perspective of the providers of education resources (tax-payers) and the recipients of education resources (students and school districts). The urgency behind these studies can be traced back to legal challenges in cases such as McInnis v. Shapiro (1968), Burruss v. Wilkerson (1969, 1970), and Serrano v. Priest (1971), which pointed out that states were obligated by constitutional lan-guage to ensure that education funding was raised and distributed in a fair and equitable manner. Two alternative definitions of equity exist in school funding. The first is known as horizontal equity, meaning that school districts considered to be similar to each other along dimensions that relate to the cost of providing basic education, such as wealth, size, and socioeconomic status, should have comparable levels of fund-ing. This is often called the equal treatment of equals in school finance literature. A second equity principle, vertical equity, states that for education funding to be equitable, school districts with higher costs to educate student populations should receive more funding than their counterparts to compensate for this difference; this is called the unequal treatment of unequals. Despite the growing attention directed toward adequacy in school finance, the issue of equity remains important to policymakers and the education community for several reasons. First, there is no consensus in the education community about the best way to measure the cost of providing an adequate education (Reschovsky and Imazeki, 2000; Odden and Picus, 2004). Even if such consensus did exist, the prescribed dollar increases often are so large that states cannot be expected to achieve adequate funding levels in the near future. Although some states may view adequacy as an unattainable short-run goal, equity should be achievable for any level of education funding. Second, there is the philosophical notion that funding should be distributed in an equitable manner (Costrell, 2005). Third, many states are mandated by their constitutions to fund schools in an equitable manner. Fourth, states are still compared with each other annually in terms of equity by entities such as Education Week and the Education Trust, and these rankings receive much attention from education stakeholders and the public. Finally, many empirical studies of school funding continue to assess horizontal and vertical equity (Duncombe and Johnston, 2004; Picus et al., 2004; Paquette, 2004; Vesely and Crampton, 2004; Hirth and Eiler, 2005). To achieve vertical equity, states have modified their funding formulas to pro-vide more money to schools with more need. It is common for states to make adjustments in per-pupil revenues based on the socioeconomic composition of districts. To illustrate, Kansas increases the per-pupil funding levels for students who are receiving free lunch by 10%, whereas Texas and Oklahoma provide 20%
123456789
10111213141516171819202122232425262728293031323334353637383940
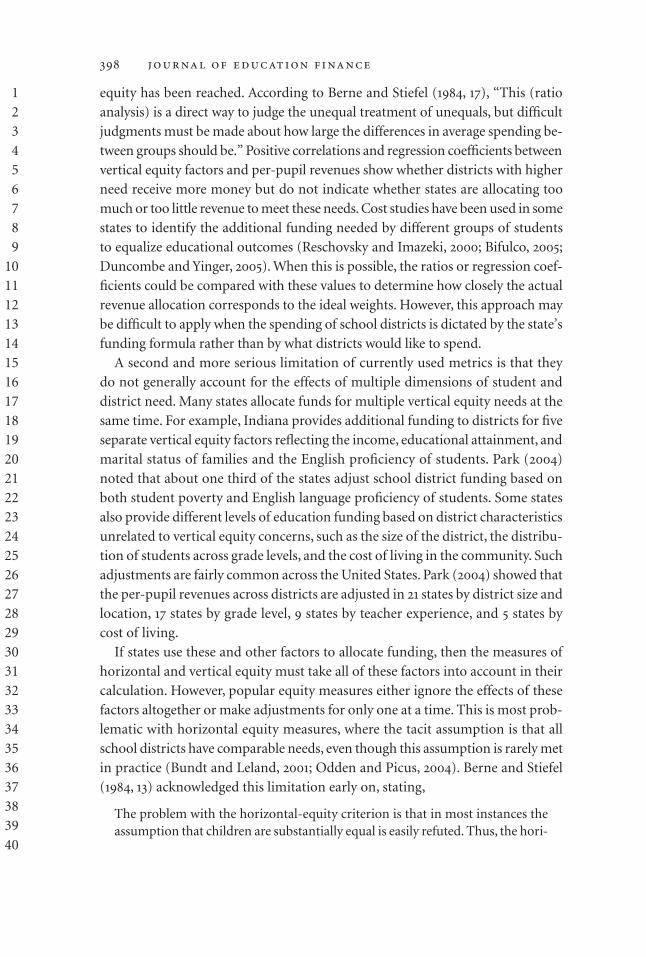
additional funding per pupil for the same group (Baker and Duncombe, 2004; Park, 2004). About half of all states provide more funding for districts with more students who are in poverty or at risk of not succeeding in school (Park, 2004; Baker and Duncombe, 2004; Olsen, 2005; Costrell, 2005). As noted by Bifulco (2005, 180), however, “there is little consensus on how much additional funding per pupil is needed for poor students relative to non-poor students.” Likewise, Reschovsky and Imazeki (2000, 3) argued that “the determination of the magni-tude of the weights appears to be completely unsupported by careful research.” Although the notions of vertical and horizontal equity are straightforward, constructing valid measures of each has proven to be difficult. Crampton (1991) and Vesely and Crampton (2004) argued that the currently used measures of vertical equity are especially in need of improvement. In theory, the metrics for horizontal and vertical equity should be able to reflect accurately the changes they purport to measure, and it should be possible for foundation programs to work toward both of these objectives simultaneously (i.e., provide more funding to school districts with greater need and comparable funding to school districts with similar needs). These metrics should also be flexible enough to handle situ-ations in which states vary funding to districts based on multiple factors relating to student and district needs. Most researchers rely on the measures described by Berne and Stiefel (1984) to assess horizontal and vertical equity in school funding. As noted by Berne and Stiefel (1984, 18), these horizontal equity measures are
statistics that capture the spread, or dispersion, in a distribution. Perfect equity would exist when every pupil in the distribution receives the same object, and the horizontal-equity measures assess how far the distribution is from perfect equality.
Reductions in dispersion are then interpreted as movements toward horizontal equity. The vertical equity metrics are based on either descriptive statistics of the variations in per-pupil revenues after adjusting for a vertical equity factor, bivariate correlations or regressions between per-pupil revenues and selected vertical equity characteristics of districts, or ratios of per-pupil revenues for two groups. Vertical equity is said to improve when there are reductions in adjusted variations in per-pupil revenues or increases in the ratios of per-pupil revenues between groups or the correlations between per-pupil revenues and vertical equity characteristics. Berne and Stiefel (1984) listed more than a dozen alternative ways of measuring horizontal and vertical equity. There are several important limitations to the current approaches toward mea-suring horizontal and vertical equity, however. First, some of the vertical equity metrics do not have specific targets that can be used to determine whether vertical
An Alternative Approach to Measuring Equity 397
123456789
10111213141516171819202122232425262728293031323334353637383940
398 journal of education finance
equity has been reached. According to Berne and Stiefel (1984, 17), “This (ratio analysis) is a direct way to judge the unequal treatment of unequals, but difficult judgments must be made about how large the differences in average spending be-tween groups should be.” Positive correlations and regression coefficients between vertical equity factors and per-pupil revenues show whether districts with higher need receive more money but do not indicate whether states are allocating too much or too little revenue to meet these needs. Cost studies have been used in some states to identify the additional funding needed by different groups of students to equalize educational outcomes (Reschovsky and Imazeki, 2000; Bifulco, 2005; Duncombe and Yinger, 2005). When this is possible, the ratios or regression coef-ficients could be compared with these values to determine how closely the actual revenue allocation corresponds to the ideal weights. However, this approach may be difficult to apply when the spending of school districts is dictated by the state’s funding formula rather than by what districts would like to spend. A second and more serious limitation of currently used metrics is that they do not generally account for the effects of multiple dimensions of student and district need. Many states allocate funds for multiple vertical equity needs at the same time. For example, Indiana provides additional funding to districts for five separate vertical equity factors reflecting the income, educational attainment, and marital status of families and the English proficiency of students. Park (2004) noted that about one third of the states adjust school district funding based on both student poverty and English language proficiency of students. Some states also provide different levels of education funding based on district characteristics unrelated to vertical equity concerns, such as the size of the district, the distribu-tion of students across grade levels, and the cost of living in the community. Such adjustments are fairly common across the United States. Park (2004) showed that the per-pupil revenues across districts are adjusted in 21 states by district size and location, 17 states by grade level, 9 states by teacher experience, and 5 states by cost of living. If states use these and other factors to allocate funding, then the measures of horizontal and vertical equity must take all of these factors into account in their calculation. However, popular equity measures either ignore the effects of these factors altogether or make adjustments for only one at a time. This is most prob-lematic with horizontal equity measures, where the tacit assumption is that all school districts have comparable needs, even though this assumption is rarely met in practice (Bundt and Leland, 2001; Odden and Picus, 2004). Berne and Stiefel (1984, 13) acknowledged this limitation early on, stating,
The problem with the horizontal-equity criterion is that in most instances the assumption that children are substantially equal is easily refuted. Thus, the hori-
123456789
10111213141516171819202122232425262728293031323334353637383940

zontal-equity criterion rightfully should be applied only to subgroups, where equality among children can be agreed upon.
It would be very difficult to group students according to multiple student and district need factors and calculate the standard horizontal equity measures in this manner. In these situations, a statistical approach is needed for horizontal equity that would remove the effects of multiple need factors before its calculation. Al-though the approaches to vertical equity such as ratio analyses and bivariate cor-relations and regressions do control for the effects of a single need factor, they are less effective at assessing vertical equity along multiple dimensions of need. There are other potential problems with the equity metrics currently in use. Directing more revenues to achieve vertical equity can produce greater overall variability in funding across districts and thereby reduce horizontal equity. This can lead policymakers to mistakenly view school finance policy as a tradeoff between providing more funding to school districts with greater need (vertical equity) and providing equal funding to school districts regardless of need (hori-zontal equity). The fact that many different statistics could be used to measure horizontal and vertical equity can also give rise to different conclusions about equity depending on the specific metric used. To illustrate, Costrell (2005) found that 5 of the top 10 states according to Education Week’s horizontal equity rank-ings were in the bottom third of the Education Trust’s rankings based on vertical equity measures and that there is little or no correlation between the rankings of states produced by these two entities (“Quality Counts,” 2005; Education Trust, 2005; see also Carey, 2004; Costrell, 2005). In this article we introduce an alternative approach for measuring both hori-zontal and vertical equity that is particularly useful when states make funding adjustments for multiple student and district need factors. We propose that verti-cal equity should be assessed based on how close the partial linear relationships between per-pupil funding and vertical equity factors are to the weights used by the state. This entails the estimation of a multiple regression model in which the vertical equity and cost-related factors used in the state are regressed against per-pupil funding. In addition, we use the same regression model to measure horizontal equity by looking at the variation in per-pupil funding that is not ex-plained by the state’s vertical equity and cost-related factors such as district size and geographic location. In this way, we use the multivariate model to remove the effects of student and district characteristics that may also be used to determine per-pupil funding in a given state. The result is an improved measurement of the equal treatment of equals without the assumption that all school districts have comparable funding needs. We begin by reviewing the approaches currently used to examine horizontal and vertical equity in education funding and then intro-
An Alternative Approach to Measuring Equity 399
123456789
10111213141516171819202122232425262728293031323334353637383940

400 journal of education finance
duce the alternative measures that address our concerns about current practice. Finally, we use data for 292 public school districts in Indiana to illustrate how the new measures can be implemented and determine whether changes in the state’s foundation program in 2005 produced improvements in either horizontal or vertical equity.
curr ent measur es of horizontal and vertical equity
Since the 1970s, a number of different approaches have been offered in the lit-erature for measuring equity in school funding. Most of the early efforts focused on fiscal neutrality, or equity from the perspective of taxpayers who provided financial support to schools (Johns and Alexander, 1971; Federal Register, 1977). As attention turned toward the equity of school funding from the perspective of recipients, new measures of equity were needed. The most commonly used metrics today can be traced back to the work of Berne (1977, 1978), Berne and Stiefel (1979), and others described in The Measurement of Equity in School Fi-nance (Berne and Stiefel, 1984). More than 20 years later, these measures continue to be used in most state-specific and national studies of horizontal and vertical equity (Rubenstein et al., 2000; Baker, 2001; Bundt and Leland, 2001; Goldhaber and Callahan, 2001; Duncombe and Johnston, 2004; Picus et al., 2004; Paquette, 2004; Hirth and Eiler, 2005). There are many different ways to critique equity measures. Berne and Stiefel (1984) applied a series of value judgment questions to their metrics that have been helpful in comparing the alternatives. For our purposes, we focus on the following three attributes of equity measures:
Is the measure univariate, bivariate, or multivariate?Can it be used when there are multiple equity or nonequity factors that affect
funding?Is there a specific target for achieving equity?
The first two attributes are particularly relevant for states that make funding adjustments for districts based on multiple equity or nonequity considerations. Table 1 presents a list of some of the measures described by Berne and Stiefel for measuring horizontal equity. Complete details on these and similar measures of equity can be found in Berne and Stiefel (1984) and Odden and Picus (2004). The horizontal equity measures are based on the assumption that all school districts are comparable in terms of factors that determine the level of funding they need to deliver basic education services. From this assumption arises the inference that an equitable school funding mechanism would provide uniform
123456789
10111213141516171819202122232425262728293031323334353637383940

levels of per-pupil funding to all school districts. As noted by Odden and Picus (2004, 63),
When horizontal equity is used, one assumes that all students are alike. While this is a crude assumption at best, it is implied when it is argued that spending should be equal across all school districts or schools. Thus, horizontal equity has been widely used in school finance, despite its assumption that all students are alike.
Only if this assumption were true would the resulting measures be informative as to the equal treatment of equals; otherwise, what is actually being captured by these measures is simply the degree of variation in per-pupil revenues across school districts. Increases in variability of per-pupil funding may reflect either a deterioration in horizontal equity or an improvement in vertical equity if more education funding is allocated on the basis of the socioeconomic status of a com-munity. All of these horizontal equity measures are univariate (descriptive) and there-fore cannot remove the effects of equity and nonequity factors on per-pupil fund-ing. The best that could be done, as per the suggestion of Berne and Stiefel (1984), would be to calculate these metrics separately for groups of students broken down by need. However, this becomes less practical as the number of dimensions on which need is defined increases. On the other hand, these horizontal equity mea-sures have specific targets that policymakers can use to assess whether equity has been achieved. Progress toward horizontal equity is said to occur when a reduction
Table 1. Commonly Used Measures of Horizontal Equity in School Finance
Metric Description
Range Difference between the districts with the highest and lowest revenues per pupilRestricted range Difference in the per-pupil revenues for districts at specific percentiles in the distributionVariance or Average squared deviation in per-pupil revenues across standard deviation school districtsMean absolute deviation Average absolute deviation in per-pupil revenues across school districtsCoefficient of variation Standard deviation in per-pupil revenues divided by the mean of per-pupil revenuesMcLoone index Ratio of the sum of per-pupil revenues for districts below the median to the sum if all districts were at the median in per-pupil revenuesGini coefficient Relationship between the distribution of per-pupil revenues and a uniform distribution of per-pupil revenues
Note: For more details on these and related statistics, see Berne and Stiefel (1984) or Odden and Picus (2004).
An Alternative Approach to Measuring Equity 401
123456789
10111213141516171819202122232425262728293031323334353637383940

402 journal of education finance
in variability in per-pupil revenues across school districts is observed (Rubenstein et al., 2000), and equity is achieved when there is no remaining variability. The concept of vertical equity holds that if students have different educational needs, an equitable state funding system should provide different levels of funding to meet these needs (Rubenstein et al., 2000). Berne and Stiefel (1984) recognized that moving from the general concept of vertical equity to an operational defi-nition and method of measurement would be challenging. Not only must one determine which vertical equity characteristics of students or school districts require different levels of revenues, but one must also identify the appropriate magnitudes of these differences. Baker and Friedman-Nimz (2003, 525) described this problem as follows: “This phrase (vertical equity) raises two key questions: (1) Who is unequal . . . and (2) What constitutes appropriately unequal treatment (e.g., how unequal is unequal enough)?” Each state must identify the vertical equity characteristics to target and deter-mine how much additional resources should be allocated for each factor. Typically, these characteristics include measures of the poverty status of students in the community, presuming that school districts in lower socioeconomic areas need more funding than do their wealthier counterparts to provide the same level of basic education. Some states also provide additional resources to districts with more students who have limited English proficiency or fewer adults with high levels of education. Park (2004) observed that the amounts of funding distributed to meet vertical equity vary greatly by state. The decisions about the amount of funding to provide for these factors usually is determined by the state’s legislative branches. Thus, the final dollar amounts assigned to each factor could be affected by the political process as much as by empirical evidence as to what they should be (Reschovsky and Imazeki, 2000). Furthermore, in periods of tight financial constraints, states could set these amounts below what may be thought necessary to bring about equality in student outcomes. In Table 2 we list the most commonly used vertical equity measures and how they relate to the three aspects we identified earlier. All of these metrics attempt to identify whether a relationship exists between a specific characteristic and per-pupil revenues. In the first approach, the per-pupil revenues of school districts are weighted by the inverse of a given characteristic, which in effect removes the influence of the factor from per-pupil revenues. The univariate measures used for horizontal equity are then applied to the adjusted per-pupil revenues, and reductions in variations are interpreted as improvements in vertical equity because more of the variations in per-pupil funding are explained by the given characteristic. The ratio analysis compares the average per-pupil revenues for two groups of districts, such as high-wealth versus low-wealth districts. Both the weighted dispersion measures and the ratio analysis are univariate, yet both can
123456789
10111213141516171819202122232425262728293031323334353637383940

Tabl
e 2.
Com
mon
ly U
sed
Mea
sure
s of
Ver
tica
l Equ
ity
in S
choo
l Fin
ance
Is
Th
ere
a
Can
th
e M
etri
c
Spec
ific
Go
al
Can
th
e M
etri
c A
dju
st
Ad
just
for
Eff
ects
St
atis
tica
l fo
r A
chie
vin
g fo
r M
ult
iple
Ver
tica
l of
Non
–V
erti
cal
Met
ric
Des
crip
tion
A
pp
roac
h
Equ
ity?
E
quit
y Fa
ctor
s?
Equ
ity
Fact
ors?
Wei
ghte
d O
bser
vati
ons
are
wei
ghte
d U
niv
aria
te
Yes,
wh
en
No,
un
less
fact
ors
are
No,
un
less
fact
ors
are
dis
per
sion
b
ased
on
th
e in
vers
e of
th
e
w
eigh
ted
par
t of
an
inde
x u
sed
to
par
t of
an
inde
x u
sed
to
mea
sure
s c
har
acte
rist
ic u
sed
in v
erti
cal
d
isp
ersi
on =
0.
wei
ght
obse
rvat
ion
s w
eigh
t ob
serv
atio
ns.
.
equ
ity,
th
en t
he
stan
dard
R
equ
ires
kn
owle
dge
of
Req
uir
es k
now
ledg
e of
mea
sure
s of
dis
per
sion
are
s
pec
ific
wei
ghts
. s
pec
ific
wei
ghts
.
com
pute
d.
Rat
io a
nal
ysis
T
he
rati
o of
per
-pu
pil
Un
ivar
iate
N
o.
No,
un
less
inde
x is
use
d N
o, u
nle
ss fa
ctor
s ar
e
rev
enu
es in
tw
o gr
oups
of
to
grou
p di
stri
cts.
u
sed
to g
rou
p di
stri
cts.
dis
tric
ts (
e.g.
, low
- vs
. hig
h-
Req
uir
es k
now
ledg
e of
R
equ
ires
kn
owle
dge
of
w
ealt
h)
is c
alcu
late
d.
sp
ecifi
c w
eigh
ts.
sp
ecifi
c w
eigh
ts.
Cor
rela
tion
s T
he
degr
ee to
wh
ich
per
-pu
pil
Biv
aria
te
No.
N
o.
No.
rev
enu
es a
re li
nea
rly
rela
ted
to
the
char
acte
rist
ic u
nde
r
c
onsi
dera
tion
is c
alcu
late
d.
Reg
ress
ion
slo
pe
Th
e ef
fect
of
a on
e-u
nit
ch
ange
B
ivar
iate
or
N
o.
Yes,
if m
ult
iple
fact
ors
Yes,
if m
ult
iple
fact
ors
i
n t
he
char
acte
rist
ic u
nde
r m
ult
ivar
iate
are
incl
ude
d in
th
e a
re in
clu
ded
in t
he
c
onsi
dera
tion
on
per
-pu
pil
reg
ress
ion
. r
egre
ssio
n.
r
even
ues
in t
he
sch
ool d
istr
ict
is
calc
ula
ted.
Ela
stic
ity
Th
e p
erce
nta
ge e
ffec
t of
a 1
%
Biv
aria
te o
r N
o.
Yes,
if m
ult
iple
fact
ors
Yes,
if m
ult
iple
fact
ors
c
han
ge in
th
e ch
arac
teri
stic
m
ult
ivar
iate
are
incl
ude
d in
th
e a
re in
clu
ded
in
u
nde
r co
nsi
dera
tion
on
r
egre
ssio
n.
th
e re
gres
sion
.
per
-pu
pil r
even
ues
in t
he
sch
ool d
istr
ict
is c
alcu
late
d.
123456789
10111213141516171819202122232425262728293031323334353637383940
404 journal of education finance
examine the relationship between revenues and a single vertical equity factor in much the same way as bivariate measures. The correlation between per-pupil funding and a vertical equity factor indicates whether a relationship exists between them and can quantify the strength of the relationship between per-pupil funding and the characteristic in question. The bivariate measures offer important improvements in the measurement of vertical equity because they allow analysts to identify both the direction and the degree to which money is being allocated to school districts with different needs. The regression slope and elasticity approaches measure the effect of a change in a ver-tical equity factor on per-pupil revenues and also reflect the correlation between funding and a vertical equity factor. With regard to goals, only the weighted dispersion measures offer specific targets for analysts to determine whether vertical equity has been achieved. The correla-tional and regression-based metrics can indicate whether districts with more need receive more money, but by themselves they do not tell analysts whether they have allocated the proper amounts of funding for these factors. Neither the weighted dispersion measures nor the ratio analysis can easily measure the effects of multiple vertical equity factors, nor do they remove the effects of nonequity factors that also affect funding. In principle the univariate metrics could accomplish this by weighting the revenue data by an index of these factors. Similarly, districts could be grouped by such an index and then ratio analysis applied to the groupings. However, this would entail knowing exactly how revenues should be distributed for these factors. The difficulty in applying these techniques when states make revenue adjustments for multiple factors was noted by Berne and Stiefel (1984, 36): “To utilize weighted dispersion measures, question 2 (Once groups with legitimate differences are defined, how should the educational objects vary over these groups?) must be answered precisely.” In contrast, the bivariate and multivariate approaches do not require precise knowledge of the weights. Because states often target multiple vertical equity factors for per-pupil adjust-ments, and bivariate correlations and weighted dispersion measures can focus on only one vertical equity factor at a time, the results from univariate and bivariate measures could be misleading. For example, if a state provides additional funding for students who are receiving free lunch but not for those with limited English proficiency, and yet the two factors are correlated with each other, then traditional vertical equity measures would show that per-pupil funding varies with limited English proficiency. The regression approach could be used to estimate the partial effects of multiple factors on revenues; however, one would still not know whether these coefficients or elasticities are correct unless a standard is identified for comparison. The wide variations across states in their vertical equity weights show that a consensus does
123456789
10111213141516171819202122232425262728293031323334353637383940

not yet exist on what these weights should be. When districts have the ability to raise enough money to meet their intended education costs, the ideal weights might be estimated through a cost analysis. Emerging research on adequacy also promises to inform the debate as to the proper revenue adjustments needed to equalize educational outcomes between groups of students. The current vertical equity measures do not even tell policymakers whether the dollars actually given to schools agree with the intentions of the state. As noted by Baker and Duncombe (2004, 204), “While several states include explicit weights for poverty status, the effect of these weights on actual distribution of aid to high poverty districts is more difficult to predict.” This is because of the widespread use of hold-harmless provisions and other adjustments that states make for districts in their funding formulas. Because these provisions affect the per-pupil revenues given to districts, they are also likely to influence whether a state’s vertical equity adjustments work as intended. The degree to which this is true is crucial to policymakers as they consider adjusting a state’s foundation program to direct more or less funding to districts to address specific needs.
an alter native approach to measuring horizontal and vertical equity
To avoid the problems inherent in current indicators, we propose a multiple regression approach to measuring both horizontal and vertical equity. The use of multiple regression analysis to examine one or more facet of equity in school finance is not new. Garms (1979) introduced a multiple regression framework to assess fiscal neutrality and vertical equity, and since then it has become com-mon practice to use multiple regression models to examine fiscal neutrality. Perhaps the main advantage of a multiple regression approach over univariate statistics and bivariate correlations or regressions is that the researcher can iso-late progress toward multiple goals at the same time through the partial effects of the vertical equity factors on funding and remove the effects of nonequity considerations.
Vertical Equity
We begin with the vertical equity characteristics (V) that policymakers in a specific state have chosen to affect the per-pupil revenues directed toward school districts. Each of these factors is assigned a weight by the state, denoted bk
*, showing how each factor is intended to affect per-pupil revenues. These weights could be based on cost studies, a review of weights used in other states, or political negotiations between policymakers. The state may have also identified a set of district vari-ables, denoted by the matrix Z, that are used to compensate districts for other
An Alternative Approach to Measuring Equity 405
123456789
10111213141516171819202122232425262728293031323334353637383940
406 journal of education finance
factors relating to the cost of providing education. These might include the size of the district, the distribution of students across grade levels, the cost-of-living indicator for the district’s geographic region, and other considerations that are beyond the control of the district (Baker and Duncombe, 2004). Taken together, the characteristics in V and Z are used to represent how com-parable school districts are to each other with regard to the factors that affect the financial resources for providing basic education services. Two districts within a state are said to be equal if they have the same values for all variables in V and Z. It is important to note that in practice the set of factors used in foundation programs for V and Z varies greatly across states (Park, 2004). With this framework, one can examine vertical equity by estimating an equation relating the vertical equity factors in V and the cost elements in Z to per-pupil revenues, as in
Yj = a0 + Vjb + Zja + ej, (1)
where Yj = per-pupil revenues in district j, a0 = estimated intercept, b = set of estimated coefficients relating the vertical equity elements in V to per-pupil rev-enues, a = set of estimated coefficients relating the cost-related factors in Z to per-pupil revenues, and ej = random error term. In states such as Indiana where the foundation program does not allow per-pupil revenues to vary with nonequity factors, Z would not be included in the equation. Vertical equity can then be evaluated by comparing the ratio of the estimated coefficients for the kth factor in V (bk) to the dollar amounts prescribed by the state’s foundation program, as in
VEk = (bk/bk*) × 100%. (2)
Vertical equity for the kth factor is achieved when VEk = 100%. When VEk < 100%, the state is allocating fewer dollars than intended for the kth factor. It is also pos-sible, as noted by Baker and Duncombe (2004), that the state allocates more dollars than intended for vertical equity (VEk > 100%). This method can be adapted for use in many states regardless of the specific vertical equity and cost-related factors that they use. The main requirement is that all of the vertical equity and cost-related factors in the state be identified so that the estimated coefficients bk represent the partial effects of each vertical equity factor on per-pupil revenues; otherwise, these estimates will be biased, as will the resulting vertical equity measure. It is important to note that vertical equity is evaluated relative to the weights set by the state for each factor. In some instances, these weights are not based on rigorous analysis of the additional funding needed to equalize educational out-comes. The measures of vertical equity then represent how well the state is meeting
123456789
10111213141516171819202122232425262728293031323334353637383940
its established goals. This information is still valuable for helping policymakers know whether the state’s funding system is working as intended and whether the state is making progress toward these goals over time.
Horizontal Equity
We propose that the same multiple regression approach can be used for measur-ing horizontal equity. The main objection to the current measures is that districts may not be similar along all of the dimensions in V and Z that a state uses for distributing funding. In practice, identifying peer districts for the purpose of comparing per-pupil revenues to assess horizontal equity is difficult because it would be virtually impossible to find two districts with the same exact values of the student and district factors used by the state. Our proposed measure of horizontal equity is based on the residuals from Equation 1:
uj = Yj - Y̆j. (3)
By definition, the average residual will be zero. The standard deviation of the error term, su, or the standard error of the estimate,
su = u 'u/(n - k - m), (4)
represents the average amount of variability in per-pupil revenues between com-parable school districts, and horizontal equity is achieved when su = 0. Because this statistic can be affected by the units of measurement, and it can be difficult for policymakers to interpret, it may be preferable to assess horizontal equity via the percentage of variance in per-pupil revenues that is not explained by the factors in V and Z:
HE = (1 - R2) × 100%, (5)
where R2 = coefficient of determination from Equation 1. As R2 increases, there is less unexplained variability in the funding of comparable school districts, and thus horizontal equity would be improving, and vice versa. By construction, 0% ≤ HE ≤ 100%, and horizontal equity is achieved when HE = 0%. Using this approach, it becomes clear that horizontal inequity results from the combined influence of all factors (other than vertical equity or cost-related factors that are included in the foundation program) affecting the per-pupil revenues received by school districts. The inverse relationship that is built into traditional measures of horizontal and vertical equity does not exist in these metrics. It is quite possible that the two equity measures will move in the same direction if per-pupil funding becomes more closely tied to vertical equity and variations in per-pupil funding caused by factors other than V or Z are reduced. However,
An Alternative Approach to Measuring Equity 407
123456789
10111213141516171819202122232425262728293031323334353637383940
408 journal of education finance
horizontal and vertical equity could also move in opposite directions depending on how the state varies per-pupil funding according to the cost-related factors in Z and the other factors not used to define the similarity of school districts. If per-pupil funding variations increase because of aspects of the state’s founda-tion program that are unrelated to V and Z, then the unexplained variability may increase even though the factors in V may be responsible for a larger proportion of variance. Progress toward horizontal and vertical equity in each state remains an empirical question to be answered through data analysis.
education funding in indiana
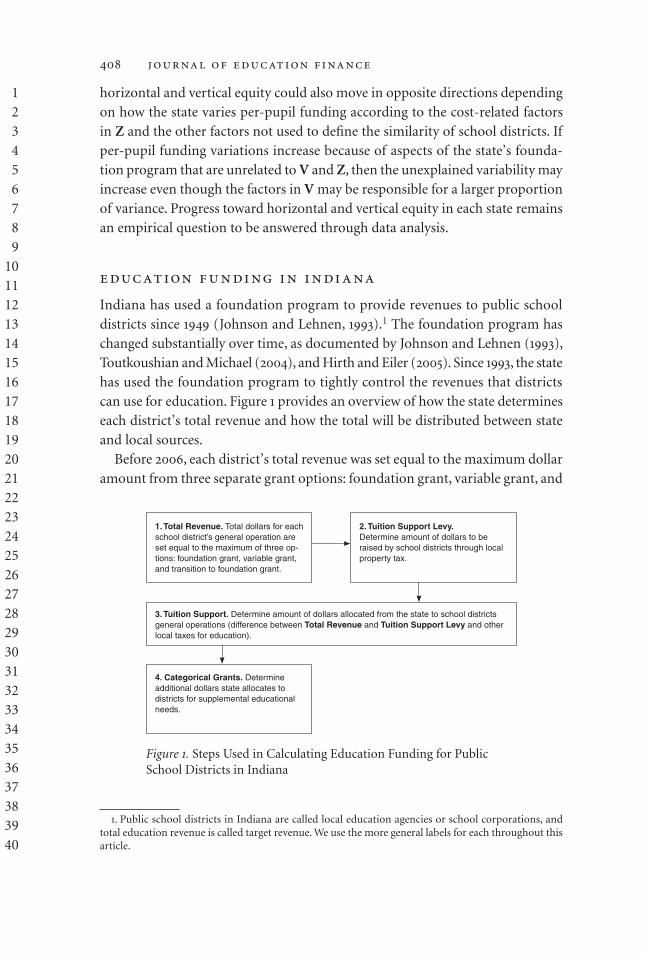
Indiana has used a foundation program to provide revenues to public school districts since 1949 (Johnson and Lehnen, 1993).1 The foundation program has changed substantially over time, as documented by Johnson and Lehnen (1993), Toutkoushian and Michael (2004), and Hirth and Eiler (2005). Since 1993, the state has used the foundation program to tightly control the revenues that districts can use for education. Figure 1 provides an overview of how the state determines each district’s total revenue and how the total will be distributed between state and local sources. Before 2006, each district’s total revenue was set equal to the maximum dollar amount from three separate grant options: foundation grant, variable grant, and
1. Public school districts in Indiana are called local education agencies or school corporations, and total education revenue is called target revenue. We use the more general labels for each throughout this article.
1. Total Revenue. Total dollars for each school district’s general operation are set equal to the maximum of three op-tions: foundation grant, variable grant, and transition to foundation grant.
2. Tuition Support Levy. Determine amount of dollars to be raised by school districts through local property tax.
3. Tuition Support. Determine amount of dollars allocated from the state to school districts general operations (difference between Total Revenue and Tuition Support Levy and other local taxes for education).
4. Categorical Grants. Determine additional dollars state allocates to districts for supplemental educational needs.
Figure 1. Steps Used in Calculating Education Funding for Public School Districts in Indiana
123456789
10111213141516171819202122232425262728293031323334353637383940
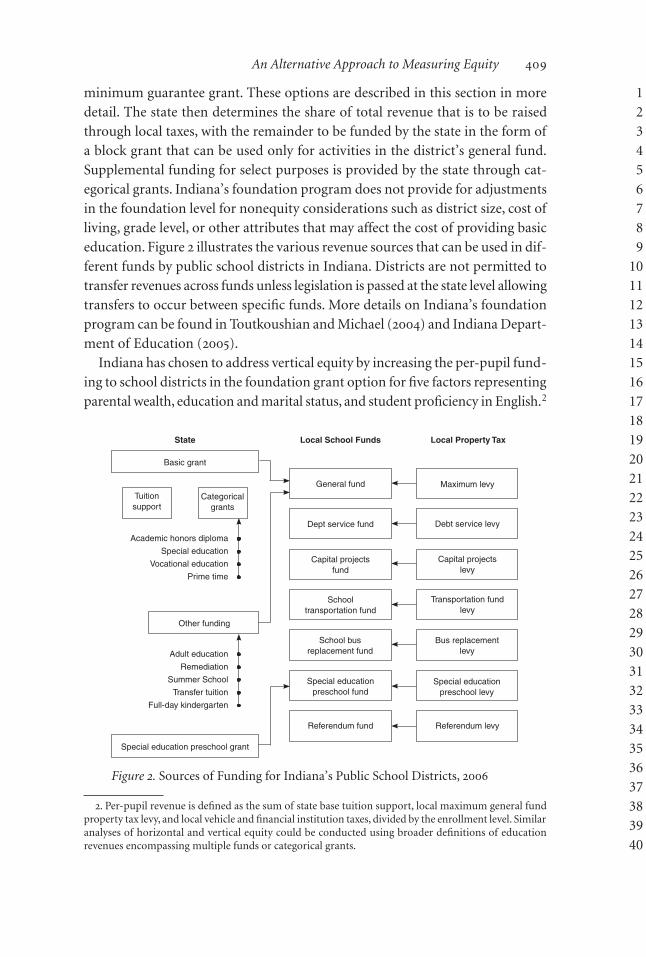
minimum guarantee grant. These options are described in this section in more detail. The state then determines the share of total revenue that is to be raised through local taxes, with the remainder to be funded by the state in the form of a block grant that can be used only for activities in the district’s general fund. Supplemental funding for select purposes is provided by the state through cat-egorical grants. Indiana’s foundation program does not provide for adjustments in the foundation level for nonequity considerations such as district size, cost of living, grade level, or other attributes that may affect the cost of providing basic education. Figure 2 illustrates the various revenue sources that can be used in dif-ferent funds by public school districts in Indiana. Districts are not permitted to transfer revenues across funds unless legislation is passed at the state level allowing transfers to occur between specific funds. More details on Indiana’s foundation program can be found in Toutkoushian and Michael (2004) and Indiana Depart-ment of Education (2005). Indiana has chosen to address vertical equity by increasing the per-pupil fund-ing to school districts in the foundation grant option for five factors representing parental wealth, education and marital status, and student proficiency in English.2
School busreplacement fund
Dept service fund
Schooltransportation fund
Special education preschool fund
Referendum fund
State Local Property Tax
Basic grant
General fund Maximum levy
Local School Funds
Debt service levy
Capital projectsfund
Capital projectslevy
Transportation fund levy
Bus replacement levy
Referendum levy
Special education preschool levy
Other funding
Special education preschool grant
Tuitionsupport
Categorical grants
Academic honors diploma
Special education
Vocational education
Prime time
Adult education
Remediation
Summer School
Transfer tuition
Full-day kindergarten
Figure 2. Sources of Funding for Indiana’s Public School Districts, 2006
2. Per-pupil revenue is defined as the sum of state base tuition support, local maximum general fund property tax levy, and local vehicle and financial institution taxes, divided by the enrollment level. Similar analyses of horizontal and vertical equity could be conducted using broader definitions of education revenues encompassing multiple funds or categorical grants.
An Alternative Approach to Measuring Equity 409
123456789
10111213141516171819202122232425262728293031323334353637383940

410 journal of education finance
Accordingly, all vertical equity adjustments are included in the general funds of school districts. In the foundation grant option, total revenue (TRj) is computed by multiplying the state’s minimum foundation level (MinFL) established by the legislature by a weighted average of enrollments or average daily membership from the previous 5 years (wADMjt) and the complexity index (CIjt) for each school district:
TR(foundation grant)jt = MinFLt × wADMjt × CIjt. (6)
The CI is a linear combination of the five factors that the state has chosen for additional funding to help achieve vertical equity: the percentage of adults in the district with less than a high school education (NoHSj), the percentage of single-parent families in the district (OnePj), the percentage of families in the district with dependent children living in poverty (Povj), the percentage of children in each district receiving free lunch at school (FreeLj), and the percentage of children in each district with limited English proficiency (LEPj). The complexity index (CIj) is then computed as follows:
CIj = 1 + b1*NoHSj + b2
*OnePj + b3*Povj + b4
*FreeLj + b5*LEPj, (7)
with b1* through b5
* representing the weights assigned to each vertical equity fac-tor.3 Although the original weights were selected based on the canonical correla-tions between the first three factors and measures of school failure, the weights for all factors have been revised and updated each biennium by the state legislature as part of the budget deliberation process.4
Table 3 provides more details on the specific calculations used to obtain the values for each vertical equity factor in 2005, 2006, and 2007. For example, in 2005 the legislature set a per-pupil weight for the percentage of single-parent families in the district of $530. This weight implies that the district should receive an ad-ditional $530 per year for each child who is thought to come from a single-parent family. The CI weight of 0.1213 for this factor is found by dividing the per-pupil dollar adjustment by the minimum foundation level in the state’s foundation program ($4,368 in 2005).
3. An additional upward adjustment is made to the complexity index when the resulting value for a school district exceeds 1.25. The adjustments generally range between 0.02 and 0.04 and affected only 8 of the 292 school districts in Indiana. As a result, the weights shown here are slightly lower than what would be true if the additional adjustment could be taken into account. More details on this adjustment can be found in the 2005–07 Digest of Public School Finance in Indiana (Indiana Department of Educa-tion, 2005).
4. Between 1993 and 2003, the at-risk index was used to provide additional funding to school districts for the vertical equity factors NoHS, OneP, and Pov. In 2003, the at-risk index was replaced by the complex-ity index, which provided for adjustments in per-pupil funding for the three factors in the at-risk index plus LEP and FreeL. The original factors and weights in the at-risk index were developed by Gridley and Peters (1987). More details on the development of the state’s at-risk index can be found in Vesper (1995). Both manuscripts are available from the authors upon request.
123456789
10111213141516171819202122232425262728293031323334353637383940
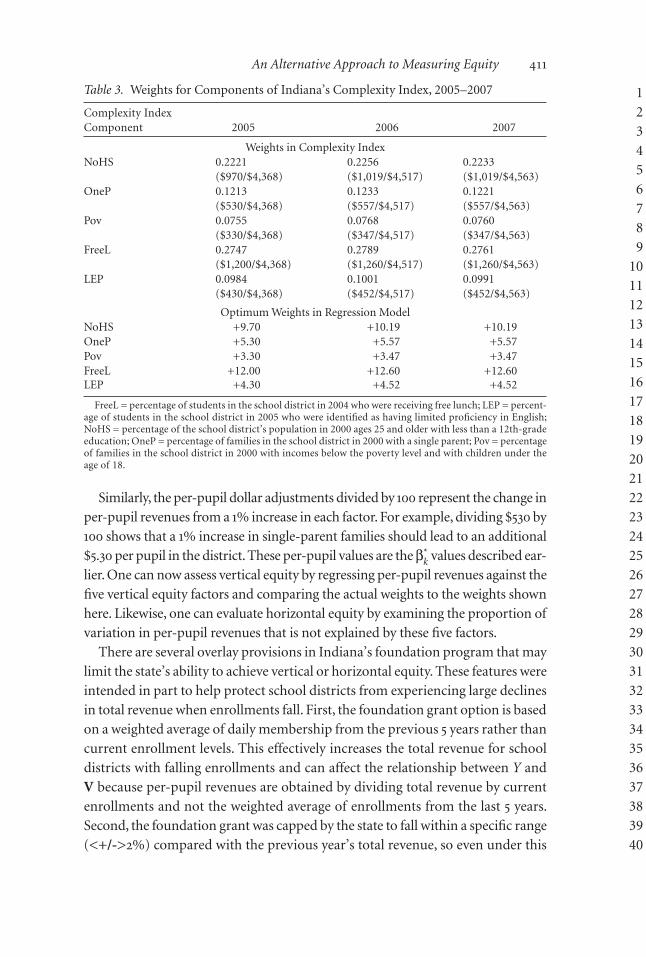
Similarly, the per-pupil dollar adjustments divided by 100 represent the change in per-pupil revenues from a 1% increase in each factor. For example, dividing $530 by 100 shows that a 1% increase in single-parent families should lead to an additional $5.30 per pupil in the district. These per-pupil values are the bk
* values described ear-lier. One can now assess vertical equity by regressing per-pupil revenues against the five vertical equity factors and comparing the actual weights to the weights shown here. Likewise, one can evaluate horizontal equity by examining the proportion of variation in per-pupil revenues that is not explained by these five factors. There are several overlay provisions in Indiana’s foundation program that may limit the state’s ability to achieve vertical or horizontal equity. These features were intended in part to help protect school districts from experiencing large declines in total revenue when enrollments fall. First, the foundation grant option is based on a weighted average of daily membership from the previous 5 years rather than current enrollment levels. This effectively increases the total revenue for school districts with falling enrollments and can affect the relationship between Y and V because per-pupil revenues are obtained by dividing total revenue by current enrollments and not the weighted average of enrollments from the last 5 years. Second, the foundation grant was capped by the state to fall within a specific range (<+/->2%) compared with the previous year’s total revenue, so even under this
Table 3. Weights for Components of Indiana’s Complexity Index, 2005–2007
Complexity Index Component 2005 2006 2007
Weights in Complexity IndexNoHS 0.2221 0.2256 0.2233 ($970/$4,368) ($1,019/$4,517) ($1,019/$4,563)OneP 0.1213 0.1233 0.1221 ($530/$4,368) ($557/$4,517) ($557/$4,563)Pov 0.0755 0.0768 0.0760 ($330/$4,368) ($347/$4,517) ($347/$4,563)FreeL 0.2747 0.2789 0.2761 ($1,200/$4,368) ($1,260/$4,517) ($1,260/$4,563)LEP 0.0984 0.1001 0.0991 ($430/$4,368) ($452/$4,517) ($452/$4,563)
Optimum Weights in Regression ModelNoHS +9.70 +10.19 +10.19OneP +5.30 +5.57 +5.57Pov +3.30 +3.47 +3.47FreeL +12.00 +12.60 +12.60LEP +4.30 +4.52 +4.52
FreeL = percentage of students in the school district in 2004 who were receiving free lunch; LEP = percent-age of students in the school district in 2005 who were identified as having limited proficiency in English; NoHS = percentage of the school district’s population in 2000 ages 25 and older with less than a 12th-grade education; OneP = percentage of families in the school district in 2000 with a single parent; Pov = percentage of families in the school district in 2000 with incomes below the poverty level and with children under the age of 18.
An Alternative Approach to Measuring Equity 411
123456789
10111213141516171819202122232425262728293031323334353637383940

412 journal of education finance
option per-pupil revenues may not vary in direct proportion to CI. The cap also means that a school district with a dramatic increase in the number of children receiving free lunch, for example, may not receive additional revenue from this option to meet all of the prescribed per-pupil funding needs for children receiv-ing free lunch. Third, and most importantly, in 2005 the total revenue for districts could be determined by any of three grant options. The second option, known as the vari-able grant, allows the district to calculate total revenue by multiplying last year’s per-pupil revenue by its current enrollment level:
TR(variable grant)jt = TRjt-1 × ADMjt/ADMjt-1 (8)
This option tends to favor school districts with rising enrollments. Although total and per-pupil revenues move in the same direction under this option, changes in the CI would not affect total revenues. Finally, the minimum guarantee option computes total revenue by increasing last year’s total revenues by a percentage (rt) determined by the legislature each year:
TR(min guarantee)jt = TRjt-1 × (1 + rt) (9)
This is used most often by school districts with falling enrollments. Note that this provision means that total revenue and per-pupil revenue may not move in the same direction under this option, and as with the variable grant option, total revenue is not affected by changes in the CI. Total revenue for each school district is based on the maximum of these three options:
TRjt = Max[TR(foundation grant)jt, TR(variable grant)jt, TR(min guarantee)jt] (10)
Taken together, per-pupil revenues may vary across school districts for rea-sons other than differences in the vertical equity factors used in the CI. Only the foundation grant directly takes vertical equity into account in estimating the per-pupil resources needed for education, although the other two options may reflect to some extent past levels of funding received by districts for meeting their vertical equity needs. Although this feature of Indiana’s foundation program may protect school districts from large declines in total revenues caused by enrollment changes, it may limit the state’s progress toward horizontal and vertical equity. This is important for the state, given that the percentage of school districts rely-ing on the minimum guarantee has increased dramatically, from 27% in 1999 to nearly 80% by 2005. As fewer school districts have received their funding based on the foundation option, policymakers in Indiana have become concerned that the state may be losing ground in achieving vertical equity because additional dollars are not being
123456789
10111213141516171819202122232425262728293031323334353637383940

directly allocated on the basis of the CI. In response, in 2005 Indiana eliminated the minimum guarantee option and allowed districts with large per-pupil revenue changes from 2005 to transition to the foundation option over a 6-year period. The state also increased the per-pupil weights in the CI in 2006 and 2007, as shown in Table 3. Policymakers in the state hoped that the changes, taken together, would lead to more education money being allocated to districts with more need. Despite the elimination of the minimum guarantee option, the state’s new foundation program also contained several overlay provisions. The foundation grant used a weighted average of past enrollments, and the variable grant was capped at 99% of the previous year’s value. Likewise, many districts are in the transition period to the foundation grant. These remaining provisions are likely to lead to unexplained variations in per-pupil revenues for school districts and affect the state’s ability to achieve horizontal and vertical equity.
horizontal and vertical equity in indiana
Equity in school funding has been and continues to be an important issue for policymakers in Indiana. As noted by Johnson and Lehnen (1993), questions about the fairness of education funding and taxation first arose in the early 1970s and culminated with a class action lawsuit raised by more than 40 school districts (Lake Central School Corporation et al. v. State of Indiana et al., 1987). Studies by Byron (1978), Wood et al. (1990), White (1991), Johnson and Lehnen (1993), Hirth (1994), Theobald (2001), and Hirth and Eiler (2005) have all focused on various forms of equity in public school funding for the state. In addition, since the mid-1990s the state has conducted annual studies of how well its foundation program is achieving a number of goals, including vertical and horizontal equity (Toutkoushian and Michael, 2006). We now use state-provided data on public school districts in Indiana to demon-strate how horizontal and vertical equity can be assessed using these new measures and determine whether the changes in the state’s foundation program in 2006 led to gains in horizontal or vertical equity. The dataset contains information on enrollments, per-pupil revenues, and the five vertical equity factors for the years 2005, 2006, and 2007 for all 292 public school districts in the state. The per-pupil revenues represent dollars in each district’s general fund for education divided by current enrollments. The variables NoHS, Pov, and OneP were taken from the 2000 Census, and FreeL and LEP were obtained from each school district in 2004 and 2005, respectively. We begin by examining several traditional metrics of horizontal and vertical equity. Descriptive statistics on selected variables are shown in Table 4. On aver-age, school districts in Indiana received $5,457 per pupil in 2005, with the average
An Alternative Approach to Measuring Equity 413
123456789
10111213141516171819202122232425262728293031323334353637383940

414 journal of education finance
increasing modestly (less than 2%) for 2006 and 2007. The changes in the state’s funding formula reduced the variability in per-pupil funding by about 6% between 2005 and 2007, as measured by both the standard deviation and the range. State policymakers might conclude that the changes in the funding formula have led to modest gains in horizontal equity. There is wide variability across Indiana school districts in terms of their vertical equity needs. For example, the percentage of students receiving free lunch varies from 2% to 76%. In Table 5, we calculated the ratios of per-pupil revenues for districts that were above and below the median for each of the five CI components and show how these changed between 2005 and 2007. We found that the ratios for four of the five vertical equity factors were greater than one and increased over this period, showing that districts with greater student need receive more money on average and that the gaps are increasing. The ratios were highest and most similar for the factors Pov, NoHS, and FreeL. However, policymakers cannot tell whether the ratios are high enough to conclude that vertical equity has been achieved, nor can they determine whether the ratio for any particular factor is affected by the correlations between vertical equity factors. The results were more mixed for students with limited English proficiency, where districts with higher concentrations received slightly less money (<1%) than districts with lower per-centages, and the ratio of per-pupil revenues was fairly constant through 2007.
Table 4. Descriptive Statistics
Standard Variable Mean Deviation Minimum Maximum Range
Per-pupil revenues in 2005 (Y) $5,457.17 $576.07 $4,623.44 $8,594.64 $3,971.20Per-pupil revenues in 2006 (Y) $5,551.46 $556.39 $4,822.73 $8,636.71 $3,813.98Per-pupil revenues in 2007 (Y) $5,629.10 $540.04 $4,936.30 $8,651.58 $3,715.28NoHS 18.37% 6.67% 2.90% 61.40% 58.50%OneP 22.82% 7.59% 8.90% 64.16% 55.26%Pov 8.38% 4.91% 1.10% 32.10% 31.00%FreeL 20.00% 11.08% 1.92% 76.43% 74.51%LEP 2.01% 3.99% 0.00% 23.81% 23.81%
Note: Data are for 292 public school districts in Indiana. The data for the variables NoHS, OneP, and Pov were obtained from the 2000 U.S. Census. The data for the variables FreeL and LEP were obtained from each school district for the most current years available (2004 for FreeL and 2005 for LEP). Per-pupil revenues for each year represent the total revenues designated for the general fund of each school district through the state’s foundation program, divided by actual or projected enrollments for the fall semester of each year. FreeL = percentage of students in the school district in 2004 who were receiving free lunch; LEP = percent-age of students in the school district in 2005 who were identified as having limited proficiency in English; NoHS = percentage of the school district’s population in 2000 ages 25 and older with less than a 12th-grade education; OneP = percentage of families in the school district in 2000 with a single parent; Pov = percentage of families in the school district in 2000 with incomes below the poverty level and with children under the age of 18.
123456789
10111213141516171819202122232425262728293031323334353637383940
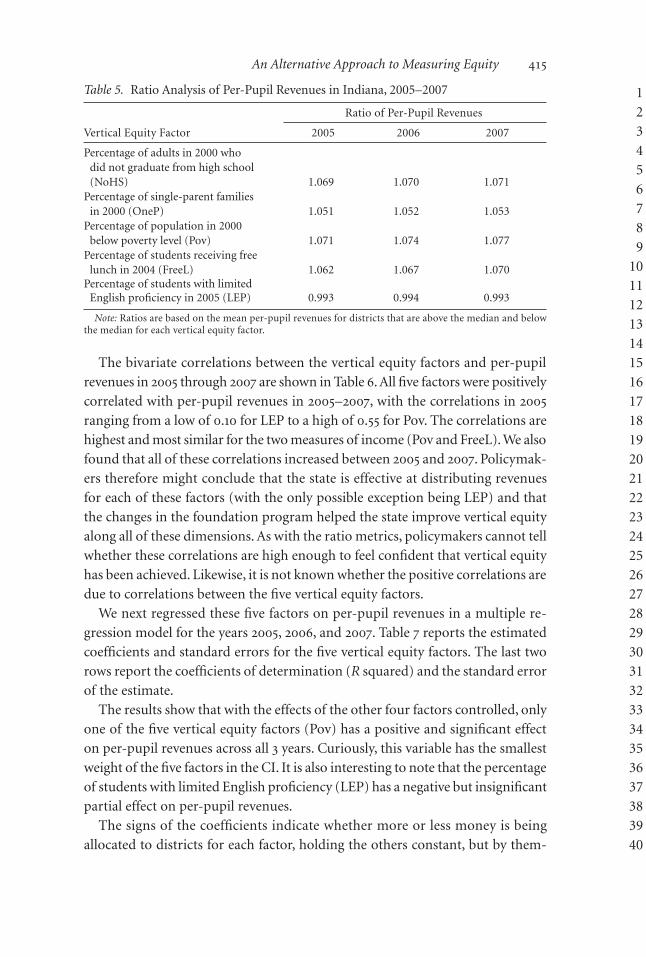
The bivariate correlations between the vertical equity factors and per-pupil revenues in 2005 through 2007 are shown in Table 6. All five factors were positively correlated with per-pupil revenues in 2005–2007, with the correlations in 2005 ranging from a low of 0.10 for LEP to a high of 0.55 for Pov. The correlations are highest and most similar for the two measures of income (Pov and FreeL). We also found that all of these correlations increased between 2005 and 2007. Policymak-ers therefore might conclude that the state is effective at distributing revenues for each of these factors (with the only possible exception being LEP) and that the changes in the foundation program helped the state improve vertical equity along all of these dimensions. As with the ratio metrics, policymakers cannot tell whether these correlations are high enough to feel confident that vertical equity has been achieved. Likewise, it is not known whether the positive correlations are due to correlations between the five vertical equity factors. We next regressed these five factors on per-pupil revenues in a multiple re-gression model for the years 2005, 2006, and 2007. Table 7 reports the estimated coefficients and standard errors for the five vertical equity factors. The last two rows report the coefficients of determination (R squared) and the standard error of the estimate. The results show that with the effects of the other four factors controlled, only one of the five vertical equity factors (Pov) has a positive and significant effect on per-pupil revenues across all 3 years. Curiously, this variable has the smallest weight of the five factors in the CI. It is also interesting to note that the percentage of students with limited English proficiency (LEP) has a negative but insignificant partial effect on per-pupil revenues. The signs of the coefficients indicate whether more or less money is being allocated to districts for each factor, holding the others constant, but by them-
Table 5. Ratio Analysis of Per-Pupil Revenues in Indiana, 2005–2007
Ratio of Per-Pupil Revenues
Vertical Equity Factor 2005 2006 2007
Percentage of adults in 2000 who did not graduate from high school (NoHS) 1.069 1.070 1.071Percentage of single-parent families in 2000 (OneP) 1.051 1.052 1.053Percentage of population in 2000 below poverty level (Pov) 1.071 1.074 1.077Percentage of students receiving free lunch in 2004 (FreeL) 1.062 1.067 1.070Percentage of students with limited English proficiency in 2005 (LEP) 0.993 0.994 0.993
Note: Ratios are based on the mean per-pupil revenues for districts that are above the median and below the median for each vertical equity factor.
An Alternative Approach to Measuring Equity 415
123456789
10111213141516171819202122232425262728293031323334353637383940
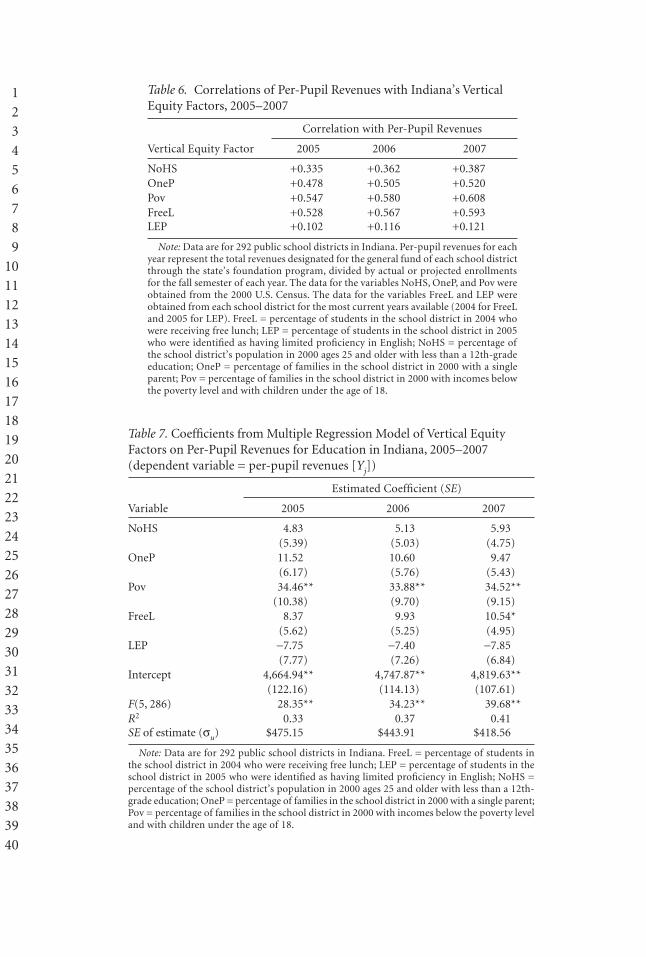
Table 6. Correlations of Per-Pupil Revenues with Indiana’s Vertical Equity Factors, 2005–2007
Correlation with Per-Pupil Revenues
Vertical Equity Factor 2005 2006 2007
NoHS +0.335 +0.362 +0.387OneP +0.478 +0.505 +0.520Pov +0.547 +0.580 +0.608FreeL +0.528 +0.567 +0.593LEP +0.102 +0.116 +0.121
Note: Data are for 292 public school districts in Indiana. Per-pupil revenues for each year represent the total revenues designated for the general fund of each school district through the state’s foundation program, divided by actual or projected enrollments for the fall semester of each year. The data for the variables NoHS, OneP, and Pov were obtained from the 2000 U.S. Census. The data for the variables FreeL and LEP were obtained from each school district for the most current years available (2004 for FreeL and 2005 for LEP). FreeL = percentage of students in the school district in 2004 who were receiving free lunch; LEP = percentage of students in the school district in 2005 who were identified as having limited proficiency in English; NoHS = percentage of the school district’s population in 2000 ages 25 and older with less than a 12th-grade education; OneP = percentage of families in the school district in 2000 with a single parent; Pov = percentage of families in the school district in 2000 with incomes below the poverty level and with children under the age of 18.
Table 7. Coefficients from Multiple Regression Model of Vertical Equity Factors on Per-Pupil Revenues for Education in Indiana, 2005–2007 (dependent variable = per-pupil revenues [Yj])
Estimated Coefficient (SE)
Variable 2005 2006 2007
NoHS 4.83 5.13 5.93 (5.39) (5.03) (4.75)OneP 11.52 10.60 9.47 (6.17) (5.76) (5.43)Pov 34.46** 33.88** 34.52** (10.38) (9.70) (9.15)FreeL 8.37 9.93 10.54* (5.62) (5.25) (4.95)LEP -7.75 -7.40 -7.85 (7.77) (7.26) (6.84)Intercept 4,664.94** 4,747.87** 4,819.63** (122.16) (114.13) (107.61)F(5, 286) 28.35** 34.23** 39.68**R2 0.33 0.37 0.41SE of estimate (su) $475.15 $443.91 $418.56
Note: Data are for 292 public school districts in Indiana. FreeL = percentage of students in the school district in 2004 who were receiving free lunch; LEP = percentage of students in the school district in 2005 who were identified as having limited proficiency in English; NoHS = percentage of the school district’s population in 2000 ages 25 and older with less than a 12th-grade education; OneP = percentage of families in the school district in 2000 with a single parent; Pov = percentage of families in the school district in 2000 with incomes below the poverty level and with children under the age of 18.
123456789
10111213141516171819202122232425262728293031323334353637383940

selves do not signify whether vertical equity has been achieved. The estimated weights clearly are very different from what has been prescribed by the state in its foundation program. For example, although the funding formula called for districts in 2005 to receive an additional $1,200 for each child who was receiv-ing free lunch, only $837 in additional revenue was allocated specifically for this purpose. Likewise, the state appears to give more than 10 times the prescribed amount of funding to districts for each child estimated to reside in a household that is below the poverty level ($3,446 allocated, $330 prescribed). In Table 8 we present the new measures of horizontal and vertical equity that follow from the results in Table 7. The first two rows show the alternative measures of horizontal equity: the proportion of deviations in per-pupil revenues that is not explained by the five vertical equity factors (1 - R2) and the standard error of the estimate, which represents the average variation in per-pupil revenues for comparable school districts. The last five rows contain the ratios of the estimated coefficients for each vertical equity factor to the weight for each variable estab-lished by the state. Beginning with horizontal equity, the changes made in Indiana’s foundation program have led to much improvement in horizontal equity. In only 2 years, the unexplained variation between school districts decreased from 67% to 59%, and the standard error of the estimate decreased by 12%, from $475 in 2005 to $419 in 2007. However, the results for vertical equity are mixed. On one hand, the state appears to be far from reaching its goals for three of the five factors (OneP, Pov, and LEP) included in the CI, and the vertical equity factors still account for less than half of the variations in per-pupil revenues across districts. At the same time, all five of the indicators have made progress toward the goal of 100% from 2005 to 2007.
Table 8. Vertical and Horizontal Equity Measures for Indiana, 2005–2007
Equity Measures 2005 2006 2007 Equity Goal
Horizontal Equity(1 - R2) × 100% 67% 63% 59% 0%SE of estimate $475.15 $443.91 $418.56 $0.00
Vertical EquityNoHS 49.8% 50.3% 58.2% 100%OneP 217.4% 190.3% 170.0% 100%Pov 1,044.2% 976.4% 994.8% 100%FreeL 69.8% 78.8% 83.7% 100%LEP -180.2% -163.7% -173.7% 100%
FreeL = percentage of students in the school district in 2004 who were receiving free lunch; LEP = percent-age of students in the school district in 2005 who were identified as having limited proficiency in English; NoHS = percentage of the school district’s population in 2000 ages 25 and older with less than a 12th-grade education; OneP = percentage of families in the school district in 2000 with a single parent; Pov = percentage of families in the school district in 2000 with incomes below the poverty level and with children under the age of 18.
An Alternative Approach to Measuring Equity 417
123456789
10111213141516171819202122232425262728293031323334353637383940
418 journal of education finance
Several interesting observations emerge from a comparison of the results from the new equity approaches with those from traditional metrics. In both instances the metrics suggested that there were gains in horizontal equity. However, the gains were larger using the new metrics than they were based on the standard deviation and range. For vertical equity, the traditional measures showed that the state was effective in allocating more money to districts for at least four of the five vertical equity factors. The new metrics showed that the allocations for three of the five factors differed greatly from the targets set by the state. However, both approaches concluded that there were modest gains in vertical equity over this time period.
summary and discussion
In this article we introduced an alternative approach for examining both horizontal and vertical equity. This procedure can help analysts avoid some of the problems they may encounter when using only univariate and bivariate statistics to examine equity, especially in states that make revenue adjustments based on multiple stu-dent or district needs. We showed that it is no longer necessary to assume that all school districts have equal needs when computing a measure of horizontal equity. All that is needed is to identify the vertical equity and cost-related factors used by the state in question to allocate revenues and the per-pupil weights attached to the vertical equity factors in the funding formula. The measure of horizontal equity is then determined based on the residuals from the model relating these factors to per-pupil revenues. This formulation shows that horizontal and vertical inequity are influenced by the extent to which a state’s foundation program permits per-pupil revenues to vary for reasons unrelated to vertical equity or cost-related factors. In particular, provisions in state aid programs that protect school districts from large declines in revenues are likely to be an important source of horizontal and vertical inequity. The results for Indiana suggest that the removal of several such provisions has led to gains in horizontal equity and, to some extent, vertical equity. As noted earlier, the state’s foundation program still contains several provisions that, in effect, introduce inequity into the system. To help improve progress toward vertical equity, the state should consider mak-ing substantial changes in the weights for Pov and LEP, and more modest changes in the weights for NoHS, FreeL, and OneP. These changes could be combined with further reductions in the other provisions in the foundation program that also affect per-pupil revenues. Policymakers in the state would have to decide whether the benefits of keeping these provisions offsets the costs in terms of horizontal and vertical inequity. The state might also consider moving the vertical equity adjustments from the total revenue calculation into a categorical grant as a means
123456789
10111213141516171819202122232425262728293031323334353637383940

of improving vertical and horizontal equity. In this way, the amount of money assigned for vertical equity factors would not be affected by the option used by school districts for their total revenue. As shown in Figure 2, Indiana currently uses categorical funding to provide revenues to school districts for purposes such as special education and vocational education. Such a change probably would result in a significant increase in school funding unless other parameters in the foundation program, such as the minimum foundation level, were adjusted ac-cordingly. It is important to remember that these measures of horizontal and vertical equity define equity relative to the goals and objectives set by each state. In some states, the weights may be based on estimates of the funding needed to equalize educational outcomes (Duncombe and Yinger, 1999; Reschovsky and Imazeki, 2000; Bifulco, 2005). In other states, the weights may reflect the subjective opinions of policymakers and be affected by financial constraints. Accordingly, one must use caution when attempting to use this approach to compare states on horizontal and vertical equity. Nonetheless, this provides valuable information to policymakers as to how well the state’s foundation program is working at achieving the targets that have been set by the state and whether progress is being made over time in achieving these goals. The approach we describe here for vertical equity can also be used when the ideal weights are known by using these quantities as the b* values rather than the actual weights in the funding formula. Although the procedure described in this article for measuring vertical and horizontal equity can be applied in almost any state, information on the appro-priate vertical equity and cost-related factors is needed for use in the analysis. This information may not always be readily available or easily discernible from reports describing a state’s funding formula. Finally, it should be recognized that the movement toward a multiple regression approach for examining vertical and horizontal equity would increase the difficulty of explaining findings to a more general audience. Many policymakers are not well versed in statistical techniques and therefore would have difficulty understanding equity measures that are based on multivariate statistics. Because the conclusions and policy recommendations reached from using the wrong measure could be incorrect, however, it is clearly preferable to select a measurement approach that is more valid for the task at hand.
ReferencesBaker, B. 2001. “Balancing Equity for Students and Taxpayers: Evaluating School Finance Reform in
Vermont.” Journal of Education Finance 26(4): 437–462.Baker, B., and W. Duncombe. 2004. “Balancing District Needs and Student Needs: The Role of Econo-
mies of Scale Adjustments and Pupil Need Weights in School Finance Formulas.” Journal of Education Finance 29(3): 195–222.
An Alternative Approach to Measuring Equity 419
123456789
10111213141516171819202122232425262728293031323334353637383940

420 journal of education finance
Baker, B. D., and R. Friedman-Nimz. 2003. “Gifted Children, Vertical Equity, and State School Finance Policies and Practices.” Journal of Education Finance 28(4): 523–556.
Berne, R. 1977, October. Equity and Public Education: Conceptual Issues of Measurement. Unpublished report, Graduate School of Public Administration, New York University, New York.
Berne, R. 1978, July. A Methodological Assessment of Educational Equality and Wealth Measures. A report to the School Finance Cooperative, Public Policy Research Institute, Graduate School of Public Ad-ministration, New York University.
Berne, R., and L. Stiefel. 1979. “Concepts of Equity and Their Relationship to State School Finance Plans.” Journal of Education Finance 5: 114–115.
Berne, R., and L. Stiefel. 1984. The Measurement of Equity in School Finance: Conceptual, Methodological, and Empirical Dimensions. Baltimore: Johns Hopkins University Press.
Bifulco, R. 2005. “District-Level Black–White Funding Disparities in the United States, 1987–2002.” Journal of Education Finance 31(2): 172–194.
Bundt, J., and S. Leland. 2001. “Wealthy or Poor: Who Receives and Who Pays? A Closer Look at Measures of Equity in Iowa School Finance.” Journal of Education Finance 26(4): 397–413.
Burruss v. Wilkerson, 310 F. Supp. 572 Virg. (1969), aff’d., 397 U.S. 44 (1970).Byron, R. 1978. “Equalization of Education Opportunity in Indiana.” Journal of Education Finance 3(4):
432–442.Carey, K. 2004. The Funding Gap 2004. Washington, DC: The Education Trust. Retrieved January 23,
2006, from http://www2.edtrust.org/NR/rdonlyres/30B3C1B3-3DA6-4809-AFB9-2DAACF11CF88/0 /funding2004.pdf.
Costrell, R. 2005. “Equity v. Equity CHECKED.” Education Next. Retrieved February 3, 2006, from http://www.educationnext.org/20053/77.html.
Crampton, F. 1991. “The Measurement of Efficiency and Equity in Oregon School Finance: The Beginning Stages.” Journal of Education Finance 16: 348–359.
Duncombe, W., and J. Johnston. 2004. “The Impacts of School Finance Reform in Kansas: Equity Is in the Eye of the Beholder.” In J. Yinger (ed.), Helping Children Left Behind: State Aid and the Pursuit of Educational Equity. Cambridge, MA: MIT Press, pp. 147–194.
Duncombe, W., and J. Yinger. 1999. “Performance Standards and Educational Cost Indexes: You Can’t Have One Without the Other.” In H. F. Ladd, R. Chalk, and J. S. Hansen (eds.), Equity and Adequacy in Education Finance: Issues and Perspectives. Washington, DC: National Academy Press, pp. 260–297.
Duncombe, W., and J. Yinger. 2005. “How Much More Does a Disadvantaged Student Cost?” Economics of Education Review 24: 513–532.
Education Trust. 2005. The Funding Gap 2005. Retrieved January 23, 2006, from http://www2.edtrust.org/NR/rdonlyres/31D276EF-72E1-458A-8C71-E3D262A4C91E/0/FundingGap2005.pdf.
Federal Register 42(251). (1977). Washington, DC: GPO, pp. 65524–65527.Garms, W. 1979. “Measuring the Equity of School Finance Systems.” Journal of Education Finance 4(4):
415–435.Goldhaber, D., and K. Callahan. 2001. “Impact of the Basic Education Program on Educational Spending
and Equity in Tennessee.” Journal of Education Finance 26(4): 415–435.Gridley, B., and R. Peters. 1987. Report to Indiana Department of Education At-Risk Functional Group.
Unpublished manuscript.Hirth, M. 1994. “A Multistate Analysis of School Finance Issues and Equity Trends in Indiana, Illinois, and
Michigan, 1982–1992: The Implications for 21st Century School Finance Policies.” Journal of Education Finance 20(2): 163–190.
Hirth, M. A., and E. Eiler. 2005. “Horizontal and Vertical Equity Analysis of Indiana’s 2001 Reward-for-Effort Formula.” Journal of Education Finance 30(4): 382–398.
Indiana Department of Education. 2005. 2005–07 Digest of Public School Finance in Indiana. Retrieved January 23, 2006, from http://www.doe.state.in.us/publications/financedigest.html.
Johns, R., and K. Alexander. 1971. Alternative Programs for Financing Education. Gainesville, FL: National Educational Finance Project.
Johns, R., and R. Salmon. 1971. Status and Impact of Educational Finance Programs, vol. 4. Gainesville, FL: National Education Finance Project, pp. 133–192.
Johnson, C., and R. Lehnen. 1993. “Reforming Indiana’s School Finance Formula, 1973–1990: A Case of Unanticipated Outcomes.” Journal of Education Finance 18(3): 264–280.
Lake Central School Corporation et al. v. State of Indiana et al., Newton Circuit Court, Indiana, Cause No. 56 Col-8703-CP-81 (1987).
McInnis v. Shapiro, 293 F. Supp. 327 (N.O. Ill. 1968) aff’d.
123456789
10111213141516171819202122232425262728293031323334353637383940

Odden, A., and L. Picus. 2004. School Finance: A Policy Perspective, 3rd ed. Boston: McGraw-Hill.Olsen, L. 2005. “Quality Counts 2005 Examines Changes in School Finance.” Education Week 24(16): 12.Paquette, J. 2004. “Interdivision Fiscal Equity in Saskatchewan, 1985–2000: An Analysis of Spending Equity
and Wealth Neutrality.” Journal of Education Finance 30(2): 139–175.Park, J. 2004. “More Different Than Alike: State Strategies for Funding Education.” Journal of School
Business Officials 16(2): 14–26.Picus, L. O., A. Odden, and M. Fermanich. 2004. “Assessing the Equity of Kentucky’s SEEK Formula: A
10-Year Analysis.” Journal of Education Finance 29(4): 315–336.“Quality Counts 2005.” (2005). Education Week, 24(17).Reschovsky, A., and Imazeki, J. 2000. “Achieving Educational Adequacy Through School Finance Reform.”
Consortium for Policy Research in Education Research Report Series RR-045, Graduate School of Education, University of Pennsylvania, Philadelphia.
Rubenstein, R., D. Doering, and L. Gess. 2000. “The Equity of Public Education Funding in Georgia, 1988–1996.” Journal of Education Finance 26(2): 187–208.
Serrano v. Priest, 96 Cal. Rptr. 601, 487 P.2d 1241, 5 Cal. 3d 584 (1971).Theobald, N. 2001. “Indiana’s Performance in Meeting Its School Funding Goals.” Journal of School
Business Management 13(2): 27–31.Toutkoushian, R., and R. Michael. 2004. Indiana’s Foundation Program: A Conceptual Introduction. Bloom-
ington: Center for Evaluation and Education Policy, Indiana University.Toutkoushian, R., and R. Michael. 2006. Indiana’s School Funding Formula Impact Study for 2005. Bloom-
ington: Center for Evaluation and Education Policy, Indiana University.Vesely, R. S., and F. E. Crampton. 2004. “An Assessment of Vertical Equity in Four States: Addressing Risk
Factors in Education Funding Formulas.” Journal of Education Finance 30 (2): 111–122.Vesper, N. 1995. Options for Indiana’s At-Risk Index. Bloomington: Indiana Education Policy Center,
Indiana University.White, R. 1991. “Indiana Public School State Formula Grants: Fair or Unfair?” Journal of Education Fi-
nance 17(2): 215–223.Wood, R., D. Honeyman, and V. Bryers. 1990. “Equity in Indiana School Finance: A Decade of Local Levy
Property Tax Restrictions.” Journal of Education Finance 16(1): 83–92.
An Alternative Approach to Measuring Equity 421
123456789
10111213141516171819202122232425262728293031323334353637383940