Embed Size (px)
Citation preview

As yield-constrained markets continue to frustrate income-focused investors, we designed an Alternative Income strategy to enhance and diversify portfolio income and total return sources.
• High, tax-advantaged monthly income and total-return potential
• Potentially lower-volatility approach
• Historically low sensitivity to traditional assets
• Convenience of one unified NAV, and one 1099 at tax time
The ChallengeLow yields across traditional income sources. Low-interest-rate policies from central banks worldwide have kept global bond income scarce for more than a decade. U.S. Treasury yields remain near all-time lows and more than $12 trillion of global fixed income is negative yielding.
Heightened macro uncertainties. The spread of COVID-19 has reversed global growth and driven extreme levels of market volatility. In this uncertain climate, it may be useful to expand investments into alternative, low-correlated asset classes to help navigate short-term market shocks.
High or dubious valuations. Valuations in most traditional bond markets have been pushed to new heights, while valuation multiples on stocks, particularly those not tied to real assets, are highly unreliable at present as analysts struggle for earnings clarity.
An Alternative Income SolutionAn alternative income strategy can help address all three of these challenges. Income producing alternative assets (some of which are tax-advantaged) have the potential to produce higher-than-average returns compared to traditional fixed income securities, while expanding portfolio diversification to help enhance overall risk-adjusted return potential.
An Alternatives Solution for Expanding Income Potential
Multi Strategy

2
An Alternatives Solution for Expanding Income Potential
Five Diversifying Asset Classes, One PortfolioCohen & Steers takes a balanced approach in its alternative income strategy, bringing together five higher-yielding, low-correlated asset classes in one professionally managed solution. Each asset class adds historically diversifying characteristics to the portfolio, with different segments tending to outperform during various types of market climates.
• Preferred and corporate debt securities: high income potential from securities of largely investment-grade issuers; generally perform well across various stages of the economic cycle.
• Global real estate securities: provided dividend growth that has outpaced inflation; generally strong across various stages of the economic cycle
• Global listed infrastructure: add income and total return potential with defensive attributes; historically strong, consistent performance in most types of markets.
• Midstream energy and master limited partnerships (MLPs): offer high income, fee-based cash flows with monopolistic positions; tend to be strong in periods of rising energy volumes.
• Natural resource equity securities: add inflation-protection traits; have typically outperformed underlying commodities early cycle.
This multi-strategy portfolio brings Cohen & Steers combined specialist expertise from across the firm’s listed real assets and alternative income investment teams.
Building a Well-balanced Alternative Income SolutionTarget Weight (+/- 10% Range)
Global Real EstateSecurities
Global ListedInfrastructure
Midstream Energy and Master Limited
Partnerships (MLPs)
Natural ResourceEquity Securities
15% 15% 15% 10%45%
Preferred and Corporate Debt Securities
Interest income taxed at 37%
for top earners
Alternative Income O�ers Attractive Income From Tax-Advantaged Asset ClassesMany Alternative Income Assets Provide Tax Benefits
MunicipalBonds
TreasuryBonds
Broad U.S.Equities
PreferredSecurities
Global Real Estate
Midstream Equities and MLPs
Global ListedInfrastructure
Natural ResourceEquities
AlternativeIncome Blend
Before TaxesAlternative Income Yields(1) After Taxes (Income > $612k)(2) After Taxes (Income > $612k)(2)Before TaxesTraditional Yields(1)
6.2 5.0
20.7
4.5 5.57.8
4.3 3.5
20.7
3.4 4.26.5
3.0 0.6 2.33.0 1.70.4
Alternative Income Portfolio Composition
At March 31, 2020. Source: Cohen & Steers, ICE BofA.Data quoted represents past performance, which is no guarantee of future results. The information presented above does not reflect the performance of any fund or other account managed or serviced by Cohen & Steers, and there is no guarantee that investors will experience the type of performance reflected above. An investor cannot invest directly in an index and index performance does not reflect the deduction of any fees, expenses or taxes. (1) Yield to maturity shown for Preferred Securities, Municipal Bonds and Treasury Bonds. Dividend yield shown for all other asset classes. (2) Assumes taxation at the highest marginal Federal income tax rates of 37% for taxable interest income, 29.6% for QBI, 20% for QDI, 20% for capital gains with an additional 3.8% Medicare surcharge on all tax rates. State and local taxes are not included in these calculations. See pages 6 and 7 for index associations and additional disclosures, including after-tax assumptions.

3
Portfolio Benefits1. High, tax-advantaged monthly income and total-return potential. By spreading investments across
multiple sources of alternative income outside of traditional asset classes, the portfolio can pursue a steadier stream of above-average income, with opportunities for attractive levels of capital appreciation potential as well. Many of these alternative income securities tend to generate predictable cash flows due to the long-term nature of their assets. In addition, the strategy includes tax-advantaged assets, such as preferreds, MLPs and REITs, which helps investors potentially keep more of their portfolio earnings.
2. Lower volatility. Because these alternative asset class exhibit low correlations to one another, combining them together in one portfolio has historically offered a better balance of risk/reward—significantly reducing overall long-term volatility while capturing attractive levels of return. This can provide a potentially smoother investment experience that helps avoid the emotion often tied to higher levels of short-term volatility, particularly for investors who may be unfamiliar with alternative investments.
3. Low sensitivity to traditional assets. The strategy can also help strengthen portfolio diversification. An alternative income blend has historically exhibited a low sensitivity to both traditional stocks and bonds. This may help enhance a portfolio’s overall risk-adjusted returns long term.
At March 31, 2020. Source: Barclays, Bloomberg, Dow Jones, FTSE, S&P, Thomson Reuters Datastream and Cohen & Steers.
Data quoted represents past performance, which is no guarantee of future results. The information presented above does not reflect the performance of any fund or other account managed or serviced by Cohen & Steers, and there is no guarantee that investors will experience the type of performance reflected above. An investor cannot invest directly in an index and index performance does not reflect the deduction of any fees, expenses or taxes. Return reflects compound annualized return. Risk reflects annualized standard deviation of monthly returns. There is no guarantee that any historical trend illustrated above will be repeated in the future, and there is no way to predict precisely when such a trend will begin. The views and opinions are as of the date of publication and are subject to change without notice.
U.S. Stocks represented by S&P 500 Index. Bonds represented by ICE BofA U.S. 710 Year Treasury Index. Preferred Securities represented by ICE BofA Fixed Rate Preferred Securities Index through December 31, 1996, 50% ICE BofA Fixed Rate Preferred Securities Index and 50% ICE BofA Capital Securities Index through December 31, 2016, 60% ICE BofA US IG Institutional Capital Securities Index, 30% ICE BofA Core Fixed Rate Preferred Securities Index and 10% Bloomberg Barclays Developed Market USD Contingent Capital Index through 12/31/2018, and 60% ICE BofA US IG Institutional Capital Securities Index, 20% ICE BofA Core Fixed Rate Preferred Securities Index and 20% Bloomberg Barclays Developed Market USD Contingent Capital Index for periods thereafter. Real Estate represented by FTSE Nareit Equity REIT Index through December 1989 and FTSE EPRA/ Nareit Developed Index thereafter. Midstream Equities and MLPs represented by Datastream Pipelines through December 31, 1995 and The Alerian MLP Index for periods thereafter. Natural Resource Equities represented by 50/50 Blend of Datastream World Oil &Gas and Datastream World Basic Materials through December 2002; S&P Global Natural Resources Index thereafter. Infrastructure represented by 50/ 50 Blend of Datastream World Pipelines and Datastream World Gas, Water, & MultiUtilities through December 2002; Dow Jones Brookfield Global Infrastructure Index thereafter. Alternative Income Blend represented by 45% weight to Preferred Securities, 15% weight to Global Real Estate, 15% weight to Midstream Equities and MLPs, 15% weight to Global Listed Infrastructure and 10% weight to Natural Resource Equities. (1) Standard Deviation is a measure of the dispersion of a set of data from its mean, also known as historical volatility and is used by investors as a gauge for the amount of expected volatility. (2) Sharpe Ratio is a measure of risk adjusted return, calculated by subtracting the risk free rate from a return and dividing that result by the standard deviation. The higher the Sharpe Ratio, the higher the risk adjusted return. Standard deviation is a measure for variation of price of a financial instrument over time.
An Optimized Balance of Risk/Reward Exposures Annualized Nominal Returns and Standard Deviation (1990–Q1 2020)
Rewa
rd (%
annu
alize
d nom
inal re
turn)
Risk (% standard deviation)
U.S. Bonds(%)
U.S. Stocks(%)
Preferred Securities
(%)
Global Real Estate
(%)
Midstream Equities and
MLPs(%)
Natural Resource Equities
(%)
Global Listed Infrastructure
(%)
Alternative Income Blend
(%)
Annualized Nominal ReturnRisk (% standard deviation) (1)
Sharpe Ratio(2)
Alternative IncomeBlend
U.S. BondsMidstream Energy & MLPs
Global ListedInfrastructure
Preferred Securities
Natural ResourceEquities
Global RealEstate
U.S. Stocks
6.6 9.0 6.4 8.5 4.2 5.2 8.9 7.16.1 14.5 9.0 16.7 20.8 18.2 14.2 10.80.64 0.49 0.44 0.42 0.18 0.22 0.49 0.45
4%
6%
8%
10%
12%
6% 8% 10% 12% 14% 16% 18% 20%

4
An Alternatives Solution for Expanding Income Potential
Portfolio applicationsThe strategy offers a convenient way to introduce a broad range of low- to non-correlated alternative income asset classes. With no minimum initial investment (excepting a $100,000 minimum for Class I shares), an allocation to the strategy can fit comfortably into well-diversified portfolios of any size to help meet a range of investment needs.
Sample Portfolio Approach: How Alternative Income May Fit In
Cash
Bonds
Alternative Income(Fixed Income)
Alternative Income(Equities)
Source: Cohen & Steers.
Stocks
18% Alternative Income Assets
Tax Advantaged• Offers access to many tax advantaged
sources of income
Completion Vehicle• Cohen & Steers Alternative Income Fund can
be a completion vehicle for your income model
• A lower fee product to keep your client’s costs in check
Simplified• One NAV
• One 1099
45%
3%
7%
11%
34%
Sample CIO Moderate Yield Focused Model
AddEasily introduce an alternativesallocation into a portfolio without any current exposures.
ComplementHelp round out existing holdingsfor portfolios that already ownalternative assets.
ConsolidateStreamline multiple alternativeincome holdings into one portfoliowith one net asset value (NAV).
At March 31, 2020. Based on Cohen & Steers expectations.
Data quoted represents past performance, which is no guarantee of future results. There is no guarantee that any historical trend illustrated above will be repeated in the future, and there is no way to predict precisely when such a trend will begin. The information presented above does not reflect the performance of any fund or other account managed or serviced by Cohen & Steers, and there is no guarantee that investors will experience the type of performance reflected above.
Potential for Low Sensitivity to Bonds Rolling 3 Year Beta to ICE BofAML 7-10 Year Treasury Index
Potential for Low Sensitivity to Stocks Rolling 3 Year Beta to S&P 500 Index
-1.4
-1.0
-0.6
-0.2
0.2
0.6
1.0
7/31/2
011
1/31/2
012
7/31/2
012
1/31/2
013
7/31/2
013
1/31/2
014
7/31/2
014
1/31/2
015
7/31/2
015
1/31/2
016
7/31/2
016
1/31/2
017
7/31/2
017
1/31/2
018
7/31/2
018
1/31/2
019
7/31/2
019
1/31/2
020
Fixed
Inco
me B
eta
0.0
0.2
0.4
0.6
0.8
1.0
7/31/2
011
1/31/2
012
7/31/2
012
1/31/2
013
7/31/2
013
1/31/2
014
7/31/2
014
1/31/2
015
7/31/2
015
1/31/2
016
7/31/2
016
1/31/2
017
7/31/2
017
1/31/2
018
7/31/2
018
1/31/2
019
7/31/2
019
1/31/2
020
Equit
y Beta
5
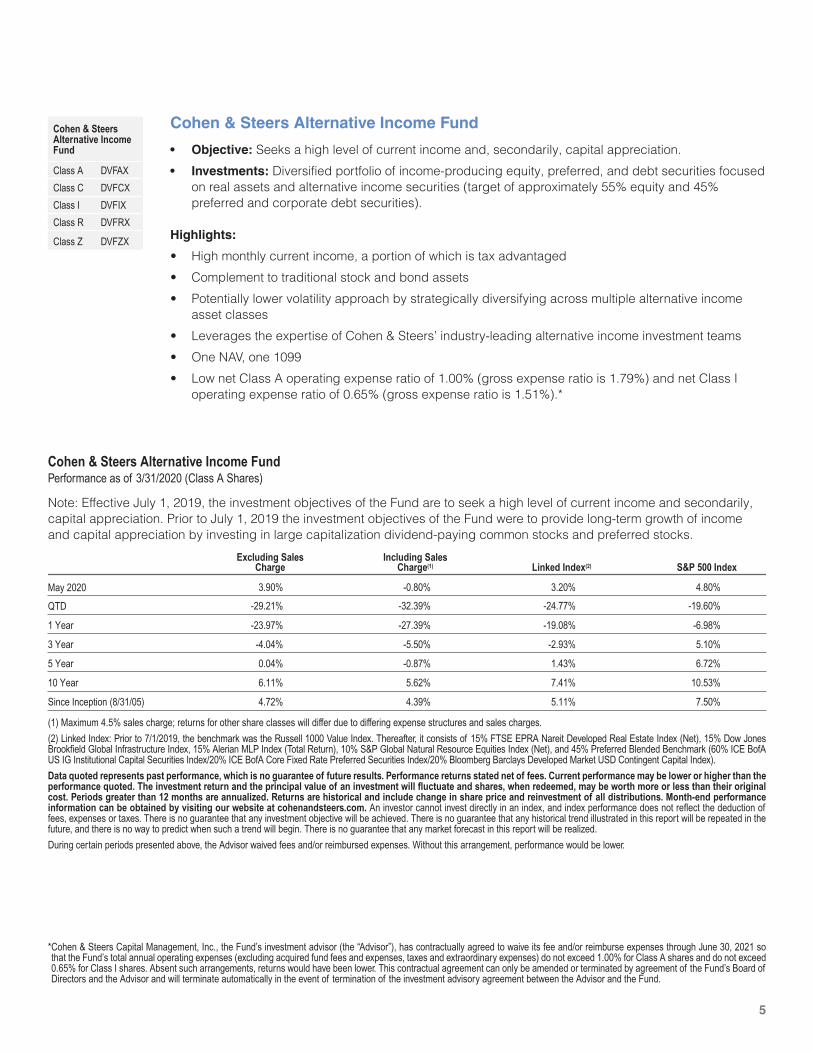
(1) Maximum 4.5% sales charge; returns for other share classes will differ due to differing expense structures and sales charges.
(2) Linked Index: Prior to 7/1/2019, the benchmark was the Russell 1000 Value Index. Thereafter, it consists of 15% FTSE EPRA Nareit Developed Real Estate Index (Net), 15% Dow Jones Brookfield Global Infrastructure Index, 15% Alerian MLP Index (Total Return), 10% S&P Global Natural Resource Equities Index (Net), and 45% Preferred Blended Benchmark (60% ICE BofA US IG Institutional Capital Securities Index/20% ICE BofA Core Fixed Rate Preferred Securities Index/20% Bloomberg Barclays Developed Market USD Contingent Capital Index).
Data quoted represents past performance, which is no guarantee of future results. Performance returns stated net of fees. Current performance may be lower or higher than the performance quoted. The investment return and the principal value of an investment will fluctuate and shares, when redeemed, may be worth more or less than their original cost. Periods greater than 12 months are annualized. Returns are historical and include change in share price and reinvestment of all distributions. Month-end performance information can be obtained by visiting our website at cohenandsteers.com. An investor cannot invest directly in an index, and index performance does not reflect the deduction of fees, expenses or taxes. There is no guarantee that any investment objective will be achieved. There is no guarantee that any historical trend illustrated in this report will be repeated in the future, and there is no way to predict when such a trend will begin. There is no guarantee that any market forecast in this report will be realized.
During certain periods presented above, the Advisor waived fees and/or reimbursed expenses. Without this arrangement, performance would be lower.
Cohen & Steers Alternative Income FundPerformance as of 3/31/2020 (Class A Shares)
Excluding Sales Charge
Including Sales Charge(1) Linked Index(2) S&P 500 Index
QTD
1 Year
3 Year
5 Year
10 Year
Since Inception (8/31/05)
Note: Effective July 1, 2019, the investment objectives of the Fund are to seek a high level of current income and secondarily, capital appreciation. Prior to July 1, 2019 the investment objectives of the Fund were to provide long-term growth of income and capital appreciation by investing in large capitalization dividend-paying common stocks and preferred stocks.
-29.21% -32.39% -24.77% -19.60%
May 2020 3.90% -0.80% 3.20% 4.80%
-23.97% -27.39% -19.08% -6.98%
-4.04% -5.50% -2.93% 5.10%
0.04% -0.87% 1.43% 6.72%
6.11% 5.62% 7.41% 10.53%
4.72% 4.39% 5.11% 7.50%
Cohen & Steers Alternative Income Fund
• Objective: Seeks a high level of current income and, secondarily, capital appreciation.
• Investments: Diversified portfolio of income-producing equity, preferred, and debt securities focused on real assets and alternative income securities (target of approximately 55% equity and 45% preferred and corporate debt securities).
Highlights:
• High monthly current income, a portion of which is tax advantaged
• Complement to traditional stock and bond assets
• Potentially lower volatility approach by strategically diversifying across multiple alternative income asset classes
• Leverages the expertise of Cohen & Steers’ industry-leading alternative income investment teams
• One NAV, one 1099
• Low net Class A operating expense ratio of 1.00% (gross expense ratio is 1.79%) and net Class I operating expense ratio of 0.65% (gross expense ratio is 1.51%).*
Cohen & Steers Alternative Income Fund
Class A DVFAX
Class C DVFCX
Class I DVFIX
Class R DVFRX
Class Z DVFZX
* Cohen & Steers Capital Management, Inc., the Fund’s investment advisor (the “Advisor”), has contractually agreed to waive its fee and/or reimburse expenses through June 30, 2021 so that the Fund’s total annual operating expenses (excluding acquired fund fees and expenses, taxes and extraordinary expenses) do not exceed 1.00% for Class A shares and do not exceed 0.65% for Class I shares. Absent such arrangements, returns would have been lower. This contractual agreement can only be amended or terminated by agreement of the Fund’s Board of Directors and the Advisor and will terminate automatically in the event of termination of the investment advisory agreement between the Advisor and the Fund.

6
An Alternatives Solution for Expanding Income Potential
Index Definitions. An investor cannot invest directly in an index and index performance does not reflect the deduction of any fees, expenses or taxes.Alternative Income Blend: 45% Preferred Securities, 15% Global Real Estate, 15% Midstream Equities and MLPs, 15% Global Listed Infrastructure and 10% Natural Resource Equities.Preferred Securities: Represented by 60% ICE BofA US IG Institutional Capital Securities Index, 20% ICE BofA Core Fixed Rate Securities Index, and 20% Bloomberg Barclays Developed Market USD Contingent Capital Index. Preferred Securities after-tax calculations assumes preferred securities income is taxed at the respective qualified dividend rate and marginal tax rate on a 65/35 blended basis.Municipal Bonds: ICE BofA Municipal Master Index (Credit quality: AA-) tracks the performance of U.S. dollar-denominated investment-grade tax-exempt debt publicly issued by U.S. states and territories, and their political subdivisions, in the U.S. domestic market. Municipal Bonds’ income is exempt from federal taxation.Global Real Estate: FTSE EPRA/NAREIT Developed Index is an unmanaged market-capitalization-weighted total-return index, which consists of publicly traded equity REITs and listed property companies from developed markets and is net of dividend withholding taxes. Global Real Estate after-tax calculations assumes income is 22% QDI, 35% QBI, 8% capital gains, 11% ROC and 24% non-qualified income.Global Listed Infrastructure: Dow Jones Global Infrastructure Index is a float-adjusted market-capitalization-weighted index that measures performance of globally domiciled companies that derive more than 70% of their cash flows from infrastructure lines of business. Global Listed Infrastructure after-tax calculations assumes income is 100% QDI.Natural Resource Equities: S&P Global Natural Resources Index includes the largest publicly-traded companies in natural resources and commodities businesses that meet specific investability requirements and is net of dividend withholding taxes. Natural Resource Equities after-tax calculations assumes income is 100% QDI.Midstream: The Alerian MLP Index is a capped, float-adjusted, capitalization-weighted index, whose constituents represent approximately 85% of total MLP float-adjusted market capitalization.Midstream Equities and MLPs’ after-tax calculations assumes all income is ROC.Equities: The S&P 500 Index is an unmanaged index of 500 large-capitalization stocks that is frequently used as a general measure of U.S. stock market performance. Equities’ after-tax calculations assumes income is 100% QDI. The Federal Reserve 10-Year Treasury Constant Maturity Rate is published by the Federal Reserve Board based on average yield of a range of Treasury securities, all adjusted to the equivalent of a 10-year maturity. Yields on Treasury securities at constant maturity are determined by the U.S. Treasury from the daily yield curve. Treasury Bonds are fully taxable at the federal level at the taxable interest income rate of 37%.

7
Important Disclosures Data quoted represents past performance, which is no guarantee of future results. This commentary is for informational purposes, and reflects prevailing conditions and our judgment as of this date, which are subject to change without notice. We consider the information in this commentary to be accurate, but we do not represent that it is complete or should be relied upon to determine if an investment is appropriate. There is no guarantee that any market forecast set forth in this commentary will be realized. Investors should consult their tax, legal and investment professionals with respect to their individual circumstances. This material should not be relied upon as investment advice, does not constitute a recommendation to buy or sell a security or other investment and is not intended to predict or depict performance of any investment. This material is not being provided in a fiduciary capacity and is not intended to recommend any investment policy or investment strategy or take into account the specific objectives or circumstances of any investor. The information presented above does not reflect the performance of any fund or other account managed or serviced by Cohen & Steers, and there is no guarantee that investors will experience the type of performance reflected above. Please consider the investment objectives, risks, charges and expenses of any Cohen & Steers fund carefully before investing. A summary prospectus and prospectus containing this and other information may be obtained by visiting cohenandsteers.com or by calling 800 330 7348. Please read the summary prospectus and prospectus carefully before investing. Diversification does not assure a profit nor protect against loss. Risks of Investing in an Alternative Income Strategy. An alternative income strategy is subject to the risk that its asset allocations may not achieve the desired risk-return characteristic, underperform other similar investment strategies or cause an investor to lose money. In general, the risks of investing in preferred securities are similar to those of investing in bonds, including credit risk and interest-rate risk. As nearly all preferred securities have issuer call options, call risk and reinvestment risk are also important considerations. In addition, investors face equity like risks, such as deferral or omission of distributions, subordination to bonds and other more senior debt, and higher corporate governance risks with limited voting rights. Risks associated with preferred securities are different from risks inherent with other investments. In particular, in the event of bankruptcy, a company’s preferred securities are senior to common stock but subordinated to all other types of corporate debt. Risks of investing in REITs are similar to those associated with direct investments in real estate securities, including (i) property values may fall due to increasing vacancies, declining rents resulting from economic, legal, tax, political or technological developments, lack of liquidity, limited diversification and sensitivity to certain economic factors such as interest rate changes and market recessions. Securities of natural resource companies may be affected by events occurring in nature, inflationary pressures and international politics. Global infrastructure securities may be subject to regulation by various governmental authorities, such as rates charged to customers, operational or other mishaps, tariffs and changes in tax laws, regulatory policies and accounting standards. Foreign securities involve special risks, including currency fluctuation and lower liquidity. An investment in MLPs involves risks that differ from a similar investment in equity securities, such as common stock, of a corporation. Holders of equity securities issued by MLPs have the rights typically afforded to limited partners in a limited partnership. As compared to common shareholders of a corporation, holders of such equity securities have more limited control and limited rights to vote on matters affecting the partnership. There are certain tax risks associated with an investment in equity MLP units. MLPs are subject to significant regulation and may be adversely affected by changes in the regulatory environment, including the risk that an MLP could lose its tax status as a partnership.Cohen & Steers Capital Management, Inc. (Cohen & Steers) is a registered investment advisory firm that provides investment management services to corporate retirement, public and union retirement plans, endowments, foundations and mutual funds. Cohen & Steers U.S. registered open-end funds are distributed by Cohen & Steers Securities, LLC, and are available only to U.S. residents.
About Cohen & SteersCohen & Steers is a global investment manager specializing in liquid real assets, including real estate securities, listed infrastructure and natural resource equities, as well as preferred securities and other income solutions. Founded in 1986, the firm is headquartered in New York City, with offices in London, Hong Kong and Tokyo.

cohenandsteers.com Advisors & Investors: 800 330 7348Institutions & Consultants: 212 822 1620
Publication Date: June 2020 Copyright © 2020 Cohen & Steers, Inc. All rights reserved.
We believe accessing investment opportunities around the world requires local knowledge and insight into specialized and regional markets. Cohen & Steers maintains a global presence through the following offices:
Americas
NEW YORK
Corporate Headquarters280 Park Avenue, 10th Floor New York, New York 10017
Phone 212 832 3232 Fax 212 832 3622
Europe
LONDON
Cohen & Steers UK Limited50 Pall Mall, 7th Floor London SW1Y 5JH United Kingdom
Phone +44 207 460 6350
DUBLIN
Cohen & Steers Ireland Limited77 Sir John Rogerson’s Quay, Block C Grand Canal Docklands, Dublin 2 D02 VK60, Ireland
Phone +353 1 592 1780
Asia Pacific
HONG KONG
Cohen & Steers Asia LimitedSuites 1201–02, Champion Tower 3 Garden Road Central, Hong Kong
Phone +852 3667 0080
TOKYO
Cohen & Steers Japan, LLCPacific Century Place, 16F 1-11-1 Marunouchi Chiyoda-ku Tokyo 100–6216 Japan
Phone +81 3 4530 4710
MP875 0620