Embed Size (px)
Citation preview
INTERNATIONAL ELECTRONIC JOURNAL OF MATHEMATICS EDUCATION
e-ISSN: 1306-3030. 2020, Vol. 15, No. 3, em0584
https://doi.org/10.29333/iejme/7840
Article History: Received 17 February 2020 Revised 2 March 2020 Accepted 2 March 2020
© 2020 by the authors; licensee Modestum Ltd., UK. Open Access terms of the Creative Commons Attribution 4.0
International License (http://creativecommons.org/licenses/by/4.0/) apply. The license permits unrestricted use, distribution,
and reproduction in any medium, on the condition that users give exact credit to the original author(s) and the source,
provide a link to the Creative Commons license, and indicate if they made any changes.
OPEN ACCESS
An Analysis for the Qualitative Improvement of Education and
Learning based on the Way of Learner Errors in Descriptive
Questions
Michiko Tsubaki 1*, Wataru Ogawara 1, Kenta Tanaka 1
1 The University of Electro-Communications, JAPAN
* CORRESPONDENCE: [email protected]
ABSTRACT
This study proposes and examines an analytical method with the aim of improving the quality of
education and learning by situating the answers to full descriptive questions in probability and
statistics to make variables of learners’ comprehension of learned content as answer
characteristics, based on actual student mistakes. First, we proposed and examined a method for
extracting answer characteristics from the answers to the questions in probability and statistics as
variables. Second, we proposed a method for obtaining answer characteristics to accurately
describe learners’ comprehension of each problem and indicate learning and educational policies
for learners to improve learning by using regression trees. In addition, the relationship between
learners’ general ability and answer characteristics was visualized in an item characteristic chart to
indicate the general comprehension of the learners. Further, the relationship between learners’
learning strategy and answer characteristics was structuralized using Bayesian network models,
and effective learning strategies for both learners as a whole and individual learners were
extracted and evaluated towards the qualitative improvement of their comprehension using
probabilistic reasoning. Our findings showed that the effectiveness of a learning strategy varies
with each concept treated in a given problem; with the degree of basical or applied answer
characteristics, indicating that the required learning strategy varies according to a given learner’s
stage of learning. Moreover, the improvement of hours studying dispersion for both mid-term
and final examinations was revealed as effective for a wide range of subjects.
Keywords: learning and education in probability and statistics, descriptive questions, extraction
of answer characteristics, error analysis, Bayesian network analysis, probabilistic reasoning
INTRODUCTION
“Error analysis” is an analysis of how and why learners make an error, and has been applied in a wide
range of fields, including simple questions involving four arithmetic operations. Rushton (2018) studied the
effect of the teaching and learning mathematics through error analysis. Mathematics education pedagogy has
relied on teachers, demonstrating correctly worked example exercises. However, in recent years, combining
the use of correctly worked exercises with error analysis has led researchers to posit increased mathematical
understanding. Durkin and Rittle-Johnson (2012) studied the effectiveness of using incorrect examples to
support learning about decimal magnitude.
In addition, in the discipline of probability and statistics, various misconceptions exist, as concluded by
Kahneman and Tversky (1982), Sulistyani (2019) showed that there were 4 stages of student errors in
Tsubaki et al.
2 / 27 http://www.iejme.com
inferential statistics. 1) Errors in comprehension occurred because students could not read statistics tables or
read outputs in the questions. 2) Transformation errors occurred because students were not appropriate in
applying/selecting the type of test statistics used or writing hypotheses. 3) Process skill errors occurred
because students were less careful in calculating and inability to interpret the results of calculations. 4) Errors
in the encoding stage occurred because students did not answer correctly or inappropriately in drawing
conclusions in hypothesis testing. These results point to properties peculiar to the content of learning in the
fields of probability and statistics, suggesting a possible trend in the ways learners of probability and statistics
make errors. It would therefore be useful to analyze the information related to the learning experiences of
other students who made errors in a similar fashion.
Accordingly, this study proposes the extraction of answer characteristics as variables, based on the forms
of error that characterize differences in the degree of learners’ comprehension using full descriptive questions
related to probability and statistics. Then, using these variables, we perform a regression tree analysis on
learners’ comprehension of the study content for each problem, as well as an analysis of an item characteristic
chart to estimate general comprehension, and a relational analysis between the comprehension and study
strategy using Bayesian networks. In so doing, furthermore we propose a method for extracting effective
learning policies or learning strategies for learners as a whole, as well as individual learners, through a
probabilistic reasoning based on Bayesian networks.
OVERVIEW OF DATA FOR ANALYSIS
This study used students’ mid-term and final examination results in a “Probability and Statistics” course
offered to sophomore students enrolled in M Engineering Division in J Department at D University, as well
as the results of a questionnaire survey on learning situation that was administered during the course to
collect data for analysis upon students’ consent. One hundred-four students took the mid-term examination,
and 99 took the final examination. Of all students who took both examinations and answered the questionnaire
survey, consent for use of the data was obtained from 89; these data were then analyzed for this study. In a
Probability and Statistics course, the key concepts and items based on the textbook were explained and
exercises were implemented during the lesson. Participants received feedback during the exercises through
which they were learning probability theory and conducting statistical estimation and testing.
Questionnaire Survey Design
The questionnaire survey was designed to meet the goal of this study based on items concerning self-
efficacy, intrinsic value, cognitive strategy and self-regulation, in accordance with the approach adopted by
Pintrich and De Groot(1990), to examine the level of learning situation, by such that the questionnaire items
conformed to purpose of the study. Further, questionnaire items concerning study habit, study time, and the
type of materials used for study were also created as important measures in the study of probability and
statistics (Table 1).
INT ELECT J MATH ED
http://www.iejme.com 3 / 27
Problems in the Mid-term Examination
The mid-term examination consisted of four full descriptive problems on the probability theories that
students had learned in the first half of the course. Students could use a calculator during the examination,
but were prohibited from bringing in textbooks or associated materials.
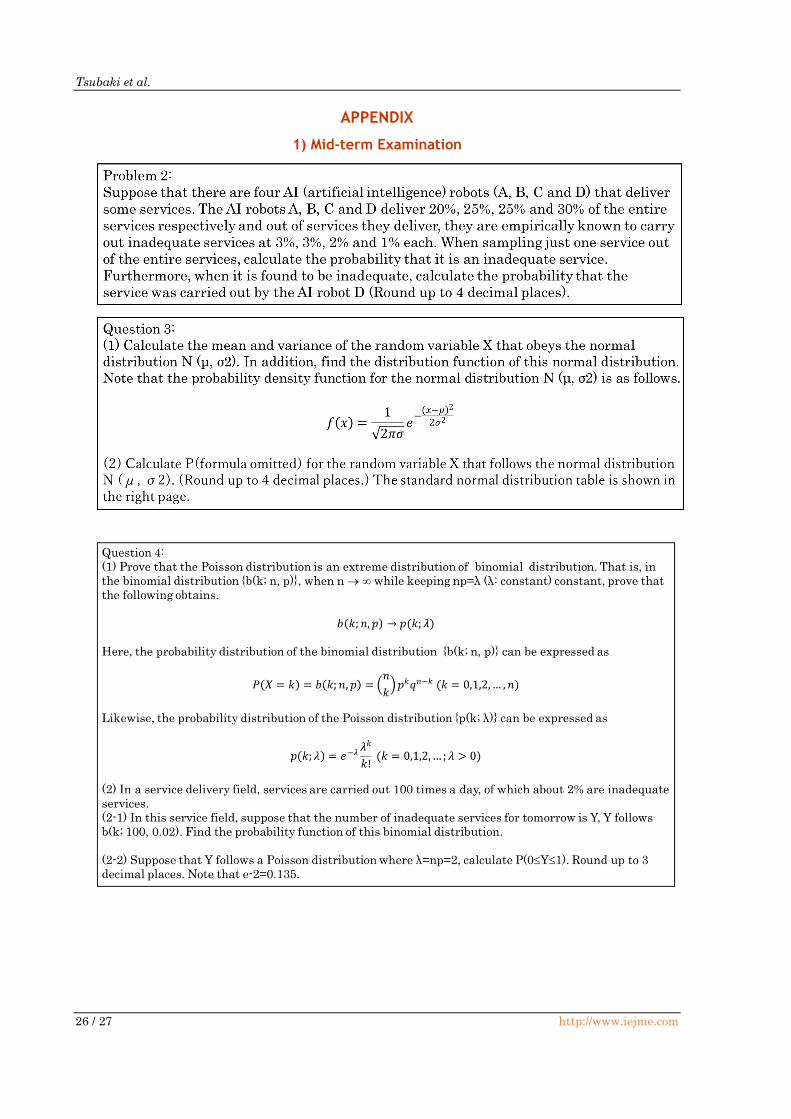
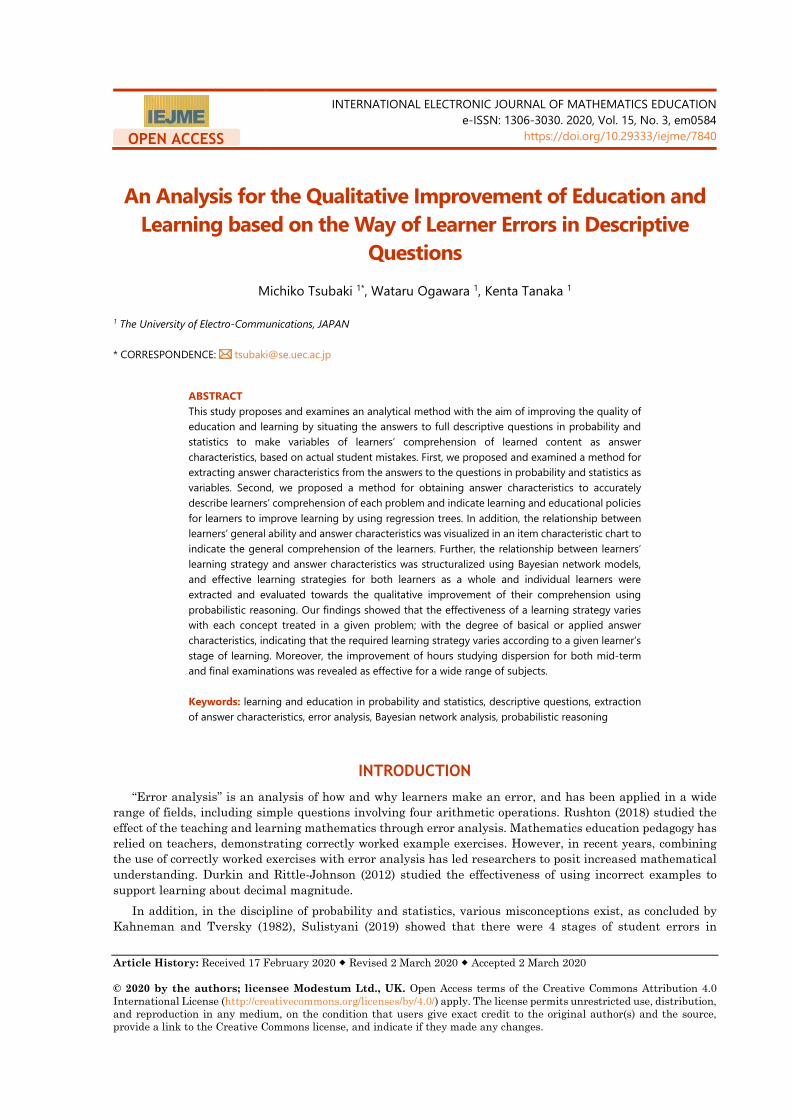
Figure 1 shows Problem 1 as an example of the problems provided as test items in the examination.
Problem 1 is composed of questions associated with the mean, variance, and conditional probability based on
the simultaneous probability distribution of 2 variables, and was worth 30 total points. As shown in Figure
Table 1. Items in the Questionnaire Survey Name Description Answer form
Self-efficacy: Useful I think I can appropriately use what I learn in the
probability and statistics class
5-point scale
assessment
(1: Strongly disagree,
2: Disagree,
3: Undecided,
4: Agree
5: Strongly agree)
Self-efficacy: Within the scope of the
course
I think I can solve the scope of the problems worked in
the class.
Self-efficacy: Outside the scope of the
course
I think I can understand content outside of the scope of
this class if I study it.
Intrinsic value: Important I think probability and statistics is an important subject
for me.
Intrinsic value: Interesting I find probability and statistics interesting.
Cognitive strategy: Understand in one’s
own words
I try to understand matters that strike me as important
by putting them into my own words.
Cognitive strategy: Identification of
content
I think about how to locate the study content within the
field of probability and statistics.
Cognitive strategy: Association with
one’s knowledge
I try to make an association with my previous
knowledge when I study something new.
Cognitive strategy: Repetitive learning
of key concepts
I repeatedly study concepts that seems important to me.
Self-regulation: Comprehension check I confirm my comprehension of the study content.
Self-regulation: Self-directed learning I work exercises by my self without being required to do
so in class.
Self-regulation: Rereading When I read the textbook or a reference, I review what I
have already read.
Self-regulation: Uninterested topics I study hard even for a topic in which I am not
interested.
Study habit: Daily preparation and
review
I make it a daily rule to prepare for and review the
classwork in the probability and statistics course.
Study habit: Review before examination I attentively review what I have learned in the
probability and statistics course before an exam.
Study habit: Study with similar
problems
I work on problems that are similar to problems I had
difficulty solving in the probability and statistics course.
Study time: Central position Cumulative study time on the center of distribution
during the course
Fill out numbers
Study time: Dispersion Cumulative study time on the dispersion of distribution
during the course.
Study time: Probability distribution Cumulative study time on probability distribution
during the course
Study time: Relation between variables Cumulative study time on the relation between
variables during the course
Study time: Statistical estimation Cumulative study time on statistical estimation during
the course
Study time: Statistical testing Cumulative study time on statistical testing during the
course
Prescribed textbook Use of prescribed textbooks during study Yes-no question (0: No
,1: Yes)
References: Probability and statistics Use of references on probability and statistics during
study
References: Outside probability and
statistics
Use of references on topics other than probability and
statistics during study
Web-based material Use of web-based material during study
Other course materials or materials
from other universities
Use of other course materials or materials from other
universities during study
Video material Use of e-Learning and video material during study
Others Use of other materials during study
Tsubaki et al.
4 / 27 http://www.iejme.com
1, a simultaneous probability distribution table for two random variables is given, and the students must
answer four questions.
Question (1) requires an assessment of whether two random variables are independent or dependent and
a description of the reason for the judgment; a correct answer receives 5 points. Question (2) requires
calculating the conditional distribution and the mean; a correct answer receives 10 points. Questions (3) and
(4) require calculations of the expected values and for the product and the sum of the two random variables;
correct answers receive 5 and 10 points each, respectively.
Problems in the Final Examination
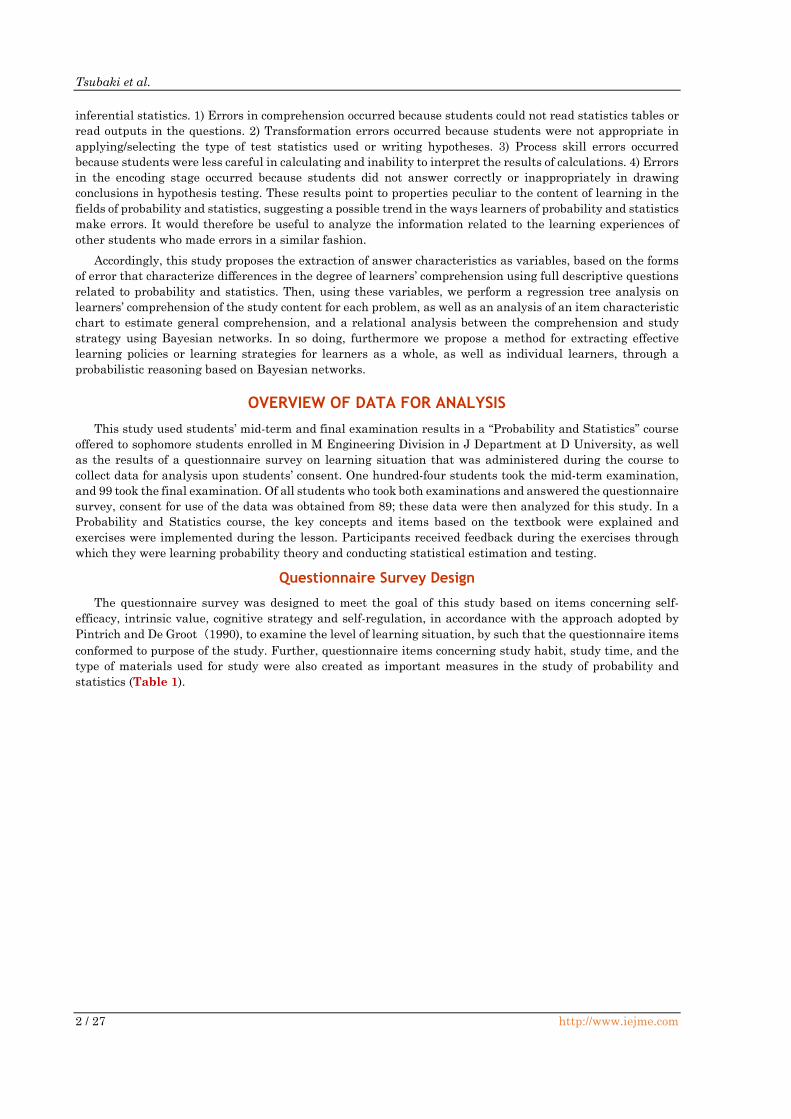
The final examination consisted of four full descriptive problems on statistical estimation and testing,
which students learned in the second half of the course. Figure 2 shows Problem 1 as an example. Problem 1
is associated with maximum likelihood estimation, a key concept in statistical estimation, and (1) requires
drawing the maximum likelihood estimator of the parameter λ in a Poisson distribution. A correct answer
receives 10 points. Question (2-1) requires the student to prove the unbiasness of the estimator led in (1),
question (2-2) requires proving its minimum variance; and question (2-3) requires the student to prove its
consistency; 5, 10, and 5 points are allocated to each question, respectively.
SCORING MODEL IN THE EXAMINATION AND EXTRACTION OF ANSWER
CHARACTERISTICS AS VARIABLES
Here, the scoring system of the examination is examined and a method for making variables, which
characterize the answers based on the mistakes students made when answering the full descriptive questions,
is proposed.
Figure 1. Problem 1 In Mid-term Examination
Figure 2. Problem 1 in the Final Examination
INT ELECT J MATH ED
http://www.iejme.com 5 / 27
Scoring Model for Full Descriptive Questions
First, regarding the multiple-choice questions, suppose 𝑝 question items exist. Let 𝑌𝑗 express the
correctness or incorrectness of the question 𝑗. Further, suppose that 𝒀 is a vector which express the correctness
or incorrectness of the entire problem in the examination. Then,
𝑌=[𝑌1,𝑌2,・・・,𝑌𝑝] (1)
𝑌𝑗=0 (Incorrect in Question j), 1 (Correct in Question j) (2)
and 𝒀 = 𝒚, which is obtained in the real examination, is named the item response data (Toyota, 2012). The
score 𝑆 in the examination is expressed by the formula (3), where each 𝑌𝑗 is multiplied by weight 𝑊𝑗 and is
then totaled.
𝑆=∑ 𝑊𝑗
𝑝
𝑗=1
𝑌𝑗 (3)
𝑊𝑗 was set by the creator of the test based on the importance of the content that is assessed in question 𝑗.
In this scoring model, a learner’s response is expressed by two values, which are correct or incorrect, for the
test questions. For this reason, the difference in the comprehension of learners as they provide wrong answers
(for example, the difference between a learner who arrives at an incorrect answer after working on the question
and a learner who fails to arrive at an answer after working on the question), cannot be expressed in formulas
(1) to (3).
Unlike this, the full descriptive problem includes questions that require indicating not only the result but
also the calculation process or the writing of a proof, and is often evaluated in detail such that even if the
answer is close to achieving full credit (or close to 0), some points may be deducted (or added). Thus, we
consider that the scoring model for the full descriptive examination in which detailed scoring, such as point-
deduction or addition, can be successfully carried out.
The score for the question i (i=1 to p), where learning content items A1, A2, …, or Aq are tested is expressed
as 𝑚1, 𝑚2, … , 𝑚𝑞, respectively, and in circumstances in which is a partial point deduction is made for content
items Ak, which is answered correctly, 𝑑𝑘 points are deducted, and where there is a partial point addition for
content items Ak, which is answered incorrectly, 𝑐𝑘 points are added. Thus, 𝑌𝑗 can be expressed as follows.
𝑌𝑗 = [𝑌𝑗11 , 𝑌𝑗12, 𝑌𝑗13,・・・,𝑌𝑗𝑞1 , 𝑌𝑗𝑞2, 𝑌𝑗𝑞3] (4)
𝑌𝑗𝑘1: 1 if the answer for Ak is correct, 0 if the answer is incorrect
𝑌𝑗𝑘2: 1 if there is a point deduction in the answer for Ak, 0 if there is no point deduction
𝑌𝑗𝑘3: 1 if there is a point addition in the answer for Ak, 0 if there is no point addition
and score Sj for question j can be expressed as follows.
𝑆𝑗 = ∑ (𝑚𝑘𝑌𝑗𝑘1 − 𝑑𝑘𝑌𝑗𝑘2 + 𝑐𝑘𝑌𝑗𝑘3)𝑞
𝑘=1 (5)
The multiple-choice test scoring model can be applied to a full descriptive test by expanding it into the full
descriptive test scoring model, as shown in formula (5).
Extraction of Answer Characteristics based on Mistakes in the Full Descriptive Test as
Variables
In this paper, each content item characterizing differences in the comprehension of learners is regarded as
an answer characteristic for each question, and a method for expressing learner’s answer characteristics is
proposed and examined.
Figure 3 illustrates the concept of extracting answer characteristics. Suppose that a problem assesses the
comprehension of study content A, which comprises 5 items—A1, A2, A3, A4, and A5, and answers from
learners 1, 2, 3, and 4 are obtained. Learner 1 correctly answers A1 and A2, while learner 3 correctly answers
all except A5. Further, suppose that learner 2 correctly answers all, while learner 4 incorrectly answers all.
When these answers are obtained, the comprehension of learners 2 and 4 can be expressed by the correct or
incorrect answer to the questions, whereas the comprehension of learners 1 and 3 reflects differences in their
comprehension of A3 and A4. Further, the comprehension of learners 2 and 3 can be characterized by the

Tsubaki et al.
6 / 27 http://www.iejme.com
difference in their comprehension of A5. In other words, the learners’ comprehension can be characterized by
“the comprehension of A1 and A2,” “comprehension of A3 and A4,” and “comprehension of A5.” Thus, making
variables of these as the answer characteristics B1, B2, and B3, respectively, allows us to characterize learners’
answers in turn, as shown in Table 2.
The procedure for extracting the answer characteristics is explained below. First, of all 𝑛 learners, suppose
there are s learners who provided a partially false answer to question 𝑗 without leaving it blank, and are
expressed as learner 𝑖 (= 1, … , 𝑠).
(i) Closely examine the answers of learner 𝑖 = 1, and let the characteristic Bk, which corresponds to each
fallacy, be an answer characteristic extracted by 𝑖 = 1.
(ii) Closely examine the answers of learners 𝑖 (= 2, … , s). (a) When the answers of learner 𝑖 can be expressed
by the answer characteristic variables extracted until learner 𝑖 − 1, express the answers of the learner 𝑖 using
the answer characteristic variables obtained by learner 𝑖 − 1.
(b) When the answers of learner 𝑖 cannot be expressed by the answer characteristic variables extracted
until learner 𝑖 − 1, add a new answer characteristic variable to express the answer of learner 𝑖.
(iii) Repeat step (ii) until 𝑖 = s.
(iv) Express the answers from 𝑖 = 1 to 𝑖 = 𝑠 in terms of answer characteristic variables B1 to Br.
(v) For the remaining 𝑛 − 𝑠 learners, set a value of 0 for all answer characteristic variables for the learners
who did not answer the question, and set 1 for all answer characteristic 12 variables for the learners who
provided a perfect answer.
Answer Characteristics for Each Question in the Mid-term Examination
Here, the variables that represent the answer characteristics extracted from Problem 1-(1) (independence
and dependence) in the mid-term exam are shown. The model answer for the question and answer
characteristics are shown in Figure 4 and Table 3, respectively.
Figure 3. Conceptual Scheme for Extraction Of Answer Characteristics
Table 2. Expression Of Comprehension Via Answer Characteristic Variables Answer characteristic B1 Answer characteristic B2 Answer characteristic B3
Learner 1 1 0 0
Learner 2 1 1 1
Learner 3 1 1 0
Learner 4 0 0 0
Figure 4. Model Answer to Problem 1-(1) in the Mid-term Examination
INT ELECT J MATH ED
http://www.iejme.com 7 / 27
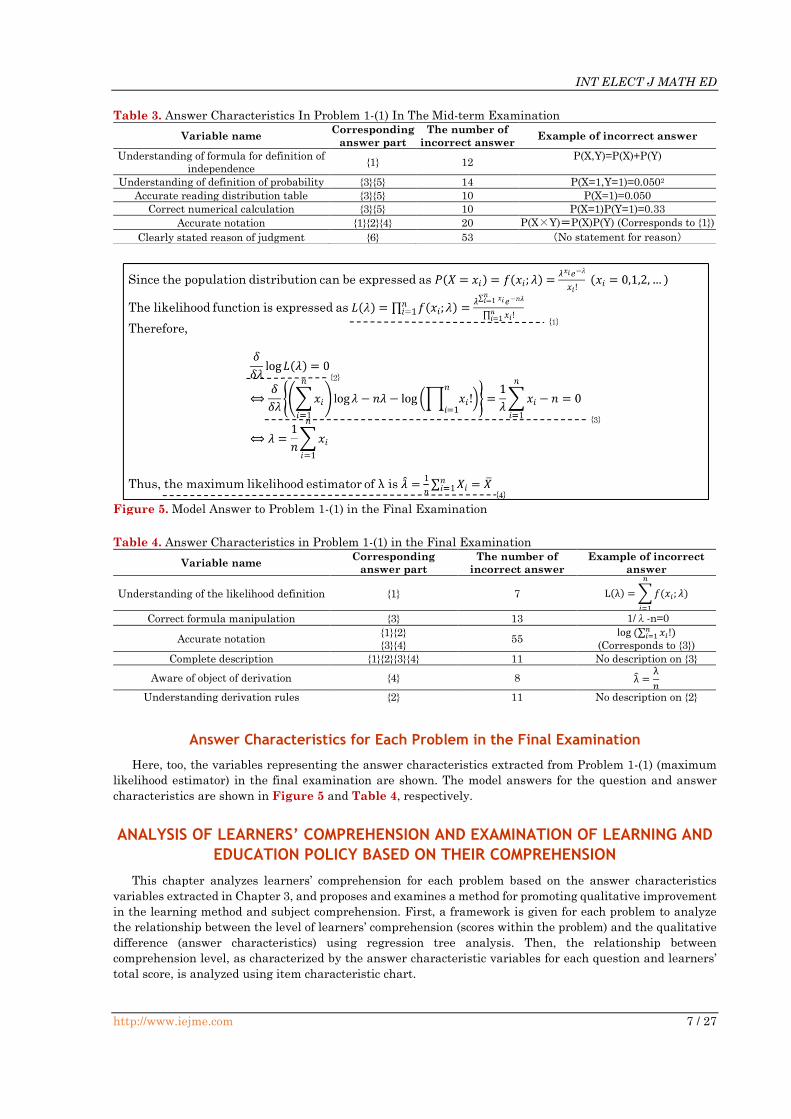
Answer Characteristics for Each Problem in the Final Examination
Here, too, the variables representing the answer characteristics extracted from Problem 1-(1) (maximum
likelihood estimator) in the final examination are shown. The model answers for the question and answer
characteristics are shown in Figure 5 and Table 4, respectively.
ANALYSIS OF LEARNERS’ COMPREHENSION AND EXAMINATION OF LEARNING AND
EDUCATION POLICY BASED ON THEIR COMPREHENSION
This chapter analyzes learners’ comprehension for each problem based on the answer characteristics
variables extracted in Chapter 3, and proposes and examines a method for promoting qualitative improvement
in the learning method and subject comprehension. First, a framework is given for each problem to analyze
the relationship between the level of learners’ comprehension (scores within the problem) and the qualitative
difference (answer characteristics) using regression tree analysis. Then, the relationship between
comprehension level, as characterized by the answer characteristic variables for each question and learners’
total score, is analyzed using item characteristic chart.
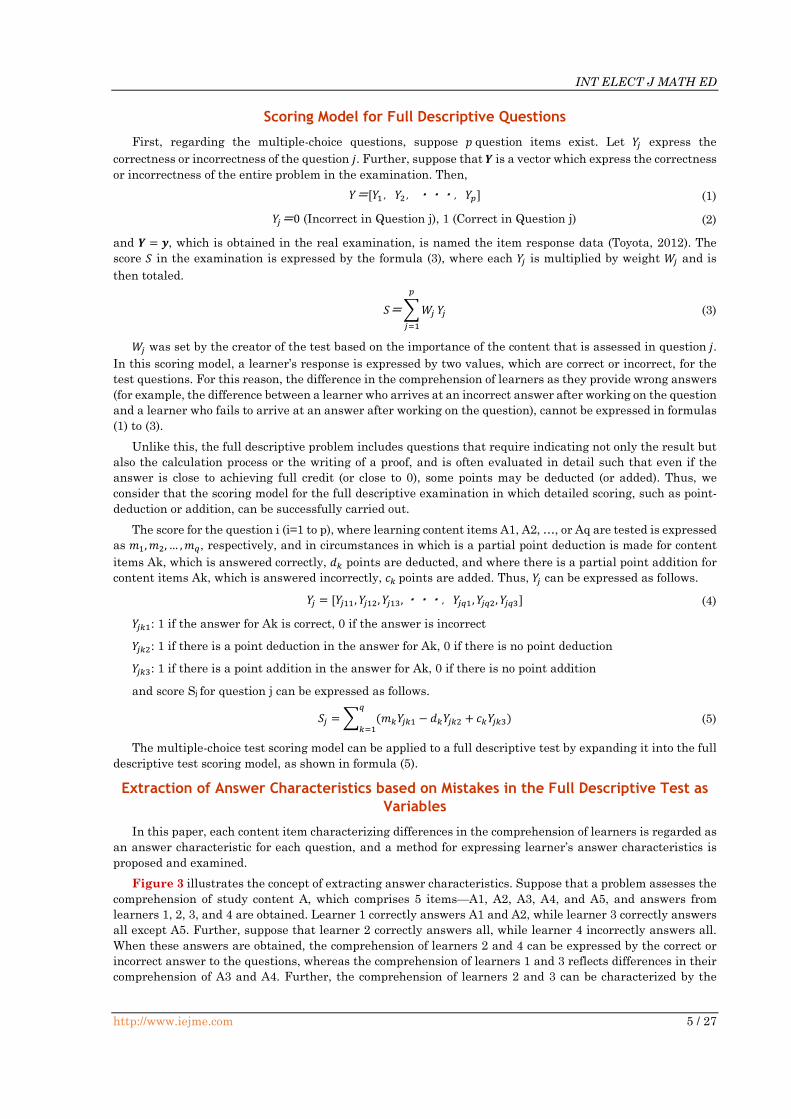
Table 3. Answer Characteristics In Problem 1-(1) In The Mid-term Examination
Variable name Corresponding
answer part
The number of
incorrect answer Example of incorrect answer
Understanding of formula for definition of
independence {1} 12
P(X,Y)=P(X)+P(Y)
Understanding of definition of probability {3}{5} 14 P(X=1,Y=1)=0.0502
Accurate reading distribution table {3}{5} 10 P(X=1)=0.050
Correct numerical calculation {3}{5} 10 P(X=1)P(Y=1)=0.33
Accurate notation {1}{2}{4} 20 P(X×Y)=P(X)P(Y) (Corresponds to {1})
Clearly stated reason of judgment {6} 53 (No statement for reason)
Figure 5. Model Answer to Problem 1-(1) in the Final Examination
Table 4. Answer Characteristics in Problem 1-(1) in the Final Examination
Variable name Corresponding
answer part
The number of
incorrect answer
Example of incorrect
answer
Understanding of the likelihood definition {1} 7 L(λ) = ∑ 𝑓(𝑥𝑖; 𝜆)
𝑛
𝑖=1
Correct formula manipulation {3} 13 1/λ-n=0
Accurate notation {1}{2}
{3}{4} 55
log (∑ 𝑥𝑖!𝑛𝑖=1 )
(Corresponds to {3})
Complete description {1}{2}{3}{4} 11 No description on {3}
Aware of object of derivation {4} 8 λ̂ =λ
𝑛
Understanding derivation rules {2} 11 No description on {2}
Tsubaki et al.
8 / 27 http://www.iejme.com
Segmentation of Learners by Question based on the Answer Characteristics Variables
Using Regression Tree and Comprehension Analysis Using Item Characteristic Chart
In this section, learners will be segmented into groups by question using the answer characteristics
variables.
Learner segmentation via regression tree analysis
Decision tree analysis is a procedure comprising the recursive segmentation and structuring of objects on
a tree by conditionalizing the explanatory variables that most eminently characterize the difference in the
objective variable. In our study, since the objective variable is an ordinal scale, a regression tree analysis will
be performed (Targo, 2017).
𝑆𝑇-(𝑆𝐿+𝑆𝑅) → 𝑚𝑎𝑥 (6)
Note that ST represents the sum of the squared deviation of the objective variable, SL is the sum of the
squared deviation of the objective variable in a left node after segmentation, and SR is the sum of the squared
deviation of the objective variable in the right node.
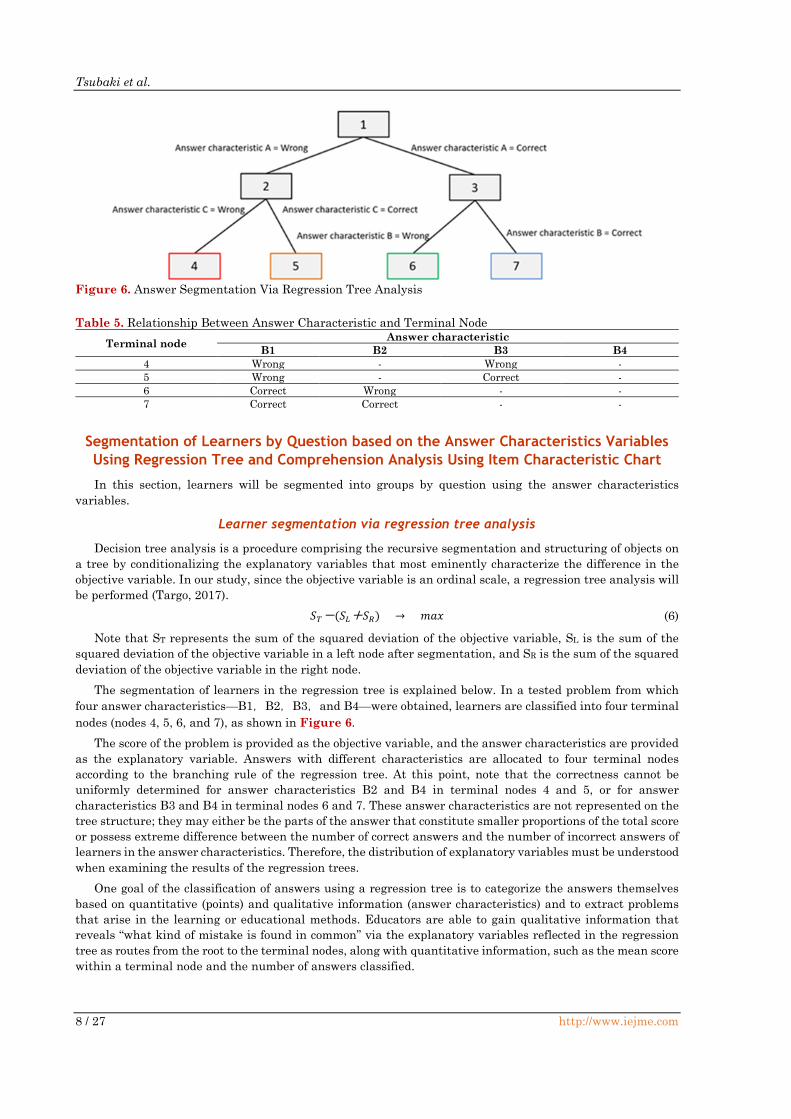
The segmentation of learners in the regression tree is explained below. In a tested problem from which
four answer characteristics—B1,B2,B3,and B4—were obtained, learners are classified into four terminal
nodes (nodes 4, 5, 6, and 7), as shown in Figure 6.
The score of the problem is provided as the objective variable, and the answer characteristics are provided
as the explanatory variable. Answers with different characteristics are allocated to four terminal nodes
according to the branching rule of the regression tree. At this point, note that the correctness cannot be
uniformly determined for answer characteristics B2 and B4 in terminal nodes 4 and 5, or for answer
characteristics B3 and B4 in terminal nodes 6 and 7. These answer characteristics are not represented on the
tree structure; they may either be the parts of the answer that constitute smaller proportions of the total score
or possess extreme difference between the number of correct answers and the number of incorrect answers of
learners in the answer characteristics. Therefore, the distribution of explanatory variables must be understood
when examining the results of the regression trees.
One goal of the classification of answers using a regression tree is to categorize the answers themselves
based on quantitative (points) and qualitative information (answer characteristics) and to extract problems
that arise in the learning or educational methods. Educators are able to gain qualitative information that
reveals “what kind of mistake is found in common” via the explanatory variables reflected in the regression
tree as routes from the root to the terminal nodes, along with quantitative information, such as the mean score
within a terminal node and the number of answers classified.
Figure 6. Answer Segmentation Via Regression Tree Analysis
Table 5. Relationship Between Answer Characteristic and Terminal Node
Terminal node Answer characteristic
B1 B2 B3 B4
4 Wrong - Wrong -
5 Wrong - Correct -
6 Correct Wrong - -
7 Correct Correct - -
INT ELECT J MATH ED
http://www.iejme.com 9 / 27
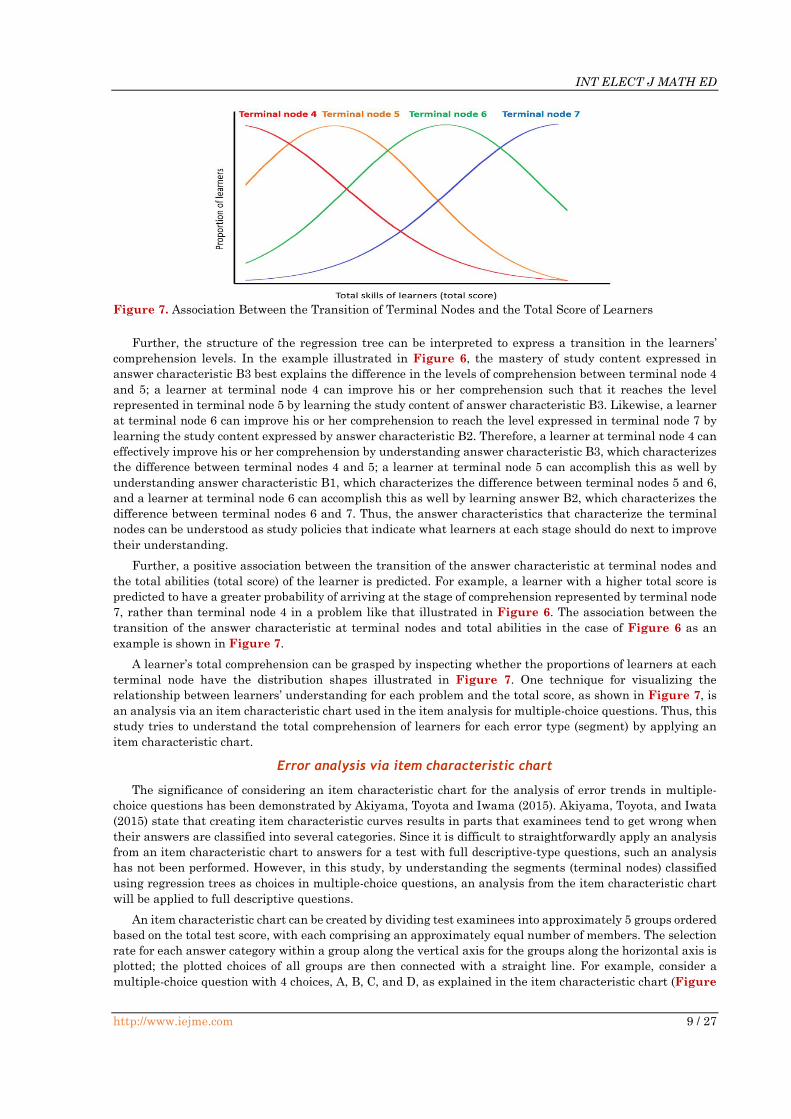
Further, the structure of the regression tree can be interpreted to express a transition in the learners’
comprehension levels. In the example illustrated in Figure 6, the mastery of study content expressed in
answer characteristic B3 best explains the difference in the levels of comprehension between terminal node 4
and 5; a learner at terminal node 4 can improve his or her comprehension such that it reaches the level
represented in terminal node 5 by learning the study content of answer characteristic B3. Likewise, a learner
at terminal node 6 can improve his or her comprehension to reach the level expressed in terminal node 7 by
learning the study content expressed by answer characteristic B2. Therefore, a learner at terminal node 4 can
effectively improve his or her comprehension by understanding answer characteristic B3, which characterizes
the difference between terminal nodes 4 and 5; a learner at terminal node 5 can accomplish this as well by
understanding answer characteristic B1, which characterizes the difference between terminal nodes 5 and 6,
and a learner at terminal node 6 can accomplish this as well by learning answer B2, which characterizes the
difference between terminal nodes 6 and 7. Thus, the answer characteristics that characterize the terminal
nodes can be understood as study policies that indicate what learners at each stage should do next to improve
their understanding.
Further, a positive association between the transition of the answer characteristic at terminal nodes and
the total abilities (total score) of the learner is predicted. For example, a learner with a higher total score is
predicted to have a greater probability of arriving at the stage of comprehension represented by terminal node
7, rather than terminal node 4 in a problem like that illustrated in Figure 6. The association between the
transition of the answer characteristic at terminal nodes and total abilities in the case of Figure 6 as an
example is shown in Figure 7.
A learner’s total comprehension can be grasped by inspecting whether the proportions of learners at each
terminal node have the distribution shapes illustrated in Figure 7. One technique for visualizing the
relationship between learners’ understanding for each problem and the total score, as shown in Figure 7, is
an analysis via an item characteristic chart used in the item analysis for multiple-choice questions. Thus, this
study tries to understand the total comprehension of learners for each error type (segment) by applying an
item characteristic chart.
Error analysis via item characteristic chart
The significance of considering an item characteristic chart for the analysis of error trends in multiple-
choice questions has been demonstrated by Akiyama, Toyota and Iwama (2015). Akiyama, Toyota, and Iwata
(2015) state that creating item characteristic curves results in parts that examinees tend to get wrong when
their answers are classified into several categories. Since it is difficult to straightforwardly apply an analysis
from an item characteristic chart to answers for a test with full descriptive-type questions, such an analysis
has not been performed. However, in this study, by understanding the segments (terminal nodes) classified
using regression trees as choices in multiple-choice questions, an analysis from the item characteristic chart
will be applied to full descriptive questions.
An item characteristic chart can be created by dividing test examinees into approximately 5 groups ordered
based on the total test score, with each comprising an approximately equal number of members. The selection
rate for each answer category within a group along the vertical axis for the groups along the horizontal axis is
plotted; the plotted choices of all groups are then connected with a straight line. For example, consider a
multiple-choice question with 4 choices, A, B, C, and D, as explained in the item characteristic chart (Figure
Figure 7. Association Between the Transition of Terminal Nodes and the Total Score of Learners
Tsubaki et al.
10 / 27 http://www.iejme.com
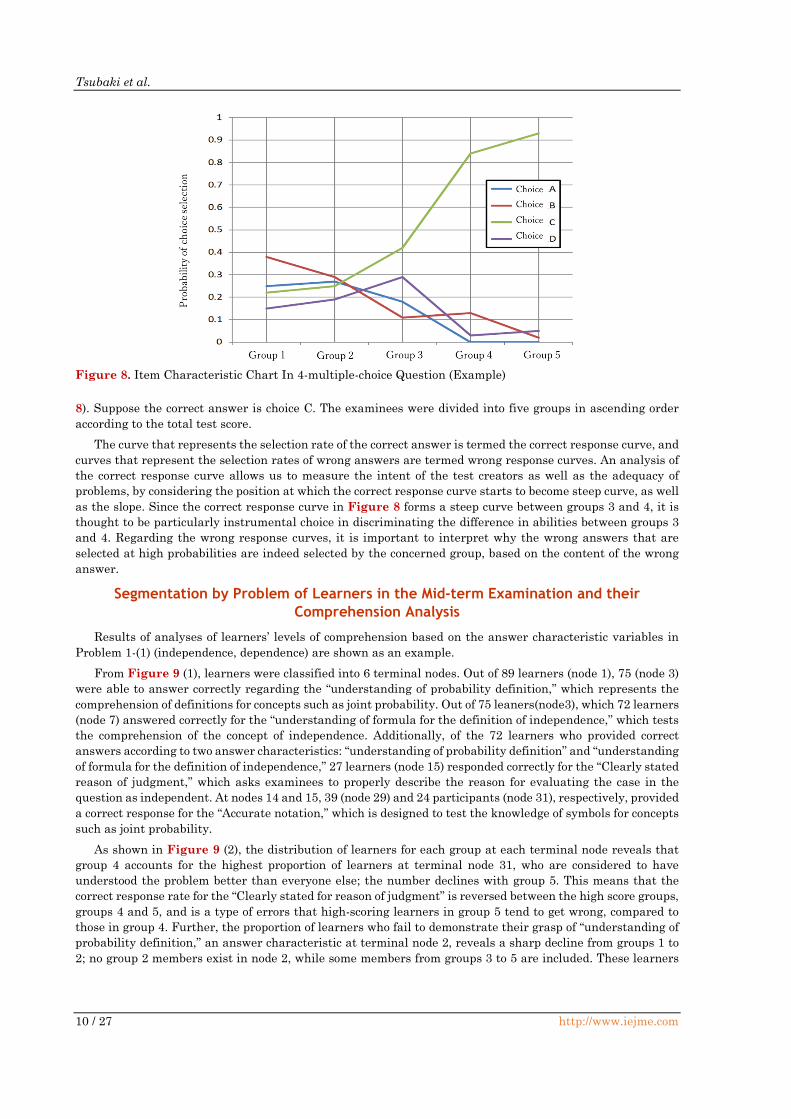
8). Suppose the correct answer is choice C. The examinees were divided into five groups in ascending order
according to the total test score.
The curve that represents the selection rate of the correct answer is termed the correct response curve, and
curves that represent the selection rates of wrong answers are termed wrong response curves. An analysis of
the correct response curve allows us to measure the intent of the test creators as well as the adequacy of
problems, by considering the position at which the correct response curve starts to become steep curve, as well
as the slope. Since the correct response curve in Figure 8 forms a steep curve between groups 3 and 4, it is
thought to be particularly instrumental choice in discriminating the difference in abilities between groups 3
and 4. Regarding the wrong response curves, it is important to interpret why the wrong answers that are
selected at high probabilities are indeed selected by the concerned group, based on the content of the wrong
answer.
Segmentation by Problem of Learners in the Mid-term Examination and their
Comprehension Analysis
Results of analyses of learners’ levels of comprehension based on the answer characteristic variables in
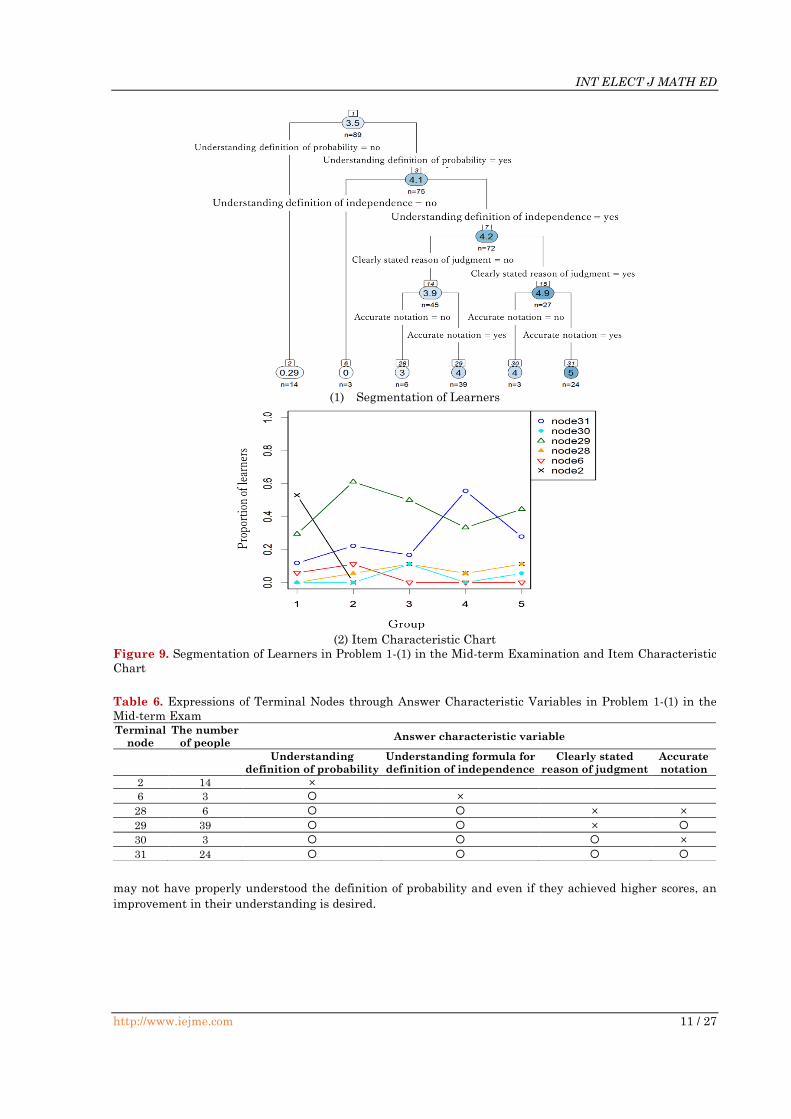
Problem 1-(1) (independence, dependence) are shown as an example.
From Figure 9 (1), learners were classified into 6 terminal nodes. Out of 89 learners (node 1), 75 (node 3)
were able to answer correctly regarding the “understanding of probability definition,” which represents the
comprehension of definitions for concepts such as joint probability. Out of 75 leaners(node3), which 72 learners
(node 7) answered correctly for the “understanding of formula for the definition of independence,” which tests
the comprehension of the concept of independence. Additionally, of the 72 learners who provided correct
answers according to two answer characteristics: “understanding of probability definition” and “understanding
of formula for the definition of independence,” 27 learners (node 15) responded correctly for the “Clearly stated
reason of judgment,” which asks examinees to properly describe the reason for evaluating the case in the
question as independent. At nodes 14 and 15, 39 (node 29) and 24 participants (node 31), respectively, provided
a correct response for the “Accurate notation,” which is designed to test the knowledge of symbols for concepts
such as joint probability.
As shown in Figure 9 (2), the distribution of learners for each group at each terminal node reveals that
group 4 accounts for the highest proportion of learners at terminal node 31, who are considered to have
understood the problem better than everyone else; the number declines with group 5. This means that the
correct response rate for the “Clearly stated for reason of judgment” is reversed between the high score groups,
groups 4 and 5, and is a type of errors that high-scoring learners in group 5 tend to get wrong, compared to
those in group 4. Further, the proportion of learners who fail to demonstrate their grasp of “understanding of
probability definition,” an answer characteristic at terminal node 2, reveals a sharp decline from groups 1 to
2; no group 2 members exist in node 2, while some members from groups 3 to 5 are included. These learners
Figure 8. Item Characteristic Chart In 4-multiple-choice Question (Example)
INT ELECT J MATH ED
http://www.iejme.com 11 / 27
may not have properly understood the definition of probability and even if they achieved higher scores, an
improvement in their understanding is desired.
(1) Segmentation of Learners
(2) Item Characteristic Chart
Figure 9. Segmentation of Learners in Problem 1-(1) in the Mid-term Examination and Item Characteristic
Chart
Table 6. Expressions of Terminal Nodes through Answer Characteristic Variables in Problem 1-(1) in the
Mid-term Exam Terminal
node
The number
of people Answer characteristic variable
Understanding
definition of probability
Understanding formula for
definition of independence
Clearly stated
reason of judgment
Accurate
notation
2 14 ×
6 3 〇 ×
28 6 〇 〇 × ×
29 39 〇 〇 × 〇
30 3 〇 〇 〇 ×
31 24 〇 〇 〇 〇
Tsubaki et al.
12 / 27 http://www.iejme.com
Segmentation by Problem of Learners in the Final Examination and their
Comprehension Analysis
Results of the analysis of learners’ comprehension based on the answer characteristic variables in Problem
1-(1) (maximum likelihood estimate) are shown below for illustration purposes.
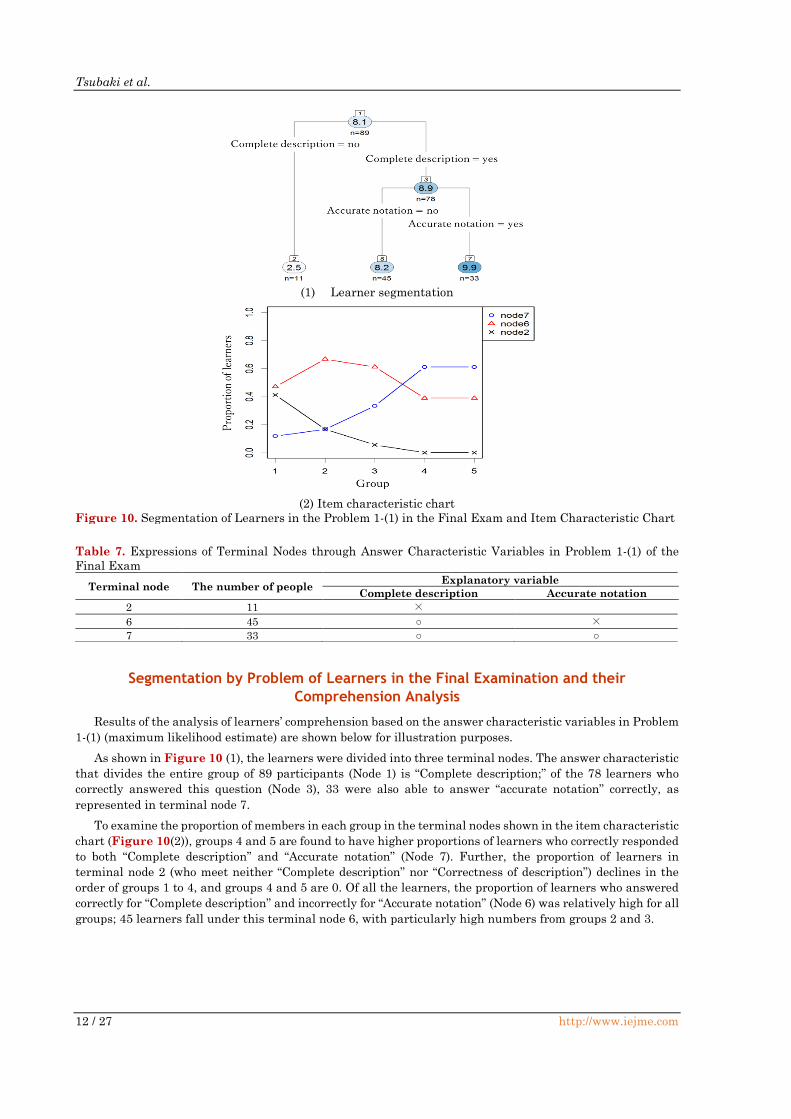
As shown in Figure 10 (1), the learners were divided into three terminal nodes. The answer characteristic
that divides the entire group of 89 participants (Node 1) is “Complete description;” of the 78 learners who
correctly answered this question (Node 3), 33 were also able to answer “accurate notation” correctly, as
represented in terminal node 7.
To examine the proportion of members in each group in the terminal nodes shown in the item characteristic
chart (Figure 10(2)), groups 4 and 5 are found to have higher proportions of learners who correctly responded
to both “Complete description” and “Accurate notation” (Node 7). Further, the proportion of learners in
terminal node 2 (who meet neither “Complete description” nor “Correctness of description”) declines in the
order of groups 1 to 4, and groups 4 and 5 are 0. Of all the learners, the proportion of learners who answered
correctly for “Complete description” and incorrectly for “Accurate notation” (Node 6) was relatively high for all
groups; 45 learners fall under this terminal node 6, with particularly high numbers from groups 2 and 3.
(1) Learner segmentation
(2) Item characteristic chart
Figure 10. Segmentation of Learners in the Problem 1-(1) in the Final Exam and Item Characteristic Chart
Table 7. Expressions of Terminal Nodes through Answer Characteristic Variables in Problem 1-(1) of the
Final Exam
Terminal node The number of people Explanatory variable
Complete description Accurate notation
2 11 ×
6 45 ○ ×
7 33 ○ ○
INT ELECT J MATH ED
http://www.iejme.com 13 / 27
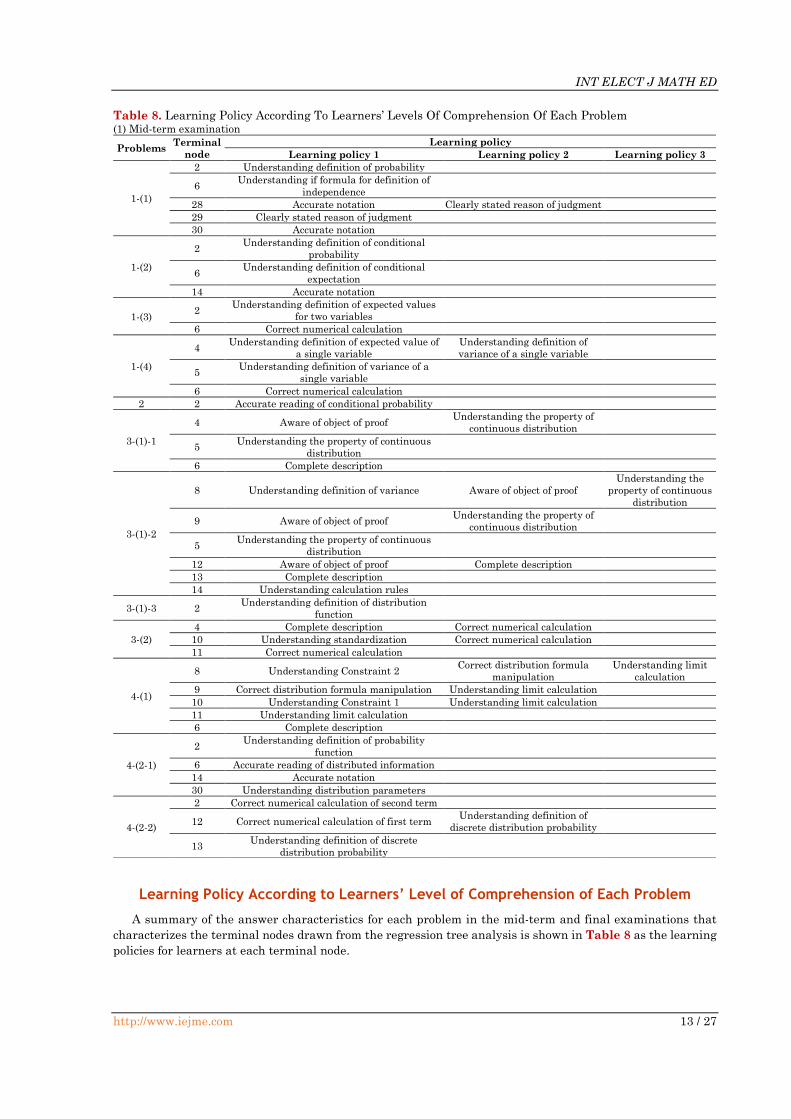
Learning Policy According to Learners’ Level of Comprehension of Each Problem
A summary of the answer characteristics for each problem in the mid-term and final examinations that
characterizes the terminal nodes drawn from the regression tree analysis is shown in Table 8 as the learning
policies for learners at each terminal node.
Table 8. Learning Policy According To Learners’ Levels Of Comprehension Of Each Problem (1) Mid-term examination
Problems Terminal
node
Learning policy
Learning policy 1 Learning policy 2 Learning policy 3
1-(1)
2 Understanding definition of probability
6 Understanding if formula for definition of
independence
28 Accurate notation Clearly stated reason of judgment
29 Clearly stated reason of judgment
30 Accurate notation
1-(2)
2 Understanding definition of conditional
probability
6 Understanding definition of conditional
expectation
14 Accurate notation
1-(3) 2
Understanding definition of expected values
for two variables
6 Correct numerical calculation
1-(4)
4 Understanding definition of expected value of
a single variable
Understanding definition of
variance of a single variable
5 Understanding definition of variance of a
single variable
6 Correct numerical calculation
2 2 Accurate reading of conditional probability
3-(1)-1
4 Aware of object of proof Understanding the property of
continuous distribution
5 Understanding the property of continuous
distribution
6 Complete description
3-(1)-2
8 Understanding definition of variance Aware of object of proof
Understanding the
property of continuous
distribution
9 Aware of object of proof Understanding the property of
continuous distribution
5 Understanding the property of continuous
distribution
12 Aware of object of proof Complete description
13 Complete description
14 Understanding calculation rules
3-(1)-3 2 Understanding definition of distribution
function
3-(2)
4 Complete description Correct numerical calculation
10 Understanding standardization Correct numerical calculation
11 Correct numerical calculation
4-(1)
8 Understanding Constraint 2 Correct distribution formula
manipulation
Understanding limit
calculation
9 Correct distribution formula manipulation Understanding limit calculation
10 Understanding Constraint 1 Understanding limit calculation
11 Understanding limit calculation
6 Complete description
4-(2-1)
2 Understanding definition of probability
function
6 Accurate reading of distributed information
14 Accurate notation
30 Understanding distribution parameters
4-(2-2)
2 Correct numerical calculation of second term
12 Correct numerical calculation of first term Understanding definition of
discrete distribution probability
13 Understanding definition of discrete
distribution probability

Tsubaki et al.
14 / 27 http://www.iejme.com
Table 8 (continued). Learning Policy According To Learners’ Levels Of Comprehension Of Each Problem
(2) Final examination
Problem Terminal
node
Learning policy
Learning policy 1 Learning policy 2 Learning policy 3
1-(1) 2 Complete description
6 Accurate notation
1-(2-1)
4 Understanding definition of unbiasedness Complete description
5 Complete description
6 Understanding definition of expected value
14 Accurate notation
1-(2-2)
8 Aware of object of proof Accurate notation Correct formula
manipulation
9 Accurate notation Correct formula manipulation
10 Complete description Correct formula manipulation
11 Correct formula manipulation
6 Aware of object of proof
14 Complete description
1-(2-3)
4 Accurate notation Correct formula manipulation
5 Correct formula manipulation
12 Understanding Chebyshev’s inequality Complete description
13 Complete description
14 Accurate notation
2-(1)
4 Understanding definition of errors in two-sided test Understanding definition of power in
two-sided test
10 Understanding situations where power is increased Understanding definition of power in
two-sided test
11 Understanding definition of power in two-sided test
12 Correct graphical demonstration of errors in test Understanding situations where
power is increased
13 Understanding situations where power is increased
14 Correct graphical demonstration of errors in test
2-(2)
8 Correct graphical demonstration of errors in test Understanding definition of power in
one-sided test
Understanding definition of
errors of one-sided test
9 Understanding definition of power in one-sided test Understanding definition of power in
one-sided test
5 Understanding definition of power in one-sided test
12 Correct graphical demonstration of errors in test
Understanding difference between
power in two-sided test and power in
one-sided test
13 Understanding difference between power in two-sided test
and power in one-sided test
14 Correct graphical demonstration of errors in test
3-(1)
4 Aware of object of derivation Description of distribution that the
statistics follows
5 Description of distribution that the statistics follows
6 Understanding derivation rules
3-(2)
4 Understanding definition of unbiased variance Accurate reading of percentage
points in chi-square distribution
5 Accurate reading of percentage points in chi-square
distribution
6 Understanding definition of confidence interval
14 Correct numerical calculation
3-(3)
2 Understanding definition of confidence interval
6 Accurate reading of percentage points in t-distribution
14 Correct numerical calculation
4-(1)
8 Clearly stated test hypothesis Understanding definition of
confidence interval
Understanding definition of
test statistic
9 Understanding definition of confidence interval Understanding definition of test
statistic
10 Clearly stated test hypothesis Understanding definition of test
statistic
11 Understanding definition of test statistic
6 Clearly stated test hypothesis
14 Understanding how to calculate percentage points in F
distribution
4-(2)
8 Understanding definition of pooled unbiased variance Accurate reading of percentage
points in t-distribution
Understanding definition of
test statistic
9 Accurate reading of percentage points in t-distribution Understanding definition of test
statistic
5 Understanding definition of test statistic
12 Accurate reading of percentage points in t-distribution Correct numerical calculation
13 Correct numerical calculation
14 Accurate reading of percentage points in t-distribution

INT ELECT J MATH ED
http://www.iejme.com 15 / 27
ANALYSIS OF THE RELATIONSHIP BETWEEN LEARNING POLICY AND ANSWER
CHARACTERISTICS FOP QUALITATIVE IMPROVEMENT IN LEARNERS’ LEARNING OF
PROBABILITY AND STATISTICS
In this chapter, the relationship between the answer characteristics and the learning policy obtained from
the questionnaire survey will be analyzed using Bayesian networks to individually derive the learning policies
that are useful in improving errors made by learners. Chen, Feng, Hu and Sun (2019) is to construct a
Bayesian network to make causal analysis and then provide personalized interventions for different learners
to improve learning. However, they do not model the relationship between the questionnaire survey and the
test answer characteristics based on error analysis.
Binarization of Learning Strategies based on Questionnaire Survey Results
As shown in Table 1 in Chapter 2, the questionnaire survey administered in this study consists of 29 items
(16+6+7 items) comprising 5-point scale questions (16 items), numerical input questions (6 items), and the
selective question with 7 choices that allow multiple answers is considered as 7 yes-or-no questions. Amongst
the latter type of question, all respondents chose No (0: No) for the questions “Video material” and “Others,”
which represent the materials used. Thus, they were excluded and the remaining 27 items were designated
as the variables for the learning strategies.
In this chapter, the learning strategy variables will be binarized to analyze the relationship between the
learning strategies and the answer characteristics using Bayesian network models. Regarding 16 questions
evaluated on a 5-point scale in Table 1, 3 negative answers to the question, 1: Strongly disagree, 2: Disagree,
and 3: Undecided, were regarded as 0,and 2 positive answers, 4: Agree, 5: Strongly agree, were regarded as
1. Regarding 6 questions of the numerical input type in Table 1, the mean value is understood as a point of
reference, since values less than the mean were regarded as 0, and the mean value and those greater than the
mean were regarded as 1.
Extraction of Learning Strategies Using Probabilistic Reasoning through Bayesian
Network Models
This study proposes a method to quantitatively detect and evaluate learning strategies that are
instrumental in eliminating mistakes and qualitatively improving learning by building a Bayesian network
model that relates answer characteristics to the learning strategy and answer characteristics for each question
and makes a probabilistic reasoning for each individual learner.
Regarding the Bayesian networks, refer to Scutari and Denis (2014), Lqbal, Yin, Hao, IIyas and Ali (2015).
In the Bayesian network model M, consider the learning strategy 𝑋 , which is in direct probabilistic relation
to characteristic 𝑌 , as the learning strategy that can be deemed useful for learners as a whole by evaluating
whether the value of D in the following formula is positive or negative, in addition to its quantity.
𝐷=𝑃(𝑌 = 1|𝑋 = 1,𝑀)-𝑃(𝑌 = 1|𝑋 = 0,𝑀) (7)
The use of the learning strategy 𝑋 , which causes the value of D in formula (7) to be positive, is considered
to promote understanding of the learned content, as represented in the answer characteristic 𝑌, as well as the
required improvement in associated skills. Moreover, if there is more than one learning strategy 𝑋 for a single
answer characteristic 𝑌, which causes the solution of formula (7) to be positive, the learning strategy 𝑋, which
maximizes the value of D in formula (7), is deemed most effective.
Extraction of Learning Strategies for Qualitative Improvement in Learning for Learners
in the Mid-term Exam
In the structural search for Bayesian network models, an AIC-based Greedy Search algorithm included in
the “bnlearn” R package was adopted. Here, to obtain a better model while preventing local optimization, the
structural search for Bayesian network models was repeated 1000 times while randomly changing the initial
values, and a model minimizing the AIC was adopted.
Let us explain the constraints imposed on the model structure of the Bayesian network model in the mid-
term examination. First, it is reasonable to assume that the comprehension of the learned content, as well as
the mastery of associated skills as represented by the answer characteristic variables, is a consequence of
learning using the strategies represented by the learning strategy variables. It is therefore inappropriate to

Tsubaki et al.
16 / 27 http://www.iejme.com
use the type of models with an edge structure in which the answer characteristic variable occupies the parent
node and the learning strategy variable occupies the child node; hence, a constraint is imposed on all answer
characteristic variables by disallowing them from possessing learning strategy variables as their child nodes.
Regarding the two learning strategy variables, “Study time: Statistical estimation” and “Study time:
Statistical testing,” both of which represent the hours of study spent on topics tested in the final examination,
it is appropriate to conclude that they do not affect learners’ mid-term examination results. Thus, of all 27
parameters that express learning strategies, two variables, “Study time: Statistical estimation,” and “Study
time: Statistical testing”, were excluded, which reduced the number of learning strategy variables to 25.
In the figure of the Bayesian network model below, the nodes in the blue and red boxes are learning
strategy variables and answer characteristic variables, respectively, which were observed to have a direct
positive probabilistic dependent relationship.
Here, the results of extracting the learning strategies to improve the answer characteristics in Problem 1-
(1) (independence, dependence) are shown as an example.
Figure 11. Structuration Of A Bayesian Network For The Answer Characteristics And Learning Strategies
Of Problem 1-(1)
INT ELECT J MATH ED
http://www.iejme.com 17 / 27
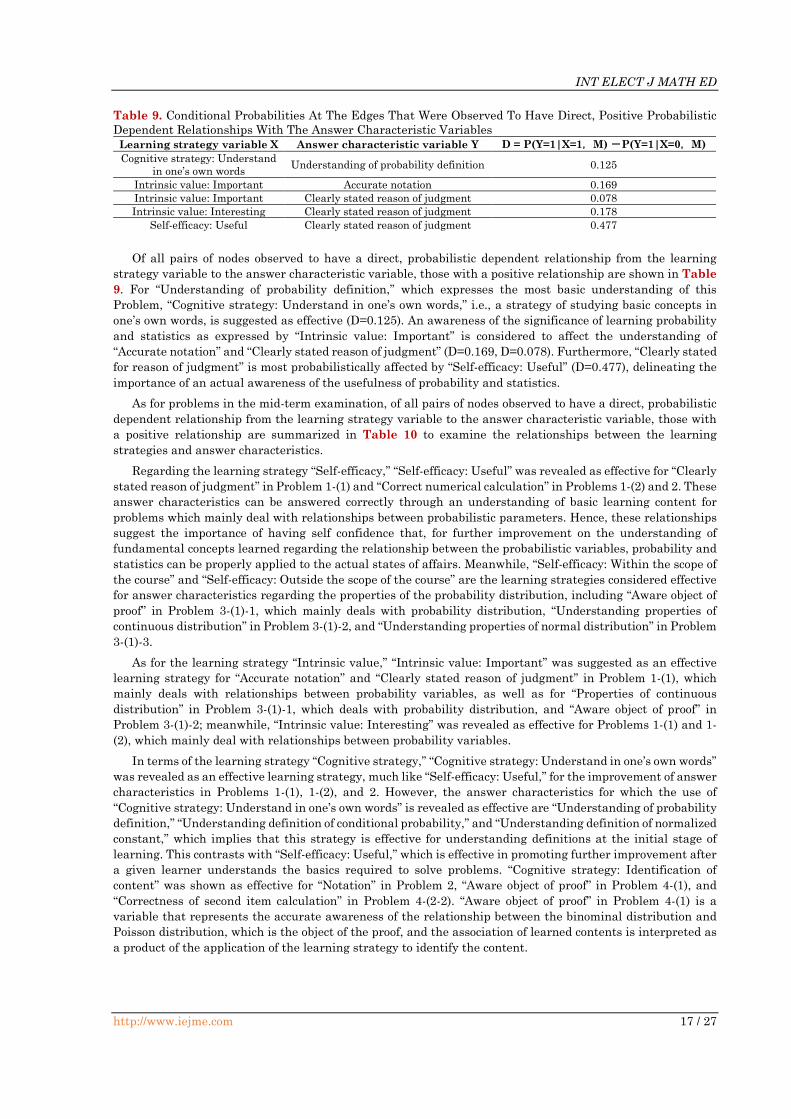
Of all pairs of nodes observed to have a direct, probabilistic dependent relationship from the learning
strategy variable to the answer characteristic variable, those with a positive relationship are shown in Table
9. For “Understanding of probability definition,” which expresses the most basic understanding of this
Problem, “Cognitive strategy: Understand in one’s own words,” i.e., a strategy of studying basic concepts in
one’s own words, is suggested as effective (D=0.125). An awareness of the significance of learning probability
and statistics as expressed by “Intrinsic value: Important” is considered to affect the understanding of
“Accurate notation” and “Clearly stated reason of judgment” (D=0.169, D=0.078). Furthermore, “Clearly stated
for reason of judgment” is most probabilistically affected by “Self-efficacy: Useful” (D=0.477), delineating the
importance of an actual awareness of the usefulness of probability and statistics.
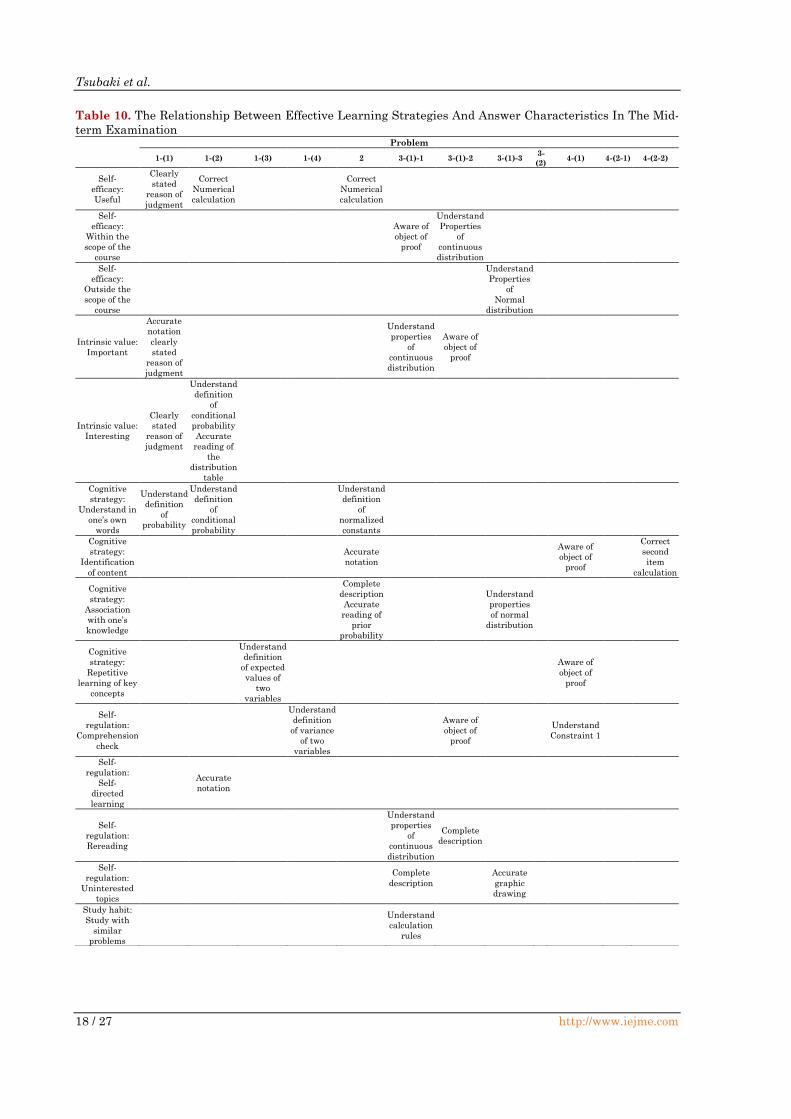
As for problems in the mid-term examination, of all pairs of nodes observed to have a direct, probabilistic
dependent relationship from the learning strategy variable to the answer characteristic variable, those with
a positive relationship are summarized in Table 10 to examine the relationships between the learning
strategies and answer characteristics.
Regarding the learning strategy “Self-efficacy,” “Self-efficacy: Useful” was revealed as effective for “Clearly
stated reason of judgment” in Problem 1-(1) and “Correct numerical calculation” in Problems 1-(2) and 2. These
answer characteristics can be answered correctly through an understanding of basic learning content for
problems which mainly deal with relationships between probabilistic parameters. Hence, these relationships
suggest the importance of having self confidence that, for further improvement on the understanding of
fundamental concepts learned regarding the relationship between the probabilistic variables, probability and
statistics can be properly applied to the actual states of affairs. Meanwhile, “Self-efficacy: Within the scope of
the course” and “Self-efficacy: Outside the scope of the course” are the learning strategies considered effective
for answer characteristics regarding the properties of the probability distribution, including “Aware object of
proof” in Problem 3-(1)-1, which mainly deals with probability distribution, “Understanding properties of
continuous distribution” in Problem 3-(1)-2, and “Understanding properties of normal distribution” in Problem
3-(1)-3.
As for the learning strategy “Intrinsic value,” “Intrinsic value: Important” was suggested as an effective
learning strategy for “Accurate notation” and “Clearly stated reason of judgment” in Problem 1-(1), which
mainly deals with relationships between probability variables, as well as for “Properties of continuous
distribution” in Problem 3-(1)-1, which deals with probability distribution, and “Aware object of proof” in
Problem 3-(1)-2; meanwhile, “Intrinsic value: Interesting” was revealed as effective for Problems 1-(1) and 1-
(2), which mainly deal with relationships between probability variables.
In terms of the learning strategy “Cognitive strategy,” “Cognitive strategy: Understand in one’s own words”
was revealed as an effective learning strategy, much like “Self-efficacy: Useful,” for the improvement of answer
characteristics in Problems 1-(1), 1-(2), and 2. However, the answer characteristics for which the use of
“Cognitive strategy: Understand in one’s own words” is revealed as effective are “Understanding of probability
definition,” “Understanding definition of conditional probability,” and “Understanding definition of normalized
constant,” which implies that this strategy is effective for understanding definitions at the initial stage of
learning. This contrasts with “Self-efficacy: Useful,” which is effective in promoting further improvement after
a given learner understands the basics required to solve problems. “Cognitive strategy: Identification of
content” was shown as effective for “Notation” in Problem 2, “Aware object of proof” in Problem 4-(1), and
“Correctness of second item calculation” in Problem 4-(2-2). “Aware object of proof” in Problem 4-(1) is a
variable that represents the accurate awareness of the relationship between the binominal distribution and
Poisson distribution, which is the object of the proof, and the association of learned contents is interpreted as
a product of the application of the learning strategy to identify the content.
Table 9. Conditional Probabilities At The Edges That Were Observed To Have Direct, Positive Probabilistic
Dependent Relationships With The Answer Characteristic Variables
Learning strategy variable X Answer characteristic variable Y D = P(Y=1|X=1,M) -P(Y=1|X=0,M)
Cognitive strategy: Understand
in one’s own words Understanding of probability definition 0.125
Intrinsic value: Important Accurate notation 0.169
Intrinsic value: Important Clearly stated reason of judgment 0.078
Intrinsic value: Interesting Clearly stated reason of judgment 0.178
Self-efficacy: Useful Clearly stated reason of judgment 0.477
Tsubaki et al.
18 / 27 http://www.iejme.com
Table 10. The Relationship Between Effective Learning Strategies And Answer Characteristics In The Mid-
term Examination
Problem
1-(1) 1-(2) 1-(3) 1-(4) 2 3-(1)-1 3-(1)-2 3-(1)-3 3-
(2) 4-(1) 4-(2-1) 4-(2-2)
Self-
efficacy:
Useful
Clearly
stated
reason of
judgment
Correct
Numerical
calculation
Correct
Numerical
calculation
Self-
efficacy:
Within the
scope of the
course
Aware of
object of
proof
Understand
Properties
of
continuous
distribution
Self-
efficacy:
Outside the
scope of the
course
Understand
Properties
of
Normal
distribution
Intrinsic value:
Important
Accurate
notation
clearly
stated
reason of
judgment
Understand
properties
of
continuous
distribution
Aware of
object of
proof
Intrinsic value:
Interesting
Clearly
stated
reason of
judgment
Understand
definition
of
conditional
probability
Accurate
reading of
the
distribution
table
Cognitive
strategy:
Understand in
one’s own
words
Understand
definition
of
probability
Understand
definition
of
conditional
probability
Understand
definition
of
normalized
constants
Cognitive
strategy:
Identification
of content
Accurate
notation
Aware of
object of
proof
Correct
second
item
calculation
Cognitive
strategy:
Association
with one’s
knowledge
Complete
description
Accurate
reading of
prior
probability
Understand
properties
of normal
distribution
Cognitive
strategy:
Repetitive
learning of key
concepts
Understand
definition
of expected
values of
two
variables
Aware of
object of
proof
Self-
regulation:
Comprehension
check
Understand
definition
of variance
of two
variables
Aware of
object of
proof
Understand
Constraint 1
Self-
regulation:
Self-
directed
learning
Accurate
notation
Self-
regulation:
Rereading
Understand
properties
of
continuous
distribution
Complete
description
Self-
regulation:
Uninterested
topics
Complete
description
Accurate
graphic
drawing
Study habit:
Study with
similar
problems
Understand
calculation
rules
INT ELECT J MATH ED
http://www.iejme.com 19 / 27
As for the learning strategy “Self-regulation,” “Self-regulation. Comprehension check” is considered an
effective learning strategy for a range of answer characteristics, including “Understanding definition of
variance of two variables” in Problem 1-(4), which mainly deals with the expected value and variance of two
variables, “Aware object of proof” in Problem 3-(1)-2; which relates to the probability distribution and
“Understanding constraint 1” in Problem 4-(1).
Of all 4 learning strategy variables that express the study time, “Study time: Dispersion” and “Study time:
Probability distribution” were extracted for a range of answer characteristics, the study time indicating that
for dispersion and probability distribution was essential. Problems 3 and 4, which deal with probability
distribution, are the problems for which “Study time: Probability distribution” was extracted as an effective
learning strategy, demonstrating that study time directly affects the understanding of the subject matter.
Conversely, “Study time: Dispersion” was extracted for Problem 1-(3), which is a calculation of the expected
values of two variables, for Problem 2 on the Bayesian theorem, and for Problem 3-(1)-2, which mainly deals
with variance. This highlights the particular importance of study time for dispersion in the study of probability
and statistics.
Learning Strategy Extraction for Qualitative Improvement of Learning in the Final
Examination
Regarding the Bayesian model used for the final examination, the constraints imposed on the model
structure are explained below. Similar to the case of the mid-term examination, since the type of models with
an edge structure in which the answer characteristic variable occupies the parent node and the learning
strategy variable occupies the child node were deemed inappropriate, constraints were imposed on all answer
characteristic variables by disallowing them from having learning strategy variables as their child nodes.
Moreover, regarding the learning strategy variables, constraints were imposed on the “Study time: Statistical
estimation” and “Study time: Statistical testing” for the study content learned in the second half such that
they could not possess “Study time: Central position,” “Study time: Dispersion,” “Study time: Probability
distribution,” and “Study time: Relationship between variables” of mid-term examination topics as their child
nodes.
Here, the results of extracting the learning strategies to improve the answer characteristics in Problem 1-
(1) (maximum likelihood estimate) are shown as an example.
Table 10 (continued). The Relationship Between Effective Learning Strategies And Answer Characteristics
In The Mid-term Examination
Problem
1-(1) 1-(2) 1-(3) 1-(4) 2 3-(1)-1 3-(1)-2 3-(1)-3 3-
(2) 4-(1) 4-(2-1) 4-(2-2)
Study time:
Central
position
Understand
definition
of
probability
function
Correct
first item
calculation
Study time:
Dispersion
Correct
numerical
calculation
Accurate
reading of
conditional
probability
Understand
definition
of variance
Study time:
Probability
distribution
Understand
properties
of normal
distribution
Correct
distribution
formula
manipulation
Accurate
notation
References:
Probability
and statistics
Accurate
reading of
distributed
information
References:
Outside
probability
and statistics
Complete
description
Web-
based
material
Understand
definition
of
conditional
expectation
Complete
description
Other course
materials or
materials from
other
universities
Understand
definition
of discrete
distribution
probability
Tsubaki et al.
20 / 27 http://www.iejme.com
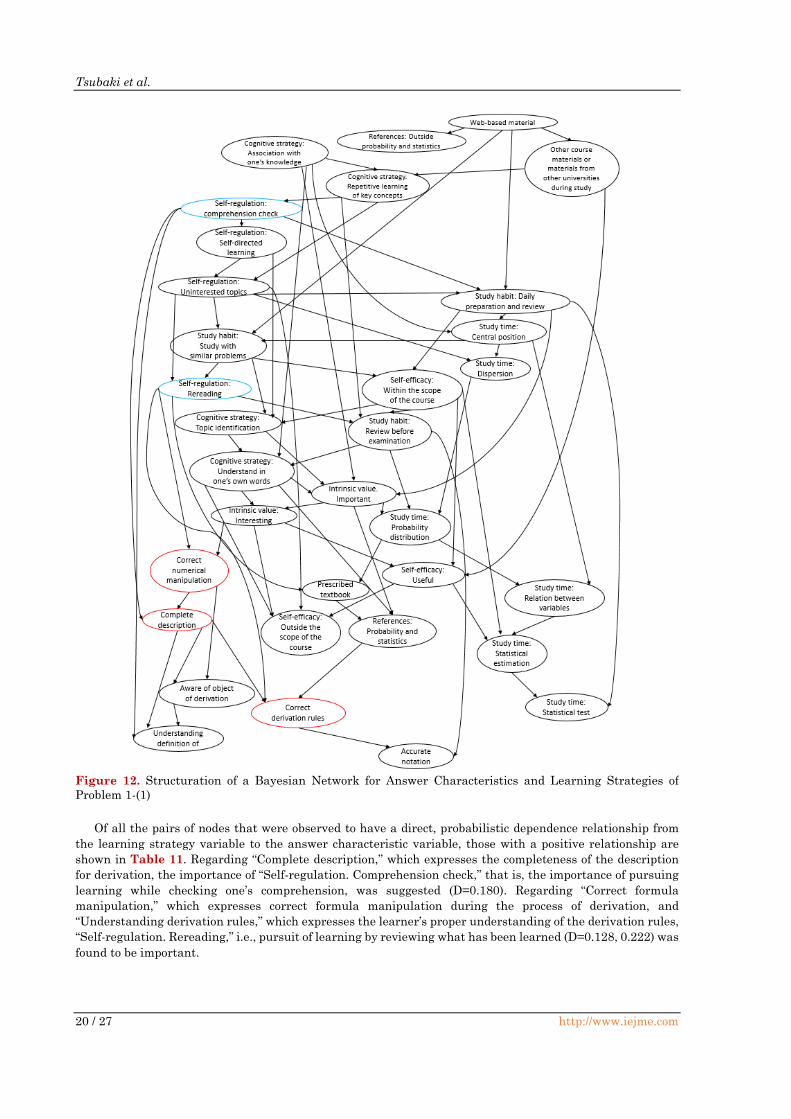
Of all the pairs of nodes that were observed to have a direct, probabilistic dependence relationship from
the learning strategy variable to the answer characteristic variable, those with a positive relationship are
shown in Table 11. Regarding “Complete description,” which expresses the completeness of the description
for derivation, the importance of “Self-regulation. Comprehension check,” that is, the importance of pursuing
learning while checking one’s comprehension, was suggested (D=0.180). Regarding “Correct formula
manipulation,” which expresses correct formula manipulation during the process of derivation, and
“Understanding derivation rules,” which expresses the learner’s proper understanding of the derivation rules,
“Self-regulation. Rereading,” i.e., pursuit of learning by reviewing what has been learned (D=0.128, 0.222) was
found to be important.
Figure 12. Structuration of a Bayesian Network for Answer Characteristics and Learning Strategies of
Problem 1-(1)
INT ELECT J MATH ED
http://www.iejme.com 21 / 27
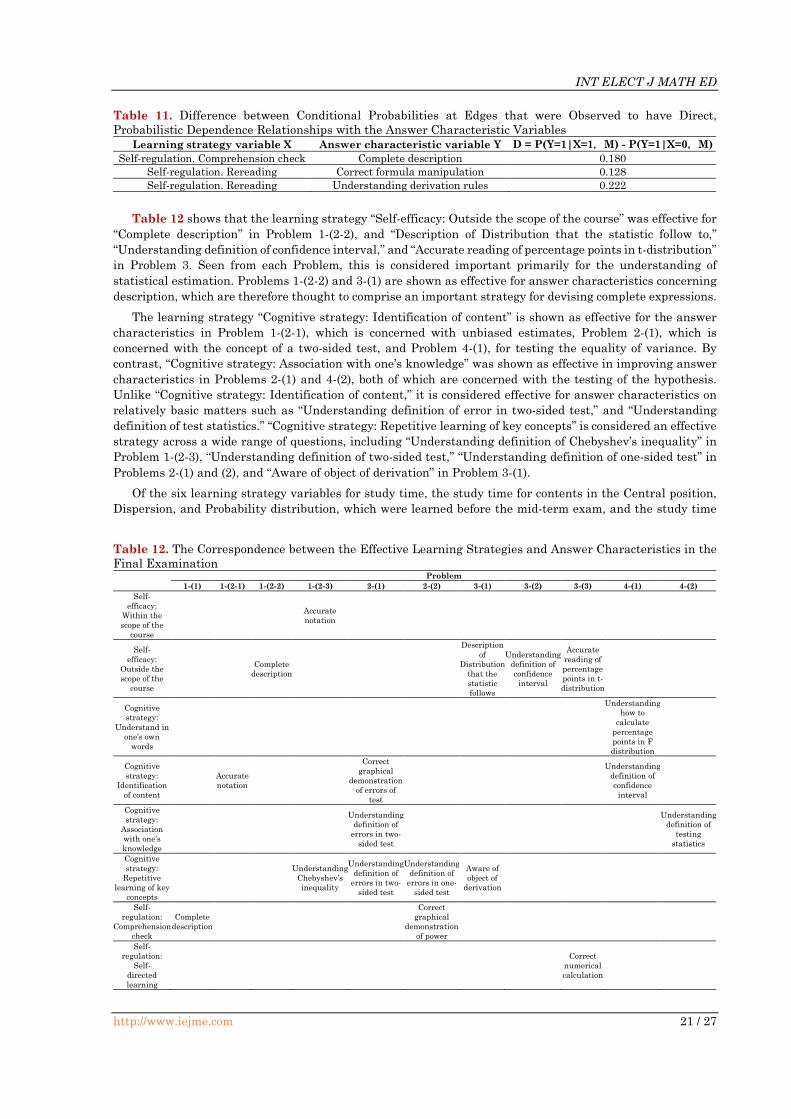
Table 12 shows that the learning strategy “Self-efficacy: Outside the scope of the course” was effective for
“Complete description” in Problem 1-(2-2), and “Description of Distribution that the statistic follow to,”
“Understanding definition of confidence interval,” and “Accurate reading of percentage points in t-distribution”
in Problem 3. Seen from each Problem, this is considered important primarily for the understanding of
statistical estimation. Problems 1-(2-2) and 3-(1) are shown as effective for answer characteristics concerning
description, which are therefore thought to comprise an important strategy for devising complete expressions.
The learning strategy “Cognitive strategy: Identification of content” is shown as effective for the answer
characteristics in Problem 1-(2-1), which is concerned with unbiased estimates, Problem 2-(1), which is
concerned with the concept of a two-sided test, and Problem 4-(1), for testing the equality of variance. By
contrast, “Cognitive strategy: Association with one’s knowledge” was shown as effective in improving answer
characteristics in Problems 2-(1) and 4-(2), both of which are concerned with the testing of the hypothesis.
Unlike “Cognitive strategy: Identification of content,” it is considered effective for answer characteristics on
relatively basic matters such as “Understanding definition of error in two-sided test,” and “Understanding
definition of test statistics.” “Cognitive strategy: Repetitive learning of key concepts” is considered an effective
strategy across a wide range of questions, including “Understanding definition of Chebyshev’s inequality” in
Problem 1-(2-3), “Understanding definition of two-sided test,” “Understanding definition of one-sided test” in
Problems 2-(1) and (2), and “Aware of object of derivation” in Problem 3-(1).
Of the six learning strategy variables for study time, the study time for contents in the Central position,
Dispersion, and Probability distribution, which were learned before the mid-term exam, and the study time
Table 11. Difference between Conditional Probabilities at Edges that were Observed to have Direct,
Probabilistic Dependence Relationships with the Answer Characteristic Variables
Learning strategy variable X Answer characteristic variable Y D = P(Y=1|X=1,M) - P(Y=1|X=0,M)
Self-regulation. Comprehension check Complete description 0.180
Self-regulation. Rereading Correct formula manipulation 0.128
Self-regulation. Rereading Understanding derivation rules 0.222
Table 12. The Correspondence between the Effective Learning Strategies and Answer Characteristics in the
Final Examination
Problem
1-(1) 1-(2-1) 1-(2-2) 1-(2-3) 2-(1) 2-(2) 3-(1) 3-(2) 3-(3) 4-(1) 4-(2)
Self-
efficacy:
Within the
scope of the
course
Accurate
notation
Self-
efficacy:
Outside the
scope of the
course
Complete
description
Description
of
Distribution
that the
statistic
follows
Understanding
definition of
confidence
interval
Accurate
reading of
percentage
points in t-
distribution
Cognitive
strategy:
Understand in
one’s own
words
Understanding
how to
calculate
percentage
points in F
distribution
Cognitive
strategy:
Identification
of content
Accurate
notation
Correct
graphical
demonstration
of errors of
test
Understanding
definition of
confidence
interval
Cognitive
strategy:
Association
with one’s
knowledge
Understanding
definition of
errors in two-
sided test
Understanding
definition of
testing
statistics
Cognitive
strategy:
Repetitive
learning of key
concepts
Understanding
Chebyshev’s
inequality
Understanding
definition of
errors in two-
sided test
Understanding
definition of
errors in one-
sided test
Aware of
object of
derivation
Self-
regulation:
Comprehension
check
Complete
description
Correct
graphical
demonstration
of power
Self-
regulation:
Self-
directed
learning
Correct
numerical
calculation
Tsubaki et al.
22 / 27 http://www.iejme.com
for contents concerning statistical test, which were learned later, were confirmed as effective for improving
the answer characteristics. “Study time: Statistical test” was observed as effective for Problem 1-(2-2), which
deals with the minimum variance of estimator, and for “Understanding situations where power is elevated”
and “Understanding definition of error in one-sided test,” which are the answer characteristics of Problems 2-
(1) and (2), respectively, for the concept of testing a hypothesis. The study time spent on hypothesis testing is
therefore considered particularly effective for understanding the testing errors, which comprise one of the
most fundamental issues in hypothesis test.
Regarding the learning strategy variables of the study materials used, the “Web-based material” was
revealed as effective across a range of questions, including Problems 1-(2-3), 3-(1), 4-(1), and 4-(2).
Learning Strategy Extraction using Individual Probabilistic Reasonings based on the
Bayesian Network Model
As a next step, a probabilistic reasoning conditioned on the comprehension of each learner and his use of
a given learning strategy was performed individually, to quantitatively assess any learning improvements
that may prove effective for learner. Here, suppose that a learner i fails to correctly answer the question q in
the fth answer characteristic Yi,q,f. Further, suppose that learning strategy 𝑿𝑖 of the learner i is represented as
𝑿𝑖 = [𝑥𝑖,1, … , 𝑥𝑖,𝑚−1, 0, 𝑥𝑖,𝑚+1, … , 𝑥𝑖,𝑟]
and element 𝑋𝑖,𝑚 of the learning strategy is 0. In addition, let answer characteristics other than f-th answer
characteristic Yi,q,f of the learner i be expressed as
𝒀𝑖,𝑞(−𝑓) = [𝑌𝑖,𝑞,1, … , 𝑌𝑖,𝑞,𝑓−1, 𝑌𝑖,𝑞,𝑓+1, … , 𝑌𝑖,𝑞,𝑝]
Then, the probability that the learner i will correctly answer the f-th answer characteristic Yi,q,f under the
learning strategy he or she has currently adopted can be expressed as
𝑃(𝑌𝑖,𝑞 , 𝑓=1|𝑋𝑖,𝑌𝑖,𝑞=(−𝑓)) (8)
Table 12 (continued). The Correspondence between the Effective Learning Strategies and Answer
Characteristics in the Final Examination
Problem
1-(1) 1-(2-1) 1-(2-2) 1-(2-3) 2-(1) 2-(2) 3-(1) 3-(2) 3-(3) 4-(1) 4-(2)
Self-
regulation:
Rereading
Correct
formula
manipulation
Correct
derivation
rules
Understanding
definition of
expected value
Study habit:
Daily
preparation
and review
Correct
graphical
demonstration
of errors of test
Study habit:
Study with
similar
problems
Explaining
grounds for
minimum
variance
Aware of
object of proof
Understanding
definition of
errors in two-
sided test
Accurate
reading of
percentage
points in t-
distribution
Study time:
Central
position
Understanding
definition of
power in one-
sided test
Understanding
definition of
confidence
interval
Study time:
Dispersion
Aware of
object of
derivation
Clearly stated
test hypothesis
Study time:
Probability
distribution
Complete
description
Study time:
Statistical
estimation
Correct
formula
manipulation
Understanding
situations where
power is
increased
Understanding
definition of
errors in one-
sided test
Web-
based
material
Accurate
notation
Aware of
object of
derivation
Understanding
definition of
errors in two-
sided test
Understanding
definition of
pooled unbiased
variance
Other course
materials or
materials
from other
universities
Correct
graphical
demonstration
of errors of test

INT ELECT J MATH ED
http://www.iejme.com 23 / 27
Here, if learner i improves the element 𝑋𝑖,𝑚 of the learning strategy and the learning strategy at this point is
expressed as 𝑿𝑖′(𝑥𝑖,𝑚 = 1) , then we obtain
𝑋𝑖′ = [𝑥𝑖,1, … , 𝑥𝑖,𝑚−1, 1, 𝑥𝑖,𝑚+1 , … , 𝑥𝑖,𝑟] (9)
and the probability that learner i will correctly answer the f-th answer characteristic Yi,q,f under the condition
that he or she improved on the m-th learning strategy is as follows.
𝑃(𝑌𝑖,𝑞,𝑓= 1|𝑋𝑖’(𝑥𝑖,𝑚 = 1),𝑌𝑖,𝑞=(−𝑓)) (10)
Then, if we take the difference between formulas (10) and (8)
𝑃(𝑌𝑖,𝑞,𝑓= 1|𝑋𝑖’(𝑥𝑖,𝑚 = 1),𝑌𝑖,𝑞=(−𝑓))-𝑃(𝑌𝑖,𝑞,𝑓=1|𝑋𝑖,𝑌𝑖,𝑞=(−𝑓)) (11)
then the learning strategy m, which is effective for improving the element f of the learning characteristic in
which learner i is interested, would be detected and assessed.
From the mid-term examination, an example of results related to probabilistic reasoning given changes
tailored for a learner in the conditions of the learning strategy and answer characteristic parameters is shown
in Table 13. Since the learning strategies that had already been used and answer variables that the learner
had gotten right did not require improvement, diagonal lines were drawn in the relevant cells.
Student 07 failed to answer “Clearly stated reason of judgment” and “Correctness of notation” correctly.
The probability that this student will give a correct answer for “Clearly stated reason of judgment” correctly
with the current learning strategy and level of comprehension is expected to increase by approximately 0.875
Table 13. Results of Probabilistic Reasonings for Student 07
Understanding the
definition formula
for independence
Understanding
definition of
probability
Accurate reading
of distribution
table
Correct
numerical
calculation
Clearly stated
reason for
judgement
Accurate
notation
Self-efficacy: Useful 0.875 0.000
Self-efficacy: Within the
scope of the course 0.000 0.000
Self-efficacy: Outside the
scope of the course 0.000 0.000
Intrinsic value: Important 0.208 0.200
Intrinsic value: Interesting 0.330 0.000
Cognitive strategy:
Understand in one’s own
words
Cognitive strategy:
Identification of content 0.000 0.000
Cognitive strategy:
Association with one’s
knowledge
Cognitive strategy:
Repetitive learning of key
concepts
Self-regulation:
Comprehension check
Self-regulation: Self-directed
learning 0.000 0.000
Self-regulation: Rereading 0.000 0.000
Self-regulation: Uninterested
topics 0.000 0.000
Study habit: Daily
preparation and review 0.000 0.000
Study habit: Review before
examination
Study habit: Study with
similar problems 0.000 -0.165
Study time: Central position
Study time: Dispersion 0.000 0.000
Study time: Probability
distribution 0.000 0.000
Study time: Relation between
variables 0.000 0.000
Prescribed textbook
References: Probability and
statistics 0.000 0.000
References: Outside
probability and statistics 0.000 0.000
Web-based material
Other course materials or
materials from other
universities during study
0.000 0.000
Tsubaki et al.
24 / 27 http://www.iejme.com
with improvement in “Self-efficacy: Useful,” by approximately 0.208 with improvement in “Intrinsic value:
Important,” by approximately 0.300 with improvement in “Intrinsic value: Interesting.” Moreover, the
probability that he will give a correct answer for “Accurate notation” is expected to increase by about 0.2, with
an improvement in “Intrinsic value: Important.”
The example of the final examination is shown in Table 14.
Student 12 failed to give a correct answer for “Accurate notation” and the “Correctness of derivation rules.”
The probability that this student will give a correct answer for “Accurate notation” and the “Correctness of
derivation rules” under the current learning strategy and level of comprehension is expected to increase by
approximately 0.056 and 0.152, respectively, with improvements in “Self-regulation. Comprehension check,”
and by approximately 0.092 and 0.249 with improvements in “Self-regulation. Rereading,” by approximately
0.032 and 0.086, with the supportive use of “References: Probability and Statistics.”
SUMMARY
This study propose the method to make variables of the level of comprehension of learners as answer
characteristics in a class of probability and statistics based on actual student mistakes in answers to full
descriptive questions; and an analytical method was proposed and examined that aimed to qualitatively
improve learners’ skills by giving feedback to both the educators and the learners. First, the method of making
variables of answer characteristics from errors of answers in the mid-term and final examinations in
probability and statistics was proposed and examined. Second, a regression tree analysis was conducted to
Table 14. Results of Probabilistic Reasonings for Student 12
Understanding
the definition of
likelihood
Correct numerical
manipulation
Accurate
natation
Complete
description
Awareness of
object of
derivation
Correct
derivation rules
Self-efficacy: Useful 0.000 0.000
Self-efficacy: Within the scope
of the course 0.000 0.000
Self-efficacy: Outside the scope
of the course 0.000 0.000
Intrinsic value: Important 0.000 0.000
Intrinsic value: Interesting -0.065 -0.175
Cognitive strategy: Understand
in one’s own words
Cognitive strategy:
Identification of content 0.000 0.000
Cognitive strategy: Association
with one’s knowledge 0.000 0.000
Cognitive strategy: Repetitive
learning of key concepts
Self-regulation: Comprehension
check 0.056 0.152
Self-regulation: Self-directed
learning 0.000 0.000
Self-regulation: Rereading 0.092 0.249
Self-regulation: Uninterested
topics 0.000 0.000
Study habit: Daily preparation
and review 0.000 0.000
Study habit: Review before
examination
Study habit: Study with similar
problems 0.000 0.000
Study time: Central position
Study time: Dispersion
Study time: Probability
distribution
Study time: Relation between
variables 0.000 0.000
Study time: Statistical
estimation
Study time: Statistical test 0.000 0.000
Prescribed textbook
References: Probability and
statistics 0.032 0.086
References: Outside probability
and statistics 0.000 0.000
Web-based material
Other course materials or
materials from other
universities during study
0.000 0.000
INT ELECT J MATH ED
http://www.iejme.com 25 / 27
extract answer characteristics that depict learners’ level of comprehension for each question, in addition to
providing a possible study policy to improve comprehension of the question for learners. Furthermore, item
characteristic charts were used to visualize the relationship between comprehensive ability and the answer
characteristics and a comprehensive analysis of learner comprehension levels requiring improvement was
carried out to provide feedback for educators. Additionally, the relationship between the students’ learning
strategy and the answer characteristic was structured for each question using a BN model, and learning
strategies effective for qualitative improvement in comprehension for both learners as a whole and as
individuals were extracted and evaluated. Our findings suggested the presences of effective learning strategies
separately for each concept in each question, as well as for each level of expertise, whether it was basic
(understanding definition, etc.) or applied (Aware object of derivation, Complete description, etc.), in answer
characteristics. This indicates that a learning strategy’s importance differs according to the learning stage.
Furthermore, improvement in dispersion based on study time was revealed to be effective in a wide range of
questions in both the mid-term and final examinations.
Disclosure statement
No potential conflict of interest was reported by the authors.
Notes on contributors
Michiko Tsubaki – The University of Electro-Communications, Japan.
Wataru Ogawara – The University of Electro-Communications, Japan.
Kenta Tanaka – The University of Electro-Communications, Japan.
REFERENCES
Akiyama, T., Toyota, H., & Iwama, T. (2015). Combing trace line of distractors on the basis of a hypothesis
and a method to verify it in an error analysis using an item characteristics chart. Kansei Engineering,
14(3), 443-455.https://doi.org/10.5057/jjske.TJSKE-D-14-00081
Chen, J., Feng, J., Hu, J., & Sun, X. (2019). Causal analysis of learning performance based on Bayesian
network and mutual information. Entropy, 21(11), 1102-1136. https://doi.org/10.3390/e21111102
Durkin, K., & Rittle-Johnson,B. (2012). The effectiveness of using incorrect examples to support learning about
decimal magnitude. Learning and Instruction, 22(3), 206-214.
https://doi.org/10.1016/j.learninstruc.2011.11.001
Kahneman, D., & Tversky, A. (1982). On the study of statistical intuitions. Cognition, 11(2), 123-141.
https://doi.org/10.1016/0010-0277(82)90022-1
Lqbal, K., Yin, X., Hao, H., IIyas, Q. M., & Ali, H. (2015). An Overview of Bayesian Network Applications in
Uncertain Domains. International Journal of Computer Theory and Engineering, 7(6), 416-427.
https://doi.org/10.1007/978-1-4899-7687-7_717
Pintrich, P. R., & De Groot, E. V. (1990). Motivational and self-regulated learning components of classroom
academic performance. Journal of Educational Psychology, 82(1), 33-40. https://doi.org/10.1037/0022-
0663.82.1.33
Rushton, S. J. (2018). Teaching and learning mathematics through error analysis. Fields Mathematics
Education Journal, 1(1), article number 3. https://doi.org/10.1186/s40928-018-0009-y
Scutari, M., & Denis, J. (2014). Bayesian Networks with Examples in R, New York: Chapman and Hall/CRC.
https://doi.org/10.1201/b17065
Sulistyani, N. (2019). Error analysis in solving inferential statistics problems for psychology students. Journal
of Physics: Conference Series, 1180 012006. https://doi.org/10.1088/1742-6596/1180/1/012006
Targo, L. (2017). “Regression Trees,” In Sammut, C. and Webb,G.I.(eds.), Encyclopedia of Machine Learning
and Data Mining, Springer, Boston, MA. https://doi.org/10.1007/978-1-4899-7687-1_717
INT ELECT J MATH ED
http://www.iejme.com 27 / 27
2) Final examination
http://www.iejme.com