Embed Size (px)
Citation preview
Department of Mechanical and Aerospace Engineering
An Analysis of Bitcoin and the Proof of Work Protocols Energy
Consumption, Growth, Impact and Sustainability
Author: David Taylor
Supervisor: Professor Joe Clarke
A thesis submitted in partial fulfilment for the requirement of the degree
Master of Science
Sustainable Engineering: Renewable Energy Systems and the Environment
2018

Copyright Declaration
This thesis is the result of the author’s original research. It has been composed by the author and has not been previously submitted for examination which has led to the award of a degree.
The copyright of this thesis belongs to the author under the terms of the United Kingdom Copyright Acts as qualified by University of Strathclyde Regulation 3.50. Due acknowledgement must always be made of the use of any material contained in, or derived from, this thesis.
Signed: D.Taylor Date: 24/08/2018

Acknowledgements:
I wish to thank Professor Joe Clarke for his guidance and advice through out this project.
I would also like to thank Zsuzsanna, Ali and Emma for their tireless support over the past year and throughout my studies.
08Fall
4
1ExecutiveSummary:....................................................................................................8
2 Introduction................................................................................................................9
3.1 Abbreviations:.......................................................................................................11
3.2 KeyDefinitionsandBackgroundKnowledge:.........................................................12
3.2.1Blockchain:.............................................................................................................12
3.2.2Hashfunctions:.......................................................................................................12
3.2.3ProofofWork:........................................................................................................12
3.2.4Hash(Rate):............................................................................................................13
3.2.5SHA256:..................................................................................................................13
3.2.6Mining:...................................................................................................................13
3.2.7ASIC:.......................................................................................................................14
3.2.8BitcoinSecurityprotocol:........................................................................................14
3.2.9NetworkDifficulty:..................................................................................................14
3.2.10ProofofStake:......................................................................................................15
3.2.11LightningNetwork:...............................................................................................15
3.2.12BlockReward:.......................................................................................................15
4 LiteratureReview:....................................................................................................16
4.1AlexdeVries–BitcoinsGrowingEnergyProblem[18]................................................16
4.1.1EconomicBasedApproach......................................................................................16
4.2MorganStanley,GMOandBitcoinMinerProduction[21][22]...................................17
4.3MarcBevand-ElectricityConsumptionofBitcoin:AMarketBasedApproach[23].....18
4.3.1EconomicsofMining...............................................................................................20
4.3.2ProfitabilityThresholdassumption.........................................................................21
4.4DataCentreCoolingandPUEConsiderations.............................................................21
4.5GlobalElectricityPrices...............................................................................................23
4.7PartB–GrowthAnalysis............................................................................................24
4.7.2ASICProgression.....................................................................................................25
4.8PartC–ComparisonofFinancialSystems..................................................................26
4.8.1HassMcCook-AnOrder-of-MagnitudeEstimateoftheRelativeSustainabilityoftheBitcoinNetwork[30].......................................................................................................26
4.8.2LightningNetwork..................................................................................................27
4.9LiteratureConclusion.................................................................................................28
5
5 Methodology............................................................................................................31
5.1 PARTA-ProofofWorkEnergyEstimationsToolDevelopment..............................31
5.1.1.ASICHardwareStatistics........................................................................................31
5.1.2.ProfitabilityTable..................................................................................................32
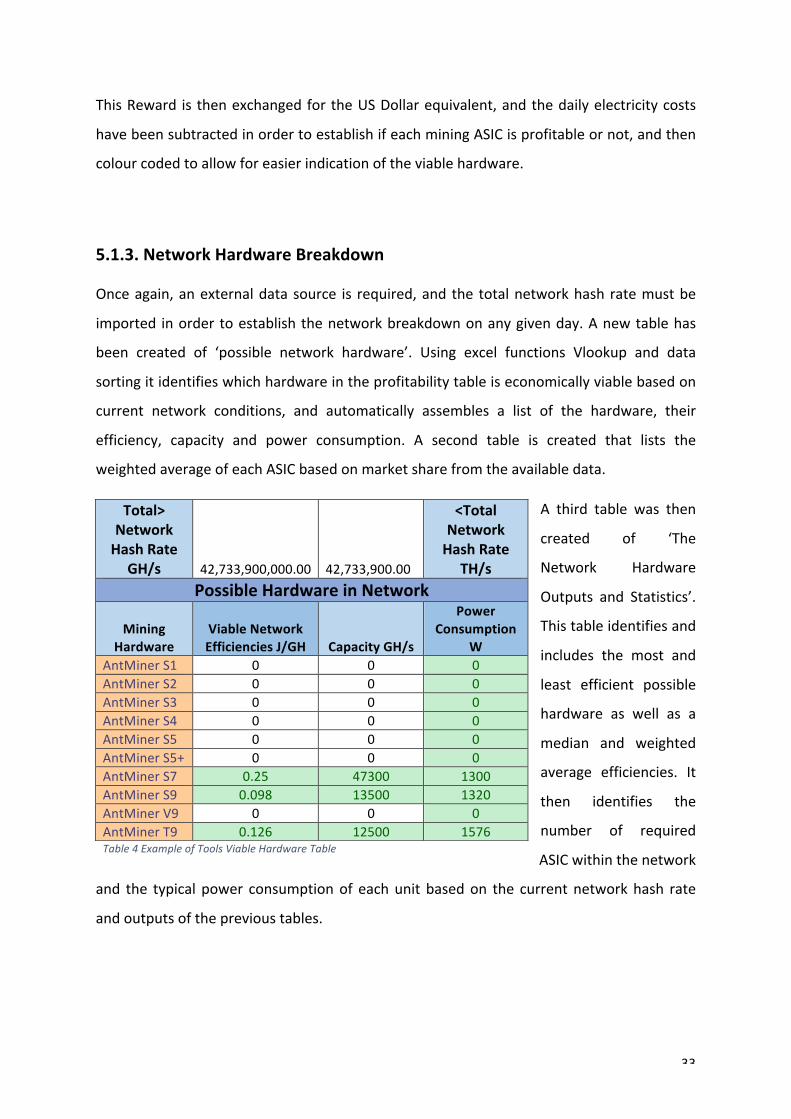
5.1.3.NetworkHardwareBreakdown..............................................................................33
5.1.4NetworkEnergyRequirements...............................................................................34
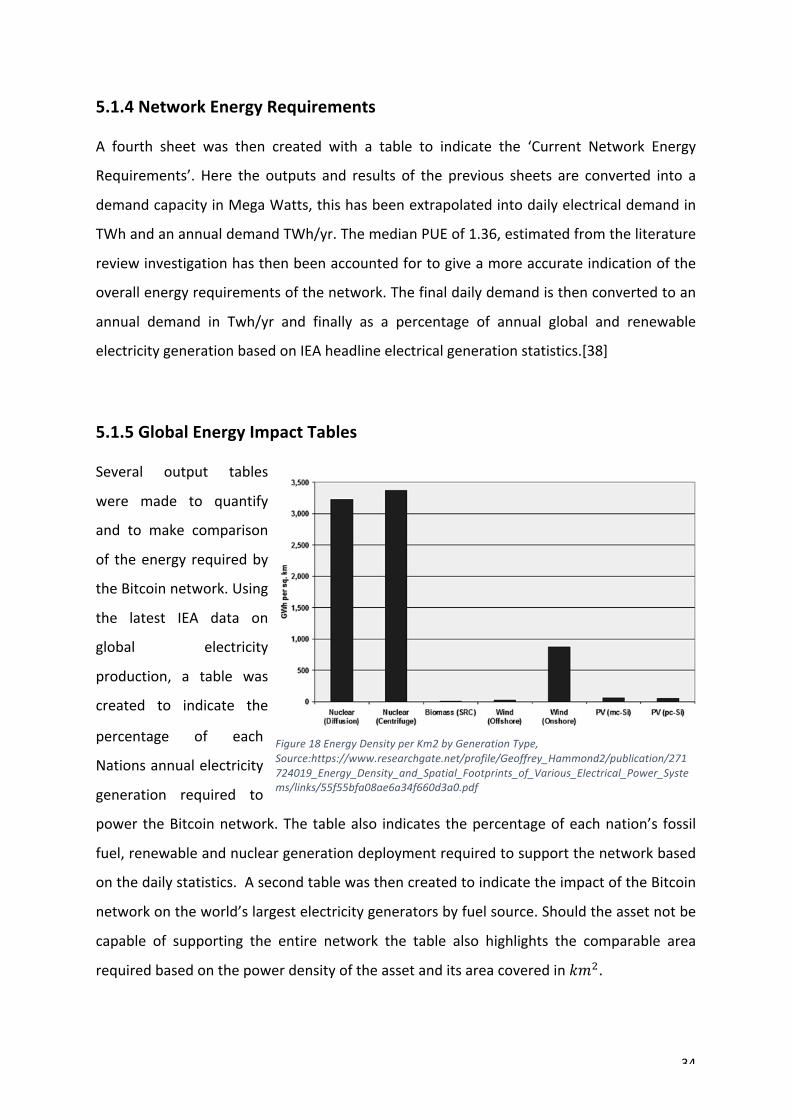
5.1.5GlobalEnergyImpactTables...................................................................................34
5.2.PartB–GrowthAnalysis...........................................................................................35
5.3.PartC–ComparisonoffinancialSystems..................................................................36
6.Results.........................................................................................................................37
6.1.PartA-EnergyEstimationsToolResults...................................................................37
6.1.1.CurrentEnergyRequirementsTable.......................................................................37
6.1.2.RequiredNewDeployment....................................................................................39
6.1.3.ASICDailyModellingResultsofNetworkDemand.................................................40
6.2.PartB–GrowthAnalysisResults...............................................................................40
6.2.1.ASICEfficiencyandGateSizeAnalysis....................................................................41
6.2.2.MarketPrice,HashRateTrendsandtheirEnergyImpact.......................................42
6.2.3.HistoricEnergyDemand.........................................................................................43
6.2.4.PossibleFutureTrends...........................................................................................44
6.3.PartC-ComparisonofFinancialSystems..................................................................47
7.Conclusion...................................................................................................................49
8.FutureWorks:..............................................................................................................53
9.References:..................................................................................................................54
10Appendices.................................................................................................................56
AppendixA………..……….ASICHardwareStatistics………………..……….EXCELTab1...............56
AppendixB………………….ProfitabilityTable…………………………………..EXCELTab2...............56
AppendixC…………………NetworkHardwareBreakdown……….………EXCELTab3...............56
AppendixD………………..EnergyImpact……………….…………………………EXCELTab4...............57
AppendixE…………………BitcoinDailyStatistics……………………………..EXCELTab5...............57
AppendixF…………………DemandandGrowth…………………………….…EXCELTab6................57
6
ListofFigures
Figure1PublicInterestinBlockchain…………………………………………………………………………………………………9
Figure2VenezuelanBitcoinTrading………………………………………………………………………………………………..10
Figure3AlltimeNetworkGrowth……………………………………………………………………………………………………13
Figure4HashRateandDifficultyRelationship…………………………………………………………………………………14
Figure5GMOQ2MiningOperationReport........................................................................................18
Figure6MarcBevand'sASICHistoryandEfficiencyChart……………………………………………………………….19
Figure7ExampleoftheProfitability/EconomicsofMiningasHashRateandDifficultyIncrease……..19
Figure8MarcBevandsProfitabilityThresholdComparedtoLeadingHardwareEfficiency………………20
Figure9GeographicalZoningofDataCentre;Temperatures,HumidityandAveragePUE……………….21
Figure10AveragePUEperReportingyear………………………………………………………………………………………22
Figure11NumberofDataCentresinEachRangewithinEurope……………………………………………………..23
Figure12AverageIndustrialElectricityPrices………………………………………………………………………………….23
Figure13WorldEnergyPriceStatistics……………………………………………………………………………………………24
Figure14EstimatedPowerConsumptionoftheBitcoinNetwork……………………………………………………24
Figure15CPUTransistorSizeProgression……………………………………………………………………………………….25
Figure16VisaNetOperationalModel……………………………………………………………………………………….…….27
Figure17VisualisationofLightningNetworkNodes………………………………………………………………………..28
Figure18EnergyDensityperKm2byGenerationType……………………………………………………………………34
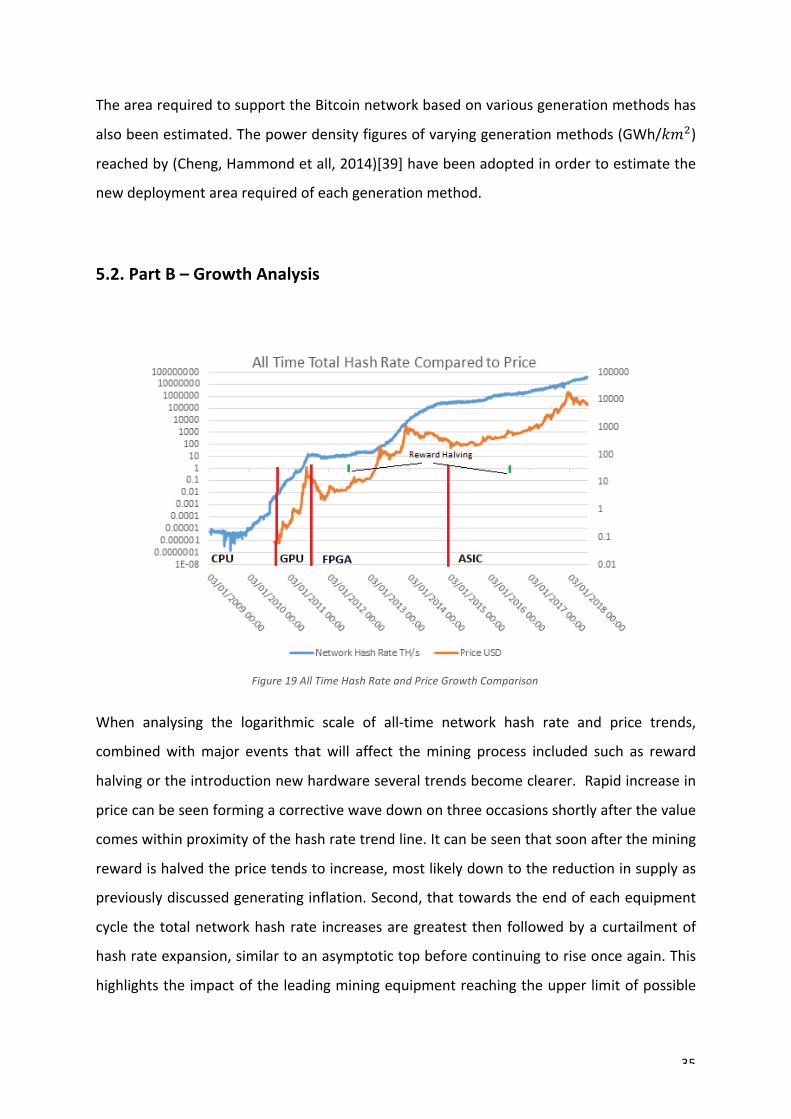
Figure19AllTimeHashRateandPriceGrowthComparison………………………………………………………..….35
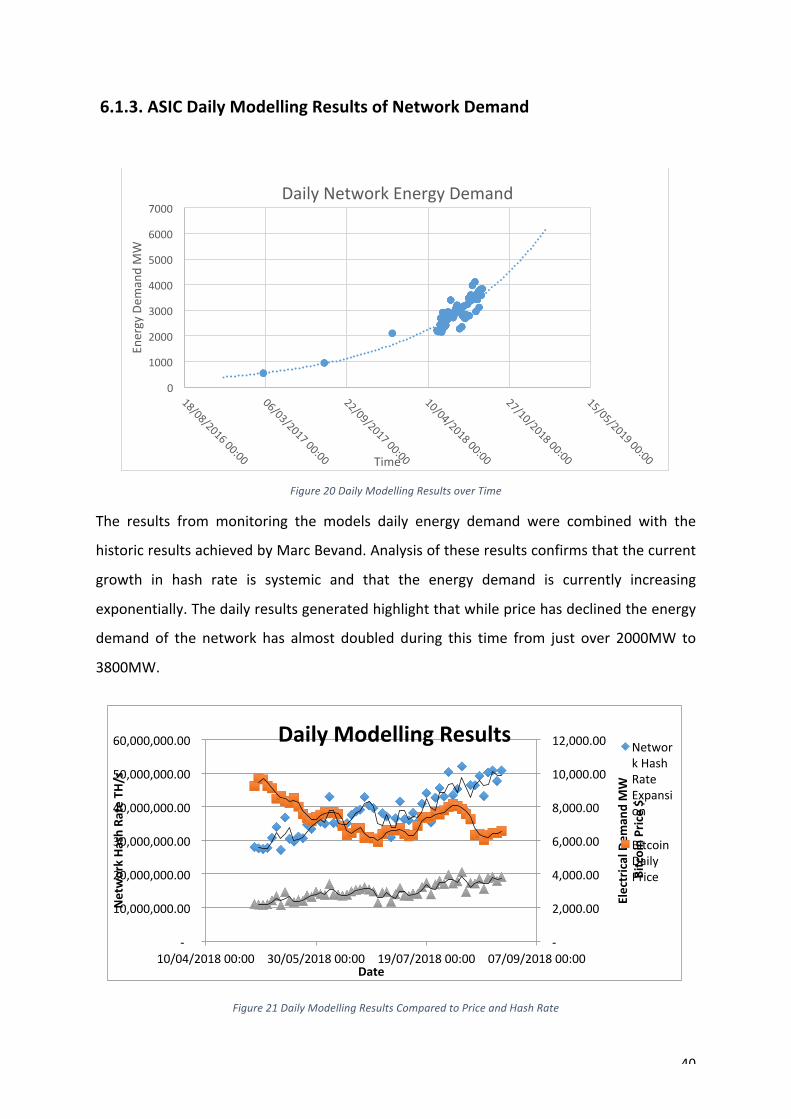
Figure20DailyModellingResultsoverTime……………………………………………………………………………………40
Figure21DailyModellingResultsComparedtoPriceandHashRate……………………………………………….40
Figure22ASICMiningChipTransistorProgressionResults……………………………………………….……………..41
Figure23CanaanASICMiningUnitHashRateandPowerConsumptionProgressionoverTime…….41
Figure24BitmainAISCUnitEfficiencyProgressions………………………………………………………………………..42
Figure25MediumTermPriceandHashrateGrowthComparison……………………………………………………42
Figure26ShortTermPriceandHashRateGrowthComparison………………………………………………………43
Figure27YearlyBitcoinEnergyDemand………………………………………………………………………………………….43
Figure28ThreePossiblePathsofBitcoin…………………………………………………………………………………………44
Figure 29 2040 Electrical Generation forecast Compared to the Continuation of Bitcoin NetworkExpansion………………………………………………………………………………………………………………………………………..45
7
Figure30TransactionEfficiencyComparisons………………………………………………………………………………….47
Figure31WindFarmCurtailmentRatesChina…………………………………………………………………………………50
Figure32AverageLCOEofRenewableGenerationSources,Source:IrenaRenewableSourceDatabase………………………………………………………………………………………………………………………………………….51
ListofTables
Table1AnalysisofMorganStanleyBitmainFindings……………………………………………………………………….29
Table2ExampleofToolsSuccessfulMiningChipsTable………………………………………………………………….31
Table3ExampleofToolsMiningEquipmentThatMadeittoMarketTable…………………………………….32
Table4ExampleofToolsViableHardwareTable…………………………………………………………………………….33
Table5NetworkElectricalDemandOutputTable……………………………………………………………………………37
Table 6 Required Portion of Existing National Electrical Generation to Support the BitcoinNetwork…………………………………………………………………………………………………………………………………………..38
Table7PortionofIndividualEnergyAssetRequiredtoSupportBitcoinNetwork…………………………….39
Table8RequiredElectricalGenerationDeploymenttosupportCurrentNetwork……………………………39
Table9Models2040EnergyDemandForecast……………………………………………………….………………………45
Table 10 Area required by 2040 to support Bitcoin Network Should current Expansion RateContinue…………………………………………………………………………………………………………………………………….……46
Table11ComparisonofFiatCurrencymintingtoBitcoinMintingProcess……………………….……………..47
8
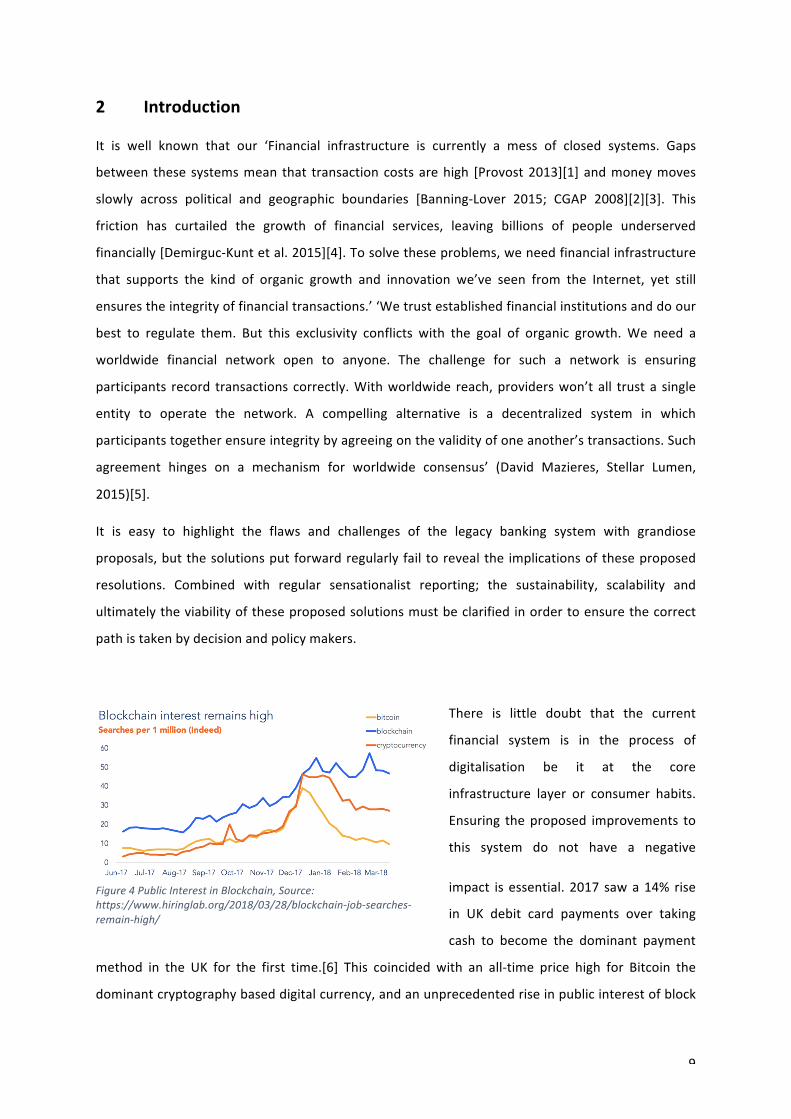
1 Abstract:
This report analyses the electrical demand of the Proof of Work Consensus mechanism and the
Bitcoin network, its impact on the global electrical supply and its sustainability from an energy
perspective. Current and future electrical demand estimations have been achieved through the
development of an energy estimations tool, and the analysis ofmining hardware trends. Further
work was undertaken to analyse historic and future growth and compare the efficiency of this
networktocurrentfinancialinfrastructure.Theresultsindicatedthatdespiteadeclineinvalue,the
network and its energy demand are expanding exponentially. Historic analysis shows that during
previous mining phases the network electrical demand was far greater, while future estimates
highlight the unsustainable growth rates of the eco system that we are currently witnessing.
Comparisonofthelegacy-bankinginfrastructuresuggeststhatwhileBitcoinisfarlessefficientasan
individual transaction layer,when current payment processing layers are combined the efficiency
differenceisreducedconsiderably.Thefindingssuggestthathistoricgrowthratesareunsustainable
in terms of current electrical supply, and further growth will likely focus on utilising low LCOE,
dispatchable Renewables in order to reduce operating costs. Should Bitcoin or any PoW based
cryptocurrencybecomeadominantdigitalpaymentmethod;continuedgrowthinminingoperations
will require considerable new deployment in order to reduce the resulting pressure placed on
currentgenerationinfrastructure.Coordinationbetweenminingoperationsandenergyproducersto
reducecurtailmentofgenerationassetsandincreaseprofitabilityisonepossibleapplicationsofthis
emergingindustry.Duetothelackofcentralgovernanceanddecentralisednatureofthistechnology
should price risewithout technological progress inmining hardware, it is inevitable the electrical
demandofthenetworkwillcontinuetoriseovertime.NationalEnergypolicymakersmuststartto
focus on the connotations and understand the impact on electrical networks of this emerging
industry, consider the negative and positive implications and develop policy that accepts this
industrybutprotectsenergymarketsandconsumers.
9
2 Introduction
It is well known that our ‘Financial infrastructure is currently a mess of closed systems. Gaps
between these systemsmean that transactioncostsarehigh [Provost2013][1]andmoneymoves
slowly across political and geographic boundaries [Banning-Lover 2015; CGAP 2008][2][3]. This
friction has curtailed the growth of financial services, leaving billions of people underserved
financially[Demirguc-Kuntetal.2015][4].Tosolvetheseproblems,weneedfinancialinfrastructure
that supports the kind of organic growth and innovation we’ve seen from the Internet, yet still
ensurestheintegrityoffinancialtransactions.’‘Wetrustestablishedfinancialinstitutionsanddoour
best to regulate them. But this exclusivity conflicts with the goal of organic growth. We need a
worldwide financial network open to anyone. The challenge for such a network is ensuring
participants record transactions correctly.Withworldwide reach,providerswon’tall trusta single
entity to operate the network. A compelling alternative is a decentralized system in which
participantstogetherensureintegritybyagreeingonthevalidityofoneanother’stransactions.Such
agreement hinges on a mechanism for worldwide consensus’ (David Mazieres, Stellar Lumen,
2015)[5].
It is easy to highlight the flaws and challenges of the legacy banking system with grandiose
proposals,butthesolutionsputforwardregularlyfail torevealthe implicationsoftheseproposed
resolutions. Combined with regular sensationalist reporting; the sustainability, scalability and
ultimatelytheviabilityoftheseproposedsolutionsmustbeclarifiedinordertoensurethecorrect
pathistakenbydecisionandpolicymakers.
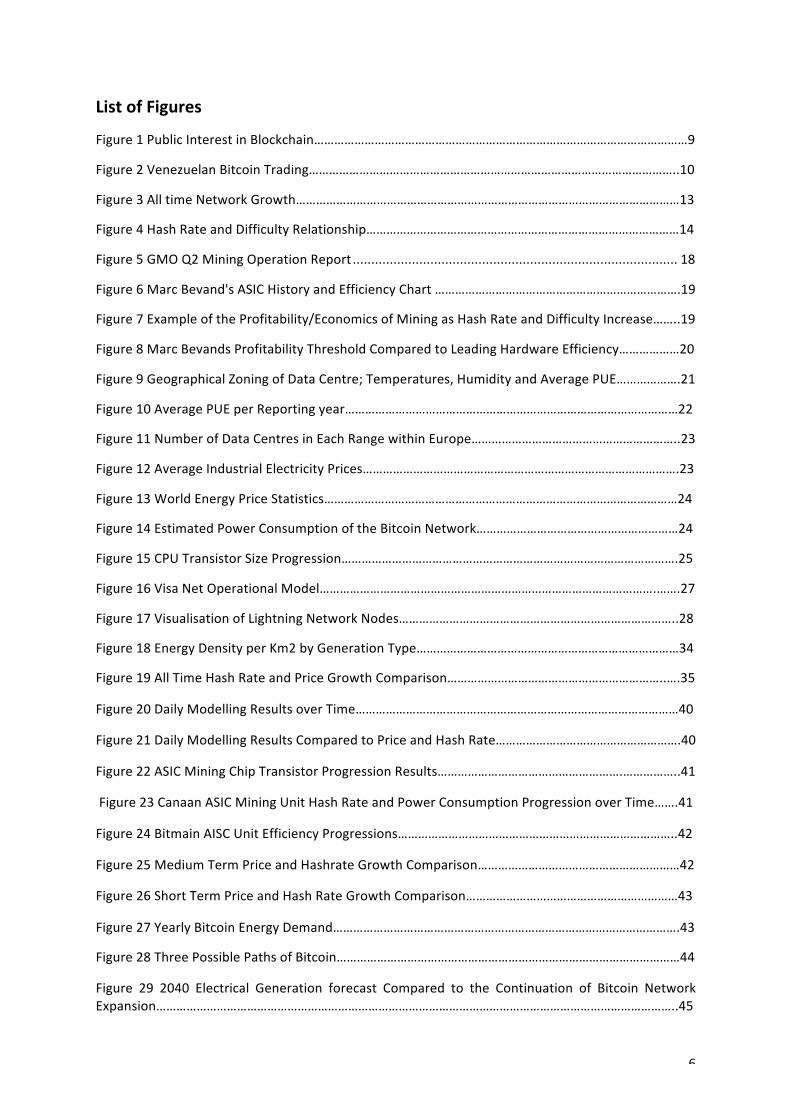
There is little doubt that the current
financial system is in the process of
digitalisation be it at the core
infrastructure layer or consumer habits.
Ensuring theproposed improvements to
this system do not have a negative
impact is essential. 2017 sawa14% rise
in UK debit card payments over taking
cash to become the dominant payment
method in the UK for the first time.[6] This coincided with an all-time price high for Bitcoin the
dominantcryptographybaseddigitalcurrency,andanunprecedentedriseinpublicinterestofblock
Figure4PublicInterestinBlockchain,Source:https://www.hiringlab.org/2018/03/28/blockchain-job-searches-remain-high/
10
chain technology, crypto currencyand theirpotential impacton the legacybanking system.Many
advocatesofthistechnologytoutBitcoinandBlockchaintosucceedtheglobalbankingnetworkbut
fail to address the possible implications and challenges still to be overcame such as the energy
intensity or transaction speeds. With this said recent disruption to the European Visa payment
systemhighlightthevulnerability,publicdependencyandnecessityforadigitalpaymentsystemto
remain secure and uninterrupted, something that Bitcoin and the Proof of Work Consensus
mechanismhassofarachieved.[7]
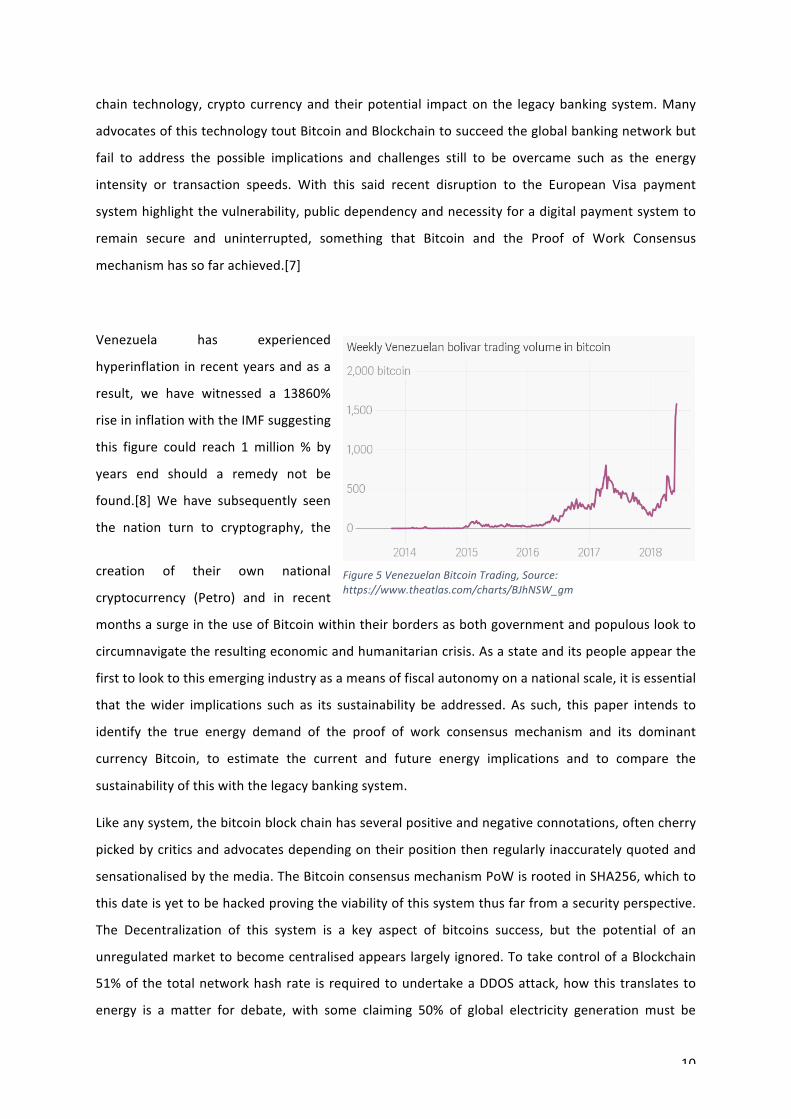
Venezuela has experienced
hyperinflation inrecentyearsandasa
result, we have witnessed a 13860%
riseininflationwiththeIMFsuggesting
this figure could reach 1 million % by
years end should a remedy not be
found.[8] We have subsequently seen
the nation turn to cryptography, the
creation of their own national
cryptocurrency (Petro) and in recent
monthsasurgeintheuseofBitcoinwithintheirbordersasbothgovernmentandpopulouslookto
circumnavigatetheresultingeconomicandhumanitariancrisis.Asastateanditspeopleappearthe
firsttolooktothisemergingindustryasameansoffiscalautonomyonanationalscale,itisessential
that thewider implications such as its sustainability be addressed. As such, this paper intends to
identify the true energy demand of the proof of work consensus mechanism and its dominant
currency Bitcoin, to estimate the current and future energy implications and to compare the
sustainabilityofthiswiththelegacybankingsystem.
Likeanysystem,thebitcoinblockchainhasseveralpositiveandnegativeconnotations,oftencherry
pickedbycriticsandadvocatesdependingontheirpositionthenregularlyinaccuratelyquotedand
sensationalisedbythemedia.TheBitcoinconsensusmechanismPoWisrootedinSHA256,whichto
thisdateisyettobehackedprovingtheviabilityofthissystemthusfarfromasecurityperspective.
The Decentralization of this system is a key aspect of bitcoins success, but the potential of an
unregulatedmarkettobecomecentralisedappearslargelyignored.TotakecontrolofaBlockchain
51%ofthetotalnetworkhashrate isrequiredtoundertakeaDDOSattack,howthistranslatesto
energy is a matter for debate, with some claiming 50% of global electricity generation must be
Figure5VenezuelanBitcoinTrading,Source:https://www.theatlas.com/charts/BJhNSW_gm

11
consumed before it is considered truly secure. As this system grows exponentially, this becomes
increasinglydifficultandcostlytorealise,suggestingthatafteracertainlevelofgrowthonlynation
statesor largeorganisedentitieswithexceptionalresourceshavethemeanstoundertakesuchan
attack.
SatoshiNakamotoassumedthatonlyCPU’swouldbeutilised intheminingprocess,howeveras is
normalwithany resource intensiveand competitiveprocess, it quicklybecameapparent that this
hascreatedaneconomyofscale,wherefromanindividualminingperspectiveagreaterhashrate
increases the probability of finding the next block first.[9] This has caused mining equipment to
evolverapidly,fortheprocesstobecomeindustrialisedandseenthepartialcentralisationofmining
by several large parties, and resulted in an alarming level of electrical consumption raising valid
concerns over the sustainability of this network. As we witness global efforts to curtail energy
consumptionandclimatechange,doestherapidriseofcryptocurrenciesimpedetheseefforts,and
does the promised economic inclusivity and immutability of bitcoin and Blockchain justify the
allegedlystaggeringenergydemandofsuchnetworksandcancurrentproposalssuchasPoSorthe
LightningNetworkalleviateanyoftheseconcerns?
3 Abbreviations,KeyDefinitionsandBackgroundKnowledge
3.1 Abbreviations:
1. ProofofWork: PoW
2. Bitcoin:BTC
3. ReusableProofofWork:RPOW
4. DenialofService:DDoS
5. ProofofStake:PoS
6. PeertoPeer:P2P
7. ApplicationSpecificIntegratedCircuit:ASIC
8. ComputerProcessingUnit:CPU
9. GraphicsProcessingUnit:GPU
10. FieldProgrammableGatewayArray:FPGA
11. Transactions:Tx
12
3.2KeyDefinitionsandBackgroundKnowledge:
3.2.1Blockchain:
AP2P ledger systemdesigned to remove thenecessityof trustbetween twoparties conductinga
transactionintheabsenceofacentralauthority.NewTransactionsarebundledandaddedinblocks
chronologicallytotheledgerbynodes(miners)inthesystem.Acopyofthisledgerisautomatically
distributedtothesenodes(computersinthenetwork)allowingforanindisputablecryptographically
timestampedrecordoftransactions.
3.2.2Hashfunctions:
Hashfunctionsareanyfunctionusedtomapdataofanysizeandtoreturnahashvalueordigestof
fixed length, allowing for accelerated look up or identifications of duplicates within a large file.
Bitcoin utilises cryptographic hash functions, amathematical algorithmdesigned to be a one-way
and infeasible to invert. ‘In the bitcoin protocol, hash functions are part of theblock hashing
algorithmwhich is used to write new transactions into the Blockchain through the mining
process.’[10]
3.2.3ProofofWork:
ProofofWorkisaneconomicbasedconsensusmechanismtoensurenetworksecurityandintegrity.
Itintentionallyresourceintensivebydesign,asitisapieceofdatathatisdifficulttoproduce(costly,
time consuming) but easy to verify. The concept originally proposed by Cynthia Dwork andMoni
Naor in 1993[11]. In 1997 Adam Back developed this concept further creating Hashcash PoW
functiontoreduceemailspamandDenialofserviceattacks(DoS).[12]Byensuringamodestamount
of computing power was allocated to each email the associated time, energy requirements and
ultimately costs become too significant to make attacks viable or worthwhile. In 1999 computer
scientist,HalFinneydevelopedRPOW.Buildingonthisconcept,Finneyproposedanelectronictoken
moneythatwasguaranteedbythevalueoftherealworldresourcesrequiredtomintaPoWtoken
without having to repeat the energy intensive minting process in future transactions.[13] Like
RPOW,It istheHashcashPoWsystemthatBitcoinutilisesforblockgeneration,withdecentralized
nodesverifyingtransactionsintheP2Pnetwork.
13
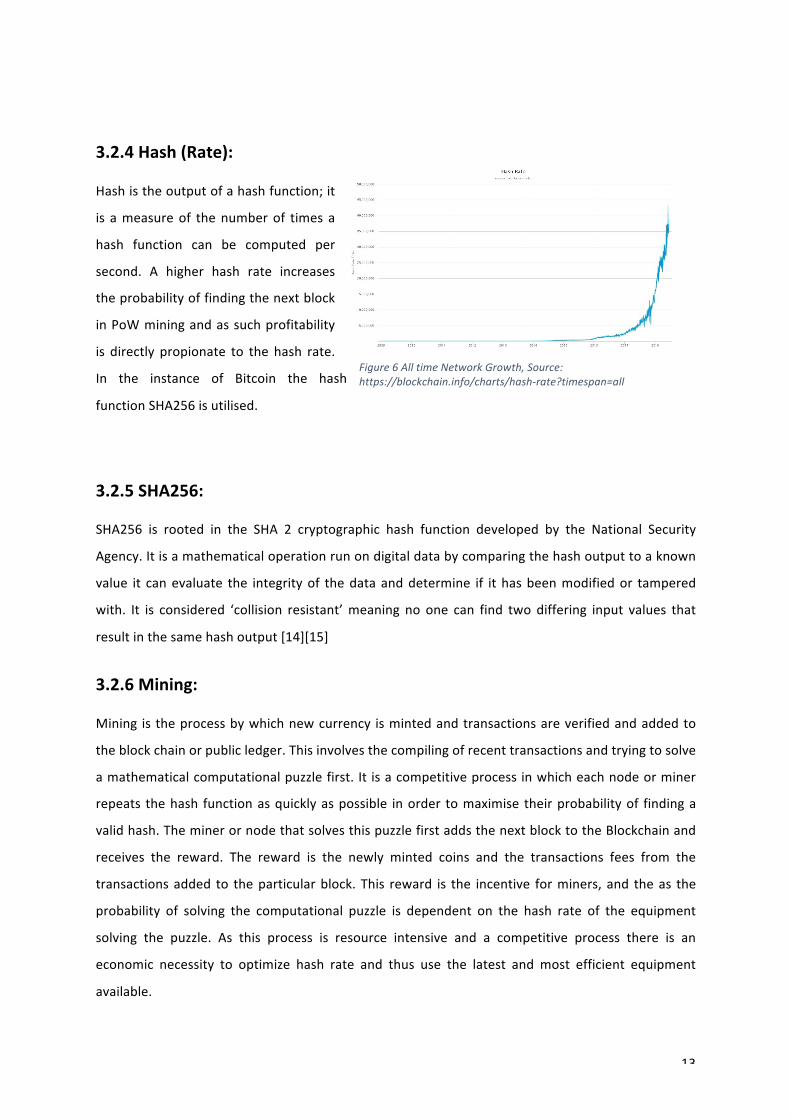
3.2.4Hash(Rate):
Hashistheoutputofahashfunction;it
is ameasureof thenumberof times a
hash function can be computed per
second. A higher hash rate increases
theprobabilityoffindingthenextblock
inPoWminingandassuchprofitability
is directly propionate to the hash rate.
In the instance of Bitcoin the hash
functionSHA256isutilised.
3.2.5SHA256:
SHA256 is rooted in the SHA 2 cryptographic hash function developed by the National Security
Agency.Itisamathematicaloperationrunondigitaldatabycomparingthehashoutputtoaknown
value it canevaluate the integrityof thedataanddetermine if ithasbeenmodifiedor tampered
with. It is considered ‘collision resistant’meaning no one can find two differing input values that
resultinthesamehashoutput[14][15]
3.2.6Mining:
Mining is theprocessbywhichnewcurrency ismintedandtransactionsareverifiedandaddedto
theblockchainorpublicledger.Thisinvolvesthecompilingofrecenttransactionsandtryingtosolve
amathematicalcomputationalpuzzlefirst. It isacompetitiveprocessinwhicheachnodeorminer
repeats thehash functionasquicklyaspossible inorder tomaximise theirprobabilityof findinga
validhash.TheminerornodethatsolvesthispuzzlefirstaddsthenextblocktotheBlockchainand
receives the reward. The reward is the newly minted coins and the transactions fees from the
transactionsadded to theparticularblock.This reward is the incentive forminers, and theas the
probability of solving the computational puzzle is dependent on the hash rate of the equipment
solving the puzzle. As this process is resource intensive and a competitive process there is an
economic necessity to optimize hash rate and thus use the latest and most efficient equipment
available.
Figure6AlltimeNetworkGrowth,Source:https://blockchain.info/charts/hash-rate?timespan=all
14
3.2.7ASIC:
ASICoranApplicationSpecificIntegratedCircuitisanintegratedcircuitdesignedforaspecificuse.
PreviouslyCPU,GPUandFPGA’sweredeployed in theminingprocess,with theoriginal intention
stated in Satoshi Nakamoto’s White Paper referring to PoW as ‘essentially one CPU-one vote’.
Within several yearsminers looking to gain a competitive edgemoved to GPU’s, then FPGA’s in
ordertooptimizetheircomputationalhashrate.
3.2.8BitcoinSecurityprotocol:
(PratandWalter,2018)statethatBitcoin’ssecuritymodelreliesonahybridapproachthatcombines
the robustness of its cryptographic primitives with the economic incentives of the agents
participating in theexecutionof itsprotocol. Inparticular,minersplayacentral roleas theystack
transactionsintoblocksandtimestampthoseinacryptographicallyrobustwaybyaddinga"proof-
of-work".ThecostofattackingBitcoinisproportionaltothecomputingpowerdeployedbyminers
becauseitdeterminesthedifficultyofthecryptographicpuzzlesincludedintheproofs-of-work.[16]
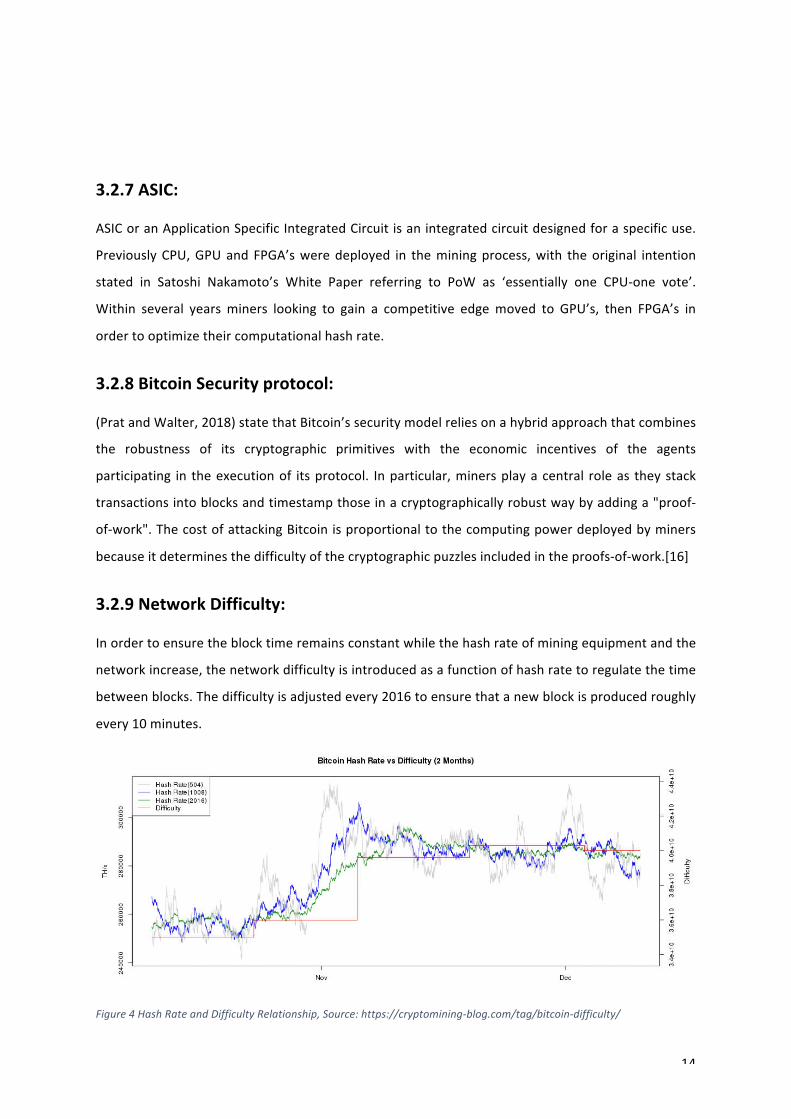
3.2.9NetworkDifficulty:
Inordertoensuretheblocktimeremainsconstantwhilethehashrateofminingequipmentandthe
networkincrease,thenetworkdifficultyisintroducedasafunctionofhashratetoregulatethetime
betweenblocks.Thedifficultyisadjustedevery2016toensurethatanewblockisproducedroughly
every10minutes.
Figure4HashRateandDifficultyRelationship,Source:https://cryptomining-blog.com/tag/bitcoin-difficulty/
15
3.2.10ProofofStake:
PoSisanalternativetotheProofofWorksystemthatseekstoaddresstheenergyintensityofthe
protocol.Insteadofrequiringincreasingcomputingpowerduringtheminingprocess,PoSallocates
miningtonodes inthenetworkbasedonthequantityofcoinstheyareholdingortheirstakeand
trust is upheld by the stake of the node being utilised as collateral. As a node does not require
increasingamountofcomputingpowertoremaincompetitive,theenergyintensityoftheprotocol
isreduced.
3.2.11LightningNetwork:
The Lightning Network is proposed solution to increase the transaction volume of the Bitcoin
Blockchain.Itisasecondlayeroffchainprotocoldesignedtofacilitatefastmicrotransactions.Using
a PoS model and nodes within the network, in theory it is intended to resolve the transaction
scalabilityproblemfacingBitcoinandothercryptocurrencies.
3.2.12BlockReward:
Theblockrewardistherewardallocatedtominersforthecreationofeachnewblock.Thisreward
currentlystandsat12.5BTCperblockandhalvesapproximatelyevery4yearsor210000blocks,and
isduetohalveagaininMay2020.Theblockrewardhalvingisaneconomicmeasureintroducedby
Nakamotocomparabletoquantitativeeasing,byreducingtherewardscarcity inordertomaintain
inflation.
16
4 LiteratureReview:
Several attempts havebeenmade to estimate the energy demandof theBitcoin network and its
overall sustainability, with the results and methodologies regularly debated, reported and
sensationalised.Amongstthemostprominentestimationsaretwostandoutworks (AlexdeVries,
2018,MarcBevand, 2017).Both approacheshave their individualmerits and limitations; the final
results produced by each highlight the varying energy demand estimations and the difficulties in
reachingconsensusonaccuratemethodologiesandresults.Thereareseveralcorechallengesfacing
those interested in modelling and forecasting of the networks energy demand that must be
overcame:
• TransparencyofASICmanufacturersandMiningOperations
• ConstantlyChangingProfitability
• ReliableDatasources
• VaryingRegionalandPrivateElectricityCosts
• MininghardwareProgression
4.1AlexdeVries–BitcoinsGrowingEnergyProblem[18]
DeVries states that themajorityofpreviousestimationshavebeenmadeusingcurrenthardware
efficiencies (J/GH) but highlights the limitations of utilising total network hash rate as the main
technique to estimate network power consumption. ‘While it is possible to observe the total
networkhashrate,thedevicesgeneratingthisateachnodeareimplausibletoidentifywithoutfirst-
handknowledgeofthenode,andasmining isahighlycompetitiveandsecretivebusinessthere is
littleinformationregardingwhichdevicesarebeingdeployedbythesenodesorminers.’Thuswhile
hash rate and the current most efficient devices can produce a best case scenario for network
energy consumption, how the total network hash rate is broken down between devices is a
challengeinitsself.
4.1.1EconomicBasedApproach
De Vries is critical of a hash rate based approach as it offers no insight into future energy
requirements,andinsteadinsistsonaneconomicapproachusingAdamHayes[19]worktovalidate
the assumption that ‘minerswill produce [hash calculations] until theirmarginal costs equal their
marginalproduct’.Onceequilibrium is reachedwhere it isno longerprofitableaminerwilleither

17
stopminingorreplacetheequipmentwithmoreefficientdevices.Inordertoestablishaneconomic
approachDeVriesbuildsonAdamHayesworkandtakeshardwarecostsaswellaselectricitycosts
into account. Bydoing so an estimationof hardware costsmust bemade in order to establish at
whichpointmarketequilibriumandprofitabilitycanbeestimated.AgainbuildingonworkbyJimmy
Song[20] and adapting it to the task De Vries has had to make several assumptions in order to
estimateproductioncosts,lifespan,andtotallifecyclecostsoftheleadinghardwaretheAntminer
S9.Whileincreasingthenumberofassumptionsmayreducethecredibilityofthework,DeVrieshas
uncoverednumerouspiecesofcriticalresearch,broughtittotheforefrontandhasnotshiedaway
fromthepotentialshortcomingsofsomanyassumptions.Onepotentialshortcomingistheassumed
globalelectricitypriceof$0.05KWh,BITMAINhaveacknowledgedtheypaylessthanthisperKWh
andit is likelythatmanyothers,specifically inChinapaylessthanthistoo,whilemanysmallscale
minerswilllikelypaymore.Anothershortcomingofthisapproachisthevaryingsalepriceofmining
hardware,astheretailandresalevalueofthesemachinesvarieswithcoinpriceanddemand.
4.2MorganStanley,GMOandBitcoinMinerProduction[21][22]
AspreviouslystatedASICproductiondetailsareunderstandablydifficulttoacquireespeciallyfroma
privately owned company. After the price of Bitcoin and thus profitability dropped in 2014many
ASICmanufacturingstart-upswentintobankruptcy(ashighlightedinFigure5),thisallowedforthe
surviving manufacturers to take larger shares of the market and in recent years BITMAIN have
become the industry leadingmanufacturer. Centralisation of hardwaremanufacturing has serious
implicationsforadecentralisednetworkasitallowsforthepossibilityofcentralisedcontrolofthe
network.AssuchitisnotinBITMAINSintereststorevealsuchdatabutcriticalfromaninvestment
perspective toestablish theirmarketdominance. Thishas led toMorganStanley conducting their
own investigation into BITMAINs production output of the Antminer S9 whom suggest BITMAIN
haveamarketshareof70%.
This has been achieved through a chip based production estimate and data requests of TSMC
(TaiwanSemi-ConductorManufacturingCompany)apublicly listedcompanywhosupply thechips
for BITMAINs Antminer. Morgan Stanley estimate that ‘with 20000 16nm wafers a month being
ordered, each wafer capable of supplying chips for 27-30 mining rigs per month Bitmain could
producehalfamillionAntminerS9permonth.’
Unlike the majority of mining ASIC manufacturers, the Japanese company GMO Internet have
submittedthemonthlystatisticsfromtheirminingbusinesswiththeirQuarterlyreports.Thisallows
foranindicationtothenumberofrigsproducedbythecompanyastheminingequipmentisduefor
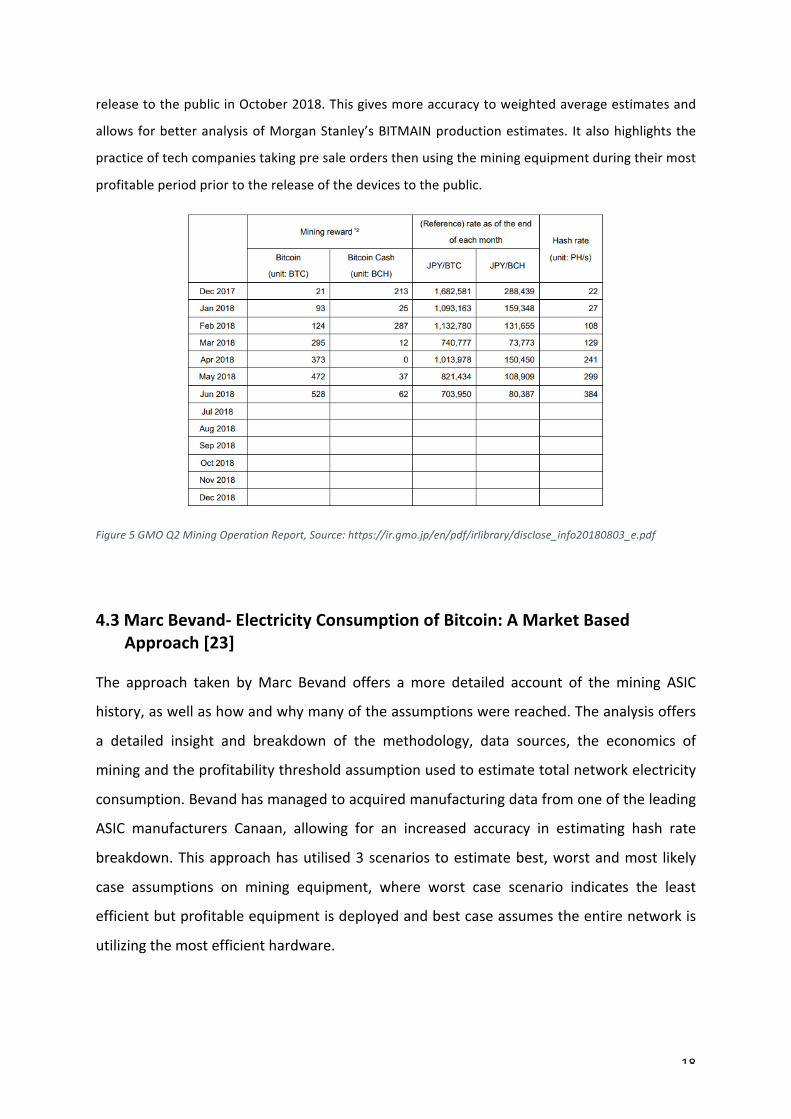
18
releasetothepublicinOctober2018.Thisgivesmoreaccuracytoweightedaverageestimatesand
allowsforbetteranalysisofMorganStanley’sBITMAINproductionestimates. Italsohighlightsthe
practiceoftechcompaniestakingpresaleordersthenusingtheminingequipmentduringtheirmost
profitableperiodpriortothereleaseofthedevicestothepublic.
Figure5GMOQ2MiningOperationReport,Source:https://ir.gmo.jp/en/pdf/irlibrary/disclose_info20180803_e.pdf
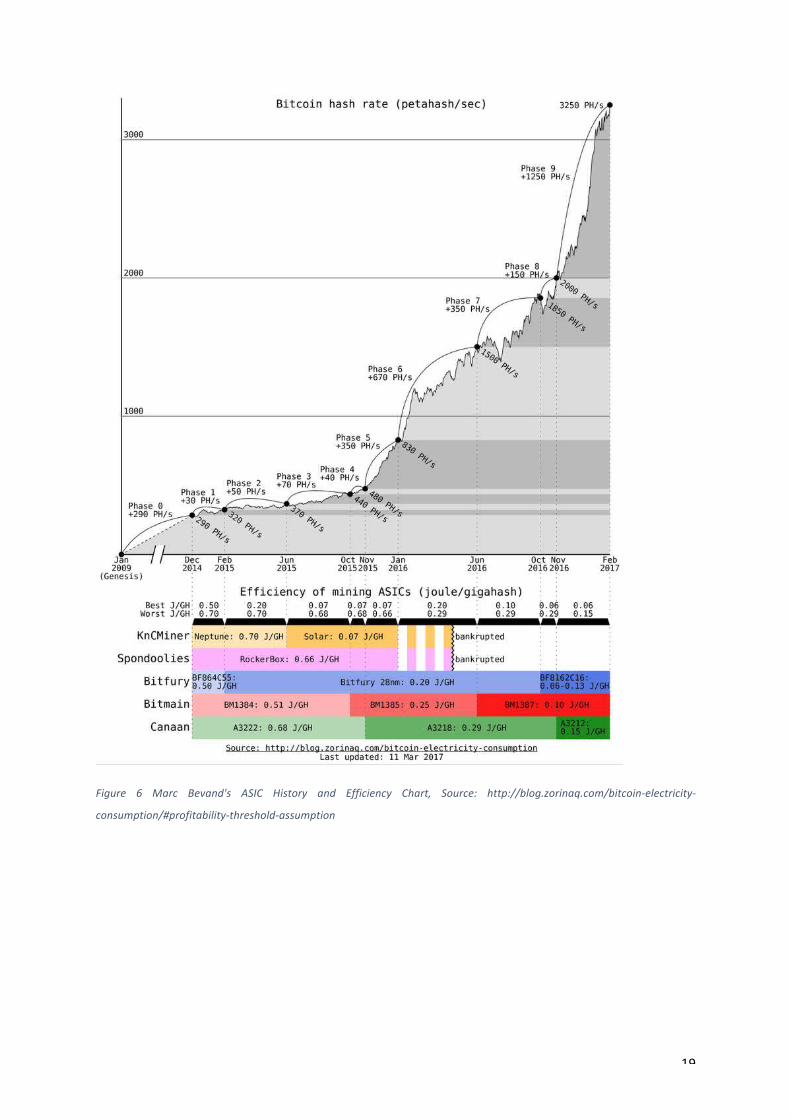
4.3MarcBevand-ElectricityConsumptionofBitcoin:AMarketBasedApproach[23]
The approach taken byMarc Bevand offers amore detailed account of themining ASIC
history,aswellashowandwhymanyoftheassumptionswerereached.Theanalysisoffers
a detailed insight and breakdown of the methodology, data sources, the economics of
miningandtheprofitabilitythresholdassumptionusedtoestimatetotalnetworkelectricity
consumption.Bevandhasmanagedtoacquiredmanufacturingdatafromoneoftheleading
ASIC manufacturers Canaan, allowing for an increased accuracy in estimating hash rate
breakdown.Thisapproachhasutilised3scenariostoestimatebest,worstandmost likely
case assumptions on mining equipment, where worst case scenario indicates the least
efficientbutprofitableequipmentisdeployedandbestcaseassumestheentirenetworkis
utilizingthemostefficienthardware.
19
Figure 6 Marc Bevand's ASIC History and Efficiency Chart, Source: http://blog.zorinaq.com/bitcoin-electricity-
consumption/#profitability-threshold-assumption
20
4.3.1EconomicsofMining
Figure 7 Example of the Profitability/Economics of Mining as Hash Rate and Difficulty Increase,
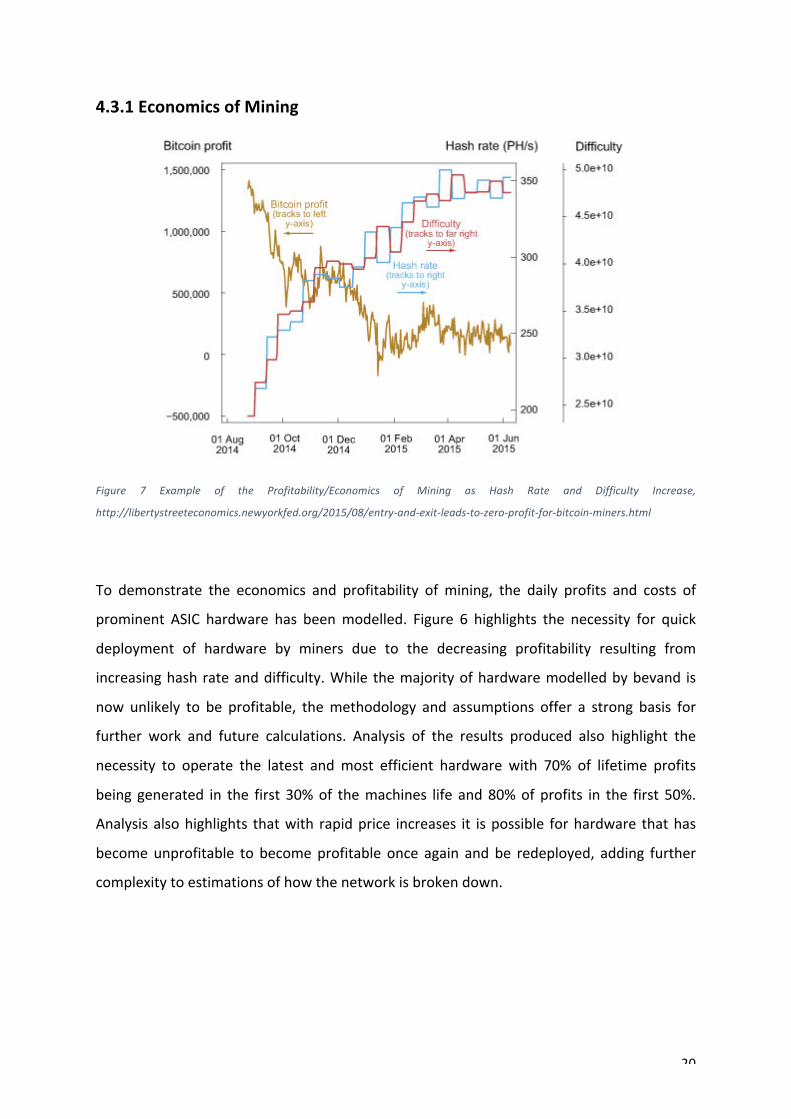
http://libertystreeteconomics.newyorkfed.org/2015/08/entry-and-exit-leads-to-zero-profit-for-bitcoin-miners.html
To demonstrate the economics and profitability of mining, the daily profits and costs of
prominent ASIC hardware has beenmodelled. Figure 6 highlights the necessity for quick
deployment of hardware by miners due to the decreasing profitability resulting from
increasinghashrateanddifficulty.While themajorityofhardwaremodelledbybevand is
now unlikely to be profitable, themethodology and assumptions offer a strong basis for
further work and future calculations. Analysis of the results produced also highlight the
necessity to operate the latest andmost efficient hardware with 70% of lifetime profits
being generated in the first 30%of themachines life and80%ofprofits in the first 50%.
Analysisalsohighlights thatwith rapidprice increases it ispossible forhardware thathas
becomeunprofitable to becomeprofitable once again andbe redeployed, adding further
complexitytoestimationsofhowthenetworkisbrokendown.
21
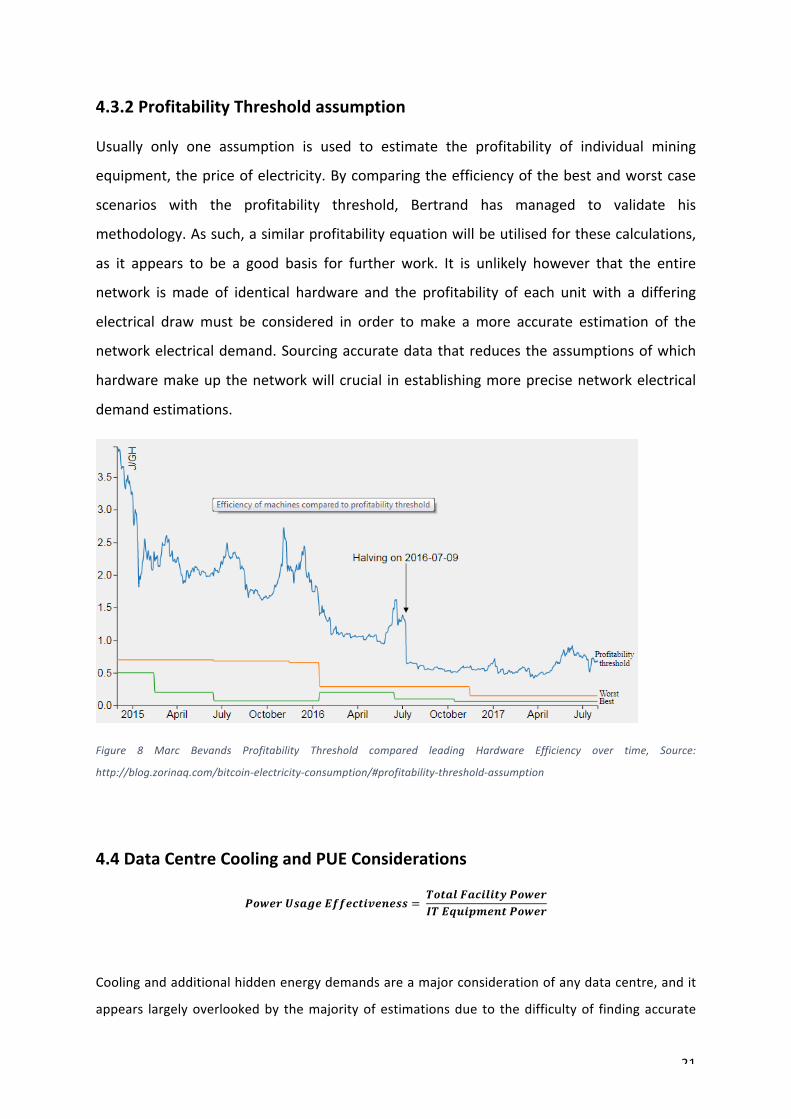
4.3.2ProfitabilityThresholdassumption
Usually only one assumption is used to estimate the profitability of individual mining
equipment,thepriceofelectricity.Bycomparingtheefficiencyofthebestandworstcase
scenarios with the profitability threshold, Bertrand has managed to validate his
methodology.Assuch,asimilarprofitabilityequationwillbeutilisedforthesecalculations,
as it appears to be a good basis for further work. It is unlikely however that the entire
network ismade of identical hardware and the profitability of each unit with a differing
electrical drawmust be considered in order tomake amore accurate estimation of the
networkelectricaldemand.Sourcingaccuratedatathatreducestheassumptionsofwhich
hardwaremakeupthenetworkwillcrucial inestablishingmoreprecisenetworkelectrical
demandestimations.
Figure 8 Marc Bevands Profitability Threshold compared leading Hardware Efficiency over time, Source:
http://blog.zorinaq.com/bitcoin-electricity-consumption/#profitability-threshold-assumption
4.4DataCentreCoolingandPUEConsiderations
𝑷𝒐𝒘𝒆𝒓 𝑼𝒔𝒂𝒈𝒆 𝑬𝒇𝒇𝒆𝒄𝒕𝒊𝒗𝒆𝒏𝒆𝒔𝒔 = 𝑻𝒐𝒕𝒂𝒍 𝑭𝒂𝒄𝒊𝒍𝒊𝒕𝒚 𝑷𝒐𝒘𝒆𝒓𝑰𝑻 𝑬𝒒𝒖𝒊𝒑𝒎𝒆𝒏𝒕 𝑷𝒐𝒘𝒆𝒓
Coolingandadditionalhiddenenergydemandsareamajorconsiderationofanydatacentre,andit
appears largelyoverlookedby themajorityofestimationsdue to thedifficultyof findingaccurate
22
data.ThisisreferredtoasthePUE(PowerUsageEffectiveness)andDeVrieshighlightsthatwithout
this consideration the estimations are limited in their accuracy. As this industry develops, the
inefficienciesofdatacentresarebecomingaseriousconsiderationandassuchmarketleadershave
begun to optimize mining farm efficiency through relocation and solutions such as immersion
cooling,withaclaimedPUEof1.02.DeVriessuggeststhiswouldaccountfor lessthan1%oftotal
network hash rate while Bevand insists that unlike conventional data centres mining operations
aggressivelyoptimizetheirPUE.
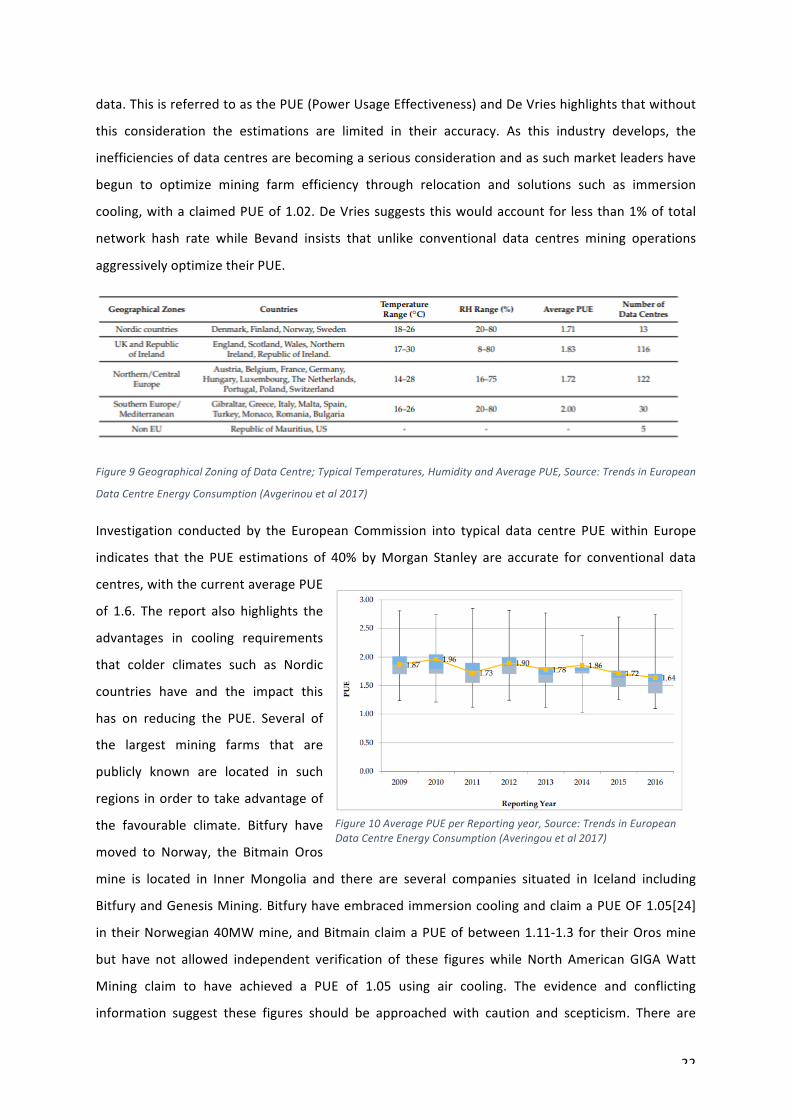
Figure9GeographicalZoningofDataCentre;TypicalTemperatures,HumidityandAveragePUE,Source:TrendsinEuropean
DataCentreEnergyConsumption(Avgerinouetal2017)
Investigation conducted by the European Commission into typical data centre PUEwithin Europe
indicates that the PUE estimations of 40% byMorgan Stanley are accurate for conventional data
centres,withthecurrentaveragePUE
of 1.6. The report also highlights the
advantages in cooling requirements
that colder climates such as Nordic
countries have and the impact this
has on reducing the PUE. Several of
the largest mining farms that are
publicly known are located in such
regions inordertotakeadvantageof
the favourable climate. Bitfury have
moved to Norway, the Bitmain Oros
mine is located in Inner Mongolia and there are several companies situated in Iceland including
BitfuryandGenesisMining.BitfuryhaveembracedimmersioncoolingandclaimaPUEOF1.05[24]
intheirNorwegian40MWmine,andBitmainclaimaPUEofbetween1.11-1.3fortheirOrosmine
but have not allowed independent verification of these figures while North American GIGAWatt
Mining claim to have achieved a PUE of 1.05 using air cooling. The evidence and conflicting
information suggest these figures should be approached with caution and scepticism. There are
Figure10AveragePUEperReportingyear,Source:TrendsinEuropeanDataCentreEnergyConsumption(Averingouetal2017)
23
obviousfinancialbenefitsbyreducingthePUEandassuch,itisreasonabletoassumethesesystems
are optimised where possible. Cooler climates clearly offer an advantage in terms of reducing
cooling requirements,however theapproachesand reductionsachievedappear sensationalised in
someinstanceseitherbymediaorformarketing.ItappearsunlikelythataPUEof1.05isachievable
for the averageminer, especially through the use of air cooling alone. If this ratewas feasible it
would be unlikely that several industry leaders would implement techniques such as immersion
cooling as the associated costs of implementing such techniqueswouldbeunnecessarily costly in
comparisontotheuseofaircoolinginmostinstances.
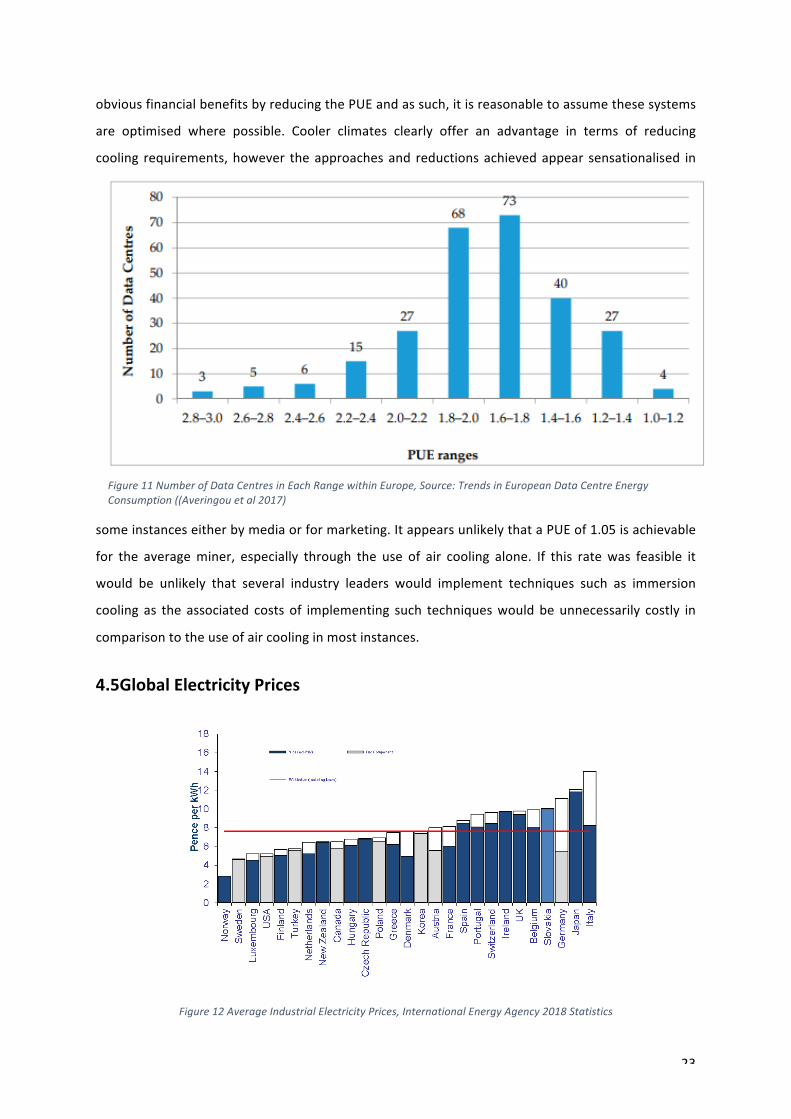
4.5GlobalElectricityPrices
Figure12AverageIndustrialElectricityPrices,InternationalEnergyAgency2018Statistics
Figure11NumberofDataCentresinEachRangewithinEurope,Source:TrendsinEuropeanDataCentreEnergyConsumption((Averingouetal2017)
24
Figure13WorldEnergyPriceStatistics,Source:InternationalEnergyAgency2018Overview
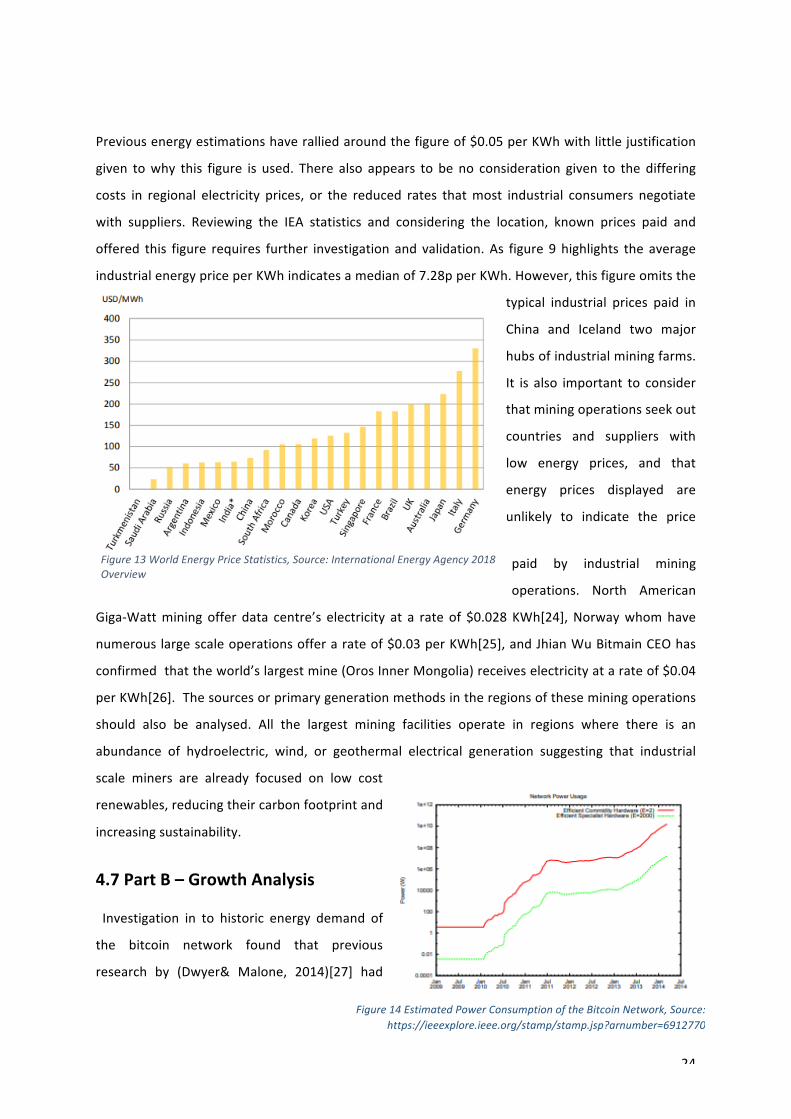
Previousenergyestimationshaveralliedaroundthefigureof$0.05perKWhwithlittlejustification
given towhy this figure is used. There also appears to be no consideration given to the differing
costs in regional electricity prices, or the reduced rates thatmost industrial consumers negotiate
with suppliers. Reviewing the IEA statistics and considering the location, known prices paid and
offered this figure requires further investigation and validation.As figure 9 highlights the average
industrialenergypriceperKWhindicatesamedianof7.28pperKWh.However,thisfigureomitsthe
typical industrial prices paid in
China and Iceland two major
hubsofindustrialminingfarms.
It is also important to consider
thatminingoperationsseekout
countries and suppliers with
low energy prices, and that
energy prices displayed are
unlikely to indicate the price
paid by industrial mining
operations. North American
Giga-Wattmining offer data centre’s electricity at a rate of $0.028 KWh[24],Norwaywhomhave
numerouslargescaleoperationsofferarateof$0.03perKWh[25],andJhianWuBitmainCEOhas
confirmedthattheworld’slargestmine(OrosInnerMongolia)receiveselectricityatarateof$0.04
perKWh[26].Thesourcesorprimarygenerationmethodsintheregionsoftheseminingoperations
should also be analysed. All the largest mining facilities operate in regions where there is an
abundance of hydroelectric, wind, or geothermal electrical generation suggesting that industrial
scale miners are already focused on low cost
renewables,reducingtheircarbonfootprintand
increasingsustainability.
4.7PartB–GrowthAnalysis
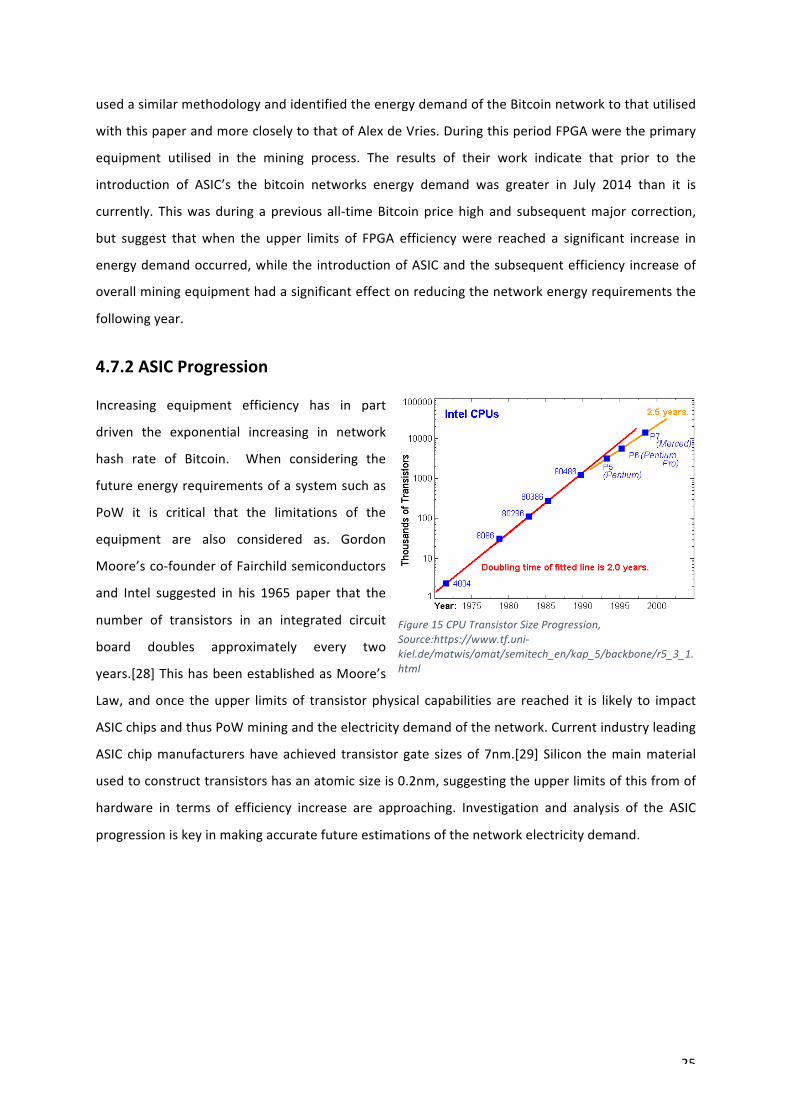
Investigation in to historic energy demand of
the bitcoin network found that previous
research by (Dwyer& Malone, 2014)[27] had
Figure14EstimatedPowerConsumptionoftheBitcoinNetwork,Source:https://ieeexplore.ieee.org/stamp/stamp.jsp?arnumber=6912770
25
Figure15CPUTransistorSizeProgression,Source:https://www.tf.uni-kiel.de/matwis/amat/semitech_en/kap_5/backbone/r5_3_1.html
usedasimilarmethodologyandidentifiedtheenergydemandoftheBitcoinnetworktothatutilised
withthispaperandmorecloselytothatofAlexdeVries.DuringthisperiodFPGAweretheprimary
equipment utilised in the mining process. The results of their work indicate that prior to the
introduction of ASIC’s the bitcoin networks energy demand was greater in July 2014 than it is
currently. Thiswasduring aprevious all-timeBitcoinpricehigh and subsequentmajor correction,
but suggest that when the upper limits of FPGA efficiencywere reached a significant increase in
energydemandoccurred,whilethe introductionofASICandthesubsequentefficiency increaseof
overallminingequipmenthadasignificanteffectonreducingthenetworkenergyrequirementsthe
followingyear.
4.7.2ASICProgression
Increasing equipment efficiency has in part
driven the exponential increasing in network
hash rate of Bitcoin. When considering the
futureenergyrequirementsofasystemsuchas
PoW it is critical that the limitations of the
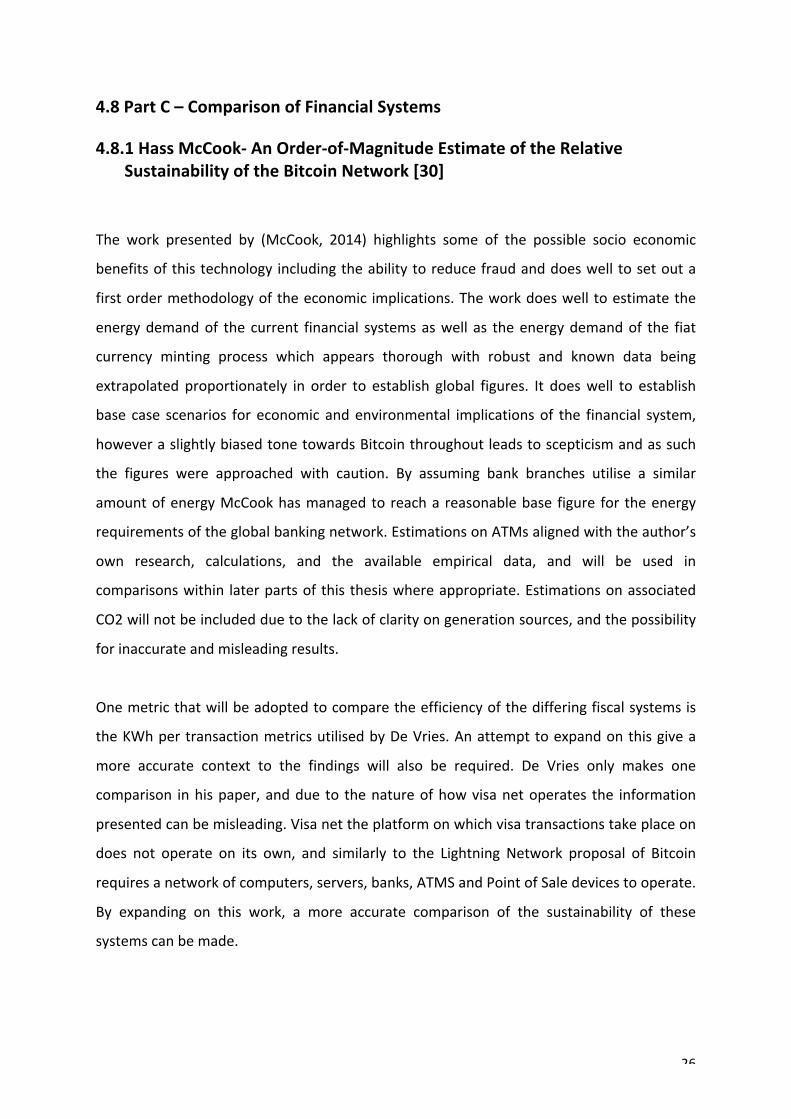
equipment are also considered as. Gordon
Moore’sco-founderofFairchildsemiconductors
and Intel suggested in his 1965 paper that the
number of transistors in an integrated circuit
board doubles approximately every two
years.[28]ThishasbeenestablishedasMoore’s
Law, andonce theupper limits of transistor physical capabilities are reached it is likely to impact
ASICchipsandthusPoWminingandtheelectricitydemandofthenetwork.Currentindustryleading
ASIC chipmanufacturershaveachieved transistor gate sizesof 7nm.[29] Silicon themainmaterial
usedtoconstructtransistorshasanatomicsizeis0.2nm,suggestingtheupperlimitsofthisfromof
hardware in terms of efficiency increase are approaching. Investigation and analysis of the ASIC
progressioniskeyinmakingaccuratefutureestimationsofthenetworkelectricitydemand.
26
4.8PartC–ComparisonofFinancialSystems
4.8.1HassMcCook-AnOrder-of-MagnitudeEstimateoftheRelativeSustainabilityoftheBitcoinNetwork[30]
The work presented by (McCook, 2014) highlights some of the possible socio economic
benefitsofthistechnology includingtheabilitytoreducefraudanddoeswelltosetouta
firstordermethodologyoftheeconomic implications.Theworkdoeswelltoestimatethe
energydemandof the current financial systemsaswell as theenergydemandof the fiat
currency minting process which appears thorough with robust and known data being
extrapolated proportionately in order to establish global figures. It doeswell to establish
base case scenarios for economic andenvironmental implicationsof the financial system,
howeveraslightlybiasedtonetowardsBitcointhroughoutleadstoscepticismandassuch
the figures were approached with caution. By assuming bank branches utilise a similar
amountofenergyMcCookhasmanagedtoreacha reasonablebase figure for theenergy
requirementsoftheglobalbankingnetwork.EstimationsonATMsalignedwiththeauthor’s
own research, calculations, and the available empirical data, and will be used in
comparisonswithin laterpartsofthisthesiswhereappropriate.Estimationsonassociated
CO2willnotbeincludedduetothelackofclarityongenerationsources,andthepossibility
forinaccurateandmisleadingresults.
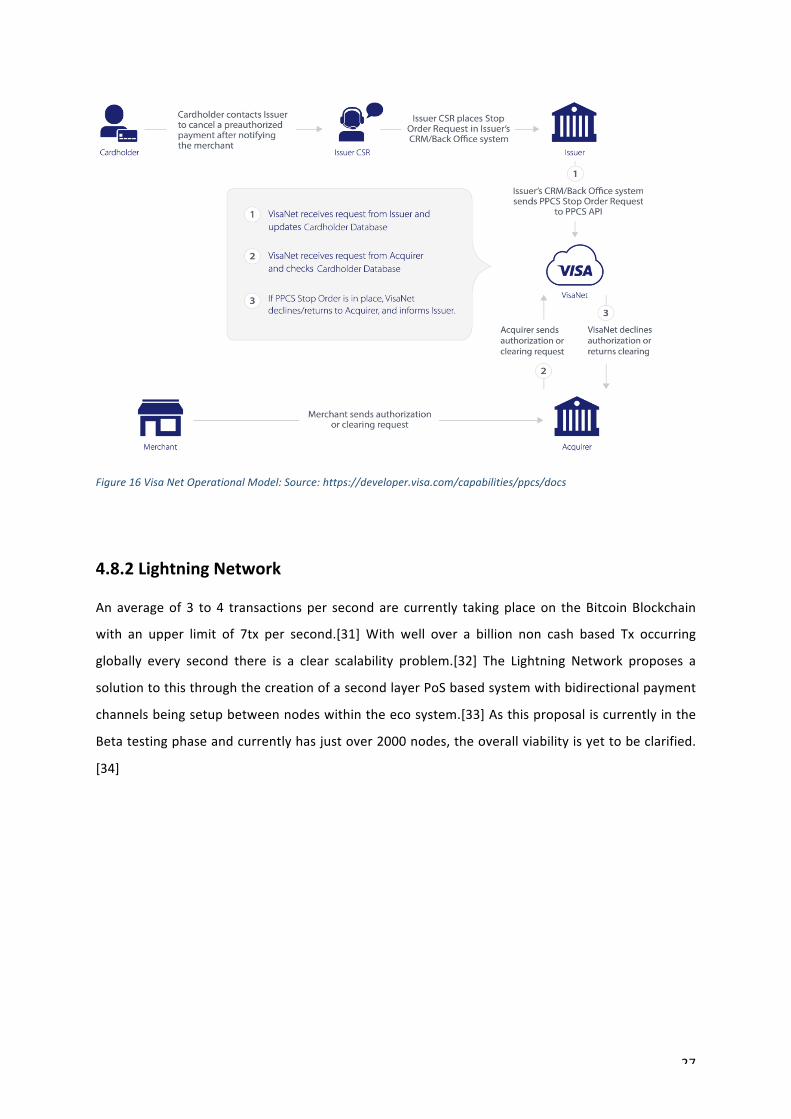
Onemetricthatwillbeadoptedtocomparetheefficiencyofthedifferingfiscalsystemsis
theKWhpertransactionmetricsutilisedbyDeVries.Anattempttoexpandonthisgivea
more accurate context to the findings will also be required. De Vries only makes one
comparison inhispaper,anddue to thenatureofhowvisanetoperates the information
presentedcanbemisleading.Visanettheplatformonwhichvisatransactionstakeplaceon
does not operate on its own, and similarly to the Lightning Network proposal of Bitcoin
requiresanetworkofcomputers,servers,banks,ATMSandPointofSaledevicestooperate.
By expanding on this work, a more accurate comparison of the sustainability of these
systemscanbemade.
27
Figure16VisaNetOperationalModel:Source:https://developer.visa.com/capabilities/ppcs/docs
4.8.2LightningNetwork
Anaverageof 3 to4 transactionsper secondare currently takingplaceon theBitcoinBlockchain
with an upper limit of 7tx per second.[31]With well over a billion non cash based Tx occurring
globally every second there is a clear scalability problem.[32] The Lightning Network proposes a
solutiontothisthroughthecreationofasecondlayerPoSbasedsystemwithbidirectionalpayment
channelsbeingsetupbetweennodeswithintheecosystem.[33]Asthisproposaliscurrentlyinthe
Betatestingphaseandcurrentlyhasjustover2000nodes,theoverallviabilityisyettobeclarified.
[34]
28
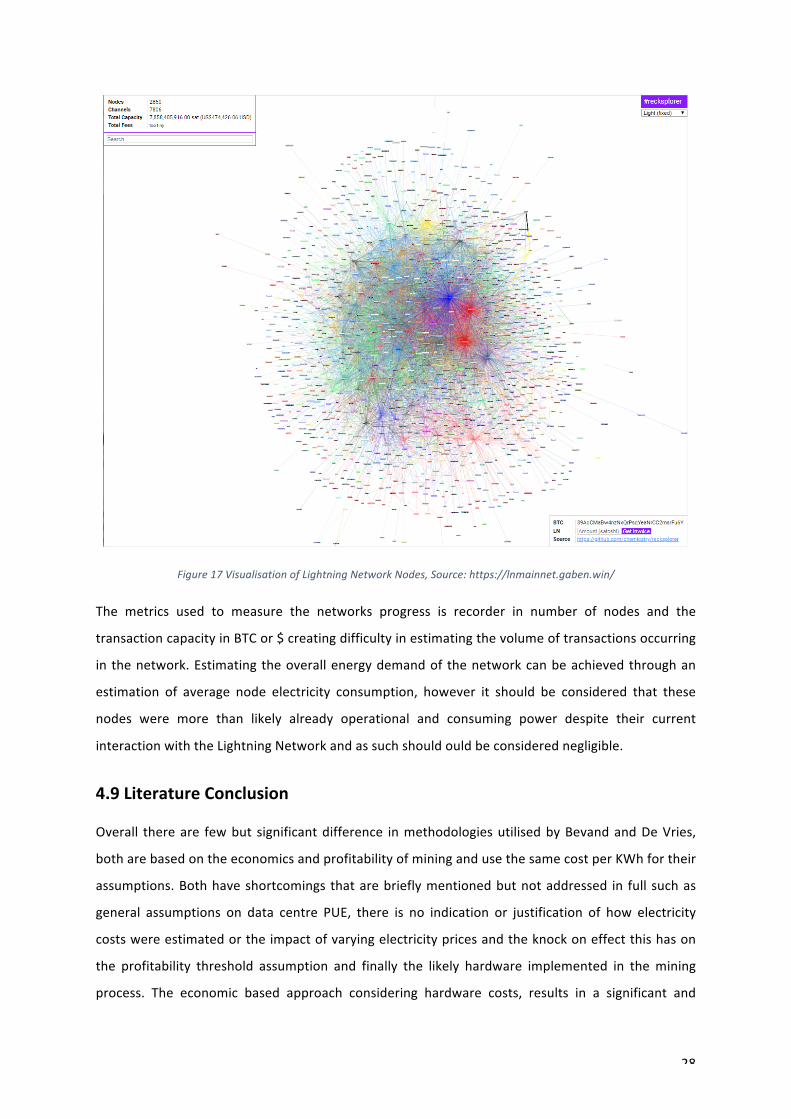
Figure17VisualisationofLightningNetworkNodes,Source:https://lnmainnet.gaben.win/
The metrics used to measure the networks progress is recorder in number of nodes and the
transactioncapacityinBTCor$creatingdifficultyinestimatingthevolumeoftransactionsoccurring
in thenetwork.Estimatingtheoverallenergydemandof thenetworkcanbeachievedthroughan
estimation of average node electricity consumption, however it should be considered that these
nodes were more than likely already operational and consuming power despite their current
interactionwiththeLightningNetworkandassuchshouldouldbeconsiderednegligible.
4.9LiteratureConclusion
Overall thereare fewbut significantdifference inmethodologiesutilisedbyBevandandDeVries,
botharebasedontheeconomicsandprofitabilityofminingandusethesamecostperKWhfortheir
assumptions.Bothhaveshortcomings thatarebrieflymentionedbutnotaddressed in full suchas
general assumptions on data centre PUE, there is no indication or justification of how electricity
costswereestimatedortheimpactofvaryingelectricitypricesandtheknockoneffectthishason
the profitability threshold assumption and finally the likely hardware implemented in themining
process. The economic based approach considering hardware costs, results in a significant and
29
arguably inaccurate increase in energy requirement estimations. This appears flawed due to the
varyingprice,profitabilityandpotentialthattheresaleofequipmentcanhave,orashighlightedby
DeVrieshimselftheirrationalorhobbiestminornotcomplyingwiththeprofitabilityassumption.
There is a large gap between the PUE estimations of Morgan Stanley and those reached by
independentreports. Investigation indicatesthatthefiguresutilisedbyMorganStanleymatchand
aremost likelytakenfromtheestimatesreachedby(Averingouetal,2017).Theydonotconsider
theaggressiveoptimisationthatminingoperationsseek,while it isalso importanttoconsiderthat
while some leading operations achieve a PUE of 1.05 that many of the smaller less refined
operationswill likely not achieve such efficiency increases . Verifying and improving the accuracy
these parameters would appear to be an essential aspect of making accurate estimations of the
network energy consumption. Taking the median values of the known electricity and PUE data
appearstobemostaccuratemeansofestimatingthesefigures foruseastheweightedaverage is
unlikelytobeaccurateduetoalackofdataregardingminesizeandlocation.
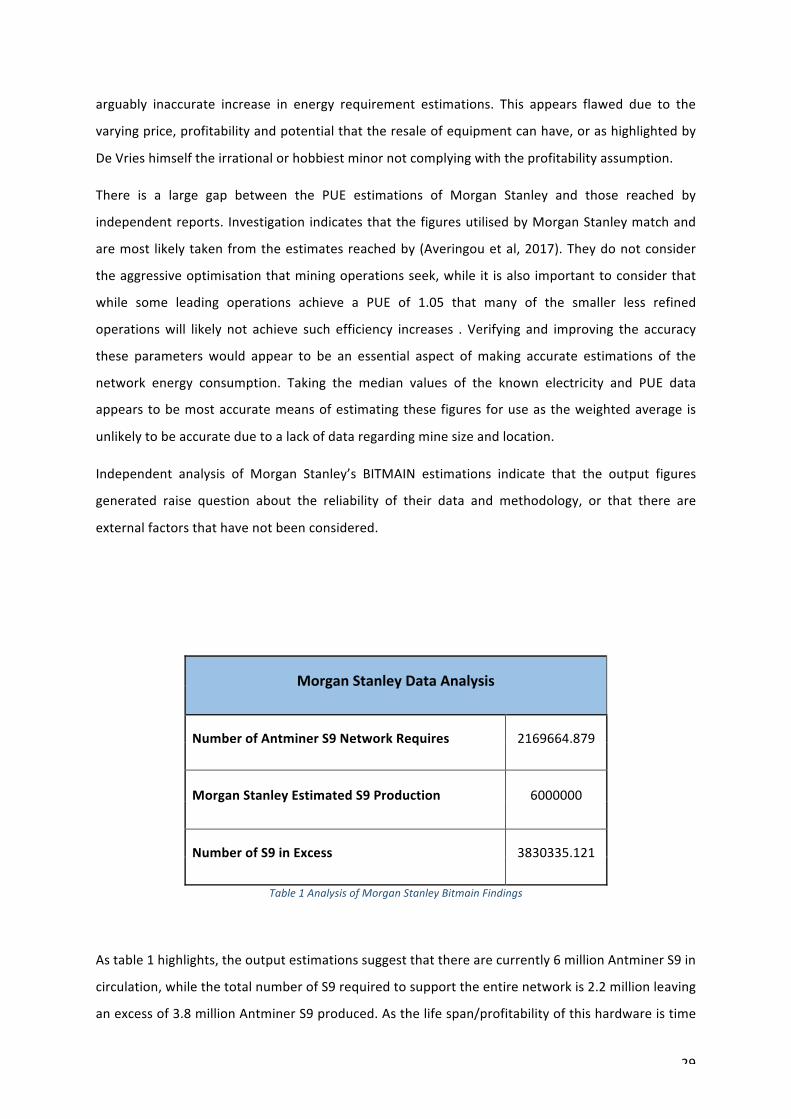
Independent analysis of Morgan Stanley’s BITMAIN estimations indicate that the output figures
generated raise question about the reliability of their data and methodology, or that there are
externalfactorsthathavenotbeenconsidered.
MorganStanleyDataAnalysis
NumberofAntminerS9NetworkRequires 2169664.879
MorganStanleyEstimatedS9Production 6000000
NumberofS9inExcess 3830335.121
Table1AnalysisofMorganStanleyBitmainFindings
Astable1highlights,theoutputestimationssuggestthattherearecurrently6millionAntminerS9in
circulation,whilethetotalnumberofS9requiredtosupporttheentirenetworkis2.2millionleaving
anexcessof3.8millionAntminerS9produced.Asthelifespan/profitabilityofthishardwareistime
30
constrainedandgeneratesthegreatestprofitsintheearlieststagesofitslifeitishighlyunlikelythat
thisvolumeofunitsaresittingidle,intransportordamaged.Theanalysisindicatesthatthesefigures
are an over estimate and that Bitmainmost likely use the same chips in othermining hardware
manufactured for alternate crypto currency mining equipment. However their estimation that
Bitmainproductshave70%shareoftheASICmarketdoesappeartobevalidasthefiguresrevealed
from their closest rivals Canaan suggest theirmining equipment accounts for a 22% share of the
total hashrate [23], while other close rivals GMO account for only 1.34%. Justification for these
figures are essential in improving the accuracy and reaching consensus in energy consumption
estimations,with themedianPUEbeing1.34,and themedianelectricityprice is$0.051validating
theelectricitypriceusedinpreviousestimations.
Theenergydemandestimationsreachedby(DwyerandMalone,2014)revealedvaluablehistorical
data,andallowsforabasisinestimatingtheimpactofreachingtheupperlimitsofASICefficiency.
TheworkconductedbyMcCookoffersa robustmethodology tobase furtherwork,as statedCO2
estimations should be approached with caution due to the lack of clarity over energy sourcing.
Preferablyalternatedatasourcescanbefoundofthelegacybankingsystemsenergyimpactthatcan
validatedestimationsreached.
31
5 Methodology
5.1PARTA-ProofofWorkEnergyEstimationsToolDevelopment
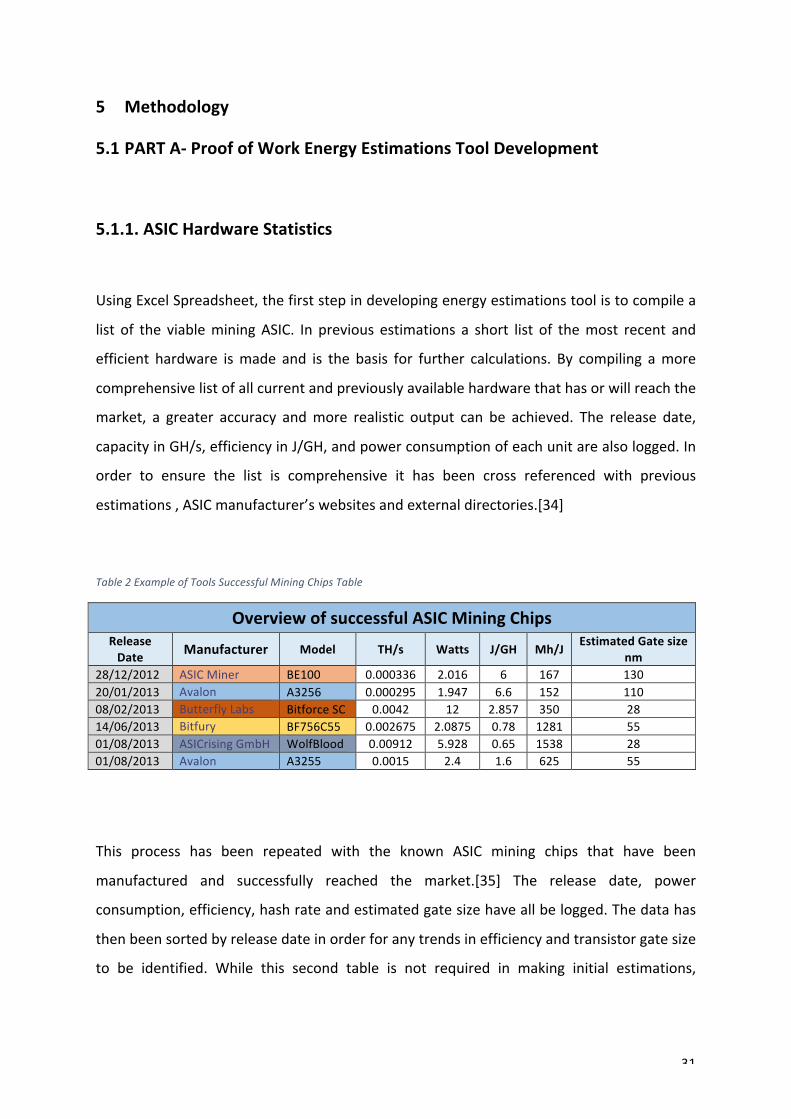
5.1.1.ASICHardwareStatistics
UsingExcelSpreadsheet,thefirststepindevelopingenergyestimationstoolistocompilea
list of the viableminingASIC. In previous estimations a short list of themost recent and
efficient hardware ismade and is the basis for further calculations. By compiling amore
comprehensivelistofallcurrentandpreviouslyavailablehardwarethathasorwillreachthe
market, a greater accuracy andmore realistic output can be achieved. The release date,
capacityinGH/s,efficiencyinJ/GH,andpowerconsumptionofeachunitarealsologged.In
order to ensure the list is comprehensive it has been cross referenced with previous
estimations,ASICmanufacturer’swebsitesandexternaldirectories.[34]
Table2ExampleofToolsSuccessfulMiningChipsTable
OverviewofsuccessfulASICMiningChipsReleaseDate Manufacturer Model TH/s Watts J/GH Mh/J
EstimatedGatesizenm
28/12/2012 ASICMiner BE100 0.000336 2.016 6 167 13020/01/2013 Avalon A3256 0.000295 1.947 6.6 152 11008/02/2013 ButterflyLabs BitforceSC 0.0042 12 2.857 350 2814/06/2013 Bitfury BF756C55 0.002675 2.0875 0.78 1281 5501/08/2013 ASICrisingGmbH WolfBlood 0.00912 5.928 0.65 1538 2801/08/2013 Avalon A3255 0.0015 2.4 1.6 625 55
This process has been repeated with the known ASIC mining chips that have been
manufactured and successfully reached the market.[35] The release date, power
consumption,efficiency,hashrateandestimatedgatesizehaveallbelogged.Thedatahas
thenbeensortedbyreleasedateinorderforanytrendsinefficiencyandtransistorgatesize
to be identified. While this second table is not required in making initial estimations,
32
understanding the trendswithinminingASICareessential for futureestimationswith the
efficiency,powerconsumptionandhashingabilityofhardwareconstantlyevolving.
5.1.2.ProfitabilityTable
Thesecondstepinthetooldevelopmentistocreateatableofthedailyprofitabilityofeach
mining ASIC. First the price of the PoW currency, the network difficulty, and the block
rewardmust be imported fromexternal data sourcesusingAPI keys.[36][37] Themedian
electricitycostpaidwasfoundtobe$0.051KWhandhasbeenusedintheestimationasthis
aligns with previous estimations allowing for empirical validation of the tool results and
after independent investigation found to be a reasonable estimation of the globalwhole
sale price of electricity supplied to industrial Blockchain mining applications. In order to
estimate the daily profitability the average daily reward in bitcoin of each ASIC were
estimatedusingthefollowingequation:
𝑫𝒂𝒊𝒍𝒚 𝑹𝒆𝒘𝒂𝒓𝒅 (𝑩𝒊𝒕𝒄𝒐𝒊𝒏) = 𝑼𝒏𝒊𝒕 𝑯𝒂𝒔𝒉 𝑹𝒂𝒕𝒆 ∗ 𝑹𝒆𝒘𝒂𝒓𝒅 𝒑𝒆𝒓 𝑩𝒍𝒐𝒄𝒌 ∗ 𝟖𝟔𝟒𝟎𝟎 ∗ 𝟏𝟎𝟎𝟎
𝑫𝒊𝒇𝒇𝒊𝒄𝒖𝒍𝒕𝒚 ∗ 𝟐𝟑𝟐𝟔𝟎𝟎
OverviewofMiningHardwarethatreachedMarket
ReleaseDate Miner
CapacityGH/s
EfficiencyJ/GH Price$
PowerConsumption
W
06/04/2013AntMinerS1 180 2 299.00 470
AntMinerS2 1000 1.1 2259 1100
AntMinerS3 441 0.77 382 1186
AntMinerS4 2000 0.7 1400 1450
AntMinerS5 1155 0.51 370 590
AntMinerS5+ 7722 0.44 2307 3436
AntMinerS7 47300 0.25 479.95 1300
AntMinerS9 13500 0.098 1,987.95 1320
01/03/2018AntMinerV9 4000 0.257 199 1027
Table3ExampleofToolsMiningEquipmentThatMadeittoMarketTable
33
ThisReward is thenexchangedfortheUSDollarequivalent,andthedailyelectricitycosts
havebeensubtractedinordertoestablishifeachminingASICisprofitableornot,andthen
colourcodedtoallowforeasierindicationoftheviablehardware.
5.1.3.NetworkHardwareBreakdown
Onceagain,anexternaldatasource is required,and the totalnetworkhash ratemustbe
imported inordertoestablishthenetworkbreakdownonanygivenday.Anewtablehas
been created of ‘possible network hardware’. Using excel functions Vlookup and data
sortingitidentifieswhichhardwareintheprofitabilitytableiseconomicallyviablebasedon
current network conditions, and automatically assembles a list of the hardware, their
efficiency, capacity and power consumption. A second table is created that lists the
weightedaverageofeachASICbasedonmarketsharefromtheavailabledata.
A third table was then
created of ‘The
Network Hardware
Outputs and Statistics’.
Thistableidentifiesand
includes the most and
least efficient possible
hardware as well as a
median and weighted
average efficiencies. It
then identifies the
number of required
ASICwithinthenetwork
and the typical power consumptionof eachunit basedon the currentnetworkhash rate
andoutputsoftheprevioustables.
Total>NetworkHashRate
GH/s42,733,900,000.00
42,733,900.00
<TotalNetworkHashRate
TH/sPossibleHardwareinNetwork
MiningHardware
ViableNetworkEfficienciesJ/GH CapacityGH/s
PowerConsumption
WAntMinerS1 0 0 0AntMinerS2 0 0 0AntMinerS3 0 0 0AntMinerS4 0 0 0AntMinerS5 0 0 0AntMinerS5+ 0 0 0AntMinerS7 0.25 47300 1300AntMinerS9 0.098 13500 1320AntMinerV9 0 0 0AntMinerT9 0.126 12500 1576Table4ExampleofToolsViableHardwareTable
34
5.1.4NetworkEnergyRequirements
A fourth sheet was then created with a table to indicate the ‘Current Network Energy
Requirements’. Here the outputs and results of the previous sheets are converted into a
demandcapacityinMegaWatts,thishasbeenextrapolatedintodailyelectricaldemandin
TWhandanannualdemandTWh/yr.ThemedianPUEof1.36,estimatedfromtheliterature
reviewinvestigationhasthenbeenaccountedfortogiveamoreaccurateindicationofthe
overallenergyrequirementsofthenetwork.Thefinaldailydemandisthenconvertedtoan
annual demand in Twh/yr and finally as a percentage of annual global and renewable
electricitygenerationbasedonIEAheadlineelectricalgenerationstatistics.[38]
5.1.5GlobalEnergyImpactTables
Several output tables
were made to quantify
and to make comparison
of theenergy requiredby
theBitcoinnetwork.Using
the latest IEA data on
global electricity
production, a table was
created to indicate the
percentage of each
Nationsannualelectricity
generation required to
power theBitcoinnetwork.The tablealso indicates thepercentageofeachnation’s fossil
fuel,renewableandnucleargenerationdeploymentrequiredtosupportthenetworkbased
onthedailystatistics.AsecondtablewasthencreatedtoindicatetheimpactoftheBitcoin
networkontheworld’slargestelectricitygeneratorsbyfuelsource.Shouldtheassetnotbe
capable of supporting the entire network the table also highlights the comparable area
requiredbasedonthepowerdensityoftheassetanditsareacoveredin𝑘𝑚!.
Figure18EnergyDensityperKm2byGenerationType,Source:https://www.researchgate.net/profile/Geoffrey_Hammond2/publication/271724019_Energy_Density_and_Spatial_Footprints_of_Various_Electrical_Power_Systems/links/55f55bfa08ae6a34f660d3a0.pdf
35
ThearearequiredtosupporttheBitcoinnetworkbasedonvariousgenerationmethodshas
alsobeenestimated.Thepowerdensityfiguresofvaryinggenerationmethods(GWh/𝑘𝑚!)
reachedby(Cheng,Hammondetall,2014)[39]havebeenadoptedinordertoestimatethe
newdeploymentarearequiredofeachgenerationmethod.
5.2.PartB–GrowthAnalysis
When analysing the logarithmic scale of all-time network hash rate and price trends,
combinedwithmajor events thatwill affect themining process included such as reward
halvingortheintroductionnewhardwareseveraltrendsbecomeclearer.Rapidincreasein
pricecanbeseenformingacorrectivewavedownonthreeoccasionsshortlyafterthevalue
comeswithinproximityofthehashratetrendline.Itcanbeseenthatsoonafterthemining
rewardishalvedthepricetendstoincrease,mostlikelydowntothereductioninsupplyas
previouslydiscussedgeneratinginflation.Second,thattowardstheendofeachequipment
cyclethetotalnetworkhashrate increasesaregreatestthenfollowedbyacurtailmentof
hashrateexpansion,similartoanasymptotictopbeforecontinuingtoriseonceagain.This
highlightstheimpactoftheleadingminingequipmentreachingtheupperlimitofpossible
Figure19AllTimeHashRateandPriceGrowthComparison
36
efficiency increases and how it will impact the total network hash rate in future, these
considerations will be important in making forecasts of the networks future electrical
demand.
Forecastingofthreepossiblepathsofthebitcoinpriceandnetworkhavebeenestimated.A
continuationof the current/historic growth rate, a stabilisedandcontinuedgrowthanda
declineingrowth.InordertomakeestimationsithasbeenassumedthatASICwillcontinue
to be the primary mining equipment, and that developments in ASIC efficiency, power
consumption and hash rate will adhere to the results foundwithin the ASIC progression
analysis. An addition ASIC was added to the profitability table with the specifications
estimatedfromtheanalysis, itwillalsoassumedthatthemostefficientequipmentwillbe
usedandassuchresultsfromthebestcasescenariohavebeenusedintheseforecasts.In
ordertoensureaccurateestimationswereachievedthedifficultyequationbelowwasused,
andtherewardhalvinghasbeenalsobeenimplemented.
𝐷𝑖𝑓𝑓𝑖𝑐𝑢𝑙𝑡𝑦 =ℎ𝑎𝑠ℎ𝑟𝑎𝑡𝑒
2^256𝑇𝑚𝑎𝑥
𝐼𝑛𝑡𝑒𝑛𝑑𝑒𝑑 𝑇𝑖𝑚𝑒 𝑝𝑒𝑟 𝐵𝑙𝑜𝑐𝑘
5.3.PartC–ComparisonoffinancialSystems
Data has been collected and compiled from numerous payment and daily transaction
sources, includingVisa,LinkATMsandPointofSaledevices.Thereare69.6thousandLink
ATMS inUK[40]with3.105billiontranactionsoccurringperannum.Figuresonthetypical
power consumption per ATM have been taken from (Roth et al, 2002)[41].These figures
alignwith theworkbyMcCookverifying theoutputsachieved.UKpointof sales terminal
data was also gathered.[42][43] Visa statistics were taken from their annual Corporate
Responsibility Report, and information requests were submitted to both Paypal and
Mastercard however, no response was received from either.[44] A comparison of the
electricity demand of global minting process wasmade using a combination of the data
sourced independently and form (McCook, 2014) with total end energy demand being
convertedtoKWhtomakeaccuratecomparisons.EstimatesofGlobaltransactionsperKWh,
totalnetworkdemandandmintingprocessbeingestimated.
37
6 Results
6.1.PartA-EnergyEstimationsToolResults
6.1.1.CurrentEnergyRequirementsTable
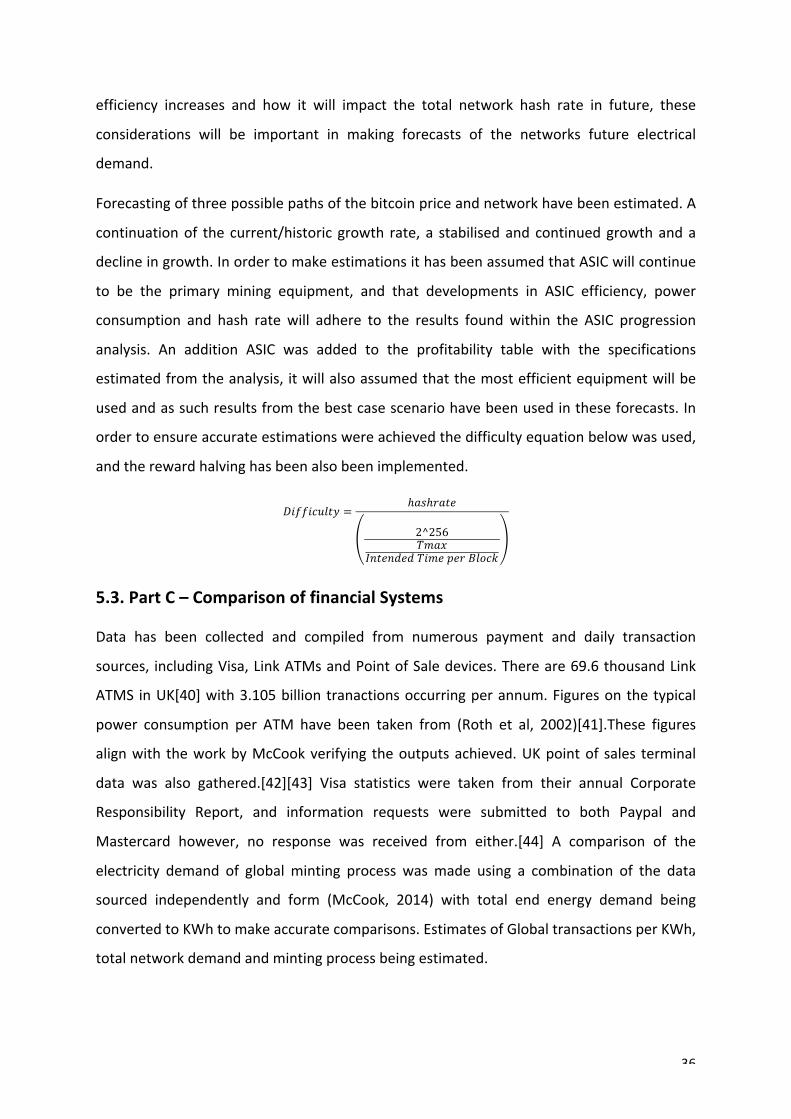
The rangeofoutput in the tableof resultsproducedby themodelhighlights theuncertaintyover
generatingenergyestimations.Themostandleastefficientoutputshavebeenempiricallyvalidated
through comparisonwith estimationsmadebyMarcBevand. Theweighted averageoutput is the
mostprobablescenarioandassuchwasusedforallfurthercomparisonsandmetrics
CurrentBitcoinNetworkEnergyRequirements
Most
EfficientLeast
Efficient MedianWeightedAverage
PowerCapacityMW 2674.65 6407.18 2480.07 3839.68DailyElectricalDemandTWh 0.06 0.154 0.060 0.092
AnnualElectricalDemandTWh/yr 23.43 56.13 21.73 33.64
%AnnualGlobalElectricityGeneration 0.10% 0.231% 0.090% 0.14%
%AnnualGlobalRenewableGeneration 0.42% 190% 0.39% 0.61%
WithPUEconsiderationof1.36PowerConsumptionMW 3637.52 8713.76 3372.89 5221.97DailyElectricalDemandTWh 0.087 0.209 0.081 0.125
AnnualElectricalDemandTWh/yr 31.865 76.333 29.547 45.744
%GlobalElectricityGeneration 0.13% 0.31% 0.12% 0.189%
%GlobalRenewableGeneration 0.58% 1.38% 0.53% 0.827%
Table5NetworkElectricalDemandOutputTable
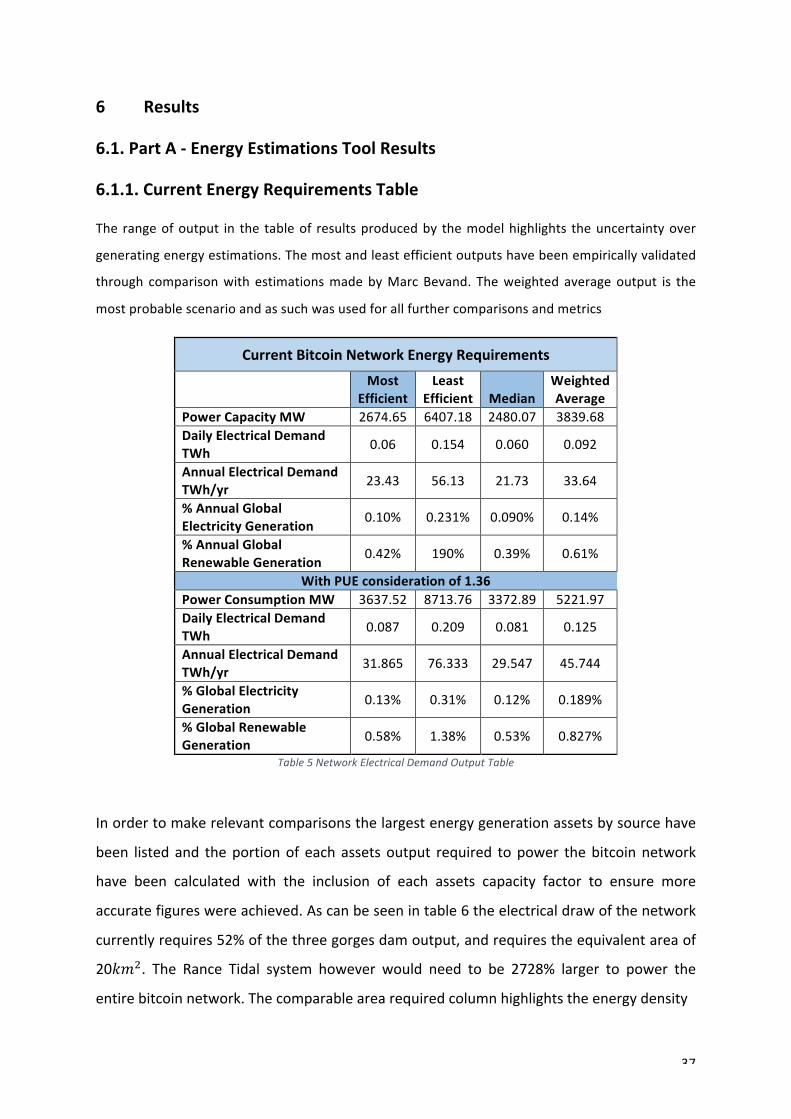
Inordertomakerelevantcomparisonsthelargestenergygenerationassetsbysourcehave
been listed and theportionof eachassetsoutput required topower thebitcoinnetwork
have been calculated with the inclusion of each assets capacity factor to ensure more
accuratefigureswereachieved.Ascanbeseenintable6theelectricaldrawofthenetwork
currentlyrequires52%ofthethreegorgesdamoutput,andrequirestheequivalentareaof
20𝑘𝑚!. The Rance Tidal system however would need to be 2728% larger to power the
entirebitcoinnetwork.Thecomparablearearequiredcolumnhighlightstheenergydensity
38
of differing generation
methods. The inclusion of a
capacity factor and its
impact on the portion of
asset required column
highlights some of the
challengesfacedbymany
generation methods in
supplying consistent base
loads and the large areas
they required.Whiledensity
varies with location the
impact on these individual
assets gives a realistic
indication of the required
area should the network be
powered exclusively by a
single generation source
andlocation.
Tables6and7putthenetworkelectricaldemandintocontextfromanationalorindividual
generatingassetperspective.Table7indicatesthe%ofeachnationsfossilfuel,nuclearor
renewables deployment required to support the network. Hypothetically a DDoS attack
requires51%controlofanetwork,when theelectrical requirementof suchanattackare
considereditisclearthatitwouldrequireasmall%ofmostlargernationselectricaloutput,
and only a fraction of a single generation sites outputs to facilitate such action. This
highlights that the network is still vulnerability from an attack by nation state such as
AmericaorChinafromanenergystandpoint.
ImpactonWorld’sLargestEnergyAssets
LocationInstalledCapacityMW
GenerationType
PortionofAssetRequired
AreaRequired
tosupportBitcoinNetworkkm2
ThreeGorgesDamn 22500 Hydro 52% 20.3
GansuWindFarm 7950 Onshore
Wind 199% N/A
BruceNulcearCanada
6384 Nuclear 91% 8.5
Surgut2 5597 GasCHP 167% 1.4TenggerSolarPark 1547 SolarPV 545% 604.8
TheGeysersGeothermal 1520 Geothermal 1764% 425.3
LondonArray 630 OffshoreWind 2728% 2151.6
NoorConcentratedSolar
580 ConcentratedSolar 7771% 68.2
RanceTidal 240 Tidal 2728% 1748.4
Table6PortionofIndividualEnergyAssetRequiredtoSupportBitcoinNetwork
39
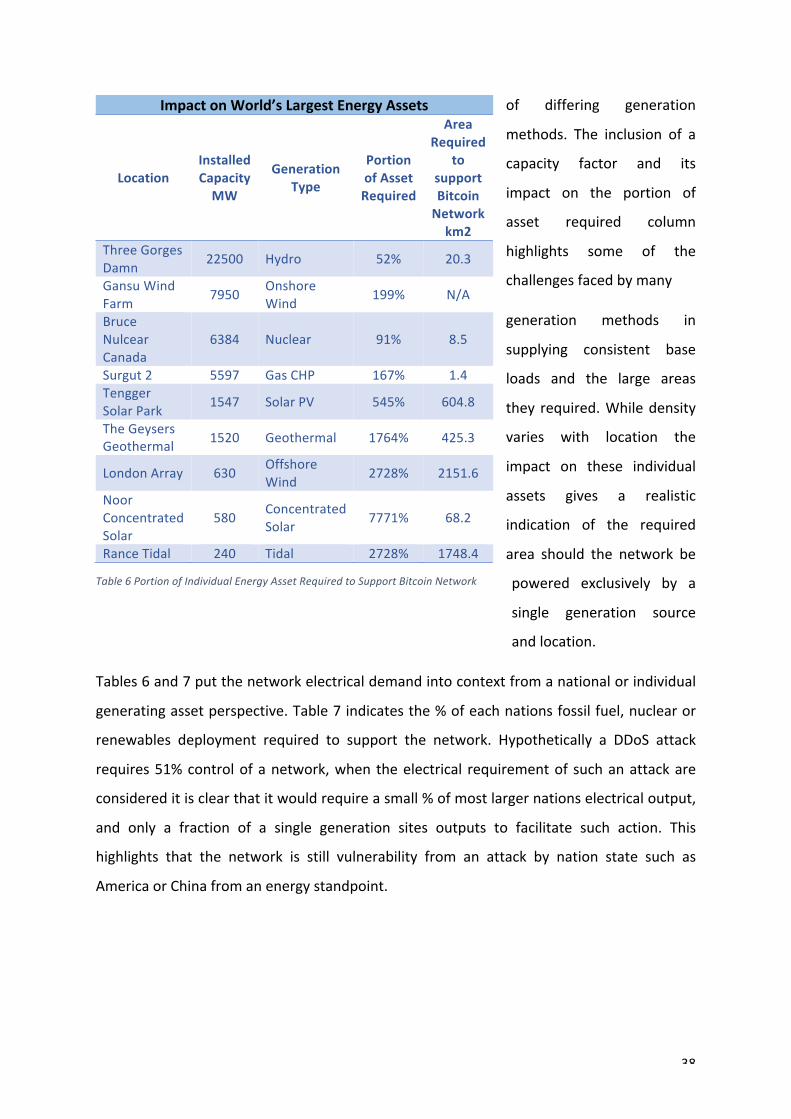
6.1.2.RequiredNewDeployment
Using the spatial
density of differing
generation methods,
the area currently
requiredtosupportthe
network by generation
type has been
estimated. The results
indicate that currently
the total area required
tosupportthenetworkiswellbelow1𝑘𝑚!forseveralgenerationmethods.
Table7RequiredPortionofExistingNationalElectricalGenerationto
SupporttheBitcoinNetwork
Country/Source Product
ElectricalOutputGWh(2015)
%ofDeploymentRequired
Australia Fossilfuels 217871 21%Australia Nuclear 0 0%Australia Renewablesources 34405 133%Australia Total 252276 18%Austria Fossilfuels 13725 333%Austria Nuclear 0 0%Austria Renewablesources 47243 97%Austria Total 61763 74%Belgium Fossilfuels 27273 168%Belgium Nuclear 26103 175%Belgium Renewablesources 14466 316%Belgium Total 69548 66%Canada Fossilfuels 141306 32%Canada Nuclear 101423 45%Canada Renewablesources 422643 11%Canada Total 670740 7%
Table8RequiredNewElectricalGenerationDeploymenttosupportCurrentNetwork
RequiredElectricalGenerationDeploymentofBitcoinNetwork
GenerationMethod Nuclear SolarPV Wind
OffshoreWind
Onshore Biomass
AveragePowerDensity
GWh/km2
3233.00 61.84 22.64 872.4 2.13
AreaRequiredkm2
0.0016 0.0844 0.2307 0.0060 2.4516
40
6.1.3.ASICDailyModellingResultsofNetworkDemand
Figure20DailyModellingResultsoverTime
The results from monitoring the models daily energy demand were combined with the
historicresultsachievedbyMarcBevand.Analysisoftheseresultsconfirmsthatthecurrent
growth in hash rate is systemic and that the energy demand is currently increasing
exponentially.Thedailyresultsgeneratedhighlightthatwhilepricehasdeclinedtheenergy
demand of the network has almost doubled during this time from just over 2000MW to
3800MW.
Figure21DailyModellingResultsComparedtoPriceandHashRate
0
1000
2000
3000
4000
5000
6000
7000
EnergyDem
andMW
Time
DailyNetworkEnergyDemand
-
2,000.00
4,000.00
6,000.00
8,000.00
10,000.00
12,000.00
-
10,000,000.00
20,000,000.00
30,000,000.00
40,000,000.00
50,000,000.00
60,000,000.00
10/04/201800:00 30/05/201800:00 19/07/201800:00 07/09/201800:00Date
ElectricalDem
andMW
BitcoinPrice$
NetworkHa
shRateTH
/s
DailyModellingResultsNetworkHashRateExpansion
BitcoinDailyPrice
41
0
200
400
600
800
1000
1200
1400
0
2000
4000
6000
8000
10000
12000
AvalonBatch1
AvalonBatch2
AvalonBatch3
Avalon2 Avalon3 Avalon6 Avolon741
Avolon821
PowerCon
sumps
onW
UnitH
ashrateGH
/s
ASICMiningEquipment
CanaanASICUnitProgression
CapacityGH/s PowerConsumpsonW
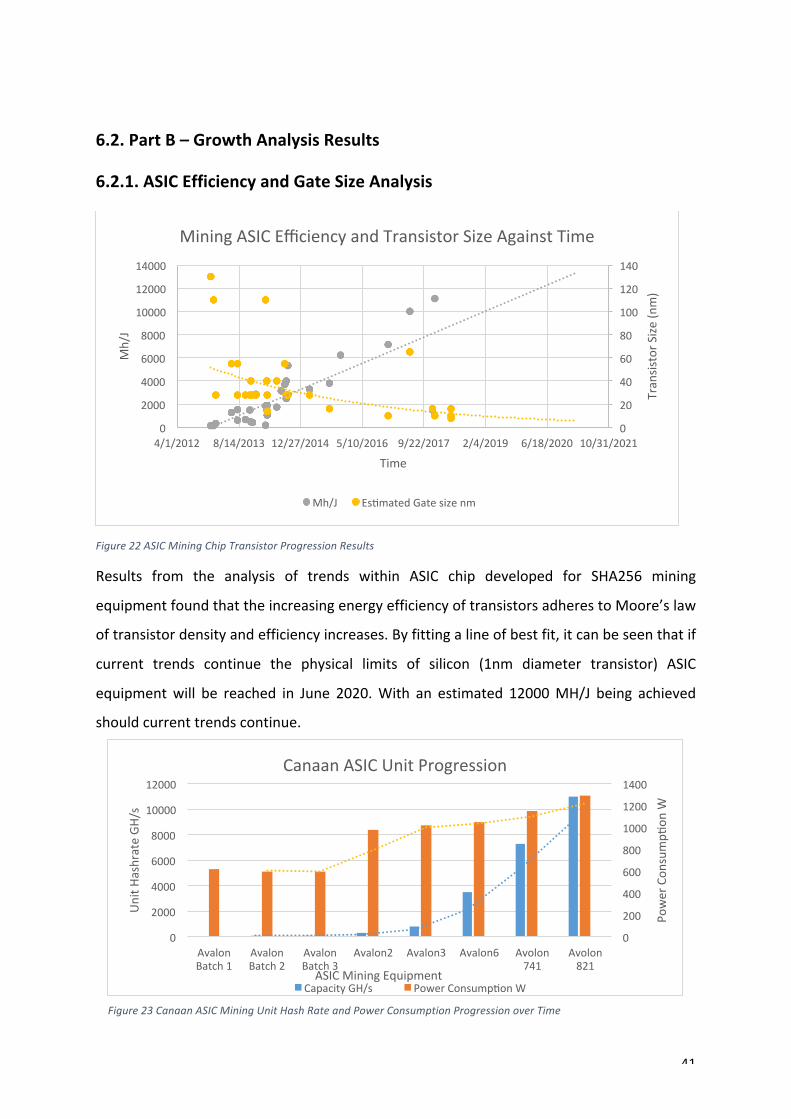
Figure23CanaanASICMiningUnitHashRateandPowerConsumptionProgressionoverTime
6.2.PartB–GrowthAnalysisResults
6.2.1.ASICEfficiencyandGateSizeAnalysis
Figure22ASICMiningChipTransistorProgressionResults
Results from the analysis of trends within ASIC chip developed for SHA256 mining
equipmentfoundthattheincreasingenergyefficiencyoftransistorsadherestoMoore’slaw
oftransistordensityandefficiencyincreases.Byfittingalineofbestfit,itcanbeseenthatif
current trends continue the physical limits of silicon (1nm diameter transistor) ASIC
equipmentwill be reached in June 2020.With an estimated 12000MH/J being achieved
shouldcurrenttrendscontinue.
0
20
40
60
80
100
120
140
0
2000
4000
6000
8000
10000
12000
14000
4/1/2012 8/14/2013 12/27/2014 5/10/2016 9/22/2017 2/4/2019 6/18/2020 10/31/2021
TransistorS
ize(n
m)
Mh/J
Time
MiningASICEfficiencyandTransistorSizeAgainstTime
Mh/J EssmatedGatesizenm
42
AnalysisoftheprogressiontrendswithintheASICminingunits foundthatwhilethechips
implementedwitheachgenerationarereducing insizetheoverallshapeandsizeofeach
unithasbeensomewhatstandardised.Thishascausedthenumberofchipswithineachunit
to increase despite the increasing chip efficiency. As Figures 20 and 21 highlight this has
resulted in exponential growth in the hashing capacity but also an overall growth in the
Powerconsumptionofeachunit.
Figure24BitmainAISCUnitEfficiencyProgressions
6.2.2.MarketPrice,HashRateTrendsandtheirEnergyImpact
02468
1012
AntMinerS12013
AntMinerS2AntMinerS32014
AntMinerS4AntMinerS5 AntMinerS5+2015
AntMinerS7AntMinerS92017
Efficien
cyGH/J
ModelProgression
BitmainASICMiningUnitProgression
-
5,000.00
10,000.00
15,000.00
20,000.00
25,000.00
-
20,000,000.00
40,000,000.00
60,000,000.00
80,000,000.00
100,000,000.00
120,000,000.00
140,000,000.00
1/1/20170:00 1/1/20180:00 1/1/20190:00
USD
Price
HashRateTH
/s
Time
PricevsHashRateMediumTermComparison
TotalNetworkHashRate
Figure25MediumTermPriceandHashRateGrowthComparison
43
Analysisofthemediumtermmarkettrendsindicatesthatthedespitethedownturninprice
over the previous 6 months the total network hash rate has continued to increase
exponentially. A small spike in hash rate during February highlights that sudden price
increasesalsoimpactsonhashratededicatedtothenetwork.
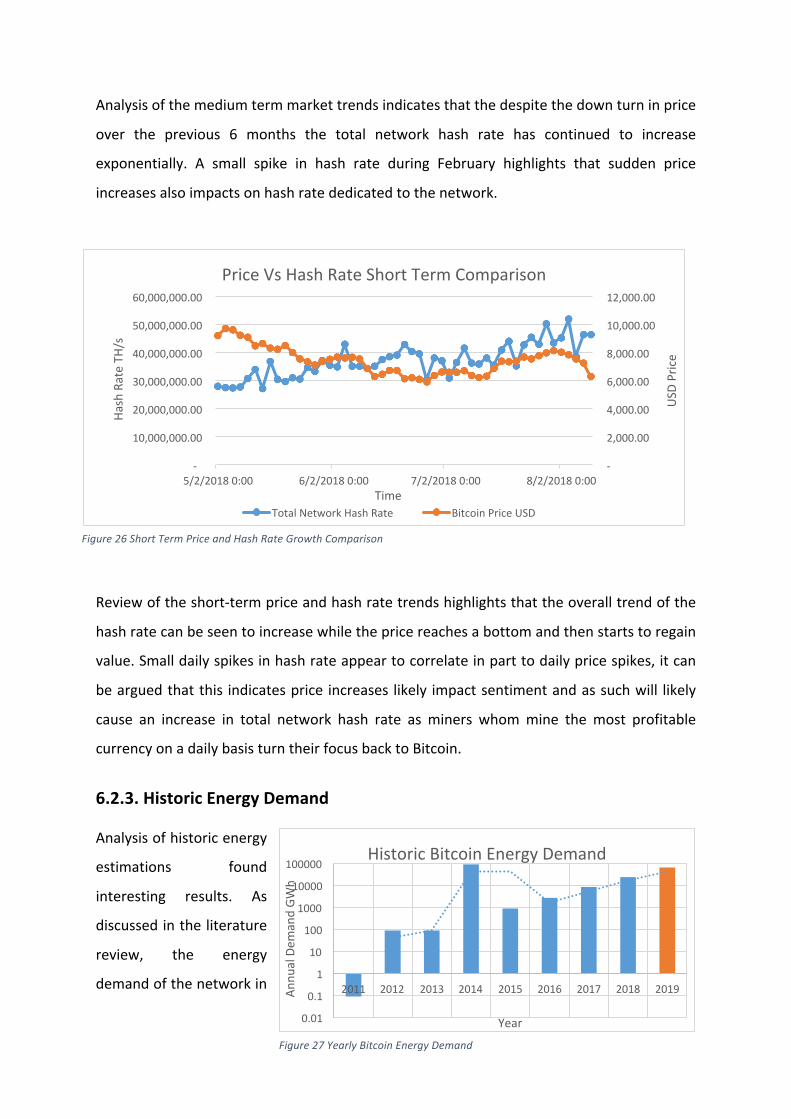
Reviewoftheshort-termpriceandhashratetrendshighlightsthattheoveralltrendofthe
hashratecanbeseentoincreasewhilethepricereachesabottomandthenstartstoregain
value.Smalldailyspikesinhashrateappeartocorrelateinparttodailypricespikes,itcan
bearguedthatthis indicatesprice increases likely impactsentimentandassuchwill likely
cause an increase in total network hash rate as miners whommine themost profitable
currencyonadailybasisturntheirfocusbacktoBitcoin.
6.2.3.HistoricEnergyDemand
Analysisofhistoricenergy
estimations found
interesting results. As
discussedintheliterature
review, the energy
demandofthenetworkin
0.01
0.1
1
10
100
1000
10000
100000
2011 2012 2013 2014 2015 2016 2017 2018 2019Ann
ualD
emandGW
h
Year
HistoricBitcoinEnergyDemand
-
2,000.00
4,000.00
6,000.00
8,000.00
10,000.00
12,000.00
-
10,000,000.00
20,000,000.00
30,000,000.00
40,000,000.00
50,000,000.00
60,000,000.00
5/2/20180:00 6/2/20180:00 7/2/20180:00 8/2/20180:00
USD
Price
HashRa
teTH/s
Time
PriceVsHashRateShortTermComparison
TotalNetworkHashRate BitcoinPriceUSD
Figure27YearlyBitcoinEnergyDemand
Figure26ShortTermPriceandHashRateGrowthComparison
44
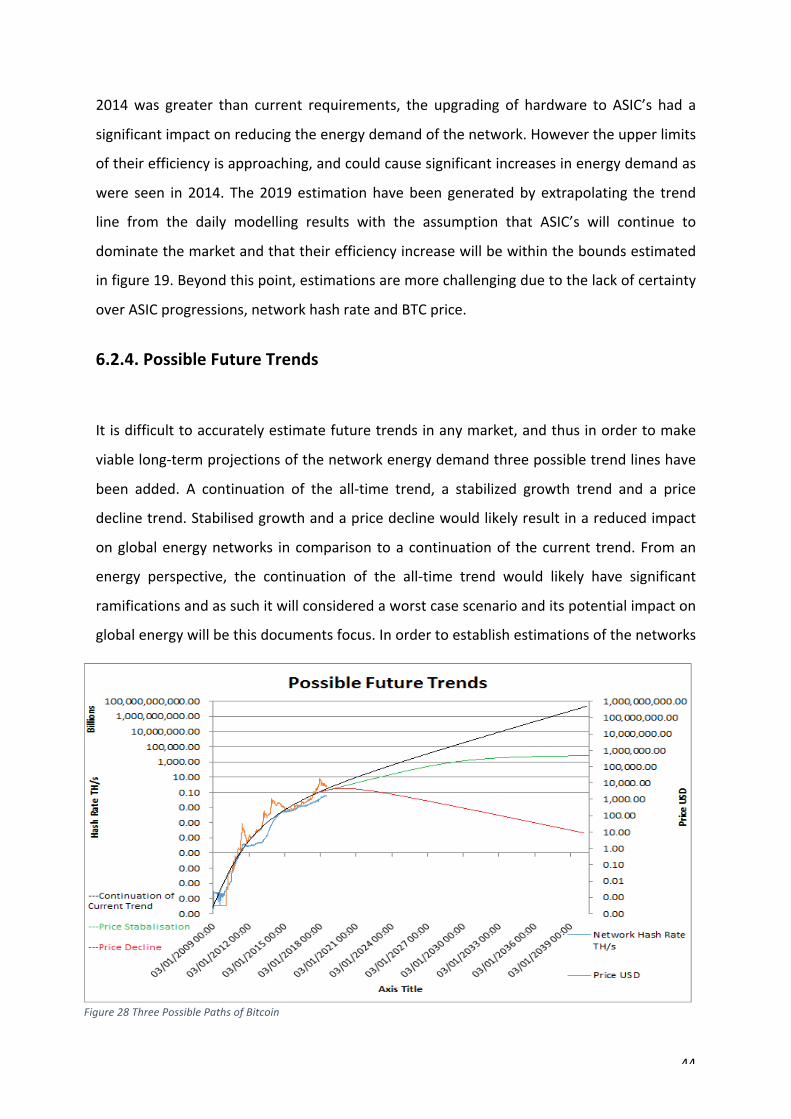
2014was greater than current requirements, the upgrading of hardware to ASIC’s had a
significantimpactonreducingtheenergydemandofthenetwork.Howevertheupperlimits
oftheirefficiencyisapproaching,andcouldcausesignificantincreasesinenergydemandas
were seen in 2014. The2019estimationhavebeengeneratedbyextrapolating the trend
line from the daily modelling results with the assumption that ASIC’s will continue to
dominatethemarketandthattheirefficiencyincreasewillbewithintheboundsestimated
infigure19.Beyondthispoint,estimationsaremorechallengingduetothelackofcertainty
overASICprogressions,networkhashrateandBTCprice.
6.2.4.PossibleFutureTrends
Itisdifficulttoaccuratelyestimatefuturetrendsinanymarket,andthusinordertomake
viablelong-termprojectionsofthenetworkenergydemandthreepossibletrendlineshave
been added. A continuation of the all-time trend, a stabilized growth trend and a price
declinetrend.Stabilisedgrowthandapricedeclinewouldlikelyresultinareducedimpact
onglobalenergynetworks incomparison toacontinuationof thecurrent trend.Froman
energy perspective, the continuation of the all-time trend would likely have significant
ramificationsandassuchitwillconsideredaworstcasescenarioanditspotentialimpacton
globalenergywillbethisdocumentsfocus.Inordertoestablishestimationsofthenetworks
Figure28ThreePossiblePathsofBitcoin
45
futureenergyrequirementsseveralassumptionsmustbemade. Ithasbeenassumedthat
ASIC’swill be themainmining equipment, and aspreviously identified theupper limit of
theirefficiencycapabilitieswillpeakin2019.
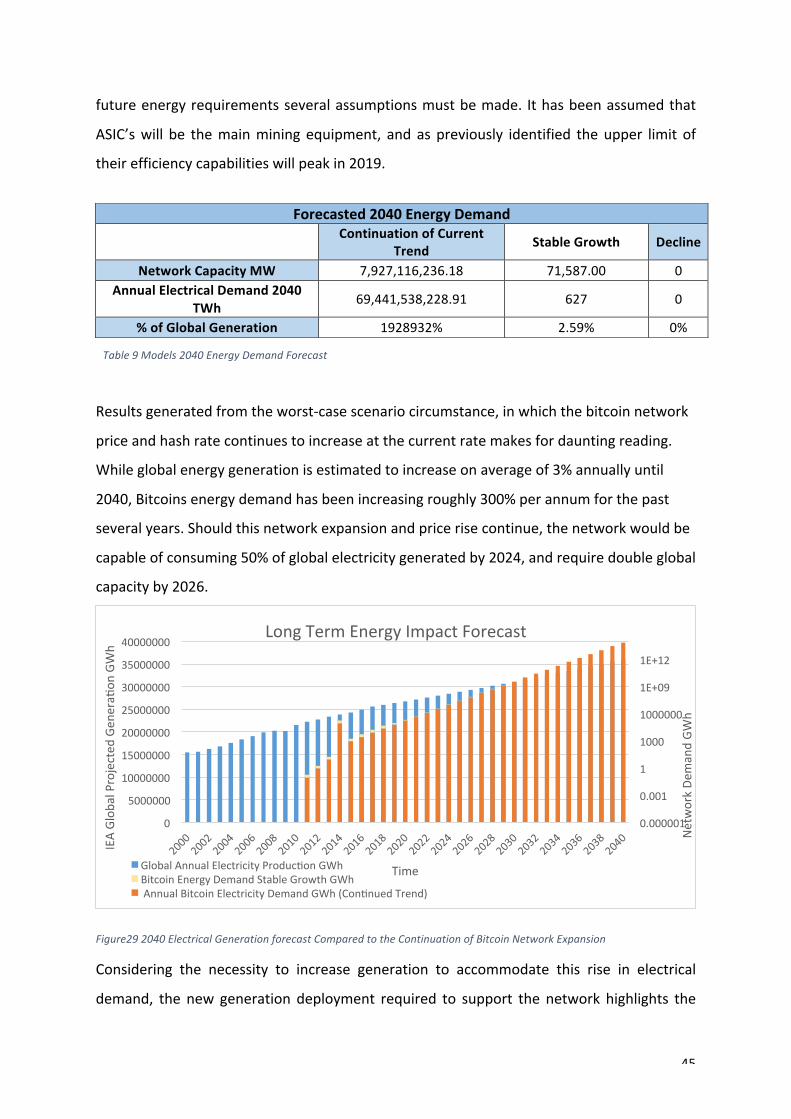
Resultsgeneratedfromtheworst-casescenariocircumstance,inwhichthebitcoinnetwork
priceandhashratecontinuestoincreaseatthecurrentratemakesfordauntingreading.
Whileglobalenergygenerationisestimatedtoincreaseonaverageof3%annuallyuntil
2040,Bitcoinsenergydemandhasbeenincreasingroughly300%perannumforthepast
severalyears.Shouldthisnetworkexpansionandpricerisecontinue,thenetworkwouldbe
capableofconsuming50%ofglobalelectricitygeneratedby2024,andrequiredoubleglobal
capacityby2026.
Figure292040ElectricalGenerationforecastComparedtotheContinuationofBitcoinNetworkExpansion
Considering the necessity to increase generation to accommodate this rise in electrical
demand, the new generation deployment required to support the network highlights the
0.000001
0.001
1
1000
1000000
1E+09
1E+12
0
5000000
10000000
15000000
20000000
25000000
30000000
35000000
40000000
NetworkDe
mandGW
h
IEAGlob
alProjected
Gen
eras
onGWh
Time
LongTermEnergyImpactForecast
GlobalAnnualElectricityProducsonGWhBitcoinEnergyDemandStableGrowthGWhAnnualBitcoinElectricityDemandGWh(ConsnuedTrend)
Forecasted2040EnergyDemand
ContinuationofCurrent
Trend StableGrowth Decline
NetworkCapacityMW 7,927,116,236.18 71,587.00 0AnnualElectricalDemand2040
TWh 69,441,538,228.91 627 0
%ofGlobalGeneration 1928932% 2.59% 0%
Table9Models2040EnergyDemandForecast
46
feasibility of this being realised. Nuclear alone with the greatest power density would
require2451938𝑘𝑚!or0.005%of theearth’ssurfaceworthofnewnuclear facilities,and
biomasswouldrequirealmost7.9%ofEarthstotalsurfacearea.Thesefiguresareextreme
scenarios, and it is important for them to remain in context in order to refrain from
misinterpretation.Whilethisisacontinuationoftheoverallcurrenttrend,itisunrealisticto
expect these figures tobeachieveddue toanumberof factors suchas the limitationsof
productionbynotonly theenergygeneration sector,but theASIC industry, and that it is
reasonabletoassumethattechnologicaladvanceswillallowforalternatemininghardware
ofgreaterefficienciesthatcannotbeaccountedforatthistimeorinthismodel. Itshould
alsobenotedthatinsuchaneventthatpricescontinuetoriseathistoricratesitisunlikely
that electricity generators, suppliers or governmentswould prioritise industrial electricity
demand or accommodate Bitcoin mining over domestic requirements. It can also be
assumedthatoncetheupper limitsofavailableelectricityarereachednetworkexpansion
rateswilldecrease,suggestingthatasthismarketmaturesmorestabilizedgrowthisamore
plausible outcome. The stabilized growth estimations indicate by 2040 2.59% of global
electricity production would be required to achieve the network hash rate and price
indicated in the price stabilisation trend. This estimation may appear considerably more
conservative, butwhen the area required to support a network of this size is considered
suchas5000𝑘𝑚!ofoffshorewindturbinestheimpactappearsconsiderablylarger.
Required2040DeploymentbyAreaKm2GenerationMethod Nuclear SolarPV WindOffshore Wind
Onshore Biomass
AveragePowerDensity
GWh/km23233.00 61.84 22.64 872.4 2.13
AreaRequiredkm2
ContinuationofCurrentTrend
2451938 128187520 350137643 9086561 3721650815
AreaRequiredkm2
StableGrowth35.3864 1850.0060 5053.1966 131.1375 53710.9726
Table10Arearequiredby2040tosupportBitcoinNetworkShouldcurrentExpansionRateContinue
47
6.3.PartC-ComparisonofFinancialSystems
EnergyComparisonofFiatCurrencyMinting
AnnualDemandTWh
DailyDemandTWh
TotallegacyBankingSystem 638.89 1.75
PaperNotePrinting 5.11 0.014CoinsMinting 11.00 0.030
Bitcoin 40.21 0.11Table11ComparisonofFiatCurrencymintingtoBitcoinMintingProcess
ResultsfromtheanalysisofphysicalcurrencymintingindicatethatBitcoinalreadyrequires
more energy than global paper and coin minting processes combined. While it is less
efficient in termsof currencyminting theelectricity demandofBitcoin accounts for both
transactionvalidationandcoinminting,andassuchwhentheannualdemandoftheentire
banking system is compared it can be seen that Bitcoin on uses 1/16th of the energy
required.
Figure30TransactionEfficiencyComparison
Figure 30 offers an insight into the transaction efficiency of each layer and transaction
method aswell as the potential impact of the Lightning Network should Bitcoin and the
Lightningnetworkbecomethedominantdigitalpaymentmethod.AscanbeseenBitcoinis
byfartheleastefficientpaymentmethodintermsoftransactionsperKWh.Assumingthata
fullyfunctioningLightningNetworkwouldhandlealldigitalpaymentsitwouldincreasethe
network efficiency considerably but still leave it less efficient than the current legacy
bankingsystem.ThereislittledoubtfromtheevidencethatVisa-net,LINKATMmachinesor
0.001
0.010
0.100
1.000
10.000
100.000
1000.000
Bitcoin LightningNetwork(All
DigitalPaymentssupported)
LegacyBanking
System(AllDigital
Payments)
PointfoSale LINKATM Visa CombinedBanking
SystemandPaymentProcessors
TransacsosnPe
rKWh
TransacsonMethod
TransacsonEnergyEfficiencyComparison

48
Pointof Saledevicesare farmoreefficient in termsof transactionsperKWh individually.
However theanalysisof thesesystems fails tohighlight thatnoneoperate independently,
and as such a better indication of how the bitcoin network compares is a cumulative
comparison of the total banking system. As figure 26 shows if all digital payments are
considered with the combined total electrical demand of each network the overall
efficiencyisreduceddramaticallybutstillremainsconsiderablymoreefficientthanbitcoin
or the Lightning Network. It is important again to give perspective to these results, as it
reasonabletoassumethatLocalBanksbranches,ATMSandpointofsalesterminalswould
stillexistsandcontinuetoplayalargepartinthebankingandcommercialsectorshoulda
cryptocurrencybethedominantglobalpaymentmethod,manyofthesesystemswouldstill
bepartofthenetwork.
49
7 Conclusion
The rapid price increase of bitcoin we have witness in recent years has been a major driver in
speculativeinvestmentandinterest.Whilethepricepercoinhasbeenindeclineoverrecentmonths
the total network hash rate has grown exponentially and subsequently its energy demand has
almostdoubledduringthisperiod.Thisnetworkgrowthwill likelyrecedeintheshorttermifprice
continues to decline asmining profitmargins are squeezed towards equilbirium.However should
thetrendreverseandthepricecontinuetoclimbatpreviousrates, thesystemicrelationshipwith
resourceswouldcause further increase in totalnetworkhashrateandminingoperationsasprofit
marginsincreaseoncemore.Withoutswiftdeploymentofnewgenerationstationstoaccountfor
thisgrowthitcouldhaveanimpactonglobalenergymarketsasnetworkenergydemandoutpaces
supply.
Analysis indicates that daily trends in price have aminor but systematic effect on hash rate and
energydemand,validatingtheassumptionsmadeaboutrationalminingbasedonprofitabilityand
thatifpriceincreasessowillspeculativeinterestandthenetwork.Itappearsreasonablethatmany
minersinterestedinprofitalonechangethecurrencytheyareminingonadailybasisdependingon
which is most profitable. Should this be true the impact on energy markets would likely be less
problematiconadailybasisasthesemineswouldalreadybeminingcontinuously,drawingasteady
base load fromanelectricalnetwork,buthighlighting thenecessity for furtherwork inestimating
theentireindustrieselectricaldemand.
Findings from the analysis of mining hardware identified that decreasing transistor size in ASIC
miningequipmentisadriverintheincreasingenergydemandofthenetwork,despitetheefficiency
increasesofminingequipment.Duetothecompetitivenatureoftheminingprocess,theimpactof
increased hardware efficiency inevitably leads to all miners increasing the efficiency of their
equipmentinordertoremaincompetitive.Whileitwouldbeexpectedinmostcasesthatthiswould
reduce energy intensity of the network the opposite was found. The analysis found that while
transistorsizereduced,thishasallowedfor increasingnumbersoftransistorswithineachunitand
assuchthepowerconsumptionofhardwarewasalsoincreasingcreatinganexponentialgrowthin
hashrateandenergydemand.Thefindingsfromanalysisofhistoricenergydemandsuggestthatthe
progression from FPGA to ASIC had a considerable impact on reducing the network electrical
demand.WhentheupperefficiencylimitsofASICminingequipmentarereached,untilanalternate
transistor technology is implemented there will likely be a similar impact on the hash rate and
energydemandaswitnessedin2014.Shouldpricealsoincreasethiscouldcreateasignificantrisein
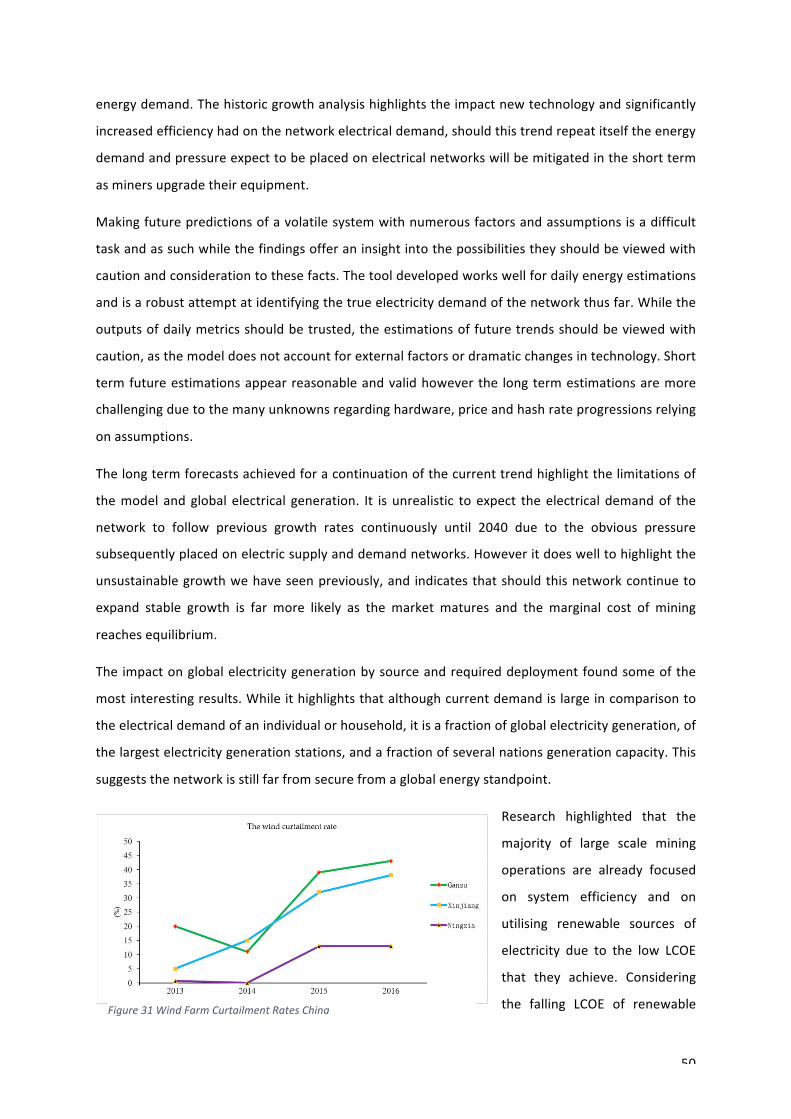
50
energydemand.Thehistoricgrowthanalysishighlightstheimpactnewtechnologyandsignificantly
increasedefficiencyhadonthenetworkelectricaldemand,shouldthistrendrepeatitselftheenergy
demandandpressureexpecttobeplacedonelectricalnetworkswillbemitigatedintheshortterm
asminersupgradetheirequipment.
Makingfuturepredictionsofavolatilesystemwithnumerousfactorsandassumptionsisadifficult
taskandassuchwhilethefindingsofferaninsightintothepossibilitiestheyshouldbeviewedwith
cautionandconsiderationtothesefacts.Thetooldevelopedworkswellfordailyenergyestimations
andisarobustattemptatidentifyingthetrueelectricitydemandofthenetworkthusfar.Whilethe
outputsofdailymetricsshouldbetrusted,theestimationsoffuturetrendsshouldbeviewedwith
caution,asthemodeldoesnotaccountforexternalfactorsordramaticchangesintechnology.Short
termfutureestimationsappearreasonableandvalidhoweverthe longtermestimationsaremore
challengingduetothemanyunknownsregardinghardware,priceandhashrateprogressionsrelying
onassumptions.
Thelongtermforecastsachievedforacontinuationofthecurrenttrendhighlightthelimitationsof
themodel andglobal electrical generation. It is unrealistic toexpect theelectrical demandof the
network to follow previous growth rates continuously until 2040 due to the obvious pressure
subsequentlyplacedonelectricsupplyanddemandnetworks.Howeveritdoeswelltohighlightthe
unsustainablegrowthwehaveseenpreviously,and indicatesthatshouldthisnetworkcontinueto
expand stable growth is far more likely as the market matures and the marginal cost of mining
reachesequilibrium.
The impactonglobalelectricitygenerationbysourceandrequireddeploymentfoundsomeofthe
mostinterestingresults.Whileithighlightsthatalthoughcurrentdemandislargeincomparisonto
theelectricaldemandofanindividualorhousehold,itisafractionofglobalelectricitygeneration,of
thelargestelectricitygenerationstations,andafractionofseveralnationsgenerationcapacity.This
suggeststhenetworkisstillfarfromsecurefromaglobalenergystandpoint.
Research highlighted that the
majority of large scale mining
operations are already focused
on system efficiency and on
utilising renewable sources of
electricity due to the low LCOE
that they achieve. Considering
the falling LCOE of renewableFigure31WindFarmCurtailmentRatesChina
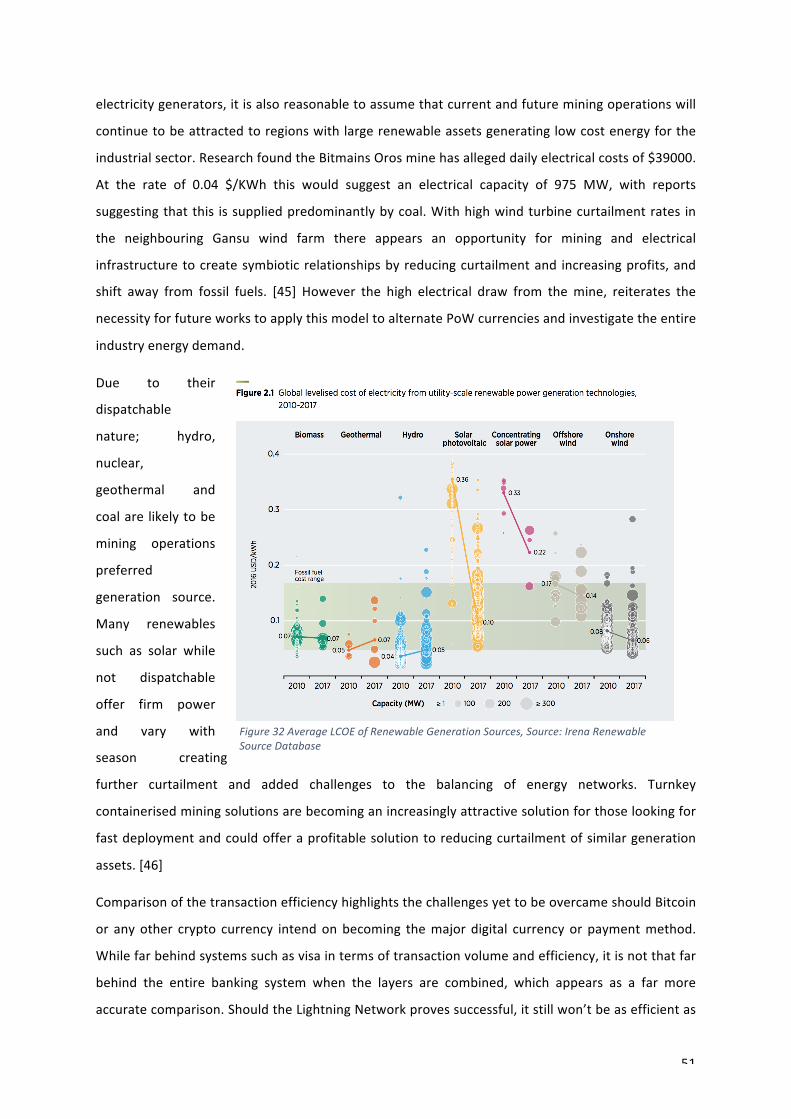
51
electricitygenerators,itisalsoreasonabletoassumethatcurrentandfutureminingoperationswill
continuetobeattractedtoregionswithlargerenewableassetsgeneratinglowcostenergyforthe
industrialsector.ResearchfoundtheBitmainsOrosminehasallegeddailyelectricalcostsof$39000.
At the rate of 0.04 $/KWh this would suggest an electrical capacity of 975 MW, with reports
suggestingthatthis issuppliedpredominantlybycoal.Withhighwindturbinecurtailmentrates in
the neighbouring Gansu wind farm there appears an opportunity for mining and electrical
infrastructuretocreatesymbioticrelationshipsbyreducingcurtailmentand increasingprofits,and
shift away from fossil fuels. [45] However the high electrical draw from themine, reiterates the
necessityforfutureworkstoapplythismodeltoalternatePoWcurrenciesandinvestigatetheentire
industryenergydemand.
Due to their
dispatchable
nature; hydro,
nuclear,
geothermal and
coalare likelytobe
mining operations
preferred
generation source.
Many renewables
such as solar while
not dispatchable
offer firm power
and vary with
season creating
further curtailment and added challenges to the balancing of energy networks. Turnkey
containerisedminingsolutionsarebecominganincreasinglyattractivesolutionforthoselookingfor
fastdeploymentandcouldofferaprofitablesolutiontoreducingcurtailmentofsimilargeneration
assets.[46]
ComparisonofthetransactionefficiencyhighlightsthechallengesyettobeovercameshouldBitcoin
or anyother crypto currency intendonbecoming themajor digital currencyor paymentmethod.
Whilefarbehindsystemssuchasvisaintermsoftransactionvolumeandefficiency,itisnotthatfar
behind the entire banking system when the layers are combined, which appears as a far more
accuratecomparison.ShouldtheLightningNetworkprovessuccessful,itstillwon’tbeasefficientas
Figure32AverageLCOEofRenewableGenerationSources,Source:IrenaRenewableSourceDatabase
52
thelegacybankingsystem,andasitsoverallenergydemandislikelytoincreaseitwillonlycontinue
to become less efficient unless the volume of digital transactions increase beyond the current
electricaldemandgrowthrate.
Due to the decentralized nature of bitcoin and blockchain, the negative connotations are also
amplified due to the inability to regulate the market. Bitcoin advocates argue that the security,
immutabilityandborderlessnatureareworththeresourceintensityofthePoWprotocol,however
its is also suggested that thenetworkwill have to consume50%of global electricity generated in
ordertobetrulysecure.Thisisanunnervingthoughtfromamenergyandsustainabilitystandpoint
andtheimplicationsofadecentralizedunregulatedsystemthatgeneratesprofitsinaframeworkof
capitalism suggests that as long as its profitable, the network will continue to grow. Another
implicationofanunregulatedeconomicsystemistheeventualcentralizationofsuchsystems.The
lawsofParetodistributiondictate that this isan inevitableconsequenceofanyeconomic system,
anditappearsthatthisisalreadytakingplace.ShouldBitmainhavea70%marketshareoftheASIC
manufacturingindustry,andseveraloftheworldslargestminesitwouldnotbeintheirinterestto
reveal this, as it would undermine the decentralisation of the network and ultimately their own
marketvaluationandprofitability.AsthecentralizationofASICmanufacturingandminingappears
already underway we must ask ourselves what impact this will have on the viability of PoW
consensusandglobalsustainabilitytargets.
Thevalueofbitcoinisobjectiveandthevaluepropositionandbenefitscanbedebatedatlength.But
inadecentralisedlassezfaireeconomicmodel, ifsomethingisprofitabletherearealwaysgoingto
bepartieswillingtoprioritiseprofitovertheenvironmentorensuringsustainability.Thus itwould
appear that continued rapid inflationand the subsequentprofitswhileagreatdriver inadoption,
are one of the biggest challenges facing decentralised currencies should they require resource
intensive processes to ensure compliance. The inevitable Industrialisation of the mining process
indicates that PoWmining is highly susceptible to centralisation and a Tragedy of the Commons
scenariooccurringshouldpricecontinuetoclimbathistoricrates.
Ultimately wemust ask our selves; are the resources required to support a digital decentralised
global currency using the PoW consensus mechanism worth the promises of financial inclusion,
borderless payments, fiscal autonomy and fraud prevention that the network claims to provide?
Bitcoinhasdonewelltoachieveabalancedecosystemwithminers,developers,businessandend
usersallwithdiffering interestsensuringnosinglepartyhascompletecontrolof thenetwork,but
witha lackofcentralauthority reachingconsensusandashiftaway fromPoWseems increasingly
53
unlikely,suggestingwewilllikelywitnessfurtherindustrializationofourlandscapenatural,withthe
environmentandournaturalresourcespayingtheultimateprice.
Thefindingssuggestthattheimplicationsofthistechnologymustbeconsiderednotonlybynational
economic policy makers, but also by those responsible for energy policy. The resource intensive
natureofthistechnologycombinedwithitsunregulatednatureandrapidgrowthsuggestitisonlya
matter of timebefore the challengesof its electrical demand impact electrical networks. There is
large potential for this industry and it is essential policymakers develop an understanding of the
implications and ensure that if crypto currency mining facilities are to be deployed within their
boundariesthat theyworkununisonandcomplimentcurrentelectricalgenerationsystemsrather
thanputfurtherstrainonthemandthesurroundingnetworks.
8.FutureWorks:
Themainfocusofthisworkwastodevelopatoolandmethodologyformakingaccurateestimations
of theBitcoin energy demand. Furtherwork tomake future estimations and compare the energy
demandofcurrentbankinginfrastructurewerelimitedandhavepotentialtobetakenfurther.Due
tothelackofknowledgeonelectricitysourcestheemissionsgeneratedbythis industrywherenot
consideredduetothepotentialformisleadingreaders.Futureworkonestimatingthegeographical
breakdownofminingfacilitiesandtypicalgenerationmixofthesecouldbeameansofgenerating
meaningfulemissionsdata.
Throughthisworkthereareopportunitiesforfutureworktoprogressbothpartsofthiscomparison
anddevelopthemethodologiescreatedfurther.Asthisindustrymaturesthetransparencyofmining
companies and ASIC manufacturers are likely to improve, allowing for better data sets and
reduced/validatedassumptions.Energyestimatesofthecurrentbankingsystemcouldbeimproved
through the acquisitionofmore specific data sets fromall paymentprocessors. Applying the tool
and methodology developed to other PoW crypto currencies in order to make estimates of the
entireindustriesenergydemandisanotherpossiblefutureworkthathasyetbeenundertakenand
wouldlikelyproduceinterestingresults
54
9.References:
[1] Claire Provost. 2013. Why do Africans pay the most to send money home? (January 2013). http://www.theguardian.com/global-development/2013/jan/30/africans-pay-most-send-money.
[2] Rachel Banning-Lover. 2015. Boatfuls of cash: how do you get money into fragile states? (February 2015). http://www.theguardian.com/global-development-professionals-network/2015/feb/19/boatfulsof-cash-how-do-you-get-money-into-fragile-states.
[3] CGAP. 2008. Making Money Transfers Work for Microfinance Institutions. (March 2008). http://www.cgap.org/sites/default/files/CGAP-Technical-Guide-Making-Money-Transfers-Workfor-Microfinance-Institutions-A-Technical-Guide-to-Developing-and-Delivering-MoneyTransfers-Mar-2008.pdf.
[4] Asli Demirguc-Kunt, Leora Klapper, Dorothe Singer, and Peter Van Oudheusden. 2015. The Global Findex Database 2014 Measuring Financial Inclusion Around the World. Policy Research Working Paper 7255. World Bank. http://www-wds.worldbank.org/external/default/WDSContentServer/WDSP/IB/2015/ 04/15/090224b082dca3aa/1_0/Rendered/PDF/The0Global0Fin0ion0around0the0world.pdf.
[5] David Mazieres. (2015). Stellar Lumen Protocol. Available: https://www.stellar.org/papers/stellar-consensus-protocol.pdf.
[6] UK Finance. (2017). Quarterly Market Trends. Available: https://www.ukfinance.org.uk/wp-content/uploads/2017/11/Quarterly-Market-Trends-Q3-2017.pdf.
[7] Visa. (2018). Visa Service Disruption. Available: https://www.visaeurope.com/newsroom/news/visa-service-disruption. Last accessed 15/06/2018
[8] International Monetary Fund. (2018). REPÚBLICA BOLIVARIANA DE VENEZUELA. Available: https://www.imf.org/en/Countries/VEN#countrydata.
[9] Satoshi Nakamoto. (2008). Bitcoin: A Peer-to-Peer Electronic Cash System. https://bitcoin.org. 1 (1), 1-9
[10] Corin Faife. (2017). Bitcoin Hash Functions Explained. Available: https://www.coindesk.com/bitcoin-hash-functions-explained/
[11] Cynthia Dwork, Moni Naor. (1993). Pricing via Processing or Combating Junk Mail. IBM Research Division, Almaden Research Centre. 1-11
[12] Adam Back. (May, 1997).Hashcash. Published at: http://www.cypherspace.org/hascash/
[13] Hal Finney. (2004). Reusable Proof of Work. Available: https://nakamotoinstitute.org/finney/rpow/index.html.
[14] Wouter Penard, Tim van Werkhoven.. (2005). On the Secure Hash Algorithm Family. Encyclopedia of Crpytography and Security. 1 (1), https://doi.org/10.1007/0-387-23483-7
[15] Tim Fisher. (2018). Cryptographic Hash Function Use a cryptographic hash function to verify the authenticity of data. Available: https://www.lifewire.com/cryptographic-hash-function-2625832.
[16] Julien Prat & Benjamin Walter, 2018. "An Equilibrium Model of the Market for Bitcoin Mining," CESifo Working Paper Series 6865, CESifo Group Munich. https://ideas.repec.org/p/ces/ceswps/_6865.html
[17] Marcel Thum, 2018. "The Economic Cost of Bitcoin Mining," CESifo Forum, Ifo Institute - Leibniz Institute for Economic Research at the University of Munich, vol. 19(1), pages 43-
55
45, March. https://www.cesifo-group.de/DocDL/CESifo-Forum-2018-1-thum-bitcoin-march.pdf
[18] Alex De Vries. (2018). Bitcoin's Growing Energy Problem. Joule. 2 (5), 801-805
[19] Hayes, Adam, A Cost of Production Model for Bitcoin (March 19, 2015). Available at SSRN: https://ssrn.com/abstract=2580904 or http://dx.doi.org/10.2139/ssrn.2580904
[20] Song, J. Just how profitable is Bitmain? 2017. https://medium.com/@jimmysong/just-how-profitable-is-bitmain-a9df82c761a
[21] Morgan Stanley. Bitcoin ASIC production substantiates electricity use; points to coming jump. 2018. https://ny.matrix.ms.com/eqr/article/webapp/b974be48-effb-11e7-8cdb-6e28b48ebbd3.
[22] GMO Internet. (2018). Cryptocurrency Mining Business: Monthly Report for July 2018. Available: https://ir.gmo.jp/en/pdf/irlibrary/disclose_info20180803_e.pdf.
[23] Marc Bevand. (2017). Bitcoin Electricity Consumption. Available: http://blog.zorinaq.com/bitcoin-electricity-consumption/. Last accessed 15/07/2018
[24] Giga-Watt. (2018). What We Offer. Available: https://giga-watt.com/.
[25] Rachel Pipan. (2018). Bitfury CEO Announces Major Norway Expansion, Meets with Government Officials. Available: https://bitfury.com/content/downloads/03_20_18_bitfury_norway_datacenter_release.pdf.
[26] Zheping Huang & Joon Ian Wong. (2017). The lives of bitcoin miners digging for digital gold in Inner Mongolia. Available: https://qz.com/1054805/what-its-like-working-at-a-sprawling-bitcoin-mine-in-inner-mongolia/.
[27] K. J. O'Dwyer and D. Malone, "Bitcoin mining and its energy footprint," 25th IET Irish Signals & Systems Conference 2014 and 2014 China-Ireland International Conference on Information and Communications Technologies (ISSC 2014/CIICT 2014), Limerick, 2014, pp. 280-285. Available: http://ieeexplore.ieee.org/stamp/stamp.jsp?tp=&arnumber=6912770&isnumber=6912720
[28] Gordon E Moore. (1965). Cramming More components onto Integrated Circuits. Available: https://drive.google.com/file/d/0By83v5TWkGjvQkpBcXJKT1I1TTA/view.
[29] GMO Internet. (2018). Worlds first 7nm Mining Chip. Available: https://gmominer.z.com/en/.
[30] Hass McCook (2014). A critical assessment of the Bitcoin mining industry, gold production industry, the legacy banking system, and the production of physical currency. Available:: https://www.scribd.com/doc/228253109/The-Relative-Sustainability-of-the-Bitcoin-Network-by-Hass-McCook.
[31] Blockchain Info. (2018). Confirmed Transactions Per ay. Available: https://www.blockchain.com/charts/n-transactions.
[32] Capgemini. (2018). Non Cash Payment Volume. Available: https://www.worldpaymentsreport.com/#non-cash-payments-content.
[33] Joseph Poon, Thaddeus Dryja. (2016). The Bitcoin Lightning Network: Scalable Off-Chain Instant Payments. Lightning Network White Paper. Available: https://lightning.network/lightning-network-paper.pdf
[34] ASIC Miner Value . (2018). ASIC Manufacturer Directory. Available: https://www.asicminervalue.com/manufacturers.
[35] Bitcoin Wiki. (2018). ASIC Mining Chip List, ASIC Development Projects. Available: https://en.bitcoin.it/wiki/List_of_Bitcoin_mining_ASICs.
56
[36] Blockchain Info. (2017). Hash Rate. Available: https://www.blockchain.com/charts/hash-rate.
[37] Blockchain Info. (2017). Difficulty. Available: https://www.blockchain.com/charts/difficulty.
[38] Internation Energy Agency. (2017). Headline Energy Data. Available: https://www.iea.org/statistics/?country=WORLD&year=2015&category=Key%20indicators&indicator=TPESbySource&mode=chart&categoryBrowse=false.
[39] Vincent K M Cheng, Geoffrey Hammond. (2014). Energy density and spatial footprints of various electrical power systems. Energy Procedia. 61 (1), 578-581
[40] LINK ATM. (2017). statistics and Trends. Available: https://www.link.co.uk/about/statistics-and-trends/.
[41] Kurt W. Roth, Fred Goldstein, Jonathan Kleinman. (2002). Energy Consumption by Office and Telecommunications Equipment in Commercial Buildings. Energy Consumption Baseline. 1 (1), 166-167
[42] The UK Card Association. (2018). UK Card Payments 2017. Available: http://www.theukcardsassociation.org.uk/wm_documents/UK%20Card%20Payments%202017%20%20website%20FINAL.pdf.
[43] Verifone. (2018). Verifone POS Terminal Specifications. Available: https://www.wirelessterminalsolutions.co.uk/product/verifone-vx670-verifone-vx680-standard-charging-base/.
[44] Visa. (2018). Visa Corporate Responsibility Report. Available: https://usa.visa.com/dam/VCOM/download/corporate-responsibility/visa-2016-corporate-responsibility-report.pdf.
[45] Guoliang Luo, Erli Dan, Xiaochun Zhang, Yiwei Guo. (2018). Why the Wind Curtailment of Northwest China Remains High. Sustainability. Available: www.mdpi.com/2071-1050/10/2/570/pdf
[46] Bitfury. (2018). Black Box. Available: https://bitfury.com/hardware/blockbox.
10Appendices
AppendixA………..……….ASICHardwareStatistics………………..……….EXCELTab1
AppendixB………………….ProfitabilityTable…………………………………..EXCELTab2
AppendixC…………………NetworkHardwareBreakdown……….………EXCELTab3

57
AppendixD………………..EnergyImpact……………….…………………………EXCELTab4
AppendixE…………………BitcoinDailyStatistics……………………………..EXCELTab5
AppendixF…………………DemandandGrowth…………………………….…EXCELTab6


![A Privacy-Preserving Networked Hospitality Service with the Bitcoin … · 2018-08-21 · Bitcoin uses a novel permis-sionless consensus protocol known as proof-of-work [4] to make](https://img.pdfslide.net/doc/110x75/5f3d9074e48dfc78716e76e3/a-privacy-preserving-networked-hospitality-service-with-the-bitcoin-2018-08-21.jpg)


![An Analysis of Anonymity in the Bitcoin Systemclark/biblio/bitcoin/Reid 2011.pdf · peer-to-peer network and is agreed upon using a proof-of-work system [3], [4]. The first Bitcoins](https://img.pdfslide.net/doc/110x75/5f10a0037e708231d44a06ac/an-analysis-of-anonymity-in-the-bitcoin-system-clarkbibliobitcoinreid-2011pdf.jpg)