Embed Size (px)
Citation preview

T.C.
BAHÇEŞEHİR ÜNİVERSİTESİ
AN ANALYSIS OF ENVIRONMENTALLY
CONSCIOUS PRACTICES IN TURKISH
COMPANIES
Master Thesis
İPEK ÖZER
İSTANBUL, 2009


T.C.
BAHÇEŞEHİR ÜNİVERSİTESİ
THE GRADUATE SCHOOL OF NATURAL AND APPLIED SCIENCES
INDUSTRIAL ENGINEERING
AN ANALYSIS OF ENVIRONMENTALLY
CONSCIOUS PRACTICES IN TURKISH
COMPANIES
Master Thesis
İpek ÖZER
Associate Professor Erkan BAYRAKTAR Supervisor
İSTANBUL, 2009

Dedicated to Nuran & Mesut ÖZER

T.C.
BAHÇEŞEHİR ÜNİVERSİTESİ
The Graduate School of Natural and Applied Sciences
Industrial Engineering
Title of the Master’s Thesis : AN ANALYSIS OF ENVIRONMENTALLY CONSCIOUS PRACTICES IN TURKISH COMPANIES
Name/Last Name of the Student : İPEK ÖZER Date of Thesis Defense : 24/07/2009 The thesis has been approved by the Graduate School of Natural and Applied Sciences. Professor A. Bülent ÖZGÜLER Director This is to certify that we have read this thesis and that we find it fully adequate in scope, quality and content, as a thesis for the degree of Master of Science. Examining Committee Members: Associate Professor Erkan Bayraktar : Assistant Professor Tunç Bozbura : Professor Ekrem Tatoğlu :

i
ÖZET
TÜRK ŞİRKETLERİNDE ÇEVREYE DUYARLI UYGULAMALARIN İNCELENMESİ
Özer, İpek
Endüstri Mühendisliği
Tez Danışmanı: Doç. Dr. Erkan Bayraktar
Temmuz 2009, 112 Sayfa
Günümüzde özellikle küresel ısınma konusundaki duyarlılığın arttığı bir dönemde çevre
ile ilgili konuların başında karbon salınımlarını azaltmak geliyor. Toplumun bu konuda
yaşadığı endişeler artık herkesi çevreye duyarlı olmaya çağırıyor. Yapılan araştırmalar
çevreye en büyük zararın; enerji, taşıma ve ağır sanayi sektörlerinin neden olduğunu
gösteriyor. Aynı zamanda, toplumun ekolojik çevre konusunda artan hassasiyeti, Türk
şirketlerinin kurumsal sosyal sorumluluk kavramına daha fazla önem vermesini
gerektiriyor. Bu kapsamda şirketlerin çevreye verebileceği zararı en aza indirgemek
durumunda olduklarını kabul etmeleri ve buna uygun davranmaları konusunda daha
duyarlı hale gelmeleri kaçınılmaz bir gerçek olmuştur.
Bu ampirik çalışma; Türk şirketlerinde çevreye duyarlı yönetim anlayışının ve
uygulamaların değişik faktörlere göre nasıl etkilendiğini, istatistiki verilere dayanarak
açıklamaktadır. Şirketlerin çevresel bilincini ölçmek amacıyla yapılan 519 katılımcılı bu
çalışmada altı ayrı bölümden oluşan toplam 34 soru sorulmuştur. Yapılan anket
çalışması sonucunda çoklu regresyon analizi kullanılarak; çevreyi kirleten potansiyel
tedarik zinciri süreçlerinin, çevre yönetimini destekleyen faktörlerin, çevresel rekabetin,
farklılaştırmaya dayalı rekabet önceliklerinin ve müşteri ilişkilerinin farkındalık seviyesi
arttıkça, çevreye duyarlı uygulamaların farkındalık seviyesinin de olumlu yönde arttığı
sonucuna varılmıştır.
Anahtar Kelimeler: Çevreye duyarlı uygulamalar, Yeşil Tedarik Zinciri Yönetimi,
Kurumsal Sosyal Sorumluluk, Türkiye.

ii
ABSTRACT
AN ANALYSIS OF ENVIRONMENTALLY CONSCIOUS PRACTICES IN TURKISH COMPANIES
Özer, İpek
Industrial Engineering
Supervisor: Associate Professor Erkan Bayraktar
July 2009, 112 Pages
Nowadays, in a period where awareness on global warming is increasing, reducing
carbon dioxide emissions is one of the leading concerns regarding the ecological
environment. The concerns that the public has regarding this topic call everyone to be
more environmentally conscious. Previous research studies prove that the greatest
damage to the environment comes from the energy, transportation and industrial sectors.
At the same time, the public’s increasing sensitivity on the ecological environment has
been driving Turkish companies, which are socially responsible; to reduce the damage
they have on environment to a minimum and behave according to this.
This empirical study explains using statistical data, how the level of environmentally
conscious practices by Turkish companies varies according to different factors. A total
of 34 questions in a six separate sections were asked to 519 participants to determine the
environmental awareness of companies. Using multiple regression analysis, the survey
results showed that as the level of awareness in the five items; supply chain
management potential polluters, environmental management drivers, competitive
environment, differentiation based competitive priorities and customer relationship
increases, the level of environmentally conscious practices increases positively.
Keywords: Environmentally Conscious Practices, Green Supply Chain Management,
Corporate Social Responsibility, Turkey.

iii
ACKNOWLEDGEMENTS
I am grateful to the following individuals for their personal and professional support
throughout the process of this thesis: to my committee members for their detailed
attention; and Associate Professor Erkan Bayraktar in particular, who has been
everything a great mentor should be: kind, patient, thoughtful and demanding of
excellence; to Professor Ekrem Tatoğlu for his useful suggestions, greatest patience and
valuable support; to Professor A. Raj Chowdhury from Kent State University for his
support to pursue my higher education and his fellowship; to my colleagues at
Bahcesehir University, friends and family who cheered me along when the road became
difficult; to Volkan Güçlü for his constant and unconditional love and support (and
editing skills). Finally, I give special thanks to my loving parents and my brother Mert
Özer, who have given me the roots and wings to succeed in this world. This thesis
would not be possible without their love and encouragement over the years.

iv
TABLE OF CONTENTS
ACKNOWLEDGEMENTS ......................................................................................... iii TABLE OF CONTENTS ............................................................................................. iv LIST OF TABLES ....................................................................................................... vi LIST OF FIGURES .................................................................................................... vii ABBREVIATIONS LIST .......................................................................................... viii
1. INTRODUCTION............................................................................................... 1
2. THEORETICAL BACKGROUND................................................................... 4
2.1 CORPORATE SOCIAL RESPONSIBILTY................................................ 8 2.2 CORPORATE SOCIAL RESPONSIBILTY PRACTICES IN THE SUPPLY CHAIN..................................................................................................... 11
2.2.1 Internal Social Responsible Practices ................................................... 12 2.2.2 Stakeholder Social Responsible Practices ............................................. 14 2.2.3 Community Social Responsible Practices ............................................. 15 2.2.4 Supplier Social Responsible Practices .................................................. 17
3. LITERATURE REVIEW AND HYPOTHESES DEVELOPMENT........... 18
3.1 ENVIRONMENTALLY CONSCIOUS PRACTICES.............................. 18 3.1.1 Design for the Environment (DFE) or Eco-Design ............................... 21 3.1.2 Life Cycle Analysis (LCA) .................................................................. 22 3.1.3 Total Quality Environmental Management (TQEM) ............................ 23 3.1.4 Environmental Regulations .................................................................. 24 3.1.5 Green Supply Chain Management (GSCM) ......................................... 28
3.2 DRIVERS AND BARRIERS TO IMPLEMENT ENVIRONMENTALLY CONSCIOUS PRACTICES....................................................................................39
3.2.1 Environmental Management Drivers ................................................. ...39 3.2.2 Environmental Management Barriers ................................................. ..44
3.3 USING RENEWABLE ENERGY, RESOURCES AND CLEANER TECHNOLOGIES...................................................................................................48 3.4 CONCEPTUAL FRAMEWORK AND HYPOTHESES DEVELOPMENT......................................................................... 50
3.4.1 SCM Potential Polluters and Environmentally Conscious Practices ...... 51 3.4.2 Environmental Management Drivers and Environmentally Conscious Practices .......................................................................................................... 55 3.4.3 Competitive Environment and Environmentally Conscious Practices ... 56 3.4.4 Competitive Priorities and Environmentally Conscious Practices ......... 57 3.4.5 Customer Relations and Environmentally Conscious Practices ............. 59

v
4. RESEARCH METHODOLOGY..................................................................... 61
4.1 QUESTIONNAIRE DEVELOPMENT...................................................... 61 4.2 DATA COLLECTION AND SAMPLING CHARACTERISTICS........... 61 4.3 OPERATIONALIZATION OF VARIABLES........................................... 64
4.3.1 Dependent Variable ............................................................................. 64 4.3.2 Independent variables .......................................................................... 65 4.3.3 Control Variables ................................................................................. 68
5. RESULTS AND DISCUSSION........................................................................ 69
5.1 DESCRIPTIVE STATISTICS.................................................................... 69 5.1.1 Environmentally Conscious Practices .................................................. 69 5.1.2 SCM Potential Polluters ....................................................................... 70 5.1.3 Environmental Management Drivers .................................................... 71 5.1.4 Competitive Environment .................................................................... 72 5.1.5 Competitive Priorities .......................................................................... 72 5.1.6 Customer Relations .............................................................................. 73
5.2 HYPOTHESES TESTING ____________________________________ 73 5.2.1 Regression Analysis ............................................................................. 75
6. CONCLUSION.................................................................................................. 80
6.1 SUMMARY OF FINDINGS....................................................................... 80 6.2 IMPLICATIONS......................................................................................... 82 6.3 LIMITATIONS AND FUTURE RESEARCH........................................... 83
BIBLIOGRAPHY ....................................................................................................... 86
APPENDICES ............................................................................................................ 97 Appendix A.1. List of countries by carbon dioxide emissions, 2007 ............................ 98 Appendix A.2. List of countries by carbon dioxide emissions per capita, 2007 .......... 100 Appendix A.3. A survey on environmentally conscious practices .............................. 103

vi
LIST OF TABLES
Table 2.1: List of top 10 countries and Turkey by 2004 Emissions ................................ 5
Table 3.1: Summary of components and sub-components of major ECBP ................... 20
Table 3.2: Descriptions of sub-components of design for environment (DfE) .............. 22
Table 3.3: IS0 14001 certification sections for EMS.................................................... 26
Table 3.4: Traditional versus ecocentric management ................................................. 29
Table 3.5: Market demands associated with competitive priorities .............................. 59
Table 4.1: Respondent profile of the survey ................................................................ 62
Table 4.2: Characteristics of the sample ...................................................................... 63
Table 5.1: Descriptive statistics of environmentally conscious practices ...................... 70
Table 5.2: Descriptive statistics of SCM potential polluters ......................................... 71
Table 5.3: Descriptive statistics of environmental management drivers ....................... 71
Table 5.4: Descriptive statistics of competitive environment ....................................... 72
Table 5.5: Descriptive statistics of competitive priorities ............................................. 72
Table 5.6: Descriptive statistics of environmentally conscious practices ...................... 73
Table 5.7: Descriptive statistics and correlation coefficients of the variables ............... 74
Table 5.8: Regression results on the extent of the level of environmentally conscious practices...................................................................................................................... 76
Table 6.1: Summary of findings .................................................................................. 80

vii
LIST OF FIGURES
Figure 2.1: Global Emissions of CO2 from fossil fuels .................................................. 4
Figure 2.2: Sector-specific trends in Turkey (1990-2006) .............................................. 6
Figure 2.3: The share by sectors of 2010 greenhouse gas emissions .............................. 7
Figure 2.4: A hierarchy of CSR ..................................................................................... 9
Figure 2.5: Relationships 3P, CS and CSR .................................................................... 9
Figure 2.6: General model of CS/CR and its dimensions ............................................. 10
Figure 2.7: Corporate stakeholders .............................................................................. 14
Figure 3.1: Strategic components of ECM. .................................................................. 19
Figure 3.2: ISO 14001 and environmental management systems ................................. 25
Figure 3.3: Environmental management and supply chain orientation ......................... 31
Figure 3.4: Classification based on problem context in supply chain design ................ 32
Figure 3.5: Common supply chain functions ............................................................... 33
Figure 3.6: Reverse supply chain................................................................................. 35
Figure 3.7: Aligning environmental and supply chain orientation ................................ 38
Figure 3.8: A preliminary model of corporate ecological responsiveness ..................... 40
Figure 3.9: Environmental motivations ....................................................................... 44
Figure 3.10: Structural model of ECM barriers. ........................................................... 45
Figure 3.11: Conceptual framework ............................................................................ 52
Figure 3.12: Natural alignments of competitive strategies and the competitive priorities of manufacturing strategy............................................................................................ 58

viii
ABBREVIATIONS LIST
Carbon Dioxide Information Analysis Center : CDIAC Corporate Environmental Management : CEM Corporate Environmental Responsibility : CER Corporate Sustainability : CS Corporate Social Performance : CSP Corporate Social Responsibility : CSR Design-for-environment : DFE Environmentally Conscious Business Practices : ECBP Environmentally Conscious Practices : ECP Environmentally Conscious Supply Chain Management : ECSCM Environmentally Conscious Manufacturing : ECM Environmental Protection Agency : EPA Environmental Management System : EMS Green Supply Chain Management : GSCM International Energy Agency : IEA The International Standards Organization : ISO Life Cycle Analysis : LCA Non-Governmental Organizations : NGOs Organization for Economic Cooperation and Development: OECD Purchasing Social Responsibility : PSR Supply Chain Management : SCM

1
1. INTRODUCTION
Competition between institutions has gained high importance in the present global
economy. Institutions have to estimate and forecast better than their competitors and
differentiate themselves; hence they need to develop strategies. As a matter of fact
institutions and corporations have to comply with customs, rules and laws of the society
they belong to.
In order to have a long life-circle in today’s competitive environment, institutions need
to develop a corporate mission and vision which combine the society needs and rules
with the business needs and rules. Interaction of society and business needs have to
create a consistent environment to live. Industrial societies are increasingly recognizing
the need for shifting to more environmentally conscious practices. Therefore, there is a
need for modifying existing processes and developing new technologies that minimize
environmental impact or pollution while providing stimulating economic value to
businesses.
In the global competition environment, the organizations that given importance to social
responsibilities, could achieve their missions and increase their brand value; moreover
they get competitive advantage against competitors. One of the important issues of
corporate social responsibility projects is minimizing the environmental damages during
their production.
Today all stakeholders of an organization are more sensitive to the production levels
and started to examine the given environmental damages related to organization. For
instance customer’s knowledge about the environment is improving and they are
starting to examine the environmental damages caused by the organizations too.
Moreover in some cases customers’ behaviors are changing whether the firms produce
environment friendly products start to prefer more than the other organizations.
Since the level of CO2 emissions started to increase after the industrial revolution, there
is a strong need to control the environmental pollution around the world. Where

2
awareness on environmental issues like global warming is increasing, reducing carbon
dioxide emissions is one of the leading concerns regarding the ecological environment.
With this issue, the environmental awareness of management’s approach is significant.
Because of different drivers that force the companies to go green, each organization has
to be aware of the environment and natural resources. In this dissertation, the main goal
is to identify the implementation level of environmentally conscious practices
Previous research studies prove that the greatest damage to the environment comes from
the energy, transportation and industrial sectors. At the same time, the public’s
increasing sensitivity on the ecological environment has been driving Turkish
companies, which are socially responsible; to reduce the damage they have on
environment to a minimum and behave according to this.
This dissertation is mainly focused on an empirical study that measures how the level of
environmentally conscious practices by Turkish companies varies according to different
factors. A total of 34 questions in a six separate sections were asked to 519 participants
to determine the environmental awareness of companies. It is expected that; supply
chain management potential polluters, environmental management drivers, competitive
environment, differentiation based competitive priorities and customer relationship are
positively associated with the level of environmentally conscious practices.
As the theoretical background of this dissertation, social responsibility concept is
examined; moreover, environmental pollution around the World and especially in
Turkey is searched thoroughly. The industrial sectors which have the biggest
importance on environmental pollution and CO2 emissions are discussed. As a result of
all these investigations, in the literature review of this dissertation, importance of
corporate social responsibility is given. Moreover, the corporate social responsible
practices in the supply chain based on the degree or effect of responsibility that a firm
has for the different stakeholder groups is discussed.
In Chapter 3, environmentally conscious practices are examined in details; especially
green supply chain management concept is discussed. Environmental management
drivers and barriers are also given in this chapter. Lastly, five hypotheses are generated
to measure the implementation level of environmentally conscious practices. A survey

3
is developed according to the previous studies in the literature and an analysis of
environmentally conscious practices in Turkish companies is discussed.
In Chapter 4, research methodology of the questionnaire is presented. The general
information about survey instruments, sample and data collection, and
operationalization of variables are provided. The reliability analysis is analyzed to
measure the internal consistency of the constructs used in the survey. In Chapter 5, the
results and discussions are provided, analysis of descriptive statistics is undertaken to
test the hypotheses.
As a conclusion chapter, summary of findings is given and implications for managers
and government are discussed, and some advices are mentioned for future studies.

4
2. THEORETICAL BACKGROUND
Industrial activities have created serious ecological problems in the past half century.
The fact that unlimited and unconscious use of natural resources caused irreversible
environmental destructions. Environmental issues include; global warming, greenhouse
gases, carbon dioxide (CO2) emissions, ozone depletion, loss of biodiversity, natural
resource scarcity, air pollution, acid rain, toxic wastes, and industrial accidents
(Shrivastava 1995b, p.183).
Since the Industrial Revolution, as a result of burned fossil fuels, the emission amounts
have increased - to the atmosphere outspreaded emissions caused to huge changes in the
earth climate. Especially, increase at the level of CO2 emissions caused to greenhouse
effects in the atmosphere. Figure 2.1 demonstrates that worldwide emissions of CO2
have risen steeply since the start of the industrial revolution, with the largest increases
coming after 1945 (Earth Trends Country Profiles, Climate and Atmosphere Turkey
2003).
Source: Baumert, K.A., Herzog, T. & Pershing, J., 2005. Navigating the Numbers: Greenhouse Gas Data and International Climate Policy. World Resources Institute.
Figure 2.1: Global Emissions of CO2 from fossil fuels

5
In Appendix A.1, the list of countries by carbon dioxide emissions due to human
activity is given. The data presented in the table corresponds to the emissions in 2004.
In 2007, CDIAC for United Nations collected the data that considers only carbon
dioxide emissions from the burning of fossil fuels, but not emissions from deforestation,
and fossil fuel exporters, etc. Table 2.1 shows the top 10 countries around the world,
according to the total annual carbon dioxide emission percentages (Appendix A.1).
Table 2.1: List of top 10 countries and Turkey by 2004 Emissions
Ranking Country Annual CO2 emissions (in thousands of metric tons)
Percentage of total emissions
1 United States 6,049,435 22.2 % 2 China and Taiwan 5,010,170 18.40% 3 European Union 4,001,222 14.70% 4 Russia 1,524,993 5.60% 5 India 1,342,962 4.90% 6 Japan 1,257,963 4.60% 7 Germany 860,522 3.10% 8 Canada 639,403 2.30% 9 United Kingdom 587,261 2.20%
10 South Korea 465,643 1.70% 23 Turkey 226,125 0.80%
Others 5,280,059 41.70%
World (207 Countries) 27,245,758 100.0 % Source: CDIAC (Carbon Dioxide Information Analysis Center), 2004.
In Appendix A.2, the list of countries by carbon dioxide emissions per capita from 1990
through 2004 is given in details. All data were calculated by the US Department of
Energy's Carbon Dioxide Information Analysis Center (CDIAC), mostly based on data
collected from country agencies by the United Nations Statistics Division. The United
States is the 1st largest in accord with the percentage of total carbon dioxide emissions;
whereas 10th largest emitter of carbon dioxide emissions per capita in 2004 (Appendix
A.2). According to preliminary estimates, since 2006 China has had a higher total
emission due to its much larger population and an increase of emissions from power
generation. China is the 91st largest emitter of carbon dioxide emissions per capita as of
2004. If we analyze the Turkey’s ranking, she is the 98th largest emitter country around
the world (Appendix A.2).

6
CO2 emissions according to the sectors around the world between years 1990-2030 is
given in World Energy Outlook report that was prepared by International Energy
Agency (IEA), in 2004. The sectors of power generation, other transformation, industry
and transport are analyzed. According to the report from IEA, CO2 emissions in power
generation and transport are expected to increase the most in the following two decades
all around the world.
Different industries in Turkey affect environmental pollution and have different CO2
emission rates. Share of greenhouse gases by main sources are; agriculture 4.9%, waste
9.1%, transport 13.4%, energy supply and use excluded transport 64.4% and industrial
processes 8.2%. CO2 has the biggest ratio with 82.7% besides CH4, N2O and F-gases
(Greenhouse gas emission trends and projections in Europe 2008).
In Figure 2.2, sector-specific trends between 1990 and 2006 in Turkey are given. In
2005-2006, the important increase in emissions was mainly due to the energy sector
(202). Also, in general emissions almost doubled since 1990. Environmental pollution
increased in all sectors except agriculture (89).
Source: Greenhouse gas emission trends and projections in Europe, 2008. EEA Report, 5.
Figure 2.2: Sector-specific trends in Turkey (1990-2006) Another report published in 2007 displays the share by sectors of 2010 greenhouse gas
emissions according to the “With Measures” projections. As seen in Figure 2.3, in 2010
supply sector will take place in the share by greenhouse gas emissions.

7
Transport32%
Electrical Sector 31%
Industry 18%
Residential Sector14%
Agriculture4%
Supply Sector1%
Source: Greenhouse gas emission trends and projections in Europe. Turkey, 2007.
Figure 2.3: The share by sectors of 2010 greenhouse gas emissions Lise (2006) studied on the decomposition of CO2 emissions over 1980-2003 in Turkey.
A decomposition analysis was undertaken to answer the following question: which
actors -i.e. scale, composition, energy and carbon intensity- explain changes in CO2
emissions. As a result of this study, the decomposition analysis indicates that the largest
increase in CO2 emissions is caused by the expansion of the economy (scale effect). In
per capita terms, the scale effect is more dominant in the 1980s than in the 1990s in
explaining the increase in CO2 emissions. The composition of the economy and the
carbon intensity has also contributed to the increase in CO2 emissions. The main
conclusion according to research done by Lise (2006) is; no significant reduction in
carbon emissions is observed in any sectors in the Turkish economy (Lise 2006,
pp.1850-1851). Therefore, in the absence of carbon policies, no significant reduction in
CO2 emissions can be observed in the Turkish economy in the future.
To reduce the greenhouse gas emissions and promote technological development and
spread of renewable energy, recent policies and proposals employ a broad range of
incentives (Fischer & Newell 2005, p.1). The primary concern of most businesses now
is how to manage their environmental impacts effectively and efficiently. Also,
environmentally sustainability – the need to protect the environment and conserve
natural resources- is now a value embraced by the most competitive and successful
multinational companies (Berry & Rondinelli 1998, p.38).

8
“Sustainable development involves control over population growth, providing worldwide food security, preserving ecosystem resources, and reorienting energy use and industry to ecologically sustainable directions” (Shrivastava 1995b, p.184).
Related to the data sets, analysis and research; industry, energy and transportation has
great impact on CO2 emissions (Baumert, Herzog & Pershing 2005). Therefore, the
organizations must be aware of the environment whether it’s a manufacturing or service
company. Greening the processes of a company and being aware of the environment has
become a “social responsible” concept. As a theoretical background research, corporate
social responsibility is clarified in this chapter.
2.1 CORPORATE SOCIAL RESPONSIBILTY
The definition of social responsibility has been subject to changes within the time. In
the beginning of 1980s, it was defined as managing of the enterprise without damaging
the interests of any related parties such as; stock holders, employees, customers and the
whole society (Carter & Jennings 2002, p.38). Today due to the increase in
environmental consciousness, the responsibility regarding ecological environment has
become an important part of the social responsibility concept.
The term corporate social responsibility (CSR) has been defined in various ways from
the narrow economic perspective of increasing shareholder wealth, to economic, legal,
ethical and discretionary strands of responsibility, to good corporate citizenship (Jamali
2008, p.214).
Carroll (1991) organized the notion of multiple corporate social responsibilities in a
pyramid construct. In this pyramid shown in Figure 2.4, economic responsibility is the
basic foundation. This conceptualization implies that the four responsibilities are
additive or aggregate. Economic and legal responsibilities are socially required (i.e.,
mandatory), ethical responsibility is socially expected, while philanthropy is socially
desired and each of these responsibilities comprises a basic component of the total
social responsibility of a business firm (Jamali 2008, p.215).

9
Source: Jamali, D., 2008. A Stakeholder Approach to Corporate Social Responsibility: A Fresh Perspective into Theory and Practice. Journal of Business Ethics 82: 213-231, p.215.
Figure 2.4: A hierarchy of CSR Corporate sustainability is considered as the ultimate goal; meeting the needs of the
present without compromising the ability of future generations to meet their own needs.
The base three aspects related with corporate social responsibility are; profit, people and
planet (seen in Figure 2.5)In spite of the traditional bias of CS towards environmental
policies the various contributions showed sufficient interest in integrating social aspects
into CS (Marrewijk 2003, p.102).
Source: Marrewijk, M.V., 2003. Concepts and definitions of CSR and Corporate Sustainability: Between Agency and Communion. Journal of Business Ethics, Kluwer Academic Publishers, 44: p. 101.
Figure 2.5: Relationships 3P, CS and CSR In the early 21st century, the corporate social responsibility concept seems to have great
potential for innovating business practices with a positive impact on people, planet and
profit (Zwetsloot 2003, p.203). Simultaneously, Marrewijk (2003) mentions on the three
Corporate Sustainability
Corporate Social Responsibility
P R O F I T
P L A N E T
P E O P L E
Total Responsibility
Discretionary Responsibility
Ethical Responsibility
Legal Responsibility
Economic Responsibility

10
aspects of sustainability (economic, environmental, and social) that can be translated
into a CR approach that companies have to be concerned with. The simple illustration in
Figure 2.6 depicts the relationship of corporate sustainability (CS), corporate
responsibility (CR) and corporate social responsibility (CSR), and, the economic and
environmental dimensions. This also shows how CSR fits into the current CR or CS
framework to complete the picture of corporate sustainability (Marrewijk 2003, p.102).
CSR relates to phenomena such as transparency, stakeholder dialogue and sustainability
reporting, while CS focuses on value creation, environmental management,
environmental friendly production systems, human capital management and so forth
(Marrewijk 2003, p.102). Figure 2.6 is the general model of corporate sustainability and
corporate responsibility with its dimensions (Marrewijk 2003, p.101).
Source: Marrewijk, M.V., 2003. Concepts and definitions of CSR and Corporate Sustainability: Between Agency and Communion. Journal of Business Ethics, Kluwer Academic Publishers, 44: p. 102.
Figure 2.6: General model of CS/CR and its dimensions In recent years, a management term called environmentally conscious supply chain
management (ECSCM) is emerged (Beamon 2005, p.222). It refers to the control
exerted over all immediate and eventual environmental effects of products and
processes associated with converting raw materials into final products. Beamon (2005)
states that ECSCM is aligned with the safety, health, and welfare of the public and
related with sustainability. Supply chain management practices related with corporate
social responsibility practices are discussed in the next section.
Corporate Responsibilty
Corporate Responsibilty
Economical ıResponsibility
Environmental ıResponsibility
Social Responsibilty
Corporate Sustainability

11
2.2 CORPORATE SOCIAL RESPONSIBILTY PRACTICES IN THE SUPPLY CHAIN
Environmental or conservation practices are sometimes compared to socially
responsible practices. The type of required performance is different between these
practices. About environmental topics, organizations try to decrease their impact on the
natural environment; one of these topics argues that the goal is to have no effect on the
environment and to guarantee that their “environmental footprint” is insignificant
(University of North Carolina at Chapel Hill and the Environmental Law Institute 2001,
p.194).
The term footprint is used as an indicator of environmental sustainability. Carbon
footprints measure the sustainability and environmental impact of our day-to-day
actions on climate change. It is also used to measure and manage resources throughout
the national and global economy (Visser et al. 2007, p.168).
The ultimate objective of the organization is to increase the welfare and life standards of
the society around the organizations’ location. Besides decreasing effects, the
organization tries to improve the positive impacts on the social context. In addition to
that, according to stakeholders; corporations should be involved in the development of
human welfare without discriminate their locations (Ball 2006, p.A1). As a result,
organizations need to be proactive in their social responsible practices to guarantee their
positive societal effect as they reduce environmental footprint.
Zutshi and Sohal (2004) support that; when firms have corporate social responsibilities,
then their supply chains become more efficient. Therefore, corporate social
responsibility concept has various benefits for the enterprises. These benefits are listed
below:
“More effective communication with customers hence more sales,
Better relations in the society
Decreasing the tension in relations with competitors
The increase in the loyalty of the employees
More trust towards the managers and the products of the company
Improved corporate image, etc” (Zutshi & Sohal 2004, pp.374-376).

12
The firms that acted appropriate to its corporate social responsibilities, they create their
business strategy and policies according to those. In fact corporate social
responsibilities bring good business strategies and policies together. This includes to be
given more importance to the environment, as well as to be established good relations
with the stakeholders, both from employees and suppliers to customers and distributors.
For instance contemporary business cycle gives importance to establishing good
relations with employees. The aim is to get fully employee involvement that is seen as a
prior condition for successful business (Zutshi & Sohal 2004, p.372).
Clark (1999) points out that many multinational companies are adopting environmental
management systems (EMS) to satisfy customer pressures and to ensure that their
suppliers are operating in environmentally and socially responsible ways. Some are
doing so in response to peer pressure as more corporations adopt environmental
management systems and require their second and third tier suppliers to do so as well.
Growing interest among corporate stakeholders is also driving more corporations to
adopt EMS and to certify them (Morrow & Rondinelli 2002, p.160).
Clarkson (1995, pp.92-94) categorizes the social responsible practices based on the
degree or effect of responsibility that a firm has for the different stakeholder groups.
These categories are;
Internal social responsible practices,
Stakeholder social responsible practices,
Community social responsible practices,
Supplier social responsible practices.
2.2.1 Internal Social Responsible Practices There are many benefits of CSR for employees. For instance in this wise employees’
trust to the business increase, and they become more loyal to the business. In fact,
businesses give more importance to their employees. Today, to be successful,
managements develop a climate of trust, and friendly and respectfully environments in
their businesses (Marrewijk 2003, p.99).

13
In nowadays business circle is given very importance to full employee involvements. In
fact the employees enjoy from taking responsibilities, having key roles in businesses;
therefore, given responsibilities to the workers impact their efficiencies positively. Also
the team works constitute efficient working possibilities for employees. For improving
their abilities, businesses encourage their employees by education and training. The
International Standards Organization (ISO) management system identifies ‘full
employee involvement’, as a prior condition for successful working and achievement of
environmental and quality objectives (Zutshi & Sohal 2004, p.372).
An organization is mainly responsible to improve the employees’ welfare and work
conditions. The reason is work behaviors are affected from several operating practices
and pressures that are related to safety. Therefore, safety in the workplace and the
pressures on employees decrease or increase the performance or efficiency of the
employees. The injuries and accidents should be reduced by job trainings and education.
Firms should be proactive to guarantee that the work procedures keep a long-term focus
that will make workers happier and healthier (Brown, Willis & Prussia 2000, pp. 445-
448). As a result of these, the firm performance and efficiency will be increased and the
employees will be much more productive.
According to Zutshi and Sohal (2004), employee involvement and empowerment
management style has some obstacles from the managers’ point of view:
Resistance to change [by employees],
Lack of trust by employees of management motives, due to sudden change in
working styles,
Lack of clear expectation of the extent of involvement in the problem solving
process,
Lack of participative skills from the employees, as they may not have previously
experienced such concepts, and
Lack of on-going commitment from the top management, who after initial
encouragement leave rest of the delegating and maintenance to the managers.
Employees will be more likely to go out of their way to ensure that the firms perform
well when they recognize that the organization is truly committed to them. Previous

14
empirical research has proven that organizations whose employees feel a higher level of
commitment and well-being perform better. Those firms are better able to exclude their
strategies and receive tremendous dedication from the employees in return, when they
are more committed to them (Lee & Miller 1999, p.579).
2.2.2 Stakeholder Social Responsible Practices The CSR’s utilities are including all corporate stakeholders. Stakeholders means
employees, community, non-governmental organizations, as well as suppliers,
distributors, service providers, consumers, shareholders, etc (Roberts 2003, p.160). In
Figure 2.7, corporate stakeholders are shown in details. Stakeholder is a broad term and
can encompass a number of individual(s) or group(s) directly or indirectly impacted by
organizational activities (Zutshi & Sohal 2004, p.373).
Source: Roberts, S., 2003. Supply Chain Specific? Understanding the Patchy Success of Ethical Sourcing Initiatives. Journal of Business Ethics, Kluwer Academic Publishers, 44: p.162.
Figure 2.7: Corporate stakeholders There is a macro-level shift in the role of business in society where environmental and
stakeholder initiatives could reshape the basis of economic competitive advantage. The
field of corporate social responsibility has been largely disconnected from corporate
strategy while functioning in a competitive environment. It is necessary to explore the
shifts in the role of business to integrate with environmental and stakeholder
Company
cAuthorisers
Customer Groups
Business Partnerss
External Influencers
Unions
Suppliers
Employees
Distributors
Service Providers
Journalists
Community Members
Special Interest Groups Customer Segment C
Customer Segment B
ıCustomer Segment A
Board of Directiors
Shareholders
Professional Societies
Trade Associations
Regulatory Agencies
Government

15
engagements and to find out its influence on competitive value (Swift & Zadek 2002,
p.2).
Environmental and social problems and challenges do not stop at the gates of
companies, but have to be considered along the supply chains as the unit across this
related material and information flows are organized (Seuring et al. 2008, p.1545).
Brown (2000) indicates that stakeholders are increasingly exerting pressure for
information on business activities aside from financial performance:
Investors are looking for evidence of good corporate governance, particularly
sound business strategy and effective management of risk,
Customers are asking about the origins of products, their manufacturers and
what they contain,
Employees are looking to work for companies that visibly account for their
responsibilities to society and the environment,
Governments and civil society are increasingly placing pressure on businesses to
report on social and environmental performance.
2.2.3 Community Social Responsible Practices Companies that do not balance strategic intent with community expectations are likely
to find their business goals and opportunities damaged. Those that are positioned
favorably in the community are treated differentially and respectfully. As a result of
these issues, what a company does in a community and how it does, it can serve as a
competitive advantage in the market (Burke 1999).
Burke (1999) also states that a successful company should pursue two goals. An
organization must redesign its community and operational practices in ways that
respond to the community’s expectations that increasingly now define how a company
should operate. The second optional goal is defined as follows: “An organization should
take advantage of the public’s shift in attitudes and design its community involvement
programs to support its business goals and enhance its competitive advantage” (Burke
1999).

16
Corporate social responsibility philosophy increases the quality of the goods and
services. Community requests the needs and determines the complaints and satisfaction.
By the reason of community feedback, companies give more importance to the
environment, they act more environmental-friendly during its activities. In this way the
environment wouldn’t be damaged and the society could get a chance to live in a
sustainable environment (Beamon 2005, p.225).
Another benefits that corporate social responsibility is preventing environmental
pollution by protecting the environment, decrease the greenhouse gases, and increasing
voluntary responsibilities towards benefits for humanity. Therefore enterprises act
together with non-governmental organizations when they take upon responsibility on
these issues (Eren 1990).
Environmental NGOs have increased pressure on organizations to review their supply
practices (Beamon 2005, p.222). Companies also need to meet with the expectations of
NGOs, activists, communities and governments. NGOs and activists, aided by the
increasing societal transparency and electronic communication, are well known sources
of pressure. The capacity of activists and interest groups to mobilize, to disseminate
negative information about companies, and to take action, have never been greater and
we have seen this force in action a lot in the past few years. They expect more
responsibility, more information, more leadership, and often require a lot of attention
from a chief executive and its team (Karp 2003, p.16).
Therefore, some social responsibility campaigns could be more effective if enterprises
involve large layers of the society in the campaign. In this situation, collaboration can
be made with non-governmental organizations (NGOs) that are responsible about
environment. Thus the number of NGO members will increase the success of this
organization and also their contribution to the society will increase. NGOs believe that
public-private partnerships can regenerate neighborhoods (Marrewijk 2003, p.96-98).
NGOs are increasingly using corporate reputational innocently as a lever for
environmental and social change (Roberts 2003, p.160).

17
2.2.4 Supplier Social Responsible Practices Research in corporate social responsibility philosophy is beginning to recognize an
important role that supply chain management plays in the specification of possible
options, processes, and outcomes. In regard to the management of quality, supply chain,
and the environment, leading to improved competitiveness, the extension of horizons of
analysis that major advances in theory and practice can occur (Kovács 2008, p.1-3).
“Corporate Culture can be defined as an organization’s unique body of knowledge that is nurtured over a long period of time resulting in commonly held assumptions, values, norms, paradigms and world views. These shape the behavior and thinking of the people within the organization and thus form the organization’s core identity characterizing the way of doing business with qualities distinct from others” (Visser et al. 2007, p.102).
Organizations started to constitute their own corporate culture to put into practice the
CSR philosophy. According the corporate culture, firms have to form their vision and
mission. To manage its suppliers, organizations dedicate their cultural values clearly to
the suppliers so that they have to be aware of the culture and the general rules of the
firms. Suppliers would recognize that if there will be lameness in the process, they
would have to pay penalty or if they improve their cultural values, they will get extra
credit. Organizations have to manage these processes carefully and clearly to obtain its
borders according to the organizational culture (Visser et al. 2007).
Many supply chain practices and systems have an impact on stakeholder social well-
being and welfare. Larger and more powerful firms are more likely to be targeted to
help improve worker conditions in the supply chain. These firms may be perceived as
being able to force suppliers to change their practices (Kovács 2008, p.1-3).

18
3. LITERATURE REVIEW AND HYPOTHESES DEVELOPMENT
The goal of this chapter is to synthesize the relevant literature into an integrated
conceptual model linking the different environmentally conscious practices in the
supply chain management. At this point, only broad associations between major
constructs are made, and a more detailed conceptual framework is presented.
Segments of three large bodies of literature are reviewed in this chapter. The first sub-
section reviews the environmentally conscious practices in details. The second sub-
section presents the drivers and barriers to implement environmentally conscious
practices. In the third section of this chapter, renewable energy, resources and cleaner
technologies are discussed. In the light of the literature review, the conceptual
framework and hypotheses development will be discussed.
3.1 ENVIRONMENTALLY CONSCIOUS PRACTICES
Environmental consciousness has been increasing in the last few decades. More people
are aware of the world’s environmental problems such as global warming, toxic
substance usage, and decreasing in non-replenish resources (Khiewnavawongsa &
Schmidt 2008, p.244)
Today, environmentally - friendly firms want to adopt their green practices to their
supply chains. Organizations think when they achieve this idea; the overall success of
the firm will increase suddenly. Therefore, within the framework of corporate social
responsibilities, most industrial firms use environmental management system(s) (EMS)
(Zutshi & Sohal 2004, p.371).
Figure 3.1 illustrates the strategic components of environmentally conscious
management. Environmentally conscious manufacturing (ECM) and its practices has a
variety of definitions and dimensions. It ranges from smaller focused and operational
programs to broader, organization-wide strategic programs with long-term implications
for an organization. Sarkis (2001) has defined ECM within the broader context of

19
organizational corporate environmental management. A summary of the various
elements and considerations within ECM are shown in Figure 3.1 that illustrates the
pervasiveness of the decision to integrate ECM and its many dimensions into an
organization’s culture, functions and business processes (Sarkis, Mohd & Shankar 2009,
p.16).
Source: Sarkis, J., Mohd, H..A., and Shankar, R., 2009. Evaluating Environmentally Conscious Manufacturing Barriers with Interpretive Structural Modeling. http://ssrn.com/abstract=956954, p.23.
Figure 3.1: Strategic components of ECM. Environmental practices represent actions and programs within the firm that improve
environmental performance, remediate problems, and minimize any environmental
Environmental Practices
Support Elements
Operational Elements
External Environmental
Demands Industrial Eco-System
Eco-Centrisim Regulations Product Stewardship
Organizational Strategy
Manufacturing Strategy
Strategic Elements
R & D/ Planning and Control (Systems and Measurements)
Process Design
Product Design Fabrication and Assembly
Logistics
Human Resources
Accounting/Finance
Marketing
Information Systems
Reduce, Recycle, Reuse, RReclaim, Remanufacture
Design for Environment, dDisassembly, etc.
Total Quality Environmental Management
Environmental Management Systems
Environmental Performance Measurement ISO 14000
Life Cycle Analysis
Green Supply Chains
Green Consumers
Storage and Inventory
Procurement and Acquisition

20
burden. Environmentally conscious business practices require a powerful supply chain
and improved relations between parts (Sarkis 1998, p.161). ECBP also require a well-
coordination and cooperation. That is to say the capability of supply chain should be
sufficient (New & Westbrook 2004, pp.232). Because of this, before their
environmentally conscious business practices organizations should identify supply
chain strategies. Sarkis (1998) and New and Westbrook (2004) groups the components
of ECBP as; design for the environment, life cycle analysis, total quality environmental
management, green supply chain management, and environmental regulations.
Table 3.1: Summary of components and sub-components of major ECBP ECBP components ECBP sub-components Design for the Environment (DfE) Design for Recyclability
Design for Reuse Design for Remanufacturability Design for Disassembly Design for Disposal
Life Cycle Analysis (LCA) Inventory Analysis Life Cycle Costing Impact Analysis Improvement Analysis
Total Quality Environmental Management (TQEM)
Leadership Strategic Environmental Quality Planning Environmental Quality Management Systems Human Resources Development Stakeholder Emphasis Environmental Measurements Environmental Quality Assurance
Green Supply Chain Management (GSCM)
Inbound Logistics/Procurement Materials Management Outbound Logistics/Transportation Packaging Reverse Logistics
IS0 14000 EMS Requirements Environmental Policy Planning Implementation and Operation Checking and Corrective Action Management Review
Source: Sarkis, J., 1998. Evaluating environmentally conscious business practices: Theory and Methodology, European Journal of Operational Research. 107, p.161.
In the sub-section, the sub-components of environmentally conscious practices will be
discussed in details.

21
3.1.1 Design for the Environment (DFE) or Eco-Design The goal of design for the environment (DfE) or eco-design is to consider the complete
product life cycle when designing environmental aspects into a product or process. In
fact DFE is concurrent engineering. The DFE is a concept that supports the philosophy
of environmental factors needs to be integrated into the early design of any product or
process. Joseph Sarkis (1998) indicates in his research that;
“DFE incorporates the types of materials that are used in the manufacture of the product, materials’ recyclability and reusability capabilities, the materials’ long term impact on the environment, the amount of energy (and efficiency) required for the product’s manufacture and assembly, the capability for easy disassembly for remanufacturing, considerations of the product’s design to include remanufacturing characteristics, and consideration of the products durability and disposal characteristics. The DFE concept supports the philosophy that environmental factors need to be integrated into the early design of any product or process”.
If the supply function is involved at an early stage in the product design process, then
this can provide benefits to the organization. Design for the environment is also called
as green product design. DFE or green product design is an important element in
environmental management, with potential benefits including less waste, greater
productivity, and higher levels of innovation. New and Westbrook (2004, p.239) quotes
that “the shift from regulatory-driven pollution control, to pollution prevention product
technologies, necessitates changes in engineering design, research, and education”.
Eco-design or design for the environment (DFE) is a helpful tool to improve companies’
environmental performance by addressing product functionality while minimizing life-
cycle environmental impacts. The success of eco-design requires the internal cross-
functional cooperation among the organization and the external cooperation with other
partners throughout the supply chain (Zhu & Sarkis 2006, p.474).
It has been argued that for effective product stewardship and reverse logistics practices,
eco-design (that includes design for disassembly, design for recycling, and design for
other reverse logistics practices) is important (Hoek & Erasmus 2000, pp. 28-33). One
of key aspects for eco-design is to facilitate reuse, recycle and recover through smart
design like disassembling used products, a critical design characteristic for closed-loop
supply chain management (Zhu, Sarkis & Lai 2008, p.14).

22
DFE has a number of functional sub-components. Another categorization could be the
consideration of technological and organizational sub-components. The functionality
perspective encompasses design for recyclability, remanufacturability, reuse,
disassembly, and disposal. The functionality grouping is used to compare attractiveness
and viability of various ECBP alternatives. Descriptions of these sub-components are
stated in Table 3.2 (Sarkis 1998, p.161).
Table 3.2: Descriptions of sub-components of design for environment (DfE) Descriptions
DE
SIG
NIN
G F
OR
EN
VIR
ON
ME
NT
Reusability
The amount of treatment required, where minimal treatment of a material is more closely associated with reuse of a product. The on-site or off-site use, with or without treatment, of a waste product. Focus on the overall product and less so on the components.
Recyclability
The amount of treatment required, while a material that requires a large amount of treatment is more characteristic of recycling. The capabilities of the materials that can be recycled or at least capabilities of the materials and sub-components of the product.
Remanufacturing
Design of a product with respect to repair, rework, or refurbishment of components and equipment to be held in inventory for either external sale or internal use. In a typical remanufacturing process, identical ‘cores’ (the worn-out components and equipment) are grouped into production batches, completely disassembled, and thoroughly cleaned before being reassembled.
Disassembly Designing a product that may be dismantled for recycling, remanufacturing or reuse purposes.
Disposal Consideration of materials and transportation requirements of materials that will be used in a product.
Source: Sarkis, J., 1998. Evaluating environmentally conscious business practices: Theory and Methodology. European Journal of Operational Research, 107, p.161.
3.1.2 Life Cycle Analysis (LCA) Life cycle analysis (LCA) is closely linked to DFE outputs. Life cycle analysis focuses
on the analysis of the design (Sarkis 1999, p.161). LCA appraises various characteristics
of a product’s life cycle from the preparation of its input materials to the end of its use.
With LCA of the product design could evaluate the types and quantities of product
inputs, such as energy, raw material, and water, and of product outputs, such as
atmospheric emissions, solid and waterborne wastes, and end-product (Sarkis 1998,
p.161). When addressing supply chain activities and processes, a product life cycle

23
perspective is required in order to consider all of its parts i.e., suppliers, manufacturers,
distributors and customers (Mosovsky, Dickinson & Morabito 2000, p. 231).
The LCA methodology can be used as an objective tool. LCA could identify and
evaluate opportunities to reduce the environmental impacts, which associated with a
specific product, process, or activity (Sarkis 1998). The four basic interrelated
components of an LCA include: inventory analysis, life cycle costing, impact analysis
and improvement analysis (Lin, Jones & Hsieh 2001, p.72).
Inventory analysis is the identification and quantification of energy and resource use
and the environmental effects on natural resources throughout a product’s lifetime (Lin,
Jones & Hsieh 2001, p.72). For inventory analysis the processes of acquiring inventory
data and component analysis are required (Sarkis 1998, p.162).
Life cycle costing (LCC) is a methodology in which all costs are identified for a product
throughout its lifetime. LCC should be performed before the product is manufactured.
Therefore, the changes in the design process can be performed at the end of an existing
product’s life-cycle (Sarkis 1998, p.162).
Impact analysis is the assessment of the consequences and risks related to wastes.
Impact analysis evaluates an array of alternatives and identifies the activities with
greater and lesser environmental consequences (Lin, Jones & Hsieh 2001, p.72).
Improvement analysis or environmental analysis is the evaluation and implementation
of opportunities that effect environmental improvements (Lin, Jones & Hsieh 2001,
p.72). Sarkis (1998) states that “improvement analysis systematically documents
periodic reviews of a facility’s operations, ensuring waste minimization and pollution
prevention”.
3.1.3 Total Quality Environmental Management (TQEM) Total quality environmental management is the application of total quality management
(TQM) with environmental regards. Total quality management basically deals with
quality and TQM is a management approach that aims for long-term success by
focusing on customer satisfaction (Rao et al. 1996, p.26). Thus total quality

24
environmental management refers to quality in environment and Sarkis (1998) defines
the term as follows:
“The elements of TQEM have been characterized by the Malcolm Baldrige Award criteria for a number of organizations and the environmental protection agency (EPA). These criteria are redefined for TQEM and introduced as the following sub-components, leadership, human resources development, environmental quality management systems, strategic environmental quality planning, environmental quality assurance, environmental measurements, and stakeholder emphasis” (Sarkis 1998, p.162).
3.1.4 Environmental Regulations The ISO 14000 Standard
ISO 14000 is the most popular kind of environment management system (EMS). An
environment management system is defined as a management model established on the
basis of risk analysis and developed for decreasing systematically and rationally the
damages or risks that enterprises caused in the environment (Clark 1999). ISO 14001 is
an international standard that was first published in 1999 as ISO 14000:1996 by the
International Organization for Standardization (ISO) and it was reviewed and published
again in 2004 (Sarkis 1998). Today businesses that want to bring their environment
related efforts systematical put forth determined objectives and want to take regulative
measures; they then run to establish their environment management systems and
certificate.
As an analytical model, the ISO environmental management system consists of five
principle components as shown in Figure 3.2 (Melnyk, Sroufe & Calantone 2003);
environmental policy, planning, implementation and operation, checking and corrective
action, and review and improvement (Sarkis 1998, Lin, Jones & Hsieh 2001, Melnyk,
Sroufe & Calantone 2003).

25
Source: Melnyk, S.A., Sroufe, R.P. & Calantone, R., 2003. Assessing the impact of environmental management systems on corporate and environmental performance. Journal of Operations Management, 21: p.331.
Figure 3.2: ISO 14001 and environmental management systems ISO 14000 guidance directs that the organization should identify or evaluate; the various activities, processes, products or services those are included within the
scope of the EMS, distinguishing them in such a way that they are “large enough for
meaningful examination and small enough to be sufficiently understood”.
all the environmental aspects of each of its activities, products and services,
including all those that the organization “can control and over which it can be
expected to have an influence”.
as many as possible of the actual or potential environmental impacts associated with
each aspect of its activities, either positive or negative.
the significance of each of the identified environmental impacts, using both
environmental criteria (for instance the scale, severity, probability, and duration of
the impact) and other business concerns such as regulatory or legal exposure,
difficulty and cost of changing the impact, concerns of interested parties, and public
image (Melnyk, Sroufe & Calantone 2003, p.331).
Environmental Management ISO 14000
Life Cycle Assessment
Organizational Evaluation Product and Process
Environmental Managment
Systems
Environmental Performance Evaluation
Environmental Auditing
Economic Responsibility
Legal Responsibility
Ethical
Environmental Aspects in Product
Standards

26
In the light of its significant impacts, the organization should set performance objectives
for implementing its environmental policy goals, and specific and measurable targets
and dates for achieving progress (University of North Carolina at Chapel Hill and the
Environmental Law Institute 2001, pp.9-11)
ISO 14001 forces the enterprises to implement a system about the environment. It
regulates the use of raw materials, production, process and poison waste regimes. It
enables enterprises to develop plans and strategies about this issue (Sarkis 1998). A
summary of the relevant sections and sub-sections for IS0 14001 Quality Standard is
shown in Table 3.3. Briefly ISO 14001 Standard defines the essential elements of an
effective environment management system.
Table 3.3: IS0 14001 certification sections for EMS
1. Environmental policy 2. Planning
2.1 Environmental aspects 2.2 Legal and other requirements 2.3 Objectives and targets 2.4 Environmental management program(s)
3. Implementation and operation 3.1 Structure and responsibility 3.2 Training, awareness and competence 3.3 Communication 3.4 Environmental management system documentation 3.5 Document control 3.6 Operational control 3.7 Emergency preparedness and response
4. Checking and corrective action 4.1 Monitoring and measurement 4.2 Non conformance and corrective and preventive action 4.3 Records 4.4 Environmental management system audit
5. Management review Source: Sarkis, J., 1998. Evaluating environmentally conscious business practices: Theory and Methodology. European Journal of Operational Research, 107: p.161.

27
WEEE
The Weee directive is a regulation including restricting the waste of electrical and
electronical equipments. It is one of the important directives of The Commission of
European Union, which published by 2002/96/EC number and called as “Waste of
Electronic and Electrical Equipment-WEEE” on 27 Jan 2003. It requires manufacturers
selling electrical or electronic equipment to member countries of the European Union to
be responsible for end-of-life disposal of their finished goods (Coombs 2007).
The Weee directive attempts to limit the stream of waste materials to be more
environmentally friendly. The end results are tariffs for purchasing electronic products
to help with disposal costs and encouraging electronic manufacturers for cycling
(Coombs 2007). Mainly, the directive obliges to separate collecting of electrically and
electronically equipments and to recycle them.
RoHS
The RoHS is other one important directive of The Commission of European Union,
which included restricting the use of some hazardous substances on electrical and
electronical equipment. This directive was published by 2002/95/EC number and called
as RoHS “Restriction of the Use of Certain Hazardous Substances” (Coombs 2007).
Actually the RoHS directive has a supplemental attribute for the Weee directive.
According to the RoHs Directive, though the electrically and electronically equipment
wastes collected separately, yet they entertain risks by virtue of hazardous substances in
its. The RoHS directive targets six widely used materials. The materials impacted by
RoHS legislation are; lead, mercury, cadmium, hexavalent chrome, PBB (poly-bromine
biphenyl) and PBDE (poly-bromine diphenyl etheryl) (Coombs 2007).
The RoHS Directive restricts the use of these substances, and also aims to reduce the
environmental effects of point at issue product wastes and at the same time in
supplementary manner with the Weee Directive to provide recovering and eliminating
these products for providing protection to human health and environment (Coombs
2007).

28
3.1.5 Green Supply Chain Management (GSCM) Adoption of supply chain management (SCM) practices in industries has gradually
increased since the 1980s (Borade & Bansod 2008, p.8). A number of definitions are
proposed and the concept is discussed from many perspectives. Oliver and Webber
(1982) define supply chain management as the flow of goods from supplier through
manufacturing and distribution chains to end-user. Saunders (1995) defines supply
chain management as the total chain of exchange from original source of raw material,
through the various firms involved in extracting and processing raw materials,
manufacturing, assembling, distributing and retailing to ultimate end customers.
Messelbeck and Whaley (1999) defines it as the network of suppliers, distributors, and
consumers. It also includes transportation between the suppliers and consumers, as well
as the final consumer.
Hervani, Helms and Sarkis (2005) support that supply chain management is “the
coordination and management of a complex network of activities involved in delivering
a finished product to the end-user or customer. It is a vital business function and the
process includes sourcing raw materials and parts, manufacturing and assembling
products, storage, order entry and tracking, distribution through the various channels
and finally delivery to the customer”. According to Russell (2001), SCM is the practice
of co-coordinating the flow of goods, services, information, and finances as they move
from raw material to parts supplier to manufacturer to wholesaler to retailer to
consumer.
The supply chain comprises all stakeholders of a company including the suppliers,
transporters, warehouses, retailers, and customers themselves (Darnall, Jolley &
Handfield 2008, p.7).
Resource productivity can be viewed as the efficient use of a range of inputs such as
raw materials and energy that can increase production as well as offset the costs of
reducing environmental impact. Eco-efficiency allows quantifying the balance between
value creation, environmental impact, and carrying capacity. By measuring eco-
efficiency supply chain constraints can be identified and removed. Eco-efficiency
includes; greater durability, minimum materials design and manufacturing, recovery of

29
scrap, repair, reuse and remanufacturing, recycling and down cycling (Visser et al.
2007, p.166). Resource productivity and eco-efficiency provide the necessary, practical
link between environmental performance, sustainability, and business value. Both these
can be considered drivers of market value.
On the other hand, the term “ecocentric management” is used by Shrivastava in 1995, to
mention on the importance of environmental consciousness in companies. This
management style generally focuses on the environment. The ecocentric paradigm aims
at creating sustainable economic development and improving the quality of life
worldwide for all organizational stakeholders. In Table 3.4, the key differences between
traditional and ecocentric management is given (Shrisvastava 1995a, p.127). Ecocentric
management term is commonly used as environmental management in literature.
Table 3.4: Traditional versus ecocentric management
Goals Economic growth & profits Sustainability and quality of life Shareholder wealth Stakeholder welfare
Products Designed for function, style, & price Designed for the environment Wasteful packaging Environment friendly
Organization
Hierarchical structure Nonhierarchical structure Top-down decision making Participative decision making Centralized authority Decentralized authority High-income differentials Low-income differentials
Environment
Domination over nature Harmony with nature Environment managed as a resource Resources regarded as strictly finite
Pollution and waste are externalities Pollution/waste elimination and management
Business Functions
Marketing aims at increasing Marketing for consumer education consumption
Finance aims at short-term profit Finance aims at long-term sustainable maximization growth
Accounting focuses on conventional costs
Accounting focuses on environmental costs
Human resource management aims at increasing labor productivity
Human resource management aims to make work meaningful & the workplace safe/healthy
Source: Shrivastava, P., 1995. Ecocentric Management for a Risk Society. Academy of Management Review, 20(1), p.127. Environmental management and supply chain management generates the term green
supply chain management (New & Westbrook 2004, p.242). Adding the “green”
component to supply chain management involves addressing the influence and

30
relationships of supply chain management to the natural environment. Motivated by an
environmentally-conscious mindset, it can also stem from a competitiveness motive
within organizations (Hervani, Helms & Sarkis 2005). GSCM is defined as: “Green
Supply Chain Management (GSCM) = Green Purchasing + Green Manufacturing /
Materials Management + Green Distribution / Marketing + Reverse Logistics”
(Hervani, Helms & Sarkis 2005).
Several researches made in the past showed that there is a positive relationship between
green and financial performance (Clemens 2006, p.492). Because of this, nowadays
businesses apply environmentally conscious supply chain management in their
organizations. Environmentally conscious supply chain management (ECSCM) refers to
the control exerted over all immediate and eventual environmental effects of products
and processes associated with converting raw materials into final product (Beamon
2005, p.221).
The most common green supply chain management practices involve organizations
assessing the environmental performance of their suppliers, requiring suppliers to
undertake measures (Bansal & Roth 2000, p.717). There are many benefits for firms to
apply green supply chain management, for instance the environmental quality of
products increase, products become more healthy and the amount of waste decreases.
This increases the reputation of any company in a consumers’ eye; this way a firm could
increase its selling performance. Hence, due to reduction in waste amounts, total costs
decrease in the long run (Darnall, Jolley & Handfield 2008, p.7).
Green supply chain management is a new approach that includes evaluating the
environmental issues by transforming them as beneficial tools for the organization. In
this way, managers integrate the environmental concerns as a component into their
supply chains. A company becomes green and thus increases the firm’s performance
(New & Westbrook 2004, p.241). Figure 3.3 illustrates the relationship between supply
chain, environmental management and performance.
31
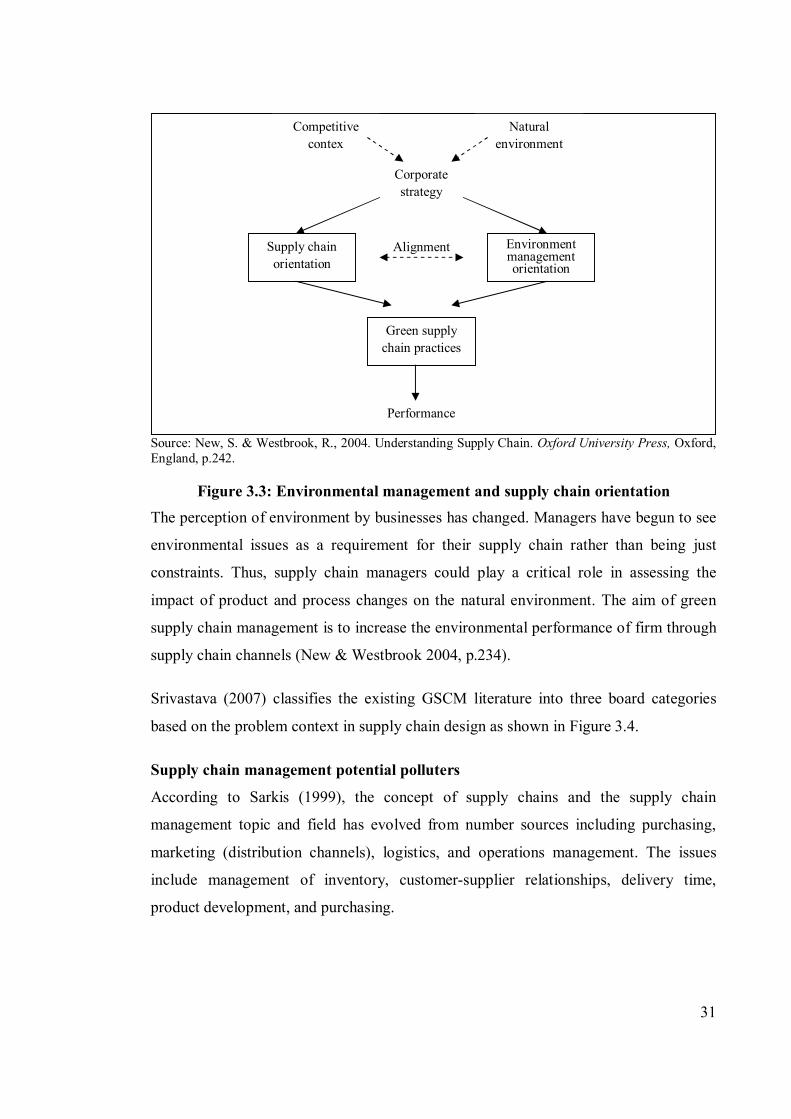
Source: New, S. & Westbrook, R., 2004. Understanding Supply Chain. Oxford University Press, Oxford, England, p.242.
Figure 3.3: Environmental management and supply chain orientation The perception of environment by businesses has changed. Managers have begun to see
environmental issues as a requirement for their supply chain rather than being just
constraints. Thus, supply chain managers could play a critical role in assessing the
impact of product and process changes on the natural environment. The aim of green
supply chain management is to increase the environmental performance of firm through
supply chain channels (New & Westbrook 2004, p.234).
Srivastava (2007) classifies the existing GSCM literature into three board categories
based on the problem context in supply chain design as shown in Figure 3.4.
Supply chain management potential polluters
According to Sarkis (1999), the concept of supply chains and the supply chain
management topic and field has evolved from number sources including purchasing,
marketing (distribution channels), logistics, and operations management. The issues
include management of inventory, customer-supplier relationships, delivery time,
product development, and purchasing.
Competitive contex
Natural environment
Corporate strategy
Supply chain orientation
Environment management orientation
Green supply chain practices
Alignment
Performance

32
Source: Srivastava, S.K., 2007. Green Supply Chain Management: A state-of-the-art literature review, International of Management Reviews, 9(1): p.55
Figure 3.4: Classification based on problem context in supply chain design

33
The operational life cycle (or value chain) of an organization means a set of
organizational elements that will influence how the supply chain is to be managed
(either internally or externally). The major elements of the operational life cycle
typically include procurement, production, distribution, reverse logistics and packaging
(Sarkis 2003, p.398). Waters (2007) demonstrates the common supply chain functions
in Figure 3.5.
Source: Waters, D., 2007. Global logistics: New directions in supply chain management, Chartered Institute of Logistics and Transport in the UK. Kogan Page Publishers, England, 5, p.212.
Figure 3.5: Common supply chain functions In the literature there are different kinds of definitions according to various case studies
and methodologies. In this dissertation, supply chain “system” members are categorized
according to the contribution to CO2 emissions to the environment. As Bloemhof-
Ruwaard et al. (1995) have argued the waste and emissions caused by the supply chain
“system” members have become the main sources of serious environmental problems
especially global warming. Therefore; logistics/distribution, reverse logistics/de-
distribution, energy production, manufacturing process and packaging are analyzed as
the biggest contributors to CO2 emission in an organization’s supply chain.
Logistics / distribution
The understanding of supply chain management has been re-conceptualized from
integrating logistics across the supply chain, and managing key business processes
Distribution / warehousing
Production / manufacturing
Purchasing / procurement
Use
Maintenance
Disposal and waste management
Reuse / Recycle

34
across the supply chain. Logistics is the part of supply chain management that plans,
implements, and controls the efficient, effective forward & reverse flow and storage of
goods, services, and related information between the point-of-origin and the point-of-
consumption in order to meet customer’s requirements (Waters 2007, p.213-217).
There are two aspects of logistics activities in a firm’s supply chain, i.e., inbound
logistics (materials management) and outbound logistics (physical distribution). The
former is concerned with products moving into a firm rather than away from it, while
the latter deals with the movement, storage and processing of order for a firm’s outputs
(Zhu et al. 2008, p.577).
Logistics is essentially a planning orientation and framework that seeks to create a
single plan for the flow of product and information through a business. Supply chain
management builds upon this framework and seeks to achieve linkage and co-ordination
between the processes of other entities in the pipeline, i.e. suppliers and customers, and
the organization itself (Mentzer et al. 2001, p.7). Logistics management is the means
whereby the needs of customers are satisfied through the co-ordination of the materials
and information flows that extend from the marketplace, through the firm and its
operations and beyond that to suppliers.
Wu and Dunn (1995) in their review of the literature found a number of areas within
standard practice of implications for greening the logistics function. The design of a
logistics network and its planning are two of the more strategic issues facing logistics
managers in this function. Many trade-off decisions need to be made with regard to the
firm's market, customer, product and logistical resources. Sarkis (1999) gives the
examples of typical logistics such as direct shipping or hub-and-spoke, central
warehouse or distributed network, intermodal or single mode, and third party services or
private fleet.
Some of the design and management criteria that support environmental planning in this
area include fewer shipments, less handling, shorter movements, more direct routes, and
better space utilization. Conversely, these issues have tradeoffs like delivery time,
responsiveness, quality and cost, as well as environmental performance (Sarkis 1999,
p16).

35
Reverse logistics / de-distribution
Broadly defined, reverse logistics includes shipments of packaging waste, recyclable
packages, and customer returns in the logistics system. Efforts that reduce reverse flows
are considered part of the reverse logistics program because they also reduce the total
amount of waste in the system (Wu & Dunn 1995, p.33).
Increased waste amounts are one of the big problems or costs of manufacturing firms.
The firms seek to find ways to reduce or eliminate the waste created during the
production stage (Melnyk, Sroufe & Calantone 2003, p.329). The innovative
approaches to reduce the amount of waste are reuse of wastes, remanufacturing or
recycle methods.
Environmental regulation of both the firm and its suppliers remains an important factor
that focuses management attention on environmental supply chain management.
Reverse logistics is defined as the materials management activities needed to perform
product recovery including the upstream movement of materials and source reduction
(New & Westbrook 2004, p.230). Several types of operations can be involved in
product recovery like seen in the Figure 3.6; recycle, reuse and remanufacture, at both
the product and component level.
Source: New, S. & Westbrook, R., 2004. Understanding Supply Chain. Oxford University Press, Oxford, England, p.231.
Figure 3.6: Reverse supply chain The reverse logistics operation is probably the least developed and studied of the
operational functions. The definition of reverse logistics according to Sarkis (2003,
p.399) is an environmental perspective primarily on the return of recyclable or reusable
products and materials into the forward supply chain. Reverse logistics has also been
studied from the perspective of returned and warranted items that may not even have
been used (Wu & Dunn 1995, p.33).
vvvvvvvvvDistribution
channel
vvvvvvvvvvvvvProduct
manufacturer
Parts/ components
suppliers
hhhhhhhhhEnd-user
Raw material supplier
Re-use ıdRemanufacture Recycle
Landfill

36
On the other hand, if the topic of reverse logistics is extended to include the
relationships between manufacturing firms and final customer in the supply chain, then
the reverse supply chain emerges and this integration means minimizing the overall
environmental impact, that is ‘ecological footprint’, of both the forward and reverse
supply chains should be termed green supply chain management (New & Westbrook
2004, p.232).
Manufacturing Process
The role of manufacturing and production processes in corporate environmental
management has been investigated in the literature for last decade. The performance of
the internal supply chain’s performance can be best managed within manufacturing
process. Florida (1996), Gupta (1995), Hanna and Newman (1995), Sarkis (1998) and
New and Westbrook (2004) have studies about environmentally conscious practices.
As mentioned before, total quality environmental management is the managerial
philosophy that includes empowerment of employees, continuous improvement, team
efforts, functional collaboration, and leadership elements (Sarkis 1998). Empowerment
(means allowing workers to attain responsibility) or employee involvement is the most
important issue when pollution prevention is the goal. Worker participation is a need
when it is about environmentally consciousness (Gupta 1995).
Remanufacturing, that includes disassembly, remanufacturing, and material recovery
principles, is also important within manufacturing process of the green supply chain.
Sarkis (1999) mentions on the awareness of environment with these words:
“The effectiveness of remanufacturing from an environmental and economic perspective is still in its infancy. Currently, in a number of industries, remanufacturing, and reverse logistics are relatively novel concepts. Since this operation is not as mature, a number of inefficiencies still exist. Certainly, to be economically feasible and environmentally benign, the systems flowing into and within the organizations operations need further development. The determination of whether the lengthening of the life of these products and materials is worth the additional efforts of energy use and waste generations have yet to be determined”(Sarkis 1999, p.13).
Closed-loop manufacturing, that means zero-emissions, is another terminology used for
environmentally conscious practices. Closed-loop manufacturing is the process of
producing products with no negative environmental impact or no effect on environment
(Hasek 1997, pp.13-16). This internal loop helps to minimize some waste streams that

37
flow from the production function, but may require additional energy and resources to
function and maintain. As part of the source-reduction philosophy closed-loop
manufacturing a related issue to the zero-emissions philosophy is substitutability, which
has become much more popular with design for the environment linkages (Sarkis 1999,
p.13).
Therefore, manufacturing processes can be the biggest contributor to CO2 emissions in
an organization’s supply chain, if the processes are not well-designed accordingly to the
protection of the environmental pollution or the workers participation is not supported
by the top level management to go green.
Packaging
Packaging is required for products to reach the market. According to Kotler (1984) there
are typically three kinds of packaging: primary, secondary, and shipping packaging.
Primary packaging contains the product itself and is the immediate and required
container. Secondary packaging is the material that protects the primary package and is
discarded when the product is about to be used. Shipping packaging refers to packaging
necessary for storage, identification, and transport. It is discarded when the product
reaches its destination (Wu & Dunn 1995, p.32). Packaging operations are usually
performed at the manufacturing site.
Packaging has been a very sensitive issue among European manufacturers and
consumers. The presence of packaging take-back laws has caused many organizations to
rethink the design of their product’s packaging as well as how to manage the packaging
delivery and logistics, once it is used. One controversy that seems to be growing in the
packaging area is whether single use packaging is more environmentally sound than
reusable packaging (Sarkis 1999, p.20).
Packaging has a strong relationship with other components of the operational life cycle.
Size, shape and materials have an impact on distribution due to their affect on the
transport characteristics of the good. Sarkis (2003) supports that “better packaging,
along with rearranged loading patterns, can reduce materials usage, increase space
utilization in the warehouse and in the trailer, and reduce the amount of handling
required”. Systems that encourage and adopt returnable packaging will require a strong

38
customer supplier relationship as well as an effective reverse logistics channel.
Efficiencies in packaging directly affect the environment. In some countries, take-back
legislation on packaging has made the packaging operation and planning a critical
environmental logistics consideration (Sarkis 2003, p.399).
Source: New, S. & Westbrook, R., 2004. Understanding Supply Chain. Oxford University Press. Oxford, England, p.244.
Figure 3.7: Aligning environmental and supply chain orientation As a conclusion, as seen in Figure 3.7 environmental and supply chain issues are
connected to each other. The capabilities across the supply chain orientation scale are
cumulative, not mutually exclusive. It’s this cumulative mature that yields a competitive
advantage and allows significant progression toward growth-scale sustainability. The
figure demonstrates that firms that have a network orientation can make use of practices
such as recycling and certification. On the other hand, if such a firm fails to develop a
proactive environmental management orientation, opportunities to achieve new
competitive advantages are being missed (New & Westbrook 2004, p.245).
Pollution prevention
(process-based reduction)
Design for the environment
Life-cycle assessment
G Remanufacture
Proactive
Reactive
Environmental orientation
Transactional Partnership supply chain orientation
Network
dReverse dlogistics
Recycle
ıssssssssssssssssCertification

39
3.2 DRIVERS AND BARRIERS TO IMPLEMENT ENVIRONMENTALLY CONSCIOUS PRACTICES
Today there are many factors for organizations that drive or hinder them to implement
environmentally friendly practices, environmental or green supply chain management
philosophy. An explorative study is conducted by Walker, Sisto and McBain (2008)
based on interviews from seven different private and public sector organizations.
Literature review identifies the main categories of internal and external drivers of green
supply chain management practices, including organizational factors, regulation,
customers, competitors, society, and suppliers. It has been indicated that; internal
barriers include cost and lack of legitimacy, whereas external barriers include
regulation, poor supplier commitment and industry specific barriers (Walker, Sisto &
McBain 2008, p.69).
In this section, literature review identifies and groups drivers and barriers to implement
environmentally conscious practices.
3.2.1 Environmental Management Drivers The literature on drivers for environmentally conscious practices is reviewed in the next
section, and grouped into internal and external drivers. Internal drivers are described
here as organizational factors, and the external drivers include regulation, customers,
competition, and society (Walker, Sisto & McBain 2008).
The motives demonstrated in Figure 3.8 suggest that firms may be ecologically
responsive to comply with legislation, to build better stakeholder relationships, to
acquire economic wealth and competitive advantage, and to maintain ecological balance
(Bansal & Roth 2008, p.718).

40
Source: Bansal, P. & Roth, K., 2000. Why Companies Go Green: A Model of Ecological Responsiveness. Academy of Management Journal 43(4): 717-736, p.718.
Figure 3.8: A preliminary model of corporate ecological responsiveness Company
Today the organizations which are aware of the benefits of environmental management
foresee proactive initiatives to develop and implement green strategies (Paulraj 2008,
p.2).
In fact internal drivers are more important than external pressures for companies. This is
because, in the course of giving decision to environmental management, there are some
determinants that affect making a decision more than external drivers including
management capability, environmental management capability, internal resources, and
organizational culture. So, for companies internal drivers become more important than
external drivers (University of North Carolina at Chapel Hill and the Environmental
Law Institute 2001, pp.7-8).
An organization’s internal drivers towards environmental management practices include
the personal commitment of leaders, middle management, policy entrepreneurs, and
investors. Organizations’ managers are able to avert negative public attention and build
stakeholder support by being responsive (Bansal & Roth 2000, p.718). Internal
organizational drivers include focusing on cost reduction through minimizing waste and
pollution, often leading to quality improvements (Walker, Sisto & McBain 2008, pp.
70-72).
Corporate Ecological Responsiveness
Stakeholder Pressures
Economic Opportunities
Ethical Motives Leadership Corporate Values
Legislation

41
The companies that implement environmentally conscious practices entirely change
their management policies, implement environmental management systems, use
ecologically sustainable resources, and reduce their energy consumptions and waste
generation, so they get cost efficiencies as well as competitive advantages in the market
(Bansal & Roth 2000, p.717).
Government policy (Regulations)
A motive of legislation refers to the desire of a firm to improve the appropriateness of
its actions within an established set of regulations, norms, values, or beliefs (Bansal &
Roth 2000, p.726). Stringent government regulations can be instrumental to the timing
and direction of many firms’ responses to environmental preservation. Several
researches show that firms adopted ecologically responsive practices to merely meet
legislative requirements and accordingly engage in only those activities that are
mandated. So, firms adopt ecologically responsive practices in their companies (Paulraj
2008, Bansal & Roth 2000).
A significant body of research indicates that government regulation and legislation is a
major driver for companies’ environmental efforts (Walker, Sisto & McBain 2008,
p.72). Government regulations can encourage the firms to implement environmental
management. Proactive efforts towards environmental regulation are more likely to be
drivers of successful green supply chain management projects. Environmental
regulations can be seen as a motivator to innovate and reduce the environmental impact
at low cost, rather than only legislation (Bowen et al. 2001, p.59).
In sum, governmental policy or external regulation and legislation appears to be a
strong driver for environmental supply chain projects, particularly if companies are
proactive and innovative in their approach (Walker, Sisto & McBain 2008, p.72).
Competition (Market)
Competitors, as potential environmental technology leaders, may be able to set industry
norms and/or legal mandates and thus clearly have the ability to drive environmental
innovation. A proactive environmental strategy can help a firm gain competitive
advantage. Environmental management improves the financial performance of a firm
(Walker, Sisto & McBain 2008, p.72).

42
Market forces are an important driver for businesses, which seek to get competitive
superiority in the market. In terms of environment, for a firm, competitiveness
constitutes the potential for ecological responsiveness to improve its long-term
profitability (University of North Carolina at Chapel Hill and the Environmental Law
Institute 2001, p.7). Firms’ ecological responses improve their competitiveness abilities
including energy and waste management, source reductions resulting in a higher output
for the same inputs (process intensification), eco-labeling and green marketing, and the
development of “eco-products”. Competitive advantage can be gained through
environmental responsibility (Bansal & Roth 2000, p.724).
In sum, external competitors can act as a driver for environmental management, for
firms seeking competitive advantage and to improve their performance (Walker, Sisto &
McBain 2008, p.72).
Customers
Customers are important drivers for environmental management. The purchasing
decision of most of the customers in the US is influenced by a company’s
environmental reputation, and customers are also willing to pay more for
environmentally - friendly products. Today consumers are more aware of environmental
issues and are demanding that the businesses take appropriate action in preserving the
environment (Paulraj 2008, p.12).
The ways in which customers drive environmental management varies significantly. For
instance customers could encourage the organizations to improve their environmental
performances. Customers exert pressure on organizations to engage environmental
management. Stakeholders have also been instrumental in inducing environmental
management to organizations (Bansal & Roth 2000, p.718). It’s known that high-profile
firms are often under considerable pressure from a range of stakeholder groups. On the
other hand the amount of pressure firms experience on environmental issues can
partially be explained by their environmental visibility.
In sum, a further external driver is the customer, influenced in turn by the end-
consumer. In reality small companies are also under particular pressure from their
customers (Walker, Sisto & McBain 2008, p.72). It is essential for the media, the

43
government organizations and the NGOs to come forward and take steps to increase
environmental awareness of customers with respect to the importance of green products
and packaging.
Society
In the field of business and management, the role of organizations in society has been
changing and their main responsibility has become to minimize impacts on the
environment (Walker, Sisto & McBain 2008, p.69).
Today people are concerned with the environment and climate change as never before.
There are many environmental issues in our world, such as global warning, ozone
depletion and industrial accidents (Paulraj 2008, pp.1-4).
The deterioration of the environment over recent decades has drastically increased the
public’s awareness of environmental issues. The public is increasingly influenced by a
company’s reputation with respect to the environment when making purchasing
decisions. They demand more environmentally friendly products and are more socially
conscious (Routroy 2009, p.20).
Public pressure and stakeholders are causing firms to review their efforts related with
the environment. On the other hand the threat of increased environmental awareness
creates an opportunity for companies to win new customers by dealing in an exemplary
way with environmental issues. Briefly external societal drivers include increasing
public awareness, consumer demand for environmentally friendly performance, and the
influence of NGOs (Walker, Sisto & McBain 2008, pp.72-73).
Suppliers
Suppliers can help to provide valuable ideas used in the implementation of
environmental projects. However, they generally do not act as a direct driving force
(Walker, Sisto & McBain 2008, p.73). Whilst suppliers may not be the drivers for
environmental management, integration and cooperation in supply chains can support
more environmentally conscious practices (Walker, Sisto & McBain 2008, p.73).
Internal environmental management is a key to improving enterprises' performance
(Melnyk, Sroufe & Calantone 2003, p.329). Customers exert pressure on their suppliers

44
for better environmental performance, which results in greater motivation for suppliers
to cooperate with customers for environmental objectives (Zhu & Sarkis 2006, p.472).
Source: Paulraj, A., 2008. Environmental Motivations: a Classification Scheme and its Impact on Environmental Strategies and Practices. Business Strategy and the Environment, John Wiley & Sons, p.3.
Figure 3.9: Environmental motivations Firms must also focus on the greenness of their supply chain activities due to their
significant influence on total environmental impact (Handfield et al. 1997, p.293).
Therefore, in order to meet the challenges of environmental wellness, it is important for
firms to select suppliers based on their advances in green products, source reduction and
packaging design. Moreover, buying firms must involve suppliers in environmental
programs to meet their environmental expectations.
In sum, supplier selection and evaluation focuses on the outcome of environmental
efforts made by the suppliers in terms of gaining certifications, being in compliance
with particular regulations or having the environment-related documentation in order
(Paulraj 2008)
3.2.2 Environmental Management Barriers In addition to identifying drivers of green supply chain management practices, the
literature review gave an opportunity to identify barriers to implement environmental
management (Walker, Sisto & McBain 2008, p.73). With the existence of particular
Internal Environmental Practices
Supplier Selection
Supplier Monitoring
External Environmental Practices
Competitiveness
Legislation
Ethical Reasons
Configurations of Environmental
Motivations
Green Practices
Entrepreneurship
Social Responsibility
Environment Commitment
Corporate Environmental Strategy

45
barriers the relative performance and success of firms may be poor (Sarkis, Mohd &
Shankar 2009, p.17).
A further observation is that some of the drivers identified can also act as barriers. For
example, regulation can help or hinder green supply chain management acting as a
catalyst for proactive firms or perceived as a limitation by others (Walker, Sisto &
McBain 2008, p.73).
In Figure 3.10, the barriers of poor design for environment interfaces are shown as a
model. Sarkis, Mohd and Shankar (2009) find out eleven barriers typically facing ECM
adoption by using the literature.
Source: Sarkis, J., Mohd, H.A., & Shankar, R., 2009. Evaluating Environmentally Conscious Manufacturing Barriers with Interpretive Structural Modeling. http://ssrn.com/abstract=956954, p.23.
Figure 3.10: Structural model of ECM barriers.
9. Poor Design for Environment
Interfaces
4. Difficulty in integrating LCA items into ECM
5. Insufficent training, education, and rewards systems
3. Resistance to organizational change
6. Difficulties with environmental technologies
8. Poor partnership (supply chain) formation and management
2. Lack of methodologies and processes to enhance ECM
11. Lack of top management support and commitment
10. Poor incorporational of environmental measures into decision making
7. Limited intra-organizational cooperation
1. Inappropriate evaluation and appraisal approaches

46
Sarkis, Mohd and Shankar (2009) generated a model of barriers that are classified into
four clusters as; ‘autonomous barriers’ that have weak driver power and dependence,
‘dependent barriers’ that have weak driver power but strong dependence, ‘linkage
barriers’ that have strong driver power, strong dependence and are unstable due to the
fact that any action on these barriers will have an effect on others and also a feedback
on themselves. The last cluster includes ‘independent barriers’ having strong driving
power but weak dependence.
The barriers simply can be grouped as internal barriers and external barriers. Internal
barriers include costs and lack of legitimacy. External barriers are regulations, poor
supplier commitment and some industry specific barriers (Walker, Sisto & McBain
2008, p.70).
Costs
The desire to reduce costs represents a common driving force for environmental
projects. Throughout a product’s life cycle, pollution reflects hidden costs in the form of
wasted resources and effort. On the other hand, environmental regulations are
motivators to innovate and reduce the environmental impact at low cost (Bowen et al.
2001, p.41).
An organization’s most important effort is reducing its costs. By intensifying production
processes, firms reduce their environmental impacts while simultaneously lowering the
costs of inputs and waste disposal (Bansal & Roth 2000, p.718). Today organizations
focus on reducing their costs through minimizing waste and pollution (Walker, Sisto &
McBain 2008, p.72). Cost reduction constitutes an important motivation for EMS
adoptions in companies. So cost factor becomes one of the important drivers for the
companies (University of North Carolina at Chapel Hill and the Environmental Law
Institute 2001, p.7).
In reality consumer desire lower priced products. This may inhibit the implementations
of environmental management. Cost concerns are the most serious obstacle for taking
environmental factors into account for companies. Also if a company gives decision to
implement environmental management, in a short term this means additional costs

47
including costs for consultants and third-party certification fees (University of North
Carolina at Chapel Hill and the Environmental Law Institute 2001, p.6).
Cost factor is even more significant for SMEs which have generally less resources
available and thus are more vulnerable. Costs can function as a barrier especially if
people act with the fixed trade-off in mind of ecology versus economy (Walker, Sisto &
McBain 2008, p.73).
Lack of Legitimacy
Some people have a much unimpassioned view about environmental issues, and there is
often a problem with management commitment. Walker, Sisto and McBain (2008)
support the idea to overcome this internal lack of legitimacy of the issue and to make
other people sympathetic to the project and environmental management philosophy.
Regulation
Environmental regulations can be seen as a motivator to innovate and reduce the
environmental impact at low cost, rather than a cause for litigation. External regulation
and legislation appears to be a strong driver for environmental management, particularly
if companies are proactive and innovative in their approach to regulatory compliance.
On the other hand, regulations can act as a barrier. For instance environmental
legislation and regulation can inhibit innovation by prescribing best available
techniques and setting unreasonable deadlines (Walker, Sisto & McBain 2008, p.74).
Poor supplier commitment
Confidentiality is a major difficulty in green supply chains. Companies are often
unwilling to exchange information on green supply for fear of exposing weaknesses or
giving other companies competitive advantage. If the firms could adopt cooperative
customer-supplier relationships, then their organizations’ abilities in managing
environmental issues will be more effectively. The firms whose environmental strategy
comprises close supply chain relations get the chance to reduce wastes and
environmental innovation (Walker, Sisto & McBain 2008, p.73).
There are some industry specific barriers which become different according to different
industries. In fact companies in different industries have differing drivers, barriers and

48
practices. As a result of Walker, Sisto and McBain’s research (2008) industry specific
barriers can affect the implementation of environmental management.
An example to industry specific barriers can be given in manufacturing industry. For at
least two decades environmentally conscious manufacturing (ECM) is the mainstay of
sustainable organizational practices in this sector (Sarkis, Mohd & Shankar 2009). But
during ECM practices in this sector firms come face to face with various barriers. This
sector has a different structure if compared with the other sectors. Also the relationships
with the other parts are complex in the sector. Creative and innovative approaches are
also very important in this sector. A central issue manufacturing organizations face is
the lack of appropriate roadmaps for ECM’s implementation and adoption (Sarkis,
Mohd & Shankar 2009).
Main barriers in this sector are lack of top management support and commitment;
resistance to organizational change; inappropriate evaluation and appraisal approaches;
lack of methodologies and processes to enhance ECM; difficulty in integrating LCA
elements into ECM; insufficient training, education, and rewards systems; poor design-
for-environment (DFE) interfaces; poor partnership (supply chain) formation and
management; poor incorporation of environmental measures into decision making;
difficulties with environmental technology; and limited intra-organizational cooperation
(Sarkis, Mohd & Shankar 2009, p.2).
3.3 USING RENEWABLE ENERGY, RESOURCES AND CLEANER TECHNOLOGIES
Energy is essential to economic and social development and improved quality of life in
all countries (Bilen et al. 2008, p.1530). The problem of massive emissions of carbon
dioxide (CO2) from the burning of fossil fuels and their climatic impact has become
major scientific and political issues. Future stabilization of the atmospheric CO2 content
requires a drastic decrease of CO2 emissions worldwide (Kaygusuz 2003, p.1671).
Today, one of the most important points is to decrease the pollution amounts in the
world by using renewable energy and resources during production of goods. In this
context the importance of solar energy, wind energy, etc. gradually increase. Renewable
resources correspond to sources that are limitless in any regard (Dincer 2000, p.157).

49
“Renewable energy technologies rely on the use of natural energy resources such as solar radiation, the winds, waves and tides, which are continually replenished and will therefore not run out” (Elliott 2000, p.261).
The need for renewable energy and its sources increase because the earth, as a resource
system, has a limited capacity for supporting a growing human population with an
intensive exchange of materials and energy with its environment (Tsoulfas & Pappis
2006, p.1593). Today renewable energy resources appear to be the one of the most
efficient and effective solutions. For instance, relative to fossil fuels, renewable energy
is an environmentally benign source of electricity (Moore & Wüstenhagen 2004, p.238).
In fact there is an intimate connection between renewable energy and sustainable
development (Dincer 2000, p.157).
“Currently, there is much enthusiasm for renewable energy systems, such as wind turbines and solar cells, which many see as the archetypal ‘sustainable technologies’, that is, technologies that can continue to be used in the future without irreparably or irreversibly damaging the eco-system” (Elliott 2000, p.261).
From a global perspective renewable energies offer many benefits: they help to reduce
CO2 emissions, thus promoting climate protection. They replace fossil fuels, therefore
reducing the economic dependency on energy imports that many nations struggle with
(Bilen et al. 2008, p.1533).
Renewable energy resources and their utilization are intimately related to sustainable
development (Dincer 2000, p.173). The increasing world population requires the
definition and successful implementation of sustainable development. There are various
essential parameters that can help in achieving a successful sustainable development in
a society. Such parameters are; public awareness, information, environmental education
and training, innovative energy strategies, promoting renewable energy resources,
financing, monitoring and evaluation tools (Dincer 2000, pp.172-173).
Cleaner production is the continuous application of an integrated preventive
environmental strategy applied to processes, products, practices and services to increase
eco-efficiency and reduce risks for humans and the environment. Cleaner technologies
extract and use natural resources more efficiently, generate products with fewer harmful
components, minimize pollutant releases to air, water and soil during manufacturing and

50
product use, and design durable goods that can be reused or recycled (Tsoulfas &
Pappis 2006, p.1595).
A substantial increase in global energy supplies will take time but cleaner technologies
will underpin a low carbon economy. A low carbon economy means increasing the
efficient production and use of fossil fuels and managing the greenhouse gases which
are generated by them (World Energy Council 2007).
As a source of production process improvements, such as cleaner technologies and
pollution control, they can change the production cost function within firms and
industries. By making products and packaging more environmental friendly,
organizations can enhance product quality and attractiveness. And by reducing waste,
pollution, and hazards these innovations or improvements can make firms more
attractive to communities (Shrivastava 1995b, p.186)
3.4 CONCEPTUAL FRAMEWORK AND HYPOTHESES DEVELOPMENT
Environmental management has been considered as a new management approach for
organizations. After the industrial revolution, the CO2 emission values have started to
increase all around the world. Industry and transportation are the significant sources for
environmental pollution (Earth Trends Country Profiles, Climate and Atmosphere
Turkey 2003).
For an organization, green/environmental operations should be a part of the corporate
culture. Improving eco efficiency, that is based on the concept of creating more goods
and services while using fewer resources and creating less waste and pollution and
resource productivity (renewable energy and resources like wind power, biodiesel, etc.)
provide the necessary, practical link between environmental performance, sustainability,
and business value.
As a part of environmentally conscious practices, recycling or reusing the waste
materials is the key point of implementation. At this point, environmental collaboration
with suppliers also have an important value because the organizations should request
suppliers to conform certain environmental regulations like ISO 14001, WEEE, RoHS,

51
etc. This way supplier involvement to environmentally conscious business practices will
impact the both the supplier and the firm. In conclusion, the company that implies
GSCM practices and be aware of the global environment gives more importance to
environmental performance than cost effectiveness.
The selection of environmentally conscious practices (ECP) to be tested in this
dissertation is based on Sarkis (1998)’s list of environmentally conscious business
practices.
The framework proposes competitiveness, customer relations, drivers and SCM
polluters which will have a positive impact on environmentally conscious practices. A
detailed description of the development of GSCM practices construct is provided in the
following paragraphs.
Using literature support, the expected relationships among environmentally conscious
practices; SCM potential polluters, environmental management drivers, competitive
environment, competitive priorities and customer relations are discussed, and
hypotheses relating these variables are developed. The conceptual framework of the
hypothesized relationships is delineated in Figure 3.11.
3.4.1 SCM Potential Polluters and Environmentally Conscious Practices In the literature, researchers define supply chain operations in various different ways
with respect to survey instruments and case studies. In this survey analysis, supply chain
“system” members are categorized according to CO2 emissions. As Bloemhof-Ruwaard
et al. (1995) have argued waste and emissions caused by the supply chain “system”
members have become the main sources of serious environmental problems especially
global warming, increase in CO2 emission levels, environmental pollution, etc.
Therefore; logistics/distribution, reverse logistics/de-distribution, energy production,
manufacturing process and packaging are analyzed as the potential factors for
environmental pollution in an organization’s supply chain.

52
Figure 3.11: Conceptual framework

53
As it is discussed in the previous literature; Wu and Dunn (1995) found that the design
of a logistics network and its planning are two of the more strategic issues facing
logistics managers in this function. Many trade-off decisions need to be made with
regard to the firm's market, customer, product and logistical resources. Environmentally
responsible logistics activities in the entire supply chain, bring awareness of
environmental issues to the transport and logistics community, and highlight some
environmentally friendly practices employed by leading edge firms (Wu & Dunn 1995,
p.21).
Sarkis (1999) gives the examples of typical logistics such as direct shipping or hub-and-
spoke, central warehouse or distributed network, intermodal or single mode, and third
party services or private fleet. Some of the design and management criteria that support
environmental planning in this area include fewer shipments, less handling, shorter
movements, more direct routes, and better space utilization. At the same time, these
issues have tradeoffs like delivery time, responsiveness, quality and cost, as well as
environmental performance (Sarkis 1999, p16).
The reverse logistics operation is the least developed and studied part of the operational
functions. The definition of reverse logistics according to Sarkis (2003, p.399) is “an
environmental perspective primarily on the return of recyclable or reusable products and
materials into the forward supply chain”. Reverse logistics has also been studied from
the perspective of returned and warranted items that may not even have been used.
The firms seek to find ways to reduce or eliminate the waste created during the
production stage (Melnyk, Sroufe & Calantone 2003, p.329). Increased waste amounts
are one of the biggest problems of production firms. Therefore, reverse logistics should
be the least important pollutant as a supply chain process.
Manufacturing processes can be the biggest contributor to CO2 emissions in an
organization’s supply chain, if the processes are not well-designed according to the
protection of the environment and prevention of pollution or if the workers’
participation is not supported by the top level management to go green. Closed-loop
manufacturing is the process of producing products with no negative environmental
impact or no effect on environment (Hasek 1997). This internal loop helps to minimize

54
some waste streams that flow from the production function, but may require additional
energy and resources to function and maintain. As part of the source-reduction
philosophy closed-loop manufacturing, a related issue to the zero-emissions philosophy
is substitutability, has become much more popular with design for the environment
linkages (Sarkis 1999, p.13).
Packaging has a strong relationship with other components of the operational life cycle.
Sarkis (2003) supports that “better packaging, along with rearranged loading patterns,
can reduce materials usage, increase space utilization in the warehouse and in the trailer,
and reduce the amount of handling required”. Efficiencies in packaging directly affect
the environment (Sarkis 2003, p.399). As a result of literature review, in an
organizations’ supply chain the packaging process does not affect the CO2 emission
besides manufacturing or logistics processes.
Besides the supply chain management practices, energy production of a company could
have an effect on environmental pollution. In today’s world, the natural resources in the
environment exist. To save the energy sources, organizations has to be more aware of
the use of energy. In other words, if an organization could produce its own energy, it
can save the global energy sources and the costs of the resources decreases. There are so
many expensive methods to apply these issues as stated before. These methods can be
efficient for the companies, but may be, bad for the global environment. Therefore,
energy production can be a contributor to CO2 emissions in the supply chain of an
organization.
As a result of literature review and previous survey research; logistics/distribution,
reverse logistics/de-distribution, energy production, manufacturing process and
packaging are analyzed as the potential factors to increase the level of CO2 emissions or
environmental pollution in an organization’s supply chain.
H1: SCM potential polluters have a positive effect on the implementation level of environmentally conscious practices.

55
3.4.2 Environmental Management Drivers and Environmentally Conscious Practices Several studies have identified drivers, pressures or motives for environmental
management, such as regulatory compliance, competitive advantage, stakeholder
pressures, ethical concerns, critical events, and top management initiative (Dillon &
Fischer 1992; Lampe, Ellis & Drummond 1991; Lawrence & Morell 1995; Vredenburg
& Westley 1993; Winn 1995). The reasons as to why companies go green are
investigated in existing literature. Bansal and Roth (2000) developed a model of the
motivations for corporate ecological responsiveness, and three basic motivations were
found as competitiveness, legitimation and environmental responsibility.
Zhu, Sarkis and Geng (2005) derive groupings of GSCM pressures, practices and
performance in the research analysis among various Chinese manufacturing
organizations. The survey question’s statistical computations show that the
environmental awareness Chinese enterprises have increased due to regulations,
competitiveness and marketing drivers.
Zhu, Sarkis and Lai (2007) supports that the pressures from different directions have
caused the Chinese automobile supply chain managers to consider and initiate
implementation of GSCM practices in China. According to the results of the survey
research, the Chinese enterprises have experienced high and increasing regulatory and
market pressures and at the same time have strong internal drivers to implement GSCM
practices (Zhu, Sarkis & Lai 2007, p.1041).
On the other hand, Walker, Sisto and McBain (2008) discusses that the main drivers for
implementing environmental management can be divided into two groups: internal and
external drivers. In this research; organization-related internal driver is mainly senior
management; whereas government policies, customers, and competition are the external
drivers for implementing environmental management philosophy. An organization’s
internal drivers towards environmentally conscious practices include the personal
commitment of individuals, senior management, ‘policy entrepreneurs’ and investors.
The goal of environmental projects is to reduce costs through minimizing waste and
pollution in regard to quality improvements (Bowen et al. 2001).

56
A significant body of research study exhibits that government policies and legislation is
a major driver for companies particularly if companies are proactive and innovative in
their approach to regulatory compliance (Bansal & Roth 2000, p.726). Regulations can
be considered as a motivator to reduce the cost and the waste. Therefore, following the
regulations for environment is a “win-win” situation for both the company and
environment. As an external driver force, the customer is the key point at purchasing
because it has been proven that customer demands have a positive impact on
environmental management (Paulraj 2008). If customers or society are not aware of the
environment, then they do not purchase the green products. Therefore, it will be
impossible to implement GSCM practices.
Several researches show that competition is also a driver for environmental
management. A proactive environmental strategy can help a firm gain competitive
advantage through the development of supply chain capabilities. In sum, competition is
an external driver for firms seeking competitive advantage and to improve their
performance (Walker, Sisto & McBain 2008, pp.72-75).
As a result of literature review, the four main drivers that should have significant
positive impact on the implementation level of environmentally conscious practices are
selected. Customers, competition, government policy and senior management of the
company are expected to be the common drivers for the companies that need to go
green.
H2: Environmental management drivers are positively associated with environmentally conscious practices.
3.4.3 Competitive Environment and Environmentally Conscious Practices In the 1950s and 1960s, minimizing unit cost was the first goal of most manufacturers.
This was accomplished using mass production methods and new product development
was slow and relied exclusively on in-house technology and capacity. However, as
competition between organizations started to rise up, modern management philosophies
such as quality management, environmentally conscious business practices, supply
chain management, customer driven corporate strategy gained more importance (Tan et
al. 1999, pp.1034-1036).

57
Supplier-buyer relationships have been changing or in other words have to change in
this competitive arena. Relationships that were once adversarial are now being
developed as strategic alliances. Manufacturers are increasingly tapping into suppliers’
technologies and expertise in product design and development, a concept commonly
known as early supplier involvement. Increasing numbers of companies also are
developing a more customer oriented focus to improve their competitive position (Tan
et al. 1999, p.1036).
A proactive environmental strategy can help a firm gain competitive advantage.
Environmental management improves the financial performance of a firm (Walker,
Sisto & McBain 2008, p.72).
Tan et al. (1999) supports that, a firm’s overall performance will be positively affected
by implementing environmental conscious practices, if the company is also concerned
with competitive environment.
H3: A firm's competitive environment is positively associated with the implementation level of environmentally conscious practices.
3.4.4 Competitive Priorities and Environmentally Conscious Practices According to Porter (1998), competitive advantage is commonly defined as a position
attained by a business unit and perceived by its customers when it is compared with its
competitors. Business units may dispose two basic strategies such as low cost or
differentiation; in order to develop competitive advantages within their competitive
environment.
Cost reduction, which may imply the offering of goods and/or services with the
lowest prices in its market.
Differentiation, which aims at offering differentiated goods and/or services
generally to niches of a market. A price policy with a greater unitary profit
margin could be practiced.
Focus, which selects one or more segments of the company’s markets and tries
to develop competitive advantages (focusing on one of the two previous
strategies).

58
Among several approaches, competitive priorities are used to describe manufacturers’
choice of manufacturing tasks or key competitive capabilities (Chen & Paulraj 2004,
p.124). Santos (2000) categorized the competitive priorities as seen in Figure 3.12 into
four groups: Cost, that means seeking a lower manufacturing cost, Flexibility, that is
mainly related to the innovation of products and services, the product mix and the
production volume, Quality which implies offering high quality products and services to
the customers and Delivery which represents the accomplishment of two basic
objectives, i.e. lower and more reliable delivery deadlines, are adopted.
Source: Santos, F.C.A., 2000. Integration of human research management and competitive priorities of manufacturing strategy. International Journal of Operations and Production Management, 20(5), p.628.
Figure 3.12: Natural alignments of competitive strategies and the competitive priorities of manufacturing strategy
Differentiation advantage can result from best practices of environmental management
that focus on product characteristics and product markets. These product focused best
practices include redesigning, packaging and products in more environmentally
responsible ways, developing new environmentally responsible products, and
advertising the environmental benefits of the products. Differentiation advantage creates
the potential to increase product prices, which results in higher revenues (Christmann
2000, p.665). The companies that are conscious about environmental management
practices should focus on differentiation business strategy. The quality performance,
innovation, customer service, delivery performances will be higher and more important
than the price or cost of the products.
Competitive Strategy
Cost Reduction Differentiation
Cost Quality Delivery Flexibility Performance
Competitive Priorities of Manufacturing Strategy
Possible arrangements of competitive priorities

59
From the generic business strategy literature, the term competitive priorities are used to
draw manufacturing function attention toward a range of market demands as seen in
Table 3.5 (Santos 2000, p.630).
Table 3.5: Market demands associated with competitive priorities Competitive Priority Main Market Demands
Cost To offer products and/or services with the lowest price Quality To offer with high performance To differentiate products from competitors To deliver appropriate technical assistance To build and improve products and company image To improve products reliability and durability Delivery Performance To manufacture products with agility To warrant reliability of delivery deadline To provide technical assistance services with replacement parts Flexibility To change products design or to launch new products quickly To offer a broad product mix To change the production volume quickly
Source: Santos, F.C.A., 2000. Integration of human research management and competitive priorities of manufacturing strategy. International Journal of Operations and Production Management, 20(5), p.630. As a result of previous literature, an organization that produces or services in the light
of competitive priorities, it is expected that the company should concern about the
environmental pollution and environmentally conscious practices. The company would
be acting coherently by including its commitment to the environment among its
differentiated based priorities and strategic objectives.
H4: Differentiation based competitive priorities are positively associated with the implementation level of environmentally conscious practices.
3.4.5 Customer Relations and Environmentally Conscious Practices A company’s customer relations practices can affect its success in implementing
environmental management. A key element of successful supply base management
involves downstream integration of customers as well as the management of upstream
suppliers. Each entity in the supply chain is a supplier as well as a customer. When a
customer driven corporate vision is implemented simultaneously with effective TQM
and supply base management practices, it can produce a competitive edge in a number
of different ways. These include increases in productivity, reductions in inventory and

60
cycle time, increased customer satisfaction, market share and profits (Tan et al. 1999,
p.1037).
On the other hand, customer relationships are greatly influenced by green marketing
policies. Many companies are putting pressure on their suppliers and suppliers are
listening to corporate customers and the end-user (Lamming & Hampson 1998).
According to Earl and Clift (1999), individual and business-to-business consumers have
similarities like behaviors, attitudes and understanding of purchasing green products,
whereas Karna and Heiskanen (1998) support that business-to-business consumer are
more aware of environmental issues. Sarkis (1999) supports that, both consumer groups
have equal levels of environmental issues with regard to purchasing green products will
affect organizational marketing practices and strategies.
Therefore, for an organization the voice of customer is important at the different levels
of management. If the company realizes and analyzes what are the customers’
complaints, needs, or wants, then the relationship will become much more reliable. On
the other hand, if the society or the customers are conscious about the environment and
prefer environmental-friendly products, then it is expected that the organizations should
be aware of environmental practices and the management should focus on green
philosophy.
H5: A customer relations focus is positively associated with the implementation level of environmentally conscious practices.

61
4. RESEARCH METHODOLOGY
4.1 QUESTIONNAIRE DEVELOPMENT
A questionnaire was used to measure the implementation level of environmentally
conscious practices. The questionnaire for this survey was carefully designed to be easy
to complete and restricted to five-point Likert scales ranging from 1 ‘strongly disagree’,
2 ‘disagree’, 3 ‘neutral’, 4 ‘agree’ and 5 ‘strongly agree’.
The survey contains six sections; (a) environmentally conscious practices in a company,
(b) the functions in the supply chain that are potential polluters, (c) items motivating
implementing environmental management, (d) competitive environment, (e)
differentiation based competitive priorities, and (f) customers relationship. To avoid
confusing respondent’s five-point scales, a brief explanation is provided at the
beginning of each section in the survey questionnaire. Detailed items for are shown in
Appendix A.3.
The preliminary questionnaire was also discussed with a number of faculty members
from Faculty of Engineering and Faculty of Economics and Administrative Sciences at
Bahcesehir University, Turkey. The general purpose of this survey was to gain a deeper
understanding of the factors that relate to the implementation of environmentally
conscious practices in Turkish companies. In the analysis part of this thesis project, the
environmental consciousness of Turkish companies and the factors that positively affect
the environmental implementations are discussed and the results are shown by using the
statistical software program SPSS 16.
4.2 DATA COLLECTION AND SAMPLING CHARACTERISTICS
This study targeted managers at middle or higher management levels. The sampling
frame for the Turkish firms was drawn from the website of TOBB (The Union of
Chambers of Commerce, Industry, Maritime Trade and Commodity Exchanges of
Turkey; http://www.tobb.org.tr), which provides an Industrial Database that contains

62
approximately 40,000 firms that are registered to any of 10 Chambers of Industry, 19
Chambers of Trade and 64 Chambers of Industry and Trade in Turkey. The names and
addresses of these companies are available from the websites of these chambers, which
are linked to the website of TOBB. Through a random sampling selection procedure, a
total of 2000 firms from different sectors, was generated and constituted the sampling
frame for the study.
The survey questionnaire was mailed to the CEO of each company with a letter
requesting that the CEO, or his/her senior executive in charge of supply chain
management within the organization, should complete it. After one reminder a total of
570 questionnaires were returned, of which 519 were usable (the remaining 51 were
excluded owing to missing data), representing an effective response rate of 25.95%,
which was satisfactory, given the confidentiality and complexity of the questionnaire.
The distributions of the respondents were 44.70% president/vice presidents and 55.3%
managers from different departments of the organizations as shown in Table 4.1. The
subgroups of the managers were distributed as; 30.66% manufacturing department,
19.51% purchasing, %18.12 supply chain, 17.42% sales, 6.97% customer relations and
7.32% marketing. ANOVA tests were used to examine the differences among means for
the respondent categories. No significant differences (p>0.1) were detected. Given the
level of responsibility of respondents, the findings provide a good reflection of senior
management’s views on supply chain management practices and firm performance.
Table 4.1: Respondent profile of the survey
Title Count Percent
President / Vice President 232 44.70%
Managers 287 55.30%
Manufacturing 88 Purchasing 56 Supply Chain 52 Sales 50 Customer Relations 20 Marketing 21

63
The responding firms were also compared across the main characteristics of the sample
such as industry type and geographical location, and again showed no systematic
differences as seen in Table 4.2 (p>0.1). The sample of 519 firms had mean number of
employees of 452. The sample is composed of relatively medium size firms given the
scale of the Turkish economy, with only 15.6% of the firms classified as small size (less
than 50 employees). The average age of sample firms is 22.21 years.
Table 4.2: Characteristics of the sample No %
Firm size (number of employees)
Small size (Less than 50) 81 15.6 Medium size (50 to 249) 280 53.9 Large size (More than 250) 158 30.5
Age (years)
Young firms (Less than 10) 84 16.2 Middle age firms (10 to 19) 181 34.9 Mature firms (More than 20) 254 48.9
Broad sector of operation Industrial, automotive and electrical equipment 58 11.2 Food, textile and paper 149 28.7 Metal, wood, leather and glass 91 17.5 Chemical and pharmaceuticals 28 5.4 Other manufacturing 45 8.7 Wholesale and retail trade 42 8.1 Computer engineering services 24 4.6 Financial services and consultancy 11 2.1 Hospital and leisure services 32 6.2 Other services 39 7.5
Geographic location Marmara 435 83.8 Aegean 34 6.6 Black Sea 16 3.1 Other 34 6.5 Total 519 100
The distribution of the sample in terms of the sector of operation is as follows:
industrial, automotive and electrical equipment, 11.2%; food, textile and paper, 28.7%;
metal, wood, leather and glass, 17.5%; chemical and pharmaceuticals, 5.4%; other

64
manufacturing, 8.7%; wholesale and retail trade, 8.1%; computer and engineering
services, 4.6%; financial services and consultancy, 2.1; hospital and leisure services,
6.2%; and other services, 7.5%. The characteristics of the sample are shown in Table
4.2.
Characteristics of the sample show that the medium sized companies have the highest
percentage with regard to small and large size organizations; whereas, most of the
Turkish companies have been in their sector for more than 20 years. According to the
sectors of the operation, the food, textile, paper and metal, wood, leather, glass sectors
have the biggest part in the analysis of the questionnaire. On the other hand, the density
of the geographic location of the companies is Marmara Region, where most of the
companies’ head departments are located.
4.3 OPERATIONALIZATION OF VARIABLES
All data used in the empirical analyses were from the administered questionnaire used
earlier by Sarkis (1998), Tan et al. (1999), Chen and Paulraj (2004), Zhu, Sarkis and
Geng (2005), Zhu, Sarkis and Lai (2007). The primary data is collected by asking the
respondent to respond to statements which will be discussed in this section. The
responses are organized on a Likert scale with five options such as “1= strongly
disagree, 2= disagree, 3= neutral, 4= agree, 5= strongly agree”.
4.3.1 Dependent Variable The environmentally conscious practices were treated as the dependent variable. The
emphasis increases on the environment by organizational stakeholders, including
governments, stockholders, customers, employees and communities (Sarkis 1998).
Based on prior literature, it is recognized that the business practices is so wide that
previous studies have taken either a subjective or an objective approach to measure the
environmental awareness.
The selection of environmentally conscious practices (ECP) to be tested in the analysis
part is based on Sarkis (1998)’s list of environmentally conscious business practices.
Industry and transportation are the significant factors for environmental pollution.
Therefore, for a company, green/environmental operations should be a part of the

65
corporate culture. Improving eco efficiency, that is based on the concept of creating
more goods and services while using fewer resources and creating less waste and
pollution, is a part of environmental culture. Resource productivity (renewable energy
and resources like wind power, biodiesel, etc.) and eco-efficiency provide the necessary,
practical link between environmental performance, sustainability, and business value.
On the other hand, as a part of green supply chain management practices recycling or
reusing the waste materials is the key point of implementation. At this point,
environmental collaboration with suppliers also have an important value because the
organizations should request suppliers to conform certain environmental regulations like
ISO 14001, WEEE, RoHS, etc. By this way supplier involvement to environmentally
conscious business practices will impact both the supplier and the firm. In conclusion,
the company that implies GSCM practices and is aware of the global environment gives
more importance to environmental performance than cost effectiveness.
The framework proposes competitiveness, customer relations, drivers and SCM
polluters will have a positive impact on environmentally conscious practices. Using
literature support, the expected relationships among environmentally conscious
practices; SCM potential polluters, environmental management drivers, competitive
environment, differentiation based competitive priorities and customer relations are
discussed, and hypotheses relating these variables are developed.
4.3.2 Independent variables SCM potential polluters (SCM_POL) were measured by an index composed of five
items. Respondents were asked to indicate on a 5 point Likert-type scale, ranging from
‘strongly disagree’ through ‘neutral’ to ‘strongly agree’, which of the supply chain
components from Logistics / Distribution, Reverse logistics / De-distribution, Energy
Production, Manufacturing Process and Packaging is the biggest factor to increase the
level of CO2 emissions. These five items in SCM potential polluters were based on
supply chain and environmental management literature. In the literature, researchers
define supply chain operations in various different ways with respect to survey
instruments and case studies. In this survey analysis, supply chain “system” members
are categorized according to the contribution to CO2 emissions to the environment. As

66
Bloemhof-Ruwaard et al. (1995) have argued waste and emissions caused by the supply
chain “system” members have become the main sources of serious environmental
problems especially global warming, increase in CO2 emission levels, environmental
pollution, etc. Therefore; an index measure composed of these five items
(Logistics/Distribution, Reverse logistics/De-distribution, Energy Production,
Manufacturing Process and Packaging) captures the organization’s implementation level
of environmentally conscious practices.
Environmental management drivers (EMD) were measured similarly, relying on a five-
point Likert scale (e.g. 1= strongly disagree, 2= Disagree, 3= Neutral, 4=Agree, 5=
strongly agree), an index composed of four items was also used to rate the
environmental management drivers – related implementation level of environmentally
conscious practices. The four main drivers that forces the companies to go green have
significant positive impacts on the implementation level of environmentally conscious
practices are given according to the previous literature review. The survey questions
investigate which drivers mostly impact on the level of environmentally conscious
practices. The survey items extend the level of the drivers that forces the companies to
go green; customers, competition, government policy and senior management of the
company.
Competitive environment (CENV) was measured by six items. Relying on a five-point
Likert scale (ranging from 1 = strongly disagree, 5 = strongly agree), the respondents
indicated the overall level of competition in the firm's primary industry for each of the
six dimensions. The competitiveness of the environment is therefore analyzed with
related to the GSCM practices. Six indicators of competitive environment were used by
the guide reference of Tan et al. (1999). These include management's perceptions of the
aggressiveness of competitors, the time and effort taken by management to analyze and
respond to the strategies and actions of competitors, and management's perceptions of
overall industry competitiveness (Tan et al. 1999, p.1039).
Competitive priorities (CPRI) were measured by an index composed of six items. The
term differentiation based competitive priorities are used to describe manufacturers’
choice of manufacturing tasks or key competitive capabilities, which are broadly

67
expressed in terms of low cost, flexibility, quality, and delivery. Hayes and
Wheelwright (1984) define competitive priorities as strategic preferences or the ways in
which an organization chooses to compete in the marketplace. Today, the list has been
enlarged by the additions of innovativeness, time, delivery speed, and delivery
reliability. These lists are closely related to the idea of generic strategies from the
business strategy literature. Therefore, extant research has noted that supply chain
strategy should not be based on cost alone, but rather on the issues of quality, flexibility,
innovation, speed, time, and dependability. This theoretical construct of competitive
priority is derived based on these initiatives (Chen & Paulraj 2004). The first two items
ask the respondents to what extent the firm’s strategy is related with the lowest price or
high quality performance. The third and fourth items quantify to what extent the firm
places greater emphasis on innovation or customer service than price. The last items are
the indication the level of delivering products with high performance and launching new
products quickly (1 = Strongly Disagree to 5 = Strongly Agree).
Customer relationship (CREL) was measured through an index, consisting of five-point
scales (1 = Strongly Disagree to 5 = Strongly Agree). Customer relationship practices
with seven elements of customer service were identified. These include the evaluation
of customer complaints and the measurement of customer satisfaction. A company's
performance on these dimensions is an indicator of whether it is aware of the
importance of customer satisfaction and of the company's dual roles as buyer and
supplier in the value chain (Tan et al. 1999, p.1039). The following questions were
asked to the respondents: (i) do they frequently evaluate the formal and informal
complaints of their customers? (ii) do they frequently interact with customers to set
reliability, responsiveness, and other standards for them? (iii) do they have frequent
follow-up with their customers for quality/service feedback? (iv) do they frequently
measure and evaluate customer satisfaction? (v) do they frequently determine future
customer expectations? (vi) do they facilitate customers’ ability to seek assistance from
them? (vii) do they share a sense of fair play with their customers? (viii) do they
periodically evaluate the importance of relationship with their customers?

68
4.3.3 Control Variables In addition to the dependent and independent variables discussed above, a set of three
variables were included in the model to control possible extraneous variation:
Firm age (AGE) was included as a control variable, since firms with more business
experience have gone through implementation of environmentally conscious practices.
We expect a positive relationship between firm age and environmentally conscious
practices.
Firm size (LN_SIZE) was also controlled for as large firms may allocate more resources
to the business and may tend to have more developed environmentally conscious
practices. Then a positive relationship may exist between firm size, and environmentally
conscious practices. Firm size was measured as the logarithm of the total number of
employees in the firm.
To control for industry variations, industry dummies were created for nine industry
categories: (1) industrial, automotive and electrical equipment (IND_ELECT); (2) food,
textile and electrical equipment (FOOD_TEXT); (3) metal, wood, leather and glass
(METAL_WOOD); (4) chemical and pharmaceuticals (CHEM_PHAR); (5) other
manufacturing (OTH_MANUF); (6) wholesale and retail trade (TRADE); (7) computer
and engineering services (COMP_ENG); (8) financial services and consultancy
(FIN_CONS); and (9) hospitality and leisure services (HOSP_LEIS).

69
5. RESULTS AND DISCUSSION
The descriptive statistics of the dependent variable (ECP) and independent variables;
supply chain management potential polluters (SCM_POL), environmental management
drivers (EMD), competitive environment (CENV), differentiation based competitive
priorities (CPRI) and customers relationship (CREL) are analyzed in this chapter. The
survey questions are given in details. All dependent and independent variables are
analyzed with respect to their descriptive statistical results. Results and relevant
discussions are provided in the following subsections.
Descriptive statistics and alpha coefficients are used to initially analyze the survey data
to assess the reliability of each scale. All of the factors have a reliability (alpha) value
above 0.70, the threshold value recommended by Nunnally (Cronbach 1951). Therefore,
calculated alpha values in excess of 0.7 can be considered to be reliable (Nunally 1978).
5.1 DESCRIPTIVE STATISTICS
5.1.1 Environmentally Conscious Practices The environmentally conscious practices item has seven questions and 509 valid
numbers of answers in total. It has been analyzed that the culture for
green/environmental operations of the organizations is the most important value. Also,
the eco-efficiency in the production process of most of the companies is another
important issue with the force on the suppliers’ environmental regulations. A research
on Chinese enterprises proves that integrating environmental considerations into
supplier selection positively affect the performance of environmental practices (Zhu,
Sarkis & Geng 2005). On the other hand, using renewable energy and resources in the
supply chain is the least important value for the organizations in this study. Reusing or
recycling waste materials, using cleaner technologies and the importance of
environmental performance rather than cost effectiveness have a fair attendance for the
organizations (Sarkis 1998).

70
Table 5.1: Descriptive statistics of environmentally conscious practices Environmentally Conscious Practices (α = 0.714) Mean S.D.
Variables Survey Questions 3.68 0.622 ECP1 There is a culture for green/environmental operations. 4.06 0.863 ECP2 We request our suppliers to conform certain environmental
regulations, e.g. ISO14001, WEEE, and RoHS. 4.05 0.991
ECP3 We place increasing emphasis on improving eco-efficiency in our production. 4.03 0.885
ECP4 We reuse/recycle waste materials. 3.73 1.091 ECP5 There is a need for exploiting cleaner technologies in your
company. 3.67 0.977
ECP6 Environmental performance is more important than cost effectiveness. 3.62 1.014
ECP7 Your company uses renewable energy and resources in the supply chain (e.g. wind power, biodiesel, etc). 2.62 1.307
Zhu, Sarkis and Geng (2005) evaluate and describe GSCM drivers, practices and
performance among Chinese manufacturing organizations by using the method of
survey analysis. Environmental Practices are divided into four groups: Internal
Environmental Management, External GSCM including green purchasing and
cooperation with customers including environmental requirements, investment recovery
and eco-design practices. According to the descriptive statistics on GSCM practices,
internal environmental management item has the highest mean value with the second
important item being eco-design. At the same time, external GSCM item has the least
mean value that also has the suppliers’ ISO14000 certification (Zhu, Sarkis & Geng
2005, p. 460).
The least important factor for the respondents is using renewable energy and resources.
The reason is mainly related to the Turkish government and policies. Therefore, most of
the respondent companies indicate that the company does not use renewable energy and
resources in their supply chain.
5.1.2 SCM Potential Polluters In an organization’ supply chain processes, logistics/distribution, reverse logistics/de-
distribution, energy production, manufacturing and packaging are all the factors that
increase the CO2 emission levels or environmental pollution (Sarkis 1999). In the
analysis part of the questionnaire it is analyzed that the companies are not aware of
which process is exactly the most important factor.

71
The overall mean of this item is equal to 3.03. Logistics or distribution is the most
important polluter for respondent companies. Reverse logistics and manufacturing
processes are placed as the second and the third. The results of the survey analysis
illustrate to us that the organizations cannot control and also measure the data of the
pollution in their processes. Each supply chain process has the average answer.
Table 5.2: Descriptive statistics of SCM potential polluters SCM Potential Polluters (α = 0.837) Mean S.D.
Variables Survey Questions 3.03 0.886 SCM_POL1 In your supply chain, logistics/distribution is the biggest
contributor to CO2 emission. 3.17 1.148
SCM_POL2 In your supply chain, reverse logistics/de-distribution is the biggest contributor to CO2 emission. 3.07 1.100
SCM_POL3 In your supply chain, manufacturing process is the biggest contributor to CO2 emission. 3.06 1.150
SCM_POL4 In your supply chain, energy production is the biggest contributor to CO2 emission. 2.98 1.135
SCM_POL5 In your supply chain, packaging is the biggest contributor to CO2 emission. 2.84 1.184
5.1.3 Environmental Management Drivers In the previous research, it has been argued that in most of the developed countries, the
government policy has great impact on environmental practices. Similarly, as a result of
the survey analysis, it has been investigated that government policy and senior
management of the company commonly drives the organizations to go green. On the
other hand, customers and competition has pressure on the implementation level of
environmental management.
Table 5.3: Descriptive statistics of environmental management drivers Environmental Management Drivers (α = 0.841) Mean S.D.
Variables Survey Questions 3.72 0.862 EMD1 Government policy drives the need to green. 3.92 0.942 EMD2 Senior management in the company drives the need to go green. 3.90 0.966 EMD3 Customers drive the need to go green. 3.53 1.154 EMD4 Competition drives the need to go green. 3.51 1.124
According to the descriptive statistics of the competition item, it is clear that
competitiveness is the least important one. This item is also supported by the
hypotheses about the competitive environment in the next sub-section.

72
5.1.4 Competitive Environment The valid number of the survey is 511 and also this part has the mean 3.97. This part
has one of the most reliable data with regards to overall. Number of competencies
required surviving in industries, the time, effort, resources and managerial attention
required to keep up with competitors and high overall competitiveness level in the
industries are the key important points. Amount of time spent analyzing major
competitors’ strategies and actions, importance of potential competitor reaction and
aggressiveness of the major competitors seen significant in the results.
Table 5.4: Descriptive statistics of competitive environment Competitive Environment (α = 0.723) Mean S.D.
Variables Survey Questions 3.97 0.593 CENV1 Number of competencies (i.e. things a firm must do well) required
surviving in this industry. 4.34 0.792
CENV2 The time, effort, resources and managerial attention required to keep up with competitors. 4.24 0.898
CENV3 Overall competitiveness of our industry is commonly high. 4.02 0.919 CENV4 Importance of potential competitor reaction or retaliation to
decisions made in our firm. 3.90 0.981
CENV5 Aggressiveness of our major competitors. 3.88 0.913 CENV6 Amount of time spent analyzing major competitors' strategies and
actions. 3.44 0.971
5.1.5 Competitive Priorities Competitive Priorities item has the highest mean value (4.29). This also proves that
concentration on the differentiation is important for Turkish market. In the descriptive
analysis of Turkish companies’ differentiation based competitive priorities, it has been
concluded that the most significant issue is delivering products with high performance
and quality rather than price.
Table 5.5: Descriptive statistics of competitive priorities Competitive Priorities (α = 0.796) Mean S.D.
Variables Survey Questions 4.17 0.607 CPRI1 Our strategy places importance on delivering products with high
performance. 4.30 0.824
CPRI2 Our strategy is based on quality performance rather than price. 4.25 0.814 CPRI3 We emphasize launching new products quickly. 4.19 0.838 CPRI4 Our strategy cannot be described as the one to offer products with
the lowest price. 4.17 0.951
CPRI5 We place greater emphasis on customer service than price. 4.13 0.854 CPRI6 We place greater emphasis on innovation than price. 4.03 0.884

73
Launching new products quickly with the lowest price is precious. However for Turkish
companies, the innovation emphasis is less valuable than all the other survey questions.
5.1.6 Customer Relations Customer relations items have the second highest mean (4.17). One of the reasons for
this result is, these survey questions were identified many times in the prior literature.
Most of the calculated means of each question are in the interval of 4.07 through 4.5.
The results show that customer relations have a significant place with in Turkish
companies. Sense of fair play, evaluation of formal and informal complaints of the
customers and the interaction with customers to set reliability, responsiveness, and
standards are the most important issues. Also, evaluation of customer relationship, aid
for customers, determination of customer expectations, satisfaction has an important
sequence. Turkish companies reflect that the least considerable issue is to follow-up the
customers for quality/service feedback.
Table 5.6: Descriptive statistics of environmentally conscious practices Customer Relations (α = 0.896) Mean S.D.
Variables Survey Questions 4.29 0.586 CREL1 We share a sense of fair play with our customers. 4.50 0.703 CREL2 We frequently interact with customers to set reliability,
responsiveness, and other standards for us. 4.34 0.759
CREL3 We periodically evaluate the importance of our relationship with our customers. 4.29 0.776
CREL4 We facilitate customers’ ability to seek assistance from us. 4.25 0.772 CREL5 We frequently determine future customer expectations. 4.21 0.783 CREL6 We frequently measure and evaluate customer satisfaction. 4.20 0.809 CREL7 We have frequent follow-up with our customers for quality/service
feedback. 4.07 0.832
5.2 HYPOTHESES TESTING
Table 5.7 shows the descriptive statistics and correlation coefficients of independent
variables in this survey study. The pair-wise correlations do not seem to present serious
multicollinearity problems for the multivariate analysis, as none of the variables have
correlation coefficients above 0.50 (Hair et al. 2006).

74
Table 5.7: Descriptive statistics and correlation coefficients of the variables
Variable name Definition Mean S.D. 1 2 3 4 5 6 7 8 9 10 11 12 13 14 15 16
1. SCM_POL SCM Potential Polluters 3.03 0.88 1.00 2. EMD Environmental Management Drivers 3.72 0.86 0.29* 1.00 3. CENV Competitive Environment 3.97 0.59 0.16 0.35* 1.00 4. CPRI Competitive priorities 4.18 0.61 0.07 0.30* 0.39* 1.00 5. CREL Customer relations 4.29 0.59 -0.01 0.35* 0.39* 0.48* 1.00 6. LN_SIZE Logarithm of firm size 5.08 1.24 -0.08 0.08 -0.04 -0.06 -0.02 1.00 7. AGE Firm age 22.2 17.11 -0.09 0.02 0.05 -0.07 0.02 0.29* 1.00 8. IND_ELECT Industrial, automotive and electrical equip. 0.11 0.31 -0.10 -0.09 -0.03 -0.04 -0.03 0.05 0.10 1.00 9. FOOD_TEXT Food, textile and paper 0.29 0.45 0.02 0.03 0.02 0.00 0.01 0.07 -0.07 -0.23* 1.00 10. METAL_WOOD Metal, wood, leather and glass 0.18 0.38 0.04 -0.01 -0.01 -0.05 -0.01 -0.02 0.06 -0.16 -0.29* 1.00 11. CHEM_PHAR Chemical and pharmaceuticals 0.05 0.22 0.07 0.05 0.02 0.06 0.04 -0.06 -0.05 -0.09 -0.15 -0.11 1.00 12. OTH_MANUF Other manufacturing 0.09 0.28 -0.07 0.07 -0.04 0.01 -0.05 0.06 0.01 -0.11 -0.20* -0.14 -0.07 1.00 13. TRADE Wholesale and retail trade 0.08 0.27 0.02 -0.04 0.04 -0.02 -0.01 -0.05 0.02 -0.11 -0.18 -0.14 -0.07 -0.09 1.00 14. COMP_ENG Computer and engineering services 0.05 0.21 -0.03 -0.02 0.03 0.04 0.02 -0.03 0.00 -0.08 -0.14 -0.10 -0.05 -0.07 -0.07 1.00 15. FIN_CONS Financial services and consultancy 0.02 0.14 -0.01 -0.04 0.03 0.03 0.06 -0.02 0.02 -0.05 -0.09 -0.07 -0.04 -0.05 -0.04 -0.03 1.00 16. HOSP_LEIS Hospitality and leisure services 0.06 0.24 0.07 0.01 0.03 0.05 -0.02 -0.03 -0.08 -0.09 -0.16 -0.12 -0.06 -0.08 -0.07 -0.06 -0.04 1.00
*p <0.001 (two-tailed test) N = 519

75
In order to test the study’s hypotheses, a series of regression models were estimated
with the dependent variable of the environmentally conscious practices (ECP). The
effects of independent variables on the dependent variable of ECP are shown in Table
5.8 respectively. A set of seven models were tested for the dependent variable. As the
first step, the control variables were entered (Model 1 in Table 5.8). Of these variables,
the firm size (LN_SIZE) does not have a significant effect on environmentally
conscious practices all seven models in Table 5.8 (p<0.01). While the firm age (AGE)
had no significant effect on any of the implementation level of environmentally
conscious practices, the industrial dummies had only modest effects.
The individual effects of the hypothesized variables were then tested in Models 2 to 6,
and all independent variables along with control variables were tested in Model 7, as
shown in Table 5.8, respectively. The F statistics indicate that all models in Table 5.8
are significant (p<0.01) and hence are useful for explanation purposes.
5.2.1 Regression Analysis Analyzing the regression results in Table 5.8, Hypothesis 1, stating, ‘SCM potential
polluters have a positive effect on the implementation level of environmentally
conscious practices’ is supported. The effects of supply chain management potential
polluters (SCM_POL) on environmentally conscious practices are shown in Models 2
and 7 (Table 5.8). Strong support was noted for this item as the coefficients of
SCM_POL are positive and significant in Model 2 (p<0.001) and Model 7 (p<0.001) in
Table 5.8, respectively. These findings reveal that, these SCM processes have a strong
support on the implementation level of the environmental practices. Thus, it would
appear that a greater emphasis on SCM potential polluters will improve environmental
consciousness and the practices will be more focused on the prevention of
environmental pollution. This reflects Sarkis’ (1999) view that the functions could be
drivers or factors to implement environmental management within green supply chain;
include purchasing and in-bound logistics, production, distribution and out-bound
logistics, and reverse logistics.

76
Table 5.8: Regression results on the extent of the level of environmentally conscious practices
Variable name Definition Model 1 Model 2 Model 3 Model 4 Model 5 Model 6 Model 7
Predictor variables
SCM_POL (H1) SCM Potential Polluters 0.32*** 0.23*** EMD (H2) Environmental Management Drivers 0.42*** 0.26***
CENV (H3) Competitive Environment 0.17** 0.14* CPRI (H4) Competitive priorities 0.41*** 0.20***
CREL (H5) Customer relations 0.40*** 0.16***
Control variables
LN_SIZE Logarithm of firm size 0.01 0.02 -0.01 0.02 0.02 0.01 0.01
AGE Firm age 0.01 0.01 0.01 0.00 0.01 0.00 0.01 IND_ELECT Industrial, automotive and electrical equipment -0.28* -0.22 -0.14 -0.32* -0.28* -0.25* -0.15
FOOD_TEXT Food, textile and paper -0.14 -0.15 -0.13 -0.21 -0.17 -0.14 -0.16 METAL_WOOD Metal, wood, leather and glass -0.17 -0.22 -0.14 -0.22 -0.17 -0.16 -0.17
CHEM_PHAR Chemical and pharmaceuticals -0.04 -0.13 -0.10 -0.11 -0.12 -0.08 -0.20 OTH_MANUF Other manufacturing -0.24 -0.20 -0.31* -0.27* -0.29* -0.21 -0.27*
TRADE Wholesale and retail trade -0.26 -0.29* -0.19 -0.33* -0.26 -0.23 -0.24* COMP_ENG Computer and engineering services -0.10 -0.08 -0.05 -0.19 -0.15 -0.10 -0.08
FIN_CONS Financial services and consultancy -0.26 -0.23 -0.16 -0.43* -0.34 -0.35 -0.35 HOSP_LEIS Hospitality and leisure services 0.01 -0.09 0.02 -0.07 -0.05 0.06 -0.08
Intercept 3.77*** 2.76*** 2.30*** 2.33*** 2.02*** 2.01*** 0.46*
F statistic 0.97 11.14*** 23.14*** 6.95*** 8.93*** 8.32*** 31.52*** R-square 0.02 0.22 0.36 0.15 0.18 0.17 0.52
Adjusted R-square 0.01 0.20 0.35 0.13 0.16 0.15 0.50
Notes: *p <0.05; **p <0.01; ***p <0.001 (two-tailed test) N = 519

77
Hypothesis 2, stating, ‘Environmental management drivers are positively associated
with environmentally conscious practices’ is also supported. The coefficients of the
environmental management drivers (EMD) in Model 3 (p<0.001) and Model 7
(p<0.001) in Table 5.8 are positive and significant indicating that there exists strong
support for ECP. These findings prove that the implementation level of environmentally
conscious practices is strongly supported by customers, government policies, senior
management and competition. In the previous literature is has been seen that this
hypothesis is also supported by many of the research studies. Zhu et al. (2008) indicates
that internal environmental management is one of the most important GSCM practices
organizations must adopt to improve environmental performance. Another survey
results shows that the Chinese automobile supply chain enterprises has experienced high
and increasing regulatory and market pressures and also have strong interval drivers for
GSCM practice adoption (Zhu, Sarkis & Lai 2007, p.1041). Whereas another article
supports that governmental environmental regulation has the highest mean value with
respect to supply chain, cost related and marketing pressure (Zhu, Sarkis & Geng 2005).
Yu and Bell (2007) that, support according to the survey findings of Chinese enterprises
governments have to extent produced a positive effect on the level of awareness of
business managers concerning the risk of pollution and the opportunity to incorporate
environmental design more effectively into their businesses.
Hypothesis 3, stating, ‘A firm's competitive environment is positively associated with the
implementation level of environmentally conscious practices’ is accepted. Some support
was also found for competitive environment (CENV). The coefficients in Model 4
(p<0.01) and Model 7 (p<0.05) is not significant providing some partial support for
ECP. At a certain level, this finding is not surprising. Most of the medium-sized Turkish
Companies is not aware of the competition in the market. Competition is commonly
seen for economical benefits or profit. Turkish companies try to establish their
economies without considering the environment, as environmental consciousness is
seen as a huge cost. Firms adopt environmentally responsive activities to remain
competitive (Clark 1999). In the literature review, it is seen that firms are more likely to
mimic the environmentally responsive behavior of their competitors who are successful
(DiMaggio & Powell 1983; Guler et al. 2002). The firms that are motivated by
competitiveness believe that their ecological responsiveness can lead the competitive

78
advantage sustainability, thereby increasing profits in the long term (Paulraj 2008, p.2).
By streamlining production processes, such firms simultaneously reduce their
environmental impacts and cost of inputs and waste disposal (Cordano 1993).
Moreover, adoption of ecological responses also helps them to build corporate
reputation and create value (Hart 1995), thereby distinguishing themselves from their
competition (Sharma & Vredenburg, 1998).
Hypothesis 4, stating, ‘Differentiation based competitive priorities are positively
associated with the implementation level of environmentally conscious practices’ is also
supported. Strong support was also found for differentiation based competitive priorities
(CPRI) as seen in Model 5 and Model 7. The significant impact on the implementation
level of environmentally conscious practices was seen by the coefficients of competitive
priorities in Model 5 (p<0.001) and Model 7 (p<0.001). Focus on the differentiation
business strategy gives rise to being conscious on the environmental friendly practices.
The quality performance, innovation, customer service, delivery performances will be
higher and more important than the price or cost of the products. Chen and Paulraj
(2004) support that supply chain strategy should not be based only on cost, but rather on
the issues of quality, flexibility, innovation, speed, time, and dependability. This
theoretical construct of competitive priority is derived based on these initiatives.
Therefore, concentration on differentiation based competitive priorities strongly
associated with the implementation level of environmentally conscious practices.
Hypothesis 5, stating, ‘A customer relations focus is positively associated with the
implementation level of environmentally conscious practices’ is also supported. The
effects of the focus on customer relations (CREL) on the environmentally conscious
practices are shown in Model 6 (p<0.001) and Model 7 (p<0.001). ECP is strongly
supported in that the coefficients of CREL are significant indicating that there is a
relationship between customer relations and environmentally practices. Customers or
society’s awareness on the environment affects the organizations’ processes. The result
is consistent with the environmental management drivers. Customers are one of the
important drivers that force the company to go green. Therefore, a strong positive effect
of customer relations is accurate with the environmental management drivers.
According to Li et al. (2006) customer relationship means the entire array of practices

79
that are employed for the purpose of managing customer complaints, building long-term
relationships with customers, and improving customer satisfaction. Noble (1997) and
Tan et al. (1998) support that customer relationship management is an important issue
for supply chain management practices. Close customer relationship allows an
organization to differentiate its products from competitors, sustain customer loyalty, and
dramatically extend the value it provides to its customers (Li et al. 2006, p.110).

80
6. CONCLUSION
As a conclusion part of this research; summary of findings, implications for managers
and government, also the limitations of this research are discussed and future research
studies are suggested.
6.1 SUMMARY OF FINDINGS
As a result of survey analysis of Turkish companies, it is proven that the survey items
are positively associated with the implementation level of the environmentally
conscious practices. Table 6.1 respects the support level of Turkish companies
hypotheses constructed according to the literature.
Table 6.1: Summary of findings Hypotheses Definition Level of Support
H1 SCM potential polluters have a positive effect on the implementation level of ECP.
Strong Support
H2 Environmental management drivers are positively associated with ECP.
Strong Support
H3 A firm's competitive environment is positively associated with the implementation level of ECP.
Partial Support
H4 Competitive priorities are positively associated with the implementation level of ECP.
Strong Support
H5 A customer relations focus is positively associated with the implementation level of ECP.
Strong Support
The summary of findings proves that Turkish companies do not give high importance to
competitive environment. On the contrary, the literature review supports that most of
the firms adopt environmentally responsive activities to remain competitive (Clark,
1999). It has been analyzed that firms are more likely to mimic the environmentally
responsive behavior of their competitors who are successful (DiMaggio & Powell,
1983; Guler et al., 2002). The firms that are motivated by competitiveness believe that

81
their ecological responsiveness can lead the competitive advantage sustainability,
thereby increasing profits in the long term (Paulraj 2008, p.2).
Supply chain processes in an organization; logistics/distribution, reverse logistics/de-
distribution, energy production, manufacturing and packaging describe all the factors
that increase the CO2 emission levels or environmental pollution (Sarkis 1999).
Therefore, companies should increase the level of awareness on these processes, to
perform better for the environment.
Environmental drivers have the highest impact on the implementation level of
environmentally conscious practices in Turkish companies. Zhu et al. (2008) indicates
that internal environmental management is one of the most important GSCM practices
organizations must adopt to improve environmental performance. Governmental
regulation is the significant driver for most Turkish companies; this result has parallel
results with the research in Chinese Enterprises. The research supports that
governmental environmental regulations as a driver have the highest mean value in
comparison with other drivers; suppliers’, cost and marketing’ pressure (Zhu, Sarkis &
Geng 2005).
Yu and Bell (2007) also support the same results according to the survey findings of
Chinese enterprises. Governments have to some extent produced a positive effect on
raising the awareness of business managers concerning the risk of pollution and the
opportunity to incorporate environmental design more effectively into their businesses.
Since China is an emerging country like Turkey, the results are consistent with the
economical and industrial background.
For Turkish companies in this survey analysis, competitive priorities have great impact
on the environmentally conscious practices. Focus on the differentiation business
strategy gives rise to be conscious on the environmentally practices. The quality
performance, innovation, customer service, delivery performances are more important
than the price or cost of the products. Chen and Paulraj (2004) support that supply chain
strategy should not be based only on cost, but rather on the issues of quality, flexibility,
innovation, speed, time, and dependability. Therefore, concentration of Turkish

82
Companies on competitive priorities is strongly associated with the implementation
level of environmentally conscious practices.
The survey findings show that customer relations have a significant place within
Turkish companies. Customer relationship practices with seven elements of customer
service were identified. These include the evaluation of customer complaints and the
measurement of customer satisfaction. A company's performance on these dimensions is
an indicator of whether it is aware of the importance of customer satisfaction and of the
company's dual roles as buyer and supplier in the value chain (Tan et al. 1999, p.1039).
Turkish companies reflect that the least considerable issue is to follow-up the customers
for quality/service feedback. Customers designate the demand variations and the society
becomes more conscious about environmental pollution rates. The demand will
differentiate according to the environmental-friendly products. Therefore, companies
have to change the management strategies with respect to environmental consciousness.
6.2 IMPLICATIONS
Even though some implications have been identified in the presentation of results in the
previous sections, additional implications from both managerial and theoretical
perspectives are built on. Both companies and government have responsibilities to
protect the environment.
The present study validates the environmentally conscious practices (ECP) that has
generally been a new concept for companies. Although some organizations have
realized the importance of implementing environmentally conscious practices, they
often do not know exactly what to implement, due to a lack of understanding of what
constitutes a comprehensive set of ECP.
Environmentally conscious practices, green supply chain management, environmental
management systems or namely green approaches are seen as cost related issues.
However, it is proven that in the long term, for the company, society and especially for
the environment, there are various benefits and profits. Therefore, as a management
philosophy related to the corporate social responsibility concept, the company should
act considering the environmental pollution and natural resources.

83
As today’s competition is moving from “among organizations” to “between supply
chains”, more organizations are increasingly adopting GSCM practices to increase their
corporate image. On the other hand, policy implications are valuable and feasible for
Turkish companies. The government should support the companies to go green with
legal regulations and incitements. The developed countries should be a model for these
implementations.
6.3 LIMITATIONS AND FUTURE RESEARCH
Environmental management has become an emerging issue for organizations to improve
environmental image and gain economic profit. Turkish companies have initiated
environmentally conscious practices. Though the adaption level is still immature, the
positive relationships are significant.
Recently, Turkish enterprises have increased their environmental awareness due to
regulatory, competitive, and marketing drivers. Most of the Turkish companies have
experienced increasing environmental drivers to implement ECP, whereas
organization’s management needs to be aware of these additional pressures. Supply
chain management functions are potential polluters, and most of the companies are
conscious about this problem. The awareness level of customer relations and
competitive priorities are positively associated with the implementation level of ECP. In
contrast to previous literature, competition or competitive environment does not
strongly affect the environmental consciousness.
In arriving at these overall results, we must mention the limitations of this study. First,
the sample is based on Turkish companies. These enterprises are only recently adopting
many of the environmentally conscious practices and have very different characteristics
compared to firms in other countries. Yet, even with the definitions and education on
environmental management concepts and also the education level in Turkey, it may still
be possible that some respondents may not fully realize the principles. This study does
not examine relationships between the implementation level of environmentally
conscious practices and firm performance. Further analyses are needed to examine the
performance and other company characteristics will be needed to help tease out
additional information on industry practices and differences. Other aspects such as

84
general operational performance and possible strategic financial and organizational
performance could be investigated. Additional moderators like types of enterprises
(FDI, joint ventures) could be studied as a new topic.
By using AMOS or LISREL statistical application tools, it is possible to make a factor
analysis to improve the model. As an example, the research can examine the
relationships between a firm's competitive environment, total quality management,
supply chain management, customer relation practices, and firm performance (Fynes,
Voss & Búrca 2005). Another empirical research presents details of a survey carried out
to determine whether particular quality management, supply base management, and
customer relations practices can impact corporate performance. In addition to that it
analyzes the impact of competitive environment on performance (Tan et al. 1999).
Expletory, confirmatory and SEM (Structural Equation Model) analysis can be applied
to examine the casual ordering in the research model by using data collected from
Turkish companies. Structural equation models (SEMs) describe relationships between
variables. They are similar to combining multiple regression and factor analysis. SEMs
also offer some important, additional benefits over these techniques including an
effective way to deal with multicollinearity, and methods for taking into account the
reliability of consumer response data.
On the other hand, a new questionnaire can be generated that focuses also on the
performance dimension. This survey has to be implemented after 2012, since new
ecological sanctions will be available in the following years. The Kyoto Protocol is one
of the newest ones that strengthens the international response to climate change and
legally binds emission targets for developed countries. Turkey had announced in June
its intention to sign the accord in late August 2009. Signing the Kyoto Protocol does not
put an additional burden on Turkey until 2012. Therefore, after the Kyoto Protocol, the
CO2 emissions should be under the level of 5%.
For a future research, the data after 2012 is more important to compare the
environmental consciousness’ level of companies in Turkey. A new questionnaire
should be developed in the light of the literature. As a conclusion, a survey analysis

85
after 2012 will show the improvement level of being conscious on environmental
resources and pollution, in Turkish Companies.

86
BIBLIOGRAPHY
Books
Burke, E.M., 1999. Corporate Community Relations: The Principle of Neighbor Choice, Praeger Publishers, Boston, MA.
Coombs, C., 2007. Printed Circuits Handbook. New York: McGraw-Hill.
Dinçer, M., 1997. Çevre Gönüllü Kuruluşları. Türkiye Çevre Vakfı
Eren, E., 1990. İşletmelerde Stratejik Planlama ve Yönetim. Istanbul: Istanbul University School of Business Administration Publications.
Hair, J.F., Black, W.C., Babin, B.J., Anderson, R.E., & Tatham, R.L., 2006. Multivariate Data Analysis. 6th Ed., Upper Saddle River, New Jersey, Pearson.
Hayes, R. H. & S. C., 1984. Wheelwright, Restoring our Competitive Edge: Competing through Manufacturing, Wiley, New York.
Kotler, P., Marketing Management: Analysis, Planning and Control, 5th ed., Prentice-Hall, Englewood Cliffs, NJ, 1984, p. 490.
Kotler, P. & Lee, N., 2008. Kurumsal Sosyal Sorumluluk. Istanbul: MediaCat Publications.
New, S. & Westbrook, R., 2004. Understanding Supply Chain. Oxford, England: Oxford University Press.
Nunally, J.C., Psychometric Theory, 1978. McGraw Hill: New York.
Özgen, E., 2006. Kurumsal Sosyal Sorumluluk Projeleri. Istanbul: Mavi Ağaç Culture Art Publishing.
Porter, M., 1998. On Competition. Harvard University Press, Boston, MA.
Rao, A., Carr, L. P., Dambolena, I., Kopp, R. J., Martin, J., Rafii, F. & Schlesinger, P. F., 1996. Total Quality Management: A Cross Functional Perspective. New York: John Wiley & Sons.
T.C. Çevre Bakanlığı, 1991. 2000’li Yıllara Doğru Çevre Sorunlar-Politikalar-Gelişmeler-Öneriler. Ankara: TR. Ministry of Environment Publications.
Visser, W., Matten, D., Pohl, M. & Tolhurst, N. (2007) The A to Z of Corporate Social
Responsibility, Wiley, London

87
Articles
Alemagi, D., Oben, P. M. & Ertel, J., 2006. Implementing Environmental Management Systems in Industries along the Atlantic Coast of Cameroon: Drivers, Benefits and Barriers. Corporate Social Responsibility and Environmental Management Corp. Soc. Responsib. Environ. Mgmt., 13: pp.221-232.
Ball, J.,2006. Digging Deep: As Exxon Pursue African Oil, Charity Becomes Political,
The Wall Street Journal. Bansal, P., & Roth, K., 2000. Why Companies Go Green: A Model of Ecological
Responsiveness. Academy of Management Journal, 43(4): pp.717-736. Beamon, B.M., 2005. Environmental and Sustainability Ethics in Supply Chain
Management. Science and Engineering Ethics, 11(2): pp.221-234. Berry, B.A. & Rondinelli, D.A., 1998. Proactive Corporate Environmental
Management: A New Industrial Revolution. The Academy of Management Executive, 12(2): pp. 38-50.
Bilen, K., Ozyurt, O., Bakırcı, K., Karslı, S. Erdoğan, S., Yılmaz, M. & Comaklı, O.,
2008. Energy production, consumption, and environmental pollution for sustainable development: A case study in Turkey. Renewable and Sustainable Energy Reviews, 12: pp. 1529–1561
Bloemhuf-Ruwaard, J.M., Van Beck, P., Hordijk, L. & Van Wassenhove, L.N., 1995.
Interactions between operational and environmental management. European Journal of Operational Research, 85(2): pp.229-243.
Borade, A.B. & Bansod, S.V., 2008. The Discipline of Supply Chain Management: A
Systematic Literature Review. The Icfai Journal of Supply Chain Management, V(1): pp.8-26.
Bowen, F., 2007. Corporate Social Strategy: Competing Views from Two Theories of
the Firm. Journal of Business Ethics, 75: pp.97-113. Bowen, F., Cousins, P., Lamming, R. & Faruk, A., 2001. Horses for courses: explaining
the gap between the theory and practice of green supply. Greener Management International, 35: pp. 41-60.
Brown, D.K, 2000. International Trade and Core Labour Standards: A Survey of the
Recent Literature. OECD Labour Market and Social Policy Occasional Papers, 43.
Brown, K.A., Willis, P.G. & Prussia, G.E., 2000. Predicting safe employee behavior in
the steel industry: Development and test of a sociotechnical model. Journal of Operations Management, 18: pp.445-465.
Carroll, A., 1991. The Pyramid Of Corporate Social Responsibility: Toward the Moral Management of Organizational Stakeholders. Business Horizons, 34: pp.39-48.

88
Carter, C.R. & Jennings, M.M., 2002. Social responsibility and supply chain
relationships. Transportation Research Part E, 38: pp.37-52, Elsevier Science Ltd.
Carter, C.R. & Ellram, L.M, 1998. Reversed logistics: a review of the literature and
framework for future investigation, Journal of Business Logistics, 19(1): pp.85-102.
Chen, I.J. & Paulraj, A., 2004. Towards a theory of supply chain management: the
constructs and measurements, Journal of Operations Management, 22(2): pp.119-150.
Christmann, P., 2000. Effect of ‘best practices’ of environmental management on cost
advantage: The role of complementary assets. Academy of Management Journal, 43(4): pp.663–680.
Clark, D., 1999. What drives companies to seek ISO14000 certification?. Pollution
Engineering Summer: pp.14-18. Clarkson, M.B.E., 1995. A Stakeholder Framework for Analyzing and Evaluating
Corporate Social Performance. The Academy of Management Review, 20(1): pp. 92-117.
Clemens, B., 2006. Economic incentives and small firms: Does it pay to be green?.
Journal of Business Research, 59: pp.492-500. Cordano, M., 1993. Making the natural connection: justifying investment in
environmental innovation. Proceedings of the International Association for Business and Society, pp.530-537.
Croom, S., Romano, P. & Giannakis, M., 2000. Supply chain management: an analytical
framework for critical literature review, European Journal of Purchasing and Supply Chain Management, 6: pp.67-83.
Darnall, N., Jolley, G. J. & Handfield, R., 2008. Environmental Management Systems
and Green Supply Chain Management: Complements for Sustainability?. Business Strategy and the Environment, 17(1): pp.30-45.
Darnall, N. Seol, I. & Sarkis, J., 2008. Perceived Stakeholder Influences and
Organizations’ Use of Environmental Audits. Accounting, Organizations and Society, pp.0-42.
DiMaggio, PJ. & Powell, WW., 1983. The iron cage revisited: institutional isomorphism
and collective rationality in organizational fields. American Sociological Review, 48: pp.147-160.
Dinçer, İ., 2000. Renewable energy and sustainable development: a crucial review. Renewable and Sustainable Energy Reviews, 4: pp.157-175.

89
Doane, D., 2005. Beyond corporate social responsibility: minnows, mammoths and
markets. Futures, 37: pp.215-229. Earl, G., and R. Clift. 1999. “Environmental Performance: What is it worth?” in
Greener Marketing: A Global Perspective on Greening Marketing Practice, edited by M. Charter and M.J. Polonsky, Sheffield, England: Greenleaf Publishing: pp.255-274.
Elliot, D., 2000. Renewable energy and sustainable futures. Futures, 32: pp.261-278. Fischer, C., & Newell, R., 2005. Environmental and Technology Policies for Climate
Mitigation, working paper. Washington: Resources for the Future: pp.1-42. Florida, R., 1996. Lean and green: the move to environmentally conscious
manufacturing. California Management Review, 39(1): pp.80-105. Fynes, B., Voss, C. & Búrca, S., 2005. The Impact of Supply Chain Relationship
Dynamics on Manufacturing Performance. International Journal of Operations and Production Management, 25(1): pp. 6-19.
Guler I., Guillen M.F. & MacPherson J.M., 2002. Global competition, institutions, and the diffusion of organizational practices: the international spread of the ISO 9000 quality certificates. Administrative Science Quarterly, 47: pp.507-531.
Gupta, M., 1995. Environmental management and its impact on the operations function.
International Journal of Operations and Production Management, 15(8): pp.34-51.
Hahn, T. & Scheermesser, M., 2006. Approaches to Corporate Sustainability among
German Companies. Corporate Social Responsibility and Environmental Management Corp. Soc. Responsib. Environ. Mgmt., 13: pp.150-165.
Handfield, R.B., Walton, S.V., Seegers, L.K. & Melnyk, S.A., 1997. Green value chain
practices in the furniture industry. Journal of Operations Management, 15: pp.293-315.
Hanna, M.D., & Newman, W.R., 1995. Operations and the environment: An expanded
focus for TQM. International Journal of Quality and Reliability Management, 12(6): pp.38-53.
Hart, S., 1995. A natural-resource-based view of the firm. Academy of Management
Review, 20(4): pp.986-1014. Hasek, G., 1997. Closing the loop: Companies use innovative methods to reduce waste.
Industry Week, 246(8): pp.13-16.

90
Hervani, A.A., Helms, M.M. & Sarkis, J., 2005. Performance measurement for green supply chain management. Benchmarking: An International Journal, 12(4): pp. 330-353.
Hoek, V.R. and Erasmus, I., 2000. From reversed logistics to green supply chains.
Logistics Solutions Issue, 2: pp.28-33. Jamali, D., 2008. A Stakeholder Approach to Corporate Social Responsibility: A Fresh
Perspective into Theory and Practice. Journal of Business Ethics, 82: pp.213-231. Kaygusuz, K., 2003. Energy policy and climate change in Turkey, Energy Conversion
and Management, 44: pp.1671–1688. Karna, A. & Heiskanen, E., 1998. The challenge of ‘product chain’ thinking for product
development and design: The example of electrical and electronic products. Journal of Sustainable Product Design, 4(1): pp.26-36.
Karp, T., 2003. Socially responsible leadership. Foresight, 5(2): pp. 15-23. Kovács, G., 2008. Corporate environmental responsibility in the supply chain. Journal
of Cleaner Production, xxx: pp.1-8. Lamming, R., & Hampson, J., 1996. The environment as a supply chain management
issue. British Journal of Management, 7(S): pp.45-62. Lampe, M., Ellis, S.R., & Drummond, C.K., 1991. What companies are doing to meet
environmental protection responsibilities: Balancing legal, ethical, and profit concerns. Proceedings of the International Association for Business and Society: pp.527-537.
Lawrence, A. T., & Morell, D., 1995. Leading edge environmental management:
Motivation, opportunity, resources, and processes. In D. Collins & M. Starik (Eds.), Research in corporate social performance and policy: pp.99-126. Greenwich, CT: JAI Press.
Lee, J. & Miller, D., 1999. People Matter: Commitment to Employees, Strategy and
Performance in Korean Firms. Strategic Management Journal, 20(6): pp.579-593. Li, S., Ragu-Nathan, B., Ragu-Nathan, T.S. & Rao, S.S., 2006. The impact of supply
chain management practices on competitive advantage and organizational performance. The international Journal of Management Science, 34: pp.107-124.
Lin, B., Jones, C.A. & Hsieh C., 2001. Environmental practices and assessment: a
process perspective. Industrial Management & Data Systems, 101(2): pp.71-80. Lise, W., 2006. Decomposition of CO2 emissions over 1980-2003 in Turkey. Energy
Policy, 34: pp.1841-1852.

91
Marrewijk, V.M., 2003. Concepts and Definitions of CSR and Corporate Sustainability: Between Agency and Communion. Journal of Business Ethics, 44: pp. 95-105, Kluwer Academic Publishers.
Matten, D. & Moon, J., 2008. “Implicit” and “Explicit” CSR: A Conceptual Framework
for A Comparative Understanding of Corporate Social Responsibility. Academy of Management Review, 33(2): pp.404-424.
Melnyk, S.A., Sroufe, R.P. & Calantone, R., 2003. Assessing the impact of
environmental management systems on corporate and environmental performance. Journal of Operations Management, 21: pp.329-351.
Messelbeck, J. & Whaley, M., 1999. Greening the health care supply chain: Triggers of
change, models for success. Corporate Environmental Strategy, 6(1): pp.39-45. Mentzer, J., DeWitt, W., Keebler, J., Min, S., Nix, N., Smith, C. & Zacharia, Z., 2001.
Defining supply chain management. Journal of Business Logistics, 22(2): pp.1-24. Morrow, D. & Rondinelli, D., 2002. Adopting Corporate Environmental Management
Systems: Motivations and Results of ISO 14001 and EMAS Certification. European Management Journal, 20(2): pp. 159-171.
Mosovsky, J., Dickinson, D. & Morabito, J., 2000. Creating Competitive Advantage
Through Resource Productivity, Eco-Efficiency, and Sustainability in the Supply Chain. IEEE: pp.230-237.
Moore, B. & Wüstenhagen, R., 2004. Innovative and Sustainable Energy Technologies:
The Role of Venture Capital. Business Strategy and the Environment, 13: pp. 235-245.
Murphy, C.J., 2002. The Profitable Correlation between Environmental and Financial
Performance: A Review of the Research. Light Green Advisors, Inc. Noble, D., 1997. Purchasing and supplier management as a future competitive edge.
Logistics Focus, 5(5): pp.23-27. Oliver, R.K. & M.D. Weber. “Supply-Chain Management: Logistics Catches Up With
Strategy.” In M.L. Christopher (Ed.), Logistics: The Strategic Issues, Chapman & Hall, London, 1982, pp. 63-75.
Paulraj, A., 2008. Environmental Motivations: a Classification Scheme and its Impact
on Environmental Strategies and Practices. Business Strategy and the Environment, John Wiley & Sons, pp.1-16.
Pratima, B. & Kendall, R., 2000. Why Companies Go Green: A Model of Ecological
Responsiveness. Academy of Management Journal, 43(4): p.717.

92
Roberts, S., 2003. Supply Chain Specific? Understanding the Patchy Success of Ethical Sourcing Initiatives. Journal of Business Ethics, 44: pp.159-170, Kluwer Academic Publishers.
Routroy, S., 2009. Antencedents and Drivers for Green Supply Chain Management
Implementation in Manufacturing Environment, The Icfai University Press, pp.20-35.
Santos, F.C.A., 2000. Integration of human research management and competitive
priorities of manufacturing strategy. International Journal of Operations and Production Management, 20(5): pp.610-628.
Sarkis, J., 1995. Manufacturing strategy and environmental consciousness.
Technovation, 15(2): pp.79-97. Sarkis, J., 1998. Evaluating environmentally conscious business practices - Theory and
Methodology. European Journal of Operational Research, 107: pp.159-174. Sarkis, J., 2001. Manufacturing’s role in corporate environmental sustainability:
concerns for the new millennium. International Journal of Operations and Production Management, 21(5/6): pp.666-686.
Sarkis, J., 2003. A strategic decision framework for green supply chain management.
Journal of Cleaner Production, 11: pp.397-409. Sarkis, J., Mohd, H.A. & Shankar, R., 2009. Evaluating Environmentally Conscious
Manufacturing Barriers with Interpretive Structural Modeling. http://ssrn.com/abstract=956954.
Seuring, S., Sarkis, J., Müller, M. & Rao, P., 2008. Sustainability and supply chain
management - An introduction to the special issue. Science Direct, Journal of Cleaner Production, 16: pp.1545-1551.
Sharma, S. & Vredenburg, H., 1998. Proactive corporate environmental strategy and the
development of competitively valuable organizational capabilities. Strategic Management Journal, 19(8): pp.729-753.
Shrivastava, P., 1995a. Ecocentric Management For A Risk Society, Academy of
Management Review, 20(1): pp.118-137. Shrivastava, P., 1995b. Environmental Technologies and Competitive Advantage,
Strategic Management Journal, 16: pp. 183-200. Srivastava, S.K., 2007. Green Supply Chain Management: A state-of-the-art literature
review, International of Management Reviews, 9(1): pp.53-80 Steger, U., 2000. Environmental Management Systems: Empirical Evidence and Further
Perspectives. European Management Journal, 18(1): pp.23-37.

93
Swift, T. & Zadek, S. (2002). Corporate Responsibility and the Competitive Advantage of Nations. The Copenhagen Centre and Accountability, pp.1-33.
Takala, T., 1996. From Social Responsibility to Environmental Responsibility -
Changes in the Finnish Business Discourse from 1970 to 1995. 1(1). Tan, K.C., Kannan, V.R., Handfield, R.B. & Ghosh, S., 1999, Supply chain
management: an empirical study of its impact on performance. International Journal of Operations & Production Management, 17(10): pp.1034-1052.
Tsoulfas, G.T. & Pappis, C.P., 2006. Environmental principles applicable to supply
chains design and operation, Journal of Cleaner Production, 14: pp.1593-1602. Varma, S., Wadhwa,S., & Deshmukh, S.G., 2006. Implementing supply chain
management in a firm: issues and remedies. Asia Pasific Journal of Marketing and Logistics, 18(3): pp.223-243.
Walker, H., Sisto, L.D. & McBain, D., 2008. Drivers and barriers to environmental
supply chain management practices: Lessons from the public and private sectors. Journal of Purchasing & Supply Management, 14: pp.69-85.
Wu, H.J. & Dunn, S.C., 1995. Environmentally responsible logistics systems.
International Journal of Physical Distribution & Logistics Management, 25(2): pp. 20-38.
Wu, S.J., Melnyk, S.A. & Calantone, R.J., 2008. Assessing the Core Resources in the
Environmental Management System From the Resource Perspective and the Contingency Perspective. IEE Transactions on Engineering Management, 55(2): pp.304-315.
Yu, J. & Bell, J.N.B., 2007. Building a sustainable business in China’s Small and
Medium-Sized Enterprises (SMEs). Journal of Environmental Assessment Policy and Management, 9(1): pp.19-43.
Zhu, Q. & Sarkis, J., 2006. An inter-sectoral comparison of green supply chain
management in China Drivers and practices. Journal of Cleaner Production, 14: pp.472-486.
Zhu, Q., Sarkis, J., & Geng, Y., 2005. Green supply chain management in China:
pressures, practices and performance. International Journal of Operations & Production Management, 25(5): pp.449-468.
Zhu, Q., Sarkis, J., & Lai, K.H., 2007. Green supply chain management: pressures,
practices and performance within the Chinese automobile industry. Journal of Cleaner Production, 15: pp.1041-1052.
Zhu, Q., Sarkis, J., & Lai, K.H., 2008. Green supply chain management implications for
- closing the loop. Transportation Research Part E, 44: pp.1-18.

94
Zhu, Q., Sarkis, J., Cordeiro, J.J. & Lai, K.H., 2008. Firm-level correlates of emergent
green supply chain management practices in Chineese context. The international Journal of Management Science, 36: pp.577-591.
Zutshi, A. & Sohal, A., 2004. A study of the environmental management system (EMS)
adoption process within Australasian organizations - Role of stakeholders. Technovation, 24: pp.371-386.
Zwetsloot, G. I., 2003. From Management Systems to Corporate Social Responsibility.
Journal of Business Ethics, 44: pp.201-207.

95
Other Publications
Baumert, K.A., Herzog, T. & Pershing, J., 2005. Navigating the Numbers: Greenhouse Gas Data and International Climate Policy. World Resources Institute.
Deciding the Future: Energy Policy Scenarios to 2050 World Energy Council 2007.
[Online] http://www.worldenergy.org/documents/scenarios_study_online.pdf, [Cited 30.06.2009].
Dillon, P. W., & Fischer, K., 1992. Environmental management in corporations.
Medford, MA: Tufts University Center for Environmental Management. Earth Trends Country Profiles, Climate and Atmosphere. Turkey, 2003, 1. Förster, R. & Reusser, L., 1999. Toolbox - An EMPA guidebook for environmental
decision support concepts and tools - Edition 03.00. EMPA, Swiss Federal Laboratories for Materials Testing and Research, St. Gallen, Switzerland.
Greenhouse gas emission trends and projections in Europe, 2008. EEA Report, 5. Greenhouse gas emission trends and projections in Europe. Turkey, 2007. International Energy Agency. World Energy Outlook, 2004. Khiewnavawongsa, S. & Schmidt, E.K. , 2008. Green Power to the Supply Chain.
Proceedings of the Annual Meeting of the Association of Collegiate Marketing Editors: pp.244-251.
List of countries by carbon dioxide emissions, 2007. [Online] http://en.wikipedia.org/wiki/List_of_countries_by_carbon_dioxide_emissions, [Cited
19.05.2009]. List of countries by carbon dioxide emissions per capita, 2007. [Online] http://en.wikipedia.org/wiki/List_of_countries_by_carbon_dioxide_emissions_per_capit
a, [Cited 19.05.2009]. Russell, K., 2001. Supply chain management, Computerworld, 35(51): pp. 32.
Sarkis J., 1999. How Green is the Supply Chain? Practice and Research. Clark University - Graduate School of Management. pp.1-40
Saunders, M., 1995. “Chains, Pipelines, Networks and Value Stream: The Role, Nature
and Value of Such Metaphors in Forming Perceptions of the Task of Purchasing and Supply Management,” 1st World-Wide Research Symposium on Purchasing and Supply Chain Management, Tempe, AZ: pp.476-485.
Sroufe, R.P., Melnyk, S.A. & Vastag, G., 1998. Environmental Management Systems
As A Source of Competitive Advantage. Michigan State University - Department of Marketing and Supply Chain Management.

96
TMMOB Çevre Mühendisleri Odası Çevre Durum Raporu, 2008. University of North Carolina at Chapel Hill and the Environmental Law Institute, 2001.
Drivers, Designs, and Consequences of Environmental Management Systems. Research Findings To Date From the National Database on Environmental Management Systems. In Cooperation with the United States Environmental Protection Agency, and the Multi-State Working Group on Environmental Management Systems, USA.
Vredenburg, H., & Westley, F., 1993. Environmental leadership in three contexts:
Managing for global competitiveness. Proceedings of the International Association of Business and Society: 495-500.
Waters, D., 2007. Global logistics: New directions in supply chain management,
Chartered Institute of Logistics and Transport in the UK. Kogan Page Publishers, England, 5.
Winn, M., 1995. Corporate leadership and policies for the natural environment. In
Collins, D. & Starik,M., (Eds.), Research in corporate social performance and policy, supplement 1: 127-161. Greenwich, CT: JAI Press.

97
APPENDICES

98
Appendix A.1. List of countries by carbon dioxide emissions, 2007
Rank Country
Annual CO2 emissions (in thousands of metric tons)
Percentage of total emissions
- World 27,245,758 100.0 %
1 United States 6,049,435 22.2 %
2 China and Taiwan 5,010,170 18.4 %
- European Union 4,001,222 14.7 %
3 Russia 1,524,993 5.6 %
4 India 1,342,962 4.9 %
5 Japan 1,257,963 4.6 %
6 Germany 860,522 3.1 %
7 Canada 639,403 2.3 %
8 United Kingdom 587,261 2.2 %
9 South Korea 465,643 1.7 %
10 Italy 449,948 1.7 %
11 Mexico 438,022 1.6 %
12 South Africa 437,032 1.6 %
13 Iran 433,571 1.6 %
14 Indonesia 378,25 1.4 %
15 France 373,693 1.4 %
16 Brazil 331,795 1.2 %
17 Spain 330,497 1.2 %
18 Ukraine 330,039 1.2 %
19 Australia 326,757 1.2 %
20 Saudi Arabia 308,393 1.1 %
21 Poland 307,238 1.1 %
22 Thailand 268,082 1.0 %
23 Turkey 226,125 0.8 %
24 Kazakhstan 200,278 0.7 %
25 Algeria 194,001 0.7 %
26 Malaysia 177,584 0.7 %
27 Venezuela 172,623 0.6 %
28 Egypt 158,237 0.6 %
29 United Arab Emirates 149,188 0.5 %
30 Netherlands 142,061 0.5 %
31 Argentina 141,786 0.5 %
32 Uzbekistan 137,907 0.5 %
33 Pakistan 125,669 0.5 %
34 Czech Republic 116,991 0.4 %
35 Nigeria 114,025 0.4 %
36 Belgium 100,716 0.4 %

99
37 Kuwait 99,364 0.4 %
38 Vietnam 98,663 0.4 %
39 Greece 96,695 0.4 %
40 Romania 90,425 0.3 %
42 Iraq 81,652 0.3 %
43 Philippines 80,512 0.3 %
44 North Korea 79,111 0.3 %
45 Israel 71,247 0.3 %
46 Austria 69,846 0.3 %
47 Syria 68,42 0.3 %
48 Finland 65,799 0.2 %
49 Belarus 64,89 0.2 %
50 Chile 62,418 0.2 %
51 Libya 59,914 0.2 %
52 Portugal 58,906 0.2 %
53 Hungary 57,183 0.2 %
54 Colombia 53,634 0.2 %
55 Serbia and Montenegro 53,322 0.2 %
56 Sweden 53,033 0.2 %
57 Denmark 52,956 0.2 %
58 Qatar 52,904 0.2 %
59 Singapore 52,252 0.2 %
60 Norway 43,149 0.2 %
60 Bulgaria 42,558 0.2 %
61 Ireland 42,353 0.2 %
62 Turkmenistan 41,726 0.2 %
63 Morocco 41,169 0.2 %
64 Switzerland 40,457 0.2 %
65 Hong Kong 37,411 0.1 %
66 Bangladesh 37,165 0.1 %
67 Slovakia 36,289 0.1 %
68 Trinidad and Tobago 32,557 0.1 %
69 New Zealand 31,57 0.1 %
70 Peru 31,493 0.1 %
71 Azerbaijan 31,365 0.1 %
72 Oman 30,899 0.1 %
73 Ecuador 29,268 0.1 %
74 Cuba 25,818 0.1 %
75 Croatia 23,501 0.1 %
77 Tunisia 22,885 0.1 %
78 Yemen 21,114 0.1 %
79 Dominican Republic 19,64 0.1 %
80 Estonia 18,944 0.1 %

100
Appendix A.2. List of countries by carbon dioxide emissions per capita, 2007 Rank COUNTRY 1990 1991 1992 1993 1994 1995 1996 1997 1998 1999 2000 2001 2002 2003 2004
1 Qatar 22.5 37.4 55.3 62.1 60.2 60.4 61.4 68.7 60.3 56.9 60.1 66.3 67.4 63.1 69.2 2 Kuwait 21.1 5.5 10.0 16.4 20.6 32.3 28.4 28.1 33.8 32.6 31.7 28.8 27.1 31.1 38.0 3 United Arab Emirates 29.3 30.2 29.4 31.0 33.0 30.2 16.9 17.7 36.4 36.0 35.6 33.5 33.7 33.6 37.8 4 Luxembourg 26.3 27.8 30.5 27.5 25.6 20.6 20.5 19.0 17.4 17.9 18.9 19.5 21.1 22.0 24.9 5 Trinidad and Tobago 13.9 17.1 17.0 13.5 15.4 16.1 16.5 14.6 15.8 18.7 19.7 20.1 21.5 22.1 24.7 6 Brunei 22.7 19.6 18.7 18.9 17.8 17.7 17.0 17.7 10.7 13.3 17.2 16.1 15.1 12.7 24.1 7 Bahrain 22.5 21.9 19.5 27.2 26.6 27.2 25.9 27.9 28.8 27.4 27.8 26.4 30.6 31.0 23.9 8 Netherlands Antilles 6.3 20.8 21.3 29.7 28.7 28.5 26.9 40.6 19.0 18.3 18.7 19.0 19.2 22.7 22.2 9 Aruba 27.7 27.8 23.6 23.0 22.0 21.4 21.1 21.2 18.9 18.8 22.7 22.4 22.5 22.3 21.3
10 United States 18.9 18.7 18.4 19.3 19.5 19.3 19.4 20.2 19.8 19.9 20.4 20.1 20.0 19.8 20.4 11 Canada 15.0 14.7 14.8 15.1 14.3 15.3 15.3 16.2 15.3 15.6 16.2 16.0 17.1 17.9 20.0 12 Norway 7.8 7.8 7.1 7.6 7.1 8.5 9.2 9.5 9.4 10.1 9.9 11.6 15.8 18.0 19.01 13 Australia 16.2 15.4 15.8 16.0 16.3 16.5 17.4 17.2 17.8 18.4 18.3 19.1 18.2 18.0 16.3 14 Falkland Islands 19.0 18.4 17.7 16.9 16.2 16.7 17.1 17.5 13.6 13.1 12.7 13.9 13.8 15.1 14.8 15 Nauru 13.9 13.6 13.5 13.2 12.9 12.8 12.5 12.2 11.9 11.3 11.1 11.0 10.8 10.8 14.2 16 Estonia 16.1 13.3 13.6 12.5 13.4 13.6 12.6 11.6 11.7 12.1 11.8 13.6 14.1 17 Faroe Islands 13.0 12.3 13.8 12.8 11.5 14.1 14.4 14.4 14.4 14.4 14.2 14.1 14.1 14.2 13.8 18 Saudi Arabia 12.1 16.4 17.1 18.4 17.7 13.1 14.2 12.6 10.9 11.1 12.7 12.8 12.7 13.0 13.4 19 Kazakhstan 15.5 13.2 12.3 10.4 8.9 8.3 8.0 7.4 8.1 8.4 10.6 10.7 13.3 20 Gibraltar 2.3 2.6 1.8 10.8 13.1 11.0 6.6 3.1 11.3 11.7 12.1 12.4 12.6 13.0 13.0 21 Finland 10.3 10.7 9.5 10.3 11.4 10.7 12.2 11.6 10.9 10.7 10.0 10.9 11.8 13.0 12.6 22 Oman 5.6 5.7 6.1 6.5 7.2 7.3 6.8 6.8 7.1 8.7 9.0 9.9 12.2 12.9 12.5 23 Singapore 15.0 14.4 14.2 16.3 19.1 13.5 15.0 16.8 14.8 14.3 14.1 13.8 13.4 11.3 12.2 24 Palau 15.3 15.0 14.8 13.9 13.6 13.8 13.8 13.1 13.0 12.8 12.6 12.0 11.9 12.3 11.9 25 Montserrat 3.2 3.2 3.4 3.4 3.4 4.2 4.4 5.9 8.4 10.1 12.6 14.1 15.7 16.0 11.7 26 Czech Republic 13.1 12.9 12.5 11.8 12.2 12.0 11.5 10.6 11.6 11.6 11.2 11.4 11.48 27 Equatorial Guinea 0.3 0.4 0.3 0.3 0.3 0.3 0.3 0.4 0.6 0.6 0.6 0.6 9.7 9.4 11.47 28 New Caledonia 9.4 10.2 9.8 9.6 9.1 8.9 8.9 9.0 8.7 9.6 8.4 8.3 8.1 8.2 11.2 29 Israel 7.4 7.3 8.3 8.8 8.8 9.7 9.4 10.6 10.2 9.8 10.6 10.3 10.8 10.6 10.8 30 Russia 13.4 12.2 10.6 10.2 10.1 9.7 9.5 9.7 9.9 9.9 9.9 10.3 10.5 31 Libya 8.7 8.9 8.4 8.6 8.3 9.1 8.2 9.7 8.9 8.5 8.8 8.9 8.9 8.9 10.3 32 Ireland 8.7 9.5 8.9 9.0 9.3 9.2 9.8 10.0 10.4 10.8 10.9 11.3 10.8 10.3 10.4

101
33 Greenland 10.0 9.8 8.6 9.0 9.0 9.0 9.2 9.3 9.5 9.6 9.9 10.0 10.0 10.0 10.0 34 Japan 8.7 8.8 8.9 8.7 9.1 9.1 9.3 9.3 8.9 9.2 9.5 9.4 9.5 9.5 9.84 35 Saint Pierre and Miquelon 15.7 17.2 16.2 12.7 12.2 12.2 12.2 7.9 9.5 9.5 9.5 9.5 10.1 11.3 9.83 36 Denmark 9.7 12.1 10.3 11.3 11.7 10.6 12.8 10.8 10.3 9.4 8.7 9.0 8.9 10.1 9.80 37 United Kingdom 10.0 11.3 9.9 9.6 9.5 9.5 9.9 9.3 9.2 9.2 9.5 9.6 9.3 9.4 9.79 38 Germany 12.4 11.2 10.8 10.5 10.4 10.2 10.5 10.2 10.1 9.6 9.7 10.0 9.7 9.8 9.79 39 South Korea 5.6 6.1 6.6 7.2 7.7 8.3 9.0 9.3 7.9 8.5 9.1 9.3 9.4 9.6 9.77 40 Belgium 10.1 10.5 10.4 9.9 10.3 10.5 10.6 10.3 10.6 10.2 9.9 9.2 6.8 8.3 9.7 41 South Africa 7.8 7.9 7.2 7.5 7.6 7.8 7.6 7.6 7.6 7.4 7.2 7.2 7.7 7.8 9.2 42 Turkmenistan 7.2 6.9 8.2 8.3 7.4 6.9 5.9 7.9 7.9 8.7 9.1 9.2 8.8 43 Netherlands 9.4 9.3 9.2 9.5 8.8 9.0 9.9 9.3 9.4 9.0 8.8 8.8 9.4 8.7 8.74 44 Greece 7.1 6.5 7.1 7.1 7.3 7.3 7.6 7.7 7.9 7.8 8.2 8.4 8.5 8.7 8.73 45 Bermuda 9.9 8.2 6.6 7.6 7.5 7.4 7.5 7.5 7.4 7.4 7.4 7.3 7.9 7.8 8.6 46 Austria 7.5 8.0 7.2 7.1 7.2 7.3 7.4 7.4 7.7 7.5 7.5 8.0 8.0 8.7 8.5 47 Cyprus 6.8 6.5 7.1 7.2 7.3 7.0 7.1 7.2 7.8 7.8 8.2 8.1 8.1 8.9 8.2 48 Slovenia 6.3 6.5 5.5 7.1 7.5 8.1 7.7 7.6 7.3 7.7 7.8 7.8 8.1 49 Poland 9.1 9.0 8.9 9.1 8.8 9.0 9.4 9.0 8.4 8.1 7.8 7.8 7.7 7.9 8.0 50 New Zealand 6.9 7.2 7.5 7.1 7.3 7.3 8.2 8.5 8.1 8.4 8.7 9.1 8.9 8.8 7.8 51 Spain 5.4 5.5 5.7 5.2 5.4 5.9 5.8 6.1 6.3 6.8 6.9 6.9 7.3 7.3 7.72 52 Italy 6.9 7.0 7.1 6.9 6.8 7.2 7.1 7.1 7.3 7.3 7.4 7.4 7.5 7.7 7.69 53 Iceland 7.9 7.0 7.0 7.6 7.6 7.3 8.2 7.7 7.6 7.4 7.7 7.4 7.7 7.6 7.6 54 Malaysia 3.1 3.7 4.0 4.7 4.7 5.9 5.9 5.8 5.2 4.8 5.5 5.8 5.9 6.4 7.05 55 Ukraine 11.6 9.9 8.2 8.3 7.8 6.5 6.3 6.4 6.2 6.3 6.4 6.6 6.98 56 Cayman Islands 9.5 9.8 9.6 9.5 9.1 8.7 8.3 7.9 7.6 7.3 7.1 6.9 6.9 7.1 6.98 57 Slovakia 8.1 7.1 7.0 7.7 7.4 7.2 7.4 7.2 6.6 6.9 6.9 7.0 6.7 58 Belarus 9.2 7.6 6.8 6.2 6.3 6.1 5.9 5.8 5.9 5.9 6.0 6.4 6.6 59 Venezuela 6.0 5.9 5.3 6.2 7.7 6.7 6.9 6.7 7.0 6.8 6.7 6.4 5.4 5.6 6.57 60 Seychelles 1.6 1.9 2.3 2.2 2.5 2.5 2.6 5.5 5.7 6.7 7.3 8.3 6.9 6.9 6.4 61 Iran 3.9 3.9 4.1 3.8 4.8 4.4 4.8 4.9 4.7 4.2 4.4 4.5 5.5 5.6 6.31 62 Bahamas 7.7 6.9 6.8 6.4 6.3 6.2 6.1 6.0 6.1 6.0 6.0 5.9 6.7 6.0 6.29 63 France 6.4 6.8 6.3 6.2 5.7 6.0 6.4 5.9 6.4 6.1 6.0 6.3 6.2 6.2 6.2 64 Malta 6.2 6.8 7.2 7.4 7.2 7.8 8.2 8.7 5.4 5.9 5.4 5.2 5.3 6.2 6.1 65 Algeria 3.0 3.1 3.0 3.0 3.1 3.4 3.4 3.0 6.0 5.5 5.4 5.2 5.3 5.1 5.99 66 Sweden 5.8 6.0 5.9 5.5 5.7 5.3 6.1 5.4 5.4 5.1 5.2 5.4 6.2 5.9 5.89 67 Hungary 5.8 5.9 5.4 5.7 5.3 5.6 5.8 5.7 5.6 5.6 5.3 5.5 5.5 5.7 5.65

102
68 Portugal 4.2 4.3 4.7 4.6 4.7 5.0 4.8 5.0 5.4 5.9 5.8 5.7 6.0 5.6 5.63 69 Switzerland 6.3 6.1 6.2 5.9 5.9 5.6 5.7 5.9 5.9 5.7 5.5 6.0 5.7 5.6 5.47 70 Bulgaria 8.7 6.8 6.0 7.8 6.3 6.8 6.3 6.1 5.9 5.3 5.3 5.6 5.3 5.6 5.46 71 French Guiana 6.9 6.8 6.9 6.7 6.6 6.5 6.3 6.0 6.3 6.1 6.0 5.8 5.8 5.6 5.38 72 Hong Kong 4.6 4.8 5.4 5.8 4.9 4.8 4.4 4.5 5.8 6.1 5.7 5.3 5.1 5.5 5.36 73 Uzbekistan 5.3 5.4 5.0 4.3 4.4 4.3 4.9 4.8 4.8 4.8 4.8 4.8 5.26 74 Croatia 3.7 3.7 3.6 3.8 4.0 4.2 4.5 4.6 4.4 4.7 4.9 5.3 5.18 75 Macedonia 5.5 5.3 5.3 5.4 6.0 5.4 6.1 5.6 5.7 5.7 5.1 5.2 5.13 76 Suriname 4.5 5.2 5.2 5.2 5.2 5.2 5.0 5.0 5.0 5.0 4.9 5.2 5.1 5.1 5.08 77 Serbia and Montenegro 4.3 3.7 3.6 3.8 4.4 4.7 4.9 3.5 3.9 4.1 4.5 4.8 5.07 78 Antigua and Barbuda 4.8 4.5 4.4 4.6 4.6 4.6 4.5 4.7 4.5 4.7 4.6 4.5 4.7 5.0 5.06 79 Macau 2.8 2.9 2.8 3.0 3.1 3.0 3.4 3.5 3.6 3.5 3.7 3.8 4.1 4.1 4.72 80 Barbados 4.2 4.7 3.8 4.3 2.9 3.2 3.2 3.4 4.3 4.6 4.5 4.6 4.6 4.4 4.36 81 Thailand 1.8 2.1 2.3 2.5 2.7 3.1 3.4 3.5 3.1 3.2 3.3 3.5 3.7 3.9 4.28 82 Mexico 4.5 4.3 4.5 4.1 4.3 4.0 3.9 4.1 4.0 4.0 4.0 4.0 3.9 4.0 4.24 83 Romania 6.7 5.8 5.3 5.1 4.9 5.5 5.4 5.0 4.4 3.8 3.9 4.2 4.0 4.2 4.16 84 Lebanon 3.3 3.4 3.9 3.9 4.1 4.3 4.3 4.8 4.8 4.9 4.5 4.8 4.7 5.4 4.10 85 Bosnia and Herzegovina 1.2 1.0 1.1 1.2 1.5 3.6 4.6 4.2 5.1 5.1 4.8 4.9 3.99 86 Guadeloupe 3.3 3.4 3.5 3.6 3.7 3.7 3.7 3.7 3.6 3.7 3.8 3.8 3.9 3.9 3.99 87 Jamaica 3.4 3.4 3.4 3.5 3.5 3.9 4.1 4.2 3.8 3.8 4.0 4.1 3.9 4.1 3.97 88 British Virgin Islands 3.0 2.9 3.0 2.9 2.9 2.8 3.1 3.0 2.9 2.9 2.8 2.8 3.2 3.6 3.88 89 Chile 2.7 2.5 2.6 2.6 2.9 3.1 3.5 3.9 3.8 4.1 3.9 3.5 3.6 3.7 3.87 90 Lithuania 5.8 4.8 4.8 4.4 4.4 4.2 4.5 3.8 3.4 3.6 3.6 3.7 3.87 91 China 2.1 2.2 2.2 2.3 2.5 2.6 2.7 2.7 2.5 2.2 2.2 2.3 2.7 3.2 3.84 92 Azerbaijan 6.3 5.9 5.4 4.2 3.9 3.6 3.8 4.1 3.7 3.4 3.4 3.5 3.78 93 Syria 2.8 3.1 3.1 3.3 3.0 2.9 2.9 2.6 3.0 3.0 2.9 2.8 2.9 2.7 3.72 94 Argentina 3.4 3.5 3.6 3.4 3.5 3.4 3.6 3.7 3.7 3.9 3.7 3.4 3.2 3.4 3.70 95 North Korea 12.4 12.6 12.7 12.8 12.6 12.4 12.2 11.0 3.0 3.3 3.5 3.6 3.4 3.5 3.36 96 Mongolia 4.5 5.4 4.8 4.0 3.4 3.3 3.3 3.2 3.1 3.1 3.0 3.1 3.2 3.1 3.35 97 Martinique 5.7 5.1 5.6 5.5 5.5 5.4 5.4 5.4 5.4 5.4 5.4 5.5 5.8 3.4 3.27 98 Turkey 2.6 2.5 2.5 2.6 2.5 2.7 3.0 3.1 3.1 3.0 3.3 2.9 3.0 3.1 3.14 99 Jordan 3.1 2.9 3.4 3.1 3.3 3.2 3.2 3.1 3.1 3.0 3.1 3.0 3.1 3.2 3.07
100 Latvia 4.8 4.4 4.3 3.8 3.8 3.3 3.2 2.7 2.5 2.8 2.7 2.9 3.07

103
Appendix A.3. A survey on environmentally conscious practices
Environmentally Conscious Practices On a scale of 1 = strongly disagree to 5 = strongly agree, indicate the practices related with environment:
1. There is a culture for green/environmental operations. 2. We request our suppliers to conform certain environmental regulations, e.g.
ISO14001, WEEE, and RoHS. 3. We place increasing emphasis on improving eco-efficiency in our production. 4. We reuse/recycle waste materials. 5. There is a need for exploiting cleaner technologies in your company. 6. Environmental performance is more important than cost effectiveness. 7. Your company uses renewable energy and resources in the supply chain (e.g.
wind power, biodiesel, etc).
SCM Potential Polluters On a scale of 1 = strongly disagree to 5 = strongly agree, indicate the potential polluters in your company’s supply chain:
1. In your supply chain, logistics/distribution is the biggest contributor to CO2 emission.
2. In your supply chain, reverse logistics/de-distribution is the biggest contributor to CO2 emission.
3. In your supply chain, manufacturing process is the biggest contributor to CO2 emission.
4. In your supply chain, energy production is the biggest contributor to CO2 emission.
5. In your supply chain, packaging is the biggest contributor to CO2 emission.
Environmental Management Drivers On a scale of 1 = strongly disagree to 5 = strongly agree, indicate the factors that drive your company to go green:
1. Government policy drives the need to green. 2. Senior management in the company drives the need to go green. 3. Customers drive the need to go green. 4. Competition drives the need to go green.
Competitive Environment On a scale of 1 = strongly disagree to 5 = strongly agree, indicate the overall level of competition in your firm's primary industry for each of the dimensions below:
1. Number of competencies (i.e. things a firm must do well) required surviving in this industry.
2. The time, effort, resources and managerial attention required to keep up with competitors.
3. Overall competitiveness of our industry is commonly high. 4. Importance of potential competitor reaction or retaliation to decisions made in
our firm. 5. Aggressiveness of our major competitors. 6. Amount of time spent analyzing major competitors' strategies and actions.

104
Competitive Priorities On a scale of 1 = strongly disagree to 5 = strongly agree, indicate the importance given to each item in your organization: Our strategy places importance on delivering products with high performance.
1. Our strategy is based on quality performance rather than price. 2. We emphasize launching new products quickly. 3. Our strategy cannot be described as the one to offer products with the lowest
price. 4. We place greater emphasis on customer service than price. 5. We place greater emphasis on innovation than price.
Customer Relations On a scale of 1 = strongly disagree to 5 = strongly agree, rate your firm's ability to monitor and manage customer relationships in the following areas:
1. We share a sense of fair play with our customers. 2. We frequently interact with customers to set reliability, responsiveness, and
other standards for us. 3. We periodically evaluate the importance of our relationship with our customers. 4. We facilitate customers’ ability to seek assistance from us. 5. We frequently determine future customer expectations. 6. We frequently measure and evaluate customer satisfaction. 7. We have frequent follow-up with our customers for quality/service feedback.

105
CURRICULUM VITAE
Name Surname: İPEK ÖZER
Address: Hürriyet Cad. No:39/6, Florya / İstanbul, Türkiye
Place and Date of Birth: Istanbul - June,30. 1983
Foreign Language: English
Primary Education: Kültür College - 1993
Secondary Education: Beşiktaş Atatürk Anatolian High School - 2001
Bachelor of Science: Işık University - 2006
Master of Science: Bahçeşehir University - 2009
Name of Institution: Institute of Science
Name of Program: Industrial Engineering
Periodicals:
Working life: Bahçeşehir University (2008 - ...), Işık University (2006 - 2008)