Embed Size (px)
Citation preview
EDHEC RISK AND ASSET MANAGEMENT RESEARCH CENTEREdhec -1090 route des crêtes - 06560 Valbonne - Tel. +33 (0)4 92 96 89 50 - Fax. +33 (0)4 92 96 93 22
Email: [email protected] – Web: www.edhec-risk.com
An Analysis of Hedge Fund Performance 1984-2000
CAPOCCI DanielUniversity of Liège
HÜBNER GeorgesDepartment of Management, University of Liège
Associate Professor with Edhec
2
Abstract
Using one of the largest hedge fund databases ever used (2796 individual funds including 801
dissolved), we investigate hedge funds performance using various asset pricing models,
including an extension of Carhart’s (1997) specification combined with the Fama and French
(1998) and Agarwal and Naik (2000) models and a new factor that takes into account the fact
that some hedge funds invest in emerging bond markets. This addition is particularly suitable
for Event Driven, Global Macro, US Opportunistics, Equity non-Hedge and Sector funds. The
performance of hedge funds for several individual strategies and different subperiods,
including the Asian Crisis period, indicates evidence of persistence in performance in some
cases but it is not stable over time.
JEL Classification codes: G2, G11, G15
Daniel Capocci is the corresponding author. University of Liège, Bld du Rectorat 7-B31, B-4000Liège, Belgium, tel.: 32 87 784221 - fax: 32 87 787140 - E-mail: [email protected].
Georges Hübner is from the Department of Management, University of Liège and Limburgs Instituteof Financial Economics, Maastricht University.
The authors would like to thank David Capocci, Mark Carhart, Bing Liang, Narayan Naik, RogerOtten and seminar participants at the Catholic University of Louvain (UCL) for helpful comments,Kenneth French and Mark Carhart from providing the data on passive investment portfolios, and Jean-Marc Brisy and James Bradburn from Olympia Capital Management for providing access to HedgeFund Research, Inc. and Managed Account Reports hedge fund data. Georges Hübner thanks Deloitteand Touche (Luxemburg) for financial support. All errors are ours.
Edhec is one of the top five business schools in France owing to the high quality of its academic staff (90permanent lecturers from France and abroad) and its privileged relationship with professionals that the school hasbeen developing since its establishment in 1906. Edhec Business School has decided to draw on its extensiveknowledge of the professional environment and has therefore concentrated its research on themes that satisfy theneeds of professionals.Edhec pursues an active research policy in the field of finance. Its “Risk and Asset Management ResearchCenter” carries out numerous research programs in the areas of asset allocation and risk management in both thetraditional and alternative investment universes.
Copyright © 2003 Edhec
An Analysis of Hedge Fund Performance 1984-2000
I Introduction
With almost 6.000 funds managing around $400 billion in capital, hedge funds justify an
increased attention in financial press as well as in the academic world. These funds, that have
been existing for more than fifty years, are not legally defined but share some common
characteristics : they use a broad range of instruments like short selling, derivatives, leverage
or arbitrage on different markets. Hedge funds require high minimum investments and their
access is limited to individual investors or to institutions with large financial resources.
Currently, about 90% of hedge fund managers are based in the US, 9% in Europe, and 1% in
Asia and elsewhere. While the number of funds has more than doubled since the mid-nineties,
around 80% of hedge funds are smaller than $100 million, and around 50% are smaller than
$12 million. This reflects the high number of recent entries.
Scientific literature on performance-evaluation yields controversial results. This lack of
consensus on the « right » model puts researchers in a quandary (Metrick, 1998). In this paper,
we investigate hedge funds performance levels and persistence using various asset-pricing
models, including an extension form of Carhart’s (1997) model, combined with the models of
Fama and French (1998) and Agarwal and Naik (2000) and with a factor, never used
previously in this context, that take into account the fact that some hedge funds invest in
emerging bond markets. This analysis is carried out for different subperiods including the
Asian Crisis period and for several individual hedge funds strategies.
The rest of the paper is organized as follow. Section 2 reviews some of the major mutual and
hedge funds performance studies with a focus on the evolution in the models used. Section 3
sets out the performance models we will use. The next Section provides a thorough
description of our database. Section 5 brings some insights on hedge fund performance.
Section 6 reports results of the performance of hedge funds. Section 7 documents and explains
the persistence in hedge fund returns. Section 8 concludes the paper.
II Literature Review
2.1 Performance Studies
Despite the increasing interest that hedge funds have originated due to their recent
development, few performance studies have been carried out on hedge funds comparing to
An Ana ly s i s o f Hedge Fund Per fo rmance 1 9 8 4 - 2 0 0 0
4
other investment tools like mutual funds. This can partly be explained by their private
characteristics and the difficulties encountered to have access to individual funds data.
Therefore, it is interesting to succinctly consider the results obtained in the main performance
studies of mutual funds before introducing results of studies on hedge funds.
In general, performance studies can mainly be classified in two categories, depending on
whether they conclude or deny that mutual funds have significantly higher realized returns that
those obtained by following passive strategies1, inducing that managers of mutual funds have
access to sufficient information to recover their costs.
Among studies finding superior mutual funds performance, numerous papers investigate
further its persistence. On the one hand, Hendricks et al. (1993), Goetzmann and Ibbotson
(1994), Brown and Goetzmann (1995), and Wermers (1996) show persistence in mutual funds
performance for a short period (1 to 3 years), and attribute it to hot hands2 or to common
investment strategies. It is worth noting that Carhart (1997) and Daniel and al. (1997)
demonstrated that the momentum effect in the share’s returns explain the hot hands effect
detected by Hendricks, et al. (1993). On the other hand, Ippolito (1989), Grinblatt and Titman
(1989, 1992), Elton et al. (1993), Elton et al. (1996), Sirri and Tufano (1998), and Zheng
(1999) report a predictability in the mutual funds returns over a longer period of time.
Considering the recent interest for this sector, performance studies on hedge funds are less
frequent. Nevertheless, Agarwal and Naik (1999) sustain that persistence in hedge funds
performance exists. This issue of persistence in performance is particularly important in the
case of hedge funds because, as emphasized by Brown and al. (1997, 1999) and Liang (1999),
hedge funds knew an attrition rate much higher than mutual funds. Brown and al. (1999)
prove that offshore hedge funds display positive returns adjusted for risk but they attribute this
performance to style effect and conclude that there is hardly any evidence of the existence of
differential manager skills.
Ackermann and al. (1999) and Liang (1999) who compare the performance of hedge funds to
mutual funds and several indices find that hedge funds constantly obtain better performance
1 See a.o. Lehmann and Modest (1987), Ippolito (1989), and Grinblatt and Titman (1989, 1992) for contenders of superior
performance of hedge funds, and Jensen (1969), Malkiel (1995), Gruber (1996) and Carhart (1997) for studies reaching the
opposite conclusion.
2 This effect means that the securities hold by funds that had better performance one year realize superior returns than other
funds the following year.

An Ana ly s i s o f Hedge Fund Per fo rmance 1 9 8 4 - 2 0 0 0
5
than mutual funds, although lower than the market indices considered. They also indicate that
the returns in hedge funds are more volatile than both the returns of mutual funds and those of
market indices. Ackermann and Ravenscraft (1998) emphasize that the stronger legal
limitations for mutual funds than for hedge funds hinder their performance. According to
Brown and al. (1997), hedge funds showing good performance in the first part of the year
reduce the volatility of their portfolio in the second half of the year.
Fung and Hsieh (1997) and Schneeweis and Spurgin (1997) prove that the insertion of hedge
funds in a portfolio can significantly improve its risk-return profile thanks to their weak
correlation with other financial securities. This low correlation is also emphasized by Liang
(1999) and Agarwal and Naik (1999). Amin and Kat (2001) find that stand-alone investment
hedge funds do not offer a superior risk-return profile, but that a great majority of funds
classified as inefficient on a stand-alone basis are able to produce an efficient payoff profile
when mixed with the S&P500. They obtain the best results when 10-20% of the portfolio
value is invested in hedge funds. Taking all these results into account, hedge funds seem a
good investment tool.
2.2 Evolution in Performance Measurement
In the eighties, performance measures based on the CAPM, like Jensen’s alpha (1968) and
their extensions, were commonly used in performance evaluation. The recent interest in multi-
factor models primarily comes from the literature on the cross-sectional variations in stock
return. Several studies3 report that the cross-section of average returns on U.S. common stocks
show little relation to the betas of the Sharpe (1964)-Lintner (1965) CAPM or the Breeden
(1979) ICAPM. Instead, these authors identify other factors like the size of the company
(Banz, 1981), leverage (Bhetari, 1988), earnings/price (Basu, 1983), book-to-market
(Rosenberg et al. 1985; Fama and French, 1992), dividend yield (Litzenberger and
Ramaswamy, 1979, 1982) and more recently the momentum effect (Jegadeesh and Titman,
1993; Carhart, 1995) that had reliable power to explain the cross-section of average returns.
Subsequent multi-factor models include the 8-factor model developed by Grinblatt and
Titman (1988), the asset class factor model from Sharpe (1992), the 3-factor model from
3 See e.g. Reinganum (1981), Breeden, Gibbons, and Litzenberger (1989), Fama and French (1996) and Chan, Jegadeesh and
Lakonishok (1996).

An Ana ly s i s o f Hedge Fund Per fo rmance 1 9 8 4 - 2 0 0 0
6
Fama and French (1993), the 4-factor model from Carhart (1997), and the international model
of Fama and French (1998)4.
However, recent studies have cast doubt on the usefulness of these new models. Kothari and
Warner (1998) show that the Fama and French (1993) 3-factor model provides better results
than the classical CAPM, but document that it detects significant abnormal results (including
timing) when none really exists. In addition, Carhart (1997) develops his own 4-factor model
that proves to be superior to the classical CAPM, the Grinblatt and Titman (1989) 8-factor
model and the Fama and French (1993) 3-factor model.
In hedge funds literature, different models have also been used in performance evaluation. In
an early study, Fung and Hsieh (1997) extend Sharpe’s (1992) asset class factor model and
find five dominant investment styles in hedge funds. Schneeweis and Spurgin (1998) also use
style analysis based on a multi-factor approach. Brown and al. (1999) and Ackermann and al.
(1999) use a single factor model and focus only on total risk. Agarwal and Naik (1999) use
regression-based (parametric) and contingency-table-based (non-parametric) methods. Their
parametric method regresses alphas (or appraisal ratios) on their lags. For the non-parametric
method, they construct a contingency table of winners and losers depending on the alpha.
Liang (1999) uses the extension of Fung and Hsieh (1997) model, regressions based on fund
characteristics, and classical measure like the Sharpe ratio. Recently, Agarwal and Naik
(2000) proposed a general asset class factor model comprising of excess returns on passive
option-based strategies and on buy-and-hold strategies to benchmark the performance of
hedge funds. Agarwal (2001) uses a model consisting of trading strategy factors and location
factors to explain the variation in hedge funds returns over time.
These results suggest that it is necessary to realize performance studies based on multi-factor
models, rather than simply use the CAPM, but there exists no unanimously accepted model.
Therefore, it is preferable to use several specifications in order to compare the results
obtained.
III Performance Measure Models
For comparison purpose, the paper starts its study of hedge funds performance with the
CAPM. The basic multi-factor specifications are the Fama and French (1993) 3-factor model
and its international version of 1998 (Fama and French, 1998) and the Carhart (1997) model
because they are not dominated by any other model in the mutual funds performance
4 See Allen and Soucik (2000) for a description of the major models used in mutual funds performance studies.

An Ana ly s i s o f Hedge Fund Per fo rmance 1 9 8 4 - 2 0 0 0
7
literature5. Finally, we construct a multifactor model that extends the Carhart (1997) model by
combining it with factors proposed in Fama and French (1998) model and Agarwal and Naik
(2000) and by adding an additional factor.
3.1 The Capital Asset Pricing Model
The first performance model we use is a single index model based on the classical CAPM
developed by Sharpe (1964) and Lintner (1965). Its equation to estimate is the following :
( ) TtRRRR PtFtMtPPFtPt ,...,2,1 =+−+=− εβα (1)
where RPt = return of fund P in month t; RFt = risk-free return on month t; RMt = return of the
market portfolio on month t; εPt = error term; αP and βP are the intercept and the slope of the
regression, respectively.
The intercept of this equation, αp commonly called Jensen’s alpha (1968) is usually
interpreted as a measure of out- or under-performance relative to the market proxy used.
3.2 The 3-facor Model of Fama and French (1993) and its international version of Fama and
French (1998)
The Fama and French (1993) 3-factor model is estimated from an expected form of the CAPM
regression. It takes the size and the book-to-market ratio of the firms into account. It is
estimated from the following extension of the CAPM regression :
( ) TtHMLSMBRRRR PttPtPFtMtPPFtPt ,...,2,1 321 =+++−+=− εβββα
where SMBt = the factor-mimicking portfolio for size (‘small minus big’) and HMLt = the
factor-mimicking portfolio for book-to-market equity (‘high minus low’)6. These factors aim
at isolating the firm-specific components of returns.
5 Following Bams and Otten (2000) we do not consider the Sharpe’s (1992) asset class factor model which is an asset
allocation model and not an asset evaluation model.
6 See Fama and French (1993) for a precise description of the construction of SMBt and HMLt.

An Ana ly s i s o f Hedge Fund Per fo rmance 1 9 8 4 - 2 0 0 0
8
In the international version of the model, Fama and French (1998) consider twelve major
EAFE (Europe, Australia, and Far East) countries and several emerging markets and propose
an international factor mimicking for book-to-market equity (HML). The formula is the
following :
( ) TtIHMLRRRR PttPFtMtPPFtPt ,...,2,1 21 =++−+=− εββα (2)
where IHMLt = an international version of HMLt.
According to Fama and French (1998), the international CAPM cannot explain the value
premium in international returns, but a one-state-variable international ICAPM that explains
returns with the global market return and a risk factor for relative distress captures the value
premium in country and global returns.
3.3 The 4-Factor Model of Carhart (1997)
Carhart’s (1997) 4-factor model is an extension of the Fama and French (1993) factor model.
It takes into account size and book-to-market ratio, but also an additional factor for the
momentum effect. Grinblatt, Titman and Wermers (1995) define this effect as buying stocks
that were past winners and selling past losers. This model is estimated with the following
regression :
( ) TtYRPRHMLSMBRRRR PttPtPtPFtMtPPFtPt ,...,2,1 14321 =++++−+=− εββββα (3)
where PR1YRt = the factor-mimicking portfolio for the momentum effect7
As stressed by Daniel et al. (1997), this model assumes that, in the absence of stock selection
or timing abilities, the coefficients of four zero investment factor mimicking portfolios are
appropriate measures of multidimensional systematic risk. It identifies a matching passive
portfolio return for each fund return.
7 For a description of the construction of PR1YR see Carhart (1997).
An Ana ly s i s o f Hedge Fund Per fo rmance 1 9 8 4 - 2 0 0 0
9
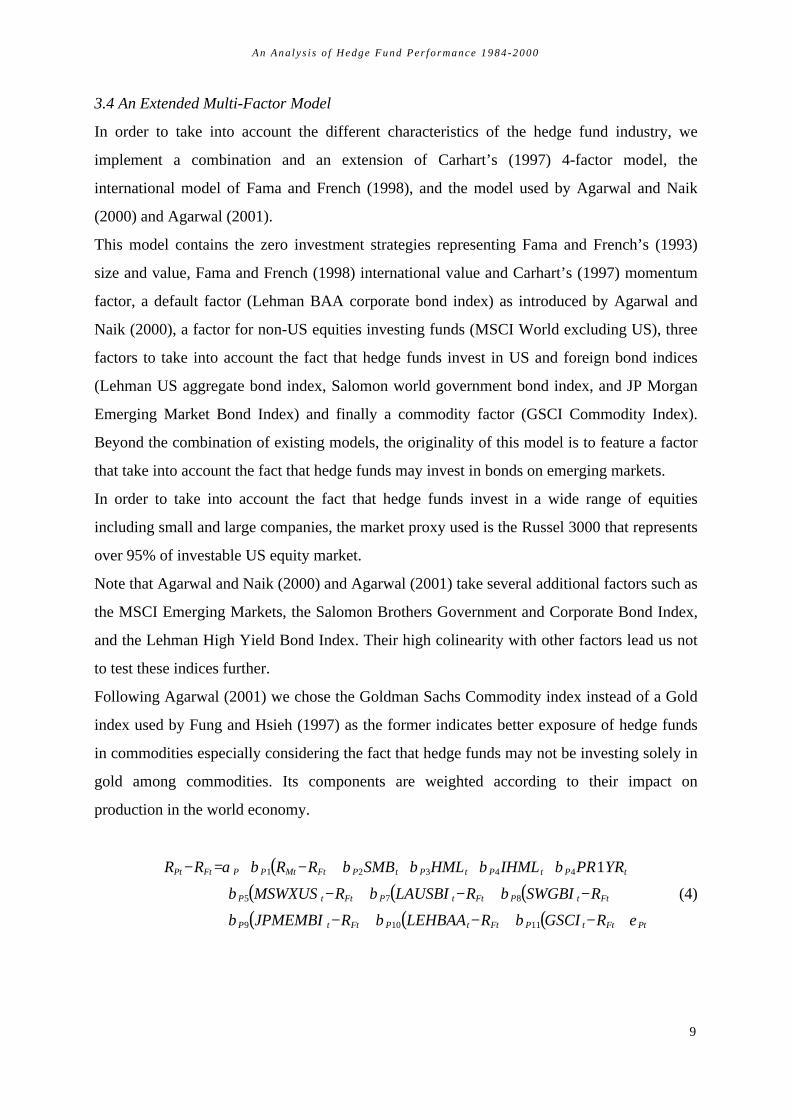
3.4 An Extended Multi-Factor Model
In order to take into account the different characteristics of the hedge fund industry, we
implement a combination and an extension of Carhart’s (1997) 4-factor model, the
international model of Fama and French (1998), and the model used by Agarwal and Naik
(2000) and Agarwal (2001).
This model contains the zero investment strategies representing Fama and French’s (1993)
size and value, Fama and French (1998) international value and Carhart’s (1997) momentum
factor, a default factor (Lehman BAA corporate bond index) as introduced by Agarwal and
Naik (2000), a factor for non-US equities investing funds (MSCI World excluding US), three
factors to take into account the fact that hedge funds invest in US and foreign bond indices
(Lehman US aggregate bond index, Salomon world government bond index, and JP Morgan
Emerging Market Bond Index) and finally a commodity factor (GSCI Commodity Index).
Beyond the combination of existing models, the originality of this model is to feature a factor
that take into account the fact that hedge funds may invest in bonds on emerging markets.
In order to take into account the fact that hedge funds invest in a wide range of equities
including small and large companies, the market proxy used is the Russel 3000 that represents
over 95% of investable US equity market.
Note that Agarwal and Naik (2000) and Agarwal (2001) take several additional factors such as
the MSCI Emerging Markets, the Salomon Brothers Government and Corporate Bond Index,
and the Lehman High Yield Bond Index. Their high colinearity with other factors lead us not
to test these indices further.
Following Agarwal (2001) we chose the Goldman Sachs Commodity index instead of a Gold
index used by Fung and Hsieh (1997) as the former indicates better exposure of hedge funds
in commodities especially considering the fact that hedge funds may not be investing solely in
gold among commodities. Its components are weighted according to their impact on
production in the world economy.
( )( ) ( ) ( )( ) ( ) ( ) PtFttPFttPFttP
FttPFttPFttP
tPtPtPtPFtMtPPFtPt
RGSCIRLEHBAARJPMEMBI
RSWGBIRLAUSBIRMSWXUS
YRPRIHMLHMLSMBRRRR
εβββ
βββ
βββββα
+−+−+−+
−+−+−+
++++−+=−
11109
875
44321 1
(4)
An Ana ly s i s o f Hedge Fund Per fo rmance 1 9 8 4 - 2 0 0 0
10
where RMt = return on the Russel 3000 index; MSWXUSt = return of the MSCI World Index
excluding US; LAUSBIt = return on the Lehman Aggregate US Bond Index; SWGBIt = return
on the Salomon World Government Bond Index; JPMEMBIt = return of the JP Morgan
emerging market Bond Index; LEHBAAt = return of the Lehman BAA Corporate Bond Index;
GSCIt = return of the Goldman Sachs Commodity Index.
IV Data
4.1 Data Providers
First, it is important to stress all information on hedge funds is available exclusively on a
voluntary basis, for ‘allowed’ persons depending on the country in which the fund wants to
find investors. Fortunately, many hedge funds release monthly information to inform existing
investors or to attract new ones. Some data collectors make them, in turn, available to the
qualifying public. As stressed by Amin and Kat (2001), there are three main hedge fund
database providers in the world. These are ‘Managed Account Reports’ (MAR, 1500 funds),
‘Hedge Fund Research, Inc.’ (HFR, 1400 funds), and ‘TASS Management’ (TASS, 2200
funds). These databases are the most used in academic and commercial hedge fund studies.
The MAR database was used, among others, by Fung and Hsieh (1997), Schneeweis and
Spurgin (1998), and Amin and Kat (2001). HFR was used by Schneeweis and Spurgin (1997),
Liang (1999), Agarwal and Naik (1999, 2000), and Agarwal (2001). TASS database was used
in Brown et al. (1997), Fung and Hsieh (2000a, 2000b), and Brown and Goetzmann (2001).
The three databases have never been used together in a study, but Ackermann et al. (1999) and
Ackermann and Ravenscraft (1998) used a combination of HFR and MAR. Liang (2000) used
a combination of TASS and HFR.
Data vendors do not collect performance data. For a majority of funds, they record many other
useful information such as company name, start and ending date, strategy followed, assets
under management, management and incentive fees, managers name etc. Moreover, each data
provider calculates a number of hedge fund indices, one for each type of strategy followed.
There is no consensus on the definition of the strategy followed but there are similarities.
MAR defines 9 strategies along with 15 sub-strategies. HFR defines sixteen different
strategies in two categories, 12 non-directional and 5 directional strategies, plus the Funds of
Funds and the Sector categories. Finally, TASS defines 15 strategies.
An Ana ly s i s o f Hedge Fund Per fo rmance 1 9 8 4 - 2 0 0 0
11
4.2 Hedge Funds
We obtained hedge fund data from HFR and MAR. Both databases give monthly net-of-fee
individual returns and other information on individual funds and group them in indices. We
got 198 monthly returns on 1811 individual hedge funds plus 48 HFR indices (16 investment
styles with 3 indices for each investment style : onshore, offshore and a combined index) in
the HFR database and 2354 individual hedge funds plus 23 indices in the MAR database
between January 1984 and June 2000. Then, in each database, we removed funds that appear
twice in the same database8 and funds with quarterly returns. This gave us 1639 individual
hedge funds in the HFR database and 2014 hedge funds in the MAR database.
We further found 857 funds that were present in the two databases. When there was
differences in the start or ending date between the two databases, we chose the database
presenting more data.
This left us with a total of 2796 individual hedge funds. This is one of the greatest database
ever used in hedge funds performance studies. These funds include 1995 (71%) survived
funds and 801 (29%) dissolved funds.
4.3 Bias in Hedge Funds Data
Survivorship bias is an important issue in mutual funds performance studies (see Carhart and
al., 2000). In response to this concern, data vendors do backfill fund’s performance history
when a new fund is added to the database. This allows them to provide data that go back
beyond the start data of the database itself (usually 1993). Moreover, these providers do not
eliminate defunct funds and should normally not suffer from survivorship bias for the years
after the start of the databases9.
According to Ackermann et al. (1999) and to Fung and Hsieh (2000b), two upward biases
exist in the specific case of hedge funds because, since they are not allowed to advertise, they
consider inclusion in a database primarily as a marketing tool. The first one is called the self-
selection bias is present because funds that realize good performance have less incentive to
8This happened in three cases: when the same fund (same name, company, and returns) appeared twice in the database; when
the same fund (same name, and returns) appeared twice in the database with two different company names; and when the
same fund (same company, and returns) appeared twice in the database with two different fund names.9 Unfortunately, it is impossible to find information on defunct funds before the starting date of each database.
An Ana ly s i s o f Hedge Fund Per fo rmance 1 9 8 4 - 2 0 0 0
12
report their performance to data providers in order to attract new investors, because they might
be considered by the SEC as making illegal advertising. The second point called instant
history bias or backfilled bias (Fung and Hsieh 2000b) occurs because a fund’s performance
history is backfilled after inclusion. This may cause an upward bias because funds with a poor
track record are less likely to apply for inclusion than funds with good performance history.
Nevertheless, to avoid polemics, we take all funds (both living and dissolved) into account.
4.4 Risk-free Return and Market Performance
As underlined by Agarwal (2001), a fundamental challenge in a risk-adjusted analysis of
hedge funds is the identification of a meaningful benchmark. Fung and Hsieh (1997),
Schneeweis and Spurgin (1998) and Liang (1999) use style analysis based multi-factor
approach, while Brown et al. (1999) address this issue by employing a Generalized Stylistic
Classification (GSC) algorithm and grouping the managers on the basis of their realized
returns.
As market performance index in the estimation of the CAPM, we had to choose between the
value-weighted portfolio of all NYSE, Amex and Nasdaq stocks usually used in mutual funds
performance studies (see for example Fama and French, 1993, 1996, 2000; Carhart, 1997) and
the Russel 3000 used in Agarwal and Naik (2000) and Agarwal (2001) hedge funds studies. In
Table 1, we compared the descriptive statistics of the two proxies. The results clearly suggest
that both market proxies are in fact equivalent and that our results would not be influenced by
the market proxy chosen. We decided to take the value-weighted portfolio of all NYSE, Amex
and Nasdaq stocks market proxy. We took the one-month T-bill from Ibbotson Associates as
the risk-free rate.
Insert Table 1 approximately here
V Data analysis
5.1 Basic Performance
Before going in the heart of our work, panel A of Table 2 contains descriptive statistics of the
funds in our database. Given that MAR and HFR classify differently the individual hedge
funds, we combine the data for strategies that exist across both databases (sometimes under
An Ana ly s i s o f Hedge Fund Per fo rmance 1 9 8 4 - 2 0 0 0
13
different names) and we add the strategies or sub-strategies present in only one database10. We
contrast hedge funds data against the descriptive statistics of the market proxy, the MSCI
World excluding US, Fama and French’s (1993) SML and HML, Fama and French’s (1998)
international IHML, Carhart’s (1997) momentum factor, Lehman US aggregate bond index,
Salomon World government bond index, JP Morgan Emerging Market Bond Index, Lehman
BAA corporate bond index (default spread), and Goldman Sachs Commodity Index. These
statistics are reported in panel B of Table 2.
Insert Table 2 approximately here
Table 2 provides comparative statistics for the individual hedge funds in our database and for
11 passive investment strategies. For hedge funds strategies, we report the living and dead
funds.
Panel A of Table 2 shows that the highest mean return was achieved by the Long Only
Leveraged (2.68%) followed by the US Opportunistics Small Caps (2.31%) and by the Sector
(1.99%). Strategies that offer the lowest mean return are Foreign Exchange (0.73%), Short
Sellers (0.79%) and Market Neutral Convertible Arbitrage (0.98%), whereas the mean return
of the whole database is 1.49%. The results are the same for the mean excess returns.
When standard deviation is taken into account through the Sharpe measure (the ratio of excess
return and standard deviation), results are somewhat different. Funds offering the best trade-
off between risk and return are the Market Neutral Convertible Arbitrage (0.3971), followed
by the Event Driven without sub-strategy (0.3575) and the US Opportunistics Small Caps
(0.3393). The worse Sharpe ratio was obtained by the Short Sellers (0.0690), which were also
in the worst performing funds when risk was not taken into account.
A look at the t-stats indicates that mean returns are significantly different from 0 at the 1%
significance level for all funds and that the mean excess returns are significantly different
from 0 at the 1% level in all cases but the Short Sellers.
Panel B of Table 2 shows that the mean excess return of the Market Proxy is 0.88% per month
(about 12% per year) and statistically different from zero. The mean excess premium of the
MSCI World excluding US is an insignificant 0.45% per month. The average SMB and HML
returns are insignificant, unlike the results obtained by Fama and French (1993) and Carhart
10 The description of these strategies is available upon request.
An Ana ly s i s o f Hedge Fund Per fo rmance 1 9 8 4 - 2 0 0 0
14
(1997)11. The international HML and the momentum factor give more interesting values. They
respectively produced an average premium of 0.41% and 1.14% per month, economically as
well as statistically significant. The highest mean return was obtained by the Market Proxy for
the equity, and by the JP Morgan Emerging Market Bond Index for the bond. The Sharpe
ratios bring the same results, with the only difference that Salomon Government Bond Index
(0.1811) and Lehman BAA Corporate (0.2357) have a Sharpe ratio very close to the one
obtained by the JP Morgan Emerging Market Bond Index (0.207).
The Sharpe ratio obtained by our whole hedge fund database (0.2054) is very close to the one
for the Market Proxy (0.2050), and higher than for the MSCI World Excluding US (0.1005).
5.2 Correlation
Fung and Hsieh (1997), Schneeweis and Spurgin (1997), Liang (1999) and Amin and Kat
(2001) report a weak correlation between hedge funds and other financial securities. Hence,
the addition of hedge funds to a traditional portfolio could in principle improve its risk-return
trade-off.
Table 3 reports correlation coefficients among and between hedge funds strategies defined in
Table 2 and passive investment strategies.
Insert Table 3 approximately here
Panel A contains the correlation among hedge funds strategies. There is a high variability
between different strategies, ranging from 0.96 (between Equity non-Hedge and US
Opportunistics) to –0.79 (between Short Selling and US Opportunistics. 42 correlation
coefficients (40%) are greater than 0.80 and 14 (13%) are negative. In particular, Short Sellers
are negatively correlated with all the other hedge fund strategies.
Panel B reports correlations (coefficients) between hedge funds and equity, bond and
commodity indices. The range is narrower than in the previous case (from –0.65 to 0.87).
Correlation coefficients between hedge funds strategies and the Market Proxy are, in almost
all cases, greater than 0.5 whereas they are always smaller than 0.3 with the MSCI World
excluding US and than 0.5 with bond indices. These results confirm that hedge funds
strategies are weakly correlated with traditional investment tools12.
11 The differences in SMB and HML can be explained by the different periods covered by our studies. Their high variance
suggests a very unstable behavior.
12 Except with the market proxy, but this result can easily be understood since the market proxy contains almost all the
American market.
An Ana ly s i s o f Hedge Fund Per fo rmance 1 9 8 4 - 2 0 0 0
15
Panel C displays correlations among Passive Investment strategies. All coefficients are below
0.46 and 93% are below 0.3, too low to raise serious multicolinearity concerns.
5.3 Survivorship bias
Survivorship bias has received considerable attention in the academic literature. Two
definition of this bias are commonly used in studies: the performance difference between
surviving funds and dissolved funds (e.g. Ackermann et al., 1999) and the performance
difference between living funds and all funds (e.g. Liang, 2000). We report the bias using both
definitions for the whole period and for 2 sub-periods 1984-1994 and 1994-2000, the turning
point corresponding to the moment when data vendors started collecting dead funds.
Insert Table 4 approximately here
In Panel A of Table 4, we report a monthly survivorship bias of 0.30% (or 3.60% per annum)
for the whole period using the first formula and in Panel B a bias of 0.07% per month (0.9%
per annum) using the second formula. A look at subperiod biases indicates, as expected, that
survivorship bias is much higher after 1994, supporting the hypothesis that data vendors
collect data on dead funds after 1994.
The value reported using the second definition for period 1994-2000 (1.2%) is very close to
the percentage of 1.5% from Fung and Hsieh (1998). It is however lower than the 0.30%
monthly bias found by Fung and Hsieh (2000b), the 3% bias found by Liang (2001) and the
industry consensus bias of 3% stressed by Amin and Kat (2001)13.
These biases indicate that poor performance could be the main reason for disappearance. In
Figure 1, we plot returns of the dissolved funds in our database over the 24-month period
before their exit dates. It shows a declining return pattern towards the date of exit, indicating
inferior performance on average: it corresponds to a decrease of the mean return of almost
3.5% in two years.
Insert Figure 1 approximately here
5.4 Instant Return History Bias
When new funds are added into a database, historical returns are backfilled. This corresponds
to a demand by fund managers who market themselves if they have good track records, i.e.
13 We find this consensus value quite high when compared to the 0.8-1.5 bias reported by Malkiel (1995) and Brown and
Goetzmann (1995) for US mutual funds.
An Ana ly s i s o f Hedge Fund Per fo rmance 1 9 8 4 - 2 0 0 0
16
after compiling good performance. Fung and Hsieh (2000b) estimate this bias using a 12
month incubation period. They found a 1.4% per year difference in returns for the 1994-1998
period.
Following Park (1995), Brown et al. (1997) and Fung and Hsieh (2000b), we estimate this
bias for our hedge fund database in two steps. On the one hand, we estimate the average
monthly return using the portfolio which invests in all funds from our database each month
(we called this portfolio the observable one). On the other, we estimate the average monthly
return from investing in all these funds after deleting the first 12, 24, 36 and 60 months of
returns (we called this portfolio the adjusted observable one). The bias is estimated for the
whole period and splitting the time period in two in order to compare our results with those
obtained by Fung and Hsieh (2000b). Results are reported in Table 5.
Insert Table 5 approximately here
For the 1/84-6/00 period, the observable monthly return averaged 1.49%, while the adjusted
observable one was 1.42% (when deleting the 12 first months), 1.26% (24 months), 1.20% (36
months), and 1.15% (36 months). This gives an estimate of approximately 0.9% per year,
lower than the 1.4% found by Fung and Hsieh (2000b) for the instant history bias. For the
1/94-6/00 period, the bias of 1.2% per year is closer to the one of Fung and Hsieh (2000b).
The remaining difference can be explained by the difference in time period covered and in the
database used. Interestingly, our results indicates that the longer the estimation period, the
bigger the bias.
VI Hedge Funds Performance
The aim of this section is to determine whether or not hedge funds as a whole and depending
on the strategy followed have out-performed the market. We compute all estimations by using
Newey-West (1987) standard errors to adjust for any autocorrelation in the returns.
6.1 Performance Measurement using the CAPM
The first performance model used is the CAPM based single index model. Panel A of Table 6
reports the results for the strategies, sub-strategies and for the All Funds category. We use
equally weighted portfolio excess returns for each investment style and for the All Funds
An Ana ly s i s o f Hedge Fund Per fo rmance 1 9 8 4 - 2 0 0 0
17
category, and we estimate the model for each fund individually14. The last columns give the
distribution of individually estimated alphas per strategy, with the percentage of significantly
positive, insignificant and negative alphas at the 5% level. This approach enables us to
analyze hedge funds performance in more details.
Insert Table 6 approximately here
The betas estimated in Panel A are rather low, except for the US Opportunistics Growth and
the Long only Leveraged, suggesting that it is necessary to use a more detailed model. Overall,
two thirds of the strategies produce significantly positive alphas. The All funds category also
significantly out-performed the market at the 1% level. In almost all out-performing strategies,
more than 30% of the alphas are significantly positive. Surprisingly, for some strategies (e.g.
Equity non-Hedge or the Non Classified funds), more than 80% of the individual funds do not
significantly out-perform the market, inducing that the best funds must have obtained
extremely high returns.
For the remaining strategies, some individual funds also significantly under-perform the
market (4% for Emerging and 2% for Funds of Funds)15. Some arguments may partly explain
poor performance: the occurrence of a few significant financial crises in our sample period
(the Exchange Rate Market crisis in 1992, the bond market turbulence in 1994, the emerging
markets crisis in 1997 and the Russian default) and the double fee structure of the Funds of
Funds strategy that lowers their net returns.
6.2 Performance Measurement using Multi-Factor Models
It is presumably better to use a multi-factor model to account for all possible investment
strategies. In Panel B of Table 6, we report the results for the Carhart’s 4-factor model and in
Panel C the results for our combined model applied to hedge funds16.
14 To make individual estimation, we require all funds to have consecutive monthly return history for at least 24 months, so
that relatively accurate risk measures can be estimated. The next to last column reports the number of funds in each strategy
for which an individual estimation could be done.
15 For the Foreign Exchange strategy, 33% of the funds significantly under-perform the market, but there were only 9 funds
in this strategy. This lead us not to insists on them given that these results are not so stable to variation in time period.
16 We also estimated the Fama and French (1993) model but since we obtained very similar results to those obtained with the
Carhart model, we do not report them here.

An Ana ly s i s o f Hedge Fund Per fo rmance 1 9 8 4 - 2 0 0 0
18
Panel B and C reveal that the premium on the SMB factor is, in almost all cases, significantly
positive. However, in the Short Sellers strategy, the premium is significantly negative. Panel C
shows that the HML (respectively IHML) factor seems to add less explanatory power as only
one fourth (respectively one seventh) of the factors is significantly positive at the 5% level.
The momentum factor does not prove to be a strong indicator of hedge funds behavior. Only 4
out of 28 investment styles exhibit significant momentum loadings (at the 5% level).
Moreover, the sign of the coefficients is in 3 cases negative, indicating momentum contrarian
strategies.
Panel C also indicates that the World excluding US, the US Bond and the Default factors are
in almost all cases not significant. The World Government Bond and the Commodity factor
add explanatory power only in few cases. The Emerging Bond factor adds explanatory power
in 12 of the strategies and sub-strategies. It is significant (at the 5% level) in almost half of the
strategies. Moreover, this factor is significant at the 1% level for the All Funds category.
These results provide some insight into the preferences of hedge funds managers depending
on the strategy followed :
§ Almost all managers seem to prefer smaller stocks;
§ Most Event Driven and US Opportunistics managers prefer stocks with high book-to-
market ratios;
§ Some Market Neutral managers follow a momentum strategy and others are momentum
contrarian;
§ One half of the managers invest in emerging bond markets.
These results are close to those found by Mitchell and Pulvino (2000) and Agarwal (2001) for
the funds following Event Driven strategies. We find that 30% of the hedge funds show
significant excess return, nearly matching the 27% they found. This independently confirms
that our approach is able to capture important risk exposure of hedge funds.
Carhart (1997) and Gruber (1996) examine US mutual fund strategies and report that
managers prefer smaller stocks as well as growth stocks. The first evidence is consistent with
our finding, while the second one is opposite. However, this difference does not exist for all
hedge funds managers, given that the HML factor is only significant for some strategies.
Comparing the alpha distribution of Panels B and C shows that, taking more factors into
account, fewer individual funds significantly out-performed the market, and more funds have
insignificant or negative excess returns.
An Ana ly s i s o f Hedge Fund Per fo rmance 1 9 8 4 - 2 0 0 0
19
Evidence on alphas obtained in Panel C is contrasted. The Market Neutral and US
Opportunistics strategies give significant positive excess returns, contrarily to the Event
Driven and Global strategies. Global Macro, Short Sellers, Market Timing, Equity non-Hedge,
Foreign Exchange, Sector, the Non Classified funds and the All Funds category have all
significant positive alphas. Finally, as with the single index model, Long only Leveraged
funds and Funds of Funds do not significantly out-perform the market. We observe negative
(but not significant) alpha’s only for the Event Driven no Sub-strategy funds. Our results are
in most cases confirmed by the last column. In the All Funds category, for example, more than
30% of the individual alpha’s are significantly positive at the 5% level.
Considering the All Funds category, we can observe that hedge funds as a whole :
§ Deliver significant excess returns (one fourth of the individual funds gave significant
positive excess return) ;
§ Seem to prefer smaller stocks ;
§ Invest in Emerging Market Bonds.
Overall it seems that the combined model does a good job in describing hedge funds behavior.
The average R²adj increases from 0.35 for the single factor model, to 0.44 for the 4-factor
model and to 0.60 for our combined model. The combined model seems particularly adapted
to Event Driven (0.78), Global Macro (0.82), US Opportunistics (0.92), Equity non-Hedge
(0.91) and Sector (0.80) funds. The R²adj for the All Funds category increases from 0.66 for
the single factor model, to 0.78 for the 4-factor model and to 0.83 for our combined model.
The mean R²adj for the individual hedge funds estimation is up too. Carhart’s (1997) model
raises the R²adj by an average 10% over the single index model, but our combined model
increases it again by another 6%. For the All Funds category, the increase from the CAPM to
Carhart’s model is 10% and from Carhart’s model to our combined model is another 7%17.
Our R²adj are also higher than those obtained by Brown et al. (1997) and Fung and Hsieh
(1997). They report R² lower than 0.20 in all cases for groups of funds. Schneeweis and
Spurgin (1997) report R²adj between -0.09 and 0.67 with a mean of 0.31 for several hedge
funds strategies. Comparing their results with ours for strategies that exist across the two
databases, we get greater R²adj in all cases. For several HFR strategies, Liang (1999) found
unadjusted coefficients ranging from 0.23 to 0.77, with an average of 0.49: taking the same
strategies, our R²adj range between 0.27 and 0.88 with an average of 0.60.
17 Individual results are not reported, but are available upon request.
An Ana ly s i s o f Hedge Fund Per fo rmance 1 9 8 4 - 2 0 0 0
20
6.3 Performance over Shorter Periods
In the previous sub-section, we analyze the performance of hedge funds for the 1/84-6/00
period. In order to better interpret these results, Table 7 presents a summary of the same
analysis over different sub-periods. We subdivide the whole period in two and four sub-
periods, and then report results of the same analysis for the Asian crisis period. The analysis
of the Asian crisis period will enable us to determine if some strategies took advantage of the
crisis and which one suffered (or not) from it.
Insert Table 7 approximately here
Columns 2 and 3 of Table 7 confirm that the same strategies significantly out-perform the
market when the time period is broken in two sub-periods, with 4 exceptions. Three strategies
(Short Sellers, Market Timing, and Equity non-Hedge) do not beat the market in the first sub-
period but do in the second, while one (Foreign Exchange) does not out-perform the market
during the second, but does in the first. The four strategies that do not beat the market over the
whole period do not do it either for any sub-period, except for the Funds of Funds that
significantly out-performed the market during the first sub-period.
When the time period is divided into four, it is interesting to note that some hedge funds
strategies and sub-strategies significantly under-perform the market in the last sub-period.
A closer look at the last two columns of Table 7 suggests that most hedge funds strategies
suffered during the 1997-98 period. The last column indicates that 19 strategies and sub-
strategies out of the 29 face negative returns, with five being significant (Global, Global
International, Global Emerging, Market Neutral Fixed Income and Funds of Funds). Only 5
strategies had significant positive returns during the 1/97-6/98 period (Market Neutral
Long/Short, Convertible Arbitrage, Non Classified funds, Relative Value Arbitrage and
Foreign Exchange), but only the first three had also significant excess returns during other
sub-periods. According to these results, the only sub-strategies that could have significantly
benefit from the Asian crisis are the Relative Value Arbitrage and the Foreign Exchange. But
one must be cautious because of the short estimation period that could put statistical bias in
these results.
Four sub-strategies (Global International, Global Emerging, Equity non-Hedge and Funds of
Funds) out-perform significantly the market over a long period of time, but they also
significantly under-perform over shorter ones. Moreover, the subdivision in sub-periods
An Ana ly s i s o f Hedge Fund Per fo rmance 1 9 8 4 - 2 0 0 0
21
indicates that over-performance is rarely sustainable over every shorter periods of time: only
two strategies (Market Neutral Convertible Arbitrage and the Non Classified funds) out-
performed the market in the 8 subperiods we considered.
6.4 Comparison with other Studies
Schneeweis and Spurgin (1997) and Liang (1999) find different results from Tables 6 and 7,
but they are mainly due to differences in the period studied and to a smaller number of funds
in their database18. Agarwal and Naik (2000) find the same results as ours except that Fixed
Income, Risk Arbitrage and Long only Leveraged strategies significantly under-performed the
market on average, while we found only small percentages of under-performing funds.
Finally, Agarwal (2001) found results close to ours.
VII Persistence in Performance
Our results show significant evidence of superior performance over long period of time for
most individual strategies and sub-strategies and for our hedge funds database as a whole.
Nevertheless, the results are not stable over shorter period of time, neither for hedge funds as a
whole, nor for individual hedge funds. Active hedge funds selection strategies could increase
the expected return on a portfolio if hedge fund performance is really predictable. The
hypothesis that hedge funds with an above average return in this period will also have an
above average return in the next period is called the hypothesis of persistence in performance.
Sirri and Tufano (1998) and Zheng (1999) have stressed the importance of persistence
analysis in mutual funds. The former document large inflows of money into last years best
performers, and withdrawals from last years losers. The latter finds that newly invested money
in these best performing mutual funds is a predictor of future fund performance.
7.1 Persistence in One-year Return-Sorted Hedge Funds Portfolios
We follow the methodology of Carhart (1997) using our combined model. All funds are
ranked based on their previous year return. Every January, we put all funds into 10 equally
18 Liang (1999) for example found non significantly positive excess return for the Convertible Arbitrage, Foreign Exchange,
Funds of Funds, Market Timing, Sector and Short Selling strategies but found that Growth and Market Neutral strategies
significantly under-performed the market.
An Ana ly s i s o f Hedge Fund Per fo rmance 1 9 8 4 - 2 0 0 0
22
weighted portfolios, ordered from highest to lowest past returns. Portfolios 1 (High) and 10
(Low) are then further subdivided on the same measure. The portfolios are held till the
following January and then rebalanced again. This yields a time series of monthly returns on
each decile portfolio from 1/85 to 6/00. Funds that disappear during the course of the year are
included in the equal-weighted average until they disappear, then portfolio weights are
readjusted appropriately.
The monthly average (respectively maximum and minimum) return to the strategy of investing
in portfolio 1 would have been 2.02% (resp. 21.99% and –14.74%) for the 1/85-6/00 period.
This is 0.57% higher than the 1.45% (resp. 12.81% and 22.43%) average return earned by the
Russel 3000 and 0.99% higher than the 1.03% (resp. 12.69 and –18.72%) return earned on the
MSCI World Index. Conversely, the monthly (resp. the maximum and minimum) return to the
strategy that invested in the lowest decile would have been 1.45% (resp. 12.84% and –
17.74%) over the same period.
Insert Table 8 approximately here
Table 8 reports the results of our calculations. The monthly excess returns on the decile
portfolios decrease monotonically between portfolio D1 and D7, but then increases again until
portfolio D10. Monthly excess return of portfolio D4 is nearly the same as the one of the last
portfolio. The annualized spread is approximately 7% between portfolio D1 and D10. This
spread is significant, indicating that without considering risk or other additional factors, there
is a significant difference in returns between portfolio D1 and D10. Portfolio D1a contains 35
funds on average and significantly out-performs portfolio 10c by 0.95% per month. Cross-
sectional variation in returns is considerably larger among previous year’s best performing
funds than previous year’s worst funds. The subportfolios of the bottom decile show a modest
spread of 22 basis point (0.86 to 1.08), whereas the spread in the top decile is a substantial 74
basis point (2.03 to 1.29). 1-2 spread is significant at the 5% level, indicating big differences
between top performing funds and other portfolio funds, but the 1-2 spread alpha is not
significant, suggesting no persistence. After controlling for the risk factors, the great part of
the spread between high and low portfolios disappear. The 1-10 spread goes from a
significantly positive 0.58% spread to a non-significant 0.07% one, the 1a and 10c spread
decreases from 0.95 (significant) to –0.06% (non significant), and the 1-2 spread reduces from
0.38% significantly positive to a 0.20% non significant spread.
An Ana ly s i s o f Hedge Fund Per fo rmance 1 9 8 4 - 2 0 0 0
23
Column 7 suggests that all deciles portfolios (except the last) prefer small stocks. More
important, however, is the pronounced pattern in the funds’ HML, PR1YR and Emerging
Market Bond coefficients (Emerg Bd). First, portfolio D3 to D7 prefer stocks with high book-
to-market ratios, whereas portfolios D1, D9 and D10 prefer (but not significantly) those with
low book-to-market. Second, returns of the top decile funds are strongly, positively correlated
with the one-year momentum factor, while returns in the other deciles are not. Third, the
returns of the D4 to D10 deciles are strongly, positively related with the Emerging Market
Bond factor. This could explain why the monthly excess return diminishes after decile D3.
Thus, the different financial crisis covered by our time period may explain why funds
investing in Emerging market Bond are not in the 3 best performing decile portfolio.
Column 4 suggests that funds in top and bottom portfolios do not significantly over- or under-
perform the market, with no persistence in returns. This means that these funds are there more
by chance or misfortune, rather than by their abilities. Moreover, the standard deviation of top
and bottom deciles are the greatest of all, indicating more volatility in returns. Things are
different for the funds in the middle deciles. Managers in these portfolios are more likely to
stay in these deciles over time, and that these managers beat the market significantly. This
suggests that, even if some hedge funds managers take a lot of risk, which lead them to have
very high or low returns for short period of time, most managers follow less risky strategies
that allow them to out-perform the market for long period of time.
To summarize, Table 8 leads to the following conclusions :
§ Best performing funds follow momentum strategies whereas worst performing ones may
follow momentum contrarian strategies19 ;
§ Best performing funds do not invest significantly in Emerging Market Bond ;
§ Average return funds prefer high book-to-market stocks, whereas best and worst
performing ones may prefer low book-to-market ones ;
§ No persistence in performance exists for best and worst performing funds, but persistence
exists for middle decile funds. Funds in these strategies significantly beat the market and
there is a proof of persistence for these funds.
19 This result confirms those of the previous section when we found that some hedge funds strategies follow momentum
strategies and other follow momentum contrarian ones.
An Ana ly s i s o f Hedge Fund Per fo rmance 1 9 8 4 - 2 0 0 0
24
7.2 Persistence over Shorter Period
In Table 9, we report estimations dividing our sample period in two sub-periods, considering
that the first sub-period does not contain any dissolved funds. In the 1985-1993 sub-period,
the first 7 deciles give significantly positive alphas, whereas only funds in decile D9 do in the
second sub-period. This suggests that our results over the whole 1985-2000 period are mainly
induced by the first part of this period. There is no proof of persistence in returns for the 1994-
2000 period. Moreover, the fact that the second sub-period contains dissolved funds may
explain why most deciles that significantly out-perform the market over the first sub-period do
not over the second20. The positive HML and Emerging Market Bond factor relations are
stronger over the second sub-period, while it is stronger over the first sub-period for the
momentum factor.
The same analysis for the Asian crisis period21 shows that top performing funds of 1996 had
significantly lower returns in 1997. The alphas of decile D1 and the 1a-10c spread were
significantly negative indicating that the best performing funds (of 1996) significantly under-
performed the worst performing funds (of 1996), in 1997. These results confirm our previous
conclusion that funds in the first decile have no persistence in returns, and that there have
more volatile returns than funds in lowest decile. In the 1/97-6/98 analysis, all decile’s alpha
were negative, with 5 of them significantly, but decile 1a was the only (sub)decile with
positive (but not significant) alpha. This indicates that some funds were not affected by the
crisis, probably because their investment strategies were relatively immune to it.
7.3 Total Returns
We repeated the analysis by ordering funds on the basis of their total return from previous
year, instead of mean returns. The analysis of the 1985-93 period shows an interesting
difference with all our previous results of this section. For the first time, the 1a-10c spread in
alpha is significantly positive. This indicates that, when we base our estimations on total
returns, and even after adjusting for all risk factors, there is a significant positive difference
20 But one must be cautious with this result, given that this is not the only reason possible. The Bond crisis in 1994, the Asian
crisis in 1997-1998, etc. may also explain these differences.
21 Numerical results are available upon request.
An Ana ly s i s o f Hedge Fund Per fo rmance 1 9 8 4 - 2 0 0 0
25
between the top thirtieth and bottom thirtieth funds for this period. There is also a proof of
persistence in returns for the best performing funds22.
7.4 Dissolution Frequencies
Figure 2 shows a histogram of hedge funds dissolution frequencies in one year as a function of
the previous year mean return decile. At the beginning of each year, all hedge funds are placed
into decile rankings by their mean returns in the previous year. If a hedge fund ceases
reporting returns at any time before the end of the year, then this is counted as dissolved.
Insert Figure 2 approximately here
Top 7 deciles have a more or less constant average rate of dissolution of 7%, it is 12.5% for
the bottom 3 deciles. This suggests that bad performance may be a major factor for
dissolution, but that very good performance is not a protection against it. This result is
consistent the previous finding that there was no persistence in the best performing funds, but
that persistence exists in the middle decile one.
7.5 One-Year Persistence for Hedge Fund Strategies
This subsection focuses on the persistence in returns for some hedge funds strategies. We
considered 2 strategies with more than 300 funds: Global Macro and Market Neutral. In
section VI we found that they significantly out-performed the market for the 1/84-6/00 period.
In this sub-section, we determine whether persistence in returns exists for these strategies. We
test it for the whole period23, for 2 sub-periods (before and after 1994), and for the Asian crisis
period (1996-97 and 1997-6/98). We classified funds in 10 decile portfolios. For added
details, we subdivided the top and bottom decile in 3 for the Market Neutral strategy. Table 10
reports a summary of our results for these strategies.
Insert Table 10 approximately here
Panel A reports the results of the analysis for Macro funds. They show that there is no
significant difference between good and bad performing funds. Most of the alphas obtained
are significantly positive for the whole period. This suggests that persistence exist for these
funds, at least over the whole 1987-2000 period. The 1996-97 Asian crisis sub-periods show
that some funds (decile D3) have persistence in their return despite the Asian crisis. This
22 These results are available upon request.
23 In order to have enough funds to divide our hedge fund sample in portfolios, we began in 1987 for Macro funds.
An Ana ly s i s o f Hedge Fund Per fo rmance 1 9 8 4 - 2 0 0 0
26
could either mean that these funds returns were not affected by the crisis, or that they benefit
from it. The second hypothesis is more plausible given that we are analyzing Macro funds that
per definition anticipate market movements.
Panel B shows the results for the Market Neutral funds. Their are very close to those obtained
for the whole hedge funds database in Table 8 (recall that the Market Neutral strategy
represents 712 funds, that is 25% of our whole hedge funds database). The only significantly
positive alphas are those from the middle deciles24 (for the whole period), and those of the top
decile (for the 1985-93 sub-period). Monthly excess return’s, 1-10 and 1a-10c spreads are
both significant in most of the period considered, but this difference disappear when we take
our different factors into account. The only significant spread in alpha is the one from the 97-
6/98 period. This indicates that significantly positive difference existed between best and
worst performing funds during the Asian crisis period.
As an illustration, Panel C reports Market Neutral’s spread decomposition for each of the sub-
period considered. There are some interesting differences between these numbers and those
obtained for our whole hedge funds database (see Table 8). Five factors have a significant
effect on spreads for the Market Neutral funds, without having significant effect on the
spreads in the all funds analysis: HML (positive) IHML and Commodity (negative), and Wd
Gvt Bd and Default (positive or negative, depending on the period). This indicates that the
results obtained for our whole hedge funds database may not be valid for one specific strategy
of funds, but that it is more an average result.
VIII Conclusion
Using one of the greatest hedge fund database ever used (2796 individual funds including 801
dissolved), we investigated hedge funds performance using various asset-pricing models
including an extension form of Carhart’s (1997) model, combined with Fama and French
(1998), Agarwal and Naik (2000) models and an additional factor that take into account the
fact that hedge funds may invest in Emerging Markets. Our results lead to the following
comments.
First, we demonstrated that our combined model is able to explain a significant proportion of
the variation in hedge fund returns over time. Compared to models used in other hedge fund
performance studies, our combined model does a better job describing hedge funds behavior.
24 Decile D9 has also a significant, and positive alpha, but only for the whole period.
An Ana ly s i s o f Hedge Fund Per fo rmance 1 9 8 4 - 2 0 0 0
27
It appears particularly good for the Event Driven, Global Macro, US Opportunistics, Equity
non-Hedge and Sector funds.
Second, our performance analysis shows that one fourth of individual hedge funds deliver
significant positive excess returns, that most of them seem to prefer smaller stocks, and that
many hedge funds invest in Emerging Market Bonds. Analyzing each strategy individually
lead to the additional conclusions that 9 out of 13 strategies offer significantly positive excess
return. A sub-period analysis showed that over-performance ability is, in most cases, constant
over time. But, according to our results, most funds suffered from the Asian crisis.
Third, the analysis of persistence in performance for our whole hedge funds database indicates
3 main findings that complete our results of the performance analysis. Firstly, best performing
funds follow momentum strategies whereas worst performing ones may follow momentum
contrarian one. Secondly, best performing funds do not significantly invest in Emerging
Market Bond, whereas lower decile funds do. Thirdly, average return funds prefer high book-
to-market stocks, whereas best and worst performing funds may prefer low book-to-market
ones. Our main conclusion from this evidence is that there is no persistence in performance
for best and worst performing funds, but persistence exists for middle decile funds. This
suggests that, even if some hedge funds managers take a lot of risk, which lead them to have
very high or low returns for short period of time, many hedge fund managers follow less risky
strategies, that allow them to out-perform the market for longer period of time. A sub-period
analysis indicates that the results obtained in the first part of the persistence analysis where
mainly induced by the first sub-period (before 1994). The Asian crisis analysis suggests that
top performing funds in the year before the crisis (1996) had significantly lower returns in the
first year of the crisis. Moreover, they significantly under-performed the worst performing
funds (of 1996) during the crisis period. The analysis of dissolution frequencies indicates, on
the one hand, that bad performance may be a major factor for dissolution, and on the other,
that very good performance is not a protection against dissolution.
Finally, we analyzed the persistence in returns for several hedge funds strategies. We showed
for strategies that significantly out-perform the market that there is a persistence in positive
excess returns, even if for the Market Neutral strategy, we found results very close to those
obtained for all hedge funds. A further analysis of the results for this strategy indicates,
however, that the differences in spread are not explained by the same factors for the whole
hedge fund database as for the Market Neutral strategy. This stresses that funds in different

An Ana ly s i s o f Hedge Fund Per fo rmance 1 9 8 4 - 2 0 0 0
28
strategy are not influenced by the same factors, and that specific models could be developed
for each investment style in the future.
All these results help in understanding the performance of hedge funds and the persistence in
this performance over different time period, including a study of the Asian crisis. The next
step in the development of model that describes hedge funds behavior, may be to include
Trading Strategy (option writing/buying) factors, in order to take into account the fact that
some hedge funds exhibit non-linear option-like exposures to standard asset-classes, as found
by Fung and Hsieh (1997, 2000a). As mentioned above, our combined model may also be
adapted to each hedge fund strategy.
An Ana ly s i s o f Hedge Fund Per fo rmance 1 9 8 4 - 2 0 0 0
29
References
Agarwal, V., 2001. Intertemporal variation in the performance of hedge funds employing a
contingent-claim-based benchmark. Working Paper, London School of Business.
Agarwal, V., Naik, N.Y., 1999. Multi-period performance persistence analysis of hedge funds.
Working Paper, London School of Business.
Agarwal, V., Naik, N.Y., 2000. Performance evaluation of hedge funds with option-based and
buy-and-hold strategies. Working Paper, London School of Business.
Ackermann, C., McEnally, R., Ravenscraft, D. 1999. The performance of hedge funds: Risk,
return, and incentives. Journal of Finance 54, 833-874.
Ackermann, C., Ravenscraft, D., 1998. The impact of regulatory restrictions on fund
performance: A comparative study of hedge funds and mutual funds. Working Paper,
University of Notre-Dame.
Allen, D. E., Soucik, V., 2000. In search of true performance : testing benchmark-model
validity in managed funds context. Working Paper, Edith Cowan University.
Amin, G.S., Kat, H.M., 2001. Hedge fund performance 1990-2000 : Do the ‘money machine’
really add value ?. Working Paper, ISMA Center, The University of Reading.
Bams, D., Otten, R., 2000. European mutual fund performance : A survey. Working Paper,
Maastricht University.
Banz, R.W., 1981. The relationship between returns and market value of common stocks.
Journal of Financial Economics 9, 3-18.
Basu, S., 1983. The relationship between earnings yield, market value, and return for NYSE
common stocks: Further evidence. Journal of Financial Economics 12, 129-156.
Bhetari, L.C., 1988. Debt/equity ratio and expected common stocks returns: Empirical
evidence. Journal of Finance 43, 507-528.
Breeden, D.T., 1979. An intertemporal asset pricing model with stochastic consumption and
investment opportunities. Journal of Financial Economics 7, 265-276.
Breeden, D.T., Gibbons, M.R., Litzenberger, R.H., 1989. Empirical tests of the consumption-
oriented CAPM. Journal of Finance 44, 231-296.
Brown, S.J., Goetzmann, W.N., 1995. Performance persistence. Journal of Finance 50, 679-
698.
Brown S.J., Goetzmann, W.N., Hiraki, T., Otsuki, T., Shiraishi, N., 1998. The Japanese open-
end fund puzzle, Working Paper.

An Ana ly s i s o f Hedge Fund Per fo rmance 1 9 8 4 - 2 0 0 0
30
Brown S.J., Goetzmann, W.N., Ibbotson, R.G., 1999. Offshore hedge funds: Survival and
performance 1989-1995. Journal of Business 72, 91-118.
Brown S.J., Goetzmann, W.N., Park, J., 1997. Conditions for survival: changing risk and the
performance of hedge fund managers and CTAs. Working Paper, Stern School of Business,
New York University.
Carhart, M.M., 1995. Survivor bias and mutual funds performance. Working Paper, School of
Business Administration, University of Southern California.
Carhart, M.M., 1997. On persistence in mutual fund performance. Journal of Finance 52, 57-
82.
Carhart, M.M., Carpenter, J.N., Lynch, A.W., Musto, D.K., 2000. Mutual fund survivorship,
SSRN Electronic Working Paper.
Chan, L.K., Jegadeesh, N., Lakonishok, J., 1996. Momentum strategies. Journal of Finance
51, 1681-1714.
Daniel, K., Grinblatt, M., Titman, S., Wermers, R., 1997. Measuring mutual fund
performance with characteristic-based Benchmark. Journal of Finance 7, 1035-1058.
Elton, E., Gruber, M., Das, S., Blake, C., 1996. The persistence of risk-adjusted mutual fund
performance. Journal of Business 69, 133-157.
Elton, E., Gruber, M., Das, S., Hlavka, M., 1993. Efficiency with costly information: A re-
interpretation of evidence from managed portfolios. Review of Financial Studies 6, 1-21.
Fama, E.F., French, K.R., 1992. The cross-section of expected returns. Journal of Finance 47,
427-465.
Fama, E.F., French, K.R., 1993. Common risk factors in the returns on stocks and bonds.
Journal of Financial Economics 33, 3-56.
Fama, E.F., French, K.R., 1996. Multifactor explanations of asset pricing anomalies. Journal
of Finance 51, 55-84.
Fama, E.F., French, K.R., 1998. Value versus growth : The international evidence. Journal of
Finance, 1975-1999.
Fama, E.F., French, K.R., 2000. Characteristics, covariances, and average returns : 1929-1997.
Journal of Finance 55, 389-406.
Fung, W., Hsieh, D.A., 1997, Empirical characteristics of dynamic trading strategies: The case
of hedge funds. Review of Financial Studies 10, 275-302.
An Ana ly s i s o f Hedge Fund Per fo rmance 1 9 8 4 - 2 0 0 0
31
Fung, W., Hsieh, D.A., 2000a. The risk of hedge funds strategies : Theory and evidence from
trend followers. Working Paper, Paradigm Financial Products International LLC, and Fuqua
School of Business, Duke University.
Fung, W., Hsieh, D.A., 2000b. Performance characteristics of hedge funds and commodity
funds: Natural vs spurious biases. Working Paper, Paradigm Financial Products International,
LLC, and Fuqua School of Business, Duke University.
Goetzmann, W.N., Ibbotson, R.G., 1994. Do winners repeat? Patterns in mutual performance.
Journal of Portfolio Management 20, 9-18.
Grinblatt, M., Titman, S., 1988. A comparison af measures of abnormal performance on a
sample of monthly mutual fund returns. Finance Working Paper, University of California, Los
Angeles.
Grinblatt, M., Titman, S., 1989. Mutual fund performance: An analysis of quarterly portfolio
holdings. Journal of Business 62, 393-416.
Grinblatt, M., Titman, S. 1992. The persistence of mutual fund performance. Journal of
Finance 42, 1977-1984.
Grinblatt, M., Titman, S., Wermers, R., 1995. Momentum investment strategies, portfolio
performance and herding: A study of mutual fund behaviour. American Economic Review 85.
Gruber, M. J., 1996. Another puzzle: the growth in actively managed mutual funds. Journal of
Finance 51, 783-810.
Hendricks, D., Patel, J., Zeckhauser, R., 1993. Hot hands in mutual Funds: Short-run
persistence of performance, 1974-88. Journal of Finance 48, 93-130.
Ippolito, R. A., 1989. Efficiency with costly information: A study of mutual fund
performance. Quarterly Journal of Economics 104, 1-24.
Jegadeesh, N., Titman, S., 1993. Returns to buying winners and selling losers: Implications
for stock market efficiency. Journal of Finance 48, 93-130.
Jensen, M.C., 1968. The performance of mutual funds in the period 1945-1964. Journal of
Finance 23, 389-416.
Jensen, M.C., 1969. Risk, the pricing of capital assets and evaluation of investment
portfolios.- Journal of Business 42, 167-247.
Kothari, S.P., Warner, J.B., 1998. Evaluating mutual fund performance. Working Paper,
Massachusetts Institute of Technology and Simon School, University of Rochester.
An Ana ly s i s o f Hedge Fund Per fo rmance 1 9 8 4 - 2 0 0 0
32
Lehmann, B.N., Modest, D.M., 1987. Mutual fund performance Evaluation: A comparison of
benchmarks and benchmarks comparisons. Journal of Finance 42, 233-245.
Liang, B., 1999. On the performance of hedge funds. Financial Analysts Journal, 72-85.
Liang, B., 2000. Hedge funds : The living and the dead. Journal of Financial and Quantitative
Analysis 35, 309-325.
Liang, B., 2001. Hedge funds performance : 1990-1999. Financial Analysts Journal.
January/February, 11-18.
Lintner, J., 1965. The valuation of risk assets and the selection of risky investments in stock
portfolio and capital budgets. Review of Economics and Statistics 47, 13-37.
Litzenberger R. and Ramaswamy, K., 1979. The effects of personal taxes and dividends on
capital asset prices : Theory and empirical evidence. Journal of Financial Economics 7, 163-
195.
Litzenberger R. and Ramaswamy, K., 1982. The effects of dividends on common stocks
returns : Tax effects or information's effects ?. Journal of Finance 37, 429-443.
Malkiel, B.G., 1995. Returns from investing in equity mutual funds 1971 to 1991. Journal of
Finance 50, 549-572.
Metrick E., 1998. Performance evaluation with transactions Data : The stock selection of
investment newsletters. NBER Working Paper Nr.6648.
Mitchell, M., Pulvino, T., 2000. Characteristics of risk and return in risk arbitrage. Working
Paper, Harvard Business School, and Northwestern University.
Newey, W., West, K., 1987. A simple positive-definite heteroskedasticity and autocorrelation
consistent covariance matrix. Econometrica 55, 703-708.
Park, J., 1995. Managed futures as an investment set. Ph.D. Dissertation, Columbia
University.
Reinganum, M.R., 1981. A new empirical perspective on the CAPM. Journal of Financial and
Quantitative Analysis 16, 439-462.
Rosenberg, B., Reid, K. Lanstein, R., 1985. Persuasive evidence of market inefficiency.
Journal of Portfolio Management 11, 9-17.
Schneeweis, T., Spurgin, R., 1997. Managed futures, hedge funds and mutual fund return
estimation: A Multi-factor approach. CISDM Working Paper.
Schneeweis, T., Spurgin, R., 1998. Multifactor analysis of hedge funds, managed futures and
mutual fund return and risk characteristics. Journal of Alternative Investments 1, 1-24.
An Ana ly s i s o f Hedge Fund Per fo rmance 1 9 8 4 - 2 0 0 0
33
Sharpe, W.F., 1964. Capital asset prices: A theory of market equilibrium under conditions of
risk. Journal of Finance 19, 425-442.
Sharpe, W.F., 1992. Asset allocation: Management style and performance measurement.
Journal of Portfolio Management 18, 7-19.
Sirri, E.R., Tufano, P., 1998. Costly search and mutual fund flows. Journal of Finance 53,
1589-1622.
Wermers, R., 1996. Momentum investment strategies of mutual funds, performance
persistence, and survivorship bias. Working paper, Graduate School of Business and
Administration, University of Colorado.
Zheng, L., 1999. Is money smart? A study of mutual fund Investor’ fund selection ability.
Journal of Finance 54, 901-933.
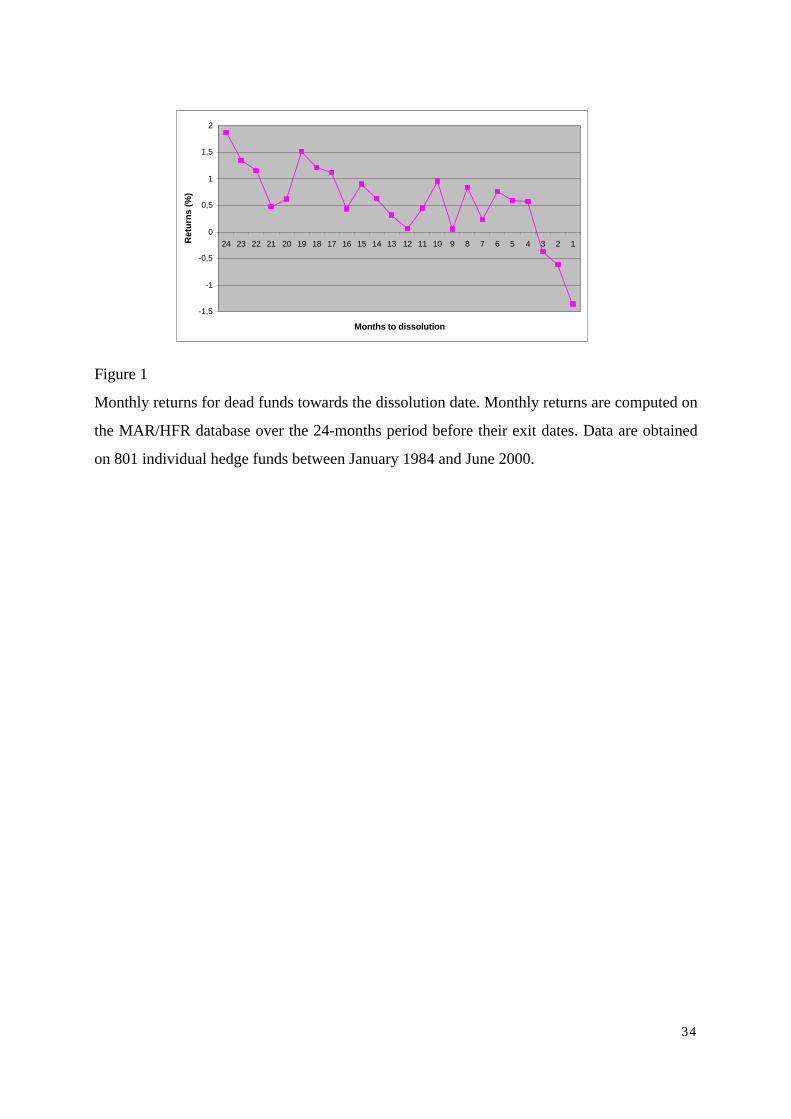
34
Figure 1
Monthly returns for dead funds towards the dissolution date. Monthly returns are computed on
the MAR/HFR database over the 24-months period before their exit dates. Data are obtained
on 801 individual hedge funds between January 1984 and June 2000.
-1,5
-1
-0,5
0
0,5
1
1,5
2
24 23 22 21 20 19 18 17 16 15 14 13 12 11 10 9 8 7 6 5 4 3 2 1
Months to dissolution
Ret
urn
s (%
)
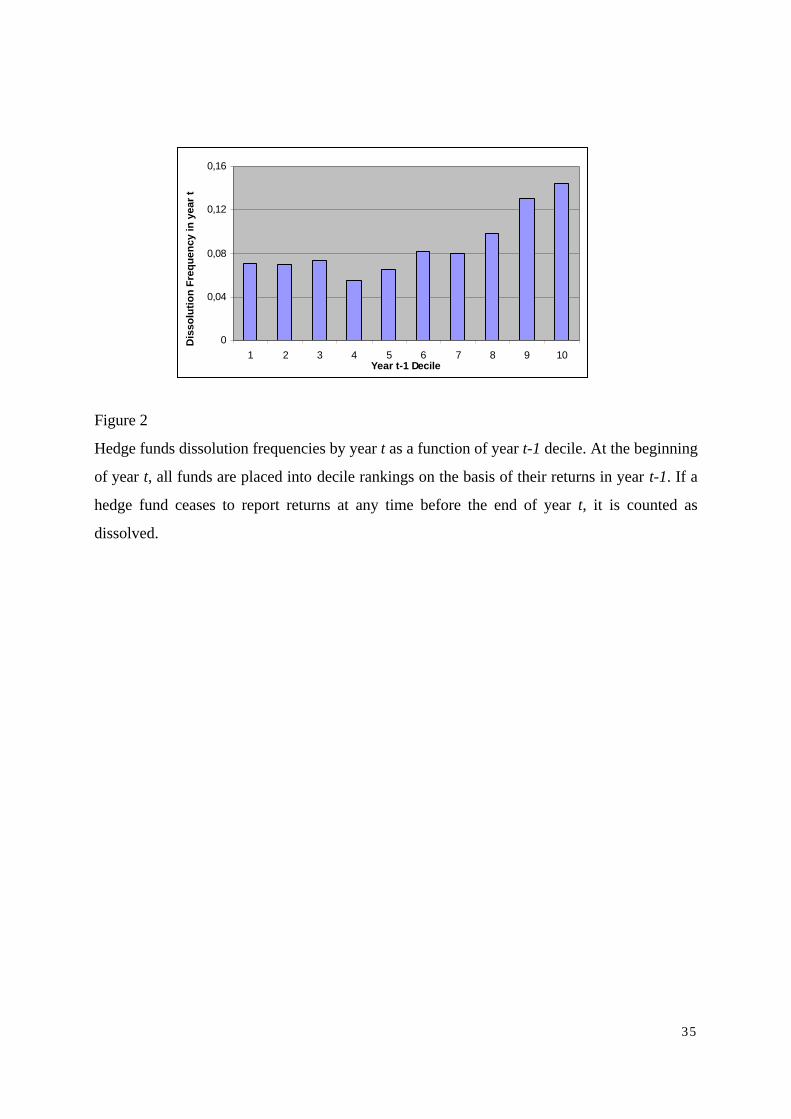
35
Figure 2
Hedge funds dissolution frequencies by year t as a function of year t-1 decile. At the beginning
of year t, all funds are placed into decile rankings on the basis of their returns in year t-1. If a
hedge fund ceases to report returns at any time before the end of year t, it is counted as
dissolved.
0
0,04
0,08
0,12
0,16
1 2 3 4 5 6 7 8 9 10Year t-1 Decile
Dis
solu
tio
n F
req
uen
cy in
yea
r t
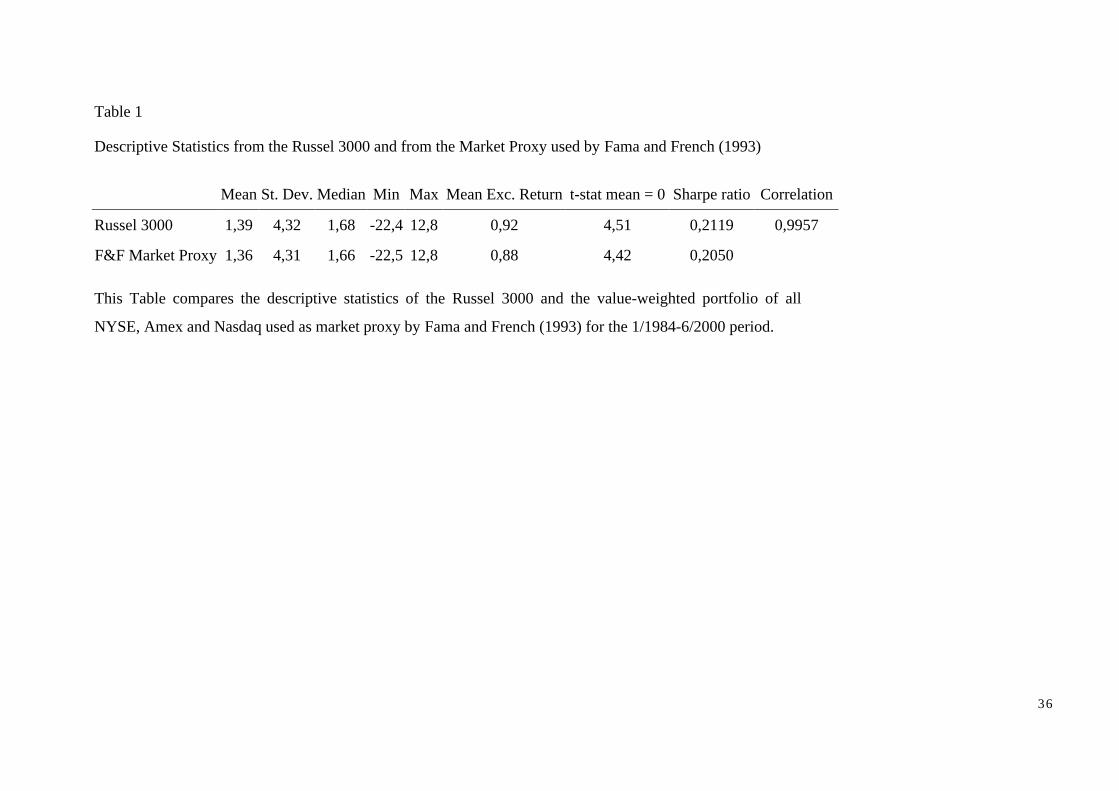
36
Table 1
Descriptive Statistics from the Russel 3000 and from the Market Proxy used by Fama and French (1993)
Mean St. Dev. Median Min Max Mean Exc. Return t-stat mean = 0 Sharpe ratio Correlation
Russel 3000 1,39 4,32 1,68 -22,4 12,8 0,92 4,51 0,2119 0,9957
F&F Market Proxy 1,36 4,31 1,66 -22,5 12,8 0,88 4,42 0,2050
This Table compares the descriptive statistics of the Russel 3000 and the value-weighted portfolio of all
NYSE, Amex and Nasdaq used as market proxy by Fama and French (1993) for the 1/1984-6/2000 period.
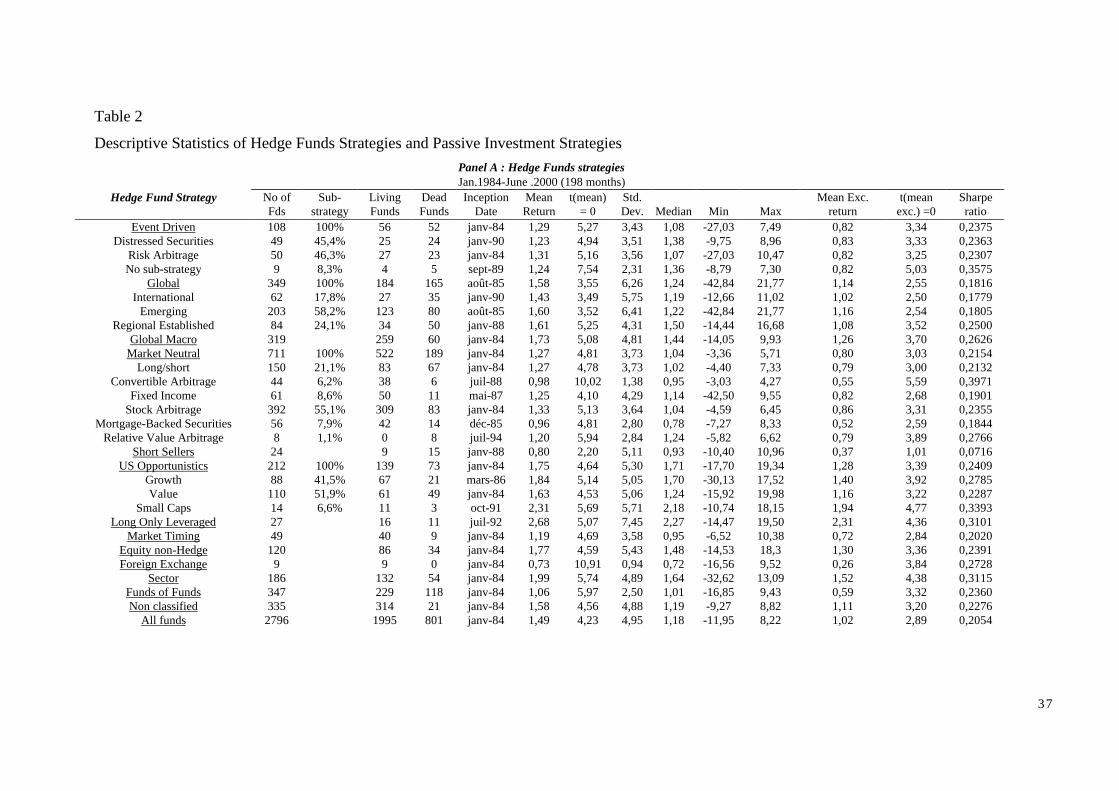
37
Table 2
Descriptive Statistics of Hedge Funds Strategies and Passive Investment StrategiesPanel A : Hedge Funds strategiesJan.1984-June .2000 (198 months)
Hedge Fund Strategy No ofFds
Sub-strategy
LivingFunds
DeadFunds
InceptionDate
MeanReturn
t(mean)= 0
Std.Dev. Median Min Max
Mean Exc.return
t(meanexc.) =0
Sharperatio
Event Driven 108 100% 56 52 janv-84 1,29 5,27 3,43 1,08 -27,03 7,49 0,82 3,34 0,2375Distressed Securities 49 45,4% 25 24 janv-90 1,23 4,94 3,51 1,38 -9,75 8,96 0,83 3,33 0,2363
Risk Arbitrage 50 46,3% 27 23 janv-84 1,31 5,16 3,56 1,07 -27,03 10,47 0,82 3,25 0,2307No sub-strategy 9 8,3% 4 5 sept-89 1,24 7,54 2,31 1,36 -8,79 7,30 0,82 5,03 0,3575
Global 349 100% 184 165 août-85 1,58 3,55 6,26 1,24 -42,84 21,77 1,14 2,55 0,1816International 62 17,8% 27 35 janv-90 1,43 3,49 5,75 1,19 -12,66 11,02 1,02 2,50 0,1779
Emerging 203 58,2% 123 80 août-85 1,60 3,52 6,41 1,22 -42,84 21,77 1,16 2,54 0,1805Regional Established 84 24,1% 34 50 janv-88 1,61 5,25 4,31 1,50 -14,44 16,68 1,08 3,52 0,2500
Global Macro 319 259 60 janv-84 1,73 5,08 4,81 1,44 -14,05 9,93 1,26 3,70 0,2626Market Neutral 711 100% 522 189 janv-84 1,27 4,81 3,73 1,04 -3,36 5,71 0,80 3,03 0,2154
Long/short 150 21,1% 83 67 janv-84 1,27 4,78 3,73 1,02 -4,40 7,33 0,79 3,00 0,2132Convertible Arbitrage 44 6,2% 38 6 juil-88 0,98 10,02 1,38 0,95 -3,03 4,27 0,55 5,59 0,3971
Fixed Income 61 8,6% 50 11 mai-87 1,25 4,10 4,29 1,14 -42,50 9,55 0,82 2,68 0,1901Stock Arbitrage 392 55,1% 309 83 janv-84 1,33 5,13 3,64 1,04 -4,59 6,45 0,86 3,31 0,2355
Mortgage-Backed Securities 56 7,9% 42 14 déc-85 0,96 4,81 2,80 0,78 -7,27 8,33 0,52 2,59 0,1844Relative Value Arbitrage 8 1,1% 0 8 juil-94 1,20 5,94 2,84 1,24 -5,82 6,62 0,79 3,89 0,2766
Short Sellers 24 9 15 janv-88 0,80 2,20 5,11 0,93 -10,40 10,96 0,37 1,01 0,0716US Opportunistics 212 100% 139 73 janv-84 1,75 4,64 5,30 1,71 -17,70 19,34 1,28 3,39 0,2409
Growth 88 41,5% 67 21 mars-86 1,84 5,14 5,05 1,70 -30,13 17,52 1,40 3,92 0,2785Value 110 51,9% 61 49 janv-84 1,63 4,53 5,06 1,24 -15,92 19,98 1,16 3,22 0,2287
Small Caps 14 6,6% 11 3 oct-91 2,31 5,69 5,71 2,18 -10,74 18,15 1,94 4,77 0,3393Long Only Leveraged 27 16 11 juil-92 2,68 5,07 7,45 2,27 -14,47 19,50 2,31 4,36 0,3101
Market Timing 49 40 9 janv-84 1,19 4,69 3,58 0,95 -6,52 10,38 0,72 2,84 0,2020Equity non-Hedge 120 86 34 janv-84 1,77 4,59 5,43 1,48 -14,53 18,3 1,30 3,36 0,2391Foreign Exchange 9 9 0 janv-84 0,73 10,91 0,94 0,72 -16,56 9,52 0,26 3,84 0,2728
Sector 186 132 54 janv-84 1,99 5,74 4,89 1,64 -32,62 13,09 1,52 4,38 0,3115Funds of Funds 347 229 118 janv-84 1,06 5,97 2,50 1,01 -16,85 9,43 0,59 3,32 0,2360Non classified 335 314 21 janv-84 1,58 4,56 4,88 1,19 -9,27 8,82 1,11 3,20 0,2276
All funds 2796 1995 801 janv-84 1,49 4,23 4,95 1,18 -11,95 8,22 1,02 2,89 0,2054
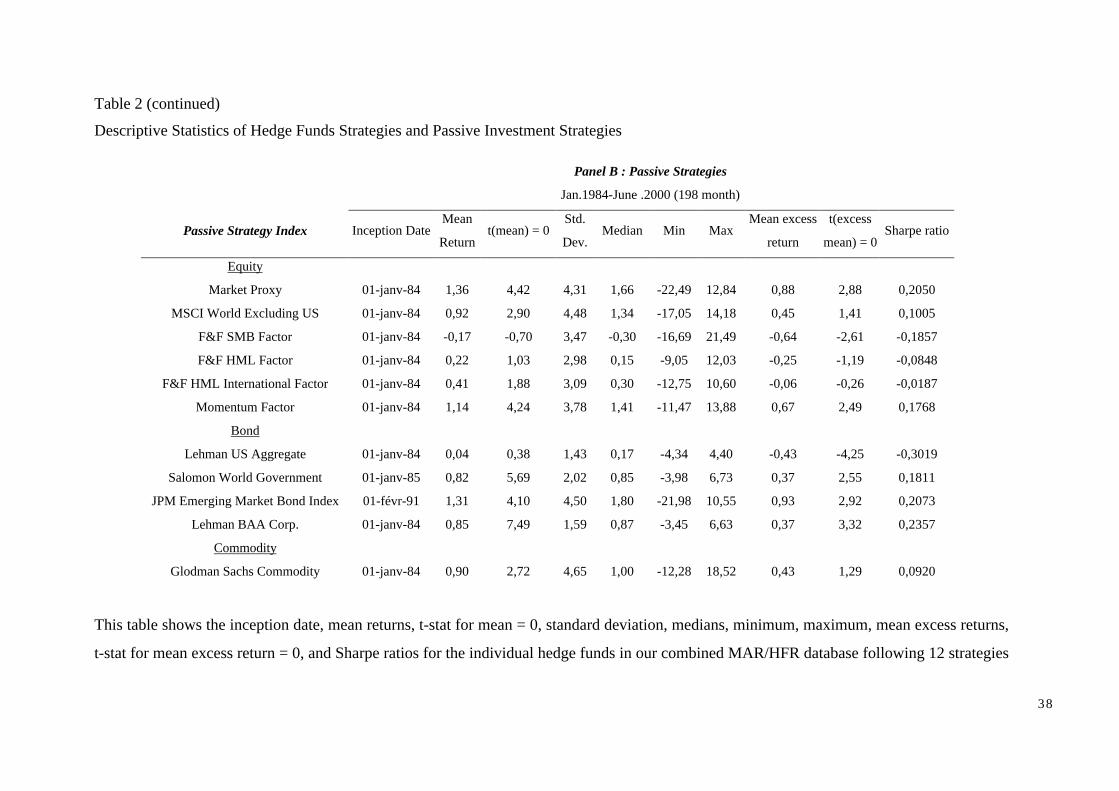
38
Table 2 (continued)
Descriptive Statistics of Hedge Funds Strategies and Passive Investment Strategies
Panel B : Passive Strategies
Jan.1984-June .2000 (198 month)
Passive Strategy Index Inception DateMean
Returnt(mean) = 0
Std.
Dev.Median Min Max
Mean excess
return
t(excess
mean) = 0Sharpe ratio
Equity
Market Proxy 01-janv-84 1,36 4,42 4,31 1,66 -22,49 12,84 0,88 2,88 0,2050
MSCI World Excluding US 01-janv-84 0,92 2,90 4,48 1,34 -17,05 14,18 0,45 1,41 0,1005
F&F SMB Factor 01-janv-84 -0,17 -0,70 3,47 -0,30 -16,69 21,49 -0,64 -2,61 -0,1857
F&F HML Factor 01-janv-84 0,22 1,03 2,98 0,15 -9,05 12,03 -0,25 -1,19 -0,0848
F&F HML International Factor 01-janv-84 0,41 1,88 3,09 0,30 -12,75 10,60 -0,06 -0,26 -0,0187
Momentum Factor 01-janv-84 1,14 4,24 3,78 1,41 -11,47 13,88 0,67 2,49 0,1768
Bond
Lehman US Aggregate 01-janv-84 0,04 0,38 1,43 0,17 -4,34 4,40 -0,43 -4,25 -0,3019
Salomon World Government 01-janv-85 0,82 5,69 2,02 0,85 -3,98 6,73 0,37 2,55 0,1811
JPM Emerging Market Bond Index 01-févr-91 1,31 4,10 4,50 1,80 -21,98 10,55 0,93 2,92 0,2073
Lehman BAA Corp. 01-janv-84 0,85 7,49 1,59 0,87 -3,45 6,63 0,37 3,32 0,2357
Commodity
Glodman Sachs Commodity 01-janv-84 0,90 2,72 4,65 1,00 -12,28 18,52 0,43 1,29 0,0920
This table shows the inception date, mean returns, t-stat for mean = 0, standard deviation, medians, minimum, maximum, mean excess returns,
t-stat for mean excess return = 0, and Sharpe ratios for the individual hedge funds in our combined MAR/HFR database following 12 strategies
39
and 15 sub-strategies, and for 11 passive investment strategies for the 1/1984 and 6/2000 period. Sharpe ratio is the ratio of excess return and
standard deviation. In panel A, No of Fds represent the number of funds following a particular strategy (or sub-strategy), Living Funds and
Dead Funds represents the number of surviving and dead funds (in June 2000, without considering the new funds established in 6/2000). We
calculate the Mean Excess Return and the Sharpe ratio considering Ibbotson Associates one-month T-bills. Numbers in the table are monthly
percentage.
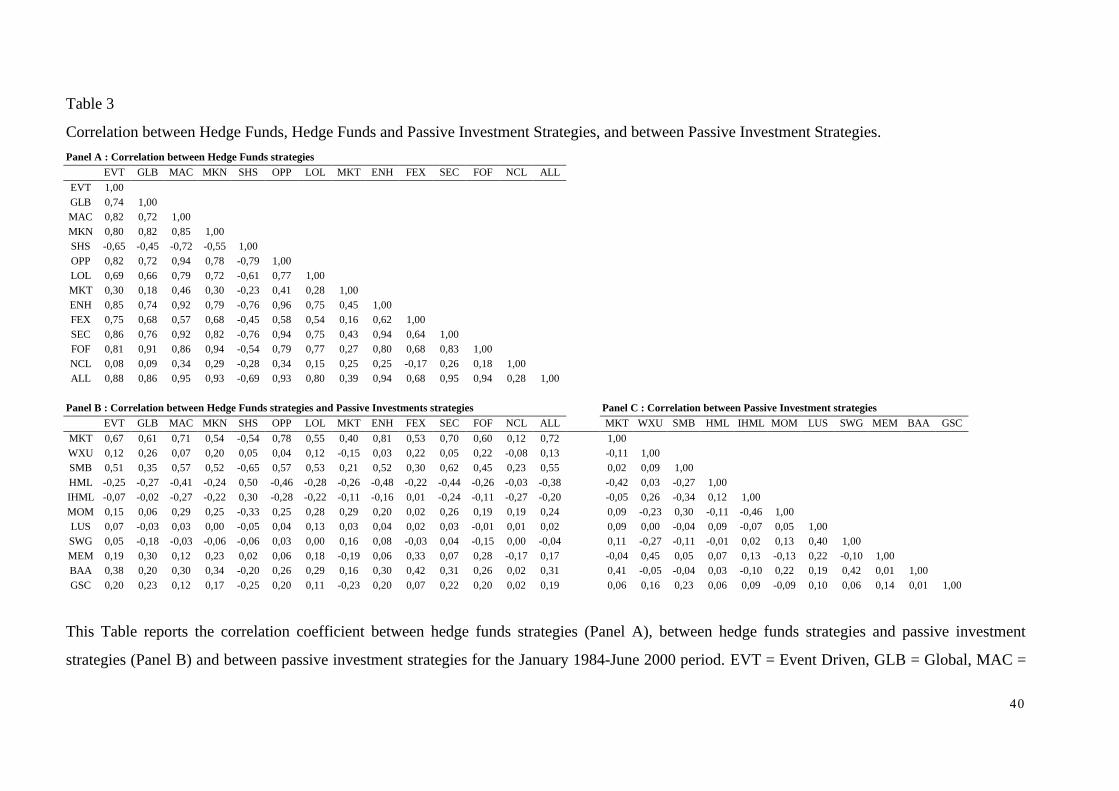
40
Table 3
Correlation between Hedge Funds, Hedge Funds and Passive Investment Strategies, and between Passive Investment Strategies.Panel A : Correlation between Hedge Funds strategies
EVT GLB MAC MKN SHS OPP LOL MKT ENH FEX SEC FOF NCL ALLEVT 1,00GLB 0,74 1,00MAC 0,82 0,72 1,00MKN 0,80 0,82 0,85 1,00SHS -0,65 -0,45 -0,72 -0,55 1,00OPP 0,82 0,72 0,94 0,78 -0,79 1,00LOL 0,69 0,66 0,79 0,72 -0,61 0,77 1,00MKT 0,30 0,18 0,46 0,30 -0,23 0,41 0,28 1,00ENH 0,85 0,74 0,92 0,79 -0,76 0,96 0,75 0,45 1,00FEX 0,75 0,68 0,57 0,68 -0,45 0,58 0,54 0,16 0,62 1,00SEC 0,86 0,76 0,92 0,82 -0,76 0,94 0,75 0,43 0,94 0,64 1,00FOF 0,81 0,91 0,86 0,94 -0,54 0,79 0,77 0,27 0,80 0,68 0,83 1,00NCL 0,08 0,09 0,34 0,29 -0,28 0,34 0,15 0,25 0,25 -0,17 0,26 0,18 1,00ALL 0,88 0,86 0,95 0,93 -0,69 0,93 0,80 0,39 0,94 0,68 0,95 0,94 0,28 1,00
Panel B : Correlation between Hedge Funds strategies and Passive Investments strategies Panel C : Correlation between Passive Investment strategiesEVT GLB MAC MKN SHS OPP LOL MKT ENH FEX SEC FOF NCL ALL MKT WXU SMB HML IHML MOM LUS SWG MEM BAA GSC
MKT 0,67 0,61 0,71 0,54 -0,54 0,78 0,55 0,40 0,81 0,53 0,70 0,60 0,12 0,72 1,00WXU 0,12 0,26 0,07 0,20 0,05 0,04 0,12 -0,15 0,03 0,22 0,05 0,22 -0,08 0,13 -0,11 1,00SMB 0,51 0,35 0,57 0,52 -0,65 0,57 0,53 0,21 0,52 0,30 0,62 0,45 0,23 0,55 0,02 0,09 1,00HML -0,25 -0,27 -0,41 -0,24 0,50 -0,46 -0,28 -0,26 -0,48 -0,22 -0,44 -0,26 -0,03 -0,38 -0,42 0,03 -0,27 1,00IHML -0,07 -0,02 -0,27 -0,22 0,30 -0,28 -0,22 -0,11 -0,16 0,01 -0,24 -0,11 -0,27 -0,20 -0,05 0,26 -0,34 0,12 1,00MOM 0,15 0,06 0,29 0,25 -0,33 0,25 0,28 0,29 0,20 0,02 0,26 0,19 0,19 0,24 0,09 -0,23 0,30 -0,11 -0,46 1,00LUS 0,07 -0,03 0,03 0,00 -0,05 0,04 0,13 0,03 0,04 0,02 0,03 -0,01 0,01 0,02 0,09 0,00 -0,04 0,09 -0,07 0,05 1,00SWG 0,05 -0,18 -0,03 -0,06 -0,06 0,03 0,00 0,16 0,08 -0,03 0,04 -0,15 0,00 -0,04 0,11 -0,27 -0,11 -0,01 0,02 0,13 0,40 1,00MEM 0,19 0,30 0,12 0,23 0,02 0,06 0,18 -0,19 0,06 0,33 0,07 0,28 -0,17 0,17 -0,04 0,45 0,05 0,07 0,13 -0,13 0,22 -0,10 1,00BAA 0,38 0,20 0,30 0,34 -0,20 0,26 0,29 0,16 0,30 0,42 0,31 0,26 0,02 0,31 0,41 -0,05 -0,04 0,03 -0,10 0,22 0,19 0,42 0,01 1,00GSC 0,20 0,23 0,12 0,17 -0,25 0,20 0,11 -0,23 0,20 0,07 0,22 0,20 0,02 0,19 0,06 0,16 0,23 0,06 0,09 -0,09 0,10 0,06 0,14 0,01 1,00
This Table reports the correlation coefficient between hedge funds strategies (Panel A), between hedge funds strategies and passive investment
strategies (Panel B) and between passive investment strategies for the January 1984-June 2000 period. EVT = Event Driven, GLB = Global, MAC =
41
Global Macro, MKN = Market Neutral, SHS = Short Selling, OPP = US Opportunistics, LOL = Long only Leveraged, MKT = Market Timing, ENH
= Equity non-Hedge, FEX = Foreign Exchange, SEC = Sector, FOF = Funds of Funds, NCL = Non Classified, ALL = All hedge funds, MKT =
Market Proxy, WXU = World excluding US, IHML = International HML, MOM = Momentum, LUS = Lehman US Aggregate Bond Index, SWG =
Salomon World Government Bond Index, MEM = JP Morgan Emerging Market Bond Index, BAA = Lehman BAA Corporate Bond Index and GSC
= Goldman Sachs Commodity Index.
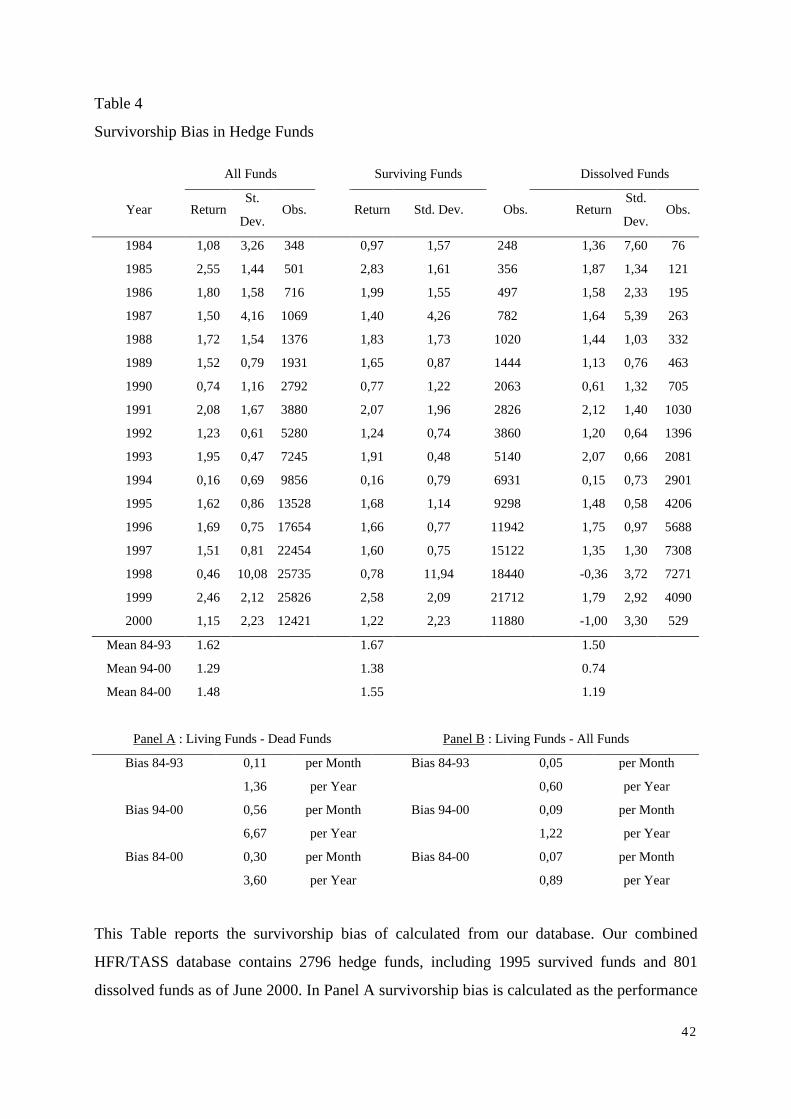
42
Table 4
Survivorship Bias in Hedge Funds
All Funds Surviving Funds Dissolved Funds
Year ReturnSt.
Dev.Obs. Return Std. Dev. Obs. Return
Std.
Dev.Obs.
1984 1,08 3,26 348 0,97 1,57 248 1,36 7,60 76
1985 2,55 1,44 501 2,83 1,61 356 1,87 1,34 121
1986 1,80 1,58 716 1,99 1,55 497 1,58 2,33 195
1987 1,50 4,16 1069 1,40 4,26 782 1,64 5,39 263
1988 1,72 1,54 1376 1,83 1,73 1020 1,44 1,03 332
1989 1,52 0,79 1931 1,65 0,87 1444 1,13 0,76 463
1990 0,74 1,16 2792 0,77 1,22 2063 0,61 1,32 705
1991 2,08 1,67 3880 2,07 1,96 2826 2,12 1,40 1030
1992 1,23 0,61 5280 1,24 0,74 3860 1,20 0,64 1396
1993 1,95 0,47 7245 1,91 0,48 5140 2,07 0,66 2081
1994 0,16 0,69 9856 0,16 0,79 6931 0,15 0,73 2901
1995 1,62 0,86 13528 1,68 1,14 9298 1,48 0,58 4206
1996 1,69 0,75 17654 1,66 0,77 11942 1,75 0,97 5688
1997 1,51 0,81 22454 1,60 0,75 15122 1,35 1,30 7308
1998 0,46 10,08 25735 0,78 11,94 18440 -0,36 3,72 7271
1999 2,46 2,12 25826 2,58 2,09 21712 1,79 2,92 4090
2000 1,15 2,23 12421 1,22 2,23 11880 -1,00 3,30 529
Mean 84-93 1.62 1.67 1.50
Mean 94-00 1.29 1.38 0.74
Mean 84-00 1.48 1.55 1.19
Panel A : Living Funds - Dead Funds Panel B : Living Funds - All Funds
Bias 84-93 0,11 per Month Bias 84-93 0,05 per Month
1,36 per Year 0,60 per Year
Bias 94-00 0,56 per Month Bias 94-00 0,09 per Month
6,67 per Year 1,22 per Year
Bias 84-00 0,30 per Month Bias 84-00 0,07 per Month
3,60 per Year 0,89 per Year
This Table reports the survivorship bias of calculated from our database. Our combined
HFR/TASS database contains 2796 hedge funds, including 1995 survived funds and 801
dissolved funds as of June 2000. In Panel A survivorship bias is calculated as the performance

43
difference between surviving funds and dissolved funds. In Panel B survivorship bias is
calculated as the performance difference between surviving funds and all funds. All returns
are net of fees and on a monthly basis. Number in the table are monthly percentage.
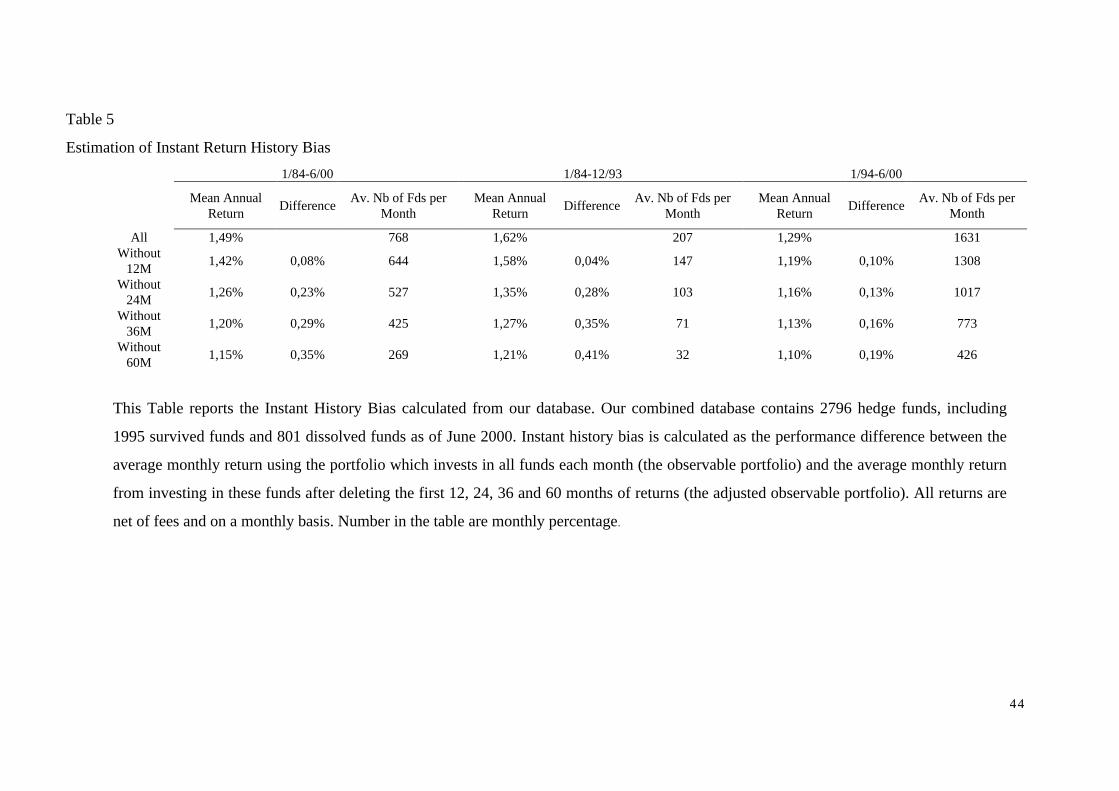
44
Table 5
Estimation of Instant Return History Bias
1/84-6/00 1/84-12/93 1/94-6/00
Mean AnnualReturn Difference Av. Nb of Fds per
MonthMean Annual
Return Difference Av. Nb of Fds perMonth
Mean AnnualReturn Difference Av. Nb of Fds per
Month
All 1,49% 768 1,62% 207 1,29% 1631Without
12M 1,42% 0,08% 644 1,58% 0,04% 147 1,19% 0,10% 1308
Without24M 1,26% 0,23% 527 1,35% 0,28% 103 1,16% 0,13% 1017
Without36M 1,20% 0,29% 425 1,27% 0,35% 71 1,13% 0,16% 773
Without60M 1,15% 0,35% 269 1,21% 0,41% 32 1,10% 0,19% 426
This Table reports the Instant History Bias calculated from our database. Our combined database contains 2796 hedge funds, including
1995 survived funds and 801 dissolved funds as of June 2000. Instant history bias is calculated as the performance difference between the
average monthly return using the portfolio which invests in all funds each month (the observable portfolio) and the average monthly return
from investing in these funds after deleting the first 12, 24, 36 and 60 months of returns (the adjusted observable portfolio). All returns are
net of fees and on a monthly basis. Number in the table are monthly percentage.
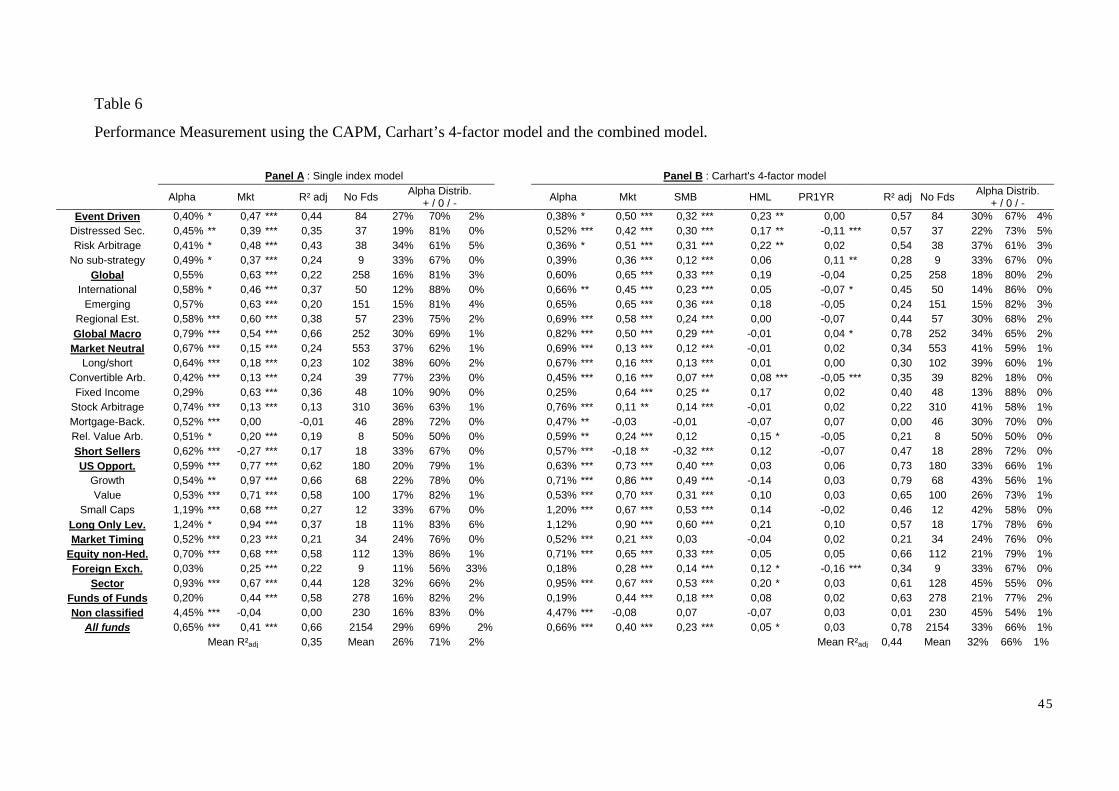
45
Table 6
Performance Measurement using the CAPM, Carhart’s 4-factor model and the combined model.
Panel A : Single index model Panel B : Carhart's 4-factor model
Alpha Mkt R² adj No Fds Alpha Distrib.+ / 0 / - Alpha Mkt SMB HML PR1YR R² adj No Fds Alpha Distrib.
+ / 0 / -Event Driven 0,40% * 0,47 *** 0,44 84 27% 70% 2% 0,38% * 0,50 *** 0,32 *** 0,23 ** 0,00 0,57 84 30% 67% 4%
Distressed Sec. 0,45% ** 0,39 *** 0,35 37 19% 81% 0% 0,52% *** 0,42 *** 0,30 *** 0,17 ** -0,11 *** 0,57 37 22% 73% 5%Risk Arbitrage 0,41% * 0,48 *** 0,43 38 34% 61% 5% 0,36% * 0,51 *** 0,31 *** 0,22 ** 0,02 0,54 38 37% 61% 3%
No sub-strategy 0,49% * 0,37 *** 0,24 9 33% 67% 0% 0,39% 0,36 *** 0,12 *** 0,06 0,11 ** 0,28 9 33% 67% 0%Global 0,55% 0,63 *** 0,22 258 16% 81% 3% 0,60% 0,65 *** 0,33 *** 0,19 -0,04 0,25 258 18% 80% 2%
International 0,58% * 0,46 *** 0,37 50 12% 88% 0% 0,66% ** 0,45 *** 0,23 *** 0,05 -0,07 * 0,45 50 14% 86% 0%Emerging 0,57% 0,63 *** 0,20 151 15% 81% 4% 0,65% 0,65 *** 0,36 *** 0,18 -0,05 0,24 151 15% 82% 3%
Regional Est. 0,58% *** 0,60 *** 0,38 57 23% 75% 2% 0,69% *** 0,58 *** 0,24 *** 0,00 -0,07 0,44 57 30% 68% 2%Global Macro 0,79% *** 0,54 *** 0,66 252 30% 69% 1% 0,82% *** 0,50 *** 0,29 *** -0,01 0,04 * 0,78 252 34% 65% 2%
Market Neutral 0,67% *** 0,15 *** 0,24 553 37% 62% 1% 0,69% *** 0,13 *** 0,12 *** -0,01 0,02 0,34 553 41% 59% 1%Long/short 0,64% *** 0,18 *** 0,23 102 38% 60% 2% 0,67% *** 0,16 *** 0,13 *** 0,01 0,00 0,30 102 39% 60% 1%
Convertible Arb. 0,42% *** 0,13 *** 0,24 39 77% 23% 0% 0,45% *** 0,16 *** 0,07 *** 0,08 *** -0,05 *** 0,35 39 82% 18% 0%Fixed Income 0,29% 0,63 *** 0,36 48 10% 90% 0% 0,25% 0,64 *** 0,25 ** 0,17 0,02 0,40 48 13% 88% 0%
Stock Arbitrage 0,74% *** 0,13 *** 0,13 310 36% 63% 1% 0,76% *** 0,11 ** 0,14 *** -0,01 0,02 0,22 310 41% 58% 1%Mortgage-Back. 0,52% *** 0,00 -0,01 46 28% 72% 0% 0,47% ** -0,03 -0,01 -0,07 0,07 0,00 46 30% 70% 0%Rel. Value Arb. 0,51% * 0,20 *** 0,19 8 50% 50% 0% 0,59% ** 0,24 *** 0,12 0,15 * -0,05 0,21 8 50% 50% 0%Short Sellers 0,62% *** -0,27 *** 0,17 18 33% 67% 0% 0,57% *** -0,18 ** -0,32 *** 0,12 -0,07 0,47 18 28% 72% 0%US Opport. 0,59% *** 0,77 *** 0,62 180 20% 79% 1% 0,63% *** 0,73 *** 0,40 *** 0,03 0,06 0,73 180 33% 66% 1%
Growth 0,54% ** 0,97 *** 0,66 68 22% 78% 0% 0,71% *** 0,86 *** 0,49 *** -0,14 0,03 0,79 68 43% 56% 1%Value 0,53% *** 0,71 *** 0,58 100 17% 82% 1% 0,53% *** 0,70 *** 0,31 *** 0,10 0,03 0,65 100 26% 73% 1%
Small Caps 1,19% *** 0,68 *** 0,27 12 33% 67% 0% 1,20% *** 0,67 *** 0,53 *** 0,14 -0,02 0,46 12 42% 58% 0%Long Only Lev. 1,24% * 0,94 *** 0,37 18 11% 83% 6% 1,12% 0,90 *** 0,60 *** 0,21 0,10 0,57 18 17% 78% 6%Market Timing 0,52% *** 0,23 *** 0,21 34 24% 76% 0% 0,52% *** 0,21 *** 0,03 -0,04 0,02 0,21 34 24% 76% 0%
Equity non-Hed. 0,70% *** 0,68 *** 0,58 112 13% 86% 1% 0,71% *** 0,65 *** 0,33 *** 0,05 0,05 0,66 112 21% 79% 1%Foreign Exch. 0,03% 0,25 *** 0,22 9 11% 56% 33% 0,18% 0,28 *** 0,14 *** 0,12 * -0,16 *** 0,34 9 33% 67% 0%
Sector 0,93% *** 0,67 *** 0,44 128 32% 66% 2% 0,95% *** 0,67 *** 0,53 *** 0,20 * 0,03 0,61 128 45% 55% 0%Funds of Funds 0,20% 0,44 *** 0,58 278 16% 82% 2% 0,19% 0,44 *** 0,18 *** 0,08 0,02 0,63 278 21% 77% 2%Non classified 4,45% *** -0,04 0,00 230 16% 83% 0% 4,47% *** -0,08 0,07 -0,07 0,03 0,01 230 45% 54% 1%
All funds 0,65% *** 0,41 *** 0,66 2154 29% 69% 2% 0,66% *** 0,40 *** 0,23 *** 0,05 * 0,03 0,78 2154 33% 66% 1%Mean R²adj 0,35 Mean 26% 71% 2% Mean R²adj 0,44 Mean 32% 66% 1%
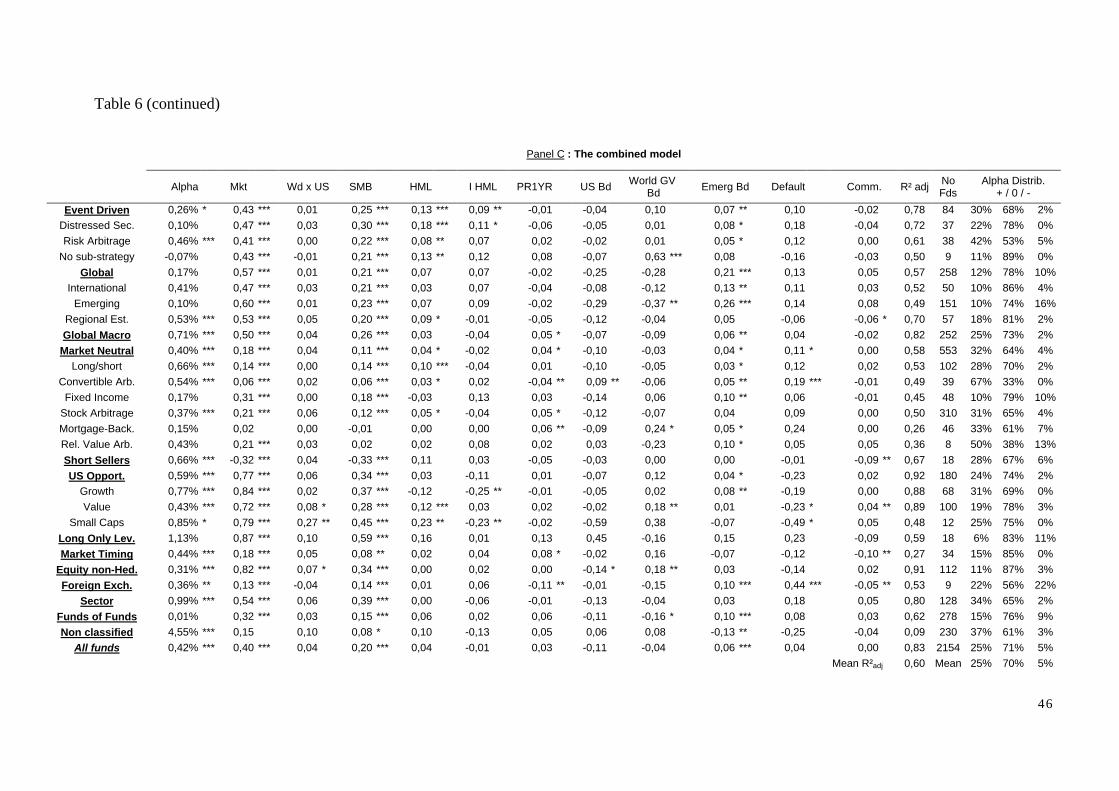
46
Table 6 (continued)
Panel C : The combined model
Alpha Mkt Wd x US SMB HML I HML PR1YR US Bd World GV Bd Emerg Bd Default Comm. R² adj No
FdsAlpha Distrib.
+ / 0 / -
Event Driven 0,26% * 0,43 *** 0,01 0,25 *** 0,13 *** 0,09 ** -0,01 -0,04 0,10 0,07 ** 0,10 -0,02 0,78 84 30% 68% 2%Distressed Sec. 0,10% 0,47 *** 0,03 0,30 *** 0,18 *** 0,11 * -0,06 -0,05 0,01 0,08 * 0,18 -0,04 0,72 37 22% 78% 0%Risk Arbitrage 0,46% *** 0,41 *** 0,00 0,22 *** 0,08 ** 0,07 0,02 -0,02 0,01 0,05 * 0,12 0,00 0,61 38 42% 53% 5%
No sub-strategy -0,07% 0,43 *** -0,01 0,21 *** 0,13 ** 0,12 0,08 -0,07 0,63 *** 0,08 -0,16 -0,03 0,50 9 11% 89% 0%Global 0,17% 0,57 *** 0,01 0,21 *** 0,07 0,07 -0,02 -0,25 -0,28 0,21 *** 0,13 0,05 0,57 258 12% 78% 10%
International 0,41% 0,47 *** 0,03 0,21 *** 0,03 0,07 -0,04 -0,08 -0,12 0,13 ** 0,11 0,03 0,52 50 10% 86% 4%Emerging 0,10% 0,60 *** 0,01 0,23 *** 0,07 0,09 -0,02 -0,29 -0,37 ** 0,26 *** 0,14 0,08 0,49 151 10% 74% 16%
Regional Est. 0,53% *** 0,53 *** 0,05 0,20 *** 0,09 * -0,01 -0,05 -0,12 -0,04 0,05 -0,06 -0,06 * 0,70 57 18% 81% 2%Global Macro 0,71% *** 0,50 *** 0,04 0,26 *** 0,03 -0,04 0,05 * -0,07 -0,09 0,06 ** 0,04 -0,02 0,82 252 25% 73% 2%
Market Neutral 0,40% *** 0,18 *** 0,04 0,11 *** 0,04 * -0,02 0,04 * -0,10 -0,03 0,04 * 0,11 * 0,00 0,58 553 32% 64% 4%Long/short 0,66% *** 0,14 *** 0,00 0,14 *** 0,10 *** -0,04 0,01 -0,10 -0,05 0,03 * 0,12 0,02 0,53 102 28% 70% 2%
Convertible Arb. 0,54% *** 0,06 *** 0,02 0,06 *** 0,03 * 0,02 -0,04 ** 0,09 ** -0,06 0,05 ** 0,19 *** -0,01 0,49 39 67% 33% 0%Fixed Income 0,17% 0,31 *** 0,00 0,18 *** -0,03 0,13 0,03 -0,14 0,06 0,10 ** 0,06 -0,01 0,45 48 10% 79% 10%
Stock Arbitrage 0,37% *** 0,21 *** 0,06 0,12 *** 0,05 * -0,04 0,05 * -0,12 -0,07 0,04 0,09 0,00 0,50 310 31% 65% 4%Mortgage-Back. 0,15% 0,02 0,00 -0,01 0,00 0,00 0,06 ** -0,09 0,24 * 0,05 * 0,24 0,00 0,26 46 33% 61% 7%Rel. Value Arb. 0,43% 0,21 *** 0,03 0,02 0,02 0,08 0,02 0,03 -0,23 0,10 * 0,05 0,05 0,36 8 50% 38% 13%Short Sellers 0,66% *** -0,32 *** 0,04 -0,33 *** 0,11 0,03 -0,05 -0,03 0,00 0,00 -0,01 -0,09 ** 0,67 18 28% 67% 6%US Opport. 0,59% *** 0,77 *** 0,06 0,34 *** 0,03 -0,11 0,01 -0,07 0,12 0,04 * -0,23 0,02 0,92 180 24% 74% 2%
Growth 0,77% *** 0,84 *** 0,02 0,37 *** -0,12 -0,25 ** -0,01 -0,05 0,02 0,08 ** -0,19 0,00 0,88 68 31% 69% 0%Value 0,43% *** 0,72 *** 0,08 * 0,28 *** 0,12 *** 0,03 0,02 -0,02 0,18 ** 0,01 -0,23 * 0,04 ** 0,89 100 19% 78% 3%
Small Caps 0,85% * 0,79 *** 0,27 ** 0,45 *** 0,23 ** -0,23 ** -0,02 -0,59 0,38 -0,07 -0,49 * 0,05 0,48 12 25% 75% 0%Long Only Lev. 1,13% 0,87 *** 0,10 0,59 *** 0,16 0,01 0,13 0,45 -0,16 0,15 0,23 -0,09 0,59 18 6% 83% 11%Market Timing 0,44% *** 0,18 *** 0,05 0,08 ** 0,02 0,04 0,08 * -0,02 0,16 -0,07 -0,12 -0,10 ** 0,27 34 15% 85% 0%
Equity non-Hed. 0,31% *** 0,82 *** 0,07 * 0,34 *** 0,00 0,02 0,00 -0,14 * 0,18 ** 0,03 -0,14 0,02 0,91 112 11% 87% 3%Foreign Exch. 0,36% ** 0,13 *** -0,04 0,14 *** 0,01 0,06 -0,11 ** -0,01 -0,15 0,10 *** 0,44 *** -0,05 ** 0,53 9 22% 56% 22%
Sector 0,99% *** 0,54 *** 0,06 0,39 *** 0,00 -0,06 -0,01 -0,13 -0,04 0,03 0,18 0,05 0,80 128 34% 65% 2%Funds of Funds 0,01% 0,32 *** 0,03 0,15 *** 0,06 0,02 0,06 -0,11 -0,16 * 0,10 *** 0,08 0,03 0,62 278 15% 76% 9%Non classified 4,55% *** 0,15 0,10 0,08 * 0,10 -0,13 0,05 0,06 0,08 -0,13 ** -0,25 -0,04 0,09 230 37% 61% 3%
All funds 0,42% *** 0,40 *** 0,04 0,20 *** 0,04 -0,01 0,03 -0,11 -0,04 0,06 *** 0,04 0,00 0,83 2154 25% 71% 5%Mean R²adj 0,60 Mean 25% 70% 5%

47
This Table presents the results of the estimation of the Single Index Model (Panel A), of Carhart’s (1997) Model (Panel B) and of our Combined
Model (Panel C) for the 1/1984-6/2000 period. We report the OLS estimators for equally weigthed portfolio’s per investment strategy, sub-strategy
and for all funds. The last column gives the distribution of individually estimated monthly alphas for all funds with 24 monthly data or more in a
specific investment style. We report the percentage of significantly positive alpha’s (+), significantly negative alpha’s (-) and alpha’s that are
insignificantly different from zero (0) at the 5% level. The next to last column reports the number of individual funds used for the individual
estimation of the last column. T-stat are heteroskdasticity consistent. *** Significant at the 1% level, ** Significant at the 5% level and * Siginficant
at the 10% level.
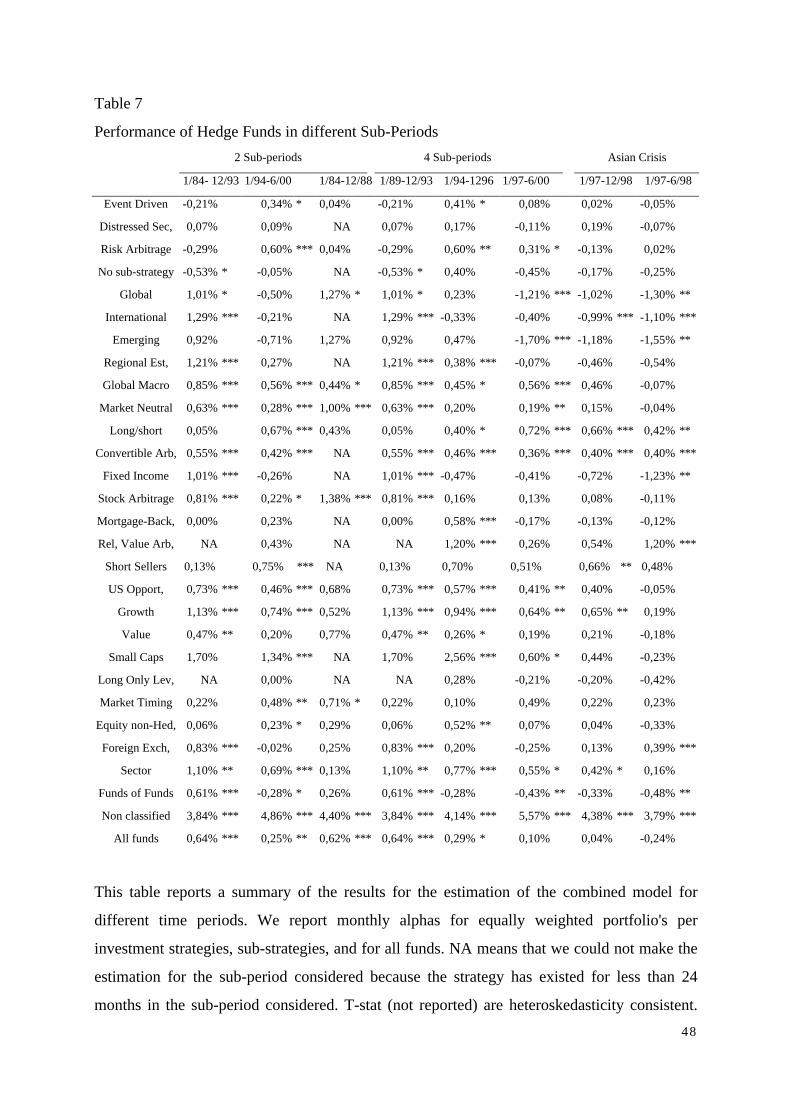
48
Table 7
Performance of Hedge Funds in different Sub-Periods
2 Sub-periods 4 Sub-periods Asian Crisis
1/84- 12/93 1/94-6/00 1/84-12/88 1/89-12/93 1/94-1296 1/97-6/00 1/97-12/98 1/97-6/98
Event Driven -0,21% 0,34% * 0,04% -0,21% 0,41% * 0,08% 0,02% -0,05%
Distressed Sec, 0,07% 0,09% NA 0,07% 0,17% -0,11% 0,19% -0,07%
Risk Arbitrage -0,29% 0,60% *** 0,04% -0,29% 0,60% ** 0,31% * -0,13% 0,02%
No sub-strategy -0,53% * -0,05% NA -0,53% * 0,40% -0,45% -0,17% -0,25%
Global 1,01% * -0,50% 1,27% * 1,01% * 0,23% -1,21% *** -1,02% -1,30% **
International 1,29% *** -0,21% NA 1,29% *** -0,33% -0,40% -0,99% *** -1,10% ***
Emerging 0,92% -0,71% 1,27% 0,92% 0,47% -1,70% *** -1,18% -1,55% **
Regional Est, 1,21% *** 0,27% NA 1,21% *** 0,38% *** -0,07% -0,46% -0,54%
Global Macro 0,85% *** 0,56% *** 0,44% * 0,85% *** 0,45% * 0,56% *** 0,46% -0,07%
Market Neutral 0,63% *** 0,28% *** 1,00% *** 0,63% *** 0,20% 0,19% ** 0,15% -0,04%
Long/short 0,05% 0,67% *** 0,43% 0,05% 0,40% * 0,72% *** 0,66% *** 0,42% **
Convertible Arb, 0,55% *** 0,42% *** NA 0,55% *** 0,46% *** 0,36% *** 0,40% *** 0,40% ***
Fixed Income 1,01% *** -0,26% NA 1,01% *** -0,47% -0,41% -0,72% -1,23% **
Stock Arbitrage 0,81% *** 0,22% * 1,38% *** 0,81% *** 0,16% 0,13% 0,08% -0,11%
Mortgage-Back, 0,00% 0,23% NA 0,00% 0,58% *** -0,17% -0,13% -0,12%
Rel, Value Arb, NA 0,43% NA NA 1,20% *** 0,26% 0,54% 1,20% ***
Short Sellers 0,13% 0,75% *** NA 0,13% 0,70% 0,51% 0,66% ** 0,48%
US Opport, 0,73% *** 0,46% *** 0,68% 0,73% *** 0,57% *** 0,41% ** 0,40% -0,05%
Growth 1,13% *** 0,74% *** 0,52% 1,13% *** 0,94% *** 0,64% ** 0,65% ** 0,19%
Value 0,47% ** 0,20% 0,77% 0,47% ** 0,26% * 0,19% 0,21% -0,18%
Small Caps 1,70% 1,34% *** NA 1,70% 2,56% *** 0,60% * 0,44% -0,23%
Long Only Lev, NA 0,00% NA NA 0,28% -0,21% -0,20% -0,42%
Market Timing 0,22% 0,48% ** 0,71% * 0,22% 0,10% 0,49% 0,22% 0,23%
Equity non-Hed, 0,06% 0,23% * 0,29% 0,06% 0,52% ** 0,07% 0,04% -0,33%
Foreign Exch, 0,83% *** -0,02% 0,25% 0,83% *** 0,20% -0,25% 0,13% 0,39% ***
Sector 1,10% ** 0,69% *** 0,13% 1,10% ** 0,77% *** 0,55% * 0,42% * 0,16%
Funds of Funds 0,61% *** -0,28% * 0,26% 0,61% *** -0,28% -0,43% ** -0,33% -0,48% **
Non classified 3,84% *** 4,86% *** 4,40% *** 3,84% *** 4,14% *** 5,57% *** 4,38% *** 3,79% ***
All funds 0,64% *** 0,25% ** 0,62% *** 0,64% *** 0,29% * 0,10% 0,04% -0,24%
This table reports a summary of the results for the estimation of the combined model for
different time periods. We report monthly alphas for equally weighted portfolio's per
investment strategies, sub-strategies, and for all funds. NA means that we could not make the
estimation for the sub-period considered because the strategy has existed for less than 24
months in the sub-period considered. T-stat (not reported) are heteroskedasticity consistent.

49
*** Significant at the 1% level, ** Significant at the 5% level and * Significant at the 10%
level.
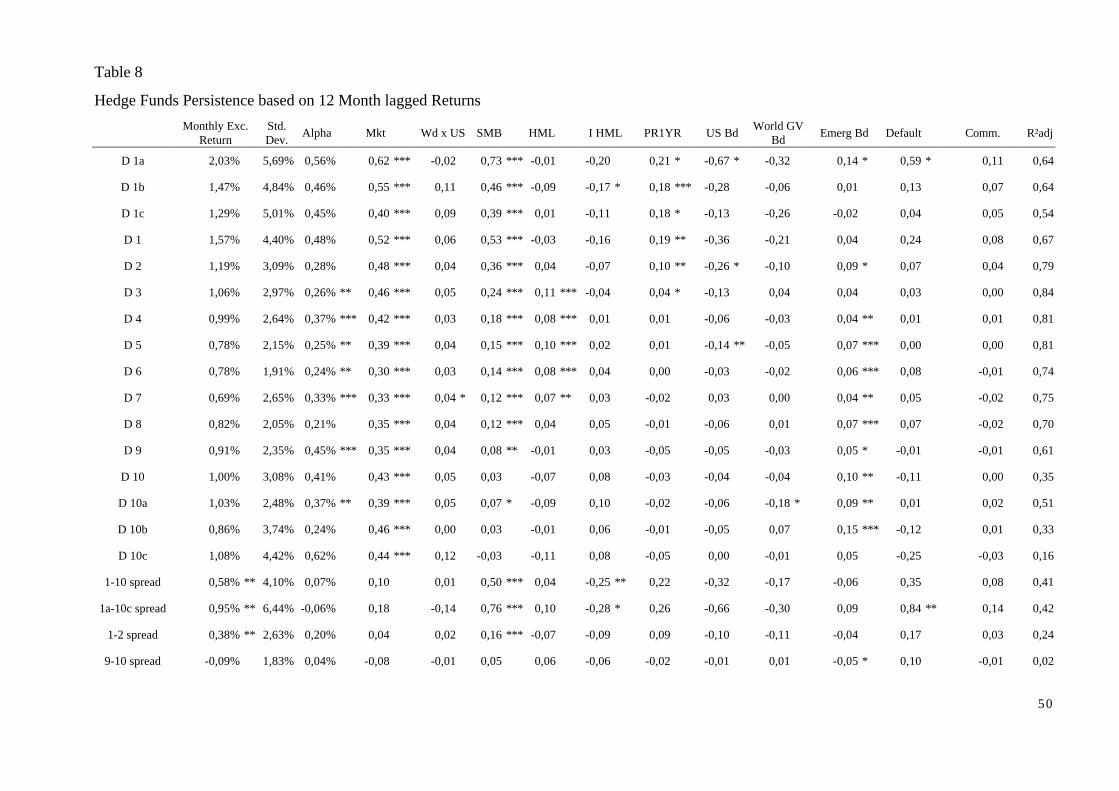
50
Table 8
Hedge Funds Persistence based on 12 Month lagged Returns
Monthly Exc.Return
Std.Dev. Alpha Mkt Wd x US SMB HML I HML PR1YR US Bd World GV
Bd Emerg Bd Default Comm. R²adj
D 1a 2,03% 5,69% 0,56% 0,62 *** -0,02 0,73 *** -0,01 -0,20 0,21 * -0,67 * -0,32 0,14 * 0,59 * 0,11 0,64
D 1b 1,47% 4,84% 0,46% 0,55 *** 0,11 0,46 *** -0,09 -0,17 * 0,18 *** -0,28 -0,06 0,01 0,13 0,07 0,64
D 1c 1,29% 5,01% 0,45% 0,40 *** 0,09 0,39 *** 0,01 -0,11 0,18 * -0,13 -0,26 -0,02 0,04 0,05 0,54
D 1 1,57% 4,40% 0,48% 0,52 *** 0,06 0,53 *** -0,03 -0,16 0,19 ** -0,36 -0,21 0,04 0,24 0,08 0,67
D 2 1,19% 3,09% 0,28% 0,48 *** 0,04 0,36 *** 0,04 -0,07 0,10 ** -0,26 * -0,10 0,09 * 0,07 0,04 0,79
D 3 1,06% 2,97% 0,26% ** 0,46 *** 0,05 0,24 *** 0,11 *** -0,04 0,04 * -0,13 0,04 0,04 0,03 0,00 0,84
D 4 0,99% 2,64% 0,37% *** 0,42 *** 0,03 0,18 *** 0,08 *** 0,01 0,01 -0,06 -0,03 0,04 ** 0,01 0,01 0,81
D 5 0,78% 2,15% 0,25% ** 0,39 *** 0,04 0,15 *** 0,10 *** 0,02 0,01 -0,14 ** -0,05 0,07 *** 0,00 0,00 0,81
D 6 0,78% 1,91% 0,24% ** 0,30 *** 0,03 0,14 *** 0,08 *** 0,04 0,00 -0,03 -0,02 0,06 *** 0,08 -0,01 0,74
D 7 0,69% 2,65% 0,33% *** 0,33 *** 0,04 * 0,12 *** 0,07 ** 0,03 -0,02 0,03 0,00 0,04 ** 0,05 -0,02 0,75
D 8 0,82% 2,05% 0,21% 0,35 *** 0,04 0,12 *** 0,04 0,05 -0,01 -0,06 0,01 0,07 *** 0,07 -0,02 0,70
D 9 0,91% 2,35% 0,45% *** 0,35 *** 0,04 0,08 ** -0,01 0,03 -0,05 -0,05 -0,03 0,05 * -0,01 -0,01 0,61
D 10 1,00% 3,08% 0,41% 0,43 *** 0,05 0,03 -0,07 0,08 -0,03 -0,04 -0,04 0,10 ** -0,11 0,00 0,35
D 10a 1,03% 2,48% 0,37% ** 0,39 *** 0,05 0,07 * -0,09 0,10 -0,02 -0,06 -0,18 * 0,09 ** 0,01 0,02 0,51
D 10b 0,86% 3,74% 0,24% 0,46 *** 0,00 0,03 -0,01 0,06 -0,01 -0,05 0,07 0,15 *** -0,12 0,01 0,33
D 10c 1,08% 4,42% 0,62% 0,44 *** 0,12 -0,03 -0,11 0,08 -0,05 0,00 -0,01 0,05 -0,25 -0,03 0,16
1-10 spread 0,58% ** 4,10% 0,07% 0,10 0,01 0,50 *** 0,04 -0,25 ** 0,22 -0,32 -0,17 -0,06 0,35 0,08 0,41
1a-10c spread 0,95% ** 6,44% -0,06% 0,18 -0,14 0,76 *** 0,10 -0,28 * 0,26 -0,66 -0,30 0,09 0,84 ** 0,14 0,42
1-2 spread 0,38% ** 2,63% 0,20% 0,04 0,02 0,16 *** -0,07 -0,09 0,09 -0,10 -0,11 -0,04 0,17 0,03 0,24
9-10 spread -0,09% 1,83% 0,04% -0,08 -0,01 0,05 0,06 -0,06 -0,02 -0,01 0,01 -0,05 * 0,10 -0,01 0,02
51
This Table reports results of the estimation of the combined model for the 1/85-6/00 period. Each year, all funds are ranked based on their previous
year's return. Portfolios are equally weighted and weights are readjusted whenever a fund disappears. Funds with the highest previous year's return go
into portfolio D1 and funds with the lowest go into portfolio D10. The high and low portfolios are further subdivided on the same measure. Monthly
Exc Return is the Monthly Excess Return of the portfolio, Std. Dev. is the Standard Deviation of the Monthly Excess Return. Mkt is the excess return
on the Market Proxy. SMB, HML, IHML, PR1YR, W x US, US Bd, W Gvt BD, Emerg Mkt BD, Default and Comm. are factors added to adjust for
size, book-to-market, one-year return momentum and for the fact that some funds invest in other than US equity market, in bonds not picked up by the
risk-free rate or in commodities. All numbers in the Table are monthly percentage. *** Significant at the 1% level ** Significant at the 5% level *
Significant at the 10% level.
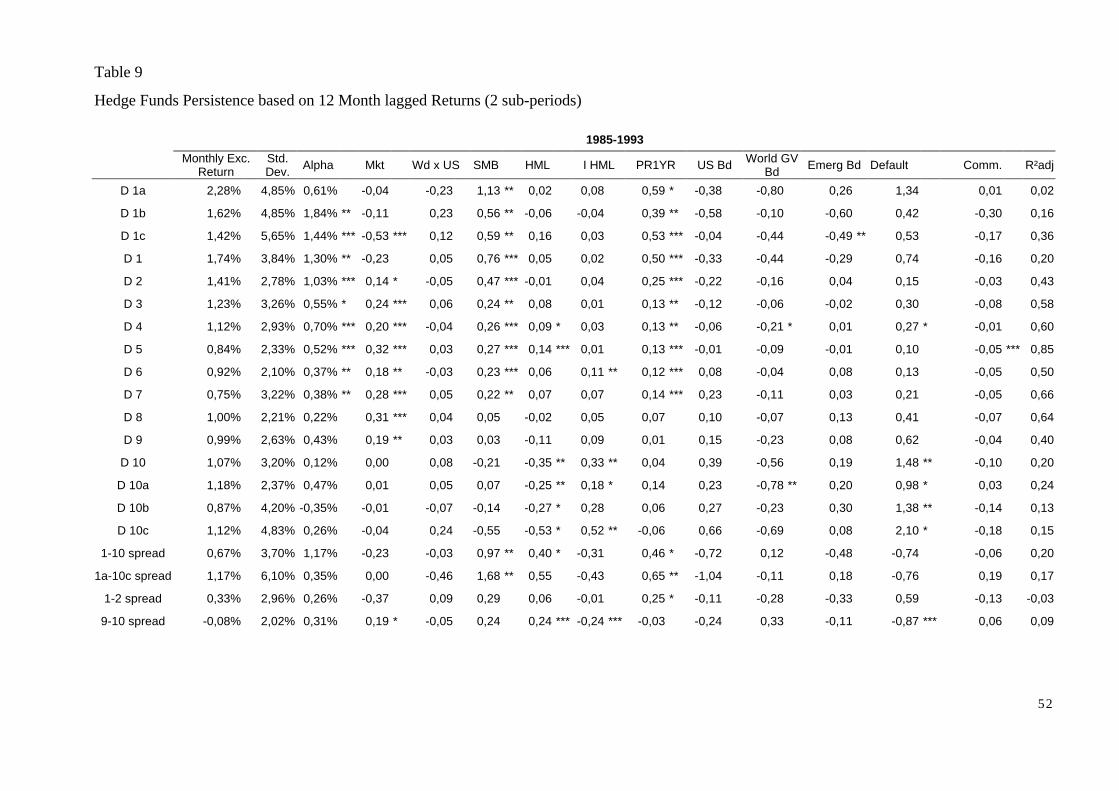
52
Table 9
Hedge Funds Persistence based on 12 Month lagged Returns (2 sub-periods)
1985-1993
Monthly Exc.Return
Std.Dev. Alpha Mkt Wd x US SMB HML I HML PR1YR US Bd World GV
Bd Emerg Bd Default Comm. R²adj
D 1a 2,28% 4,85% 0,61% -0,04 -0,23 1,13 ** 0,02 0,08 0,59 * -0,38 -0,80 0,26 1,34 0,01 0,02
D 1b 1,62% 4,85% 1,84% ** -0,11 0,23 0,56 ** -0,06 -0,04 0,39 ** -0,58 -0,10 -0,60 0,42 -0,30 0,16
D 1c 1,42% 5,65% 1,44% *** -0,53 *** 0,12 0,59 ** 0,16 0,03 0,53 *** -0,04 -0,44 -0,49 ** 0,53 -0,17 0,36
D 1 1,74% 3,84% 1,30% ** -0,23 0,05 0,76 *** 0,05 0,02 0,50 *** -0,33 -0,44 -0,29 0,74 -0,16 0,20
D 2 1,41% 2,78% 1,03% *** 0,14 * -0,05 0,47 *** -0,01 0,04 0,25 *** -0,22 -0,16 0,04 0,15 -0,03 0,43
D 3 1,23% 3,26% 0,55% * 0,24 *** 0,06 0,24 ** 0,08 0,01 0,13 ** -0,12 -0,06 -0,02 0,30 -0,08 0,58
D 4 1,12% 2,93% 0,70% *** 0,20 *** -0,04 0,26 *** 0,09 * 0,03 0,13 ** -0,06 -0,21 * 0,01 0,27 * -0,01 0,60
D 5 0,84% 2,33% 0,52% *** 0,32 *** 0,03 0,27 *** 0,14 *** 0,01 0,13 *** -0,01 -0,09 -0,01 0,10 -0,05 *** 0,85
D 6 0,92% 2,10% 0,37% ** 0,18 ** -0,03 0,23 *** 0,06 0,11 ** 0,12 *** 0,08 -0,04 0,08 0,13 -0,05 0,50
D 7 0,75% 3,22% 0,38% ** 0,28 *** 0,05 0,22 ** 0,07 0,07 0,14 *** 0,23 -0,11 0,03 0,21 -0,05 0,66
D 8 1,00% 2,21% 0,22% 0,31 *** 0,04 0,05 -0,02 0,05 0,07 0,10 -0,07 0,13 0,41 -0,07 0,64
D 9 0,99% 2,63% 0,43% 0,19 ** 0,03 0,03 -0,11 0,09 0,01 0,15 -0,23 0,08 0,62 -0,04 0,40
D 10 1,07% 3,20% 0,12% 0,00 0,08 -0,21 -0,35 ** 0,33 ** 0,04 0,39 -0,56 0,19 1,48 ** -0,10 0,20
D 10a 1,18% 2,37% 0,47% 0,01 0,05 0,07 -0,25 ** 0,18 * 0,14 0,23 -0,78 ** 0,20 0,98 * 0,03 0,24
D 10b 0,87% 4,20% -0,35% -0,01 -0,07 -0,14 -0,27 * 0,28 0,06 0,27 -0,23 0,30 1,38 ** -0,14 0,13
D 10c 1,12% 4,83% 0,26% -0,04 0,24 -0,55 -0,53 * 0,52 ** -0,06 0,66 -0,69 0,08 2,10 * -0,18 0,15
1-10 spread 0,67% 3,70% 1,17% -0,23 -0,03 0,97 ** 0,40 * -0,31 0,46 * -0,72 0,12 -0,48 -0,74 -0,06 0,20
1a-10c spread 1,17% 6,10% 0,35% 0,00 -0,46 1,68 ** 0,55 -0,43 0,65 ** -1,04 -0,11 0,18 -0,76 0,19 0,17
1-2 spread 0,33% 2,96% 0,26% -0,37 0,09 0,29 0,06 -0,01 0,25 * -0,11 -0,28 -0,33 0,59 -0,13 -0,03
9-10 spread -0,08% 2,02% 0,31% 0,19 * -0,05 0,24 0,24 *** -0,24 *** -0,03 -0,24 0,33 -0,11 -0,87 *** 0,06 0,09
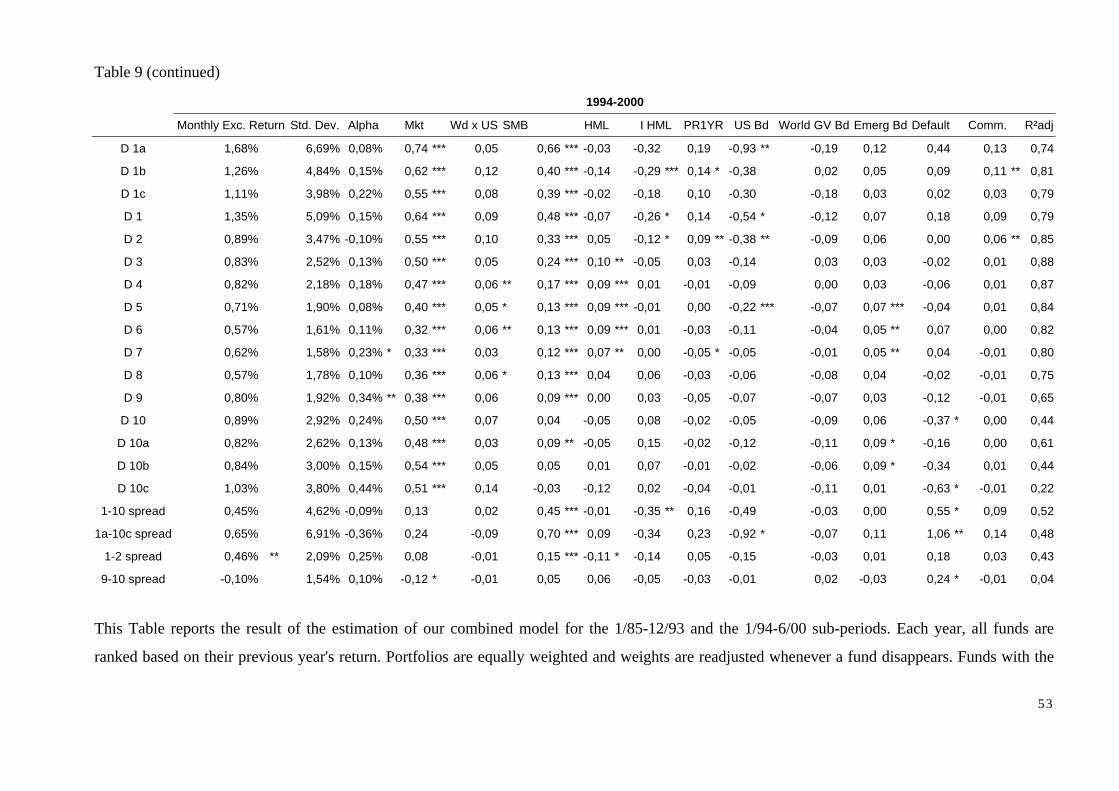
53
Table 9 (continued)
1994-2000
Monthly Exc. Return Std. Dev. Alpha Mkt Wd x US SMB HML I HML PR1YR US Bd World GV Bd Emerg Bd Default Comm. R²adj
D 1a 1,68% 6,69% 0,08% 0,74 *** 0,05 0,66 *** -0,03 -0,32 0,19 -0,93 ** -0,19 0,12 0,44 0,13 0,74
D 1b 1,26% 4,84% 0,15% 0,62 *** 0,12 0,40 *** -0,14 -0,29 *** 0,14 * -0,38 0,02 0,05 0,09 0,11 ** 0,81
D 1c 1,11% 3,98% 0,22% 0,55 *** 0,08 0,39 *** -0,02 -0,18 0,10 -0,30 -0,18 0,03 0,02 0,03 0,79
D 1 1,35% 5,09% 0,15% 0,64 *** 0,09 0,48 *** -0,07 -0,26 * 0,14 -0,54 * -0,12 0,07 0,18 0,09 0,79
D 2 0,89% 3,47% -0,10% 0,55 *** 0,10 0,33 *** 0,05 -0,12 * 0,09 ** -0,38 ** -0,09 0,06 0,00 0,06 ** 0,85
D 3 0,83% 2,52% 0,13% 0,50 *** 0,05 0,24 *** 0,10 ** -0,05 0,03 -0,14 0,03 0,03 -0,02 0,01 0,88
D 4 0,82% 2,18% 0,18% 0,47 *** 0,06 ** 0,17 *** 0,09 *** 0,01 -0,01 -0,09 0,00 0,03 -0,06 0,01 0,87
D 5 0,71% 1,90% 0,08% 0,40 *** 0,05 * 0,13 *** 0,09 *** -0,01 0,00 -0,22 *** -0,07 0,07 *** -0,04 0,01 0,84
D 6 0,57% 1,61% 0,11% 0,32 *** 0,06 ** 0,13 *** 0,09 *** 0,01 -0,03 -0,11 -0,04 0,05 ** 0,07 0,00 0,82
D 7 0,62% 1,58% 0,23% * 0,33 *** 0,03 0,12 *** 0,07 ** 0,00 -0,05 * -0,05 -0,01 0,05 ** 0,04 -0,01 0,80
D 8 0,57% 1,78% 0,10% 0,36 *** 0,06 * 0,13 *** 0,04 0,06 -0,03 -0,06 -0,08 0,04 -0,02 -0,01 0,75
D 9 0,80% 1,92% 0,34% ** 0,38 *** 0,06 0,09 *** 0,00 0,03 -0,05 -0,07 -0,07 0,03 -0,12 -0,01 0,65
D 10 0,89% 2,92% 0,24% 0,50 *** 0,07 0,04 -0,05 0,08 -0,02 -0,05 -0,09 0,06 -0,37 * 0,00 0,44
D 10a 0,82% 2,62% 0,13% 0,48 *** 0,03 0,09 ** -0,05 0,15 -0,02 -0,12 -0,11 0,09 * -0,16 0,00 0,61
D 10b 0,84% 3,00% 0,15% 0,54 *** 0,05 0,05 0,01 0,07 -0,01 -0,02 -0,06 0,09 * -0,34 0,01 0,44
D 10c 1,03% 3,80% 0,44% 0,51 *** 0,14 -0,03 -0,12 0,02 -0,04 -0,01 -0,11 0,01 -0,63 * -0,01 0,22
1-10 spread 0,45% 4,62% -0,09% 0,13 0,02 0,45 *** -0,01 -0,35 ** 0,16 -0,49 -0,03 0,00 0,55 * 0,09 0,52
1a-10c spread 0,65% 6,91% -0,36% 0,24 -0,09 0,70 *** 0,09 -0,34 0,23 -0,92 * -0,07 0,11 1,06 ** 0,14 0,48
1-2 spread 0,46% ** 2,09% 0,25% 0,08 -0,01 0,15 *** -0,11 * -0,14 0,05 -0,15 -0,03 0,01 0,18 0,03 0,43
9-10 spread -0,10% 1,54% 0,10% -0,12 * -0,01 0,05 0,06 -0,05 -0,03 -0,01 0,02 -0,03 0,24 * -0,01 0,04
This Table reports the result of the estimation of our combined model for the 1/85-12/93 and the 1/94-6/00 sub-periods. Each year, all funds are
ranked based on their previous year's return. Portfolios are equally weighted and weights are readjusted whenever a fund disappears. Funds with the
54
highest previous year's return go into portfolio D1 and funds with the lowest go into portfolio D10. Monthly Exc Return is the Monthly Excess Return
of the portfolio, Std. Dev. is the Standard Deviation of the Monthly Excess Return. Mkt is the excess return on the Market Proxy. SMB, HML, IHML,
PR1YR, W x US, US Bd, W Gvt BD, Emerg Mkt BD, Default and Comm. are factors added to adjust for size, book-to-market, one-year return
momentum and for the fact that some funds invest in other than US equity market, in bonds not picked up by the risk-free rate or in commodities. All
numbers in the Table are monthly percentage. *** Significant at the 1% level ** Significant at the 5% level * Significant at the 10% level.
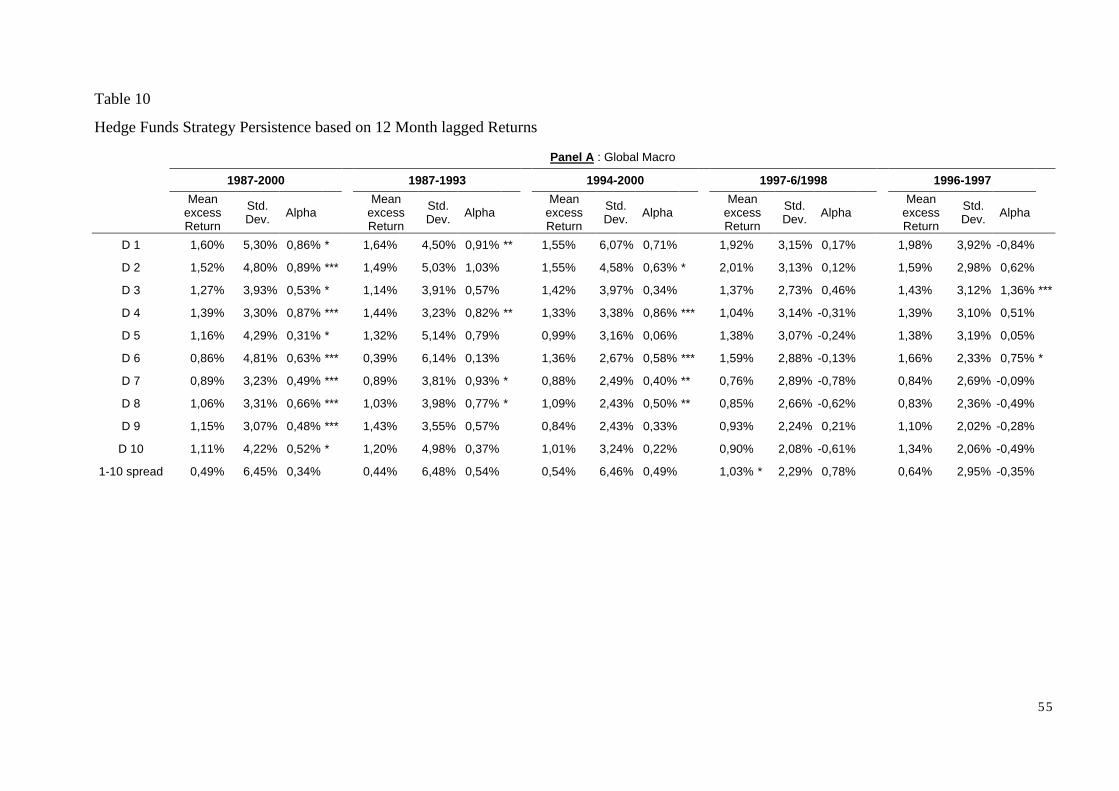
55
Table 10
Hedge Funds Strategy Persistence based on 12 Month lagged Returns
Panel A : Global Macro
1987-2000 1987-1993 1994-2000 1997-6/1998 1996-1997
MeanexcessReturn
Std.Dev. Alpha
MeanexcessReturn
Std.Dev. Alpha
MeanexcessReturn
Std.Dev. Alpha
MeanexcessReturn
Std.Dev. Alpha
MeanexcessReturn
Std.Dev. Alpha
D 1 1,60% 5,30% 0,86% * 1,64% 4,50% 0,91% ** 1,55% 6,07% 0,71% 1,92% 3,15% 0,17% 1,98% 3,92% -0,84%
D 2 1,52% 4,80% 0,89% *** 1,49% 5,03% 1,03% 1,55% 4,58% 0,63% * 2,01% 3,13% 0,12% 1,59% 2,98% 0,62%
D 3 1,27% 3,93% 0,53% * 1,14% 3,91% 0,57% 1,42% 3,97% 0,34% 1,37% 2,73% 0,46% 1,43% 3,12% 1,36% ***
D 4 1,39% 3,30% 0,87% *** 1,44% 3,23% 0,82% ** 1,33% 3,38% 0,86% *** 1,04% 3,14% -0,31% 1,39% 3,10% 0,51%
D 5 1,16% 4,29% 0,31% * 1,32% 5,14% 0,79% 0,99% 3,16% 0,06% 1,38% 3,07% -0,24% 1,38% 3,19% 0,05%
D 6 0,86% 4,81% 0,63% *** 0,39% 6,14% 0,13% 1,36% 2,67% 0,58% *** 1,59% 2,88% -0,13% 1,66% 2,33% 0,75% *
D 7 0,89% 3,23% 0,49% *** 0,89% 3,81% 0,93% * 0,88% 2,49% 0,40% ** 0,76% 2,89% -0,78% 0,84% 2,69% -0,09%
D 8 1,06% 3,31% 0,66% *** 1,03% 3,98% 0,77% * 1,09% 2,43% 0,50% ** 0,85% 2,66% -0,62% 0,83% 2,36% -0,49%
D 9 1,15% 3,07% 0,48% *** 1,43% 3,55% 0,57% 0,84% 2,43% 0,33% 0,93% 2,24% 0,21% 1,10% 2,02% -0,28%
D 10 1,11% 4,22% 0,52% * 1,20% 4,98% 0,37% 1,01% 3,24% 0,22% 0,90% 2,08% -0,61% 1,34% 2,06% -0,49%
1-10 spread 0,49% 6,45% 0,34% 0,44% 6,48% 0,54% 0,54% 6,46% 0,49% 1,03% * 2,29% 0,78% 0,64% 2,95% -0,35%
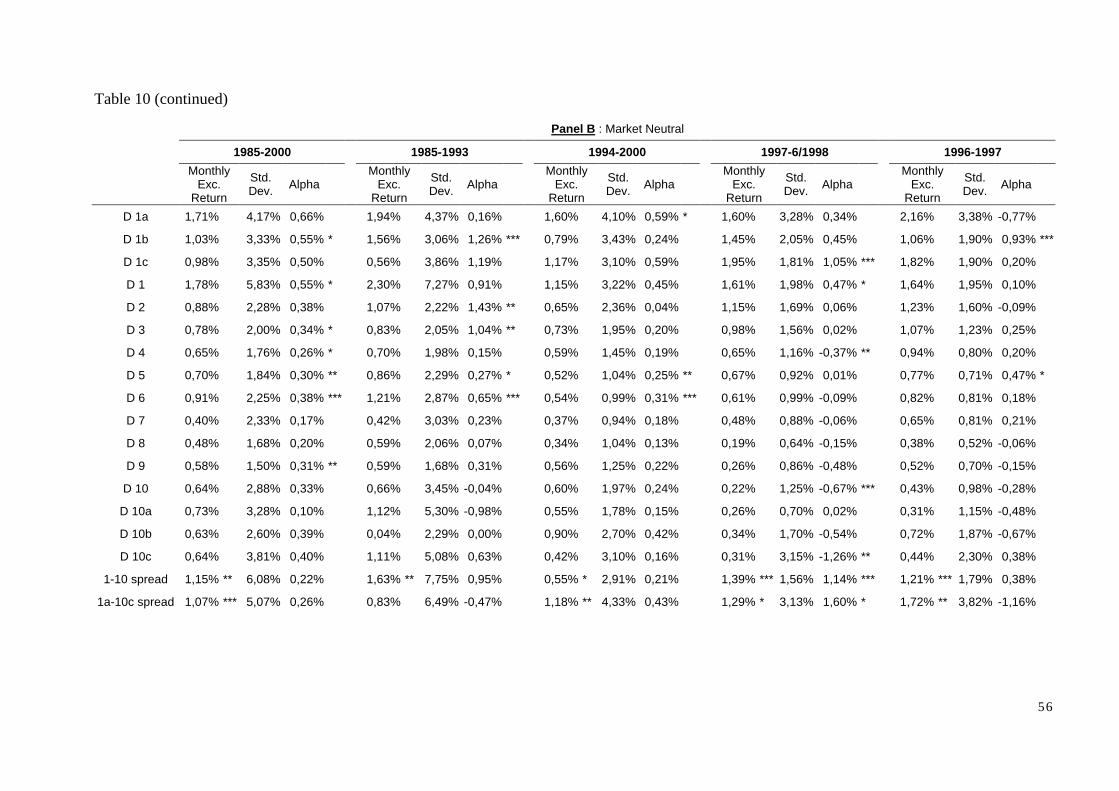
56
Table 10 (continued)
Panel B : Market Neutral
1985-2000 1985-1993 1994-2000 1997-6/1998 1996-1997
MonthlyExc.
Return
Std.Dev. Alpha
MonthlyExc.
Return
Std.Dev. Alpha
MonthlyExc.
Return
Std.Dev. Alpha
MonthlyExc.
Return
Std.Dev. Alpha
MonthlyExc.
Return
Std.Dev. Alpha
D 1a 1,71% 4,17% 0,66% 1,94% 4,37% 0,16% 1,60% 4,10% 0,59% * 1,60% 3,28% 0,34% 2,16% 3,38% -0,77%
D 1b 1,03% 3,33% 0,55% * 1,56% 3,06% 1,26% *** 0,79% 3,43% 0,24% 1,45% 2,05% 0,45% 1,06% 1,90% 0,93% ***
D 1c 0,98% 3,35% 0,50% 0,56% 3,86% 1,19% 1,17% 3,10% 0,59% 1,95% 1,81% 1,05% *** 1,82% 1,90% 0,20%
D 1 1,78% 5,83% 0,55% * 2,30% 7,27% 0,91% 1,15% 3,22% 0,45% 1,61% 1,98% 0,47% * 1,64% 1,95% 0,10%
D 2 0,88% 2,28% 0,38% 1,07% 2,22% 1,43% ** 0,65% 2,36% 0,04% 1,15% 1,69% 0,06% 1,23% 1,60% -0,09%
D 3 0,78% 2,00% 0,34% * 0,83% 2,05% 1,04% ** 0,73% 1,95% 0,20% 0,98% 1,56% 0,02% 1,07% 1,23% 0,25%
D 4 0,65% 1,76% 0,26% * 0,70% 1,98% 0,15% 0,59% 1,45% 0,19% 0,65% 1,16% -0,37% ** 0,94% 0,80% 0,20%
D 5 0,70% 1,84% 0,30% ** 0,86% 2,29% 0,27% * 0,52% 1,04% 0,25% ** 0,67% 0,92% 0,01% 0,77% 0,71% 0,47% *
D 6 0,91% 2,25% 0,38% *** 1,21% 2,87% 0,65% *** 0,54% 0,99% 0,31% *** 0,61% 0,99% -0,09% 0,82% 0,81% 0,18%
D 7 0,40% 2,33% 0,17% 0,42% 3,03% 0,23% 0,37% 0,94% 0,18% 0,48% 0,88% -0,06% 0,65% 0,81% 0,21%
D 8 0,48% 1,68% 0,20% 0,59% 2,06% 0,07% 0,34% 1,04% 0,13% 0,19% 0,64% -0,15% 0,38% 0,52% -0,06%
D 9 0,58% 1,50% 0,31% ** 0,59% 1,68% 0,31% 0,56% 1,25% 0,22% 0,26% 0,86% -0,48% 0,52% 0,70% -0,15%
D 10 0,64% 2,88% 0,33% 0,66% 3,45% -0,04% 0,60% 1,97% 0,24% 0,22% 1,25% -0,67% *** 0,43% 0,98% -0,28%
D 10a 0,73% 3,28% 0,10% 1,12% 5,30% -0,98% 0,55% 1,78% 0,15% 0,26% 0,70% 0,02% 0,31% 1,15% -0,48%
D 10b 0,63% 2,60% 0,39% 0,04% 2,29% 0,00% 0,90% 2,70% 0,42% 0,34% 1,70% -0,54% 0,72% 1,87% -0,67%
D 10c 0,64% 3,81% 0,40% 1,11% 5,08% 0,63% 0,42% 3,10% 0,16% 0,31% 3,15% -1,26% ** 0,44% 2,30% 0,38%
1-10 spread 1,15% ** 6,08% 0,22% 1,63% ** 7,75% 0,95% 0,55% * 2,91% 0,21% 1,39% *** 1,56% 1,14% *** 1,21% *** 1,79% 0,38%
1a-10c spread 1,07% *** 5,07% 0,26% 0,83% 6,49% -0,47% 1,18% ** 4,33% 0,43% 1,29% * 3,13% 1,60% * 1,72% ** 3,82% -1,16%
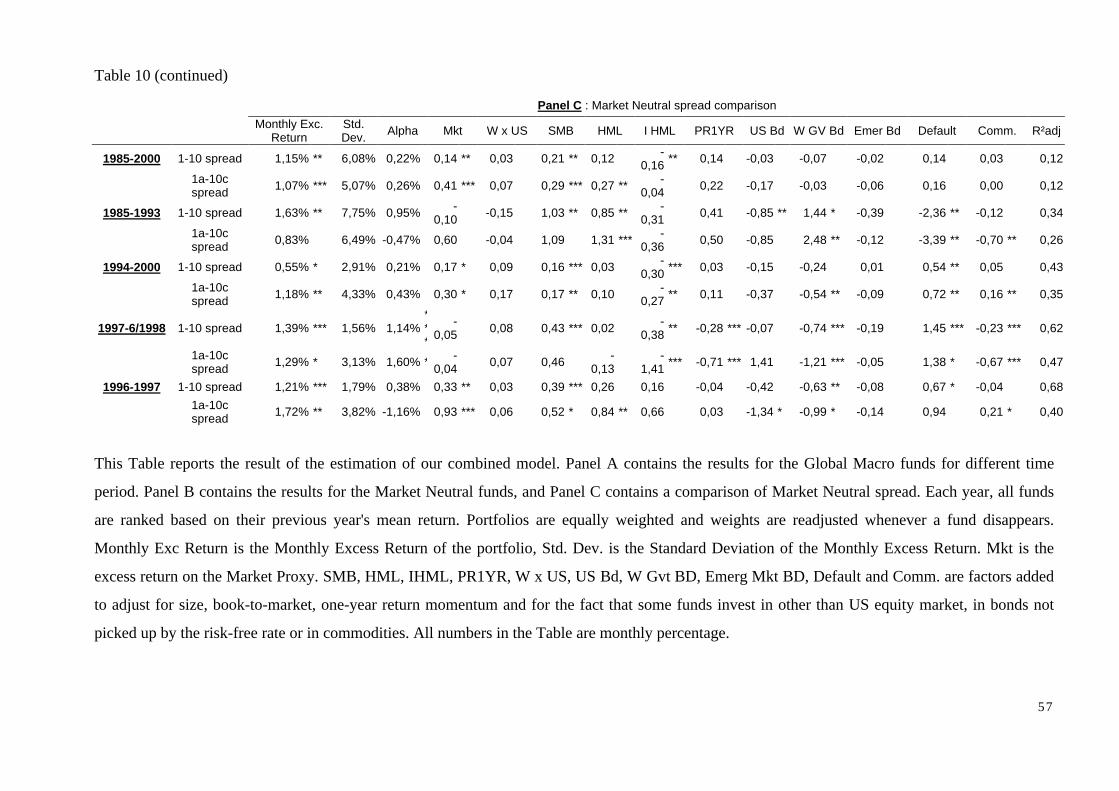
57
Table 10 (continued)
Panel C : Market Neutral spread comparison
Monthly Exc.Return
Std.Dev. Alpha Mkt W x US SMB HML I HML PR1YR US Bd W GV Bd Emer Bd Default Comm. R²adj
1985-2000 1-10 spread 1,15% ** 6,08% 0,22% 0,14 ** 0,03 0,21 ** 0,12 -0,16 ** 0,14 -0,03 -0,07 -0,02 0,14 0,03 0,12
1a-10cspread 1,07% *** 5,07% 0,26% 0,41 *** 0,07 0,29 *** 0,27 ** -
0,04 0,22 -0,17 -0,03 -0,06 0,16 0,00 0,12
1985-1993 1-10 spread 1,63% ** 7,75% 0,95% -0,10 -0,15 1,03 ** 0,85 ** -
0,31 0,41 -0,85 ** 1,44 * -0,39 -2,36 ** -0,12 0,34
1a-10cspread 0,83% 6,49% -0,47% 0,60 -0,04 1,09 1,31 *** -
0,36 0,50 -0,85 2,48 ** -0,12 -3,39 ** -0,70 ** 0,26
1994-2000 1-10 spread 0,55% * 2,91% 0,21% 0,17 * 0,09 0,16 *** 0,03 -0,30 *** 0,03 -0,15 -0,24 0,01 0,54 ** 0,05 0,43
1a-10cspread 1,18% ** 4,33% 0,43% 0,30 * 0,17 0,17 ** 0,10 -
0,27 ** 0,11 -0,37 -0,54 ** -0,09 0,72 ** 0,16 ** 0,35
1997-6/1998 1-10 spread 1,39% *** 1,56% 1,14%***
-0,05 0,08 0,43 *** 0,02 -
0,38 ** -0,28 *** -0,07 -0,74 *** -0,19 1,45 *** -0,23 *** 0,62
1a-10cspread 1,29% * 3,13% 1,60% * -
0,04 0,07 0,46 -0,13
-1,41 *** -0,71 *** 1,41 -1,21 *** -0,05 1,38 * -0,67 *** 0,47
1996-1997 1-10 spread 1,21% *** 1,79% 0,38% 0,33 ** 0,03 0,39 *** 0,26 0,16 -0,04 -0,42 -0,63 ** -0,08 0,67 * -0,04 0,68
1a-10cspread 1,72% ** 3,82% -1,16% 0,93 *** 0,06 0,52 * 0,84 ** 0,66 0,03 -1,34 * -0,99 * -0,14 0,94 0,21 * 0,40
This Table reports the result of the estimation of our combined model. Panel A contains the results for the Global Macro funds for different time
period. Panel B contains the results for the Market Neutral funds, and Panel C contains a comparison of Market Neutral spread. Each year, all funds
are ranked based on their previous year's mean return. Portfolios are equally weighted and weights are readjusted whenever a fund disappears.
Monthly Exc Return is the Monthly Excess Return of the portfolio, Std. Dev. is the Standard Deviation of the Monthly Excess Return. Mkt is the
excess return on the Market Proxy. SMB, HML, IHML, PR1YR, W x US, US Bd, W Gvt BD, Emerg Mkt BD, Default and Comm. are factors added
to adjust for size, book-to-market, one-year return momentum and for the fact that some funds invest in other than US equity market, in bonds not
picked up by the risk-free rate or in commodities. All numbers in the Table are monthly percentage.