Embed Size (px)
Citation preview
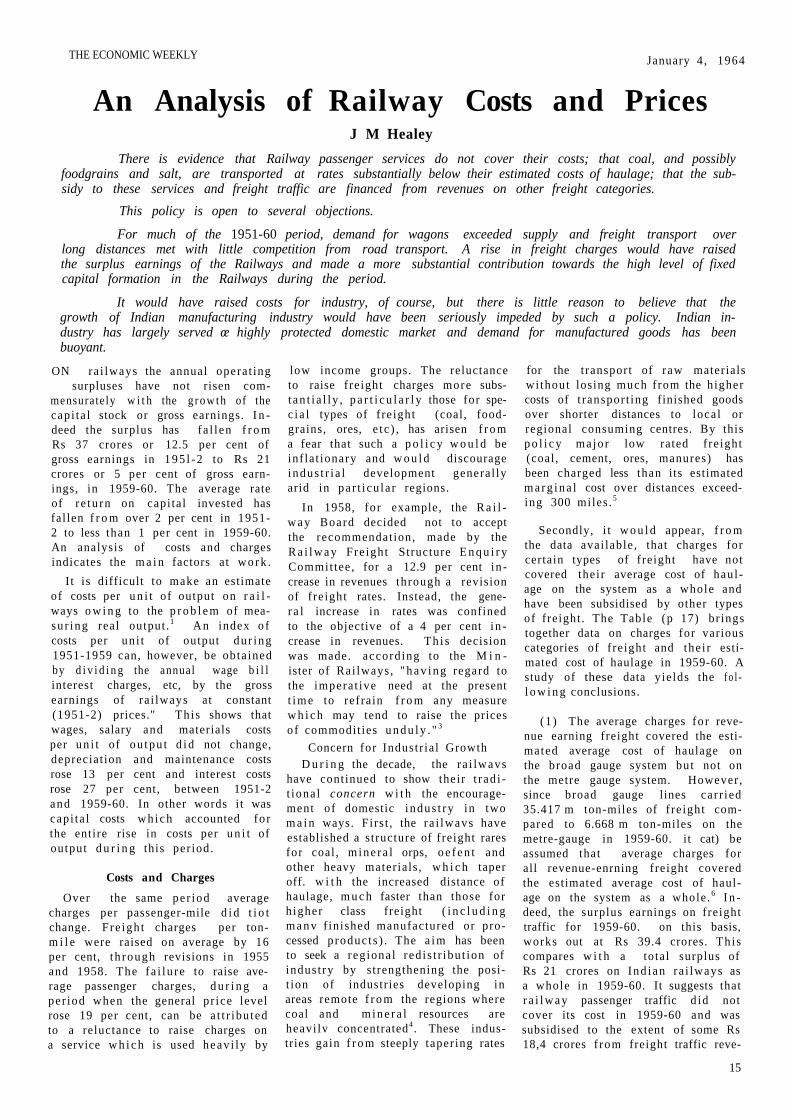
There is evidence that Railway passenger services do not cover their costs; that coal, and possibly foodgrains and salt, are transported at rates substantially below their estimated costs of haulage; that the subsidy to these services and freight traffic are financed from revenues on other freight categories.
This policy is open to several objections.
For much of the 1951-60 period, demand for wagons exceeded supply and freight transport over long distances met with little competition from road transport. A rise in freight charges would have raised the surplus earnings of the Railways and made a more substantial contribution towards the high level of fixed capital formation in the Railways during the period.
It would have raised costs for industry, of course, but there is little reason to believe that the growth of Indian manufacturing industry would have been seriously impeded by such a policy. Indian industry has largely served œ highly protected domestic market and demand for manufactured goods has been buoyant.
ON ra i lways the annual opera t ing surpluses have not risen com-
mensurately w i t h the g rowth of the cap i ta l stock or gross earnings. I n deed the surplus has fa l l en f r o m Rs 37 crores or 12.5 per cent of gross earnings in 1 9 5 l - 2 to Rs 21 crores or 5 per cent of gross earnings, in 1959-60. The average rate of r e tu rn on capi ta l invested has fal len f r o m over 2 per cent in 1951-2 to less than 1 per cent in 1959-60. An analysis of costs and charges indicates the m a i n factors at w o r k .
I t is difficult to make an estimate of costs per u n i t of output on r a i l ways o w i n g to the p r o b l e m of measu r ing real output .1 An index o f costs per un i t of output du r ing 1951-1959 can, however, be obta ined by d i v i d i n g the annual wage b i l l interest charges, etc, by the gross earnings of ra i lways at constant (1951-2) prices." Th is shows that wages, salary and materials costs per u n i t of ou tpu t d i d not change, depreciat ion and maintenance costs rose 13 per cent and interest costs rose 27 per cent, between 1951-2 and 1959-60. In other words i t was capi ta l costs wh ich accounted for the entire rise in costs per u n i t of output d u r i n g this per iod.
Costs and Charges
Over the same per iod average charges per passenger-mile d i d t i o t change. F re igh t charges per ton-m i l e were raised on average by 16 per cent, t h rough revisions in 1955 and 1958. The f a i lu re to raise ave-rage passenger charges, d u r i n g a per iod when the general pr ice level rose 19 per cent, can be a t t r ibu ted to a reluctance to raise charges on a service w h i c h is used heav i ly by
low income groups. The reluctance to raise f re ight charges more subst an t i a l l y , p a r t i c u l a r l y those for spec i a l types of f re ight (coal, food-grains, ores, e t c ) , has arisen f r o m a fear that such a p o l i c y w o u l d be inf la t ionary and w o u l d discourage indus t r i a l development general ly arid in pa r t i cu la r regions.
In 1958, for example, the R a i l w a y Board decided not to accept the recommendat ion, made by the R a i l w a y Fre ight Structure E n q u i r y Commit tee , for a 12.9 per cent i n crease in revenues through a revision of f re ight rates. Instead, the gener a l increase in rates was confined to the objective of a 4 per cent i n crease in revenues. T h i s decision was made. accord ing to the M i n ister of Rai lways , " h a v i n g regard to the impera t ive need at the present t i m e to refrain f r o m any measure w h i c h may tend to raise the prices o f commodit ies u n d u l y . " 3
Concern for Industr ia l Growth D u r i n g the decade, the ra i lwavs
have continued to show their t r ad i t iona l concern w i t h the encouragement of domestic i ndus t ry in two m a i n ways. Firs t , the ra i lwavs have established a structure of freight rares for coal, m ine ra l orps, o e f e n t and other heavy materials , w h i c h taper off. w i t h the increased distance of haulage, m u c h faster than those for h igher class freight ( i n c l u d i n g m a n v f inished manufactured or processed p roduc t s ) . The a i m has been to seek a reg iona l red i s t r ibu t ion of indus t ry by strengthening the posit ion of industries developing in areas remote f r o m the regions where coal and m i n e r a l resources are heavi lv concentrated4 . These industries gain f r o m steeply taper ing rates
for the t ransport of raw materials wi thout losing much f rom the h igher costs of t ranspor t ing finished goods over shorter distances to loca l or regional consuming centres. By this p o l i c y ma jo r low rated f re ight (coal , cement, ores, manures) has been charged less than its estimated m a r g i n a l cost over distances exceeding 300 miles . 5
Secondly, i t w o u l d appear, f r o m the data avai lable , that charges for certain types of f reight have not covered thei r average cost of haul age on the system as a whole and have been subsidised by other types of freight . The Table (p 17) br ings together data on charges for various categories of f re ight and the i r estimated cost of haulage in 1959-60. A study of these data yie lds the f o l l o w i n g conclusions.
( 1 ) The average charges fo r revenue earning freight covered the estimated average cost of haulage on the broad gauge system but not on the metre gauge system. However , since broad gauge lines car r ied 35.417 m ton-miles of f re ight compared to 6.668 m ton-miles on the metre-gauge in 1959-60. it cat) be assumed that average charges for all revenue-enrning freight covered the estimated average cost of haulage on the system as a whole . 6 I n deed, the surplus earnings on freight traffic for 1959-60. on this basis, works out at Rs 39.4 crores. Th i s compares w i t h a tota l surplus of Rs 21 crores on Ind ian ra i lways as a whole in 1959-60. It suggests that r a i l w a y passenger traffic d id not cover its cost in 1959-60 and was subsidised to the extent of some Rs 18,4 crores f rom freight traffic reve-
15
THE ECONOMIC WEEKLY January 4 , 1964
An Analysis of Railway Costs and Prices J M Healey
January 1, 1964 T H E E C O N O M I C W E E K L Y
nues; a conclusion wh ich w o u l d not he unexpected in view of the un-changed passenger fares and r i s ing overhead costs indicated earl ier .
( 2 ) Estimated costs of haulage of a l l revenue-earning freight on the metre gauge were about 90 per cent higher per ton-mi le than on the metre gauge system.7 A l t h o u g h charges on the metre gauge were also h igher they s t i l l fa i led to cover
costs for both coal and other revenue earning freight ,
(3 ) The average charge for revenue ea rn ing coal freight d i d not cover its estimated cost of haulage per ton -mi le on either broad or metre gauge and the discrepancy, or subsidy fo r coal freight , was 13.5 per cent of the cost per ton-mi le on the broad gauge and as m u c h as 41.5 per cent on the metre gauge,
It can be calculated on this basis t h a t for the whole system, the to ta l annual loss a t t r ibu tab le to revenue-earn ing coal f re ight in 1959-60 was Rs 5,95 crores.
( 4 ) Est imated costs of haulage are not avai lable for pa r t i cu la r categories other than coal . However, i t is possible, by inference, to make some assessment of the relat ionship between charges and costs

THE ECONOMIC WEEKLY January 4 , I964
for a few commodi t ies . Fi rs t , the cost of h a u l i n g ores is not l i k e l y to be substant ia l ly different f r o m that for coa l ; ores have the same robustness, ease of loading , low risks of carr iage and carr iage in heavy b u l k consignments. Manga- . nese ores have a h igh average length of hau l , approaching that of coal . I r on ores and other ores are hauled on ly ha l f the average distance of coal but this cost ra is ing factor may be offset, to some extent, by the reduced incidence of empty wagon r u n n i n g . It seems reasonable to assume, therefore, that these heavy mater ia ls w o u l d cost l i t t l e more to ca r ry than coal . Tri this case, the charges for these mater ials on both gauges more than covered the i r costs (see Table ) . s
A second, more tentative, inference can be made w i t h respect to f re igh t l ike foodgrains. o i l seeds arid salt. The cost of hau l ing these may we l l approximate to the average cost of hau l ing a l l (non-coal) revenue-earning freight ( fo r which an estimate exists, see T a b l e ) . The lowest costs of haulage apply to ores but c l ea r ly foodgrains, sugar, oilseeds and salt w o u l d 'not be as easily loadable as ores and wou ld need greater protect ion in transit f rom damage and theft. On the other hand, they are transported over long distances and would not be as difficult to handle and hence as costly to transport , as manufactured goods. If the assumption is made that the cost of hau l ing these goods is, in fact, close to the average cost of a l l revenue-earning freight ( exc lud ing coal) then charges for foodgrains and salt f a l l below this cost on both gauges and oilseeds on the metre gauge on ly (see T a b l e ) . This won I d mea n that foodgrains and salt freight i n cur red losses of Rs 8.02 crores and Rs 1.85 crores respectively, in 1959. 60. These losses must have been subsidised f rom other freight revenue since revenue f rom a l l freight traffic covered its cost."
Questionable Subsidy To sum u p : there is evidence
that passenger services d id not cover the i r cost; that coal, and poss ib ly foodgrains and salt, were t ransported at rates substant ia l ly below thei r estimated costs of haul age; that the subsidies to these services and f re igh t were financed f r o m revenues on other f re igh t cate
gories. Th i s p o l i c y is open to sever a l objections.
F i r s t l y , i t can be argued that charges for each service and comm o d i t y should reflect, as closely as is pract icable , thei r own estimated costs, so that the user of these services pays the true cost and the pattern of demand for these differ-e'nt services is not distorted.
Secondly, even if a subsidy to cer ta in services were desired in the nat ional interest, it does not fo l low that it should be financed by charges on other kinds of r a i l w a y freight (as has ac tual ly happened). Th i s m a y have been a convenient arrangement but it was c lear ly preferable for the desired subsidies to
be met f r o m general government revenues.
It is difficult to see the economic jus t i f ica t ion for not revis ing average passenger charges between 1951 and 1959, pa r t i cu l a r ly as they d i d not apparently cover costs in 3959-60. l 0 Keeping charges low and below cost presumably s t imulated demand for passenger services. I f demand was elastic w i t h respect to rates an upward revision of rates wou ld have reduced the pressure on capacity and released resources for investment in f re ight capacity which was under great s t rain d u r i n g this per iod. I f passenger demand had been inelastic then a rise in rates w o u l d have increased the surplus earnings of ra i lways f rom reinvestment.
Table
17

January 4, 1964 T H E E C O N O M I C W E E K L Y

THE ECONOMIC WEEKLY January 4. 1964
d u e f o r Higher Freight Rates
The a i m of the subsidy to coal freight-rates ( w h i c h cost Rs 6 crores i l l 1959-60) was ostensibly to give a general s t imulus to i ndus t r i a l development . However, this subsidy to coal has been financed f r o m charges on other indus t r i a l f re ight , l i k e h i g h rated manufac tured and processed goods (cot ton , i r on and steel, cement, manufactures, sugar and vegetable o i l s ) . Moreover , these in dus t r i a l f re ight have also borne the cost of subsidising passenger services and probably foodgrains and salt charges. Th i s p o l i c y is most un l ikely to have given a net s t imulus to indus t r ia l development in general. I f charges were more closely related to costs, and the subsidy to coal charges had been financed f r o m general government revenues, a more effective s t imulus to indus t ry w o u l d have been given,1 1
Foodgrains and salt f re ight charges have also been kept very low and possibly below their cost. Th i s po l i cy was c lear ly based on equi ty considerations. A l t h o u g h o n l y JO per cent of to ta l foodgrains product i o n and impor ts are ca r r i ed by r a i l , th is is the po r t i on w h i c h is marketed . A large revis ion of food-grains freight charges w o u l d have had a considerable effect on the pr ice of food to u rban low-income consumers especially. However, i f the burden of this subsidy had been planed on general Government revenues, this w o u l d have reduced the d is tor t ion of the f re ight rates s tructure. Salt concession rates also f a l l in to the same category a l though expenditure on salt constituted a smal ler par t of the budget of low-income consumers than foodgrains or high-rated sugar.
Fre igh t charges h i general should have been raised more dras t ica l ly . Fo r m u c h of the 1951-60 per iod the demand for wagons exceeded the supply of wagons and f re igh t t ransport over l o n g distances met l i t t l e compet i t ion f r o m road transp o r t 1 2 A rise in f re ight charges w o u l d have increased the surplus earnings of ra i lways and made a more substantial con t r i bu t ion towards the h i g h level of f ixed capit a l f o r m a t i o n d u r i n g this per iod .
I t w o u l d , of course, have raised costs fo r indus t ry as a whole b u t there is l i t t l e reason to believe tha t the g r o w t h o f I n d i a n manufac tu r ing indus t ry wou ld have been seriously
impeded by such a p o l i c y . I n d i a n indus t ry has l a rge ly served the domestic marke t and has been heavily protected against fore ign compet i t i o n by tariffs and stringent fore ign exchange controls d u r i n g th is per iod . Domestic demand for manufactured goods has been buoyant and i f prices of manufactured goods had been raised this w o u l d have had l i t t l e effect on the cost of l i v i n g index for w o r k i n g class fami l ies .
Conclusion Altogether , there has been scope
for the ra i lways to raise thei r surp lus earnings substant ia l ly to help f inance their large investment prog ramme.
As I M D L i t t l e has said "where it can be seen that a pa r t i cu la r i n dustry could make good profi ts wi thout any apparent ' d i s to r t i on ' of output, then i t seems mani fes t ly wrong that i t should th row the whole burden of finding the savings requi red for its own investment on to the government or the rest of the economy."1 3 Ra i lways d i d f ind some of the i r own savings; between 1955-6 and 1959-60, the total r a i l way surplus of Rs 105 crores financed rather less than 20 per cent of the i r estimated net fixed capi ta l f o r m a t i o n . Rs 256.4 crores and more than 50 per cent was financed by domestic b o r r o w i n g or r u n n i n g down the depreciat ion reserve fund . However, pr ivate large scale undertakings financed a much higher prop o r t i o n of their investment f r o m regained profi ts . Data collected by the Taxa t ion E n q u i r y Commiss ion 1953-4, showed that, f r o m 1946 to 1951, retained prof i ts constituted 57 per cent of net fixed capi ta l format i on by 448 pr iva te manufac tu r ing companies.14 It is t rue that a po l i cy of h igher charges to make the r a i l ways earn a larger surplus Represents a f o r m of indirect taxat ion w h i c h c o u l d be regressive in i t s effects. Th i s m i g h t be t rue for i n creases in r a i l passenger fares. But there is not l i k e l y to be a s ignif i cant effect on low income groups f r o m a rise in indus t r i a l raw mater i a l f re ight charges. In any case, i t was u n l i k e l y that surcharges on r a i l way services w o u l d have been more regressive in their effects than the exis t ing system of indirect taxat ion . 1 5 I t seems more expedient to have adjusted charges on pub l i c undertakings to ensure substantial surplus earnings for reinvestment
wherever possible rather than a l l ow increased purchasing power to rem a i n i n pr iva te hands and t r y t o raise f inance for investment, w i t h more difficulty, th rough market loans, sma l l savings and a tax system w h i c h is slow and subject to evasion.
N o t e s 1 Ton-miles of freight and passenger
miles are not integrable. 2 The main sources of data on railways have been the Railway Board Reports (Annual), Vols I and II
3 Quoted in "The Economic Weekly'' 6 September, 1958. p 1159.
4 The coefficient of localization of coal mining in India in 1951 was 0.67 (P S Florence index). This coeffci-ent was calculated by using the State-wise distribution of employment in coal mines.
5 See Plannnig Commission, G O I, "Preliminary Report of the Committee on Transport Policy and Coordination", New Delhi, 1961, p 87.
6This average cost was calculated by weighting costs and charges by the shares of traffic carried by the broad and metre gauges. It ignored the narrow gauge railways which carry a very small volume of freight,
7 The higher costs on the metre gauge system probably stem from the location of these lines. There are few in the main industrial areas and they are concentrated in areas like the south of Madras State, Rajasthan, Kutch and Assam, where the density of freight traffic is lower. Net ton-miles per route-mile (per year) and per engine-hour were very much lower on the metre gauge than the broad gauge (see "Railway Board Report", Vol I I , Statistics.) Indivisible costs (which would include a substantial proportion of wages and salaries) are not spread so effectively over a larger ton-mileage as on the broad gauge system. It is also noticeable that cost per ton of coal consumed as fuel, on the metre gauge, was generally higher than on the broad gauge, presumably because of the greater remoteness of most of these lines from the coal mining regions.
8 Except for iron ore on the metre gauge where charges just equal the cost of coal haulage.
9 It is interesting to note that the "Preliminary Report on Transport Policy" makes a different calculation. It shows that charges for grains have lagged behind the rise in the overall level of charges, between 1938-9 and 1958-9, It calculates that, if grains rates had risen at the same pace as other rates, the extra earnings from grain freight in 1958-9 (given the same volume of freight) would have been Rs 15 crores. The surplus earn-ings of railways in 1958-9 were Rs 16 crores.
10 It has been estimated above that the loss on passenger traffic may have been about Rs 18.4 crores in 1959.60.
19

January 4, 1964 THE ECONOMIC WEEKLY
11 The subsidised rates for coal have also altered the ratio of raw material costs to finished goods costs. Together with the more rapid taper of rates, for coal and ores compared to finished industrial goods, over long distances, this policy would, by itself, have encouraged the dispersal of industry from the geographically concentrated coal and ore mining areas. This policy, however, has been car
ried out in isolation by the railways and not as part of a national integrated plan. For example, there were disparities in electricity tariffs in neighbouring States (see "Thi rd Five Year Plan", p 406) and these could well have had effects on the location of industry which nullified those intended by the railways.
12 See the figures for outstanding registrations and wagons loaded in the
"Preliminary Report", cit, Appendix
13 "A Critique of Welfare Economics", Oxford. 1951, p 215.
14 Report, Vol I, p 115. 15 ibid, p 68. It is noticeable that reve
nues from highly regressive excise duties rose from 15 per cent to 28 per cent of total tax revenues, between 1951 and 1959.
20