Embed Size (px)
Citation preview

An analysis of recent survey data on the remittances of Pacific island migrants in
Australia
Richard P.C Brown (UQ)Gareth Leeves (U Monash, Malaysia)
Prabha Prayaga (UQ)
Paper presented at ‘Making Pacific Migration Work: Australian and New Zealand Experiences’ A Development Policy Centre Conference, Australian National University,
3 April 2012

Importance of remittances
• Remittances an important factor in – promoting economic development– providing informal, family-based social protection – alleviating poverty, promoting saving, investment and human capital
formation
• Especially important in Pacific island nations with extensive migration since 1950s– remittances relative to GDP among highest in the world– Present study complements our previous surveys in Australia (early
1990s) and PICs (1990s and 2006)
• Regional/rural focus important for policy debate in relation to Pacific Seasonal Worker Pilot Scheme (PSWPS)– World Bank study (Brown et al. 2006) played an important part in
justifying PSWPS but no separate information on rural migrants

Polynesian migration to Australia
Tonga Samoa Cook IslandsPopulation (thous. 2010)
103.7 184 17.8
Ethnic Abroad (thous. 2006)
125 300 70
Migrants (thous. 2006)
100 220 30
GDP/Capita (US$ thous. 2009)
3.32 3.14 9.14
Imports/GDP (2007-10)
36.99 43.23 66.61
Exports/GDP (2007-10)
2.84 2.11 1.78
ODA/GDP (2007-09)
10.00 9.60 3.90
Net Borrowing/GDP (2007-09)
2.31 4.53 0.05
Remittances/GDP (2007-09)
26.90 24.10 n.a.+
Sources: Asian Development Bank (2011a, 2011b, 2011c)+There are no estimates of remittances to Cooks Islands.
34.15
41.12
64.83
26.924.1
60
10 9.6
3.92.314.53
0.050
10
20
30
40
50
60
70
Tonga Samoa Cook Islands
Trade Gap Remittances ODA Net Borrowing
Ow
n E
stim
ate
% o
f GD
P
Ow
n E
stim
ate
Ow
n E
stim
ate
Country Background Demographic and Economic Data
Trade Gap by Source of External Income (2007-2009)

Study focus
• Study migration and characteristics of Pacific islanders in urban and regional Australia (ARC Discovery Grant, 2010-2012)
• Quantify and compare incidence and magnitudes of remittance flows
• in all forms (cash, in-kind, payments to third-parties)• through all channels (formal, informal)• to all recipients in home country (HC) (own household, other
households, charitable institutions (churches), own asset accumulation)
• Main purpose of this paper isTo identify factors and migrant characteristics associated with differences in remittance behaviours for
– different categories of remittance recipient in HC, – the country of origin of the migrant, and – where the migrant lives in Australia (Sydney, Riverina).
The survey
Country of origin Riverina Sydney Total
Tonga 60 173 233
Samoa 73 271 344
Cook Islands 61 186 247
Other 7 6 13
Total 201 636 837
Study sample 194 630 824
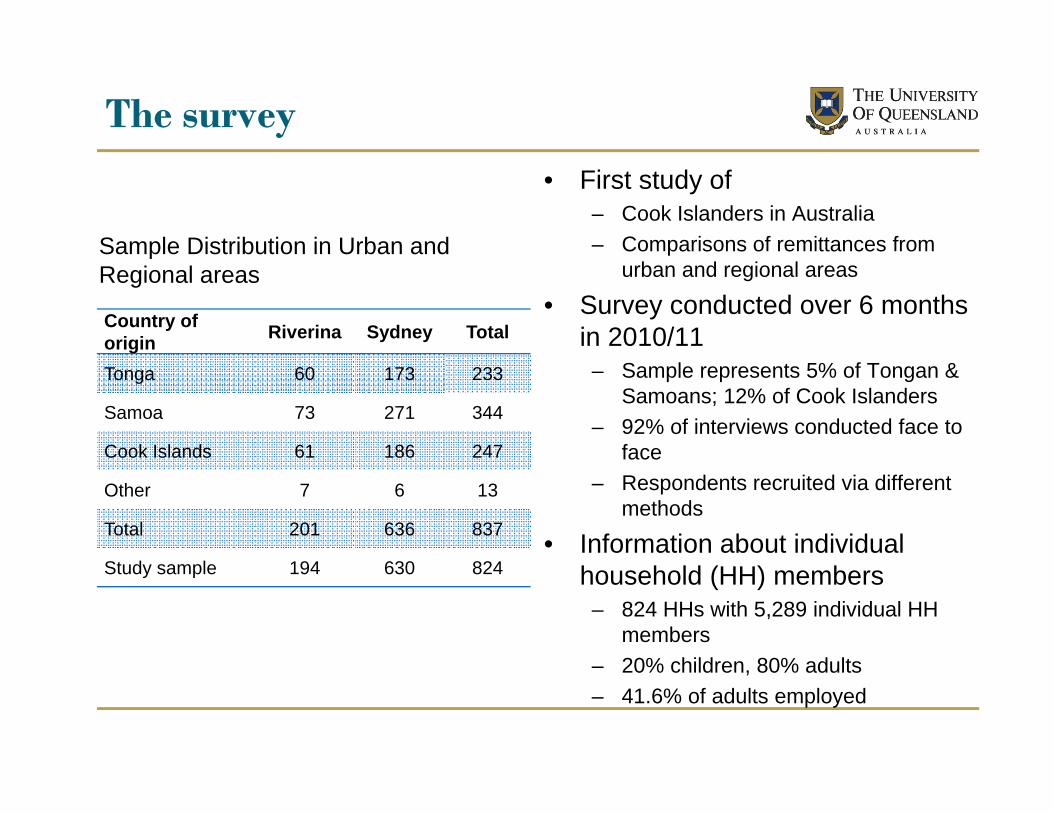
• First study of – Cook Islanders in Australia– Comparisons of remittances from
urban and regional areas
• Survey conducted over 6 months in 2010/11
– Sample represents 5% of Tongan & Samoans; 12% of Cook Islanders
– 92% of interviews conducted face to face
– Respondents recruited via different methods
• Information about individual household (HH) members
– 824 HHs with 5,289 individual HH members
– 20% children, 80% adults– 41.6% of adults employed
Sample Distribution in Urban and Regional areas

Occupation of Employed Migrants
Occupational category N % Skill
category %
Managers 57 3.23
Skilled 15.03Professionals 107 6.07
Technicians & Trade 101 5.73
Community & Personal service
296 16.79
Semi-skilled
46.69
Clerical & Administration
141 8.00
Sales Workers 111 6.30
Machine operators 275 15.60
Labourers 675 38.29Unskilled 38.29
Total Employed 1763 100.00
• Occupation categories – identified based on ANZSCO
tables– further grouped based on skill
level of occupation
• 85% of employed semi-skilled or unskilled
• less than 10% in managers and professionals categories

Migrant Household (HH) Characteristics (Mean values)
Variables Riverina Sydney
Total N=824 N=194 N=630
Household Characteristics
Total HH income (’000) 80.16 99.54Income earners in HH (no.) 2.34 2.34
Income per earner (’000$) 34.84 42.76
Household size (no.) 3.95 4.47
Per capita income (’000$) 22.91 25.54
HH Head Characteristics
Gender Male (%) 84.02 80.83
Age (yrs) 42.08 45.45
Married/de facto (%) 77.32 77.30
Education (yrs) 10.41 10.97
Employed (%) 88.66 84.44
Urban Origin (%) 59.28 77.94
• Urban HHs– earn more than regional HHs
for all countries except Cook Islands
– are larger than regional HHs for all countries except Cook Islands
• Urban HH heads– have lower employment rate
than regional HH heads– number of years of education
similar to regional HH heads– more female HH heads than in
regional areas– have older HH heads than in
regional areas

Migration History of Migrant HHs
Variables Riverina SydneyN=824 N=194 N=630Household Head Characteristics
Total years abroad 21.58 23.81Years in Australia 15.40 18.42Step-Migrant (%) 57.73 56.35Step-Migrant via NZ (%) 53.61 53.02
Household CharacteristicsOther migrants (%) 89.18 96.67Other migrants in Australia (%) 77.84 89.21Other migrants in other countries (%)* 11.34 7.46
Other migrants in USA / UK (%)+ 5.15 9.84
Members in Origin Country (%) 96.91 86.19Parent in Origin Country (%) 55.15 29.05Visitor from Origin Country (%) 38.66 38.10Intent to return (%) 11.34 20.48
• HH head in urban areas have– lived abroad longer than regional
HH heads for all countries– lived longer in Australia than
regional HH heads for all countries– lower step-migration rates than
regional HH heads for all countries except Samoa
• Urban HHs– more have other migrants (OM)
living in Australia than regional HHs– less have other migrants living
exclusively in countries other than Australia than regional HHs
– less have a parent or parent-in-law living in HC than regional HHs
– more expressed an intent to return than regional HHs

Incidence of multiple recipients of a HHs remittances
Recipient Category
Total (N=824) Own HH Institutions Other HHs Own
Assets Exclusively
Own HH 654(84.7%) ‐‐‐‐‐ 490 171 202 123
Institutions 603(78.4%) 490 ‐‐‐‐‐ 172 178 89
Other HHs 196(25.5%) 171 172 ‐‐‐‐‐ 77 2
Own Assets 205(26.7%) 202 178 77 ‐‐‐‐‐ 0
Exclusively 214(27.8%) 123 89 2 0 ‐‐‐‐‐
Total Remitters 769 651 603 196 205 214
• Total remitting HHs in sample 769 (93.9%)• only16% of remitting HHs remitted exclusively to Own HH• 8% of remitting HHs remitted to all categories of recipients• 12% of remitting HHs remitted exclusively to institutions• 64% of remitting HHs remitted to own HH & institutions• only 10% of remitting HHs remitted to Other HHs and Own Assets
Composition of Remittances by Category of Recipient
Own HH60%
Church16%
Other HHs7%
Own Assets17%
Sydney
Own HH71%
Church11%
Other HHs5%
Own Assets13%
Riverina
$5,800/HH
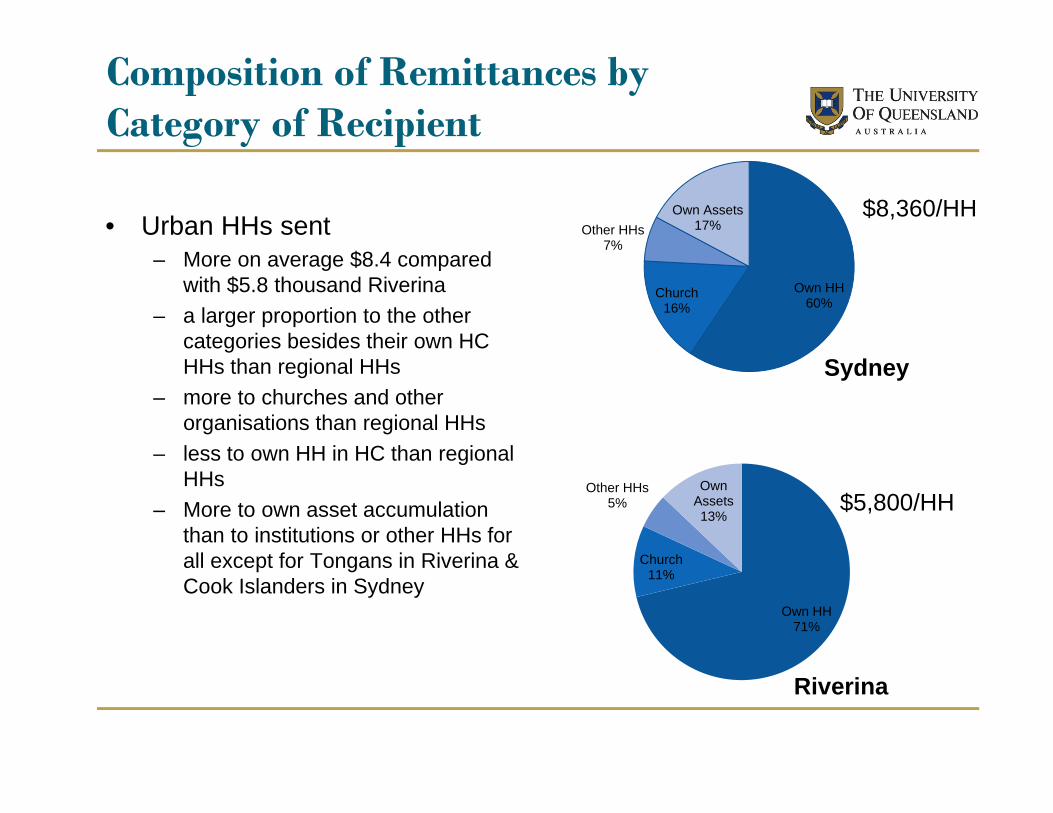
• Urban HHs sent– More on average $8.4 compared
with $5.8 thousand Riverina– a larger proportion to the other
categories besides their own HC HHs than regional HHs
– more to churches and other organisations than regional HHs
– less to own HH in HC than regional HHs
– More to own asset accumulation than to institutions or other HHs for all except for Tongans in Riverina & Cook Islanders in Sydney
$8,360/HH
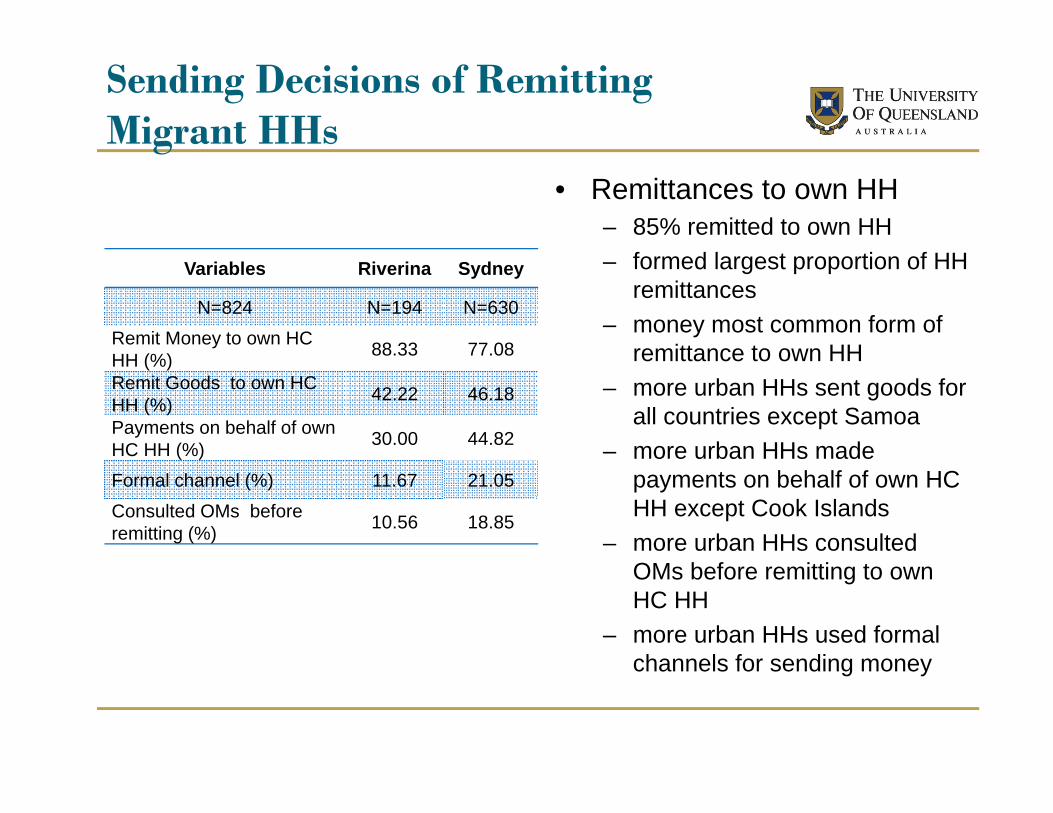
Sending Decisions of Remitting Migrant HHs
Variables Riverina Sydney
N=824 N=194 N=630Remit Money to own HC HH (%) 88.33 77.08
Remit Goods to own HC HH (%) 42.22 46.18
Payments on behalf of own HC HH (%) 30.00 44.82
Formal channel (%) 11.67 21.05Consulted OMs before remitting (%) 10.56 18.85
• Remittances to own HH– 85% remitted to own HH– formed largest proportion of HH
remittances– money most common form of
remittance to own HH– more urban HHs sent goods for
all countries except Samoa – more urban HHs made
payments on behalf of own HC HH except Cook Islands
– more urban HHs consulted OMs before remitting to own HC HH
– more urban HHs used formal channels for sending money

Selected Remittances Variables by Income Category
Income category Bottom 40%
Middle 40%
Top 20%
Number of HH N=807 324 330 153
Riverina 23.15% 28.79% 13.73%
Remitting HH 91.67% 95.76% 92.81%Mean HH remittance ($’000s) 5.75 7.65 9.88
Remittances (% of income) 11.98% 7.60% 6.35%
Using informal channels (%) 17.28% 17.58% 10.46%
HH Head Total years abroad (yrs) 21.92 23.97 24.97
• HHs in regional areas are poorer than in urban areas– lower proportion of high income
HHs in regional areas
• Top income category– highest mean HH remittance
for Tonga but middle 40% for Samoa and Cook Islands
– remittances form a lower proportion of income
– lowest use of formal channels for sending money

Remittances by Income Category and Country of Origin
• Similar proportion of HHs remit for all income categories– for all countries except Cook
Islands
• Tongans have a strong positive relationship between income & remittance levels
• Remittances as a proportion of income decline as income increases– for all countries except Tonga
• Remittances by Cook Islanders much less but still about 10% of GDP from Aus (another 50% GDP from NZ?)

Selected Remittance Variables by Length of Absence (LOA) of HH head
Length of absence (years) 0-5 5-10 10-15 15-20 20-25 25+
N=824 39 68 118 131 159 309
Proportion HHs in category (%) 4.73 8.25 14.32 15.90 19.30 37.50
Riverina (%) 53.85 30.88 15.25 25.95 26.42 18.77
Remitters (%) 89.74 94.12 95.76 90.84 94.34 93.20
Mean per capita income (’000$) 25.18 23.03 21.31 23.94 25.62 26.69
Mean HH remittance(’000$) 5.21 7.15 6.39 6.44 7.46 8.09
Remittances as % of income 10.19 10.01 8.16 10.21 9.35 8.57
Intent to return(%) 7.69 22.06 20.34 18.32 18.24 18.12
• Majority of HH heads have been abroad for more than 25 years
• Most recent cohort – More live in the Riverina– Fewer intend to return– Relatively high pc income– Remit lowest amounts– Remit similar % of income
• Remittances positivelyassociated with LOA(possible ‘cohort effect’)
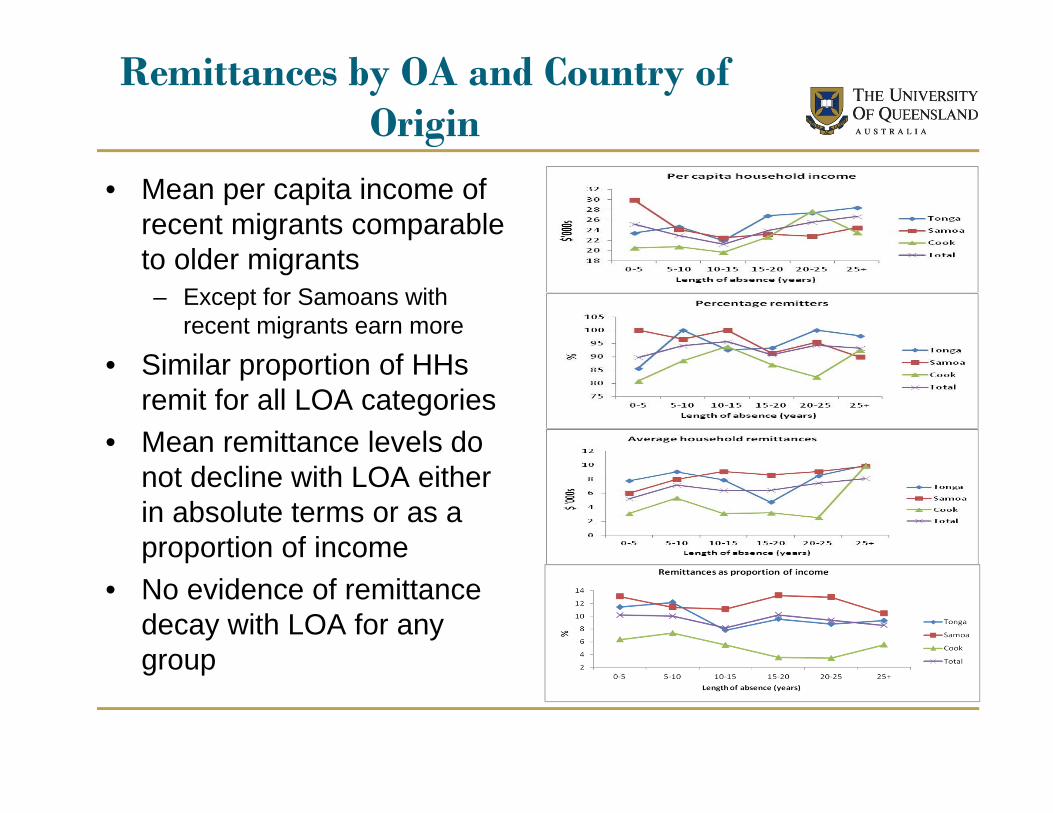
Remittances by OA and Country of Origin
• Mean per capita income of recent migrants comparable to older migrants– Except for Samoans with
recent migrants earn more
• Similar proportion of HHs remit for all LOA categories
• Mean remittance levels do not decline with LOA either in absolute terms or as a proportion of income
• No evidence of remittance decay with LOA for any group
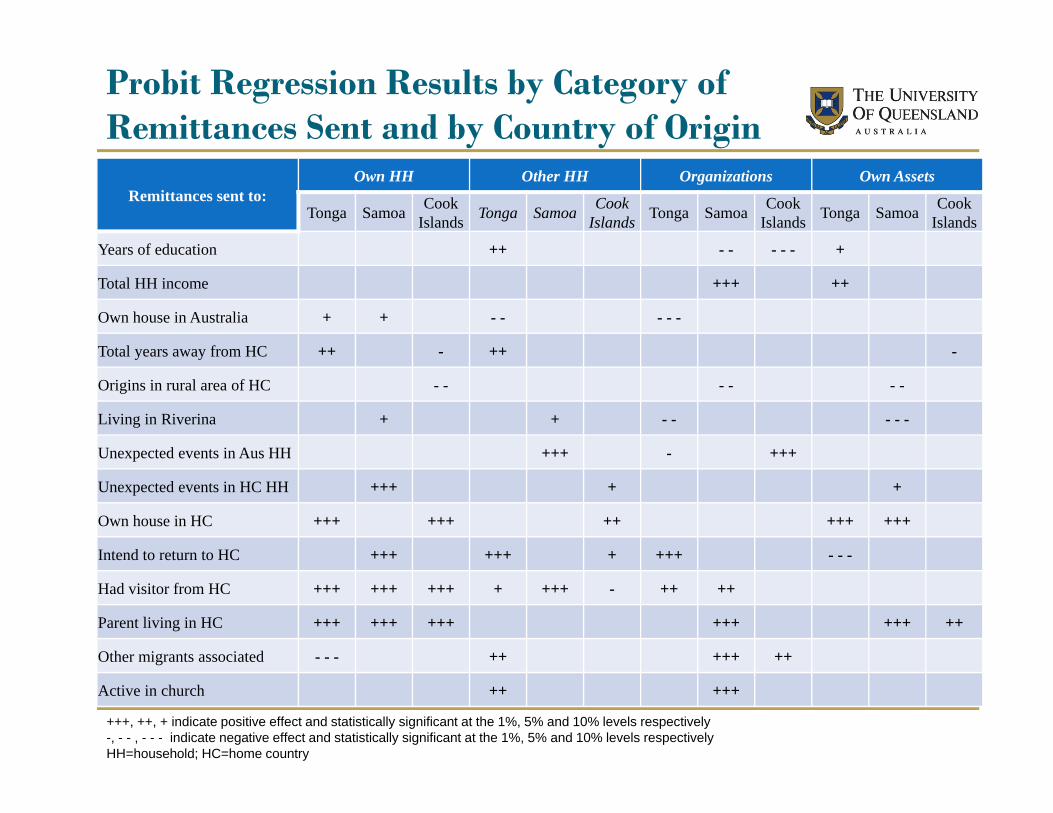
Probit Regression Results by Category of Remittances Sent and by Country of Origin
Remittances sent to:Own HH Other HH Organizations Own Assets
Tonga Samoa Cook Islands Tonga Samoa Cook
Islands Tonga Samoa Cook Islands Tonga Samoa Cook
Islands
Years of education ++ - - - - - +
Total HH income +++ ++
Own house in Australia + + - - - - -
Total years away from HC ++ - ++ -
Origins in rural area of HC - - - - - -
Living in Riverina + + - - - - -
Unexpected events in Aus HH +++ - +++
Unexpected events in HC HH +++ + +
Own house in HC +++ +++ ++ +++ +++
Intend to return to HC +++ +++ + +++ - - -
Had visitor from HC +++ +++ +++ + +++ - ++ ++
Parent living in HC +++ +++ +++ +++ +++ ++
Other migrants associated - - - ++ +++ ++
Active in church ++ +++
+++, ++, + indicate positive effect and statistically significant at the 1%, 5% and 10% levels respectively-, - - , - - - indicate negative effect and statistically significant at the 1%, 5% and 10% levels respectivelyHH=household; HC=home country

Econometric estimation – preliminary findings• Models for each of the recipients
– Own HH, Other HHs, Institutions, Own asset accumulation– Variables in models include
• observable characteristics of remitting HHs• unexpected shocks to the migrant HHs in Australia and HC• social networks of migrant HHs and their strength of association with HC
• Summary of findings– Samoans in Riverina more likely to remit to own and other HHs– Duration of LOA of HH head does have a negative relationship – Remittances not affected by HH income except for
• Samoans remitting to an organization and Tongans remitting towards own asset accumulation
– Strength of association with HC variables have a positive effect on one or more remittance recipients
• Intention to return is positively associated for remittances to other HHs for Tongans and Cook Islanders

Concluding remarks
• Study contributions– inclusion of Cook Islanders first in Australia and first remittances study
since 1980s (remittances could be 60% of GDP)– our dataset allows for disaggregation of remittances by recipient category– Also allows for comparative analysis of migrants in urban and regional
areas and from three countries
• Initial findings include– household income not associated with the probability of remitting or the
amount remitted– LOA not associated with decline in probability of remitting or amount
remitted– migrants’ strength of association with HC strongly associated with remitting– Preliminary regression modeling suggests regional migrants remit less
beyond own HH– Most migrants prefer informal transfer channels, especially the wealthiest
and those living in Riverina
Concluding remarks
• Further empirical analysis of:– factors associated with
• amounts and composition of remittances • choice of urban vs regional residential location (incl. expected income differential)• method/channel of remittance transfer (informal vs formal)
– roles of ‘sharing norms’, community pressures and church affiliation on remittances
• Limitations of single cross-sectional dataset– Methodological challenges establishing causality– Length of absence not necessarily capturing effect of time away
• Survey designed as first wave of longitudinal study– Respondents’ names and addresses retained– Additional research funding to be sought for repeat surveys
THANK YOU!

An analysis of recent survey data on the remittances of Pacific island migrants in Australia
Richard P.C Brown, School of Economics, University of Queensland Gareth Leeves, School of Business, Monash University Malaysia Prabha Prayaga, School of Economics, University of Queensland Abstract
We report initial findings from a household survey of Pacific island migrants and their remittances, conducted in 2010-11 in New South Wales (NSW). The study covers three Polynesian communities, Samoans and Tongans as in previous studies, but also Cook Islanders. We cover migrants in both Sydney and the regional NSW. We quantify remittances of all types, formally and informally transferred, and distinguish those sent to households and organizations (mainly churches) or invested, beyond the migrants’ home country household, which account for almost 40% of total remittances. We provide the first estimates of remittances to Cook Islands since the mid-eighties, and the first estimates of remittances from regional areas in Australia. We investigate a number of potential socio-economic determinants of remittance behavior including the migrants’ income, duration of absence, strength of ties to home country, and major events in home country and Australia. We identify a number of important differences among the three groups, and between the Riverina- and Sydney-based communities. Areas for further research from this dataset are identified. Key words: migration, remittances, household survey, urban and regional Australia, Pacific islands, Cook Islands, Samoa, Tonga
Paper Prepared for Making Pacific Migration Work: Australian and New Zealand Experiences A Development Policy Centre Conference, Australian National University,
University House, 3 April, 2012

1
1. Introduction
Migration and remittances in the South Pacific
Remittances are increasingly viewed as an important factor in promoting economic
development and providing informal, family-based social protection in less developed
countries, especially where formal pension schemes do not exist. This is nowhere more
applicable than in those Pacific island countries (PICs) from where there has been extensive
migration to Australia, New Zealand and the US. Migrants' remittances have been the subject
of extensive discussion in the context of sustainable development in the South Pacific (Connell
& Brown, 2005). Importantly international migration has become a "safety-valve" for PIC
governments under increasing pressure to provide employment opportunities and welfare
services in conditions of poor domestic economic growth performance. By the 1980s smaller
Pacific island countries (initially Kiribati, Tokelau, Cook Islands and Tuvalu) had become
conceptualized as MIRAB states by Bertram and Watters (1985), and later extended to larger
countries such as Samoa and Tonga, where Migration, Remittances, Aid and the resultant
largely urban Bureaucracy were central to the socio-economic system. For these MIRAB
countries remittances relative to GDP are among the highest in the world (Ratha, Mohapatra,
& Silwal, 2011). Furthermore, civil unrest in the in a number of PICs has raised Australian
government concern for the emergence of a so-called ‘arc of instability’ in the region (Duncan
& Chand, 2002). For these reasons the impact of migration and migrants’ remittances on the
economic well-being and development of migrant-sending countries is receiving increasing
attention in the migration policy debate in Australia, specifically in relation to the Pacific
Seasonal Worker Pilot Scheme (PSWPS) for temporary migration from the Pacific islands.
Support for the PSWPS has come mainly from employer organizations, regional and
local governments and academics, in relation to the benefits that would accrue both to Australia
in alleviating unskilled labour bottlenecks, and to the sending countries in terms of the expected
remittance flows (Maclellan, 2008; Maclellan & Mares, 2006; World Bank, 2006). A survey of
Tongan and Samoan migrants in Australia and their island-based families over 15 years ago
went some way towards challenging a number of conventional beliefs about remittances, by
showing, for instance, that remittance-receiving households tended to save more, that
remittances reduced poverty and improved income distribution, and, that there was little
evidence of remittance decay over time (Brown, 1995, 1997, 1998; Brown & Walker, 1995).
This earlier work focused exclusively on long-term, urban-based migrants in Brisbane and
Sydney.

2
A more recent survey-based study for the World Bank among migrant-sending and
remittance-receiving households in Fiji and Tonga found that remittances make a significant
contribution to the alleviation of poverty, as well as promoting saving, investment and human
capital (Brown, Connell, Jimenez, & Leeves, 2006; Brown & Jimenez, 2008; Jimenez-Soto,
2008; Jimenez & Brown, 2008). It was also found that the impacts of remittances extend well
beyond the migrant-sending households; a significant proportion of non-migrant households
received remittances either directly from migrants of other households, or indirectly from
internal, unrequited transfers made to them by remittance-receiving households (Brown et al.,
2006).
It was also found in earlier surveys that migrants do not remit exclusively to
households but also to community-level organisations, mainly churches, and to community
clubs and societies, and relief funds. Through these ‘social remittances’ the wider community
including non-migrant households may benefit. Apart from remittances to households and
organisations, migrants also send remittances for the purpose of accumulating assets in their
home country. These could be financial assets such as savings accounts, or physical assets such
as housing or business investment. Most of the existing literature on remittances focuses
exclusively on remittances to households and most often, only the migrants’ household.
Analysis of the determinants and effects of remittances consequently overlooks a large part of
the broader remittances picture. By surveying the migrants themselves, this study allows for
broader categories of remittance recipients. Moreover, as previous surveys in Australia were
conducted exclusively among migrants in cities we have no information about the migration
histories, labour market performance, incomes and remittances behaviours of Pacific islanders
in the labour force in regional areas such as the Riverina region of NSW, Mildura and
Shepparton in Victoria, and Renmark in South Australia. Unlike any previous household
survey-based studies of Pacific islanders in Australia, the research project on which this paper
is based focuses explicitly on a comparison of urban and regional Polynesian communities.1
The study comprises of a household survey of Polynesian migrants in the greater
Sydney area and in the Riverina region was conducted in 2010/11 among three of the largest
Pacific island migrant communities in Australia; Tongans, Samoans, and, Cook Islanders.2
(Further details of the survey are discussed in Section 2 and in Appendix 1).
1 Australian Research Council Discovery Grant DP0988280 “Determinants, Motives and Channels of Pacific Island Workers’ Remittances from Australia” 2010-2012. 2 The other substantial Pacific island migrant community is from Fiji, but given that this community consists of two distinct sub-groups, Indo-Fijians and Indigenous-Fijians with very different migration histories and

3
Background on Polynesian migration to Australia
Most international migration of Pacific islanders has occurred since the 1950s and so
extensive has it become that some of the greatest concentrations of Pacific Islanders are now
residing outside their countries of origin in cities such as Auckland, Sydney, Honolulu, and
Los Angeles. In all three countries covered in this study more than half their ethnic
population currently lives overseas.3
The extreme case is Cook Islands where there is now a population of less than 20
thousand domestically resident, and an estimated 70 thousand ethnic Cook Islanders living
abroad (Table 1). Most of these (around 60 thousand) are in New Zealand. Cook Islanders
have New Zealand citizenship and as such have free access to New Zealand residency.4 At
present there are an estimated 5,000 Cook Island-born people living in Australia, of whom
almost one-third hold Australian citizenship (Department of Immigration and Citizenship,
2010a). More than 50% of the Cook Islanders surveyed in our study entered Australia via
New Zealand as step-migrants under the Trans-Tasman Agreement. The rest presumably
entered Australia directly from the Cook Islands as New Zealand citizens.
Table 1: Country Background Demographic and Economic Data
There are around 300 thousand ethnic Samoans living abroad, with only 184 thousand
resident in Samoa (Table 1). Again most of these live in New Zealand. In 2006, 131,103
motivations, and the relatively low numbers living in the Riverina area, the survey sample was restricted to the three Polynesian communities. 3 In Table 1 'Ethnic Abroad' includes overseas-born, and 'Migrants' excludes overseas-born. 4 From 1901 to 1965, the islands were administered by New Zealand, and since 1965, they have operated in "free association" with New Zealand.
Tonga Samoa Cook Islands
Population (thous. 2010) 103.7 184 17.8 Ethnic Abroad (thous. 2006)* 125 300 70 Migrants (thous. 2006)* 100 220 30 GDP/Capita (US$ thous. 2009) 3.32 3.14 9.14 Imports/GDP (2007-10) 36.99 43.23 66.61 Exports/GDP (2007-10) 2.84 2.11 1.78 ODA/GDP (2007-09) 10.00 9.60 3.90 Net Borrowing/GDP (2007-09) 2.31 4.53 0.05 Remittances/GDP (2007-09) 26.90 24.10 n.a.+ Sources: Asian Development Bank (2011a, 2011b, 2011c) +There are no estimates of remittances to Cooks Islands. Based on the findings of this study we estimate that remittances to be around 50% of GDP which is consistent with the size of the ‘un-funded’ imports shown in this table.

4
people of Samoan ethnicity were living in New Zealand, of whom less than 50% were born in
Samoa (50,649). During WW1 New Zealand occupied Western Samoa and administered the
country until independence in 1962. Most Samoans entered New Zealand under the Samoan
Quota System, first introduced in 1967, which, since 2002, allows up to 1,100 Samoans
access, through a ballot, to permanent residence in New Zealand each year. Like the Cook
Islanders, most of the estimated 15 to 20 thousand ethnic Samoans currently living in
Australia entered via New Zealand as ‘step-migrants’.5 In our sample around two-thirds of
the Samoan migrants entered Australia via New Zealand.
Tongans have historically had less easy access to New Zealand and Australia yet their
rate of international migration has also resulted in an almost equal number of Tongan-born
migrants living abroad and a domestically-resident population of around 100 thousand hardly
growing over the last few decades (see Table 1). There are an estimated 125 thousand ethnic
Tongans living abroad, of which 50 thousand are in New Zealand. From the mid-1970s,
following the cessation of the New Zealand contract-worker scheme, many Tongans
employed in the scheme left New Zealand and came to Australia looking for work. At the
2006 census there were an estimated 7,580 Tongan-born migrants living in Australia
(Department of Immigration and Citizenship, 2010c). In our sample around 38% of the
Tongan respondents migrated to Australia as step-migrants from New Zealand. Most (around
56%) migrated to Australia directly from Tonga.
Dependence on income from abroad
Common to the three Polynesian countries is a heavy reliance on income from abroad.6 This
is shown most clearly in Figure 1 by the enormous trade gap in all three countries, the
extreme being the case of the Cook Islands where imports are equivalent to two-thirds of
GDP while exports are less than 2 per cent of GDP.7 It is also interesting to note that the
Cook Islands appears to enjoy a relatively much higher per capita income of over US$9
thousand in comparison with just over US$ 3 thousand in Samoa and Tonga. Income from
external sources is consequently of vital importance in all cases, consisting of three main forms;
in ascending order of importance - borrowing, foreign aid and international migrants’
remittances.
5 According to the 2006 census there were 15,240 Samoan-born people living in Australia (Department of immigration and Citizenship, 2010b) 6 The Cook Islands does not have its own currency - it uses the New Zealand dollar. 7 In this study we define trade gap as the value of imports minus the value of exports.

5
Figure 1: Trade Gap by Source of External Income (2007-2009)
Source: Based on data reported in Table 1. Trade gap defined here as imports minus exports. Own estimate of Cook Islands remittances based on unfinanced trade gap.
The cases of Tonga and Samoa are very similar. Tonga’s trade gap is equivalent to
about 34% of GDP and estimated foreign income flows amount to approximately 40% of GDP:
2.3% from borrowing; 10% through foreign aid and 27% through remittances. Samoa’s trade
gap amounts to around 41% of GDP and foreign income flows add up to about 38% of GDP
with very similar proportions from the three main sources to Tonga.
The case of the Cook Islands is different in a number of respects. As already noted,
the national accounts data indicate a very much higher level of per capita income and an
associated trade gap equal to around 65% of GDP. Net foreign borrowing is negligible and
foreign aid is less than 4% of GDP. What also distinguishes the Cook Islands case is that
there are no official or unofficial estimates of international remittances. Indeed, the balance
of payments statistics show no data on private income transfers from abroad in any form.
This is puzzling given our previous observation that while the domestically-resident
population is less than 18 thousand in comparison with over 70 thousand ethnic Cook
34.15
41.12
64.83
26.9 24.1
60
10 9.6
3.9 2.31 4.53
0.05 0
10
20
30
40
50
60
70
Tonga Samoa Cook Islands
Trade Gap Remittances ODA Net Borrowing
Ow
n Es
timat
e
% o
f GD
P
Ow
n Es
timat
e
Ow
n Es
timat
e

6
Islanders living abroad (Table 1).8 Given that we know from a much earlier study in the early
1980s (Loomis, 1986), and from this survey, that Cook Islanders share similar remittances
behaviours to other Polynesian migrants (discussed in section 2), and, assuming that the
trade, foreign aid and borrowing aggregates reported in Table 1 and Figure 1 are reasonably
accurate, it can reasonably be assumed that the unaccounted trade gap must be funded from
migrants remittances. With a trade gap equal to 65% of GDP and foreign borrowing and aid
totaling 4% of GDP, the ‘unfinanced’ foreign exchange gap would have had to have been
covered by migrants’ remittances to an amount of around 60% of GDP as shown in Figure 1.
The focus of this study
A main aim of this research project is to assess the net benefits of migration for Pacific
islanders in relation to both the welfare of their households in urban and rural Australia, and the
benefits to their communities in the migrant-sending countries of the Pacific from the
remittances sent home. This paper reports some of the initial findings from this survey,
consisting of a combination of descriptive and econometric analysis. The focus is particularly
on the quantification and comparison of the propensities and magnitudes of remittance flows
and saving in all forms (cash, in-kind, payments to third-parties), through all channels (formal
and informal), and to all recipients. Given what was noted previously about remittances not
being sent exclusively to the migrant’s households in the home country, our survey was
designed to allow for a disaggregated analysis of remittances in four separate categories: (i) to
own household in home country; (ii) to other households in home country; (iii) to charitable
institutions (mainly churches) in home country; and, towards own asset accumulation in home
country.
The questionnaire was also designed to allow for the capture of remittances in the
various forms they take; viz. money transfers; in-kind transfers; and, payments made to third
parties on behalf of a household in the migrants’ home countries, such as electronic bank
payments or the purchase of an air-ticket, neither of which would involve a payment directly to
the benefiting household. Where money transfers are involved, the questionnaire also acquired
information on the main transfer channels used which enables us to ascertain the extent to
which migrants use formal financial channels versus informal channels such as hand-carried 8 As the currency of the Cook Islands is the NZ$ it would be extremely difficult if not impossible to track income earned in and remitted from New Zealand. This probably explains the absence of any balance of payments data on private transfers. If GDP includes consumption from remittances but does not exclude current transfers from abroad as would normally be the case, it is likely that GDP is highly over-estimated, explaining also the apparently substantially higher per capita income than in Tonga and Samoa. This requires further investigation.
7
transfers. We also provide details of the migration histories, and demographic and socio-
economic characteristics of the migrant households, disaggregated by country of origin and
urban vs. regional current residency.9
The main purpose of the analysis is to identify factors and migrant characteristics
associated with differences in remittance behaviours. Of particular interest is whether the main
drivers of remittances differ depending on the category of remittances recipient, the country of
origin of the migrant, and, the regional vs urban residency of the migrant household. Attention
is given to factors such as: income level and education; length of absence from their home
countries; the strength of their ties to their home country, including the presence of a parent
and/or other family members in the home country, their intentions to return home, and their
ownership of substantial assets in their home country and in Australia. Where possible,
comparisons with the previous survey of Pacific islanders in Australia will be made.
The rest of this paper is structured as follows: section 2 discusses the survey, including
details of the questionnaire design, sampling and administration of the survey, and presents a
selection of summary socio-demographic statistics relating to the migrant households, their
migration histories and occupations; section 3 presents and discusses a number of tables of
descriptive statistics from the survey concerning the migrants’ remittances, in terms of their
size and composition and relationship to key variables of potential interest such as household
income, location and duration of absence; section 4 presents some preliminary econometric
results on the factors most associated with the probabilities of migrants remitting to the various
categories of recipient and of the choice if informal versus formal financial institution for
making their transfers; section 5 summarises and discusses the main findings and identifies
areas for further investigation using this dataset. As indicated previously, comparisons are
made among the three migrant communities, and, between those living in regional versus urban
areas.
2. Survey design and profile of respondents
The survey
The survey was administered over a six month period from late September 2010 to early
March 2011. A total of 824 households from these communities were surveyed. The sample
represents about 5% each of the total Tongan- and Samoan-born populations and 9 The questionnaire allowed for the possibility of some migrants in the Riverina area being temporary internal migrants from Sydney or other large Australian cities, but none of the respondents was in that category.

8
approximately 12% of the Cook Islands-born population in New South Wales (NSW) as
estimated by the 2006 Census (Department of Immigration and Citizenship, 2010a, 2010b,
2010c). The surveys were administered in urban (greater Sydney) and rural (Riverina region)
NSW. New South Wales was chosen as the study location for two main reasons. First, it has
the largest Tongan, Samoan and Cook Islander populations in Australia. Second, it would
facilitate comparisons over time in remittance and migration patterns of Tongans and
Samoans with survey data from an earlier study in Sydney by Brown and Walker (1995).
Approximately 92% of the interviews were conducted face to face at the interviewers’
or respondents’ home, public gathering places (such as churches, libraries, RSL clubs) and at
respondents’ workplaces. The remaining 8% of the interviews were conducted via telephone.
As no sample frame exists the respondents were recruited through a combination of methods,
initially through interviewer networks combined with snowball sampling. Additional
participants were recruited through intercepts at specific community localities frequented by
Pacific islanders (churches, community support services, social organisations and gatherings)
and street intercepts at various community organisations and public locations.
A total of 837 surveys were completed with 636 from urban and 201 from regional
NSW. Table 2 shows the sample distribution.
Table 2: Sample Distribution in Urban and Regional areas
Country of origin Riverina Sydney Total Tonga 60 173 233 Samoa 73 271 344 Cook Islands 61 186 247 Other 7 6 13 Total 201 636 837
The largest group of participants was from Samoa (344 households or 41.1% of the sample)
followed by the Cook Islands (247 households or 29.5% of the sample) and Tonga (233
households or 27.8%).10 The survey gathered information about each household member
giving a total number of individual observations of 5,289, 80% of whom are adults and 20%
children.
10 The sample also included a small number of respondents (1.6%) from other Pacific Island Nations of Niue, Fiji, Tuvalu and American Samoa. These were excluded from the sample for data analysis purposes, with the final sample size being 824 (194 regional and 630 urban).

9
Profile of surveyed migrant households Table 3 shows the mean values for a selection of migrant household characteristics for the
Riverina and Sydney households in the combined sample. (The disaggregated data by country
of origin are shown in Appendix Table A.2.)
Table 3: Migrant Household Characteristics (Mean values)
As expected, the Sydney-based households earn, on average, higher incomes, in both absolute
terms, on a per-earner basis and on a per capita basis. They also have a larger mean
household size. Over 80% of household heads in both localities are male and employed, have
an average age in the low to mid 40s, have 10 to 11 years of education, and over three-
quarters are partnered. It is noteworthy that the employment rate is higher in Riverina (89%)
Variables ( N=824) Riverina Sydney N=194 N=630
Household Characteristics
Total HH income (’000) 80.16 99.54
Income earners in HH (no.) 2.34 2.34
Income per earner (’000$) 34.84 42.76
Household size (no.) 3.95 4.47
Per capita income (’000$) 22.91 25.54
HH Head Characteristics
Gender Male (%) 84.02 80.83
Age (yrs) 42.08 45.45
Married/de facto (%) 77.32 77.30
Education (yrs) 10.41 10.97
Employed (%) 88.66 84.44
Urban Origin (%) 59.28 77.94

10
than in Sydney (84%), and, a relatively higher proportion of migrants in Riverina originate
from a rural region in their home countries (41%).11
Table 4 provides information about the occupations of all those who were employed
at the time of the survey. Approximately 85% fall into the semi-skilled or unskilled
categories and less than 10% in manager and professional categories.
Table 4: Occupation of Employed Migrants*
* Of the 4,236 adults covered by the survey 1,763 (41.6%) were employed at the time.
Table 5 presents information about the migration history of the sampled households. The
mean number of years the household head lived abroad is very similar; greater than 20 years,
in both Sydney and Riverina, although the number of years living in Australia is somewhat
lower for the Riverina migrants (15 years as opposed to 18 years for those in Sydney). We
also find a relatively high incidence of step migration from another country (57%), and in a
very high proportion of cases, via New Zealand (53%).
When we disaggregate the data by country (see Appendix Table A.3) we find that in
the cases of Tonga and the Cook Islands a higher proportion of rural migrants were step-
migrants (58%), while, for Samoa, a much higher proportion of Sydney-based migrants had
step-migrated (70%). Given the extremely high rates of migration from the three countries it
is also not surprising to see that over 90% of households have migrants from their home
country household living elsewhere. In most cases the household has other migrants living
elsewhere in Australia, but the incidence is much lower for those in Riverina (78%) in
comparison with Sydney (89%). There is a relatively small proportion of households with
11 It is not surprising that almost 75% of all migrants originate from rural areas in their home countries given the very high concentrations of Pacific island populations in capital cities.
Occupational category (N=1763)
N= %
Skill category
%
Managers 57 3.23 Skilled
15.03 Professionals 107 6.07
Technicians & Trade 101 5.73 Community & Personal service 296 16.79
Semi-skilled
46.69 Clerical & Administration 141 8.00 Sales Workers 111 6.30 Machine operators 275 15.60 Labourers 675 38.29 Unskilled 38.29 Total Employed 1763 100.00
11
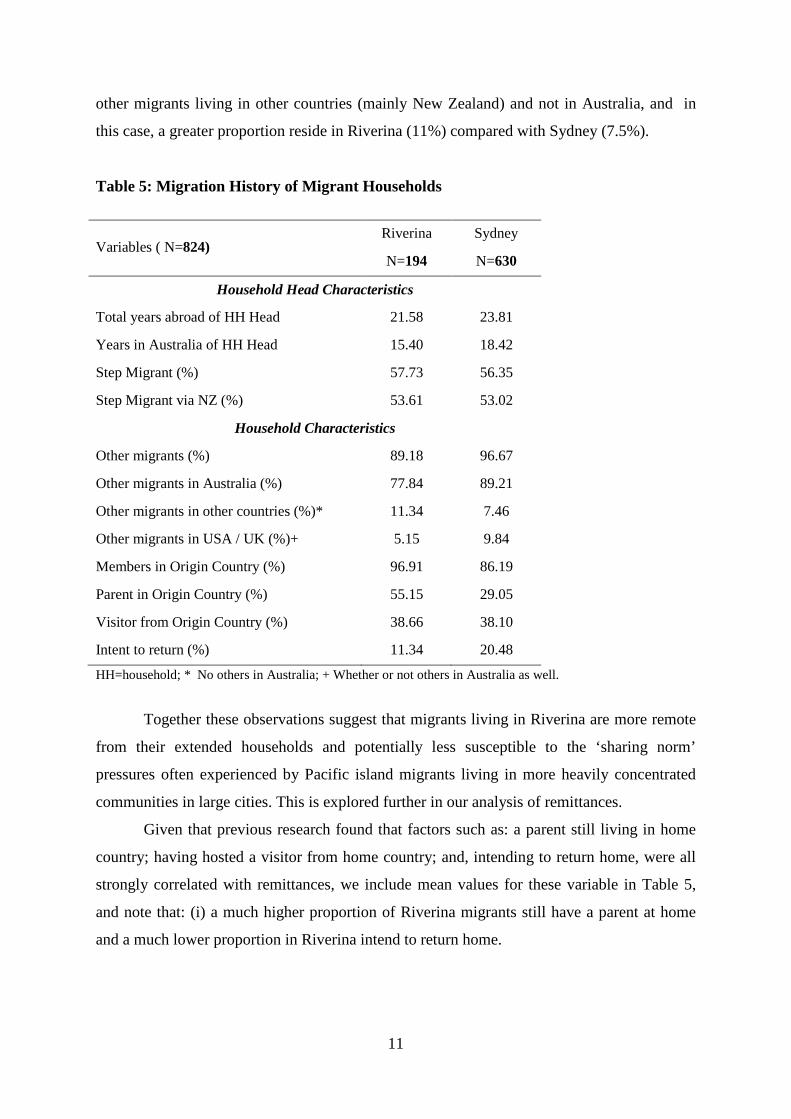
other migrants living in other countries (mainly New Zealand) and not in Australia, and in
this case, a greater proportion reside in Riverina (11%) compared with Sydney (7.5%).
Table 5: Migration History of Migrant Households
HH=household; * No others in Australia; + Whether or not others in Australia as well.
Together these observations suggest that migrants living in Riverina are more remote
from their extended households and potentially less susceptible to the ‘sharing norm’
pressures often experienced by Pacific island migrants living in more heavily concentrated
communities in large cities. This is explored further in our analysis of remittances.
Given that previous research found that factors such as: a parent still living in home
country; having hosted a visitor from home country; and, intending to return home, were all
strongly correlated with remittances, we include mean values for these variable in Table 5,
and note that: (i) a much higher proportion of Riverina migrants still have a parent at home
and a much lower proportion in Riverina intend to return home.
Variables ( N=824) Riverina Sydney
N=194 N=630
Household Head Characteristics
Total years abroad of HH Head 21.58 23.81
Years in Australia of HH Head 15.40 18.42
Step Migrant (%) 57.73 56.35
Step Migrant via NZ (%) 53.61 53.02
Household Characteristics
Other migrants (%) 89.18 96.67
Other migrants in Australia (%) 77.84 89.21
Other migrants in other countries (%)* 11.34 7.46
Other migrants in USA / UK (%)+ 5.15 9.84
Members in Origin Country (%) 96.91 86.19
Parent in Origin Country (%) 55.15 29.05
Visitor from Origin Country (%) 38.66 38.10
Intent to return (%) 11.34 20.48
12
3. Remittances: Propensities, amounts, categories, forms, and channels
Propensities, amounts and composition of remittances
In this section we examine the survey data relating to migrant households’ remittances.
Tables 6a and 6b provide information about the households’ remittance patterns.
First, in terms of the proportion of households remitting (Table 6b), there appears to
be very little difference between Riverina and Sydney for the combined sample
(approximately 93% in each case). However, the relative size of these proportions varies
between the country groups. For the Tongans, a much lower proportion of households in
Riverina remitted (90%) in comparison with Sydney (99%), whereas for Samoa and Cook
Islands, a slightly higher proportion of households in Riverina remitted.
Second, in terms of the levels of remittances (among remitting households), the mean
level of remittances as shown in Table 6b is considerably higher among the Sydney-based
migrants ($8.36 thousand) in comparison with Riverina ($5.80 thousand). This could be due
to the lower income levels in Riverina noted earlier, but could also be at least partially
attributable to the notion that migrant households in Riverina are less exposed to sharing
norm pressures than those in Sydney. However, there are again differences among the three
groups. The mean amount remitted by Cook Islanders, in both Riverina and Sydney, is
considerably lower than the mean amounts sent by Tongans and Samoans. However, unlike
the Tongans and Samoans, Cook Islanders living in Riverina remitted more on average than
those in Sydney. For Cook Islanders in Riverina, a higher proportion remitted and they sent
much higher amounts than those in Sydney. In terms of the aggregate level of remittances,
Cook Islanders remitted much less than Tongans and Samoans.
Third, from the breakdown by category of remittance in Table 6a it can be seen that
while a very high proportion of remitters remit to their home country households (85%), a
large proportion of migrants also remit to other categories of recipient; viz. to charitable
institutions (78%); to other households (26%); and, towards their own asset accumulation
(26%). To focus exclusively on remittances sent to the migrants’ own household would omit
a sizeable part of the remittance flows to the migrants’ home country. Indeed, only 123
households (about 16% of the remitters) remitted exclusively to their home country
household.

13
Table 6a: Categories of Recipients (Numbers of households; % of remitters in parentheses)
Table 6b: Remittances of Migrant Households (Mean values)
Recipient Category Total (N=824) Own HH Institutions Other HHs Own Assets Exclusively Own HH 651 (84.7)
490 171 202 123
Institutions 603 (78.4) 490
172 178 89 Other HHs 196 (25.5) 171 172
77 2
Own Assets 205 (26.7) 202 178 77
0 Exclusively 214 (27.8) 123 89 2 0 Total Remitters 769 651 603 196 205 214 Non-Remitters 55
Tonga Samoa Cook Islands Total N=233 N=344 N=247 N=824
Variables Riverina Sydney Riverina Sydney Riverina Sydney Riverina Sydney
N=60 N=173 N=73 N=271 N=61 N=186 N=194 N=630 Remitters (n) 54 172 70 252 56 165 180 589 % of all HHs [90.00] [99.42] [95.89] [92.99] [91.80] [88.71] [92.78] [93.49]
Mean value of remittances for remitting HHs (in $ '000s) Total value of HH remittances 6.77 9.47 5.76 10.69 4.91 3.67 5.80 8.36 Per capita HH remittances 1.55 2.51 1.68 2.68 1.70 0.88 1.65 2.13 Remit to own HC HH 5.27 5.99 3.78 6.01 3.49 2.30 4.14 4.97 Remit to institutions in HC 0.65 1.20 0.61 1.94 0.60 0.69 0.62 1.37 Remit to other households in HC 0.38 0.95 0.32 0.50 0.19 0.33 0.30 0.58 Remit to own assets in HC 0.47 1.33 1.05 2.24 0.63 0.35 0.75 1.44
HH=household; HC=home country
14
Table 6a also shows the incidence of multiple recipients of a household’s remittances.
The first column shows the total number of households that remitted to each category; 651 to
own household; 603 to institutions; etc. Then looking along the row, it can be seen that of the
651 that remitted to own household, 490 also remitted to institutions, 171 to other
households, and 202 towards own asset accumulation. What is interesting to observe is that
490 of the 769 remitting households (64%) remitted to their home country household and to
an institution/church. What appears to differentiate remitters the most is whether they
remitted to other households in their home country or, towards their own asset accumulation.
There is relatively very little overlap between these two categories of recipient. While 196
remitted to other households and 205 remitted to accumulate assets, only 77 households
(10%) remitted to both these categories. In subsequent econometric analysis where a
comparative analysis of factors associated with the different categories of remittances is
undertaken, it will be interesting to identify those factors that most differentiate these two
categories of recipient.
In terms of the amounts of remittances sent to the different categories of recipient,
Table 6b shows that although the mean levels sent to the migrants’ own households far
exceeds the amounts sent to the other categories of recipient, the combined amounts sent to
the other categories of recipient are substantial. The composition for Riverina and Sydney is
shown in Figure 2. For the combined sample it can be seen that the main difference between
the Sydney and Riverina communities is not only that the former remit more in total - $8.4
and $5.8 thousand respectively – but in addition, they sent a larger proportion to the other
categories besides their own home country households (40% and 29% respectively). Again,
this could be attributable to lower incomes in the Riverina region allowing for less
discretionary remitting beyond the migrants’ own households, or, it could also be attributable
to there being less community pressure to share beyond the immediate household; a
phenomenon referred to as ‘social sharing norms’ in the anthropological literature, and
receiving increasing attention in the development economics literature as an obstacle to the
earners’ use of their income for saving and investment (Duflo & Udry, 2004; Fafchamps,
McKenzie, Quinn, & Woodruff, 2011; Platteau, 2000). It is interesting to note that the mean
amounts remitted towards own asset accumulation is in most instances greater than the mean
levels sent to institutions or other households, the exceptions being Tongans in Riverina and
Cook Islanders in Sydney who sent more on average to institutions.

15
Figure 2 Composition of Remittances by Category of Recipient
HH = household
Own HH 60%
Church 16%
Other HHs 7%
Own Assets 17%
Sydney
Own HH 71%
Church 11%
Other HHs 5%
Own Assets 13%
Riverina

16
Another important finding from this study is in relation to the magnitude of
remittances to the Cook Islands. It was noted in section 2 that there are no official balance of
payments estimates of remittances to the Cook Islands. The only other detailed study of Cook
Islander migrants’ remittances was undertaken in New Zealand in the early 1980s (Loomis,
1986). From the trade gap data in Table 1, we arrived at a rough estimate of the ‘unfinanced’
foreign exchange gap equivalent to 60% of GDP (see Figure 1). To what extent are our
findings from this study consistent with this estimate? To recap: we found that 90% of Cook
Islander households had remitted and the mean value was $3,951 per remitting household.
Given that there are currently around 5,000 Cook Island-born migrants in Australia, or,
approximately 800 households assuming the same mean size as in our sample, total
remittances from Australia in 2010 would have amounted to approximately $2.85mn. This
would be equivalent to more than 10% of the Cook Islands GDP in that year. If we then
assume that Cook Islanders living in New Zealand (approximately 25,000) share the same
remittances propensities as their Australian counterparts, total remittances from New Zealand
would be equal to approximately 50% of GDP. The combined amount from Australia and
New Zealand would be equivalent to 60% of GDP – the same magnitude as the estimate
based on the ‘unfinanced’ trade gap from the macro-data in Table 1 and shown in Figure 1.
Forms and channels of remittances
It is also important to note that remittances are sent in a variety of forms and through various
channels as shown in Table 7. By far the most common form of remittances is money, but it
is worth noting that migrants in Riverina are more likely to send money and less likely to
send goods or to make payments to third parties on behalf of the home country households in
comparison with those living in Sydney. This is likely to be due to the greater access to
tradeable goods (especially second-hand goods often favoured by migrants) and
transportation means and costs. It is also interesting to note that a relatively small proportion
of migrants sending money do so through formal channels. Of those sending money to their
home country households, less than 12 % in Riverina and 21% in Sydney used formal
financial institutions. The preferred remittance channel for sending money remains informal,
mainly hand-carried, either by the migrants themselves, or by friends, relatives or paid money
courier. However, the much higher use of formal channels in Sydney suggests that
accessibility and proximity to banks and other financial institutions could be important in
determining a migrants’ choice of transfer method.

17
Table 7: Sending Decisions of Remitting Migrant Households
HH=household; HC=home country; OMs=other migrants from same HC HH
However, when we look at the same data disaggregated by country (see Appendix
Table A.4) some important differences emerge. For instance, among the Samoan community,
a higher proportion of those living in Riverina send in-kind remittances (50%) in comparison
with those in Sydney (45%). In relation to remittances in the form of payments on behalf of
home country households a higher proportion of Cook Islander households in Riverina (36%)
chose this method in comparison with Cook Islanders in Sydney (32%) and in comparison
with the other two groups in Riverina.
Remittances and migrants’ income levels and duration of absence
It is clear from the preceding discussion that there are some observable differences in
remittance behaviours between Riverina and Sydney based households and among the three
migrant communities in our survey. Two of the main drivers of remittances we explore
further in this section are: (i) household income; and (ii) duration of absence from home
country. To the extent that remittances are determined by the migrants’ capacity to save out
of current income, we can expect to find a positive relationship between income and level of
remittances. To the extent that the longer the duration of absence of migrants from their home
countries the weaker the ties are, we can expect to find a negative relationship between time
away and propensity and amounts remitted. Strength of ties to both their home country
communities and to their respective community groups in Australia are also likely to be
associated with the social pressure on the migrant to share their income with the broader
community at home, as discussed earlier in relation to the concept of ‘social sharing norms’.
The remittance decay hypothesis is based on the assumption that the strength of ties and the
associated pressures to share weaken over time. Previous research found no evidence of such
Variables ( N=824) Riverina Sydney
N=194 N=630
Remit Money to own HC HH (%) 88.33 77.08
Remit Goods to own HC HH (%) 42.22 46.18
Payments on behalf of own HC HH (%) 30.00 44.82
Formal channel (%) 11.67 21.05
Consulted OMs before remitting (%) 10.56 18.85

18
remittance decay (Brown, 1997, 1998). However, if, as hypothesized here, migrants who live
in the more remote regional areas such as Riverina, are less vulnerable to social sharing
norms and pressures, it is likely that they would be remitting less to recipients beyond their
immediate household. The association of remittance levels with migrants’ income and length
of absence are explored initially examining the cross-tabulations presented in Tables 8 and 9
and in the corresponding Figures 3 and 4. (In the regression analysis (section 4) we test for
the effect of income, length of absence, and location in Riverina vs Sydney on the probability
of the migrants remitting to each of the four categories of recipient.)
In Table 8 it can be seen that a relatively much lower proportion of rich households
live in Riverina. In terms of remittances, the proportion of remitting households does not vary
substantially across income groups, however, there is clearly a positive relationship between
income level and amount remitted (see also Figure 3).12
Table 8: Selected Remittances Variables by Income Category*
HH=household However, when we examine the same data on an individual country group basis it becomes
clear that it is only in the case of the Tongans that there is a strong positive relationship
between income and amount remitted (see Appendix Table A.5 and Appendix Figure A.1).
12 The income categories are based on per capita incomes. The categories were then created by splitting the entire sample of individuals into the three income groups; eg. In the Case of Tonga the Bottom Income Category consists of the 40% poorest individuals living in 76 households, while the Middle Income Category consists of the 40% middle income individuals living in 107 households.
Income category Bottom 40%
Middle 40% Top 20%
N=807 324 330 153
Riverina (%) 23.15% 28.79% 13.73%
Remitting HH (%) 91.67% 95.76% 92.81%
Mean HH remittance ($ ‘000s) 5.75 7.65 9.88
Remittances (% of income) 11.98 7.60 6.35
Using informal channels (%) 17.28% 17.58% 10.46%
HH Head Total years abroad 21.92 23.97 24.97

19
Figure 3: Remittances by Income Group
20
Indeed, the top income group remits on average $14.2 thousand in comparison with $5.6
thousand for the poorest group. For the two other countries the amount remitted does not
appear to vary with income level. It is also worth noting that it is the highest income group
that relies least on formal transfer channels.
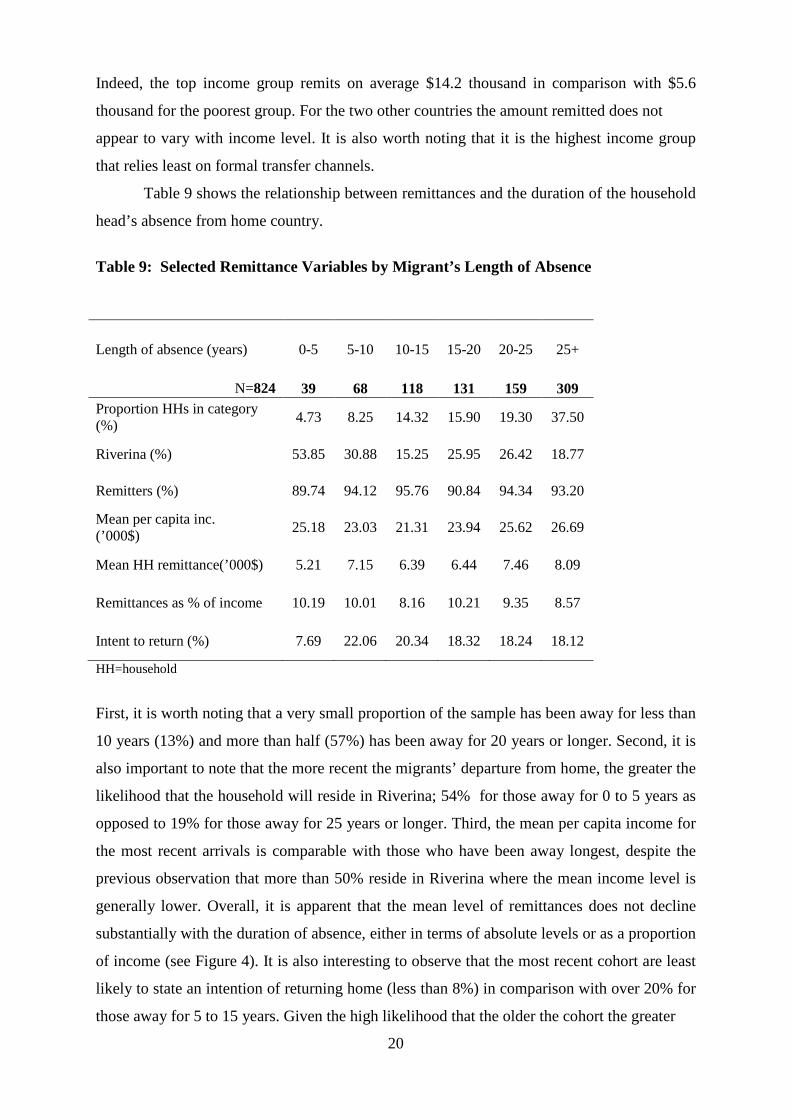
Table 9 shows the relationship between remittances and the duration of the household
head’s absence from home country.
Table 9: Selected Remittance Variables by Migrant’s Length of Absence
HH=household
First, it is worth noting that a very small proportion of the sample has been away for less than
10 years (13%) and more than half (57%) has been away for 20 years or longer. Second, it is
also important to note that the more recent the migrants’ departure from home, the greater the
likelihood that the household will reside in Riverina; 54% for those away for 0 to 5 years as
opposed to 19% for those away for 25 years or longer. Third, the mean per capita income for
the most recent arrivals is comparable with those who have been away longest, despite the
previous observation that more than 50% reside in Riverina where the mean income level is
generally lower. Overall, it is apparent that the mean level of remittances does not decline
substantially with the duration of absence, either in terms of absolute levels or as a proportion
of income (see Figure 4). It is also interesting to observe that the most recent cohort are least
likely to state an intention of returning home (less than 8%) in comparison with over 20% for
those away for 5 to 15 years. Given the high likelihood that the older the cohort the greater
Length of absence (years) 0-5 5-10 10-15 15-20 20-25 25+
N=824 39 68 118 131 159 309 Proportion HHs in category (%) 4.73 8.25 14.32 15.90 19.30 37.50
Riverina (%) 53.85 30.88 15.25 25.95 26.42 18.77
Remitters (%) 89.74 94.12 95.76 90.84 94.34 93.20
Mean per capita inc. (’000$) 25.18 23.03 21.31 23.94 25.62 26.69
Mean HH remittance(’000$) 5.21 7.15 6.39 6.44 7.46 8.09
Remittances as % of income 10.19 10.01 8.16 10.21 9.35 8.57
Intent to return (%) 7.69 22.06 20.34 18.32 18.24 18.12
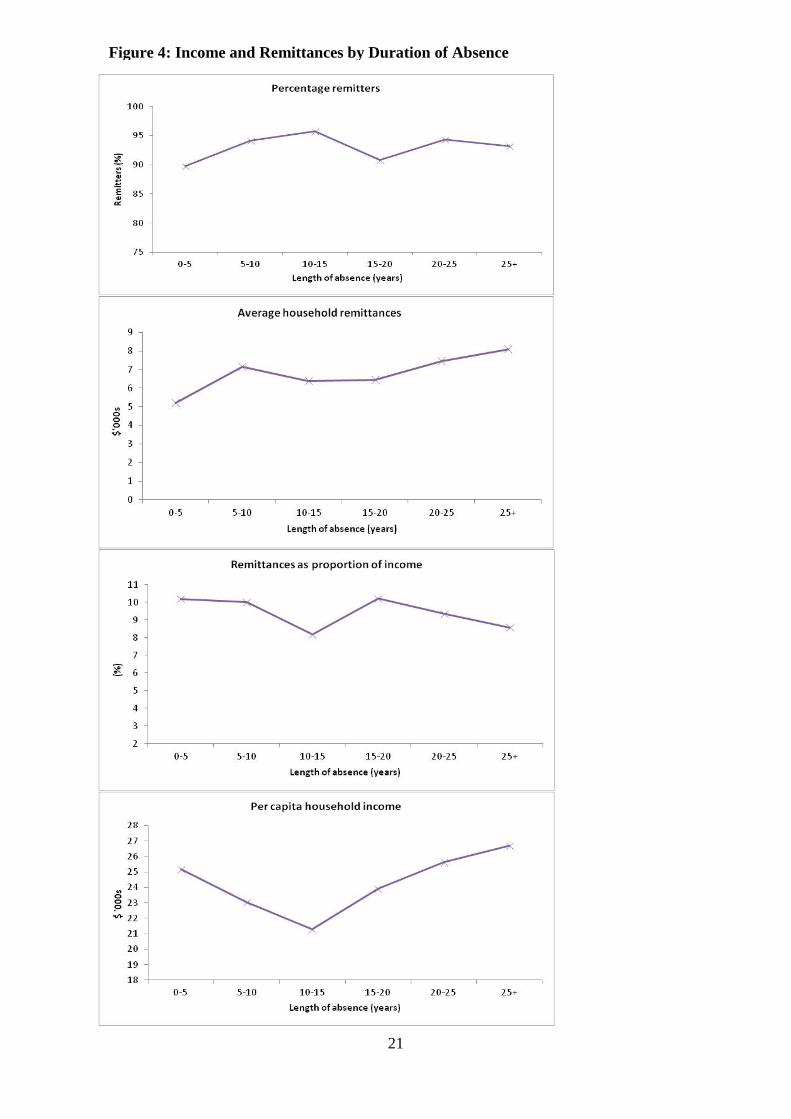
21
Figure 4: Income and Remittances by Duration of Absence
22
the proportion who have already returned home one would expect a lower proportion among
the older cohorts intending to return. Our finding could be associated with some qualitative
difference among the most recent cohort or simply reflect the effects of the passage of time;
ie. after the first few years away the desire to return increases.
When we examine the same data disaggregated by country of origin, the observations
made here for the whole sample are very similar for each of the three country groups, with
one exception; mean per capita income among the more recent cohorts (10 years or less) is
relatively lower in the cases of Tonga and Cook Islands but is considerably higher among the
most recent cohort in the Samoan community.
4. Econometric estimations
Probability of remitting by category of remittances
In this section we seek to explore more formally whether there are significant differences in
the propensity to remit between the different categories of migrants, in terms of both country
of origin and location in Riverina and Sydney, as well as the influence of other household
characteristics on different forms of remittances. The analysis to this point has been purely
descriptive and univariate. The associations and differences we have identified thus far could
be spurious given that we have not controlled for differences in other variables. It is therefore
necessary to re-examine some of the relationships using appropriate multivariate,
econometric methods. In the next section we summarize the results of a preliminary
econometric analysis.
Specifically, we use probit regressions with each of the four forms of remittance as
the dependent variable. In each case we started with a version that includes a number of
observable characteristics of the remitting household only (Model 1). We then extended this
to include the impact of unexpected events in the Australian or home country household
(Model 2). Finally, we added in a set of variables describing the strength of association
between the remitting household and the home country (Model 3). We estimated these three
models for each of the four forms of remittance in turn. Initially we pool the sample and use
dummy variables for the migrants’ country of origin, then we disaggregate the data into the
three country groups, and run the full model (Model 3). In this paper we report only the
summary findings from the full model (Model 3) for each of the three countries separately.,
These results have to be treated with some caution as the variation in significance may reflect
a lack of cases to identify effects within each country sample rather than genuine differences
in motive to remit. The results are summarized in Table 10 and the full regression results
showing average marginal effects are reported in Appendix Tables A.7 and A.8.

23
Table 10: Probit Regression Results by Category of Remittances Sent and by Country of Origin
Remittances sent to: Own HH Other HH Organizations Own Assets
Tonga Samoa
Cook Islands Tonga Samoa
Cook Islands Tonga Samoa
Cook Islands Tonga Samoa
Cook Islands
Years of education
++
- - - - - + Total HH income
+++
++
Own house in Australia + +
- -
- - - Total years away from HC ++
- ++
-
Origins in rural area of HC
- -
- -
- - Living in Riverina
+
+
- -
- - -
Unexpected events in Aus HH
+++
-
+++ Unexpected events in HC HH
+++
+
+
Own house in HC +++
+++
++
+++ +++ Intend to return to HC
+++
+++
+ +++
- - -
Had visitor from HC +++ +++ +++ + +++ - ++ ++ Parent living in HC +++ +++ +++
+++
+++ ++
Other migrants associated - - -
++
+++ ++ Active in church
++
+++
+++, ++, + indicate positive effect and statistically significant at the 1%, 5% and 10% levels respectively -, - - , - - - indicate negative effect and statistically significant at the 1%, 5% and 10% levels respectively HH=household; HC=home country

24
First, it is apparent that residing in the Riverina region as opposed to Sydney is
associated with differences in the probability of remitting almost exclusively for the Samoan
group. It has a positive effect on their likelihood of remitting to their own households and to
other households and a negative effect on the likelihood of remitting towards their own asset
accumulation. The only other effect is in the case of Tongan remittances to organizations
which is negative.
Second, duration of absence of the household head does not appear to have a
negative effect on any category of remittances for the Tongan and Samoan groups. It has a
negative effect on Cook Islanders’ remittances to own household and towards own asset
accumulation. Surprisingly, length of absence is associated with a strong positive effect on
Tongans’ remittances to own household and to other households.
Third, it is interesting to note that the probability of remitting is hardly affected by the
household’s income level across all three groups and in both regions. In the case of Samoans,
income has a positive effect on the probability of remitting to an organization and in the case
of Tongans, of remitting towards own asset accumulation. The household head’s years of
education has a negative effect on remittances to an organization for both the Samoan and
Cook Islander communities, suggesting that it is the less-educated who are more likely to
make church donations. It is also the case that among the Samoans, being active in the local
church is positively associated with donations to organizations in the home country.
Fourth, strength of ties to home country as proxied by factors such as ownership of a
house in home country, having hosted a visitor from home country, and having a parent still
living in home country all have positive effects on one or more categories of remittances. In
the case of Tongans and Cook Islanders, intention of returning home is positively associated
with remittances to other households while among the Samoans it is positively associated
with remittances to own household. For Tongans it is also positively associated with
remittances to organizations but negatively with accumulation of own assets.
Other noteworthy findings: it is only Cook Islander households that are less likely to
remit to own household because the home country household is in a rural area of the country;
Tongan household probability of remitting is linked negatively to the number of other
migrants associated with the household, suggesting in this case, that the remittance decision
is made on a collective basis by all migrants from the same household; and, unexpected
events in the home country household increase the likelihood of remittances amongst Samoan
households but have no effect on Cook Islander and Tongan households.
25
4. Concluding comments
The main purpose of this paper was to present some initial findings from our recent survey of
Pacific island migrants from three Polynesian countries; Cook Islands, Samoa and Tonga. A
similar survey undertaken some 15 years ago and covered only the Samoan and Tongan
communities and was restricted to households living in urban areas - Brisbane and Sydney. In
this paper we rely mainly on descriptive analysis, but also report some preliminary findings
from econometric analysis of the probability of a migrant remitting.
Three aspects of this study of remittances distinguish it from previous research. First,
is the inclusion of the Cook Islander migrant community, not only because there has been no
previous such survey of this community in Australia, with the last New Zealand study
undertaken more than 25 years ago, but also because there are no official estimates of total
remittance flows to the Cook Islands. Based on official national accounts and balance of
payments data we estimate an ‘unfinanced’ trade gap of around 60% of GDP which is most
likely financed by unrecorded migrants’ remittances. Extrapolating our Australian sample
survey estimates of remittance propensities to the rest of the Cook Island communities in
Australia and New Zealand yields an estimate of total remittances to the Cook Islands also of
around 60% of GDP. It would therefore seem that the Cook Islands is substantially more
reliant on migrant remittances than commonly believed by policy makers in the region.
A second aspect that distinguishes this from most other studies of remittances is that
the questionnaire was designed to allow for a disaggregation of remittances according to the
category of recipient, where we distinguish between remittances to: (i) the migrants’ own
household in the respective home country; (ii) other households in the home country; (iii)
charitable organizations such as churches in home country; and, (iv) accumulation of the
migrants’ own assets in the home country. It was found that in most instances migrants
remitted to multiple categories of recipient. Although their own households were clearly the
main recipients, it was found that around 30% of remittances from Riverina and 40% from
Sydney went to the other categories. This reinforces previous findings that the benefits of
remittances extend well beyond the migrants own households, and that analysis based
exclusively on remittances received by migrant households will underestimate the magnitude
and effects on the wider community.
A third important contribution of this study is that it covers migrants in both urban
and regional areas. Previous surveys have been restricted exclusively to migrants in large
cities. Given that our data show that an increasing proportion of relatively recent arrivals are
living in the Riverina area it is important to ascertain whether the knowledge we have

26
previously gained about remittance behaviours of Pacific islanders from studies of urban-
based households also applies to those in the regional and rural areas. One reason why those
in regional areas might behave differently is that their relative remoteness could be associated
with less community pressure to remit, especially to recipients beyond their immediate
households in their home countries. From the descriptive analysis we found some important
differences in both the levels and allocation of remittances to the various categories of
recipients. Despite a similarly very high proportion of remitting migrants in Riverina (93%),
the amounts remitted are lower, and, a much smaller share of remittances is sent to recipients
beyond the immediate household. Moreover, a much lower proportion of migrants in
Riverina (11%) stated their intention to return home, compared with 20% in Sydney. The
results from the preliminary econometric analysis also indicated that residing in Riverina had
a significant, negative effect on Tongans remittances to charitable organizations (mainly
churches). The reasons for these findings need to be examined further; one possibility being
that there is less community pressure to share when the migrant is located in the more remote
regions of the host country. Migrants could be opting to move away from the larger
concentrations of their communities in the big cities precisely to avoid the social pressures to
remit, or, it could be that having chosen to live in a more remote area perhaps for
employment reasons, the migrants find themselves less exposed to social sharing norms. Our
survey included questions put to those in Sydney about their knowledge of the Riverina
region, its employment possibilities and earnings expectations, and the same questions to
migrants in Riverina about employment prospects in Sydney. This is one possible avenue of
investigation that could shed more light on the migrants’ motivations for choice of place to
live.
Finally, in relation to remittances a number of interesting initial observations can be
made, all of which require further investigation using appropriate econometric methods: (i)
household income do not appear to be strongly associated with the probability of remitting or
the amount remitted, although the descriptive data suggest that Tongans could be an
exception with average remittance levels rising with mean income levels; (ii) the duration of
the migrants’ absence from the home country does not appear to adversely affect, the
probability of remitting nor the amount remitted – the descriptive data suggests the opposite
(positive relationship) could be the case; (iii) from the preliminary regression analysis it
appears that conditions in the migrants’ home country are a stronger determinant of remitting,
including such factors as there being a parent (or parent-in-law) still living at home, the
migrant’s intention to return home, or whether someone from their home country had visited

27
recently; (iv) in terms of transfer channels it was found that only 21% of migrants in Sydney
and 12% in Riverina used formal financial institutions for their remittances, and, in all cases
this proportion is lower for the highest income group; by far the most preferred method was
the use of informal channels such as cash hand-carried. In future research these and other
related issues will be studied in greater depth using appropriate econometric methods.

28
Appendix 1: The Survey Design and Implementation
The survey was designed to collect information about migration and remittance patterns from
three major Pacific Island nations – Tonga, Samoa and the Cook Islands. The survey was
administered over a six month period from late September 2010 to early March 2011. A total
of 824 households from these communities were surveyed. The sample represents about 5%
each of the total Tongan and Samoan born populations and approximately 12% of the Cook
Islander born population in New South Wales (NSW) as estimated by the 2006 Census.
The target population was first generation migrant households, that is, where either
the respondent or the respondent’s spouse was born in one of the three targeted Pacific island
nations. A mixture of households remitting and not remitting to their country of origin were
targeted. Additionally the respondent had to be 18 years or older to participate in the survey.
The surveys were administered in urban (greater Sydney) and regional (Riverina) NSW. New
South Wales was chosen as the study location for two main reasons. First, it has the largest
Tongan, Samoan and Cook Islander populations in Australia. Second, it would facilitate
comparisons over time in remittance and migration patterns of Tongans and Samoans with
survey data from an earlier study by Brown and Walker (1995) in Sydney.
The surveys were first piloted on University of Queensland students from Tonga,
Samoa and the Cook Islands before being field tested in Sydney. The survey instrument was
refined on the basis of feedback received from the pilots and field tests before data collection
began. Interviewers from Pacific island communities were recruited to conduct the
interviews. Approximately 92% of the interviews were conducted face to face at the
interviewers’ or respondents’ home, public gathering places (such as churches, libraries, RSL
clubs) and at respondents’ workplaces. About 8% of the interviews were conducted via
telephone. Each respondent was given a $20 shopping voucher as an incentive to complete
the survey.
The first respondents were obtained from interviewer networks and then snowball
sampling was applied. Initially, every respondent was asked to provide three potential
respondents outside their own household, from which one respondent would be selected for
the survey. However it was difficult to rely exclusively on this method as only 9% of the
respondents provided names of possible additional. However most of these contained only
partial details, such as providing only names without contact details or providing only one or
two names with contact details, and hence could not be used for snowballing. Therefore

29
opther methods were employed such as recruiting through interviewer networks and specific
community channels frequented by Pacific islanders (churches, community support services,
social organisations and gatherings etc) and street intercepts at various community
organisations and public locations.
The target sample size was initially set at 800, with 500 and 300 in urban and regional
NSW respectively. The target sample size for urban NSW was easily reached, but the sample
size of 300 for regional NSW was difficult to achieve for two main reasons; the large
distances that needed to be covered by both the respondents and interviewers and the floods
in December 2010 and January 2011 which made travel more difficult due to road closures.
Hence in the interest of both respondent and interviewer safety, it was decided to reduce the
regional sample to 200 and increasing the urban sample to 600 and to administer the survey
via telephone to some of the participants in the regional areas. A total of 837 surveys were
completed with 636 from urban and 201 from regional NSW. Of the 201 surveys
administered in regional areas approximately one third 61 (32%) were conducted via
telephone. These were administered between February and March 2011 after the floods. The
distribution of surveys during the data collection period September 2010 to March 2011 is
presented in Table 1. Data collection in rural NSW began 4 weeks later than in Sydney to
enable the interviewers to establish networks in regional areas.
Table A.1: Distribution of Surveys During the Data Collection Period
Month of interview
Tonga Samoa Cook Islands Total Riverina Sydney Riverina Sydney Riverina Sydney Riverina Sydney
Sep-10 ------ 9 ------ 6 ------ 11 ------ 26 Oct-10 4 26 7 25 1 35 12 86 Nov-10 15 37 11 89 9 19 35 145 Dec-10 3 42 11 55 9 68 23 165 Jan-11 10 34 19 27 14 15 43 76 Feb-11 5 15 5 57 3 35 13 107 Mar-11 23 10 20 12 25 3 68 25 Total 60 173 73 271 61 186 194 630

30
Appendix Table A.2: Profile of Migrant Households by Country of Origin
Tonga N=233
Samoa N=344
Cook Islands N=247
Total N=824
Variables Riverina Sydney Riverina Sydney Riverina Sydney Riverina Sydney
N=60 N=173 N=73 N=271 N=61 N=186 N=194 N=630 Household Averages (Standard deviation)
Household size 4.13 (1.59)
4.72 (2.56)
3.78 (1.68)
4.40 (1.74)
3.97 (1.59)
4.33 (1.81)
3.95 (1.62)
4.47 (2.02)
Number of children below 16 yrs
1.03 (1.26)
1.43 (1.73)
1.15 (1.37)
1.30 (1.44)
0.98 (1.10)
1.34 (1.39)
1.06 (1.25)
1.34 (1.51)
Income earners 2.62 (1.19)
2.40 (1.38)
2.12 (1.07)
2.32 (1.29)
2.31 (1.19)
2.29 (1.22)
2.34 (1.16)
2.34 (1.30)
Total HH income (’000) 87.79 (36.35)
107.28 (69.97)
72.28 (48.60)
100.06 (58.21)
82.02 (45.66)
91.41 (50.64)
80.16 (44.41)
99.54 (59.92)
Income per earner (’000$)
35.76 (11.82)
45.44 (18.47)
34.54 (16.73)
42.89 (13.87)
34.26 (9.89)
40.03 (14.27)
34.84 (13.35)
42.76 (15.50)
Per capita income (’000$)
23.79 (11.51)
27.94 (18.67)
22.09 (14.40)
25.20 (14.93)
23.01 (11.96)
23.75 (15.03)
22.91 (12.76)
25.54 (16.14)
Household Head Gender Male (%) 80.00 78.03 87.67 86.25 83.61 75.54 84.02 80.83
Age (yrs) 41.98 (11.89)
48.23 (11.12)
41.66 (12.28)
44.30 (11.72)
42.67 (12.61)
44.56 (9.58)
42.08 (12.21)
45.45 (11.08)
Married/de facto (%) 75.00 72.83 82.19 80.81 73.77 76.34 77.32 77.30
Education (yrs) 10.44 (2.36)
12.03 (2.43)
10.03 (3.51)
10.81 (3.17)
10.84 (2.99)
10.23 (3.22)
10.41 (3.04)
10.97 (3.07)
Employed (%) 88.33 83.82 87.67 84.13 90.16 85.48 88.66 84.44
Urban Origin (%) 58.33 81.50 52.05 82.66 68.85 67.74 59.28 77.94

31
Appendix Table A.3: Migration History of Migrant Households by Country of Origin
Tonga N=233
Samoa N=344
Cook Islands N=247
Total N=824
Variables Riverina Sydney Riverina Sydney Riverina Sydney Riverina Sydney
N=60 N=173 N=73 N=271 N=61 N=186 N=194 N=630
Household percentages
Other migrants (%) 90.00 95.95 82.19 96.31 96.72 97.85 89.18 96.67
Other migrants in Australia (%) 76.67 89.60 69.86 88.93 88.52 89.25 77.84 89.21 Other migrants only in NZ & other countries except Australia (%)
13.33 6.36 12.33 7.38 8.20 8.60 11.34 7.46
Other migrants in USA / UK (%) 10.00 15.61 5.48 11.81 0.00 1.61 5.15 9.84
Members in Origin Country (%) 96.67 98.27 98.63 86.72 95.08 74.19 96.91 86.19
Parent in Origin Country (%) 50.00 26.59 60.27 36.90 54.10 19.89 55.15 29.05
Visitor from Origin Country (%) 43.33 51.45 27.40 35.79 47.54 29.03 38.66 38.10
Intent to return (%) 13.33 26.59 12.33 16.97 8.20 19.89 11.34 20.48
Remittances (%) 90.00 99.42 95.89 92.99 91.80 88.71 92.78 93.49
Household Head (Standard deviation)
Total years abroad 24.07 (10.54)
24.86 (10.62)
18.86 (11.55)
23.70 (9.71)
22.39 (12.73)
23.00 (12.47)
21.58 (11.79)
23.81 (10.84)
Years in Australia 18.00 (8.45)
20.94 (10.39)
13.23 (8.30)
17.35 (8.14)
15.44 (9.40)
17.64 (9.01)
15.40 (8.88)
18.42 (9.17)
Step Migrant (%) 65.00 36.42 49.32 73.06 60.66 50.54 57.73 56.35
Step Migrant via NZ (%) 58.33 30.64 46.58 70.48 57.38 48.39 53.61 53.02

32
Appendix Table A.4: Sending Decisions of Remitting Migrant Households by Country of Origin
Tonga N=233
Samoa N=344
Cook Islands N=247
Total N=824
Variables Riverina Sydney Riverina Sydney Riverina Sydney Riverina Sydney
N=60 N=173 N=73 N=271 N=61 N=186 N=194 N=630
Remitters (n) [% of all HH] 54 [90.00]
172 [99.42]
70 [95.89]
252 [92.99]
56 [91.80]
165 [88.71]
180 [92.78]
589 [93.49]
Remittances to own HC HH (% of remitting HH) Consulted OMs before remitting 9.26 18.02 15.71 20.24 5.36 17.58 10.56 18.85
Remit Money to own HC HH 92.59 90.70 94.29 82.54 76.79 54.55 88.33 77.08
Remit Goods to own HC HH 38.89 55.81 50.00 44.84 35.71 38.18 42.22 46.18 Payments on behalf of own HC HH 25.93 52.91 28.57 47.62 35.71 32.12 30.00 44.82
Money remittances to own HC HH (% of remitting HH) Formal channel 14.81 13.95 10.00 32.94 10.71 10.30 11.67 21.05 Cost incurred for sending money 61.11 72.67 62.86 58.73 57.14 36.36 60.56 56.54
Frequency of remitting money to own HC HH (% of remitting HH)
Once a year 15.69 3.85 19.70 9.62 16.28 16.67 17.50 9.03
2 – 4 times a year 45.10 53.85 62.12 55.29 53.49 60.00 54.38 55.73
5 – 8 times a year 19.61 25.00 12.12 24.04 20.93 13.33 16.88 22.25
9 – 12 times a year 9.80 12.18 3.03 8.65 6.98 8.89 6.25 9.91
More than 12 times a year 9.80 4.49 3.03 2.40 2.33 1.11 5.00 2.86
HH=household; HC=home country; OMs=other migrants from same HC HH

33
Appendix Table A.5: Selected Remittances Variables by Income Category and Country of Origin* * The income categories are based on per capita incomes. The categories were then created by splitting the entire sample of individuals into the
three income groups; eg. In the Case of Tonga the Bottom Income Category consists of the 40% poorest individuals living in 76 households, while the Middle Income Category consists of the 40% middle income individuals living in 107 households.
Tonga N=231
Samoa N=337
Cook Islands N=239
Income category Bottom
40% Middle 40% Top 20%
Bottom 40%
Middle 40%
Top 20%
Bottom 40% Middle 40% Top
20% N=76 N=107 N=48 N=147 N=120 N=70 N=101 N=103 N=35
Remitting HH (%) 98.68 96.26 95.83 91.84 95.83 94.28 86.14 95.15 85.71 Mean HH size 5.74 4.41 3.00 4.83 4.18 3.21 4.96 3.98 3.06 Mean HH remittances ($) 5.62 8.13 14.22 7.53 10.32 9.97 3.25 4.04 3.75
Remittances as % of income 11.96 7.35 9.17 15.48 10.50 6.23 6.89 4.47 2.74
Riverina(%) 23.68 34.58 10.42 25.17 19.17 17.14 19.80 33.98 11.43 Informal channels (%) 18.42 21.50 8.33 19.05 16.67 11.43 13.86 14.56 11.43 HH Head total years abroad 22.78 24.69 27.60 21.57 24.24 21.92 21.77 22.92 27.47
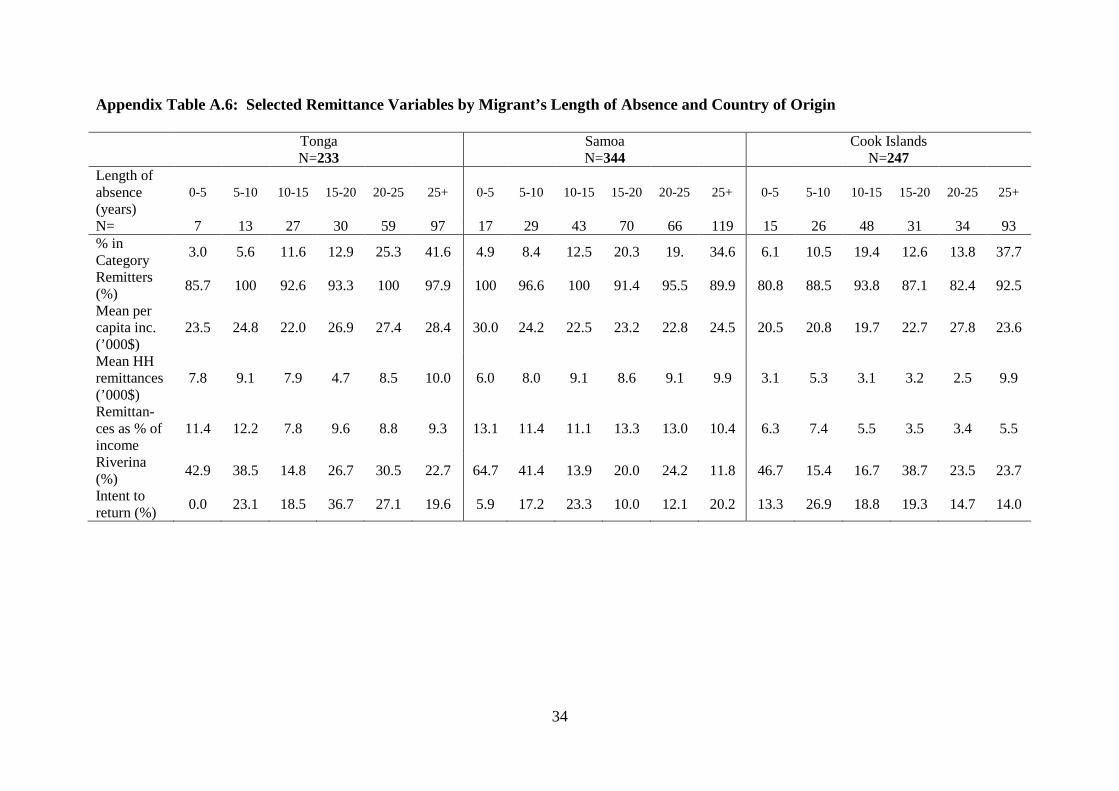
34
Appendix Table A.6: Selected Remittance Variables by Migrant’s Length of Absence and Country of Origin
Tonga N=233
Samoa N=344
Cook Islands N=247
Length of absence (years)
0-5 5-10 10-15 15-20 20-25 25+ 0-5 5-10 10-15 15-20 20-25 25+ 0-5 5-10 10-15 15-20 20-25 25+
N= 7 13 27 30 59 97 17 29 43 70 66 119 15 26 48 31 34 93 % in Category 3.0 5.6 11.6 12.9 25.3 41.6 4.9 8.4 12.5 20.3 19. 34.6 6.1 10.5 19.4 12.6 13.8 37.7
Remitters (%) 85.7 100 92.6 93.3 100 97.9 100 96.6 100 91.4 95.5 89.9 80.8 88.5 93.8 87.1 82.4 92.5
Mean per capita inc. (’000$)
23.5 24.8 22.0 26.9 27.4 28.4 30.0 24.2 22.5 23.2 22.8 24.5 20.5 20.8 19.7 22.7 27.8 23.6
Mean HH remittances (’000$)
7.8 9.1 7.9 4.7 8.5 10.0 6.0 8.0 9.1 8.6 9.1 9.9 3.1 5.3 3.1 3.2 2.5 9.9
Remittan-ces as % of income
11.4 12.2 7.8 9.6 8.8 9.3 13.1 11.4 11.1 13.3 13.0 10.4 6.3 7.4 5.5 3.5 3.4 5.5
Riverina (%) 42.9 38.5 14.8 26.7 30.5 22.7 64.7 41.4 13.9 20.0 24.2 11.8 46.7 15.4 16.7 38.7 23.5 23.7
Intent to return (%) 0.0 23.1 18.5 36.7 27.1 19.6 5.9 17.2 23.3 10.0 12.1 20.2 13.3 26.9 18.8 19.3 14.7 14.0

35
Appendix Table A.7: Regression Estimates-Sending Decisions of Remitting Migrant Households by Form of Remittance and Country of Origin
Probit Regression results: Average Marginal Effects (By Country)
Remit to Own Households Remit to Other Households
(1) (2) (3) (4) (5) (6)
Tonga Samoa
Cook Islands Tonga Samoa
Cook Islands
VARIABLES . . . . . . HH head male 0.106 0.004 0.049 0.084 -0.037 -0.228**
(0.068) (0.064) (0.068) (0.081) (0.078) (0.100)
Years of education -0.006 -0.004 0.003 0.029** 0.005 -0.007
(0.006) (0.006) (0.007) (0.012) (0.007) (0.007)
Marital status of HH head 0.038 -0.014 0.012 -0.031 -0.049 0.051
(0.060) (0.058) (0.061) (0.094) (0.076) (0.069)
Total HH income 0.000 -0.000 0.000 0.001 -0.000 0.001
(0.000) (0.000) (0.001) (0.001) (0.000) (0.000)
HH size -0.003 0.013 -0.003 -0.011 -0.000 -0.010
(0.009) (0.010) (0.016) (0.015) (0.014) (0.015)
Own house in Australia 0.060* 0.069* 0.041 -0.118** 0.071 0.007
(0.035) (0.037) (0.062) (0.055) (0.056) (0.061)
Total years away frm HC 0.005** -0.001 -0.004* 0.006** 0.002 0.002
(0.002) (0.002) (0.002) (0.003) (0.002) (0.002)
Origins in rural area of HC 0.032 -0.034 -0.145** 0.083 -0.030 0.082
(0.033) (0.038) (0.061) (0.074) (0.050) (0.065)
Living in Riverina -0.033 0.070* 0.066 -0.086 0.116* -0.028
(0.043) (0.042) (0.065) (0.070) (0.065) (0.054)
Unexpected events in Australian HH 0.049 0.038 0.144 0.092 0.277*** 0.157
(0.047) (0.055) (0.088) (0.098) (0.086) (0.118)
Unexpected events in HC HH
0.128*** 0.142 -0.009 -0.008 0.230*
(0.039) (0.123) (0.074) (0.050) (0.138)
Own house in HC 0.109***
0.219*** 0.009 0.113 0.228**
(0.025)
(0.085) (0.061) (0.069) (0.101)
Intend to return to HC 0.026 0.127*** 0.057 0.247*** 0.036 0.156*
(0.036) (0.037) (0.073) (0.081) (0.059) (0.085)
Had visitor from HC 0.169*** 0.225*** 0.338*** 0.094* 0.169*** -0.085*
(0.031) (0.027) (0.053) (0.055) (0.047) (0.051)
Parent living in HC 0.094*** 0.261*** 0.250*** -0.038 0.056 0.056
(0.028) (0.033) (0.063) (0.061) (0.048) (0.057)
Other migrants associated with HH -0.015*** -0.008 -0.004 0.019** -0.001 0.005
(0.005) (0.005) (0.010) (0.009) (0.008) (0.010)
Active in church -0.004 0.002 0.013 0.117** 0.072 0.048
(0.032) (0.038) (0.054) (0.059) (0.047) (0.053)
Observations 230 335 237 230 335 237 Log likelihood -45.26 -79.79 -92.30 -114.4 -144.3 -102.0 chi2 63.08 89.13 95.06 51.33 52.44 38.23 Pseudo R2 0.395 0.472 0.399 0.200 0.146 0.206 Standard errors in parentheses
*** p<0.01, ** p<0.05, * p<0.1
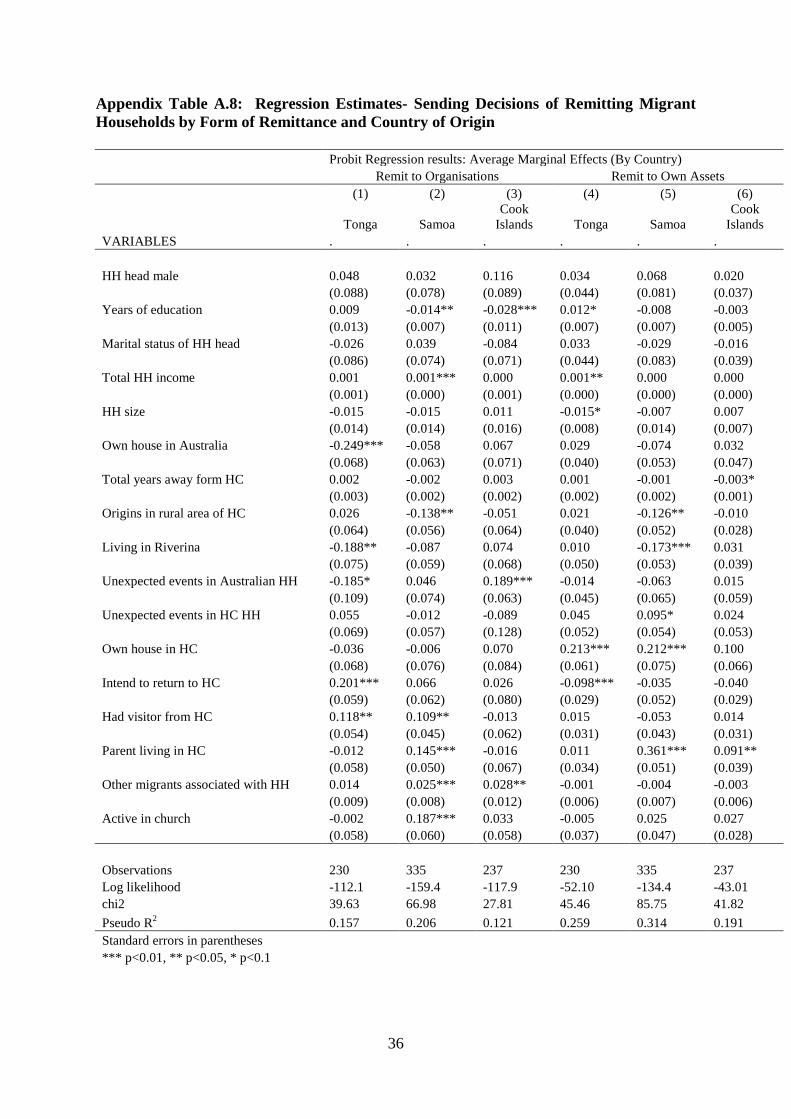
36
Appendix Table A.8: Regression Estimates- Sending Decisions of Remitting Migrant Households by Form of Remittance and Country of Origin
Probit Regression results: Average Marginal Effects (By Country)
Remit to Organisations Remit to Own Assets
(1) (2) (3) (4) (5) (6)
Tonga Samoa
Cook Islands Tonga Samoa
Cook Islands
VARIABLES . . . . . . HH head male 0.048 0.032 0.116 0.034 0.068 0.020
(0.088) (0.078) (0.089) (0.044) (0.081) (0.037)
Years of education 0.009 -0.014** -0.028*** 0.012* -0.008 -0.003
(0.013) (0.007) (0.011) (0.007) (0.007) (0.005)
Marital status of HH head -0.026 0.039 -0.084 0.033 -0.029 -0.016
(0.086) (0.074) (0.071) (0.044) (0.083) (0.039)
Total HH income 0.001 0.001*** 0.000 0.001** 0.000 0.000
(0.001) (0.000) (0.001) (0.000) (0.000) (0.000)
HH size -0.015 -0.015 0.011 -0.015* -0.007 0.007
(0.014) (0.014) (0.016) (0.008) (0.014) (0.007)
Own house in Australia -0.249*** -0.058 0.067 0.029 -0.074 0.032
(0.068) (0.063) (0.071) (0.040) (0.053) (0.047)
Total years away form HC 0.002 -0.002 0.003 0.001 -0.001 -0.003*
(0.003) (0.002) (0.002) (0.002) (0.002) (0.001)
Origins in rural area of HC 0.026 -0.138** -0.051 0.021 -0.126** -0.010
(0.064) (0.056) (0.064) (0.040) (0.052) (0.028)
Living in Riverina -0.188** -0.087 0.074 0.010 -0.173*** 0.031
(0.075) (0.059) (0.068) (0.050) (0.053) (0.039)
Unexpected events in Australian HH -0.185* 0.046 0.189*** -0.014 -0.063 0.015
(0.109) (0.074) (0.063) (0.045) (0.065) (0.059)
Unexpected events in HC HH 0.055 -0.012 -0.089 0.045 0.095* 0.024
(0.069) (0.057) (0.128) (0.052) (0.054) (0.053)
Own house in HC -0.036 -0.006 0.070 0.213*** 0.212*** 0.100
(0.068) (0.076) (0.084) (0.061) (0.075) (0.066)
Intend to return to HC 0.201*** 0.066 0.026 -0.098*** -0.035 -0.040
(0.059) (0.062) (0.080) (0.029) (0.052) (0.029)
Had visitor from HC 0.118** 0.109** -0.013 0.015 -0.053 0.014
(0.054) (0.045) (0.062) (0.031) (0.043) (0.031)
Parent living in HC -0.012 0.145*** -0.016 0.011 0.361*** 0.091**
(0.058) (0.050) (0.067) (0.034) (0.051) (0.039)
Other migrants associated with HH 0.014 0.025*** 0.028** -0.001 -0.004 -0.003
(0.009) (0.008) (0.012) (0.006) (0.007) (0.006)
Active in church -0.002 0.187*** 0.033 -0.005 0.025 0.027
(0.058) (0.060) (0.058) (0.037) (0.047) (0.028)
Observations 230 335 237 230 335 237 Log likelihood -112.1 -159.4 -117.9 -52.10 -134.4 -43.01 chi2 39.63 66.98 27.81 45.46 85.75 41.82 Pseudo R2 0.157 0.206 0.121 0.259 0.314 0.191 Standard errors in parentheses
*** p<0.01, ** p<0.05, * p<0.1

37
80 82 84 86 88 90 92 94 96 98
100
Bottom 40% Middle 40% Top 20%
%
Income categories
Percentage remitting households
Tonga
Samoa
Cook
Total
Appendix Figure A.1 Remittances by Income Category and Country of Origin

38
2
4
6
8
10
12
14
0-5 5-10 10-15 15-20 20-25 25+
%
Length of absence (years)
Remittances as proportion of income
Tonga
Samoa
Cook
Total
Appendix Figure A.2 Remittances by Duration of Absence and Country of Origin
39
References Asian Development Bank. (2011a). Tonga Fact Sheet (pp. 1-4). Manila, Philippines: Asian
Development Bank. Asian Development Bank. (2011b). Samoa Fact Sheet (pp. 1-4). Manila, Philippines: Asian
Development Bank. Asian Development Bank. (2011c). Cook Islands Fact Sheet (pp. 1-4). Manila, Philippines:
Asian Development Bank. Bertram, G., & Watters, R. (1985). The MIRAB Economy in South Pacific Microstates.
Pacific Viewpoint, 26(3), 497-519. Brown, R. P. C. (1995). Hidden Foreign Exchange Flows: Estimating Unofficial Remittances
to Tonga and Western Samoa. Asian and Pacific Migration Journal, 4(1), 35-54. Brown, R. P. C. (1997). Estimating remittance functions for Pacific Island Migrants. World
Development, 25(4), 613-626. Brown, R. P. C. (1998). Do Pacific Island migrants' remittances decline over time? Evidence
from Tongans and Western Samoans in Australia. Journal of Contemporary Pacific, 10(1), 107-151.
Brown, R. P. C., Connell, J., Jimenez, E., & Leeves, G. (2006). Chapter 3 Cents and Sensibility: the Economic Benefits of Remittances At Home and Away: Expanding Job Opportunities for Pacific Islanders Through Labour Mobility. Washington DC: World Bank.
Brown, R. P. C., & Jimenez, E. (2008). Estimating the net effects of migration and remittances on poverty and inequality: comparison of Fiji and Tonga. Journal of International Development, 20(4), 547-571. doi: 10.1002/jid.1474
Brown, R. P. C., & Walker, A. (1995). Migrants and their Remittances Results of a Household Survey of Tongans and Western Samaons in Sydney. Sydney: Centre for South Pacific Studies, University of New South Wales.
Connell, J., & Brown, R. P. C. (2005). Remittances in the Pacific An Overview. Philippines: Asian Development Bank.
Department of Immigration and Citizenship. (2010a). Community Information Summary - Cook Islands. Canberra: Department of Immigration and Citizenship.
Department of immigration and Citizenship. (2010b). Community Information Summary - Samoa. Canberra: Department of immigration and Citizenship.
Department of Immigration and Citizenship. (2010c). Community Information Summary - Tonga. Canberra: Department of Immigration and Citizenship.
Duflo, E., & Udry, C. (2004). Intrahousehold Resource Allocation in Cote d’Ivoire: Social Norms, Separate Accounts and Consumption Choices. Cambridge, Massachusetts, USA: National Bureau of Economic Research.
Duncan, R., & Chand, S. (2002). The Economics of the ‘Arc of Instability’. Asian-Pacific Economic Literature, 16(1), 1-9. doi: 10.1111/1467-8411.t01-1-00001
Fafchamps, M., McKenzie, D., Quinn, S., & Woodruff, C. (2011). When is Capital Enough to get Female Microenterprises Growing? Evidence from a Randomized Experiment in Ghana (pp. 1-59). Oxford: Centre for the Study of African Economies (CASE), Department of Economics.
Jimenez-Soto, E. V. (2008). The Social Protection Role of Remittances - The Cases of Fiji and Tonga. (Doctor of Philisophy Doctoral Thesis), University of Queensland, Brisbane. Available from UQ UQespace database.
Jimenez, E. V., & Brown, R. P. C. (2008). Assessing the poverty impacts of remittances with alternative counterfactual income estimates. Brisbane, Australia: SSchool of Economics, The University of Queensland.

40
Loomis, T. (1986). Remittances and Development: Cook Islands Migrants in New Zealand and Their Influence on Cook Islands Development. Auckland, New Zealand: Social Research and Development Trust.
Maclellan, N. (2008). Seasonal Workers for Australia – Lessons from New Zealand. Farm Policy Journal, 5(3), 43-53.
Maclellan, N., & Mares, P. (2006). Labour Mobility in the Pacific: Creating seasonal work programs in Australia. In S. Firth (Ed.), Globalisation and governance in the Pacific Islands (pp. 137-172). Canberra: ANU E Press.
Platteau, J.-P. (2000). Institutions, Social Norms, and Economic Development. Singapore: Harwood Academic Publishers.
Ratha, D., Mohapatra, S., & Silwal, A. (2011). Migration and Remittances Factbook 2011 (Second Edition ed.). Washington DC: The international Bank for Reconstruction and Development / The World Bank.
World Bank. (2006). At Home and Away: Expanding Job Opportunities for Pacific Islanders Through Labour Mobility. Washington DC: World Bank.

1
Table 1: Country Background Demographic and Economic Data
Figure 1: Trade Gap by Source of External Income (2007-2009)
Source: Based on data reported in Table 1. Trade gap defined here as imports minus exports. Own estimate of Cook Islands remittances based on unfinanced trade gap.
34.15
41.12
64.83
26.9 24.1
60
10 9.6
3.9 2.31 4.53
0.05 0
10
20
30
40
50
60
70
Tonga Samoa Cook Islands
Trade Gap Remittances ODA Net Borrowing
Ow
n Es
timat
e
% o
f GD
P
Ow
n Es
timat
e
Ow
n Es
timat
e
Tonga Samoa Cook Islands
Population (thous. 2010) 103.7 184 17.8 Ethnic Abroad (thous. 2006)* 125 300 70 Migrants (thous. 2006)* 100 220 30 GDP/Capita (US$ thous. 2009) 3.32 3.14 9.14 Imports/GDP (2007-10) 36.99 43.23 66.61 Exports/GDP (2007-10) 2.84 2.11 1.78 ODA/GDP (2007-09) 10.00 9.60 3.90 Net Borrowing/GDP (2007-09) 2.31 4.53 0.05 Remittances/GDP (2007-09) 26.90 24.10 n.a.+ Sources: Asian Development Bank (2011a, 2011b, 2011c) +There are no estimates of remittances to Cooks Islands. Based on the findings of this study we estimate that remittances to be around 50% of GDP which is consistent with the size of the ‘un-funded’ imports shown in this table.
Tables and figures from Brown et al (2012) An analysis of recent survey data on the remittances of Pacific island migrants in Australia
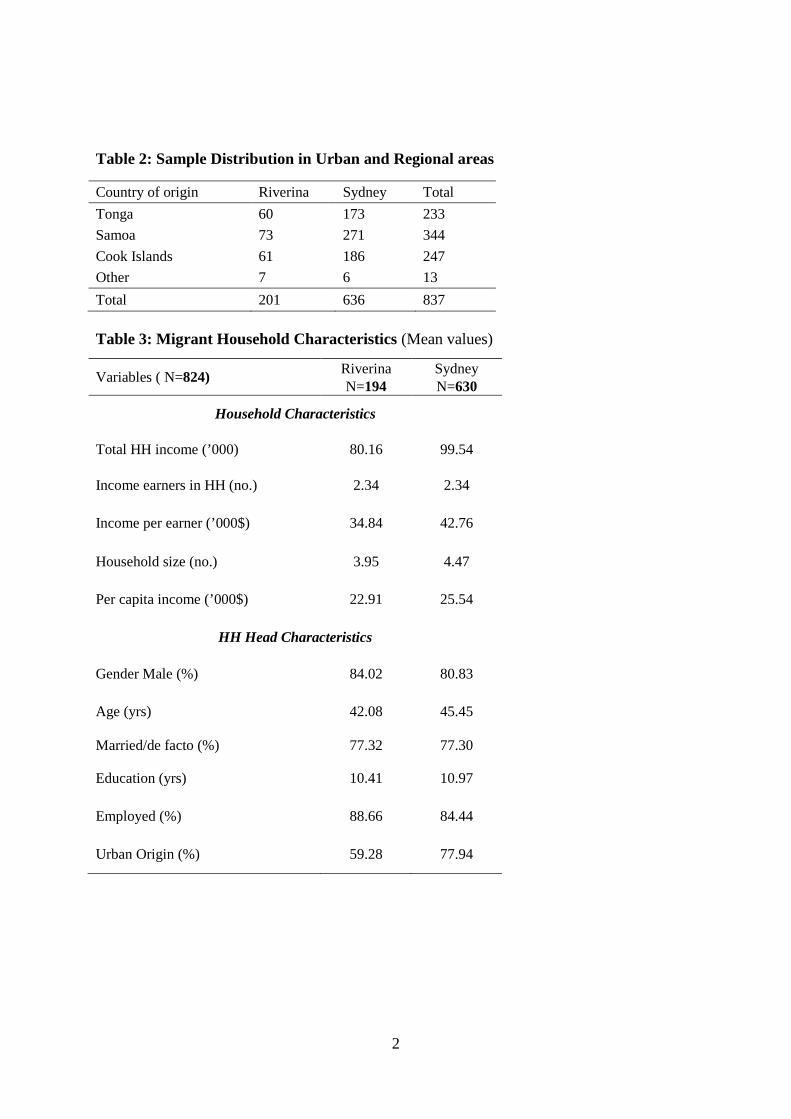
2
Table 2: Sample Distribution in Urban and Regional areas
Country of origin Riverina Sydney Total Tonga 60 173 233 Samoa 73 271 344 Cook Islands 61 186 247 Other 7 6 13 Total 201 636 837 Table 3: Migrant Household Characteristics (Mean values)
Variables ( N=824) Riverina Sydney N=194 N=630
Household Characteristics
Total HH income (’000) 80.16 99.54
Income earners in HH (no.) 2.34 2.34
Income per earner (’000$) 34.84 42.76
Household size (no.) 3.95 4.47
Per capita income (’000$) 22.91 25.54
HH Head Characteristics
Gender Male (%) 84.02 80.83
Age (yrs) 42.08 45.45
Married/de facto (%) 77.32 77.30
Education (yrs) 10.41 10.97
Employed (%) 88.66 84.44
Urban Origin (%) 59.28 77.94

3
Table 4: Occupation of Employed Migrants*
* Of the 4,236 adults covered by the survey 1,763 (41.6%) were employed at the time. Table 5: Migration History of Migrant Households
HH=household; * No others in Australia; + Whether or not others in Australia as well.
Occupational category (N=1763)
N= %
Skill category
%
Managers 57 3.23 Skilled
15.03 Professionals 107 6.07
Technicians & Trade 101 5.73 Community & Personal service 296 16.79
Semi-skilled
46.69 Clerical & Administration 141 8.00 Sales Workers 111 6.30 Machine operators 275 15.60 Labourers 675 38.29 Unskilled 38.29 Total Employed 1763 100.00
Variables ( N=824) Riverina Sydney
N=194 N=630
Household Head Characteristics
Total years abroad of HH Head 21.58 23.81
Years in Australia of HH Head 15.40 18.42
Step Migrant (%) 57.73 56.35
Step Migrant via NZ (%) 53.61 53.02
Household Characteristics
Other migrants (%) 89.18 96.67
Other migrants in Australia (%) 77.84 89.21
Other migrants in other countries (%)* 11.34 7.46
Other migrants in USA / UK (%)+ 5.15 9.84
Members in Origin Country (%) 96.91 86.19
Parent in Origin Country (%) 55.15 29.05
Visitor from Origin Country (%) 38.66 38.10
Intent to return (%) 11.34 20.48

4
Figure 2 Composition of Remittances by Category of Recipient
HH = household
Own HH 60%
Church 16%
Other HHs 7%
Own Assets 17%
Sydney
Own HH 71%
Church 11%
Other HHs 5%
Own Assets 13%
Riverina

5
Table 6a: Categories of Recipients (Numbers of households; % of remitters in parentheses)
Table 6b: Remittances of Migrant Households (Mean values)
Recipient Category Total (N=824) Own HH Institutions Other HHs Own Assets Exclusively Own HH 651 (84.7)
490 171 202 123
Institutions 603 (78.4) 490
172 178 89 Other HHs 196 (25.5) 171 172
77 2
Own Assets 205 (26.7) 202 178 77
0 Exclusively 214 (27.8) 123 89 2 0 Total Remitters 769 651 603 196 205 214 Non-Remitters 55
Tonga Samoa Cook Islands Total N=233 N=344 N=247 N=824
Variables Riverina Sydney Riverina Sydney Riverina Sydney Riverina Sydney
N=60 N=173 N=73 N=271 N=61 N=186 N=194 N=630 Remitters (n) 54 172 70 252 56 165 180 589 % of all HHs [90.00] [99.42] [95.89] [92.99] [91.80] [88.71] [92.78] [93.49]
Mean value of remittances for remitting HHs (in $ '000s) Total value of HH remittances 6.77 9.47 5.76 10.69 4.91 3.67 5.80 8.36 Per capita HH remittances 1.55 2.51 1.68 2.68 1.70 0.88 1.65 2.13 Remit to own HC HH 5.27 5.99 3.78 6.01 3.49 2.30 4.14 4.97 Remit to institutions in HC 0.65 1.20 0.61 1.94 0.60 0.69 0.62 1.37 Remit to other households in HC 0.38 0.95 0.32 0.50 0.19 0.33 0.30 0.58 Remit to own assets in HC 0.47 1.33 1.05 2.24 0.63 0.35 0.75 1.44
HH=household; HC=home country

6
Appendix Table A.2: Profile of Migrant Households by Country of Origin
Tonga N=233
Samoa N=344
Cook Islands N=247
Total N=824
Variables Riverina Sydney Riverina Sydney Riverina Sydney Riverina Sydney
N=60 N=173 N=73 N=271 N=61 N=186 N=194 N=630 Household Averages (Standard deviation)
Household size 4.13 (1.59)
4.72 (2.56)
3.78 (1.68)
4.40 (1.74)
3.97 (1.59)
4.33 (1.81)
3.95 (1.62)
4.47 (2.02)
Number of children below 16 yrs
1.03 (1.26)
1.43 (1.73)
1.15 (1.37)
1.30 (1.44)
0.98 (1.10)
1.34 (1.39)
1.06 (1.25)
1.34 (1.51)
Income earners 2.62 (1.19)
2.40 (1.38)
2.12 (1.07)
2.32 (1.29)
2.31 (1.19)
2.29 (1.22)
2.34 (1.16)
2.34 (1.30)
Total HH income (’000) 87.79 (36.35)
107.28 (69.97)
72.28 (48.60)
100.06 (58.21)
82.02 (45.66)
91.41 (50.64)
80.16 (44.41)
99.54 (59.92)
Income per earner (’000$)
35.76 (11.82)
45.44 (18.47)
34.54 (16.73)
42.89 (13.87)
34.26 (9.89)
40.03 (14.27)
34.84 (13.35)
42.76 (15.50)
Per capita income (’000$)
23.79 (11.51)
27.94 (18.67)
22.09 (14.40)
25.20 (14.93)
23.01 (11.96)
23.75 (15.03)
22.91 (12.76)
25.54 (16.14)
Household Head Gender Male (%) 80.00 78.03 87.67 86.25 83.61 75.54 84.02 80.83
Age (yrs) 41.98 (11.89)
48.23 (11.12)
41.66 (12.28)
44.30 (11.72)
42.67 (12.61)
44.56 (9.58)
42.08 (12.21)
45.45 (11.08)
Married/de facto (%) 75.00 72.83 82.19 80.81 73.77 76.34 77.32 77.30
Education (yrs) 10.44 (2.36)
12.03 (2.43)
10.03 (3.51)
10.81 (3.17)
10.84 (2.99)
10.23 (3.22)
10.41 (3.04)
10.97 (3.07)
Employed (%) 88.33 83.82 87.67 84.13 90.16 85.48 88.66 84.44
Urban Origin (%) 58.33 81.50 52.05 82.66 68.85 67.74 59.28 77.94

7
Appendix Table A.3: Migration History of Migrant Households by Country of Origin
Tonga N=233
Samoa N=344
Cook Islands N=247
Total N=824
Variables Riverina Sydney Riverina Sydney Riverina Sydney Riverina Sydney
N=60 N=173 N=73 N=271 N=61 N=186 N=194 N=630
Household percentages
Other migrants (%) 90.00 95.95 82.19 96.31 96.72 97.85 89.18 96.67
Other migrants in Australia (%) 76.67 89.60 69.86 88.93 88.52 89.25 77.84 89.21 Other migrants only in NZ & other countries except Australia (%)
13.33 6.36 12.33 7.38 8.20 8.60 11.34 7.46
Other migrants in USA / UK (%) 10.00 15.61 5.48 11.81 0.00 1.61 5.15 9.84
Members in Origin Country (%) 96.67 98.27 98.63 86.72 95.08 74.19 96.91 86.19
Parent in Origin Country (%) 50.00 26.59 60.27 36.90 54.10 19.89 55.15 29.05
Visitor from Origin Country (%) 43.33 51.45 27.40 35.79 47.54 29.03 38.66 38.10
Intent to return (%) 13.33 26.59 12.33 16.97 8.20 19.89 11.34 20.48
Remittances (%) 90.00 99.42 95.89 92.99 91.80 88.71 92.78 93.49
Household Head (Standard deviation)
Total years abroad 24.07 (10.54)
24.86 (10.62)
18.86 (11.55)
23.70 (9.71)
22.39 (12.73)
23.00 (12.47)
21.58 (11.79)
23.81 (10.84)
Years in Australia 18.00 (8.45)
20.94 (10.39)
13.23 (8.30)
17.35 (8.14)
15.44 (9.40)
17.64 (9.01)
15.40 (8.88)
18.42 (9.17)
Step Migrant (%) 65.00 36.42 49.32 73.06 60.66 50.54 57.73 56.35
Step Migrant via NZ (%) 58.33 30.64 46.58 70.48 57.38 48.39 53.61 53.02

8
Appendix Table A.4: Sending Decisions of Remitting Migrant Households by Country of Origin
Tonga N=233
Samoa N=344
Cook Islands N=247
Total N=824
Variables Riverina Sydney Riverina Sydney Riverina Sydney Riverina Sydney
N=60 N=173 N=73 N=271 N=61 N=186 N=194 N=630
Remitters (n) [% of all HH] 54 [90.00]
172 [99.42]
70 [95.89]
252 [92.99]
56 [91.80]
165 [88.71]
180 [92.78]
589 [93.49]
Remittances to own HC HH (% of remitting HH) Consulted OMs before remitting 9.26 18.02 15.71 20.24 5.36 17.58 10.56 18.85
Remit Money to own HC HH 92.59 90.70 94.29 82.54 76.79 54.55 88.33 77.08
Remit Goods to own HC HH 38.89 55.81 50.00 44.84 35.71 38.18 42.22 46.18 Payments on behalf of own HC HH 25.93 52.91 28.57 47.62 35.71 32.12 30.00 44.82
Money remittances to own HC HH (% of remitting HH) Formal channel 14.81 13.95 10.00 32.94 10.71 10.30 11.67 21.05 Cost incurred for sending money 61.11 72.67 62.86 58.73 57.14 36.36 60.56 56.54
Frequency of remitting money to own HC HH (% of remitting HH)
Once a year 15.69 3.85 19.70 9.62 16.28 16.67 17.50 9.03
2 – 4 times a year 45.10 53.85 62.12 55.29 53.49 60.00 54.38 55.73
5 – 8 times a year 19.61 25.00 12.12 24.04 20.93 13.33 16.88 22.25
9 – 12 times a year 9.80 12.18 3.03 8.65 6.98 8.89 6.25 9.91
More than 12 times a year 9.80 4.49 3.03 2.40 2.33 1.11 5.00 2.86
HH=household; HC=home country; OMs=other migrants from same HC HH

9
Appendix Table A.5: Selected Remittances Variables by Income Category and Country of Origin*
* The income categories are based on per capita incomes. The categories were then created by splitting the entire sample of individuals into the three income groups; eg. In the Case of Tonga the Bottom Income Category consists of the 40% poorest individuals living in 76 households, while the Middle Income Category consists of the 40% middle income individuals living in 107 households.
Tonga N=231
Samoa N=337
Cook Islands N=239
Income category Bottom
40% Middle 40% Top 20%
Bottom 40%
Middle 40%
Top 20%
Bottom 40% Middle 40% Top
20% N=76 N=107 N=48 N=147 N=120 N=70 N=101 N=103 N=35
Remitting HH (%) 98.68 96.26 95.83 91.84 95.83 94.28 86.14 95.15 85.71 Mean HH size 5.74 4.41 3.00 4.83 4.18 3.21 4.96 3.98 3.06 Mean HH remittances ($) 5.62 8.13 14.22 7.53 10.32 9.97 3.25 4.04 3.75
Remittances as % of income 11.96 7.35 9.17 15.48 10.50 6.23 6.89 4.47 2.74
Riverina(%) 23.68 34.58 10.42 25.17 19.17 17.14 19.80 33.98 11.43 Informal channels (%) 18.42 21.50 8.33 19.05 16.67 11.43 13.86 14.56 11.43 HH Head total years abroad 22.78 24.69 27.60 21.57 24.24 21.92 21.77 22.92 27.47

10
Appendix Table A.6: Selected Remittance Variables by Migrant’s Length of Absence and Country of Origin
Tonga N=233
Samoa N=344
Cook Islands N=247
Length of absence (years)
0-5 5-10 10-15 15-20 20-25 25+ 0-5 5-10 10-15 15-20 20-25 25+ 0-5 5-10 10-15 15-20 20-25 25+
N= 7 13 27 30 59 97 17 29 43 70 66 119 15 26 48 31 34 93 % in Category 3.0 5.6 11.6 12.9 25.3 41.6 4.9 8.4 12.5 20.3 19. 34.6 6.1 10.5 19.4 12.6 13.8 37.7
Remitters (%) 85.7 100 92.6 93.3 100 97.9 100 96.6 100 91.4 95.5 89.9 80.8 88.5 93.8 87.1 82.4 92.5
Mean per capita inc. (’000$)
23.5 24.8 22.0 26.9 27.4 28.4 30.0 24.2 22.5 23.2 22.8 24.5 20.5 20.8 19.7 22.7 27.8 23.6
Mean HH remittances (’000$)
7.8 9.1 7.9 4.7 8.5 10.0 6.0 8.0 9.1 8.6 9.1 9.9 3.1 5.3 3.1 3.2 2.5 9.9
Remittan-ces as % of income
11.4 12.2 7.8 9.6 8.8 9.3 13.1 11.4 11.1 13.3 13.0 10.4 6.3 7.4 5.5 3.5 3.4 5.5
Riverina (%) 42.9 38.5 14.8 26.7 30.5 22.7 64.7 41.4 13.9 20.0 24.2 11.8 46.7 15.4 16.7 38.7 23.5 23.7
Intent to return (%) 0.0 23.1 18.5 36.7 27.1 19.6 5.9 17.2 23.3 10.0 12.1 20.2 13.3 26.9 18.8 19.3 14.7 14.0

11
Table 10: Probit Regression Results by Category of Remittances Sent and by Country of Origin
Remittances sent to: Own HH Other HH Organizations Own Assets
Tonga Samoa
Cook Islands Tonga Samoa
Cook Islands Tonga Samoa
Cook Islands Tonga Samoa
Cook Islands
Years of education
++
- - - - - + Total HH income
+++
++
Own house in Australia + +
- -
- - - Total years away from HC ++
- ++
-
Origins in rural area of HC
- -
- -
- - Living in Riverina
+
+
- -
- - -
Unexpected events in Aus HH
+++
-
+++ Unexpected events in HC HH
+++
+
+
Own house in HC +++
+++
++
+++ +++ Intend to return to HC
+++
+++
+ +++
- - -
Had visitor from HC +++ +++ +++ + +++ - ++ ++ Parent living in HC +++ +++ +++
+++
+++ ++
Other migrants associated - - -
++
+++ ++ Active in church
++
+++
+++, ++, + indicate positive effect and statistically significant at the 1%, 5% and 10% levels respectively -, - - , - - - indicate negative effect and statistically significant at the 1%, 5% and 10% levels respectively HH=household; HC=home country