Embed Size (px)
Citation preview

AN ANALYSIS OF RIVER FRAGMENTATION IN THE SPANISH RIVER BASINS
Developed by:
Ecohidráulica, S.L.
At the request of:
Centro Ibérico de Restauración Fluvial (CIREF) Wetlands International European Association
I+D+i en Gestión del Agua EH-BIO-007-16


Final Report
AN ANALYSIS OF RIVER FRAGMENTATION IN THE SPANISH RIVER BASINS
Developed by: Gonzalo Rincón Sanz Javier Gortázar Rubial
Technical and Scientific Advice:
Carlos Alonso González Diego García de Jalón Lastra
This report was supported by the European Commission through LIFE NGO funding
December 2016
I+D+i en Gestión del Agua EH-BIO-007-16

Acknowledgements
A project like this that has required the collection of much information also requires the help of many people.
We would like to express our gratitude to the following persons who have facilitated the performance of this work.
From the data collection process of different River Basin Districts:
- To Mònica Bardina Martín from Agència Catalana de l´Aigua and Marc Ordeix Rigo from Museu del Ter: Centre d´estudis dels rius mediterranis.
- To Iñaki Arrate from Uraren Euskal Agentzia.
- To Gustavo González from Icthios s.l
- To José Ángel Losada García from Confederación Hidrográfica del Ebro
- To Carmen Macías and the people from the department of Hydrological Planning of the Guadalquivir River Basin District.
- To Lidia Arenillas from Confederación Hidrográfica del Tajo
- To the people from the department of Hydrological Planning of the Guadiana River Basin District
- To Francisco Hervella from Dirección Xeral de Conservación da Naturaleza (Xunta de Galicia)
- To Emilio Esteban Rodríguez Merino from Confederación Hidrográfica del Miño-Sil
- To Sara María Jiménez Argudo from Confederación Hidrográfica del Júcar
- To Eduardo Lafuente Sacristán from Confederación Hidrográfica del Segura and Francisco Oliva Paterna from the University of Murcia.
- To Pepe Barquín from Environmental Hydraulics Institute (IHCantabria) of University of Cantabria
- To Silvia Rubio Rubio from Agencia Medio Ambiente y Agua de la Junta de Andalucía. Also thanks to Quique Larios.
- To Enrique Moreno from Consejo Insular de Aguas de Gran Canaria
Special thanks to Javier Sánchez Martínez from the Ministry of Agriculture and Fishing, Food and Environment.

From the cost-benefit case studies:
Thanks to Pedro Brufao for the information provided and his advices.
To Javier Sanz-Ronda from the University of Valladolid.
To Gloria Lázaro and the people of AEMS-Ríos con Vida involved in the Amber project.
To Pao Fernández Garrido from World Fish Migration Foundation.
To Nekane Etxandi from the Uraren Euskal Agentzia.
To Nicolás Hernández Monedero from the Servicio de Política Forestal y Espacios Naturales de Cuenca (Castilla-La Mancha).
Special thanks to José Ignacio Santillán for his valuable suggestions on the benefits of the removal of barriers.
And last but not least, our thanks to Vanesa Martínez and Joaquín Solana from the Universidad Politécnica de Madrid for their support and ideas during the last stages of this report.

INDEX
Acknowledgements ....................................................................................................................... 5
1. Introduction .......................................................................................................................... 9
2. Regulatory framework ........................................................................................................ 11
3. Information gathering ......................................................................................................... 11
4. Inventory of barriers ........................................................................................................... 13
5. Barrier permeabilization measures ..................................................................................... 15
5.1. Actions developed in the National Strategy of River Restoration .............................. 17
6. Specific information for each River Basin District ............................................................... 19
6.1. Internal Basins of Catalonia .............................................................................................. 19
6.2. Internal Basins of Basque Country ................................................................................... 22
6.3. Duero River Basin District................................................................................................. 23
6.4. Ebro River Basin District ................................................................................................... 26
6.5. Guadalquivir River Basin District ...................................................................................... 28
6.6. Tajo River Basin District .................................................................................................... 29
6.7. Guadiana River Basin District ........................................................................................... 31
6.8. Galicia-Coast River Basin District ...................................................................................... 32
6.9. Miño-Sil River Basin District ............................................................................................. 34
6.10. Júcar River Basin District ................................................................................................ 35
6.11. Segura River Basin District ............................................................................................. 37
6.12. Cantabrian River Basin District ....................................................................................... 39
6.13. Andalusian River Basin District ....................................................................................... 39
6.14. Spanish archipelagos ...................................................................................................... 41
-Canary Islands .................................................................................................................... 41
-Balearic Islands ................................................................................................................... 42
7. Summary of the data collected in the River Basin Districts. ............................................... 42
8. Cost-benefit case studies in Spain ....................................................................................... 47
Background of cost-benefit studies in dam removal .............................................................. 48
The dam removal in Spain: a brief summary .......................................................................... 48
General benefits of dam removal ........................................................................................... 49
Ecosystem Services provided by rivers and its effect on Human Well-being ......................... 50
Study cases .............................................................................................................................. 51
7
Case 1: The San Marcos weir removal .................................................................................... 52
Case 2: Inturia dam removal ................................................................................................... 56
Case 3: Robledo de Chavela dam removal .............................................................................. 62
Case 4: La Gotera dam removal .............................................................................................. 67
Summary table of dam removal actions ................................................................................. 71
Case 5. Fish pass on the Najerilla River ................................................................................... 76
Case 6. Fish pass in Las Librerías weir on the Guadiela River ................................................. 79
Summary table of fish passage actions ................................................................................... 82
Cost-benefit methodology applied to barriers permeabilization ........................................... 84
Simulations pre and post permeabilization and weighting of variables. ................................ 90
9. Recommendations on management, policy and best practice for river restoration .............. 95
First part: analysis of the information of each River Basin ..................................................... 95
Second part: cost-benefit case studies ................................................................................... 96
SWOT analysis of the state of longitudinal connectivity and dam removal in Spain .............. 98
References ................................................................................................................................. 101
References of every River Basin District ............................................................................... 101
General references ................................................................................................................ 108
Appendix ................................................................................................................................... 111
Maps ...................................................................................................................................... 111
8

1. Introduction
Rivers are one of the most threatened ecosystems in the world (Dudgeon et al 2006), especially affected by the longitudinal disconnection of the fluvial systems. Longitudinal connectivity in rivers is an extremely important concept that is altered by human activities such as flow regulation produced by dams, weirs and other barriers, disrupting the upstream-downstream linkages in the river (Ward 1989). The loss of longitudinal connectivity in rivers is a major problem worldwide as a result of the dam development (Gought et al. 2012). Loss of longitudinal connectivity is considered to hinder or impede the movement of fish species in the rivers, especially the migratory fish. However it is also important to take into account not only the movement of fish but also the amount of sediments that are retained by the presence of barriers.
Dams and weirs are necessary for human activities; they support agriculture and industry, provide water for human consumption, prevent flooding and also generate electricity. All this makes the dams important for society and, for this reason, they is no general intention to manage the passability of these obstacles.
Spain is one of the countries with the largest number of dams in the world. The existence of more than 1,500 large dams is documented (MAPAMA 2016). Of the total, 353 are state-owned and 1185 belong to private owners (Table 1). In spite of this, the public information on inventory of barriers still remains heterogeneous and incomplete (although there has been a progress in the availability of this information in recent years). There is evidence that the current inventories developed by the different River Basin Districts of the country determine the existence of about 26,000 barriers in our rivers, but it is estimated that the actual number can approach to more than 50,000 obstacles. These inventories are not always available for the public, which is a problem because this information can generate awareness in the society about the problem of the loss of longitudinal connectivity in Spain due to the presence of barriers.
9

Table 1. Inventory of large dams in each River Basin District according to their ownership. Source: Ministry of Agriculture and Fisheries, Food and Environment (MAPAMA) (year 2016).
River Basin District Number of State-owned Dams
Number of private owned
Dams Total
Balearic Islands 0 2 2 Cantabric River Basin District 3 68 71
Ceuta 2 0 2 Andalusian Mediterranean
Basins 3 44 47
Internal Basins of Catalonia 0 16 16 Internal Basins of the Basque
Country 0 14 14
Duero River Basin District 38 107 145 Ebro River Basin District 75 224 299 Galicia-Coast River Basin
District 0 24 24
Guadalete and Barbate River Basin 0 27 27
Guadalquivir River Basin District 51 71 122 Guadiana River Basin District 39 151 190
Júcar River Basin District 32 22 54 Las Palmas (Canary Island River
Basin) 0 61 61
Miño-Sil River Basin District 6 70 76 Segura River Basin District 38 5 43
Tajo River Basin District 66 218 284 Tenerife (Canary Island River
Basin) 0 16 16
Tinto, Odiel and Piedras River Basin 0 45 45
To develop a more realistic representation of the problem of the disconnection in our rivers it is very important to involve society to demand the removal of obstacles that have lost their usefulness or are harmful to the ecology of the river. Once the society is aware of the problematic of the loss of longitudinal connectivity produced by the existence of barriers, it will be possible to develop plans to prioritize the actions on specific barriers, so as to produce an effective restoration of stream connectivity.
10

2. Regulatory framework
The public access to environmental information, participation and access to justice in environmental matters is a right that is regulated by the Law 27/2006. According to this law, the River Basin Authorities should make available information on the inventory of obstacles and the implementation of measures to improve the longitudinal connectivity of their rivers.
The European Union Water Framework Directive (2000/60/CE) establishes the need to reach a good ecological status of water bodies by 2015. This requires the application of different measures, including the plans for the environmental restoration of rivers (Perni and Martínez-Paz 2012).
In compliance with the WFD, different programs and projects are being developed to restore river connectivity and achieve the good ecological status of water bodies. These projects have been developed within the National Strategy of River Restoration (NSRR) and within the framework of the environmental objectives and measures of the Hydrological Plans of each River Basin.
3. Information gathering
The main part of this report is an analysis of the state of the art on access to the information about the river fragmentation in the Spanish basins. More specific information on the existence of an integrative plan to improve river connectivity at the scale of River Basin, the application of a passability index to each obstacle, the existence of public participation plans related to improve the river connectivity, etc. are also required to complete the report.
This process of collecting information consisted of two main steps:
1. Information search in the websites of every River Basin District. 2. Information request to the Authorities, including River Basin Authorities, water
agencies, universities and research centers, etc.
Once the information is received, it was selected separating the information obtained in the Internet (easily accessible information) from the information received in the requests to the Authorities in order to develop a realistic image of the availability of this information in the different River Basins (see table 2).
11

Table 2. list of authorities consulted during the development of the report.
River Basin District Consulted Authorities
Internal Basins of Catalonia -Agència Catalana de l´Aigua (ACA) -Museu del Ter: Centre d´estudis dels rius mediterranis
Internal Basins of the Basque Country
-Agencia Vasca del Agua (Uraren Euskal Agentzia, URA) -Diputación Foral de Gipuzkoa
Duero River Basin District -Confederación Hidrográfica del Duero -ICTHIOS Gestión Ambiental S.L.
Ebro River Basin District -Confederación Hidrográfica del Ebro
Guadalquivir River Basin District -Confederación Hidrográfica del Guadalquivir
Tajo River Basin District -Confederación Hidrográfica del Tajo
Guadiana River Basin District -Confederación Hidrográfica del Guadiana
Júcar River Basin District -Confederación Hidrográfica del Júcar
Segura River Basin District -Confederación Hidrográfica del Segura -University of Murcia
Miño Sil River Basin District -Confederación Hidrográfica del Miño-Sil
Galicia-Coast River Basin District
-Xunta de Galicia: Augas de Galicia -Dirección Xeral de Conservación da Naturaleza.
Andalusian River Basin District -Agencia Medio Ambiente y Agua de la Junta de Andalucía
Cantabrian River Basin District
-Environmental Hydraulics Institute (IHCantabria). University of Cantabria
-University of Oviedo -Confederación Hidrográfica del Cantábrico
Canary Islands -Consejo Insular de Aguas de Gran Canaria
Balearic Islands -Agencia Balear del Agua y la Calidad Ambiental (ABAQUA)
12

Other Authorities consulted were:
- Ministry of Agriculture and Fishing, Food and Environment (MAPAMA):
- Subdirección General de Gestión Integrada del Dominio Público Hidráulico.
- Dirección General del Agua.
-AEMS-Ríos con vida.
-University of the Basque Country.
-University of Valladolid.
-Polytechnic University of Valencia.
-University of Santiago de Compostela.
4. Inventory of barriers
The availability of barriers information differs substantially from one basin to others. In general, most of the basin authorities have a public inventory of large dams and the rivers in which they are located, but the existence of a complete obstacle list where weirs are also included is more difficult to find. Moreover, some lists of weirs are not updated.
There is an official inventory of the large dams in the country on the Ministry of Agriculture and Fishing, Food and Environment (MAPAMA) website. Although access to this information is public, it is not easy to obtain a geo-database mapping of this inventory of large dams.
13

Figure 1.a. Barriers inventory obtained from the different River Basin Authorities and those
that appear in the inventory of large dams (red points). Green points represents the information obtained directly from the website of the River Basin Authorities (therefore
easily accessible information), whereas orange points represent the information provided by express request to the River Basin Authorities. The River Basins without obstacles in
green or orange represent areas which we have not yet received data. The case of the Canary Islands is particular because their rivers are temporary. Furthermore, there are no native freswater fish species except eel (Anguilla anguilla).
Figure 1.b. Barriers inventory in Canary Islands. Only information from Gran Canaria Island was provided.
14

5. Barrier permeabilization measures
The permeabilization measures (including both the development of a fish passage or the removal of the barrier) have been performed in Spain unequally according to each River Basin District (figure 2). The creation of fishpass is a measure that has been applied for barriers permeabilization for decades in Spain. There are records of these infrastructures built in 1960 in Catalonia. The problem is that many of these actions have been done inefficiently, investing large amounts of money in the design of completely ineffective fish scales. For example, in the barriers inventory provided by the Duero River Basin District there are a total of 104 fish passages installed in, but 68 of them are not operative.
Figure 2. fish passages by River Basin District collected in the barriers inventories provided by the authorities.
Some of these actions are included in the Hydrological Plans of each basin, both in the old plans (planned for the years 2009-2015) and in the new ones (planned for the years 2015-2021). The problem is that this information on permeabilization is not very useful as it is not clearly established in the plans the exact location of the permeabilized obstacle (for more detailed information, see section of permeabilized barriers of each River Basin District in section 6).
Based on the inventories of obstacles provided by the different River Basin Districts, we developed a figure with the location of the fish passages in the country (figure 3).
0
20
40
60
80
100
120
Cata
loni
a
Due
ro
Gua
dalq
uivi
r
Basq
ue C
ount
ry
Gal
icia
Coa
st
Ebro
Miñ
o-Si
l
Júca
r
Segu
ra
Gua
dian
a
Number of fish passages
15

Figure 3. location of the fish passages recorded in the inventories provided by the River Basin
District authorities. The Basins without information correspond to inventories in which there is no information on the permeability of obstacles or its location is not specified.
A marked difference is observed between the watersheds of the north and south.
During the first years of the 21st century there has been an increase in the development of measures to permeabilize obstacles, especially with the construction of new fish passages, but increasingly taking into account the elimination of weirs as a practice to improve the longitudinal connectivity of rivers (figures 4 and 5).
Figure 4. Comparison of the number of permeabilization actions developed by year in Spain,
including fish passage and weir removal actions. Source: Confederación Hidrográfica del Segura (CHS).
16

Figure 5. Permeabilization measures developed in Spain during the years 2006-2014. Source: Confederación Hidrográfica del Segura (CHS).
5.1. Actions developed in the National Strategy of River Restoration
An important event in Spain was the implementation of the National Strategy of River Restoration (NSRR). Under their framework some actions of barrier permeabilization and dam removal were developed (Figure 6).
The National Strategy of River Restoration is a program of measures developed by the Ministry of Agriculture and Fishing, Food and Environment (MAPAMA) in line with the objectives set out in the WFD. Its objective is to recover the integrity of the ecological functioning of rivers and to make compatible all administrative uses and actions with the conservation of their natural values (MAGRAMA 2012).
Permeabilization actions (2006-2014)
Fish passage Dam/weir demolition
17

Figure 6. Map of the actions done in the National Strategy of River Restoration framework. The brown points represent the barriers removed between the years 2006-2016 while the green points represent the barriers permeabilized by the construction of fish passes between the
years 2002-2016 (MAPAMA 2016).
Figure 7. number of weirs removed by River Basin District during the years 2006-2016.
As seen in figure 7, during the application of the NSRR framework, the Duero River Basin District leads the ranking of barrier permeabilization followed by the Cantabrian River Basin District (including their Western and Eastern divisions).
0
20
40
60
80
100
120
WesternCantabric
EasternCantabric
Tajo Segura Duero Miño-Sil Catalonia Júcar Ebro
18

6. Specific information for each River Basin District
In order to clarify the use of bibliographic references and to avoid confusions because most of the documents consulted have a Spanish title, we have developed a reference system for each River Basin District to facilitate the reading of the document. In this way, the references are listed at the end of the report, ranked according to its use for each River Basin District. When a reference is cited, the legend will appear like: "see document (the name of the River Basin District and the number of reference)". Example: for the 3rd reference consulted in the Ebro River Basin District, the legend will be: (see Ebro document 3).
6.1. Internal Basins of Catalonia
The Catalan Water Agency (Agència Catalana de l`Aigua, hereafter ACA) is one of the fluvial authorities where more plans on improving the longitudinal connectivity in its rivers can be found. Also, a lot of information about the passability of their barriers has been collected and processed generating a complete inventory of barriers in where you can find information about the location of each barrier, their physical characteristics and if they are permeabilized or not. The ACA provided an updated inventory of barriers (dams and weirs) in their basin (Figure 8). This information is not available in the River Basin website but the ACA can provide it after request.
Figure 8. location of obstacles in the river network of the Internal Basins of Catalonia, in the
east part of the Catalonia Autonomous Community.
19

A fish pass assessment called River Connectivity Index, ICF in Spanish (Solà et al. 2011) has been applied in this River Basin. The index is based on the comparison between obstacle characteristics (and fish pass if any) and the ability of the fishes potentially present in the considered river section to overcome the obstacle. To calculate this index, the most characteristics fish species in the Catalan rivers were clustered into four groups: (G1) littorals and similar species, divided in (G1a) large species with a moderate capacity to overcome obstacles, i.e. Alosa alosa and (G1b) small or benthic species with a moderate capacity to overcome obstacles, i.e. Petromyzon marinus, (G2) eels and similar, i.e. Anguilla anguilla, (G3) cyprinids and similar species, divided in (G3a) large species with a moderate capacity to overcome obstacles, i.e. Barbus meridionalis and (G3b) small species with little capacity to overcome obstacles, i.e. Phoxinus phoxinus, (G4) trout and similar, intra-river migratory species with a high capacity to overcome obstacles by swimming and/or jumping, i.e. Salmo trutta (see Catalonia document 1). According to the existence of an integrative plan to improve the connectivity in the river basin, there is information in a document of the year 2010 about the development of a programme to improve the fluvial connectivity in Catalonia (see Catalonia document 2). The inventory of obstacles provided by the Catalan Water Agency also provides detailed information about weir permeabilization and weir removal measures, including the year of the works and the river where it takes place. Also, the effectiveness of the fish passes in weirs associated with hydropower plants and gauging stations has been evaluated by Ordeix et al 2011 (see Catalonia document 3).
Figure 9. Permeabilization actions developed in the Internal Basins of Catalonia. Source:
inventory of barriers from the Agència Catalana de l`Aigua (ACA).
0
20
40
60
80
100
120
Fish passages Total removal Partial removal
Permeabilization actions in the Catalan rivers
20

Figure 10. Number of fish passages built in the Internal Basins of Catalonia between the years
1960 and 2008. Source: inventory of barriers from the Agència Catalana de l´Aigua (ACA).
Figure 11. Set of permeabilization actions developed in this basin during the years 2009-2016.
Source: inventory of barriers from the Agència Catalana de l`Aigua (ACA).
In regard to an inventory of fish species near the barriers, there is information available in the document about the fish communities in Catalonia in 2014 (see Catalonia document 4). Also, in the document of the assessment of fish connectivity in the rivers of Catalonia in 2006 (see Catalonia document 5) there is a list of fish species (both native and exotic species) for each obstacle of the inventory.
0
1
2
3
4
5
6
719
60
1970
1990
1991
1992
1993
1994
1995
1998
2001
2002
2003
2004
2005
2006
2007
2008
Fish passages built in the Internal Basins of Catalonia (1960 - 2008)
0
1
2
3
4
5
6
7
8
2009 2010 2011 2012 2013 2014 2015 2016
Developed actions by year (2009-2016)
Fish passages Partial removal Total removal
21
In this case, there is not specific information about public participation related to the improvement of river connectivity. However, there are some informative programs about what a fish passage is (see Catalonia document 6). Finally, there is not a monitoring programme to check the improvements of fluvial connectivity in this River Basin. Managing instructions to facilitate fish migrations across obstacles are given in the document about the fish communities in Catalonia (see Catalonia document 4). Some information on the monitoring of the hydromorphological quality of the Catalan rivers can be found for the years 2007-2012 (see Catalonia document 7). However, we cannot find more available information about this topic.
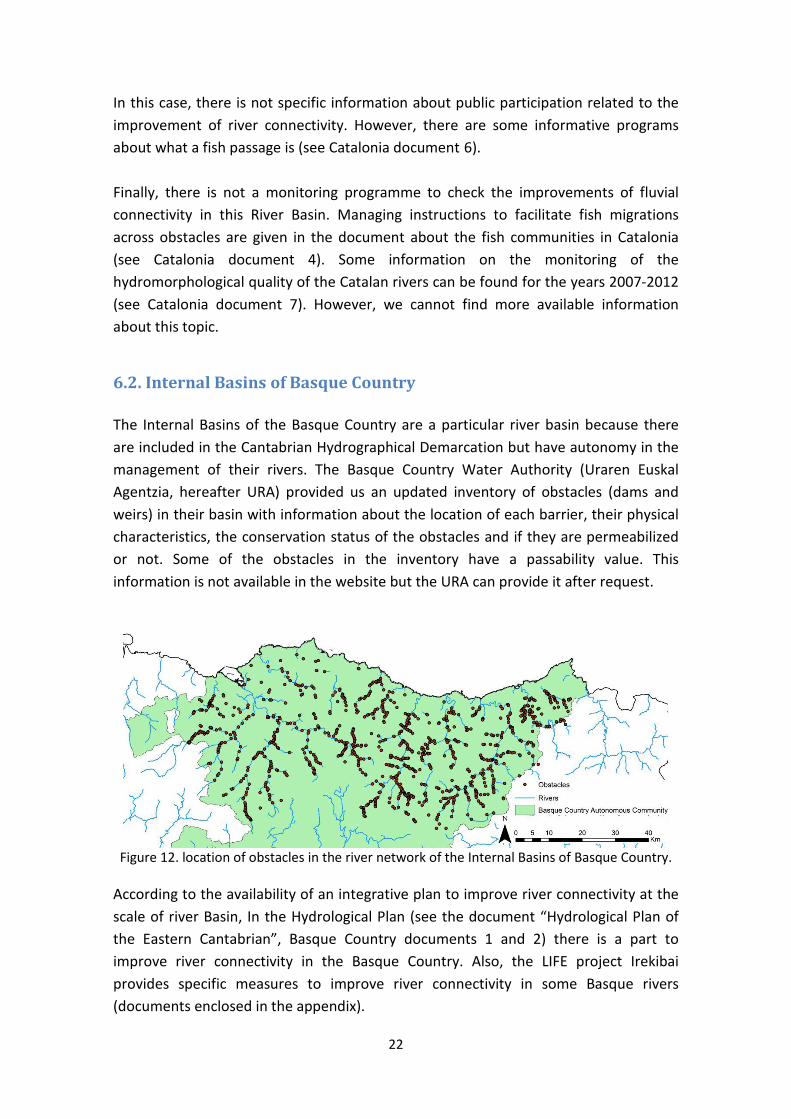
6.2. Internal Basins of Basque Country The Internal Basins of the Basque Country are a particular river basin because there are included in the Cantabrian Hydrographical Demarcation but have autonomy in the management of their rivers. The Basque Country Water Authority (Uraren Euskal Agentzia, hereafter URA) provided us an updated inventory of obstacles (dams and weirs) in their basin with information about the location of each barrier, their physical characteristics, the conservation status of the obstacles and if they are permeabilized or not. Some of the obstacles in the inventory have a passability value. This information is not available in the website but the URA can provide it after request.
Figure 12. location of obstacles in the river network of the Internal Basins of Basque Country.
According to the availability of an integrative plan to improve river connectivity at the scale of river Basin, In the Hydrological Plan (see the document “Hydrological Plan of the Eastern Cantabrian”, Basque Country documents 1 and 2) there is a part to improve river connectivity in the Basque Country. Also, the LIFE project Irekibai provides specific measures to improve river connectivity in some Basque rivers (documents enclosed in the appendix).
22

The inventory of barriers provided by the URA encloses specific information about the permeabilization of the obstacles: if they have a fish pass (and its characteristics) or if this obstacle has been removed. There are some actions of dam removal performed in the LIFE project Irekibai (see Basque Country documents 3, 4 and 5). Also, there are some actions of dam removal performed by the water authorities under the National Strategy of River Restoration Framework between the years 2006-2016 see (figure 6). An inventory of fish species, both native and exotic, is provided by the URA where you can find information on the presence of fish species in each river of this River Basin (see Basque Country document 4). No geo-database is available for the moment. In this River Basin is where we have found more information regarding the processes of information and public participation. A good amount of information about these topics can be found in the LIFE project Irekibai (documents enclosed in the appendix). These documents are available for the public in the website of the LIFE project. Finally, there is a study from 2013 to measure the passability of a specific obstacle (see Basque Country document 5). Also, monitoring programmes of fish species, including allis shad (Alosa alosa), sea lamprey (Petromyzon marinus) and Atlantic salmon (Salmo salar) have been carried out in the rivers between the Autonomous Communities of Navarra and the Basque Country in LIFE project Irekibai (Basque Country document 6)
6.3. Duero River Basin District
The Duero River Basin District is probably the River Basin where better information on longitudinal connectivity is available. This information is, to a greater extent, available to the public on the website of the Duero River Basin Authority (Confederación Hidrográfica del Duero, hereafter CHD). An inventory of obstacles that includes dams and weirs can be downloaded from de website of the CHD. Further, we have an inventory developed in 2010 with complete information of every obstacle (see Duero document 1). This inventory is the most complete we have found.
23

Figure 13. location of obstacles in the river network of Duero River Basin District.
A complete report about the passability of the barriers of the Duero Basin was developed in 2010. The passability was measured by the Passability Index (Índice de Franqueabilidad or IF in Spanish). To calculate the IF of every barrier the fish species were clustered into six groups: (1) fish species with high swimming and jump capacity, i.e. salmonids like Salmo trutta, (2) fish species of cyprinids with high swimming and low jump capacity, i.e. migratory cyprinids like Luciobarbus bocagei, (3) fish species of cyprinids with moderate movement and low jump capacity, i.e. small migratory cyprinids like Gobio lozanoi, (4) slow water fish with no ability to jump like Tinca tinca, (5) benthonic fish like Cobitis calderoni and (6) eels (Anguilla anguilla). The final value of the IF is the result of the sum of the passability of the six groups of fish species in both directions according to the following formula: IF = IF upstream + IF downstream. The IF values range from 0 to 100: 0 when the obstacle passability is total and 100 when the obstacle is impassable. The importance of this index is that the passability of every barrier has been measured in both directions, upstream and downstream, providing a more complete and realistic passability model. They also developed some indices to evaluate the fragmentation of the rivers and to prioritize the dam management actions (see Duero document 1). According to the availability of an integrative plan to improve river connectivity at the scale of River Basin, there is a general plan to improve river connectivity developed by the CHD (see Duero document 2).
24

The CHD is one of the River Basins where more permeabilization measures are being carried out, especially in the northern part of the basin. A number of obstacles in this basin have been removed or permeabilized under the National Strategy of River Restoration Framework between the years 2002-2016 (Figure 6). Also the LIFE project CIPRIBER includes some actions of fish pass construction and barriers removal in some rivers (see Duero document 3). The public information of fish species provided by the CHD website is very complete, including GIS data on presence/absence of fish species (both native and exotic) for the entire basin. In this database is easy to determine the impact of the barriers to fish populations just comparing the information of the location of barriers and the presence of fish species (Figures 14 and 15).
Figure 14. localization of native fish species in the Duero River Basin. In this case, the image
shows the presence of brown trout (Salmo trutta) in the basin (orange line). Source: Confederación Hidrográfica del Duero.
25

Figure 15. localization of exotic fish species in the Duero River Basin. In this case, the image
shows the presence of pike (Esox lucius) in the basin (red line). Source: Confederación Hidrográfica del Duero.
There is scarce information about public participation programs in rivers of the Duero Basin, most of them developed under the National Strategy of River Restoration Framework. Also the LIFE project CIPRIBER includes some actions of public information. Monitoring programmes have been developed in the upper Tormes River (southwest part of the Basin) since 2011 in a river management program where 21 weirs have been removed and 16 fish pass have been constructed. In 2016 a tracking program has started using PIT tag. There are more than 6,000 fish marked and 6 installed antennas. Finally, the LIFE project CIPRIBER includes some measures about monitoring programmes of exotic fish species in the rivers where actions of connectivity recovery are programmed (see Duero document 4).
6.4. Ebro River Basin District
The Ebro River Basin District has a complete inventory of obstacles, including dams and weirs. This information is available in the website of the Ebro River Basin Authority (Confederación Hidrográfica del Ebro, hereafter CHE).
26

Figure 16. location of obstacles in the river network of Ebro River Basin District.
According to the availability of information related with evaluation of passability of barriers for fish species, there is no knowledge about the existence of this information or the application of a passability index for each obstacle. There is no knowledge about a specific plan to improve river connectivity at the scale of River Basin. However, there are some reports about specific programs to recover river connectivity in different parts of the Ebro River Basin. In the Hydrological Plan (2010-2015) there is an action of improving the river continuity managing 30 weirs (see Ebro document 1). Some of these actions depend on the different Autonomous Communities of the Basin (see reports of the Hydrological Plan, Ebro document 1). Also, the Hydrological Plan includes specific programmes to improve the connectivity for some fish species (see Ebro document 2). There are some actions of dam removal performed by the water authorities under the National Strategy of River Restoration Framework between the years 2006-2016 (Figure 6). There is no evidence of the existence of a specific plan for dam removal made by the CHE. Some obstacles in this Basin have been removed or permeabilized in the National Strategy of River Restoration between the years 2002-2016 (Figure 6). Also, the Hydrological Plan includes some measures about permeability and removal of obstacles. There are reports about obstacle permeabilization and fish passage assessment in parts of this River Basin (see Ebro documents 3, 4 and 5). In regard to the availability of inventories of fish species in this basin, there is a report about the fish communities, including both native and exotic species, in the Ebro River Basin from data collections between the years 1996-2010 (see Ebro document 6).
27

More specific information about the fish species located near a barrier can be found in the Ebro document 7. No geo-database is available so far. The information found about the existence of public information and public participation related to measures to improve river connectivity in the Ebro River Basin is not very extensive. There are some specific actions about public participation in the appendix 10 of the Hydrological Plan (2010-2015). Finally, there is no evidence about the existence of monitoring programmes of the measures performed to improve fluvial connectivity or about the public availability of this information.
6.5. Guadalquivir River Basin District
The Guadalquivir River Basin Authority (Confederación Hidrográfica del Guadalquivir, hereafter CHGuadalquivir) provided an inventory of obstacles including dams and weirs. This information does not seem very complete because there are only 481 obstacles in this inventory. It looks like a low number for such a large basin as the Guadalquivir River is.
Figure 17. location of obstacles in the river network of Guadalquivir River Basin District.
Furthermore, there is no evidence about the existence of an evaluation of passability of barriers or the application of a passability index for each obstacle. There is no knowledge about a general plan to improve river connectivity in the Guadalquivir River Basin. However, we have found information about programmes for
28

improving the longitudinal permeability in some rivers of the basin (little information available in the Hydrological Plan, see Guadalquivir document 1). There is evidence about a plan to manage the eel including measures to permeabilize the obstacles that affect their movement in the appendix 10 of the Hydrological Plan (see Guadalquivir document 2). With respect to the existence of a specific plan to dam permeabilization or removal made by the CHGuadalquivir, there is no knowledge about the existence of this information. However, in the inventory of weirs collected in the Hydrological Plan of this Basin (293 weirs) 97 of them have fish pass and there is not knowledge about their actual performance (see Guadalquivir documents 3 and 4). Also, there is no evidence about obstacles removed or permeabilized under the National Strategy of River Restoration Framework between the years 2010-2016. In regard to the availability of inventories of fish species in this basin, there is a report about the fish communities, including both native and exotic species, in Guadalquivir River Basin (see Guadalquivir document 5). No geo-database is available so far. According to the existence of public information and public participation related to measures to improve river connectivity and the availability of monitoring programmes of these measures, there is no evidence that this information exists or it is available to the public.
6.6. Tajo River Basin District
The Tajo Water Authority (Confederación Hidrográfica del Tajo, hereafter CHT) provided a report about the development of a programme to improve the fluvial permeability in the Tajo River Basin District where the obstacles of the basin are located (see Tajo document 1). There is also an inventory of abandoned obstacles of the River Basin (see Tajo document 2).
29

Figure 18. location of obstacles in the river network of Tajo River Basin District.
In the study of fluvial permeability, the obstacles of the inventory have been analyzed according to their passability (measured with a passability index, IF) where fishes are clustered into four groups according with their physical characteristic (see Tajo document 1). Also, this report includes an index to prioritize the actions on different barriers. This index is called IPA (Índice de Prioridad de Actuación in Spanish). According to the availability of an integrative plan to improve river connectivity at the scale of River Basin, there is a detailed description of a plan to evaluate the inventoried obstacles in this River Basin in the same report (see Tajo document 1). There is no knowledge about a specific plan for dam removal developed by the Tajo Water Authority. However, in 2014, the Robledo de Chavela dam was removed which was a milestone in the barriers removal procedure in Spain (more information in section 8: Cost-benefit case studies in Spain, case study number 3). Some obstacles in this basin have been removed or permeabilized in the National Strategy of River Restoration Framework between the years 2006-2016 (Figure 6). More specific actions about river permeabilization are included in the report of the river Viejas (see Tajo document 3). There is an inventory of the fish species (both native and exotic) present in the River Basin (see Tajo document 1 and 6). Also, maps were developed with the presence of each species in the basin (unfortunately, this information is not provided in a shapefile). Specific information about fish distribution, with GIS information of fish species presence, is provided in the following reports (see Tajo documents 4 and 5).
30
About the existence of public information and public participation related to measures to improve river connectivity, there is no evidence that this information exists or is available to the public. Finally, there is information about monitoring programmes available in the report where the ecological status of the river is monitored after the Robledo de Chavela dam removal (see Tajo document 7). Also, information about river permeabilization is included in the report about weir removal benefits in the Viejas River (see Tajo document 3).
6.7. Guadiana River Basin District
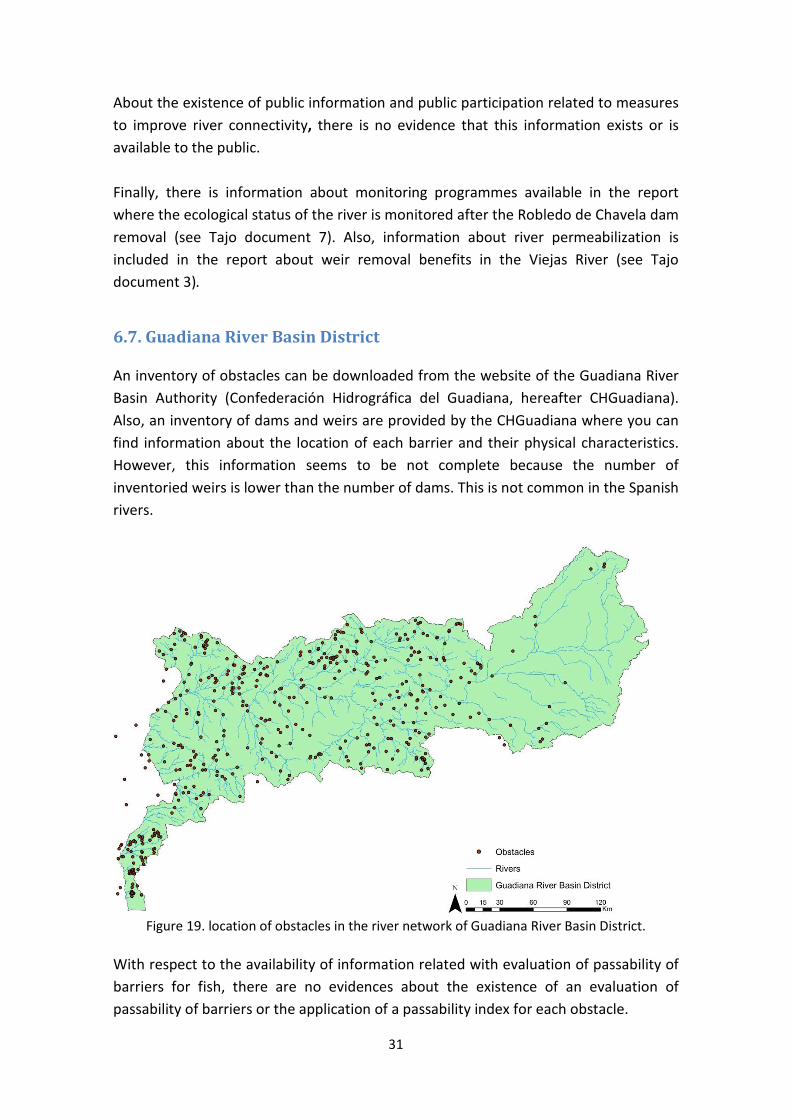
An inventory of obstacles can be downloaded from the website of the Guadiana River Basin Authority (Confederación Hidrográfica del Guadiana, hereafter CHGuadiana). Also, an inventory of dams and weirs are provided by the CHGuadiana where you can find information about the location of each barrier and their physical characteristics. However, this information seems to be not complete because the number of inventoried weirs is lower than the number of dams. This is not common in the Spanish rivers.
Figure 19. location of obstacles in the river network of Guadiana River Basin District.
With respect to the availability of information related with evaluation of passability of barriers for fish, there are no evidences about the existence of an evaluation of passability of barriers or the application of a passability index for each obstacle.
31

The CHGuadiana provided information about the existence of some plans to improve the river connectivity in the River Basin. Unfortunately, we have no further information on the content of these plans and measures. There is some information on this topic available in the Hydrological Plan (see Guadiana document 1). According to the availability of databases of weirs removed, fish passes and closely related measures, there is no knowledge about a specific plan for dam removal made by the CHGuadiana. There are 63 weirs inventoried in the Hydrological Plan of this Basin, only 5 have a fish pass. However, there is a report about the location and efficiency of fish passes and improvement proposals in the middle course of the Guadiana River (see Guadiana document 2). There is no evidence about obstacles removed or permeabilized under the National Strategy of River Restoration Framework. In regard to the availability of inventories of fish species, some information about migratory fish species in the midcourse of Guadiana River is also available (see Guadiana document 2). No geo-database is available so far. According to the existence of public information and public participation related to measures to improve river connectivity and the availability of monitoring programmes of these measures, there is no evidence that this information exists or is available to the public.
6.8. Galicia-Coast River Basin District
We have an inventory of obstacles provided by the Environmental and Land Management Authority of the Galicia Regional Government (Consellería do Medio Ambiente e Ordenación do Territorio, Xunta de Galicia). This inventory contains information about the location of barriers throughout the territory of the Galicia Autonomous Community. This is not an official inventory, so we cannot be sure of the reliability of the data collected but it serves to give us an idea of the disconnection status of the Galician rivers. In this inventory, we can find information about physical characteristics of the obstacle, their conservation status, their passability in both directions and whether there are fishes near the obstacle.
32

Figure 20. location of obstacles in the river network of Galicia-Coast River Basin District, in the
west part of Galicia Autonomous Community. There is information about the passability in both directions, upstream and downstream, for each obstacle. There is no knowledge about a specific plan to improve river connectivity made by Galicia-Coast River Basin Authority (Confederación Hidrográfica Galicia-Costa, hereafter CHG-C). We have not received an official answer of the Water Authority of this River Basin. According to the availability of databases of weirs removed, fish passes and closely related measures, there are 621 weirs inventoried in the Hydrological Plan of this Basin, only 43 have a fish pass, but there is not knowledge about if they are functional or not (see Galicia-Coast document 1). There are no evidences about obstacles removed or permeabilized under the National Strategy of River Restoration Framework between the years 2010-2016. We have not received an official answer of the Water Authority of this River Basin. In regard to the availability of inventories of fish species near barriers, there is information about the presence/absence of fish near the obstacles in the inventory of barriers, but we do not have specific information about the fish species. No geo-database is available so far. We have not received an official answer of the Water Authority of this River Basin.
33

We have not received an official answer of the Water Authority of this River Basin about the existence of public information and public participation related to measures to improve river connectivity and the availability of monitoring programmes of the measures performed to improve fluvial connectivity.
6.9. Miño-Sil River Basin District
As seen in the previous section, there is an inventory of obstacles for the whole Galicia Autonomous Community. However, the Miño-Sil River Basin Authority (Confederación Hidrográfica Miño-Sil, hereafter CHM-S) provided with an updated inventory of obstacles in the river basin. This inventory contains information about the location of each barrier, the height of each obstacle, if they have a fish pass and the difficulty passability of the barriers in both directions, upstream and downstream. This information is not available to be downloaded for the public (as long as we know).
Figure 21. location of obstacles in the river network of Miño-Sil River Basin District, in the east
part of Galicia Autonomous Community. The inventory of obstacles of the river basin contains information about the passability of the obstacles in both directions and about the fish species present near the obstacle. The fish populations are clustered into four groups: (1) salmonids, (2) cyprinids, (3) small cyprinids and (4) eels (information provided by the CHM-S). They
34

also assign a passability value for upstream and downstream movements across barriers. According to the availability of an integrative plan to improve river connectivity at the scale of River Basin, there is no knowledge about the existence of this plan in the Miño-Sil River Basin. However, information on passability of obstacles is included in the inventory of barriers, although we do not know how these data were obtained (information provided by the CHM-S). There are 3372 weirs inventoried in the Hydrological Plan of this Basin, only 10 of them have a fish pass. However, there is not knowledge about whether they are functional or not (see Miño-Sil documents 1 and 2). Some obstacles in this basin have been removed under the National Strategy of River Restoration Framework between the years 2009-2015 (Figure 6). In regard to the availability of inventories of fish species near barriers, there is information about fish communities near each obstacle in the inventory of barriers provided by the CHM-S. There is not information about whether the species are native or exotic. No geo-database is available so far. Regarding the existence of public information and public participation related to measures to improve river connectivity and the availability of monitoring programmes of these measures, there is no evidence that this information exists or is available to the public.
6.10. Júcar River Basin District
The Júcar River Basin Authority (Confederación Hidrográfica del Júcar, hereafter CHJ) provided with an updated inventory of obstacles in the River Basin with information about the location of each barrier, its height, its state of conservation and if they are permeabilized or not. This inventory is available for the public from the CHJ website (see Júcar document 1).
35

Figure 22. location of obstacles in the river network of Júcar River Basin District.
The passability of every obstacle inventoried in this river basin has been evaluated through the application of the passability index (IF) used to assess passability in other River Basin Districts such us Duero and Tajo. To evaluate the effect of the obstacle to the fish movement, the fish species were clustered into 3 groups: (G1) salmonids, (G2) cyprinids and (G3) species of transitional water bodies. This information was provided by the CHJ. According to the availability of an integrative plan to improve river connectivity at the scale of River Basin, there is no knowledge of its existence. However, the CHJ has informed us of the existence of specific programs to improve the longitudinal connectivity in some rivers of the basin like a study developed by the Polytechnic University of Valencia (UPV) in the upper and middle reach of the Júcar River. Nevertheless there is not much information available yet. There are 855 weirs inventoried in the Hydrological Plan of this Basin, only 4 have a fish pass. There is not knowledge about whether they are functional or not (see Júcar document 2). There is no evidence about a specific plan for dam removal made by the CHJ. Nevertheless there are evidences about a weir removed in the National Strategy of River Restoration Framework in the year 2015. In addition it is known that actions to eliminate obstacles are being taken in this basin.
36

We know that information about the presence of fish species in this basin exist but it is not available for the public so far because there are some administrations involved in this report and we have to wait for a general authorization. According to the existence of public information and public participation related to measures to improve river connectivity and the availability of monitoring programmes of these measures, there is evidence that there are organizations (NGOs) involved in monitoring the actions developed on longitudinal connectivity but this information is not available to the public so far.
6.11. Segura River Basin District
The Segura River Basin District has developed one of the most comprehensive programs for assessing connectivity in its basin. An updated inventory of obstacles was provided by the Segura River Basin Authority (Confederación Hidrográfica del Segura, hereafter CHS). This information is available in their website as a geo-database where the obstacles are located, but it is not possible to download it (as far as we know).
Figure 23. location of obstacles in the river network of Segura River Basin District.
The CHS provided a report with complete and useful information about barriers passability in this basin, including technical specifications of the obstacles. The passability of each obstacle has been measured with the passability index (IF), a fluvial continuity index, ICF (Índice de Conectividad Fluvial in Spanish) and an index to
37

prioritize the actions on different barriers (IPA). It is important to note that the passage of fish species has been evaluated in two directions, upstream and downstream (see Segura document 1). They applied the same methodology that González Fernández et al. (2010) developed for the passability indices in the Duero River Basin. This River Basin also developed complete technical sheets for each obstacle inventoried that includes details of the physical characteristics of each obstacle as well as the value of the passability indexes. The information provided in the technical documents for each obstacle shows that there is a connectivity plan in the Segura River Basin. More information about the identification of the barriers that hinder longitudinal connectivity in the Segura River and its tributaries is available in the Segura document 1. Also, there is a specific program (LIFE Project Segura RiverLink) to improve the longitudinal connectivity in the Segura River (see Segura document 2). There are 72 weirs inventoried in the Hydrological Plan of this Basin, 58 of them cause an impact to fish movements. We do not have more information about fish passes (see Segura documents 3 and 4). Under the framework of the LIFE Project Segura RiverLink, some actions of permeabilization and dam removal have been done. Specifically, one work of dam removal (year 2014) and seven fish passes sited in the Segura River (year 2015) (see Segura documents 1 and 2). In regard to the availability of inventories of fish species near barriers, some information about fish communities, both native and exotic, in the Segura River Basin is available in research works done by the University of Murcia (Martínez-Morales et al 2010, Castejón-Bueno et al 2011, Oliva-Paterna et al 2014; Information corresponding to Segura documents 5, 6 and 7). No geo-database is available so far. Some actions of public participation and information have been done during the LIFE Project Segura RiverLink (see Segura document 2). Finally, according to the framework of the LIFE Project Segura RiverLink, monitoring programmes are developed to test the results of the permeabilization actions and dam removal attending to biological, hydromorphological and physico-chemical criteria (documents not available so far).
38

6.12. Cantabrian River Basin District
Despite our attempts to contact with this administration, we have not received answer from the Cantabrian River Basin Authority. The Hydrologic Plan includes an inventory of the obstacles (dams and weirs) in this basin, but there is only a map and we cannot work with this information (see Cantabrian documents 1, 2 and 3). There is not knowledge about a specific plan to improve river connectivity made by the Cantabrian Water Authorities. In spite of not having information about inventory of obstacles in this basin, we found information about some obstacles that have been removed or permeabilized during the National Strategy of River Restoration Framework between the years 2006-2016 (figure 6). There is a big ratio of permeabilization/removal of obstacles in this basin according to its size.
6.13. Andalusian River Basin District
The Andalusian River Basin District comprises three different River Basins: Andalusian Mediterranean River Basin, Guadalete and Barbate River Basin, and Tinto, Odiel and Piedras River Basin (see figure 24). The Water Authority of these basins (Agencia de Medio Ambiente y Agua de Andalucía, hereafter AMA) provided an inventory of obstacles of some rivers. This inventory comes from a study of the distribution of eel (Anguilla anguilla) populations in these basins during the years 2014-2016 and, to a lesser extent, from other studies of the distribution of the brown trout and the autochthonous crayfish (Austrapotamobius pallipes) in the years 2004 and 2008 so there is not a complete inventory of the presence of barriers in this area (see Andalusian documents 1, 2 and 3). However, there is some information about dams and weirs location in the Hydrological Plans of the three basins that comprise the Andalusian River Basins: - Guadalete and Barbate River Basin: 14 dams and 45 weirs. There is not knowledge about the existence of fish passes (see Andalusian documents 4 and 5). -Andalusian Mediterranean River Basin: 105 obstacles in this Basin. There is not knowledge about the existence of fish passes (see Andalusian document 6). -Tinto, Odiel and Piedras River Basin: 52 dams and 82 weirs (none of them with fish passes) (see Andalusian document 7).
39
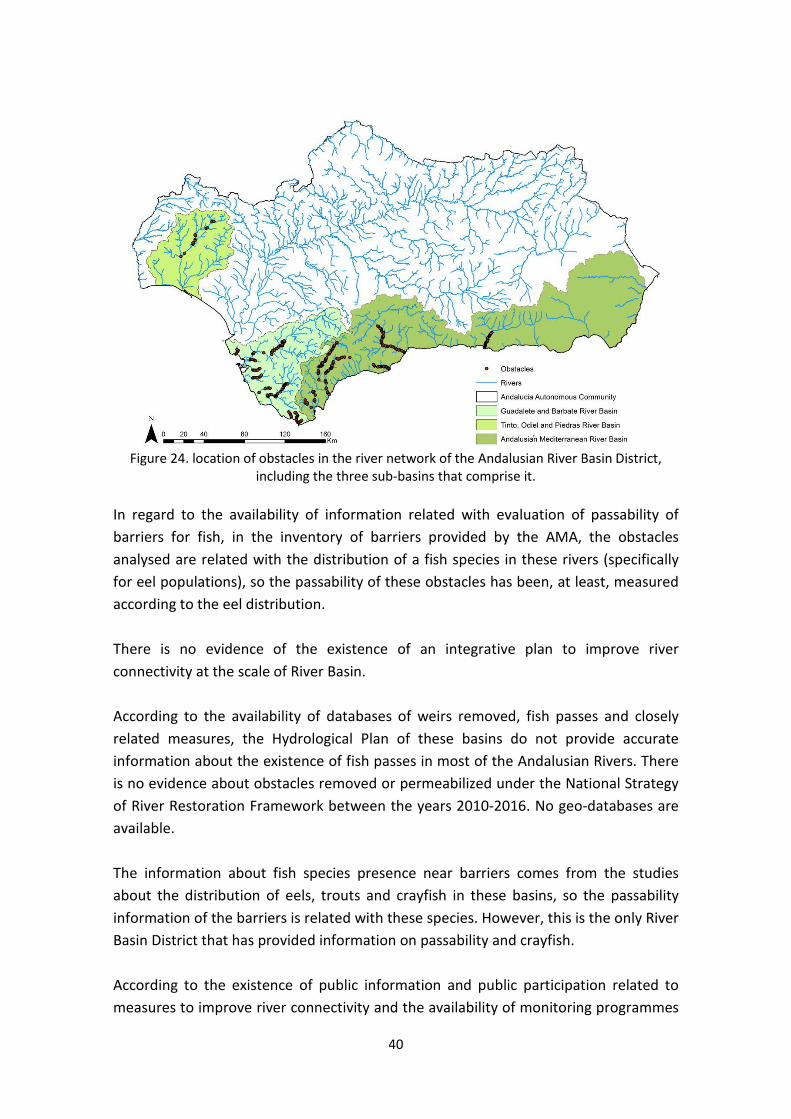
Figure 24. location of obstacles in the river network of the Andalusian River Basin District,
including the three sub-basins that comprise it. In regard to the availability of information related with evaluation of passability of barriers for fish, in the inventory of barriers provided by the AMA, the obstacles analysed are related with the distribution of a fish species in these rivers (specifically for eel populations), so the passability of these obstacles has been, at least, measured according to the eel distribution. There is no evidence of the existence of an integrative plan to improve river connectivity at the scale of River Basin. According to the availability of databases of weirs removed, fish passes and closely related measures, the Hydrological Plan of these basins do not provide accurate information about the existence of fish passes in most of the Andalusian Rivers. There is no evidence about obstacles removed or permeabilized under the National Strategy of River Restoration Framework between the years 2010-2016. No geo-databases are available. The information about fish species presence near barriers comes from the studies about the distribution of eels, trouts and crayfish in these basins, so the passability information of the barriers is related with these species. However, this is the only River Basin District that has provided information on passability and crayfish. According to the existence of public information and public participation related to measures to improve river connectivity and the availability of monitoring programmes
40

of these measures, there is no evidence that this information exists or it is available to the public.
6.14. Spanish archipelagos
-Canary Islands
We did not receive an official answer of the Water Authorities of this basin, so this is the information we have obtained in the website of Gran Canaria Water Authority. An inventory of large dams is available in the River Basin website, at least for Gran Canaria Island (Consejo Insular de Aguas de Gran Canaria, hereafter CIAGC) (see Canary Islands documents 1, 2 and 3).
Figure 25. location of obstacles in Gran Canaria Island.
There is no evidence about information of the passabiliy of barriers in this basin due to the characteristics of the temporary rivers in the island, all the obstacles are large dams and there are no native freshwater fishes in the islands (except for eels). There is not knowledge about a general plan to improve river connectivity in this Basin. There is not knowledge about the availability of databases of weirs removed, fish passes and closely related measures in this Basin.
41

According to the availability of inventories of fish species near barriers, this basin has a special characteristic in this sense because, except for eels, no native freshwater fishes live in the rivers. According to the existence of public information and public participation related to measures to improve river connectivity and the availability of monitoring programmes of these measures, there is no evidence that this information exists or is available to the public.
-Balearic Islands
We have not received information from the Balearic River Basin Authority. However, the Hydrological Plan of the Balearic Islands states that there are only two dams in Mallorca Island and there is no intention to build any more dams (see Balearic Islands document 1).
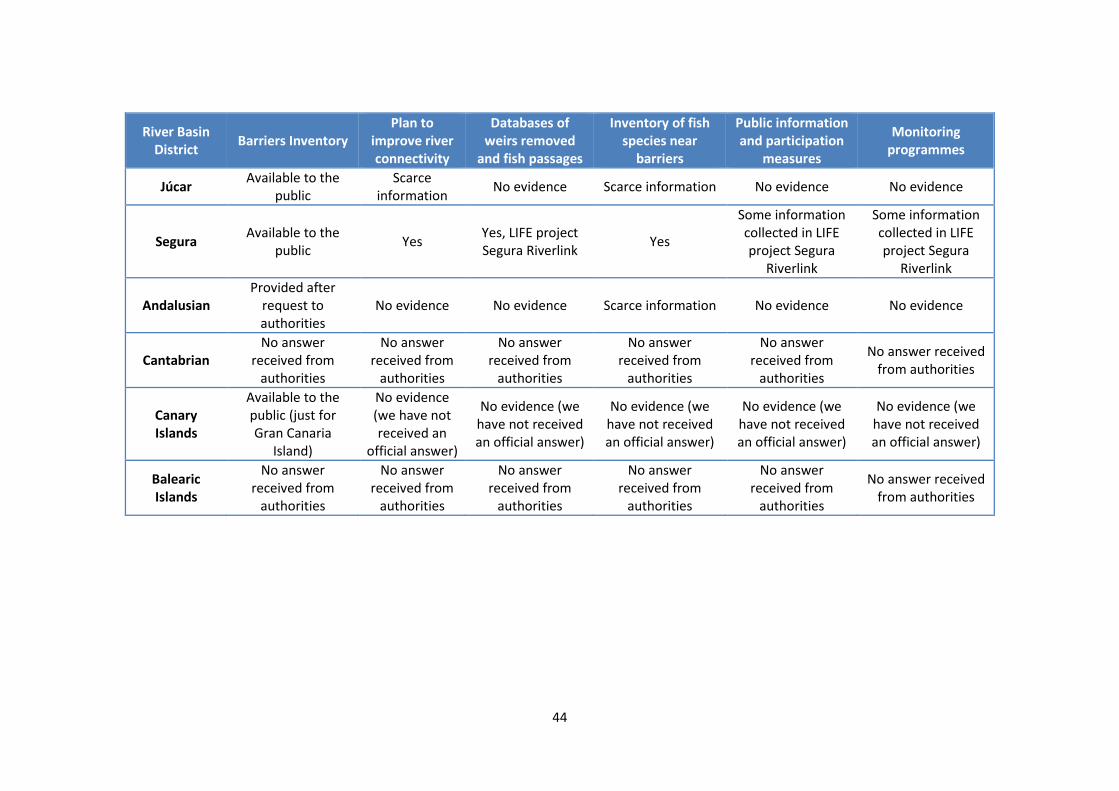
7. Summary of the data collected in the River Basin Districts.
1. While some River Basin Districts have provided a lot of information, others have been more reticent or have not even responded to our requests (see table 3).
42

Table 3. Summary of the information provided by the authorities of each River Basin District.
River Basin District Barriers Inventory
Plan to improve river connectivity
Databases of weirs removed
and fish passages
Inventory of fish species near
barriers
Public information and participation
measures
Monitoring programmes
I. B. of Catalonia
Provided after request to authorities
Yes Yes Yes No evidence No evidence
I. B. of the Basque Country
Provided after request to authorities
Yes Yes Yes Yes LIFE Project Irekibai Yes
Duero Available to the public Yes Yes
Yes. Geo-database of both native and
exotic fish available Scarce information Yes. LIFE Project
CIPRIBER
Ebro Available to the public No evidence Yes Yes Scarce information No evidence
Guadalquivir Provided after
request to authorities
No evidence Yes Yes No evidence No evidence
Tajo Provided after
request to authorities
No evidence Scarce information Yes No evidence Scarce information
Guadiana Available to the public
Scarce information Scarce information Scarce information No evidence No evidence
Galicia-Coast Yes, but there is
not an official inventory
No evidence Yes Yes No evidence No evidence
Miño-Sil Provided after
request to authorities
No evidence Scarce information Yes No evidence No evidence
43
River Basin District Barriers Inventory
Plan to improve river connectivity
Databases of weirs removed
and fish passages
Inventory of fish species near
barriers
Public information and participation
measures
Monitoring programmes
Júcar Available to the public
Scarce information No evidence Scarce information No evidence No evidence
Segura Available to the public Yes Yes, LIFE project
Segura Riverlink Yes
Some information collected in LIFE project Segura
Riverlink
Some information collected in LIFE project Segura
Riverlink
Andalusian Provided after
request to authorities
No evidence No evidence Scarce information No evidence No evidence
Cantabrian No answer
received from authorities
No answer received from
authorities
No answer received from
authorities
No answer received from
authorities
No answer received from
authorities
No answer received from authorities
Canary Islands
Available to the public (just for Gran Canaria
Island)
No evidence (we have not received an
official answer)
No evidence (we have not received an official answer)
No evidence (we have not received an official answer)
No evidence (we have not received an official answer)
No evidence (we have not received an official answer)
Balearic Islands
No answer received from
authorities
No answer received from
authorities
No answer received from
authorities
No answer received from
authorities
No answer received from
authorities
No answer received from authorities
44

2. A north-south gradient can be seen in Spain respect to the amount of information available (and its quality) regarding the issue of barrier inventory and the existence of plans to improve the longitudinal connectivity of rivers in each basin (see figure 1.a and tables 3 and 4).
Table 4. Number of obstacles recorded in the official inventories by each confederation.
Riber Basin District Obstacles
Duero 3,539 Catalonia 1,190
Segura 169 Tajo 792 Júcar 1,191 Ebro 2,192
Miño-Sil 4,590 Galicia-Coast 1,080 Guadalquivir 481
Basque Country 1,390 Guadiana 493
Andalusian Basins 404 Canary Islands 168
Total 17,679
3. The data obtained from the inventories of obstacles compiled are still far from the "official" data of the existence of 26,000 obstacles (and even more of the 50,000 obstacles considered unofficially).
4. Some River Basin Districts have built several fish passages to facilitate the movement of the fish species through their obstacles; however it is known that a large number of them are not operative so they do not solve the river disconnection problem.
5. The fish passages that appear in the Hydrological Plans do not always correspond to those that are registered in the inventories of obstacles provided by each River Basin Distric authorities. The quality of the information available for the public is therefore diminished.
6. During the implementation period of the National Strategy of River Restoration (NSRR), the Duero River Basin District led the ranking of barriers permeabilization followed by the Cantabrian River Basin District (including the Internal Basins of the Basque Country).
7. The National Strategy of River Restoration has been a strong stimulus in the process of permeabilization of obstacles in Spain.
45

8. Only a few basins have applied connectivity indices to assess the passability of obstacles in their basins (table 5).
Table 5. List of River Basins that have applied connectivity indexes and the type of index used (*abbreviations correspond to the initials of the Spanish names).
Riber Basin District Index applied*
Duero
Passability Index (IF); Compartmentation Index (IC);
Longitudinal Continuity Index (ICL); Priority Index of Performance (IPA).
Tajo
Passability Index (IF); Compartmentation Index (IC);
Longitudinal Continuity Index (ICL); Priority Index of Performance (IPA)
Segura
Passability Index (IF); Compartmentation Index (IC);
Longitudinal Continuity Index (ICL); Priority Index of Performance (IPA),
Fluvial Connectivity Index (ICF).
Internal Basins of Catalonia
Priority index of water bodies (IPM); Fluvial Connectivity Index (ICF);
Obstacle Priority Index (IPO).
Júcar Fluvial Connectivity Index (ICF).
9. The River Basin Districts that have applied passability indices for the quantification of the longitudinal disconnection in their rivers have done so with different degree of intensity, obtaining different results in similar river reaches.
10. The River Basin Districts that have measured the passability of their obstacles in two directions, upstream and downstream, are: Duero, Galicia-Coast, Miño-Sil and Segura.
46
8. Cost-benefit case studies in Spain
The second part of the report focuses on the study and assessment of the cost-benefit analysis of the permeabilization of an obstacle in six real cases in Spain: four cases of barrier removal and two on construction of fish passages.
The technique of the cost-benefit study is a usual tool in the traditional economy that tries to evaluate the profitability of a certain investment and to help decision makers to choose among policy alternatives (Boardman et al. 1996); the problem arises when trying to apply this economic concept to value other aspects such as environmental and ecological values (Arrojo et al. 1999).
Under the framework of the National Strategy of River Restoration (NSRR), cost-benefit studies are encouraged in river restoration projects. The cost-benefit analysis methodology developed for this type of project can be summarized in the following general steps (MAGRAMA 2012):
- Determine the objectives of the project. - Analyze the different alternatives for achieving the objectives; including
alternative 0 (not doing the project.). - Define the different scenarios according to the alternatives that are to be
analyzed. - Estimation and valuation of costs and benefits (in financial and economic
terms). - Estimation of net present value (NPV) with the calculation model. - Valuation of the model (sensitivity analysis of relevant variables).
In the cost-benefit analysis, we seek to maximize the net profit for society. Therefore, these analyzes should be considered as complementary decision tools to other instruments (Wegner and Pascual 2011). Despite the limitations of these studies, mainly because of the difficulty of defining the non-monetizable environmental variables, their application is very useful in the process of decision/choice of alternatives for fluvial restoration projects.
The ecosystem services provided by the rivers should be key elements to take into account when developing cost-benefit analysis. However, the complexity of the concept of ecosystem services makes its valuation complicated in this kind of analysis, where ecosystem services are valued only economically (Wegner and Pascual 2011).
The definition of ecosystem service is directly related to human well-being (MA 2005; Daily 1997; Constanza et al. 1997; Boyd and Banzhaf 2007; Fisher, Turner and Morling 2008). Therefore It will be essential to use decision-making tools to ensure the improvement of human well-being and the sustainable use of natural resources. The
47

cost-benefit studies applied to this field should try to achieve these objectives (Brouwer et al. 2015).
Background of cost-benefit studies in dam removal
The implementation of cost-benefit analysis in the study of dam removal cases is a standard practice in the United States (Industrial Economics Inc. 2015, Headwaters Economics 2016). The United States can be considered as a reference in the field of dam removal. This is one of the countries of the world with the greatest number of hydraulic obstacles (Brufao 2006). A federal inventory has identified more than 87,000 dams across the United States that are more than six feet tall (approximately two meters high) (CorpsMaps National Inventory of Dams 2013). Besides, by 2020, 70 percent of dams in the United States will be more than 50 years old (American Society of Civil Engineers 2013) which means that many of these dams will be at the limit of their useful life. This implies the need to consider other management options, making dam removal more common in the future (Stanley and Doyle 2003).
The circumstances for individual dam removal projects are wide-ranging and depend on unique combinations of environmental, historic, and economic factors (Headwaters Economics 2016).
Since 1912, more than 1,300 dams have been removed across the U.S., and 62 dams were removed in 2015 alone (American Rivers 2016). However, it would not be fair to equate what was done in the United States with what has been done in Spain so far, since the conditions of each country are totally different, and the demolition trend in Spain nowadays begins to be relevant.
The dam removal in Spain: a brief summary
The dam removal is a process that has begun to intensify in Spain since the mid-2000s, although the construction of fish passages has been taking place for some decades (see section 5: barrier permeabilization measures). The distribution of dam removal actions has been irregular in the Spanish territory, with the northern basins, as well as the Duero and Tajo basins, being more active.
With the implementation of the objectives of the Water Framework Directive, together with the Dam Safety Regulations, the Flood Directive and the National Strategy of River Restoration, many dams have been removed in the country for environmental reasons (Alonso Vizcaíno et al. 2008).
Spanish legislation has long allowed the demolition of dams; although at the time of its approval it lacked the environmental perspective that it currently has (Brufao 2006).
48

A modern management of the hydraulic infrastructures should consider the phase of abandonment and its elimination, as well as the environmental restoration of the affected environment, at the end of its useful life or in case of early expiration for any reason. The elimination of an infrastructure and the subsequent environmental restoration could be charged to the concessionaire and ensured through the proper provision of a specific fund, which would allow the environmental, social and economic risks of its abandonment and deterioration to be solved (Alonso Vizcaíno et al. 2008).
Despite the progress in legislative and social issues, the removal of dams in Spain are carried out in an uncoordinated manner between the different River Basin Districts and the regional authorities, without a unifying criterion marking the way in this matter, taking into account the specific characteristics of each River Basin.
Most of the dams built in Spain have been made without a previous cost-benefit analysis (Brufao 2006). Unfortunately, there is no evidence of the existence of previous case studies of cost-benefit about dam permeabilization and removal in the country. Although there are precedents in other countries like the United States (see references above), it is difficult to transpose its methodology to the actions carried out in our country because economic, environmental and social conditions are very different in both countries.
The main problems are the lack of cost-benefit studies and monitoring when developing these types of activities. Pre-demolition sampling is not usually carried out, so it is very difficult to quantify the benefits obtained once the work is done and it is therefore difficult to communicate the advantages of dam removal to the society.
General benefits of dam removal
The general benefits of the dam demolition are (adapted from Industrial Economics Inc. 2015):
- On average, the removal of obstacles means a saving compared to maintenance and repair in the coming years.
- Removal of dams reduces the risk of flooding in the area adjacent to the location of the obstacle.
- Removal of the dam increases habitat quality and habitat availability in the river, especially for fish species.
- The dam removal can improve the benefits of local populations and regional economies.
- Removal of dams also focuses on achieving broader ecological objectives. This has a positive influence on the social and economic conditions of the people of the area.
49

- Dam removal increases the quality of recreational experiences, such as fishing, canoeing and wilderness observation activities.
- Improvement of aesthetic landscape conditions.
Ecosystem Services provided by rivers and its effect on Human Well-being
An adapted version of the Ecosystem Services has been used in this report (table 6) according to the proposals of Vidal-Abarca and Suárez (2013) and the MA (2005).
Table 6. Classification of the Ecosystem Services.
Ecosystem Services
Provisioning Freshwater: fish habitat (longitudinal connectivity)
Mineral raw materials: sediment transport Renewable energy: hydropower
Regulating
Water regulation and water quality: water regulation (natural river flow)
Natural hazard mitigation: flood mitigation Biological control: in-stream natural communities
restoration
Cultural
Local ecological knowledge: public awareness Cultural identity and sense of belonging: involvement of
riparian populations Landscape-aesthetic values: scenic beauty of the landscape Recreation and ecoturism: fishing, angling, rafting/kayaking
Environmental education: wildlife and biodiversity Changes in Ecosystem Services affect human well-being through impacts on security, health and social and cultural relations (Alcamo et al. 2003).
Table 7. Constituents of Human Well-being.
Constituents of Well-
being
Security
Ability to live in an environmentally clean and safe shelter Ability to reduce vulnerability to ecological shocks and stress
Basic material for a good life Ability to access resources to earn income and gain a livelihood
Health
Ability to be adequately nourished Ability to be free from avoidable disease
Ability to have adequate and clean drinking water Ability to have clean air
Ability to have energy to keep warm and cool
Good social
relations
Opportunity to express aesthetic and recreational values associated with ecosystems
Opportunity to express cultural and spiritual values associated with ecosystems
Opportunity to observe, study, and learn about ecosystems
50

The concepts that appear in tables 6 and 7 will serve to develop the cost-benefit methodology on dam removal and fish passage development in the six case studies in Spanish rivers.
Study cases
The case studies selected for this report range from medium-size weirs to large dams, including the assessment of fish passages:
- San Marcos weir on the Bernesga River in León (Duero River Basin District). - Inturia dam on the Leizarán River in Gipuzkoa (Internal Basins of the Basque
Country) - La Gotera dam on the Bernesga River in León (Duero River Basin District). - Robledo de Chavela dam on the Cofio River in Madrid (Tajo River Basin District). - Fish passage on the Najerilla River (Ebro River Basin District). - Fish passage in Las Librerías weir on the Guadiela River (Tajo River Basin
District).
51
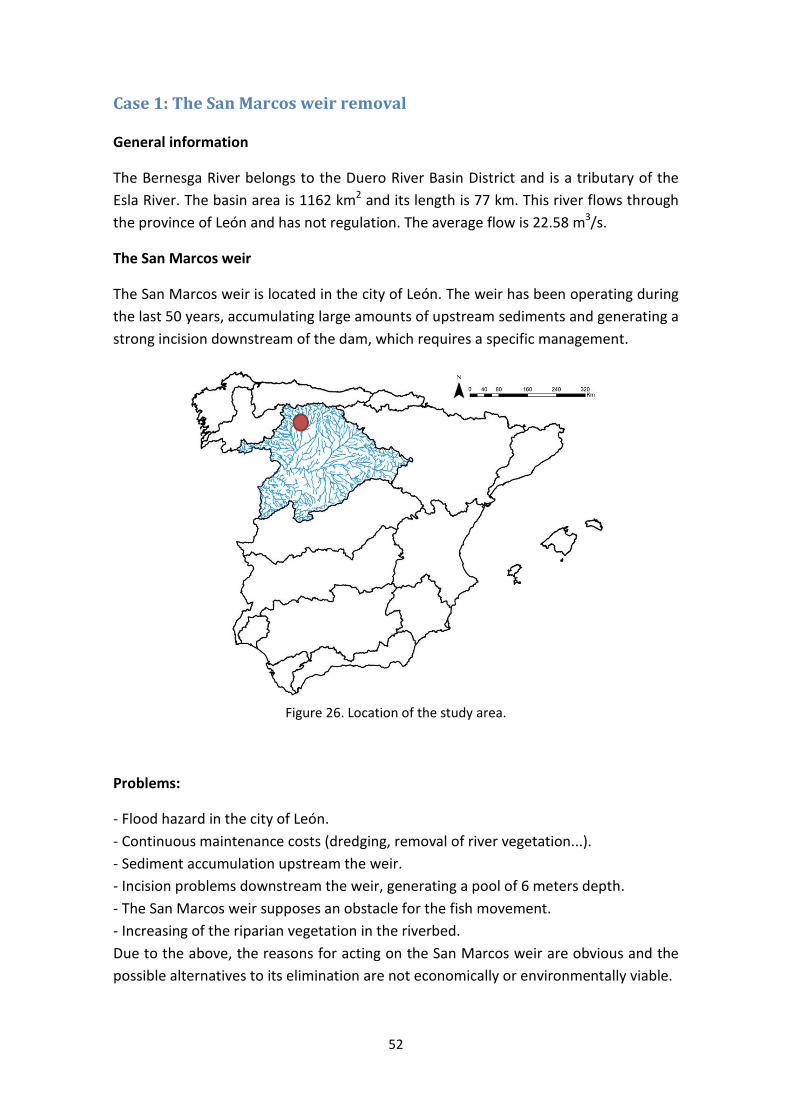
Case 1: The San Marcos weir removal
General information
The Bernesga River belongs to the Duero River Basin District and is a tributary of the Esla River. The basin area is 1162 km2 and its length is 77 km. This river flows through the province of León and has not regulation. The average flow is 22.58 m3/s.
The San Marcos weir
The San Marcos weir is located in the city of León. The weir has been operating during the last 50 years, accumulating large amounts of upstream sediments and generating a strong incision downstream of the dam, which requires a specific management.
Figure 26. Location of the study area.
Problems:
- Flood hazard in the city of León. - Continuous maintenance costs (dredging, removal of river vegetation...). - Sediment accumulation upstream the weir. - Incision problems downstream the weir, generating a pool of 6 meters depth. - The San Marcos weir supposes an obstacle for the fish movement. - Increasing of the riparian vegetation in the riverbed. Due to the above, the reasons for acting on the San Marcos weir are obvious and the possible alternatives to its elimination are not economically or environmentally viable.
52

Dam removal process
Works: partial demolition of the weir, decreasing its height by about 2.5 meters. Its complete demolition was not viable because it is a danger for the bridge sited upstream the weir, which has a high historical and cultural value. A fish pass was also installed to facilitate the movement of the fish species in the river. The process of demolition has to take care of the bridge placed upstream, so that the cost of the works became more expensive.
The duration of the works was planned for four months, however it finished one month before. The elimination was carried out between July-October 2013.
Total budget for the San Marcos weir removal project: 424,726€
Figure 27. Image of the Bernesga River before (left side) and after (right side) the works of
removal.
Benefits:
- Decreased risk of flooding in the city of León. With the adopted solution, the danger of flooding decreases considerably, regarding the previous situation in which the river would overflow for a return period of 131 years, with the projected solution, there is no risk of overflow for a 494 m3/s flow, corresponding to the period of return of 500 years.
53

- The materials removed from the weir were used to fill the pool produced downstream the weir (approximately 6 meters deep), diminishing the erosion of the river bed (600m3 removed from which they used 500m3 to fill the pool).
- The longitudinal connectivity was enhanced by the construction of a fish pass, improving the potential habitat for native fish species such as the Brown trout (Salmo trutta) and the Northern Iberian spined-loach (Cobitis calderoni).
- Local populations are usually against the use of public funding to remove dams. This removal action supposes a measure of awareness for the population of the city of León.
- Increasing awareness of local people about the natural conditions of a river.
Figure 28. Images of the area during and after demolition of the weir. Photo credits: José
Ignacio Santillán.
Conclusions:
This action is very significant because it has been carried out in the urban section of a medium-sized city, which means that the local population become accustomed to the fact that these actions are carried out and are beneficial for both the river and the inhabitants of the city.
The movement of the sediments has provided a more natural image to the river and the native riparian vegetation is regenerating, creating a more natural fluvial landscape.
Furthermore, the extraordinary flood of 25 years of return period occurred a year after the demolition would have caused a flood in part of the city if this elimination had not been done. It is therefore found that the removal of this weir has been beneficial to the local population.
On the contrary, the longitudinal connectivity will need more time to recover due to the great number of obstacles located in that section of the river.
54

References
Confederación Hidrográfica del Duero (2013). El Ministerio de Agricultura, Alimentación y Medio Ambiente reducirá parcialmente el azud existente aguas abajo del Puente de San Marcos sobre en el río Bernesga (León). Press release from 30/07/2013.
Confederación Hidrográfica del Duero (2013). El Ministerio de Agricultura, Alimentación y Medio Ambiente reducirá parcialmente el azud existente aguas abajo del Puente de San Marcos sobre en el río Bernesga (León). Press release from 28/10/2013.
Headwaters Economics (2016). Dam removal: case studies on the Fiscal, Economic, Social and Environmental benefits of dam removal.
Industrial Economics Inc. (2015). Economic & Community Benefits from Stream Barrier Removal Projects in Massachusetts (MA). Massachusetts Department of Fish and Game, Division of Ecological Restoration. Santillán Ibánez, J.I. (2015). Eliminación del azud urbano de San Marcos (León) en el río Bernesga. Buena práctica para recuperar la continuidad del curso fluvial. II Actas del Congreso Ibérico de Restauración Fluvial (Restauraríos). Pamplona.
55

Case 2: Inturia dam removal
General information
The Leitzaran River is a tributary of the Oria River. The basin area is 123.20 km2 and its length is 44.25 km. The river is located between the regions of Navarra and the Basque Country (province of Gipuzkoa). The average flow in the confluence with the Oria River is 4 m3/s, which is reduced to 0.98 m3/s during the period of the lowest annual contribution. The Leitzaran River belongs to the Natura 2000 network. The river was object of intense human use in the past. In spite of that, it is an area of great environmental value.
The Inturia dam
The construction of the Inturia dam dates from around 1913. Permission was granted for the construction of a dam of 12.5 meters and a capacity of 300,000 m3 to regulate the river flow for the Bertxin Power Plant located 1 km downstream.
Over time, the dam began to fill with sediment so it lost its functionality and later its use. It was necessary to make a decision to reduce the impact that this dam produced in the river, so several management alternatives were considered.
The reasons for acting were that the Inturia dam was an unsafe and unused infrastructure with high maintenance costs. It was an industrial ruin, blocks the river and is an obstacle for fish movement.
Figure 29. Location of the study area.
56

Alternatives:
- Fish pass and/or fish elevator: this option was rejected because the high height of the dam (12.5 m) required a great investment and the guarantees of success were low.
-Total demolition of the dam in a single intervention: this option was rejected due to the large amount of sediment accumulated in the dam that could damage other hydroelectric uses downstream. In addition, these sediments could cloud the water to an unacceptable level.
Finally, the chosen option was a removal in four stages leaving a year between each action to give the river time to recover.
Dam removal process
The Inturia dam was removed in four stages due to the size of its infrastructure and the large volume of sediment accumulated in its reservoir. A staged demolition is more natural since it involves a gradual restoration of the solid flow regime. In each performance, 3 meters high are removed from the wall of the dam.
Before the first demolition stage, the useful volume of the dam was estimated at 70,500 m3 as the sediments had filled the dam. The flooded area of the reservoir was between 38,000 and 40,000 m2. The three existing drains placed in the bottom of the dam did not work.
The pre-demolition works was aimed to protect the Bertxin dam, located downstream, from the released sediments. In addition, it was proceeded to partly emptying the dammed area by gradually opening the bottom drainage.
The removal works of the Inturia dam lasted four years, one for each stage of the project. In this way, the changes that have occurred in the river between stages can be evaluated. The actions were performed in summer when the flow is low, except in the stage 4 that was done in January.
The reservoir accumulated about 236,000 m3 of sediment. The river mobilized about 60,000 m3 in each stage.
In order to start the works, it is necessary to first make a land access to reach the river. Approximately 300 m3 of material was used to make these roads. This material was removed after the work and was re-used in the following stage of the removal process (a year before).
After the last phase, a path was made along the right side to allow fishermen access to the river. Finally, a viewpoint has been created where a plaque has been placed with photos and data explaining the process and the importance of this removal.
57
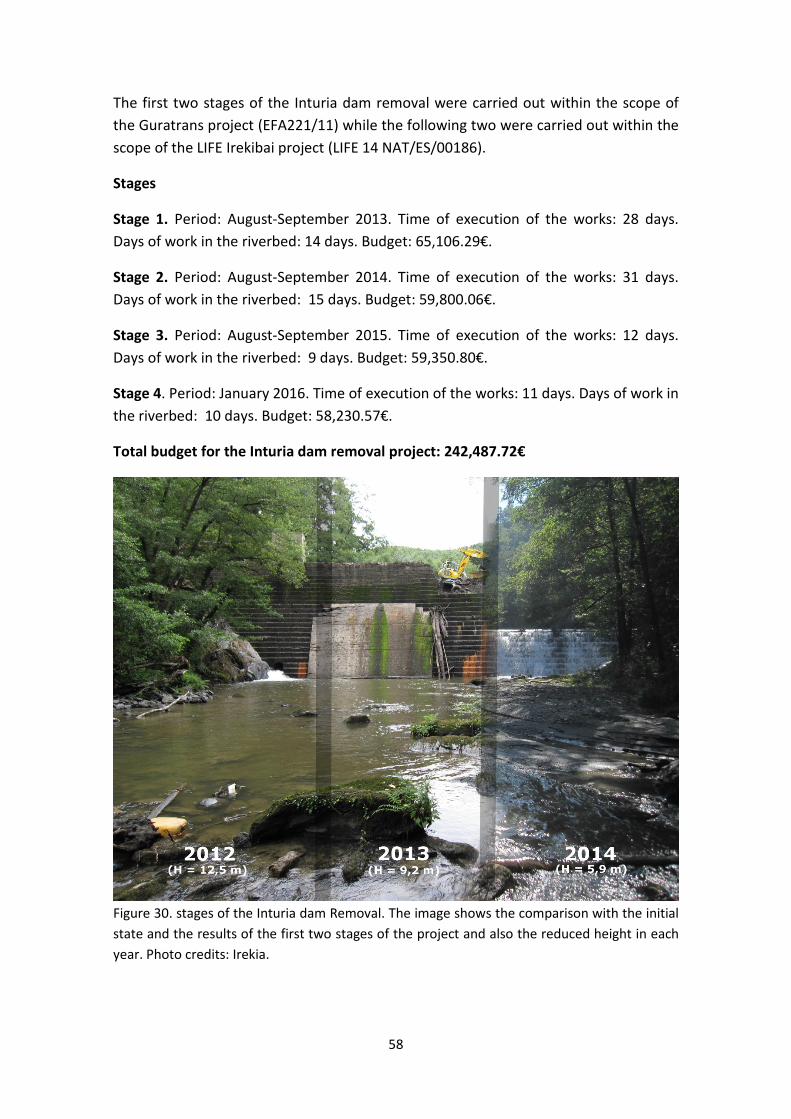
The first two stages of the Inturia dam removal were carried out within the scope of the Guratrans project (EFA221/11) while the following two were carried out within the scope of the LIFE Irekibai project (LIFE 14 NAT/ES/00186).
Stages
Stage 1. Period: August-September 2013. Time of execution of the works: 28 days. Days of work in the riverbed: 14 days. Budget: 65,106.29€.
Stage 2. Period: August-September 2014. Time of execution of the works: 31 days. Days of work in the riverbed: 15 days. Budget: 59,800.06€.
Stage 3. Period: August-September 2015. Time of execution of the works: 12 days. Days of work in the riverbed: 9 days. Budget: 59,350.80€.
Stage 4. Period: January 2016. Time of execution of the works: 11 days. Days of work in the riverbed: 10 days. Budget: 58,230.57€.
Total budget for the Inturia dam removal project: 242,487.72€
Figure 30. stages of the Inturia dam Removal. The image shows the comparison with the initial state and the results of the first two stages of the project and also the reduced height in each year. Photo credits: Irekia.
58
Monitoring
A monitoring process was developed before the first stage of the removal. Bathymetries were first performed in the reservoir to determine the amount of sediment accumulated.
Two geomorphological monitoring reports were made. The first one, carried out in 2013, was a morphological characterization in the study section (upstream and downstream of the dam) prior to the first stage of the removal. Following the first stage, two monitoring campaigns were carried out (September 2013 and April-June 2014). Besides, a second monitoring campaign was conducted after the second stage of the removal
The monitoring process determines that a movement of the sediments is observed after each phase of action, depending on the flow rate of that year. The amount of sediment mobilized after the first stages of the removal is higher than the sediments mobilized prior to the removal of the dam.
It can also be concluded that water quality has not been altered after the first stages of the removal.
Habitat and species studies were also conducted because the Inturia dam is an impassable obstacle to the movement of fish. The fish community in the Leitzaran River is: Brown trout (Salmo trutta), Atlantic salmon (Salmo salar), barbel (Luciobarbus graellsii), Adour minnow (Phoxinus bigerri) and eel (Anguilla anguilla). Trout is considered a good indicator in this river.
Within the monitoring process, a 3 km long reach (2 km upstream and 1 km downstream) was monitored by placing 11 sample points in which it was possible to verify the evaluation of the river by taking images at different moments of the year.
Monitoring has been carried out after the fourth stage of the removal as well, but this data is not yet available.
Benefits
- Elimination of the barrier effect and improvement of river connectivity. - Progressive reduction of the reservoir. - Permeabilization of the habitat for the fish species. - Increase of potential habitat for the Atlantic salmon (Salmo salar). - Increase of potential habitat for the birdlife, especially for the Kingfisher
(Alcedo atthis) and the white-throated dipper (Cinclus cinclus). - Increase of potential habitat for mammals such as European mink (Mustela
lutreola) and the Iberian desman (Galemys pyrenaicus). - Improvement of the physicochemical conditions of the waters.
59

- Increase of the slope of the channel, which causes a progressive increase of the velocities upstream of the dam and in the entire area of the current reservoir.
- Decrease in water temperature. - Decrease in river eutrophication, especially upstream the dam. - Naturalization of the riverbed. By promoting river dynamics, the river regains
its sinuosity in the riverbed, which encourages the colonization of the sediment banks by native vegetation.
Conclusions
It is considered that the proposal of removal in different stage is adequate and it seems correct to apply this methodology in actions of similar characteristics.
It is also considered adequate to leave a period of time between each stage of the removal so that the sediments can be exported through the river by means of the floods.
Working in stages also avoids impacts on ecosystems. The fish populations of the Leitzaran River have endured well the works.
References
GURATRANS (2014). La demolición de la presa de Inturia: un paso adelante hacia una nueva relación con nuestros ríos. Proyecto EFA221/11
GURATRANS (2014). Seguimiento geomorfológico de los procesos geomorfológicos tras la demolición de una presa en el río Leitzaran. Informe de seguimiento a la demolición de la presa de Inturia tras la segunda fase de derribo. Proyecto EFA221/11
Headwaters Economics (2016). Dam removal: case studies on the Fiscal, Economic, Social and Environmental benefits of dam removal.
Ibisate, A., Acín, V., Ballarín, D., Besne, P., Díaz, E., Ferrer-Boix, C., ... & Mesanza, A. Seguimiento geomorfológico del derribo de presas: metodología y primeros resultados (Mendaraz e Inturia, Gipuzkoa).
Ibisate, A., Ollero, A., Ballarín, D., Horacio, J., Mora, D., Mesanza, A., ... & Martín-Vide, J. P. (2016). Geomorphic monitoring and response to two dam removals: rivers Urumea and Leitzaran (Basque Country, Spain). Earth Surface Processes and Landforms, 41(15), 2239-2255.
Industrial Economics Inc. (2015). Economic & Community Benefits from Stream Barrier Removal Projects in Massachusetts (MA). Massachusetts Department of Fish and Game, Division of Ecological Restoration.
60
LIFE Irekibai project (2015). Resumen de los trabajos de demolición de la presa de Inturia, Fase 3.
LIFE Irekibai project (2016). Resumen de los trabajos de demolición de la presa de Inturia, Fase 4.
Ojeda, A. O., de Matauco, A. I. G., Naverac, V. A., Ferrer, D. B., Besne, P., Bea, E. D., ... & Martín-Vide, J. P. (2015). Geomorfología y restauración fluvial: seguimiento del derribo de presas en Gipuzkoa. Cuadernos de investigación geográfica, (40), 67-88.
Universidad del País Vasco (2014). Cuantificación de la tasa de sedimentos exportados de la cuenca del Río Leitzaran antes, durante y después de la demolición de la presa de Inturia. (IT598/13, Gobierno Vasco)
61

Case 3: Robledo de Chavela dam removal
General information
The Cofio River belongs to the Tajo River Basin District and is a tributary of the Alberche River. The basin area is 636.71 km2 and its length is 56 km. This river flows north-south between the regions of Castilla and León (province of Ávila) and Comunidad de Madrid. The average flow varies between 0.65 – 0.90 m3/s.
The Robledo de Chavela dam
The Robledo de Chavela dam was located in the province of Madrid. The dam was built in the sixties of the twentieth century, starting to work in 1968. The objective of the reservoir was to supply water to the urban center of Robledo de Chavela, but the waters did not reach the quality required for the supply. Finally, and after several actions trying to rectify the problem, the dam closed in 1990 and it was abandoned a decade later. In 2004, the Tajo River Basin District recovered the ownership of the dam due to the expiration of its use and its state of obvious abandonment.
It was noticeable that heavy metals were detected in the sediments retained in the reservoir vessel, whose capacity is 200,000 m3.
In 2012 a leakage is detected in the dam drainage, so that emergency measures have to be put in place to avoid the pollution of the river's waters.
Finally, this accumulation of problems led to the question of the application of management measures for this dam. The size and height of the dam, whose wall was 22.7 meters high, make the dam of Robledo to be considered as a large dam, so the current safety legislation determines that the obstacle cannot be abandoned without taking the security measures. Therefore, the only viable solution was its removal.
62

Figure 31. Location of the study area.
Problems
- As seen in the previous section, this dam has never fulfilled the purpose for which it was designed. So the only management option, for technical, safety and environmental reasons, was its removal.
- It was an impassable barrier that completely blocked the natural flow of the river and hinders the movement of the native fish species.
- Although the reservoir contained sediments, they only represented 10% of its capacity. The problem is that heavy metals concentrations were detected in these sediments so that the waters under the dam could be polluted.
Dam removal process
The removal of the Robledo dam was a milestone as to be the highest dam demolished in Spain, and possibly, in Europe.
The work carried out, besides the removal of the dam wall, consisted of the extraction and relocation of sediments, the capture and transfer of 4500 specimens of native fish, delimitation of the channel with riprap, slope profiling and reforestation of the riverbank.
The dam was demolished on September 29, 2014, by the use of 1.2 tons of explosives. More than 9,000 m3 of concrete from the wall of the dam were demolished.
63

Total budget for the Robledo de Chavela dam removal project: 280,000€
Nevertheless, there is a total budget of €1.5 million which includes the elimination of the dam and the renaturalization of the environment.
Figure 32. Moment of the demolition of Robledo de Chavela dam. The first photo shows the dam before its removal. The second picture shows the demolition moment and the third the state of the dam after demolition. Photo Credits: Ministry of Agriculture and Fishing, Food and Environment (MAPAMA).
Monitoring
Due to the problems of sediment contamination stored upstream of the dam, a study was carried out prior to the removal in order to make a diagnosis of the sediments and their treatment. A plan is implemented to remove some of these sediments and place them in higher areas where they were confined and stabilized by planting native vegetation.
Two years after the removal of the dam, a monitoring plan was conducted to measure:
- Physicochemical parameters of water as temperature, dissolved oxygen, conductivity and pH.
- Habitat availability. - Quality of the riparian forest. - Flora (macrophytes) and fauna (macroinvertebrates and fish) present in the
river, as well as exotic species.
64

The fish community in the Cofio River near the Robledo dam is: Rainbow trout (Oncorhynchus mykiss), Iberian barbel (Luciobarbus bocagei), chub (Squalius pyrenaicus), calandino (Squalius alburnoides) and Iberian gudgeon (Gobio lozanoi), being Squalius alburnoides the dominant specie. All are native species of the Tajo River Basin except from the rainbow trout that is exotic and comes from sport fishing.
Sampling points were determined both upstream and downstream from where the dam was located. The main results of this monitoring show clear signs of recovery in the river reach affected by the presence of the dam, with some differences between the areas that were located upstream and downstream of the dam.
Benefits
- The removal of Robledo dam is a milestone for the dam removal procedure. It shows that this type of action can and should be done in large dams that have lost their function and are not used anymore.
- The section of the river Cofio affected by the presence of the dam is recovering, especially downstream the dam.
- The area where the dam of Robledo is located lies within the Special Conservation Zone (Zona de Especial Conservación, ZEC in Spanish) “Basins of the Alberche and Cofio Rivers”. The removal of this dam will improve the quality of this area of high environmental value which belongs to the Natura 2000 network.
- The distribution of sediments along the river bed is allowing the recovery of riparian vegetation.
Conclusions
The removal of the Robledo dam stands out as an example of participatory management, in which the importance of administrative coordination between different social agents is evidenced.
The Robledo dam removal will promote the recovery of altered river processes as a consequence of the construction, exploitation and abandonment of the dam. It will therefore contribute to the improvement of the ecological status of the Cofio River and the native fish populations in this river.
A geomorphological study is required to determine the scope of sediment mobilization after dam removal.
References
Amor Cortés, J. (2016). Emisiones de gases de efecto invernadero en la demolición de la presa de Robledo de Chavela y la restauración ambiental de los terrenos afectados. Final Master Degree dissertation.
65

Confederación Hidrográfica del Tajo (2009). Diagnóstico y Propuesta de Tratamiento de los Sedimentos del Embalse de Robledo de Chavela en el río Cofio (Madrid). Estrategia Nacional de Restauración de Ríos.
Confederación Hidrográfica del Tajo (2014). Derribada la presa de Robledo de Chavela (Madrid), sobre el río Cofio, la más alta desmantelada en España con casi 23 metros de altura. Press release from 29/09/2014
Confederación Hidrográfica del Tajo (2016). Seguimiento del estado ecológico del Río Cofio tras la demolición de la presa de Robledo de Chavela.
Headwaters Economics (2016). Dam removal: case studies on the Fiscal, Economic, Social and Environmental benefits of dam removal.
Industrial Economics Inc. (2015). Economic & Community Benefits from Stream Barrier Removal Projects in Massachusetts (MA). Massachusetts Department of Fish and Game, Division of Ecological Restoration. Ollero Ojeda, A. (2015). Guía metodológica sobre buenas prácticas en restauración fluvial. Manual para gestores.
66

Case 4: La Gotera dam removal
General information
The Bernesga River belongs to the Duero River Basin District and is a tributary of the Esla River. The basin area is 1162 km2 and its length is 77 km. This rivers flows through the province of León and has not regulation. The average flow is 22.58 m3/s.
La Gotera dam
La Gotera dam was placed in the upper reach of the Bernesga River. It was built to serve a hydroelectric project that began operating in the 20's of the last century. The concession for the hydroelectric use was 75 years, so after that time it is necessary to determine measures to manage the obstacle.
The dam wall was 8 meters high. It also has gates for a bypass channel located on its left bank.
The location of the obstacle in a narrow area of the river with difficult access determined that the most viable option, once the dam had already fulfilled its function, was its removal. In addition, the reservoir vessel was partially filled with sediments (mostly gravels).
The dam was placed in a Biosphere Reserve, created in 2005, which implies a loss in the environmental values of the river in that area.
Figure 33. Location of the study area.
67

Problems
- The dam was placed in the Upper Bernesga River Biosphere Reserve, an area of high environmental value.
- This dam is an insurmountable barrier for the fish communities, especially for brown trout (Salmo trutta) which is a species of high environmental and social value in the area.
- There was an accumulation of sediments upstream of the dam.
Dam removal process
The Works of removal started in September 2011 by the Duero River Basin District and within the framework of the National Strategy of River Restoration (NSRR).
The slope between the river and the banks required the construction of a ramp so that the machines could access to the river. Due to the impossibility of removing the material from the ramp once the work was finished, material from other restoration activities in other river reaches was used. The native vegetation of the area was respected during the works of removal. In addition, it will serve to fix the ramp that allows the approach of the machines to the river.
Prior to the removal, a capture of the fish specimens located upstream of the dam was performed and subsequently released in the same river away from the intervention. A high abundance of fish was observed.
A volume of 1,068 m3 of debris was removed during the works. The concrete from the bypass channel and the dam was removed in the last phase of the work. All elements that are strange to the river like the concrete or metallic remains were removed from the river and moved to authorized dump sites.
With this removal, 15 kilometers of river that previously were interrupted by the dam has been reconnected. Barely a month after the removal of the obstacle, the river has recovered its natural course.
Total budget for the La Gotera dam removal project: 125,442.72€
68

Figure 34. Image of the removal works of La Gotera dam. Photo Credits: Ministry of Agriculture and Fishing, Food and Environment (MAPAMA).
Figure 35. Image of the place where the dam of La Gotera was located on the Bernesga River.
Note the narrowness of the place, which made difficult the works of removal.
69

Monitoring
The information regarding the monitoring of La Gotera dam removal is very scarce. A study was carried out prior to the demolition of the dam and another one a year later. Three points were sampled: a reference point upstream the dam, other near the dam wall and a third one downstream the dam. The fish samplings yielded no significant results. However, all macroinvertebrate indices did show an improvement, especially in the sampling point downstream of the dam.
Benefits
- The longitudinal connectivity of the river has been improved by releasing 15 km of the river.
- The fish communities (especially the brown trout) quickly recolonize the new habitats generated in the rapids formed upstream the dam.
- The colonization of the new river habitat available by the trout will also generate social and economic benefits since fishing is an important activity in the area.
- The river rapidly mobilizes the sediment accumulated behind the dam despite the reduced flow rate existing after the demolition.
- The removal of this dam will improve the quality of this area of high environmental value which belongs to a Biosphere Reserve.
Conclusions
The removal of this dam is an example that the performance of these actions, together with the availability of an adequate flow, generates good results in a short period of time.
It will be the river with its high flows that finally does the restoration work. The river mobilizes the sediments naturally the year after the removal
References
Headwaters Economics (2016). Dam removal: case studies on the Fiscal, Economic, Social and Environmental benefits of dam removal.
Industrial Economics Inc. (2015). Economic & Community Benefits from Stream Barrier Removal Projects in Massachusetts (MA). Massachusetts Department of Fish and Game, Division of Ecological Restoration. Ollero Ojeda, A. (2015). Guía metodológica sobre buenas prácticas en restauración fluvial. Manual para gestores.
70

Rodríguez Muñoz, I., Santillán Ibáñez, JI., Huertas, R. (2011). Excursión del I Congreso Ibérico de Restauración de Ríos. León. More information about La Gotera dam removal process: https://www.youtube.com/watch?v=iZeJ28uDIW4
Summary table of dam removal actions
The previous case studies are summarized in the following table:
71

Location Cost of removal Estimated benefits of removal
Alternatives Considerations
San Marcos Weir on the Bernesga River (León)
424,726 € - Decreased barrier effect and improvement of longitudinal connectivity. - Decreased risk of flooding in the city of León. - Better distribution of the sediments retained by the weir. - Improvement of potential habitat for fish communities. - Increasing awareness of local people about the natural conditions of a river.
Continuous and costly maintenance costs (dredging of the river, elimination of the vegetation accumulated in the river, etc.) do not allow consideration of other alternatives.
With this action, an extraordinary flood was prevented (the year after the dam removal) that would have flooded part of the city of León. The realization of this removal in an urban area is a great success since it increases the awareness of the society because they will demand this type of actions when seeing the results. The location of the weir near a bridge forced to use more costly removal techniques, which increased the final price of the project.
72

Location Cost of removal Estimated benefits of removal
Alternatives Considerations
Inturia dam on the Leitzaran River (Gipuzkoa)
Stage 1: 65,106.29 € Stage 2: 59,800.06 € Stage 3: 59,350.80 € Stage 4: 58,230.57 €
Total: 242,487.72 €
- Elimination of the barrier effect and improvement of river connectivity. - Progressive reduction of the reservoir. - Permeabilization of the habitat for the fish species. - Improvement of the physicochemical conditions of the waters. - Improvement of potential habitat for emblematic species such as Atlantic salmon, Kingfisher, European Mink and Iberian Desman. -Increasing the slope of the river bed. - Decrease in water temperature. - Decrease in river eutrophication. - Naturalization of the riverbed.
-Fish pass and/or fish elevator: Discarded for being very expensive and ineffective. - Total demolition of the dam in a single intervention: discarded due to the large amount of sediment accumulated in the dam.
A geomorphological study was carried out prior to the beginning of the first stage of action and then another during the second stage. A monitoring program was carried out during stages 1 and 2 to evaluate the morphological changes in the river upstream and downstream of the dam. It is considered that the proposal of removal in different stage is adequate and it seems correct to apply this methodology in actions of similar characteristics.
73

Location Cost of removal Estimated benefits of removal
Alternatives Considerations
Robledo de Chavela dam on the Cofio River
(Madrid)
280,000 € - Elimination of the barrier effect and improvement of river connectivity. - The section of the river Cofio affected by the presence of the dam is recovering, especially downstream the dam. - The distribution of sediments along the river bed is allowing the recovery of riparian vegetation. - The removal of this dam will improve the quality of this area of high environmental value which belongs to the Natura 2000 network.
The size and height of the dam make the dam of Robledo to be considered as a large dam, so the current legislation determines that the obstacle cannot be abandoned without taking security measures. However, the accumulation of technical and environmental problems determines that the only viable solution was its removal.
This removal is a milestone for the dam removal procedure. It shows that this type of action should be done in large dams that have lost their function and are not used anymore. A monitoring program was carried out after the dam removal (in August 2016) showing environmental improvements in the river after the removal. The importance of performing this monitoring before and after the dam removal is emphasized in order to quantify the effects that this type of actions have on the river.
74

Location Cost of removal Estimated benefits of removal
Alternatives Considerations
La Gotera dam on the Bernesga River (León)
125,442.72 € - Elimination of the barrier effect and improvement of river connectivity by reconnecting 15 km of the river. - The fish communities (brown trout) quickly recolonize the new habitats generated in the rapids formed upstream the dam. - The colonization of the new river habitat available by the trout will also generate social and economic benefits since fishing is an important activity in the area. - The river quickly mobilizes the sediment accumulated behind the dam despite the reduced flow after the demolition.
The location of the obstacle in a narrow area of the river with difficult access determined that the most viable option, once the dam had already fulfilled its function, was its removal.
The concession of hydroelectric exploitation had long expired, so the dam had already fulfilled its function and therefore could be eliminated. The removal of this dam is an example that the performance of these actions, together with the availability of an adequate flow, generates good results in a short period of time The river mobilizes the sediments naturally the year after the removal
75

Case 5. Fish pass on the Najerilla River
General information
The Najerilla River belongs to the Ebro River Basin District and is tributary of the Ebro River. The basin area is 1,105 km2 and its length is 99.7 km. This river flows through the regions of Castilla and León (province of Burgos) and La Rioja. The average flow of this river is 16.45 m3/s.
Obstacle information
The weir that was generating a disconnection in the longitudinal continuity of the river is located in the lower section of the Najerilla River, near the confluence with the Ebro River. It was a small weir that served to supply irrigation communities in the area. In origin, the weir was of an approximate height of 40 cm. However, over time, an erosion was generated downstream the obstacle so its height increased to 1.5 meters and the weir became impassable. This was a problem since the community of fish in the river is very varied and this obstacle became a serious problem for its movement through the river.
Figure 36. Location of the study area.
Due to this, it is necessary to propose management solutions to the longitudinal connectivity problem that this obstacle is generating. In this case the best management option is the installation of a fish passage to conserve the weir, since it generates a profit in the agricultural communities of the zone. In this way the weir will not be an obstacle for the movement of fish in the river.
76

Fish communities
The fish community of the Najerilla River is composed mainly of brown trout (Salmo trutta), graells barbel (Luciobarbus graellsii), Western Mediterranean barbel (Barbus meridionalis), Ebro nase (Parachondrostoma miegii) and the Pyrenean gudgeon (Gobio lozanoi).
Permeabilization works
Among the variety of existing fishways, in this particular case the chosen option was the installation of a rock ramp. This type of device mimics the natural conditions of the river. Usually have an inclined plane with a slope always ≤ 10%, in which blocks of stone of considerable size are inserted.
The advantages of this kind of devices are:
- It offers better conditions of passage (both upstream and downstream). - Its appearance is better integrated with the environment. - It allows the evacuation of flows (including ecological flows). - It does not alter the structure of the obstacle. - Low maintenance cost.
On the other hand the disadvantages are:
- It requires more space to be built. - It needs more flow to ensure their functionality. - It is only applicable to obstacles with small-medium heights (less than 2.5 m).
In this case, the Najerilla River presents marked contrasts of flow between high and low waters, so that it was proposed to make two sections of the fishway: a deeper central ramp of about 10 m wide and two shallower lateral ones of 4 m wide each. Stone blocks of about 1 meter diameter were placed so that no channels were formed where the water reaches a high speed and impedes the ascent of the fish. Finally, gravels have been embedded in the surface of the ramp in order to increase the roughness of the ramp bottom. The slope of the ramp was 5%.
Figure 37. Rock ramp in the Najerilla River with a low flow (left) and with a higher flow (right).
Photo credits: Pedro Boné.
77

Total budget for the Najerilla River fish pass project: 61,823 €
Part of this work was supported through FEADER funding (European funding to improve the rural development).
Benefits
- The realization of this work improves the longitudinal connectivity of the Najerilla River by facilitating the movement of the fish communities through an impassable obstacle.
- The permeabilization work has allowed the improvement of the longitudinal continuity of the river without eliminating the obstacle that was in use, which would have caused a conflict with the agricultural communities of the area.
- The work has been quickly integrated with the environment. - The fish communities of the Najerilla River have recovered their fluvial habitat,
fragmented by the presence of the obstacle.
References
Boné P. (2015) Rampa para peces en el Río Najerilla (Torremontalbo, La Rioja). Buena práctica para recuperar la continuidad del curso fluvial.
Confederación Hidrográfica del Ebro (2009). Pasos de peces para permeabilizar estructuras transversales en la cuenca del Ebro. Tecnoma.
Sanz-Ronda, J. et al. (2015) Sistemas de adaptación de pasos de agua a la migración de los peces. Ejemplos realizados en España. Seminario técnico LIFE-Miera: Gestión de un corredor ecológico.
78

Case 6. Fish pass in Las Librerías weir on the Guadiela River
General information
The Guadiela River belongs to the Tajo River Basin District and is a tributary of the Tajo River. The length is 109.5 km. The river flows through the region of Castilla-La Mancha (provinces of Cuenca and Guadalajara).
Obstacle information
Las Librerías weir is located in the upper reach of the Guadiela River. It belongs to a hydroelectric system formed by three obstacles: two in the Guadiela River (Las Librerías weir and Los Tilos weir) and another in the tributary Cuervo River. The dam is made of concrete and is 3 meters high. It is used for hydroelectric services and there is no data of the year of its construction neither of the concession period. Due to its use, the flow is very low and an ecological flow is not guaranteed in that section of the river.
It is an impassable barrier that fragments a river reach of high ecological value that belongs to a place declared Natural Monument in 2004. The section of the river situated between this dam and Los Tilos weir (located three kilometers downstream) has a special importance for salmonids. It is considered especially important the permeabilization of Las Librerías weir to free the Guadiela River from obstacles to its headwaters.
Figure 38. Location of the study area.
79

Fish communities
The fish community of the upper Guadiela River is composed mainly of brown trout (Salmo trutta) and chub (Squalius pyrenaicus).
Permeabilization works
Of the variety of existing fishways, in this particular case the chosen option was the installation of a pool fishpass, the most used kind of fishways.
The advantages of this kind of devices are:
- Little selective. Most fish species will be able to use it effectively. - It admits wide ranges of flows. - It presents an optimum behavior against changes of the water level.
The disadvantages of this kind of devices are:
- Plenty of space is required for its installation. - It needs more maintenance because it can become blocked. - The price is higher than other fish pass options.
In this case, due to the location of the dam it was decided to build the fishway with a curve of 180 degrees.
Among the alternatives of permeabilization, weir removal was not proposed since the obstacle is in use and it serves to generate hydroelectric energy. An agreement was reached with the owner in order to make a fishway that at least guarantees the circulation of a constant flow downstream the weir.
With this permeabilization it is possible to recover the connectivity between this section and the headwaters of the Guadiela River. However, the presence 3 km downstream of the Los Tilos dam (more than 6m high) prevents this recovery from being complete. It is therefore required to permeabilize this obstacle in order to achieve a more complete reconnection.
80

Figure 39. The fishpass built in Las Librerías weir on the Guadiela River. Photo credits: Europa
press/JCCM.
Total budget for the Las Librerías fish pass project: 144,000 €
Part of this work was supported through FEDER funding (European funding to improve the regional development).
Problems
- The flow through the fishway is a little lower than expected. - The fishway is usually stuck after the river floods, so a periodic maintenance is
needed for its optimal functioning.
Benefits
- The realization of this work improves the longitudinal connectivity of the upper Guadiela River by facilitating the movement of the fish communities through an impassable obstacle. This longitudinal connectivity is especially valuable for fish species such as trout and Iberian endemism such us chub and bermejuela.
- The fishway allows the river flow in this part to remain more stable throughout the year.
- This work contributes to the recovery of an area of high environmental value.
References
Confederación Hidrográfica del Ebro (2009). Pasos de peces para permeabilizar estructuras transversales en la cuenca del Ebro. Tecnoma.
WWF (2009). Liberando ríos. Propuestas de la WWF para el desmantelamiento de presas en España.
81

Summary table of fish passage actions
The previous case studies are summarized in the following table:
Location Cost Estimated benefits Considerations Fish pass on the
Najerilla River (La Rioja, Ebro River
Basin District)
61,823 € -The realization of this work improves the longitudinal connectivity of the Najerilla River by facilitating the movement of the fish communities through an impassable obstacle. -The permeabilization work has allowed the improvement of the longitudinal continuity of the river without eliminating the obstacle that was in use, which would have caused a conflict with the agricultural communities of the area. -The work has been quickly integrated with the environment. -The fish communities of the Najerilla River have recovered the fluvial habitat, fragmented by the presence of the obstacle
It is advisable to use rock ramps, whenever the place permits, as they integrate in a more natural way with the environment. The implementation of monitoring programs is essential to evaluate the correct functioning of the fishways. In this regard, there is a lack of information about this action.
82

Location Cost Estimated benefits Considerations Fish pass in Las
Librerías weir on the Guadiela
River (Cuenca, Tajo River Basin
District)
144,000 € -The realization of this work improves the longitudinal connectivity of the upper Guadiela River by facilitating the movement of the fish communities through an impassable obstacle, especially valuable fish species such as trout and Iberian endemics such us chub and bermejuela. -The fishway allows the river flow to remain more stable throughout the year in this section. -This work contributes to the recovery of an area of high environmental value.
Because the obstacle is in use and its elimination was unlikely, at least an agreement was reached with the owner to permeabilize the dam and ensure a minimum flow rate in that section of the river. This permeabilization represent an improvement in the longitudinal connectivity of this river reach, however it is considered necessary to permeabilize the weir located 3 km downstream in order to achieve a more complete reconnection. The implementation of monitoring programs is essential to evaluate the correct functioning of the fishway. There is no evidence that monitoring programs are being taken for this action.
83

Cost-benefit methodology applied to barriers permeabilization
In the following section we will implement criteria of cost-benefit evaluation in the six real cases of elimination and fish passage previously described.
Once the benefits of barriers permeabilization have been established as well as the difficulty of evaluating them only economically, it is considered necessary to apply a methodology to evaluate the changes in the Ecosystem Services and Human Well-being in the permeabilization processes. For this purpose it has been decided to use the Fuzzy Cognitive Maps (FCM).
The FCMs constitute an attractive and structured modelling technique that can be specifically used in complex systems (Papageorgiou et al., 2009), where predictions on systems performance are made through a semi-quantitative or semantic assessment of the relationships between concepts (Papageorgiou and Kontogianni, 2012). FCMs can be described as a qualitative model that portrays how a given system operates (Özesmi and Özesmi, 2004). The qualitative model is derived by describing the system in terms of its component variables and the causalities among these variables (Park and Kim, 1995).
The construction of a FCM requires the input of human experience and knowledge of the system under consideration. Thus, FCMs integrate the accumulated experience and knowledge concerning the underlying causal relationships among factors, characteristics and components that constitute the system (Papageorgiou and Kontogianni, 2012).
For this case, experts on restoration and river management issues have been consulted to develop a correspondence matrix between Ecosystem Services and human welfare indicators for the specific case of barrier permeability. This matrix allows calculating the outdegree (cumulative strength of connections exiting a variable or how much a variable affects other variables) the indegree (cumulative strength of connections entering a variable or how much a variable is impacted by other variables). The summation of the outdegree and the indegree of a variable show its centrality which demonstrates the importance of the variable in the FCM (Özesmi and Özesmi, 2003, 2004).
The FCM also permit to analyse the system behavior by running simulations and to determine possible management scenarios under different conditions or if different policy options were implemented (Kosko 1987).
Therefore, we have crossed the Ecosystem Services provided by rivers and the indicators of human well-being that they provide in a relationship matrix in order to determine their variations in different real cases of barrier permeabilization in Spain.
84

Once the matrix of Ecosystem Services and Human Well-being indicators is prepared, it was filled by four experts in fluvial ecosystems and water resources management. The values of the crosses between the variables of the matrix were: 1 if the connection is strong, 0.5 if the connection is medium and 0 if there is no relationship between these variables. Also this relation can be positive (+) or negative (-). The relationships were established so that the variables of the columns influence the variables of the rows (figure 40 on the next page).
85

86

Figure 40. Matrix of relationships between Ecosystem Services and constituents of Human Well-being.
fres
hwat
er: f
ish h
abita
t (lo
ngitu
dina
l con
nect
ivity
)m
iner
al ra
w m
ater
ials:
se
dim
ent t
rans
port
rene
wab
le e
nerg
y: h
ydro
pow
erw
ater
regu
latio
n an
d w
ater
qu
ality
: wat
er re
gula
tion
(nat
ural
rive
r flo
w)
natu
ral h
azar
d m
itiga
tion:
flo
od m
itiga
tion
biol
ogic
al c
ontr
ol: i
n-st
ream
na
tura
l com
mun
ities
loca
l eco
logi
cal k
now
ledg
e:
publ
ic a
war
enes
scu
ltura
l ide
ntity
and
sens
e of
be
long
ing:
invo
lvem
ent o
f rip
aria
n po
pula
tions
land
scap
e-ae
sthe
tic v
alue
s:
scen
ic b
eaut
y of
the
recr
eatio
n an
d ec
otur
ism:
fishi
ng, a
nglin
g,
envi
ronm
enta
l edu
catio
n:
wild
life
and
biod
iver
sity
Abili
ty to
live
in a
n en
viro
nmen
tally
cle
an a
nd
safe
shel
ter
Abili
ty to
redu
ce v
ulne
rabi
lity
to e
colo
gica
l sho
cks a
nd
Basic
mat
eria
l for
a g
ood
life
Abili
ty to
acc
ess r
esou
rces
to
earn
inco
me
and
gain
a
livel
ihoo
dAb
ility
to b
e ad
equa
tely
no
urish
edAb
ility
to b
e fr
ee fr
om
avoi
dabl
e di
seas
eAb
ility
to h
ave
adeq
uate
and
cl
ean
drin
king
wat
erAb
ility
to h
ave
clea
n ai
rAb
ility
to h
ave
ener
gy to
kee
p w
arm
and
coo
lO
ppor
tuni
ty to
exp
ress
ae
sthe
tic a
nd re
crea
tiona
l va
lues
ass
ocia
ted
with
O
ppor
tuni
ty to
exp
ress
cu
ltura
l and
spiri
tual
val
ues
asso
ciat
ed w
ith e
cosy
stem
sO
ppor
tuni
ty to
obs
erve
, stu
dy,
and
lear
n ab
out e
cosy
stem
s
freshwater: fish habitat (longitudinal connectivity) 0 -1 1 1 0 1 0 0 0 0 0 0 0 0 0 0 0 0 0 0 0 0mineral raw materials: sediment transport 1 -1 1 -0,5 0 1 0 0 0 0 0 0 0 0 0 0 0 0 0 0 0 0renewable energy: hydropower 0 -1 0 0 0 0 0 0 0 0 0 0 0 0 0 0 0 0 0 0 0 0
water regulation and water quality: water regulation (natural river flow) 0 0 -1 1 0 1 0,5 0 0 0 0 0 0 0 0 0 0 0 0 0 0 0natural hazard mitigation: flood mitigation 0 -0,5 1 -1 0,5 1 0 0 0 0 0 0 0 0 0 0 0 0 0 0 0 0
biological control: in-stream natural communities restoration 1 1 -1 1 1 1 0,5 0 0 0 0 0 0 0 0 0 0 0 0 0 0 0local ecological knowledge: public awareness 1 1 1 1 1 0,5 1 1 0,5 1 -0,5 -0,5 0 0,5 0 -0,5 -0,5 -1 0 0,5 0 1cultural identity and sense of belonging: involvement of riparian populations 0 0 0 0,5 0,5 0,5 0,5 1 0,5 0,5 1 0 0 0,5 0 0 0 0 0 0,5 1 0,5landscape-aesthetic values: scenic beauty of the landscape 0,5 1 0 1 1 1 1 1 0,5 0,5 0,5 0 0 0 0 0 0 0 0 0,5 0 0recreation and ecoturism: fishing, angling, rafting/kayaking 1 0,5 1 0,5 0,5 1 1 1 1 0,5 0 0,5 0 0,5 0 0 0 0 0 0 0 0environmental education: wildlife and biodiversity 1 0,5 -1 1 1 1 1 0,5 1 1 0,5 0 0 0 0 0 0 0 0 0,5 0 0,5Ability to l ive in an environmentally clean and safe shelter 0 -0,5 1 -1 1 0,5 0 0 0 0 0 1 1 0 0 0 0 0 0 0 0 0
Ability to reduce vulnerabil ity to ecological shocks and stress 1 0,5 0 -1 1 0,5 0 0 0 0 0 0 0 0 0 0 0 0 0 0 0 0Basic material for a good life 0 1 0 0 0 0 0 0 0 0 0 0 0 0,5 0 0 0 0 0 0 0 0Ability to access resources to earn income and gain a l ivelihood 0 1 1 -0,5 0 -0,5 0 0 0 1 0 0,5 0 1 0,5 0,5 0,5 0 0,5 0 0 0,5Ability to be adequately nourished 0 0 0 0 0 0 0 0 0 0 0,5 0,5 0 1 1 0 0 0 0 0 0 0Ability to be free from avoidable disease 0 0 0 0,5 -0,5 0,5 0 0 0,5 1 0,5 1 0 1 1 1 1 1 1 0 0 0Ability to have adequate and clean drinking water 0 -0,5 0 -0,5 0 0,5 0 0 0 0 0 1 0,5 1 0,5 0 0 0 0 0 0 0Ability to have clean air 0 0 1 0 0 0 0 0 0 0 0 0,5 0 0 0 0 0 0 0 0 0 0Ability to have energy to keep warm and cool 0 0 1 0 0 0 0 0 0 0 0 0 0 1 1 0 0 0 0 0 0 0Opportunity to express aesthetic and recreational values associated with ecosystems 1 1 0 1 0,5 1 1 1 1 1 0,5 0,5 0 0 0 0 0 0 0 0 0 1Opportunity to express cultural and spiritual values associated with ecosystems 0,5 0 0 0,5 0 0 1 1 1 1 0,5 0,5 0 0 0 0 0 0 0 0 0,5 0,5Opportunity to observe, study, and learn about ecosystems 1 1 0 1 1 1 1 1 1 1 1 1 0 0 0 0 0 0 0 0 1 0,5
ecosystem services constituents of well-beingprovisioning regulating cultural security health good social relations
ecos
yste
m se
rvic
es
prov
.re
gula
ting
cultu
ral
cons
titue
nts o
f wel
l-bei
ng
secu
rity
heal
thgo
od so
cial
re
latio
ns
87

88

The calculation of the outdegree, indegree and centrality of the variables (figure 41) as well as the simulation of different management scenarios (pre and post dam permeabilization) were conducted with the Fuzzy Cognitive Mapping & Modelling software tool (Bachhofer and Wildenberg, 2010) (freely available in www.fcmappers.net).
Figure 41. Representation of the importance of the variables according to their centrality, which is the sum of the outdegree and indegree of a variable, and demonstrates the importance of the variable.
As seen, the most important variables of the system are: public awareness and natural river flow. Both are Ecosystem Services that will have great influence on the other variables, both Ecosystem Services and Human Well-being indicators.
0
5
10
15
20
25
30
publ
ic a
war
enes
s
natu
ral r
iver
flow
Opp
ortu
nity
to o
bser
ve,…
envi
ronm
enta
l edu
catio
n
land
scap
e-ae
sthe
tic v
alue
s
recr
eatio
n an
d ec
otur
ism
in-s
trea
m n
atur
al…
sedi
men
t tra
nspo
rt
flood
miti
gatio
n
invo
lvem
ent o
f rip
aria
n…
Opp
ortu
nity
to e
xpre
ss…
Abili
ty to
acc
ess…
Abili
ty to
live
in a
n…
long
itudi
nal c
onne
ctiv
ity
hydr
opow
er
Abili
ty to
be
free
from
…
Opp
ortu
nity
to e
xpre
ss…
Abili
ty to
redu
ce…
Abili
ty to
hav
e ad
equa
te…
Basic
mat
eria
l for
a g
ood…
Abili
ty to
be
adeq
uate
ly…
Abili
ty to
hav
e en
ergy
to…
Abili
ty to
hav
e cl
ean
air
Outdegree Indegree
89

Simulations pre and post permeabilization and weighting of variables.
After calculating the importance of the variables, a simulation of how the system works before and after the barrier permeabilization was conducted. For that, we considered two simulation scenarios for each case study: a scenario before the permeabilization (Scenario 1) and a scenario after the permeabilization, either by removal of the obstacle or by construction of a fish passage (Scenario 2).
The simulations have been carried out by modifying the value of the Ecosystem Services for each specific case study and measuring the variations that these changes caused in Human Well-being indicators. These simulations have been performed according to the expert criteria and have been assessed modifying the value of the Ecosystem Services in both scenarios. A value of 0 is assigned when the Ecosystem Service is altered, a value of 1 if the service is in good condition and a value of 0.5 for intermediate states. For example, in the case of the removal of San Marcos weir it is know that, during its presence, some Ecosystem Services such as the sediment transport, the longitudinal connectivity and the in-stream natural communities were negatively affected. This implies an impact on the Human Well-being indicators. However, after its elimination, it is known what ecosystem services have changed its state (generally better, although each case is different and has been taken into account). In the case of San Marcos weir removal, the increase of public awareness has been especially important since it has greatly favored the other benefits of the elimination of this weir. This information has been used to generate the state of the Scenario 2 and measure changes in the Well-being indicators, provided as software outputs.
Once the values of the variables in the Scenario 1 and Scenario 2 situations have been determined, the difference between the two situations has been calculated (tables 8 and 9).
90

Table 8. results of the simulation process for the four cases of obstacle removal. The values obtained in Scenario 1 (S1) and in Scenario 2 (S2) are shown for each case, as well as the difference between them (Diff.).
Constituents of Human Well-being San marcos weir
Inturia dam
Robledo dam
Gotera dam
S1 S2 Diff. S1 S2 Diff. S1 S2 Diff. S1 S2 Diff.
Ability to live in an environmentally clean and safe shelter 0.69 0.72 0.03 0.69 0.43 -0.26 0.81 0.62 -0.19 0.69 0.46 -0.23
Ability to reduce vulnerability to ecological shocks and stress 0.50 0.78 0.28 0.50 0.56 0.06 0.62 0.62 0.00 0.50 0.68 0.18
Basic material for a good life 0.62 0.82 0.20 0.62 0.82 0.20 0.62 0.73 0.11 0.62 0.82 0.20 Ability to access resources to earn income and gain a livelihood 0.98 0.99 0.01 0.96 0.98 0.02 0.96 0.98 0.02 0.96 0.98 0.02
Ability to be adequately nourished 0.87 0.93 0.06 0.87 0.93 0.05 0.88 0.93 0.05 0.87 0.93 0.05 Ability to be free from avoidable disease 1.00 1.00 0.00 0.99 1.00 0.00 0.99 1.00 0.01 0.99 1.00 0.01
Ability to have adequate and clean drinking water 0.85 0.85 0.00 0.85 0.70 -0.15 0.87 0.82 -0.05 0.85 0.72 -0.13
Ability to have clean air 0.59 0.59 0.00 0.59 0.55 -0.03 0.60 0.58 -0.02 0.59 0.56 -0.03 Ability to have energy to keep warm and cool 0.83 0.86 0.03 0.83 0.86 0.03 0.83 0.85 0.02 0.83 0.86 0.03
Opportunity to express aesthetic and recreational values associated with ecosystems
0.85 1.00 0.14 0.77 1.00 0.23 0.83 1.00 0.17 0.77 1.00 0.23
Opportunity to express cultural and spiritual values associated with ecosystems
0.85 0.98 0.13 0.76 0.98 0.22 0.78 0.99 0.20 0.76 0.99 0.23
Opportunity to observe, study, and learn about ecosystems 0.92 1.00 0.08 0.86 1.00 0.14 0.93 1.00 0.07 0.86 1.00 0.14
91

Table 9. results of the simulation process for the two cases of fish passage. The values obtained in Scenario 1 (S1) and in Scenario 2 (S2) are shown for each case, as well as the difference between them (Diff.).
Constituents of Human Well-being Najerilla Las librerías
S1 S2 Diff. S1 S2 Diff. Ability to live in an environmentally clean and safe shelter 0.69 0.65 -0.04 0.86 0.75 -0.11
Ability to reduce vulnerability to ecological shocks and stress 0.50 0.56 0.06 0.50 0.56 0.06
Basic material for a good life 0.62 0.62 0.00 0.62 0.62 0.00 Ability to access resources to earn income and gain a livelihood 0.96 0.94 -0.02 0.99 0.98 -0.01
Ability to be adequately nourished 0.87 0.89 0.02 0.88 0.92 0.04 Ability to be free from avoidable disease 0.99 1.00 0.00 1.00 1.00 0.00
Ability to have adequate and clean drinking water 0.85 0.85 0.00 0.87 0.86 -0.01
Ability to have clean air 0.59 0.58 -0.01 0.81 0.71 -0.10 Ability to have energy to keep warm and cool 0.83 0.83 0.00 0.93 0.89 -0.04
Opportunity to express aesthetic and recreational values associated with ecosystems
0.77 0.99 0.22 0.79 0.99 0.20
Opportunity to express cultural and spiritual values associated with ecosystems
0.76 0.97 0.21 0.78 0.98 0.20
Opportunity to observe, study, and learn about ecosystems 0.86 1.00 0.13 0.88 1.00 0.11
Parallel to this process, a classification of the variables that constitute the Human Well-being indicators has been made (table 10). The next step was the weighting of these variables to determine their importance in the processes of permeabilization of obstacles. The weighting was performed with two types of preference: linear and exponential. The second one was chosen to avoid the strong linear relationship between the variables. This weighting has also been performed according to expert criteria.
92

Table 10. Classification of the constituents of Human Well-being according to the importance determined by a group of experts. Some of them share the same position because the experts considered that they should have the same importance.
Constituents of Human Well-being Rank Weight Health Ability to be adequately nourished 1 1.04 Health Ability to have adequate and clean drinking water 1 1.04 Health Ability to be free from avoidable disease 2 1.00 Health Ability to have energy to keep warm and cool 2 1.00
Security Ability to live in an environmentally clean and safe shelter 3 0.95 Security Ability to reduce vulnerability to ecological shocks and stress 4 0.90 Health Ability to have clean air 5 0.85
Security Basic material for a good life 6 0.78 Security Ability to access resources to earn income and gain a livelihood 7 0.70
Good social relations
Opportunity to express cultural and spiritual values associated with ecosystems 8 0.60
Good social relations Opportunity to observe, study, and learn about ecosystems 9 0.48
Good social relations
Opportunity to express aesthetic and recreational values associated with ecosystems 10 0.30
The results obtained by comparing the difference of the variable values between the two scenarios (namely the results of Scenario 2 minus those of Scenario 1) have been multiplied by the weight assigned to each constituent of Human Well-being. The sum of these values is therefore considered the final benefit obtained by the permeabilization of each obstacle (table 11).
Table 11. Comparison between the total cost of the action and the overall benefit obtained. The value of the benefit is given in the range 0 – 1.
Case study Total cost Total
benefit obtained
San Marcos weir removal 424,726 € 0.69
Inturia dam removal 242,487.72 € 0.15 Robledo de Chavela
dam removal 280,000 € 0.13
La Gotera dam removal 125,442.72 € 0.32
Najerilla fish passage 61,823.00 € 0.27 Las librerías fish
passage 144,000.00 € 0.09
93

Figure 42. Comparison between the cost of every permeabilization action and the estimated
benefit obtained.
Finally, we have compared the total cost of every permeabilization action with their obtained benefit. As it is shown in figure 42, there is trend between the cost of the action and the possible benefit obtained, which suggests that the works of permeabilization of obstacles will be beneficial for ecosystem services and constituents of human well-being in spite of the cost that they present.
94

9. Recommendations on management, policy and best practice for river restoration
First part: analysis of the information of each River Basin
- All the River Basin Districts should make the information on obstacle inventories publicly available on their respective websites. This information should also be free to download in accessible files to the public.
- The information provided in the barriers inventories by the River Basins is presented in some cases in a confused and disorderly way, which makes it difficult to compare with the inventories of other River Basins. It is considered necessary to establish common criteria to facilitate its consult.
- In some inventories the location of barriers is provided in different coordinate systems, which makes it difficult to cluster them into common databases.
- It is considered necessary to establish stronger cooperation between the Regional Governments and the River Basin Districts on the data processing to avoid the loss of information or the development of parallel studies on the same subject instead of working together to obtain better inventories and higher data quality.
- It is considered necessary to establish a unifying criterion between the different River Basin Districts in order to ensure that all of them apply the river connectivity indices in a coordinated way, so that the results of the application of these indices are comparable between the different basins.
- Some River Basin Districts have assessed the passability of the obstacles in two directions, upstream and downstream. It is considered essential to apply this criterion to other basins to develop more realistic obstacle passability criteria.
- The lack of information on the ownership of obstacles is a problem when proposing management measures.
- Field work campaigns should be implemented by the River Basin Authorities to check the barriers inventories and to upgrade them with real data.
- Knowledge gaps in the loss of longitudinal connectivity field must be completed to raise public awareness of the importance of these activities.
- The public administration should implement studies to obtain extensive and actual data on fish communities, in order to facilitate the decision-taking and prioritization of actions, either of dam removal or fish passes. The lack of fish data, concerning native
95

and non-native species, is a barrier for the implementation of such measures by the public administration.
Second part: cost-benefit case studies
- There are hardly any references to cost-benefit studies on the permeabilization and removal of barriers in our country. The lack of this information makes it difficult to implement a methodology in this regard.
- Most of the information found about cost-benefit studies of barrier removal comes from the United States. Similar information from studies done in Europe has not been found.
- The monitoring studies prior and after the permeabilization, by building a fishway or removing the barrier, are essential to be able to verify the effects on the river, the animal and vegetal communities and the society.
- The longitudinal connectivity of rivers should not be measured exclusively by the movement of fish species; the mobility of sediments is a fundamental issue that should be further studied.
- A dam is not a natural obstacle, like a waterfall, it is a building and as such needs maintenance.
- It is essential to end with the established idea among the population that dams are things that exist "lifelong". Most of them are from the beginning/middle of the twentieth century.
- Previous studies conducted in the United States determine that, in some situations, removing the dams was less expensive than other maintenance alternatives (Industrial Economics Inc. 2015; Headwaters Economics 2016). However, this statement is not applicable to all dam removal actions since each case is different and must be analyzed accordingly. In spite of, this is a way of demonstrating that the removal of obstacles is a desirable alternative when the maintenance and repair costs exceed the demolition option.
- The methodology used in this report to make the cost-benefit analyse of obstacles permeabilization, has suggested that there may be a positive trend between the cost of the action and the environmental and social benefits obtained.
- When talking about the cost-benefit of dam removal works, whatever the cost, the benefit will theoretically be forever since the river will recover its naturalness to a greater or lesser extent.
96

- More than talking about cost-benefit studies in removing obstacles, we would have to talk about the period of amortization of the removing work. This would serve to prioritize actions (in case of limited budgets) but not to determine whether to demolish or not, as long as it could be demolished.
97

SWOT analysis of the state of longitudinal connectivity and dam removal in Spain
As seen in the former sections and as a summary of the report analysis of river fragmentation in the Spanish basins, a SWOT analysis (Strengths, Weaknesses, Opportunities and Threats) has been implemented to serve as a best practice guide. Strengths:
-Spain is a member of the European Union, so that we share a common legislation about river management.
-The river responds quickly after a dam removal, so the positive effects come soon.
-There is more technical knowledge on how the barriers work than twenty years before, making the society more aware that the dams are obsolescent and therefore it is necessary to develop plans for its management.
-The exploitation concessions of many dams have already expired or are near their expiration.
-It is relatively simple to fit the dam removal projects into other restoration projects, which facilitates its application.
Weaknesses:
-There is not a complete list of all the barriers in Spain (the official lists are incomplete).
-Scarcity of human and economic resources in the public administrations responsible of river restoration measures.
-There is a social rejection about the dam removal measures, especially in the populations placed near the river.
-There are few cost-benefit studies of dam removal in Spain.
-There are so few studies of monitoring before the removal of the barrier, so that there are no data about the previous situation and the possible improvements of the removal.
-On occasion, the difficulty of dealing with the owners of the obstacles impedes the process of permeabilization.
-There is a lack of coordination among the regional governments and the River Basin Authorities. This hinders the implementation of projects to remove barriers.
98

-There is a lack of a standard methodology to be applied in the dam removal projects.
-The downstream connectivity is a process that still remains undervalued in the longitudinal connectivity analysis.
-There is no assessment of the effectiveness of some permeability works such as fish passages.
-There are many weirs that are considered cultural heritage. This implies a limitation when proposing removal measures.
Opportunities:
-The removal of the barrier is in most of the cases cheaper than any other alternatives of maintenance.
- Several dam removal actions have been carried out recently in Spanish rivers. It is therefore important to classify the methodologies that have been most successful in order to apply them in other cases.
- There are European projects and funding that can be used to carry out the removal of barriers in Spain.
-The current legislation supports the removal of dams when they are obsolete and not in use anymore.
-There are more management alternatives than the expropriation to remove a barrier.
-The reform of the Common Agricultural Policy (CAP) could favor the actions of elimination of obstacles in the rivers.
-The Habitats Directive (92/43/CEE) also encourages the permeabilization measures in order to improve the habitat for the native fish communities.
-Pedagogical work is essential to raise the awareness of the population about the benefits of the dam removal.
-The dam removal actions are an opportunity to develop projects of “citizen science” where local populations are involved in the importance of regaining longitudinal connectivity in rivers and that they are a key piece in the process.
Threats:
-The population does not demand dam removal actions because they consider that it is not necessary. It is generated, therefore, a vicious circle: there is no demand from the society so there is no need to do this type of projects.
-Slow evolution of population awareness on the dam removal issue.
99

-Regulated rivers are causing incision problems in the river bed downstream the obstacle.
-The ecological water flows proposed by the authorities are insufficient to recover the longitudinal connectivity.
-The retention of fluvial sediment is a major problem near the obstacles, generating a problem with flows with sediment deficit known as “hungry waters”.
-The Climate Change will be a problem, especially in the Mediterranean rivers, because the forecasts estimate an increase in the duration of the dry periods and therefore a decrease of the flows in these rivers. This will lead to the demand for the construction of new reservoirs for water storage.
100

References
References of every River Basin District
Internal Basins of Catalonia (Catalonia)
1. Solà, C., i Rigo, M. O., Rovira, Q. P., Sellarès, N., Queralt, A., Bardina, M., ... & Ramos, A. M. (2011). Longitudinal connectivity in hydromorphological quality assessments of rivers. The ICF index: A river connectivity index and its application to Catalan rivers. Limnetica, 30(2), 273-292. [Information available on the Internet]
2. Agència Catalana del´Aigua (2010). Bases tècniques per al desenvolupament del programa de mesures encaminat a la millora de la connectivitat fluvial a Catalunya. [Information available on the Internet]
3. Ordeix, M., Pou-Rovira, Q., Bardina, M., Munné, A., Solà, C., Casamitjana, A., & Sellarès, N. (2011). Fish pass assessment in the rivers of Catalonia (NE Iberian Peninsula). A case study of weirs associated with hydropower plants and gauging stations. Limnetica, 30(2), 0405-426. [Information available on the Internet]
4. Ordeix, M., Sostoa, A; Maceda, A; García-Berthou, E; Benejam, L; Casals, F; Caiola, N; Ibàñez, C; Sellarès, N; Pou-Rovira, G; Rodríguez-Labajos, B; Solà, C; Bardina, M; Casamitjana, A i Munné, A. (2014). Els peixos dels rius i les zones humides de Catalunya. Qualitat biològica i connectivitat fluvial. Agència Catalana de l’Aigua – Museu del Ter – Eumo editorial. Vic. 172 pàg. [Information available on the Internet]
5. Ordeix, M., Pou, Q., Sellarès, N. (2006) Avaluació de la connectivitat per als peixos als rius de Catalunya. Agència Catalana de l’Aigua – Museu del Ter. [Information available on the Internet]
6. Agència Catalana del´Aigua (2005). Què és una escala de peixos? [Information available on the Internet]
7. Agència Catalana del´Aigua (2012). Qualitat hidromorfològica dels rius del Districte de Conca Fluvial de Catalunya. Resultats del Programa de Seguiment i control 2007-2012 [Information available on the Internet]
Internal Basins of the Basque Country (Basque Country)
1. Agencia Vasca del Agua (2012). Demarcación Hidrográfica del Cantábrico Oriental 2010-2021. Ámbito de las Cuencas Internas del País Vasco. Anexos a la memoria. [Information available on the Internet]
2. Confederación Hidrográfica del Cantábrico (2015). Plan Hidrológico (revisión 2015-2021) Parte española de la Demarcación Hidrográfica del Cantábrico
101

Oriental. Anejo IX: objetivos medioambientales y excepciones. [Information available on the Internet]
3. LIFE Irekibai (2015). http://www.irekibai.eu/ 4. Agencia Vasca del Agua (2015). Sistema de evaluación de la comunidad
piscícola en ríos de la CAPV. Informe Técnico. 120 pp. Informe elaborado por UTE Anbiotek-Ekolur para la Agencia Vasca del Agua (URA) [Information available on the Internet]
5. Agencia Vasca del Agua (2013). Estudio de eficacia de las obras de permeabilización realizadas en 3 azudes del Alto Oria (Gipuzkoa). Informe elaborado por Ekolur para la Agencia Vasca del Agua (URA) [Information provided by Authority]
6. Ardaiz Ganuza, José. Seguimientos de fauna piscícola: efectos de las actuaciones del proyecto sobre la especies del río. Gobierno de Navarra. Document part of the LIFE project Irekibai [Information available on the Internet]
Duero River Basin District (Duero)
1. Confederación Hidrográfica del Duero (2010). Diagnóstico de la conectividad longitudinal de la cuenca del Duero. Informe elaborado por ICTHIOS s.l para la Confederación Hidrográfica del Duero (CHD). [Information available on the Internet]
2. Confederación Hidrográfica del Duero (2011). Programa de mantenimiento y conservación de cauces (2008-2010). [Information available on the Internet]
3. LIFE Cipríber (2015) http://www.cipriber.eu/ 4. LIFE Cipríber (2015). Protocolo de Actuación frente a Especies Exóticas
Invasoras. LIFE13/NAT/ES/ 000772 “CIPRÍBER” (ACCIÓN C2) [Information available on the Internet]
Ebro River Basin District (Ebro)
1. Confederación Hidrográfica del Ebro. Plan Hidrológico de la cuenca del Ebro (2010-2015). [Information available on the Internet]
2. Confederación Hidrográfica del Ebro (2015). Planes de gestión de los espacios naturales protegidos de la parte española de la Demarcación Hidrográfica del Ebro. [Information provided by request to Authority]
3. Confederación Hidrográfica del Ebro (2009). Pasos de peces para permeabilizar estructuras transversales en la Cuenca del Ebro. Documento elaborado por TECNOMA. [Information available on the Internet]
4. Confederación Hidrográfica del Ebro (2011). Evaluación de pasos de peces en la Cuenca del Ebro. Documento elaborado por TECNOMA. [Information available on the Internet]
102
5. Confederación Hidrográfica del Ebro (2010). Análisis del funcionamiento de escalas de peces existentes en la cuenca del Ebro y propuesta de nuevas escalas en el estudio de presas y azudes en los que es necesaria su instalación para alcanzar el buen estado de las aguas según la Directiva 2000/60/CE, proyecto de pasos de peces 2008-2010. Documento elaborado por TECNOMA. [Information available on the Internet]
6. Confederación Hidrográfica del Ebro (2012). Caracterización de la Ictiofauna de la cuenca del Ebro a partir de los inventarios realizados entre 1996 y 2010. Documento elaborado por la Oficina de Planificación de la Confederación Hidrográfica del Ebro con la colaboración de TRAGSATEC y la revisión del Área de Calidad. [Information provided by request to Authority]
7. Confederación Hidrográfica del Ebro (2010). Evaluación de la efectividad de la escala de peces del azud del río Ebro en Xerta (Tarragona). Documento elaborado por URS España. [Information available on the Internet]
8. Confederación Hidrográfica del Ebro (2014). Inventario de presiones en la Cuenca del Ebro según la Directiva Marco del Agua. Documento elaborado por la Universidad de Zaragoza. [Information available on the Internet]
Guadalquivir River Basin District (Guadalquivir)
1. Confederación Hidrográfica del Guadalquivir (2015). Plan Hidrológico de la Demarcación Hidrográfica del Guadalquivir (2015 – 2021). [Information available on the Internet]
2. Confederación Hidrográfica del Guadalquivir (2015). Plan Hidrológico de la Demarcación Hidrográfica del Guadalquivir (2015 – 2021), Anejo 10: planes y programas relacionados. [Information available on the Internet]
3. Confederación Hidrográfica del Guadalquivir (2009). Pliego de bases de servicios para la realización de un estudio básico para la planificación de la mejora de las condiciones hidromorfológicas de los ríos en la Demarcación Hidrográfica del Guadalquivir, tt.m. varios, provincias varias. Documento elaborado por Ingeniería 75 s.a. [Information provided by request to Authority]
4. Confederación Hidrográfica del Guadalquivir (2010). Propuesta de Proyecto de Plan Hidrológico de la Demarcación Hidrográfica del Guadalquivir. Anejo 7: inventario de presiones. [Information available on the Internet]
5. Confederación Hidrográfica del Guadalquivir (2014). Distribución y estado de conservación de los peces dulceacuícolas del río Guadalquivir. Documento elaborado por la Universidad de Córdoba, la Liverpool John Moores University y la Universidad de Murcia. [Information available on the Internet]
6. Confederación Hidrográfica del Guadalquivir. Infraestructuras y políticas del agua y su relación con el territorio del Guadalquivir. Documento elaborado por
103

Laboratorio de Urbanismo y Ordenación del Territorio de la Universidad de Granada. [Information available on the Internet]
Tajo River Basin District (Tajo)
1. Confederación Hidrográfica del Tajo (2015). Realización de un plan para la mejora de la permeabilidad fluvial en la cuenca del Tajo. Documento elaborado por DENGA. [Information available on the Internet]
2. Confederación Hidrográfica del Tajo (2011). Inventario de infraestructuras en desuso en la cuenca del Tajo: diagnóstico para su posible eliminación y rehabilitación del domino hidráulico afectado. [Information available on the Internet]
3. Confederación Hidrográfica del Tajo (2009). Beneficios ambientales de la eliminación del azud de Hidroeléctrica del Viejas S.A en el río Viejas. T.M. Castañar de Ibor, Cáceres. Documento elaborado por AMBISAT Ingeniería Ambiental. [Information provided by request to Authority]
4. Confederación Hidrográfica del Tajo (2016). Caracterización y valoración de las poblaciones piscícolas en ejes del curso bajo de la cuenca del Tajo. Documento elaborado por CIMERA estudios aplicados s.l. [Information provided by request to Authority]
5. Confederación Hidrográfica del Tajo (2015). Diagnóstico para la evaluación del grado de permeabilidad a la ictiofauna migradora en barreras a la continuidad longitudinal. subcuenca del río Ibor. Documento elaborado por CIMERA estudios aplicados s.l. [Information provided by request to Authority]
6. Confederación Hidrográfica del Tajo (1999). Especies piscícolas presentes en la cuenca del río Tajo (tramo español). [Information provided by request to Authority]
7. Confederación Hidrográfica del Tajo (2016). Seguimiento del estado ecológico del río Cofio tras la demolición de la presa de Robledo de Chavela. Documento elaborado por ICTHIOS s.l. [Information provided by request to Authority]
Guadiana River Basin District (Guadiana)
1. Confederación Hidrográfica del Guadiana (2015). Plan Hidrológico de la parte española de la Demarcación Hidrográfica del Guadiana. [Information available on the Internet]
2. Confederación Hidrográfica del Guadiana (2015). Seguimiento de la permeabilidad de las escalas de peces en el tramo medio del río Guadiana. [Information available on the Internet]
104

Galicia-Coast River Basin District (Galicia-Coast)
1. Augas de Galicia (2014). Plan Hidrológico de la Demarcación Hidrográfica de Galicia-Costa 2015 – 2021, Anexo VI: inventario de presiones. [Information available on the Internet]
Miño-Sil River Basin District (Miño-Sil)
1. Confederación Hidrográfica del Miño-Sil (2015). Proyecto de plan hidrológico del ciclo 2015-2021, capítulo 3: descripción de usos y presiones. [Information available on the Internet]
2. Confederación Hidrográfica del Miño-Sil. Evaluación preliminar del riesgo de inundación (EPRI) e identificación de las áreas con riesgo potencial significativo de inundación (ARPSIS) del territorio español de la Demarcación Hidrográfica del Miño-Sil. [Information available on the Internet]
Júcar River Basin District (Júcar)
1. Confederación Hidrográfica del Júcar. Inventario de obstáculos en la cuenca del Júcar. [Information provided by request to Authority]
2. Confederación Hidrográfica del Júcar (2014). Plan Hidrológico de la Demarcación Hidrográfica del Júcar, anejo 7: inventario de presiones. [Information available on the Internet]
Segura River Basin District (Segura)
1. Confederación Hidrográfica del Segura (2012). Inventariado e identificación de obstáculos a la continuidad longitudinal del río Segura y sus afluentes. Análisis, propuesta y valoración de soluciones. Documento elaborado por INFRAECO s.l. [Information available on the Internet]
2. LIFE Segura Riverlink (2013-2017). www.chsegura.es/chs/cuenca/segurariverlink/riverlink/
3. Confederación Hidrográfica del Segura (2013). Plan Hidrológico de la cuenca del Segura 2009/2015. Anejo 7: inventario de presiones. [Information available on the Internet]
4. Confederación Hidrográfica del Segura (2014). Plan Hidrológico de la Demarcación del Segura (ciclo 2015-2021) y plan de gestión del riesgo de inundación. [Information available on the Internet]
105

5. Martínez Morales, I., Oliva Paterna, F. J., Verdiell Cubedo, D., & Torralva Forero, M. D. M. (2010). Inventario y estado de conservación de la fauna piscícola en la cuenca alta del río Segura (SE Península Ibérica). Anales de Biología 32: 47-58. [Information provided by request to Authority]
6. Castejón-Bueno, D., Torralva Forero, M., Verdiell Cubedo, D., Martínez Morales, I., Ruiz Navarro, A., & Oliva Paterna, F. J. (2011). Variación en la condición de Luciobarbus sclateri (Günther, 1868) (Cypriniformes; Cyprinidae) a lo largo de gradientes longitudinales de la cuenca del río Segura. Anales de Biologia 33: 41-52. [Information provided by request to Authority]
7. Oliva Paterna, F. J., Verdiell Cubedo, D., Ruiz Navarro, A., & Torralva Forero, M. D. M. (2014). La ictiofauna continental de la Cuenca del río Segura (SE Península Ibérica): décadas después de Mas (1986). Anales de Biología 36: 37-45. [Information provided by request to Authority]
Cantabrian River Basin District (Cantabrian)
1. Confederación Hidrográfica del Cantábrico (2011). Propuesta de proyecto del plan hidrológico de la Demarcación Hidrográfica del Cantábrico Occidental. Anejo VII: inventario de presiones. [Information available on the Internet]
2. Confederación Hidrográfica del Cantábrico (2011). Propuesta de proyecto del plan hidrológico de cuenca de la parte española de la Demarcación Hidrográfica del Cantábrico Oriental. Anejo VII: inventario de presiones. [Information available on the Internet]
3. Confederación Hidrográfica del Cantábrico (2015). Plan Hidrológico (revisión 2015-2021) Parte española de la Demarcación Hidrográfica del Cantábrico Oriental. Anejo X: recuperación de costes. [Information available on the Internet]
Andalusian River Basin District (Andalusian)
1. Consejería de Medio Ambiente y Ordenación del Territorio. Plan de Gestión de la Anguila en Andalucía (periodo 2015-2016). [Information provided by request to Authority]
2. Consejería de Medio Ambiente y Ordenación del Territorio. Programa de recuperación de las poblaciones de Trucha común en Andalucía (años 2004 y 2008). [Information provided by request to Authority]
3. Agencia Medio Ambiente y Agua de la Junta de Andalucía. Inventario de obstáculos en las cuencas andaluzas. [Information provided by request to Authority]
106

4. Junta de Andalucía, Consejería de Agricultura, Pesca y Medio Ambiente. Demarcación Hidrográfica del Guadalete y Barbate. [Information available on the Internet]
5. Junta de Andalucía, Consejería de Medio Ambiente y Ordenación del Territorio. Ciclo de Planificación Hidrológica 2015-2021. Demarcación Hidrográfica del Guadalete y Barbate. Anejo 7: inventario de presiones. [Information available on the Internet]
6. Junta de Andalucía, Consejería de Medio Ambiente y Ordenación del Territorio. Ciclo de Planificación Hidrológica 2015-2021. Demarcación Hidrográfica de las cuencas Mediterráneas Andaluzas. Anejo VII: inventario de presiones [Information available on the Internet]
7. Junta de Andalucía, Consejería de Agricultura, Pesca y Medio Ambiente. Demarcación Hidrográfica del Tinto, Odiel y Piedras. Anejo 7: inventario de presiones. [Information available on the Internet]
Canary Islands Water Agency (Canary Islands)
1. Consejo Insular de Aguas de Gran Canaria. Inventario de Presas. Volumen 1: grandes presas. presiones [Information available on the Internet]
2. Consejo Insular de Aguas de Gran Canaria. Inventario de Presas. Volumen 2: pequeñas presas. presiones [Information available on the Internet]
3. Consejo Insular de Aguas de Gran Canaria (2005). Presas de Gran Canaria. presiones [Information available on the Internet]
4. Consejo Insular de Aguas de Tenerife (2015). Plan Hidrológico de Tenerife. presiones [Information available on the Internet]
Balearic Islands Water Agency (appendix 1.15)
1. Conselleria d´Agricultura, Medi Ambient i Teritori. Plan hidrológico de las Illes Balears 2015-2021. Anexo 11: programa de actuación e infraestructuras PHIB 2015-2021. [Information available on the Internet]
107

General references
2013 report card for America's infrastructure - Dams: condition & capacity (2013). Reston (VA): American Society of Civil Engineers. http://www.infrastructurereportcard.org/a/ - p/dams/conditions-and-capacity
Alcamo, J., Ash, N.J., Butler, C.D., Callicott, J.B., Capistrano, D., Carpenter, S., Castilla, J.C., Chambers, R., Chopra, K., Cropper, A. and Daily, G.C., (2003). Ecosystems and human well-being: a framework for assessment. Island Press, Washington, USA, 266 pp.
Alonso Vizcaíno EM, Cortés Martín J, Garza Garrido R, Rodríguez Ruiz C (2008). Estudio sobre el desmantelamiento de la presa de la Hoz Seca (Alto Tajo). Final Master Degree dissertation.
American Rivers (2016). 62 dams removed to restore rivers in 2015. https://s3.amazonaws.com/american-rivers-website/wp-content/uploads/2016/02/02122410/DamsRemoved_1999-2015.pdf
Arrojo Agudo P, Bernal Cuenca E, Fernández Camuñas J & López Gracia, JM (1999). El análisis coste-beneficio y su vigencia relativa en la valoración de grandes proyectos hidráulicos. Universidad de Zaragoza.
Bachhofer, M., Wildenberg, M (2010). FCMappers, http://www.fcmappers.net
Boardman, AE, Greenberg, DH, Vining, AR, & Weimer, DL (2006). Cost-benefit analysis: concepts and practice (Vol. 3). Upper Saddle River, NJ: Prentice Hall.
Brufao Curiel P (2006). Demolición de presas y otras obras hidráulicas: herramienta indispensable para la restauración de nuestros ríos y humedales.
Boyd, J., & Banzhaf, S. (2007). What are ecosystem services? The need for standardized environmental accounting units. Ecological economics, 63(2), 616-626.
CorpsMap National Inventory of Dams (2013). Washington (DC): U.S. Army Corps of Engineers; http://nid.usace.army.mil/cm_apex/f?p=838:1:0::NO.
Costanza, R., & Folke, C. (1997). Valuing ecosystem services with efficiency, fairness and sustainability as goals. Nature’s services: Societal dependence on natural ecosystems, 49-70.
Daily, G. C., Matson, P. A., & Vitousek, P. M. (1997). Ecosystem services supplied by soil. Nature’s services: societal dependence on natural ecosystems, 113-132.
108

Dudgeon, D., Arthington, A. H., Gessner, M. O., Kawabata, Z. I., Knowler, D. J., Lévêque, C., Naiman, R.J., Prieur-Richard, A-H., Soto, D., Stiassny, M.L.J., & Sullivan, C. A. (2006). Freshwater biodiversity: importance, threats, status and conservation challenges. Biological reviews, 81(2), 163-182.
Fisher, B., Turner, R. K., & Morling, P. (2009). Defining and classifying ecosystem services for decision making. Ecological economics, 68(3), 643-653.
Gough P, Philipsen P, Schollema PP, & Wanningen H (2012) From sea to source: International guidance for the restoration of fish migration highways. Regional Water Authority Hunze en Aa´s. The Netherlands.
Headwaters Economics (2016). Dam removal: case studies on the Fiscal, Economic, Social and Environmental benefits of dam removal.
Industrial Economics Inc. (2015). Economic & Community Benefits from Stream Barrier Removal Projects in Massachusetts (MA). Massachusetts Department of Fish and Game, Division of Ecological Restoration. Kosko, B (1987). Adaptive inference in fuzzy knowledge networks. In: Proceedings of the First IEEE International Conference on Neural Networks (ICNN-86), San Diego, CA, pp. 261-268. Millennium Ecosystem Assessment (2005). Millennium Ecosystem Assessment. Ecosystems and Human Well-Being: Biodiversity Synthesis, Published by World Resources Institute, Washington, DC.
Ministerio de Medio Ambiente y Medio Rural y Marino (2010). Restauración de ríos. Bases de la Estrategia Nacional de Restauración de Ríos.
Ministry of Agriculture, Food and Environment MAGRAMA (2012). Informe de situación de la Estrategia Nacional de Restauración de Ríos.
Özesmi, U., & Özesmi, S.L (2003). A participatory approach to ecosystem conservation: Fuzzy cognitive maps and stakeholder analysis in Uluabat Lake, Turkey. Environ. Manage. 31(4), 518-531.
Özesmi, U., & Özesmi, S.L (2004). Ecological Models based on People’s Knowledge: A Multi-Step Fuzzy Cognitive Mapping Approach. Ecol. Model. 176, 43-64.
Papageorgiou, E.I., Markinos, A., & Gemtos, T (2009). Application of fuzzy cognitive maps for cotton yield management in precision farming. Expert Syst. Appl. 36 (10), 12399-12413.
Papageorgiou, E.I., & Kontogianni, A (2012). Using Fuzzy Cognitive Mapping in Environmental Decision Making and Management: A Methodological Primer and an
109

Application, International Perspectives on Global Environmental Change. Dr. Stephen Young (Ed.), InTech
Park, K.S., & Kim, S.H (1995). Fuzzy Cognitive Maps considering time relationships. Int. J. Hum.-Comput. Stud. 42, 157-168.
Perni A., & Martínez-Paz JM (2012). Valoración económica de los beneficios ambientales de la recuperación del río segura (España). Semestre Económico, 15(32), 15-40.
Stanley EH, & Doyle, MW (2003). Trading off: the ecological effects of dam removal. Frontiers in Ecology and the Environment, 1(1), 15-22.
Vidal-Abarca MR & Suárez ML (2013). Which are, what is their status and what can we expect from ecosystem services provided by Spanish rivers and riparian areas? Biodiversity and conservation, 22(11), 2469-2503.
Ward JV (1989) The four-dimensional nature of the lotic ecosystem. Journal of the North American Benthological Society 8:2–8
Wegner, G., & Pascual, U. (2011). Cost-benefit analysis in the context of ecosystem services for human well-being: A multidisciplinary critique. Global Environmental Change, 21(2), 492-504.
110

Appendix
Maps
General maps
River Basin District maps
111


![La Confederación del Ebro - · PDF file—el llamado pantano del Ebro, ... MAYO-ACOSTO 1959] LA CONFEDEBACJON DEL EBBO 539 Al quedar abrumado por la responsabilidad que sobre mí](https://img.pdfslide.net/doc/110x75/5a787fb97f8b9a7b698befd3/la-confederacin-del-ebro-el-llamado-pantano-del-ebro-mayo-acosto-1959.jpg)