Embed Size (px)
Citation preview

South African Journal of Education
Copyright © 2010 EASA
Vol 30:571-590
An analysis of the alignment of the Grade 12 Physical Sciencesexamination and the core curriculum in South Africa
Nazeem [email protected]
I report on an analysis of the alignment between the South African Grade 12
Physical Sciences core curriculum content and the exemplar papers of 2008, and
the final examination papers of 2008 and 2009. A two-dimensional table was
used for both the curriculum and the examination in order to calculate the Porter
alignment index, which indicates the degree of match between the two.
Alignment indices of 0.8 and 0.6 for Physics and Chemistry, respectively, were
computed and remained constant for Physics, but fluctuated initially for Chemis-
try before levelling off. Using the revised Bloom’s taxonomy, discrepancies were
found in terms of cognitive levels as well as content areas in both Physics and
Chemistry. The cognitive level Remember is under-represented in the Chemistry
and Physics examinations, whereas the cognitive levels Understand and Apply
were over-represented in Chemistry. It is argued that the shift to higher cognitive
levels is in line with the reported increase in cognitive complexity of the Physical
Sciences curriculum. The significance of the study for Physical Science teachers
is highlighted, and the potential for further research is also indicated.
Keywords: alignment; assessment; Chemistry; cognitive level; curriculum
content; Physics; revised Bloom’s taxonomy
IntroductionSouth African Grade 12 learners wrote their National Senior Certificate (NSC)examination based on the outcomes-based education (OBE) system for thefirst time in November 2008. This was also the first time that a nationally setpublic examination was written in all subjects. Only 62.5% of all the candi-dates obtained their NSC at the first attempt, while the results of the 2009cohort of learners showed a decline to 60.6% (DoBE, 2010:41). The new cur-riculum is designed to embody the values, knowledge and skills envisaged inthe constitution of the new democratic South Africa. It provides learners withthe opportunity to perform at the maximum level of their potential andfocuses on high levels of knowledge and skills, while promoting positive valuesand attitudes (DoE, 2008a:2).
The introduction of OBE in South Africa was intended to redress thelegacy of apartheid by promoting the development of skills throughout theschool-leaving population in order to prepare South Africa’s workforce forparticipation in an increasingly competitive global economy (Le Grange, 2007:79). The move towards standards-based assessment practices internationallyhas been incorporated into the OBE system in South Africa, with learningoutcomes and assessment standards being specified for each school subject.The adoption of a radical change of policy on the curriculum was contestedand underwent a review in 2000. The current curriculum for Grades R to 9
572 Edwards
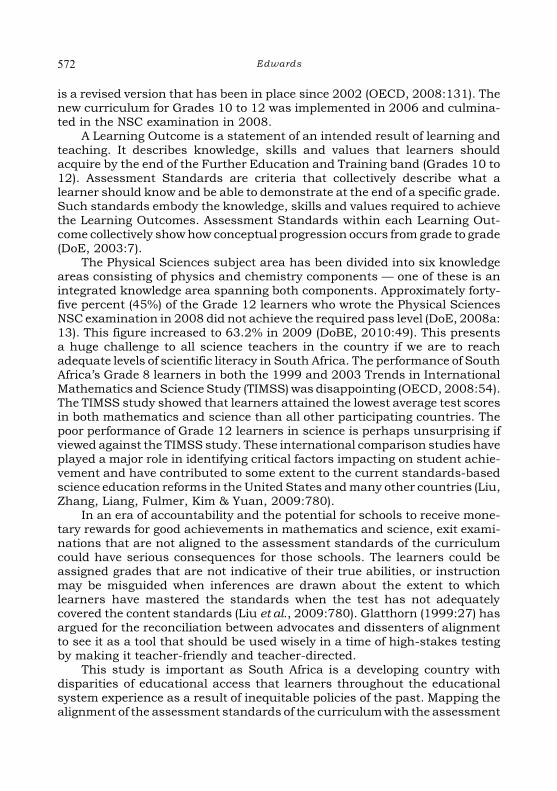
is a revised version that has been in place since 2002 (OECD, 2008:131). Thenew curriculum for Grades 10 to 12 was implemented in 2006 and culmina-ted in the NSC examination in 2008.
A Learning Outcome is a statement of an intended result of learning andteaching. It describes knowledge, skills and values that learners shouldacquire by the end of the Further Education and Training band (Grades 10 to12). Assessment Standards are criteria that collectively describe what alearner should know and be able to demonstrate at the end of a specific grade.Such standards embody the knowledge, skills and values required to achievethe Learning Outcomes. Assessment Standards within each Learning Out-come collectively show how conceptual progression occurs from grade to grade(DoE, 2003:7).
The Physical Sciences subject area has been divided into six knowledgeareas consisting of physics and chemistry components — one of these is anintegrated knowledge area spanning both components. Approximately forty-five percent (45%) of the Grade 12 learners who wrote the Physical SciencesNSC examination in 2008 did not achieve the required pass level (DoE, 2008a:13). This figure increased to 63.2% in 2009 (DoBE, 2010:49). This presentsa huge challenge to all science teachers in the country if we are to reachadequate levels of scientific literacy in South Africa. The performance of SouthAfrica’s Grade 8 learners in both the 1999 and 2003 Trends in InternationalMathematics and Science Study (TIMSS) was disappointing (OECD, 2008:54).The TIMSS study showed that learners attained the lowest average test scoresin both mathematics and science than all other participating countries. Thepoor performance of Grade 12 learners in science is perhaps unsurprising ifviewed against the TIMSS study. These international comparison studies haveplayed a major role in identifying critical factors impacting on student achie-vement and have contributed to some extent to the current standards-basedscience education reforms in the United States and many other countries (Liu,Zhang, Liang, Fulmer, Kim & Yuan, 2009:780).
In an era of accountability and the potential for schools to receive mone-tary rewards for good achievements in mathematics and science, exit exami-nations that are not aligned to the assessment standards of the curriculumcould have serious consequences for those schools. The learners could beassigned grades that are not indicative of their true abilities, or instructionmay be misguided when inferences are drawn about the extent to whichlearners have mastered the standards when the test has not adequatelycovered the content standards (Liu et al., 2009:780). Glatthorn (1999:27) hasargued for the reconciliation between advocates and dissenters of alignmentto see it as a tool that should be used wisely in a time of high-stakes testingby making it teacher-friendly and teacher-directed.
This study is important as South Africa is a developing country withdisparities of educational access that learners throughout the educationalsystem experience as a result of inequitable policies of the past. Mapping thealignment of the assessment standards of the curriculum with the assessment
573Physical sciences examination
in the Grade 12 Physical Sciences exit examination could provide examinerswith a tool with which to look at shortcomings of the examination questionpapers or the assessment standards. Herman and Webb (2007:3) argued thatit is only when assessment is aligned with both standards and classroominstruction that assessment results can provide sound information about bothhow well learners are doing and how well schools and their teachers are doingin helping students to attain the standards. Olson (2003:2) underscores thispoint by stating that “when a test is used to measure the achievement of cur-riculum standards, it is essential to evaluate and document both the rele-vance of a test to the standards and the extent to which it represents thosestandards. Studies of alignment measure the match, or the quality of therelationship, between a state’s standards and its tests. That match can beimproved by changing the standards, the tests, or both.”
Curriculum change in South AfricaChanges in the educational system in South Africa have been driven by con-stitutional imperatives and were characterised by policy changes influencedby international perspectives and global economic trends (OECD, 2008:75).Curriculum policy changes were followed by an implementation phase andcurrently revisions are taking place to address problems that have arisen.Curriculum 2005 (C2005) was launched in 1997 and was informed by princi-ples of OBE as the foundation of the post-apartheid schools’ curriculum(Chisholm, 2005:193). C2005 was revised and in 2002 the Revised NationalCurriculum Statement (RNCS) became policy to be implemented in 2004, andculminated in the phasing in of the National Curriculum Statement (NCS) inGrade 12 in 2008 (OECD, 2008:81). The DoE also published content frame-works in each subject as well as work schedules and subject assessmentguidelines in response to Grade 10 to 12 teachers’ concerns about the contentto be taught (ibid., p.177). Rogan (2007:457) has argued that it is not enoughto merely publish a new curriculum and assessment standards, particularlyin a developing country. Detailed attention must be given in terms of howthings will unfold in practice.
Green and Naidoo (2006:79) studied the content of the Physical SciencesNCS and found that:• It reconceptualises valid science knowledge.• It values the academic, utilitarian and social-reconstructionist purpose
of science.• It is based on a range of competences, from the metacognitive level
through to the simple level.• There is a shift to greater competence complexity, and thus to
corresponding higher expectations for teachers and learners.The introduction of OBE in South Africa purportedly brought about a moveaway from norm-referenced testing to criterion-referenced testing. Less em-phasis on summative assessment practices (assessment of learning) to moreformative assessment (assessment for learning) was envisaged. In reality the

574 Edwards
final examination in Grade 12 constitutes 75% of the pass requirement inmost subjects and thus represents a summative assessment. Baker, Freemanand Clayton (1991) contended that the underlying assumptions regarding theassessments, such as norm-referenced tests and normally distributed achie-vement, can result in misalignment with standards that are targeted for allstudents (cited by Webb, 1999:1).
Alignment StudiesAlignment studies are important in the context of a changed curriculum asit may give an indication of the reform efforts when the assessment results arepublished. Schools also use the performance results to reflect on areas thatneed improvement. If there is no alignment between what is taught as spe-cified in the curriculum and what is tested, then schools may well teach to thetest and ignore the desired assessment standards. On the other hand ifschools teach according to the desired assessment standards and the testsare not aligned, it may well give a false impression of the students’ perfor-mance relative to those tests. The negative impact on remedial action is greatbecause the real cause of the problem may not be addressed. La Marca (2001:1) maintained that it is unlikely that perfect alignment between the test andcontent standards will occur and this is sufficient reason to have multipleaccountability measures. In supporting alignment measures he concludesthat “it would be a disservice to students and schools to judge achievementof academic expectations based on a poorly aligned system of assessment”.
Alignment in the literature has been defined as the degree to whichstandards and assessments are in agreement and serve in conjunction withone another to guide the system towards students learning what they areexpected to know and do (Webb, 1999:2). The emphasis is on the quality ofthe relationship between the two. A team of reviewers analysed the degree ofalignment of assessments and standards in mathematics and science fromfour states in the United States using four criteria: categorical concurrence(or content consistency), depth-of-knowledge consistency (or cognitive de-mands), range-of-knowledge correspondence (or content coverage), and ba-lance of representation (or distribution of test items). The alignment wasfound to vary across grade levels, content areas and states without any dis-cernable pattern (Webb, 1999:vii). The study developed a valid and reliableprocess for analysing the alignment between standards and assessments.
Systematic studies of alignment based on Webb’s procedures have beencompleted across many states in the United States (Bhola, Impara & Bucken-dahl, 2003; Olson, 2003; Porter, 2002; Porter, Smithson, Blank & Zeidner,2007; Webb, 1997; 2007). Essentially it involves panels of subject expertsanalysing assessment items against a matrix comprising a subject area do-main and levels of cognitive demand. Martone and Sireci (2009:1337) reviewedthree methods for evaluating alignment — the Webb, Achieve, and Surveys ofEnacted Curriculum (SEC) methods. They focused on the use of alignmentmethodologies to facilitate strong links between curriculum standards, in-
575Physical sciences examination
struction, and assessment. The authors conclude that all three methods startwith the evaluation of the content cognitive complexity of standards andassessments with the SEC methodology including an instructional com-ponent. The latter method is useful to understand both the content andcognitive emphases whereas the Webb and Achieve methods help to betterunderstand the breadth and range of comparison between the standards andassessment (ibid., p.1356).
Porter, Smithson, Blank and Zeidner (2007:28) have shown that severalresearchers have modified Webb’s procedures to measure alignment. Theyoutline a quantitative index of alignment, which is a two-dimensional lan-guage for describing content. The one dimension is topics and the othercognitive demand. The two content dimensions are analysed by experts in thesubject field. The cognitive demand was categorized into five levels, rangingfrom the lowest to the highest: memorize (A), perform procedures (B), com-municate understanding (C), solve non-routine problems (D), and conjecture/generalize/prove (E). An alignment index is produced by comparing the levelof agreement in cell values of the two matrices, both of which were standar-dized by converting all cell values into proportions of the grand total (Liang &Yuan, 2008:1825). Porter (2002:10) also contended that content analysis toolsprovide information that may be useful in developing more powerful pro-grammes for teacher professional development. The proposed continuingprofessional development of in-service teachers in South Africa could poten-tially benefit from an analysis of alignment of the curriculum and examina-tions. Areas of over- or under-representation either way could be addressed.
Purpose of the studyFollowing the recommendations of Liang and Yuan (2008:1824) that interna-tional studies be done of different countries’ curriculum standards andassessment systems, in this paper I analyse the extent to which the Grade 12Physical Sciences exemplars of 2008 (DoE, 2008c) and the examinationpapers of 2008 (DoE, 2008d) and 2009 (DoE, 2009) are aligned with the coreknowledge and concepts embodied in the NCS for Physical Sciences (DoE,2003). The DoE published exemplar papers in 2008 to give an idea of whatstandard and format learners can expect in the final examination. Thisinitiative followed widespread concern that the Grade 12 learners would notbe adequately prepared for the final examination in 2008.
In this study the following research questions and sub-questions areinvestigated:(a) What is the overall alignment between the Physical Sciences core
curriculum and the Grade 12 national Physics and Chemistryexamination?i. How does the alignment between the Chemistry and Physics
examination differ?ii. How does the alignment of the exemplars of 2008 differ from the
final examination of 2008 and 2009?(b) How do the Chemistry and Physics examinations differ from the core

576 Edwards
curriculum in terms of cognitive levels?(c) How do the Chemistry and Physics examinations differ from the core
curriculum in terms of content areas?
MethodThis study employs document analysis as a research method as it involves asystematic and critical examination, rather than a mere description, of aninstructional document such as the National Curriculum Statement (IAR,2010:1). Document analysis is an analytical method that is used in qualitativeresearch to gain an understanding of the trends and patterns that emergefrom the data. Creswell and Plano Clark (2007:114) have argued that theresearcher must determine the source of data that will best answer the re-search question or hypotheses by considering what types of data are possible.Merriam (1988) also pointed out that “documents of all types can help theresearcher uncover meaning, develop understanding, and discover insightsrelevant to the research problem” (cited by Bowen, 2009:29). The justificationfor using document analysis also stems from its efficiency in terms of time,accessibility within the public domain and cost effectiveness (ibid., p.31).
A slightly modified version of Porter’s method is used to analyse the coreknowledge and concepts of the curriculum by employing a revised Bloom’staxonomy (RBT) which includes the cognitive level categories Remember,Understand, Apply, Analyse, Evaluate and Create (Liang & Yuan, 2008:1826).To facilitate the process, keywords were used to classify items and learningoutcomes into the different cognitive levels. This was done for the curriculumas well as all the question papers in Chemistry and Physics.
Rationale for using the revised Bloom’s taxonomyThe use of the RBT, which is a two-dimensional table, was a move away fromthe restrictive hierarchical original taxonomy. The notion of a cumulativehierarchy has been removed so that a student may use a higher-order cog-nitive skill without a lower-order one (Anderson, 2005:106). For example, astudent may be applying a law (say Newton’s first law) without necessarilyunderstanding the law. The cognitive complexity at a lower level may begreater than at a higher level. These points are emphasised by Krathwohl(2002:215) when he states:
However, because the revision gives much greater weight to teacherusage, the requirement of a strict hierarchy has been relaxed to allow thecategories to overlap one another. This is most clearly illustrated in thecase of the category Understand. Because its scope has been considerablybroadened over Comprehend in the original framework, some cognitiveprocesses associated with Understand (e.g. Explaining) are more cogni-tively complex than at least one of the cognitive processes associated withApply (e.g. Executing).
Mayer (2002:226) posited the idea that the revised taxonomy is aimed atbroadening the range of cognitive processes so that meaningful learning can

577Physical sciences examination
occur. This can be achieved by not only promoting retention of material buttransfer as well which entails the ability to use what was learned to solve newproblems. This is particularly relevant in Physics where the learner must solveproblems that they have not encountered before by applying their priorknowledge. Näsström (2009:40) has also shown that the revised taxonomy isuseful as a categorisation tool of the standards for the following reasons:1. It is designed for analysing and developing standards, teaching and as-
sessment as well as of emphasising alignment among these main compo-nents of an educational system.
2. It has general stated content categories which allow comparisons of stan-dards from different subjects.
3. In a study where standards in chemistry were categorised with two differ-ent types of models, Bloom’s revised taxonomy was found to interpret thestandards more unambiguously than a model with topics-based cate-gories.
This particular alignment study focuses on the range of competences percontent area within Physical Sciences using the RBT. The two-dimensionalstructure of the RBT allows for teachers to increase the cognitive complexityof their teaching which may lead to meaningful learning (Amer, 2006:224-225).
Data collection proceduresAnalysis of core knowledge and concepts in Physical SciencesIn South Africa the NCS for Physical Sciences (Grades 10–12) has been divi-ded into six core knowledge areas: • two with a chemistry focus — Systems; Change;• three with a physics focus — Mechanics; Waves, Sound and Light;
Electricity and Magnetism; and• one with an integrated focus — Matter and Materials. (DoE, 2003:11)A Physical Sciences content document was published in 2006 to give depthto the NCS (DoE, 2006). Table 1 is an extract from this document whichshows that column one corresponds to the NCS and column two gives thedepth to the concepts.
The Physical Sciences Grade 12 examination guidelines give specificdetails regarding the themes to be tested in each of the knowledge areas (DoE,2008b:14). It outlines the format of the question papers in Chemistry andPhysics, knowledge that is required from content in Grades 10 and 11 and thecore content that will be assessed in the final examination. The latter corres-ponds to the first two columns which show the core knowledge and conceptsin Table 1. There are 32 themes in Physics including force, momentum, pro-jectile motion, work, energy, power, Doppler Effect, electrostatics, electric cir-cuits, optical phenomena, etc. Chemistry has 20 themes including organicchemistry, electrochemistry, rates of reactions, chemical industries, etc.
The themes for Physics and Chemistry resulted in a 32 × 6 table and a 20× 6 table, respectively, for the core knowledge and the 6 cognitive levels within

578 Edwards
Table 1 An example of the Grade 12 core knowledge and concepts
The learner is able to state, explain, interpret and evaluate scientific and
technological knowledge and can apply it in everyday contexts.
Constructing and Applying Scientific Knowledge
Note: The core concepts to be learned are included under the underlined
theme and form a coherent whole.
Core knowledge
and concepts as
in the NCS for the
Physical Sciences
Core knowledge
and concepts
proposed for
2008 - 2010
Core knowledge
and concepts
proposed for the
full implemen-
tation of the NCS.
To be updated
before implemen-
tation.
Comment and
links
MECHANICS 12,5%
Motion in two
dimensions:
Learners must be
able to,
Learners must be
able to,
Projectile motion
represented in
words, diagrams,
equations and
graphs;
for vertical
projectile motion
(near the surface
of the Earth if air
friction is ignored)
Explain that
projectiles fall
freely with
gravitational
acceleration ‘g’
for two dimen-
sional projectile
motion (near the
surface of the
Earth if air
friction is ignored)
calculate the
horizontal and
vertical compo-
nents of a projec-
tile launched at
an angle, è, to the
horizontal
Link to Grade 10
motion in one
dimension.
Link to Grade 11
Newton’s second
Law and the Law
of Universal
Gravitation
Source: Department of Education, 2006:83.
the revised Bloom’s taxonomy. The themes were then collapsed into the know-ledge areas for ease of comparison with the examination later. The examina-tion does not necessarily include all the themes, but all the knowledge areasare covered. Liu et al. (2009:782) motivated similarly in their study that “inorder for standardised tests to properly guide instruction, it was necessary tofocus attention on broader topics or big ideas instead of isolated and specifictopics”. Two coders with a combined experience of more than 30 years inteaching Physical Sciences independently classified the curriculum contentusing the tables to achieve an inter-coder reliability of 0.97 and 0.98 forPhysics and Chemistry, respectively. These relatively high coefficients can beascribed to the use of the keywords to classify the curriculum content. The

579Physical sciences examination
assessment statements (“the learner must be able to ...”) were unambiguousand straightforward to classify. The differences were resolved through discus-sion.
Analysis of the Chemistry and Physics exemplar and examinationIn 2008 the DoE published exemplars and preparatory examination papersfor many subjects in anticipation of the final examination in November. In thisarticle the Chemistry and Physics examination papers of the exemplar of 2008and the final examinations of 2008 and 2009 have been analysed. Eachexamination paper is worth 150 marks and together they contribute 75% ofthe pass mark in the subject. A variety of questions including multiple-choicequestions, one-word answers, matching items, true-false items and problem-solving questions were included. The same two coders analysed the examina-tions along with the marking memoranda using a matrix identical to the oneused for the core curriculum. An average inter-coder reliability of 0.88 and0.92 for the Physics and Chemistry examination respectively was obtained.Differences were again resolved through discussion.
Calculating the Porter alignment indexThe cell values in the curriculum table and examination table are standardi-sed to make them comparable, that is, converted into ratios totalling to 1 (Liuet al., 2009:781). The Porter alignment index is defined as:
where n is the total number of cells in the table and i refers to a specific tablecell, ranging from 1 to n. For example, for a 3 × 4 table, there are 12 cells,thus n = 12. Xi refers to the ith cell of Table X (e.g. the standardized test table)and Yi refers to the corresponding cell (ith cell) in Table Y (e.g. the contentstandard table). Both Xi and Yi are ratios with a value from 0 to 1. The sum
n n1 1of X to X is equal to 1, so is the sum of Y to Y . The discrepancy betweenthe ith cells of the test table and the standard table can be calculated as
.
The total absolute discrepancy is then calculated by summing the absolutediscrepancies over all cells (Liu et al., 2009:781-782).
The values of the Porter alignment index ranges from 0 to 1, which indi-cates no alignment or perfect alignment respectively (Liang & Yuan, 2008:1829). The alignment indices as well as the discrepancies between correspon-ding cells, by cognitive levels and knowledge area, were all computed usingMicrosoft Excel. Liu and Fulmer (2008:375) have also argued that Porter’salignment model has two advantages over other models: (a) it adopts acommon language to describe curriculum, instruction and assessment; and(b) it produces a single number as the alignment index.
580 Edwards
Table 2 Grade 12 Physics curriculum — core knowledge and concepts
Remember Understand Apply Analyse Evaluate Create Sub-total
MECHANICS
WAVES, SOUND & LIGHT
ELECTRICITY & MAGNETISM
MATTER & MATERIALS
Sub-total
17
12
21
6
56
(38.9% )
8
10
16
9
43
(29.9% )
14
5
18
1
38
(26.4% )
0
1
3
2
6
(4.2% )
0
0
0
1
1
(0.7% )
0
0
0
0
0
(0% )
39 (27.1% )
28 (19.4% )
58 (40.3% )
19 (13.2% )
144 (100% )
Table 3 Grade 12 Chemistry curriculum — core knowledge and concepts
Remember Understand Apply Analyse Evaluate Create Sub-total
MATTER & MATERIALS
CHEMICAL CHANGE
CHEMICAL SYSTEMS
Sub-total
5
22
12
39
(48.8% )
2
20
8
30
(37.5% )
1
6
1
8
(10% )
0
0
2
2
(2.5% )
0
0
1
1
(1.2% )
0
0
0
0
(0% )
8 (10% )
48 (60% )
24 (30% )
80 (100% )
581Physical sciences examination
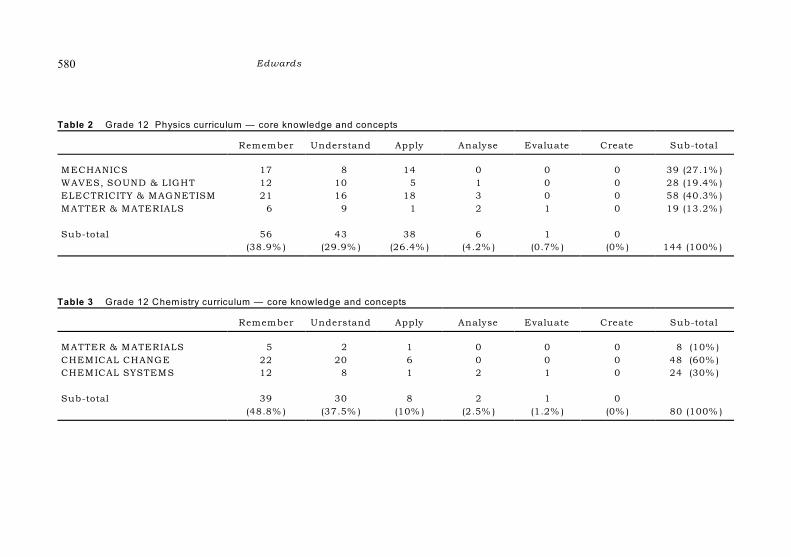
ResultsA. Core knowledge and concepts in Physical SciencesTable 2 presents the core knowledge and concepts of the Grade 12 Physicscurriculum according to knowledge themes and cognitive levels within therevised Bloom’s taxonomy. Within the cognitive level categories Rememberconstitutes the largest proportion (38.9%), followed by Understand (29.9%)and Apply (26.4%). The last three categories have by far the lowest percen-tages as is evident from the table. The knowledge area Electricity and Magne-tism contributes 40.3% of the total cognitive categories while Mechanicsmakes up 27.1%. The knowledge theme that spans both Physics and Che-mistry (i.e. Matter & Materials) contributes 13.2% of the total.
Table 3 presents the core knowledge and concepts of the Grade 12 Che-mistry curriculum according to knowledge themes and cognitive levels. Thecognitive level Remember again has the greatest emphasis (48.8%) comparedwith Understand (29.9%). Apply contributes 26.4% with the other three cog-nitive levels making insignificant contributions.
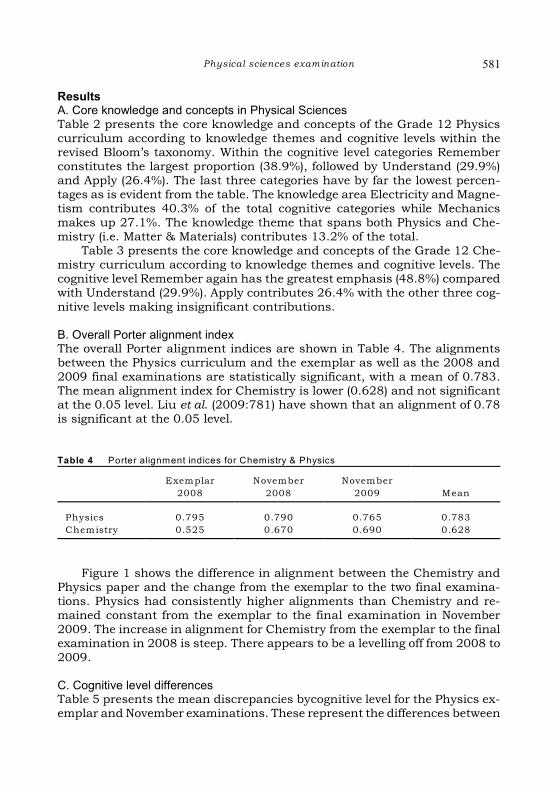
B. Overall Porter alignment indexThe overall Porter alignment indices are shown in Table 4. The alignmentsbetween the Physics curriculum and the exemplar as well as the 2008 and2009 final examinations are statistically significant, with a mean of 0.783.The mean alignment index for Chemistry is lower (0.628) and not significantat the 0.05 level. Liu et al. (2009:781) have shown that an alignment of 0.78is significant at the 0.05 level.
Table 4 Porter alignment indices for Chemistry & Physics
Exemplar
2008
November
2008
November
2009 Mean
Physics
Chemistry
0.795
0.525
0.790
0.670
0.765
0.690
0.783
0.628
Figure 1 shows the difference in alignment between the Chemistry andPhysics paper and the change from the exemplar to the two final examina-tions. Physics had consistently higher alignments than Chemistry and re-mained constant from the exemplar to the final examination in November2009. The increase in alignment for Chemistry from the exemplar to the finalexamination in 2008 is steep. There appears to be a levelling off from 2008 to2009.
C. Cognitive level differencesTable 5 presents the mean discrepancies bycognitive level for the Physics ex-emplar and November examinations. These represent the differences between

582 Edwards
the ratios in the curriculum table and the examination table. Negative num-bers indicate that the curriculum is under-represented. The discrepanciesranged from +0.8% (Understand, Apply, Analyse) to –3% (Remember) for theExemplar; from +0.8% (Understand & Analyse) to –3.3% (Remember) for theNovember 2008 examination; and ranged from –0.3% (Evaluate) to –3%(Remember) for the November 2009 examination. The largest discrepancy isin the Remember category for all three examinations. There appears to be nooverall discrepancy in terms of cognitive complexity amongst the three exami-nations.
Table 6 presents the cognitive-level differences in Chemistry. Rememberas a cognitive level is again under-represented (–6.6%), while the Apply levelis over-emphasised (+2.9%). The cognitive level Evaluate is also over-empha-sised (+1.1%).
The discrepancies within the Exemplar ranges from +0.7% (Create) to–8.7% (Remember); within the November 2008 examination it ranges from–0.3% (Analyse & Evaluate) to –6% (Remember); and it ranges from –0.3%(Analyse & Evaluate) to –5% (Remember) for the November 2009 examination.The exemplar and two final examinations across all levels only marginallyunder-represent the curriculum in terms of cognitive demand.
Figure 2 graphically illustrates how the curriculum in Physics is under-represented in the Remember category, but over-represented in almost all theother categories.
Figure 1 Graph of Porter alignment indices for Chemistry and Physics

583Physical sciences examination
Table 5 Mean discrepancies by cognitive level, with direction, for Physics examination
Remember Understand Apply Analyse Evaluate Create Mean
Exemplar 2008
November 2008
November 2009
Mean
–0.030
–0.033
–0.030
–0.031
0.008
0.008
–0.008
0.003
0.008
0.020
0.023
0.017
0.008
0.008
0.015
0.010
0.010
–0.003
–0.003
0.002
0.000
0.000
0.000
0.000
0.000
0.000
0.000
Table 6 Mean discrepancies by cognitive level, with direction, for Chemistry examination
Remember Understand Apply Analyse Evaluate Create Mean
Exemplar 2008
November 2008
November 2009
Mean
–0.087
–0.060
–0.050
–0.066
–0.037
0.040
0.027
0.010
0.043
0.020
0.023
0.029
0.023
–0.003
–0.003
0.006
0.040
–0.003
–0.003
0.011
0.007
0.000
0.000
0.002
–0.002
–0.001
–0.001

584 Edwards
The same scenario obtains when looking at Figure 3 which presents agraph of the discrepancies in Chemistry. The Remember cognitive level isagain under-emphasised, while in most of the other categories there is anover-emphasis.
Figure 2 Graph of mean discrepancies by cognitive level, with direction,for Physics examination
Figure 3 Graph of mean discrepancies by cognitive level, with direction,for Chemistry examination

585Physical sciences examination
D. Discrepancies by content areas Table 7 shows the discrepancies by content areas for the Physics examina-tions, while Figure 4 illustrates this graphically. In Mechanics the biggestdiscrepancy was +1.3% for the November 2008 examination while in theNovember 2009 examination it was marginally under-represented. Theknowledge area Waves, Sound and Light had a discrepancy of +1.8% in theNovember 2009 examination. Electricity and Magnetism was slightly under-represented in both the final examinations. Marginal under-representationalso occurred in the Matter and Materials knowledge area in all three Physicspapers.
Table 7 Discrepancies by content areas, with direction, for Physics examination
Mechanics
Waves, Sound
& Light
Electricity &
Magnetism
Matter &
Materials Mean
Exemplar 2008
November 2008
November 2009
Mean
–0.007
0.013
–0.002
0.001
0.000
0.002
0.018
0.007
0.010
–0.013
–0.015
–0.006
–0.002
–0.002
–0.003
–0.002
0.003
–0.004
0.000
Table 8 presents the discrepancies by content areas for Chemistry. In theknowledge area Matter and Materials there is an over-emphasis (mean =+4.3%) in all the examination papers. Chemical Change and ChemicalSystems are both under-represented (mean = –2.3%) in all the Chemistryexamination papers. Figure 5 graphically shows this under-representation forChemical Change and Chemical Systems.
Figure 4 Graph of discrepancies by content areas, with direction,for Physics examination

586 Edwards
Table 8 Discrepancies by content areas, with direction, for Chemistry examination
Matter &
Materials
Chemical
Change
Chemical
Systems Mean
Exemplar 2008
November 2008
November 2009
Mean
0.03
0.05
0.05
0.043
–0.02
–0.02
–0.03
–0.023
–0.02
–0.03
–0.02
–0.023
–0.003
0.000
0.000
Discussion and implicationsThe classification of the core curriculum content in this paper has beenrelatively straightforward in that verbs are used to describe what a learnermust be able to do. By using a list of keywords in each cognitive level, it is amatter of classifying according to the verb. Hence, the relatively high inter-rater correlations achieved by the coders can be understood, and any differ-ences are minor and easily resolved through discussion. Classifying the ex-emplar and examination items for Physics and Chemistry is a more tediousprocess. Having experienced teachers also helped to achieve good inter-ratercorrelations. Differences of opinion do arise and so the resolution throughdiscussion takes much longer.
The Porter alignment indices for Physics and Chemistry have been shownto be about 0.8 and 0.6, respectively. This is similar to what Liu and Fulmer(2008:379) found in their study. There is little variation in Physics and aninitial fluctuation in the index for Chemistry which then becomes constant
Figure 5 Graph of discrepancies by content areas, with direction,for Chemistry examination

587Physical sciences examination
between the final examinations. The Physics alignment index is also con-sistently higher than the Chemistry alignment index. The degree of alignmentdepends on the table matrix, because it would be more difficult to find exactmatching in the corresponding cells if the table is larger, but having morespecific categories helps. The tables that are used for Physics and Chemistryhave specific themes under each knowledge area, which also helped with thecoding of items. An insignificant alignment index is not necessarily a badthing if this is due to the examination including more cognitively demandingitems. There has been a differentiated impact of testing on teaching due to therelative emphases of the topics and cognitive demands (Liu et al., 2009:792).Teachers may use the items to adopt more student-centred pedagogies or theywill use it to drive their lessons in a teacher-centred way.
The adoption of a two-dimensional table to calculate the Porter alignmentindex is in line with the revised Bloom’s taxonomy. This allows for a non-hierarchical approach so that cognitive complexity can occur across levels.Science concepts may be mastered at different cognitive levels, but recall(Remember) is essential for problem-solving since it taps into long-termmemory. The higher-order cognitive levels promote transfer of knowledge asopposed to formulaic methods where learners are adept at substitutingnumbers into formulae. This study has found that the Remember categorywas under-emphasised in the exemplar and final examinations for bothPhysics and Chemistry. In the Physics final examinations of 2008 and 2009,Apply as a cognitive level is over-represented. This could simply be an in-dication that there is a shift away from simple recall to more demanding skillsin Physics. The final examinations of 2008 and 2009 in Chemistry em-phasised the cognitive levels Understand and Apply. Krathwohl (2002:215)highlighted that some cognitive processes associated with Understand aremore complex than those associated with Apply. Green and Naidoo (2006:79)also showed the shift in cognitive complexity of the Physical Sciences cur-riculum overall. There is clearly a need for Physical Science teachers to im-prove the skills of learners to handle more complex items in the examinationif the Grade 12 final examination results are anything to go by.
A look at the examiners’ reports (WCED, 2008a:1-2; WCED, 2008b:1-2)for the final examination in Physics and Chemistry highlights the following:• candidates are unable to explain phenomena by applying principles;• new work in the curriculum is poorly answered;• candidates struggle with concepts requiring higher-order reasoning to
solve problems;• candidates lack basic understanding (comprehension); and• higher-order questions that also occurred in the old curriculum are well
answered.The lack of emphasis on higher-order cognitive skills could possibly lead toteachers not preparing Grade 12 learners adequately for the examination.Where teachers appear to be familiar with the work from the old curriculum,the learners are doing well. However, it would seem that a lack of developmentof teachers in the new materials is hampering the progress of learners. Thelearners are also doing worse in the Chemistry paper overall and a lower

588 Edwards
alignment index is one possible explanation for this. The exemplar and exami-nations in Physics maintain a balanced emphasis across the knowledge areas,whereas for Chemistry instances of over- and under-representation occur.Within the knowledge area Matter and Materials in Chemistry there is a 5%over-representation in the final examination. This contains a lot of newmaterial in Organic Chemistry that learners struggle to understand. Perhapsthere is also a need to develop teachers in this area as many of them do nothave an adequate background in Organic Chemistry.
The 2009 Grade 12 Physical Sciences results that were released in Janu-ary 2010 showed a drastic increase in the failure rate. One possible expla-nation for this is that no new exemplars for Physical Sciences were madeavailable in 2009. This study has shown that on the whole the final exami-nations of 2008 and 2009, and the exemplars of 2008 were fairly consistentacross cognitive levels and content areas. What needs to be researched is theissue of test familiarity, since other preparatory examinations were alsoreleased in 2008. Umalusi (2009:121) compared the NCS with the old curri-culum and concluded that it is far more difficult in terms of breadth ofcontent than is the old curriculum, but is midway between the Higher andStandard Grade levels of the old curriculum in terms of the levels of difficultyof the content topics. The Physical Sciences panel also estimated that up to35% more classroom time is needed for the NCS content compared with theold curriculum.
There are huge gaps inherent in the South African education system asfar as implementing the new curriculum is concerned. Teachers utilise thepublished policy documents to give direction to their teaching. The curriculumdocuments themselves should be clear and give a balanced weighting acrosscognitive levels. If this situation obtains, then teachers can have a reasonableexpectation that the examination should be aligned to the curriculum content.Alignment studies would thus be important to elucidate the differences in theintended curriculum and the enacted curriculum. They could also be used asa tool for the professional development of teachers to analyse their internally-set examinations. This study makes a first contribution towards establishingthe quality of the relationship between the Physical Sciences curriculum andthe examination in the South African context. It also has potential to beutilised in other subjects such as Mathematics and Life Sciences. A furtherarea of research, which has been beyond the scope of this study, would be toexamine the cognitive complexity within each knowledge area in Physics andChemistry.
AcknowledgementsI thank Lucille Phillips and Andrew Fair for their participation in this study,the teachers for their contribution at a workshop on the revised Bloom’staxonomy, Prof Lesley Le Grange for useful comments on an earlier draft, andthe reviewers for constructive feedback.

589Physical sciences examination
ReferencesAmer A 2006. Reflections on Bloom’s revised taxonomy. Electronic Journal of
Research in Educational Psychology, 4:213-230.
Anderson LW 2005. Objectives, Evaluation, and the improvement of education.
Studies in Educational Evaluation, 31:102-113.
Bhola DS, Impara JC & Buckendahl CW 2003. Aligning tests with states’ content
standards: Methods and issues. Educational Measurement: Issues and Practice,
22:21-29.
Bowen GA 2009. Document analysis as a qualitative research method. Qualitative
Research Journal, 9:27-40.
Chisholm L 2005. The making of South Africa’s National Curriculum
Statement.Journal of Curriculum Studies, 37:193-208.
Creswell J & Plano Clark VL 2007. Designing and conducting mixed methods
research. Thousand Oaks: Sage.
Department of Education 2003. National Curriculum Statement Grades 10-12
(General) Policy: Physical Sciences. Pretoria: Government Printer.
Department of Education 2006. National Curriculum Statement Grades 10-12
(General): Physical Sciences Content. Pretoria: Government Printer.
Department of Education 2008a. Abridged Report: 2008 National Senior Certif icate
Examination Results. Pretoria: Department of Education.
Department of Education 2008b. Examination Guidelines: Physical Sciences Grade
12 2008. Pretoria: Department of Education.
Department of Education 2008c. Physical Sciences Exemplars 2008. Available
athttp://www.education.gov.za/Curriculum/grade12_examplers.asp. Accessed
24 October 2008.
Department of Education 2008d. Physical Sciences Examination 2008. Available at
http://www.education.gov.za/Curriculum/NSC% 20Nov% 202008% 20Examinati
on% 20Papers.asp. Accessed 8 July 2009.
Department of Education 2009. Physical Sciences Examination 2009. Available at
http://www.education.gov.za/Curriculum/NSC% 20Nov% 202009% 20Examinati
on% 20Papers.asp. Accessed 3 March 2010.
Department of Basic Education 2010. National Examinations and Assessment Report
on the National Senior Certif icate Examination Results Part 2 2009. Pretoria:
Department of Education.
Glatthorn A 1999. Curriculum alignment revisited. Journal of Curriculum and
Supervision, 15:26-34.
Green W & Naidoo D 2006. Knowledge contents reflected in post-apartheid South
African Physical Science curriculum documents. African Journal of Research in
SMT Education, 10:71-80.
Herman JL & Webb NM 2007. Alignment methodologies. Applied measurement in
education, 20:1-5.
Instructional Assessment Resources (IAR) 2010. Document analysis. Available at
http://www.utexas.edu/academic/diia/assessment/iar/teaching/plan/method
/doc-analysis.php. Accessed 24 August 2010.
Krathwohl DL 2002. A revision of Bloom's taxonomy: An overview. Theory into
Practice, 41:212-218.
La Marca PM 2001. Alignment of standards and assessments as an accountability
criterion. Practical Assessment, Research & Evaluation, 7. Available from
http://PAREonline.net/getvn.asp?v=7&n=21. Accessed 15 August 2010.
Le Grange L 2007. (Re)thinking outcomes-based education: From arborescent to
rhizomatic conceptions of outcomes (based-education). Perspectives in
Education, 25:79-85

590 Edwards
Liang L & Yuan H 2008. Examining the alignment of Chinese national Physics
curriculum guidelines and 12th-grade exit examinations: A case study.
International Journal of Science Education, 30:1823-1835.
Liu X & Fulmer G 2008. Alignment between the Science curriculum and assessment
in selected NY State Regents exams. Journal of Science Education and
Technology, 4:373-383.
Liu X, Zhang B, Liang L, Fulmer G, Kim B & Yuan H 2009. Alignment between the
Physics content standard and the standardized test: A comparison among the
United States-New York State, Singapore, and China-Jiangsu. Science
Education, 93:777-797.
Martone A & Sireci SG 2009. Evaluating alignment between curriculum,
assessment, and Instruction. Review of Educational Research, 79:1332-1361.
Mayer RE 2002. Rote versus meaningful learning. Theory into Practice, 41:226-232.
Näsström G 2009. Interpretation of standards with Bloom’s revised taxonomy: a
comparison of teachers and assessment experts. International Journal of
Research & Method in Education, 32:39-51.
Olson L 2003. Standards and tests: Keeping them aligned. Research Points: Essential
Information for Education Policy, 1:1-4.
Organisation for Economic Co-Operation and Development 2008. Reviews of
National Policies for Education: South Africa. OECD, Paris.
Porter AC 2002. Measuring the content of instruction: Uses in research and practice.
Educational Researcher, 31:3-14.
Porter AC, Smithson J, Blank R & Zeidner T 2007. Alignment as a teacher variable.
Applied Measurement in Education, 20:27-51.
Umalusi 2009. From NATED 550 to the new National Curriculum: maintaining
standards in 2008. Part 2: Curriculum Evaluation. Pretoria: Umalusi.
Rogan JM 2007. How much curriculum change is appropriate? Defining a zone of
feasible innovation. Science Education, 91:439-460.
Webb NL 1997. Criteria for alignment of expectations and assessments in
mathematics and science education (Research monograph No. 6). Washington,
DC: Council of Chief State School Officers.
Webb NL 1999. Alignment of science and mathematics standards and assessments in
four states (Research monograph No. 18). Washington, DC: Council of Chief
State School Officers.
Webb NL 2007. Issues related to judging the alignment of curriculum standards and
assessments. Applied Measurement in Education, 20:7-25.
Western Cape Education Department 2008a. Physical Sciences - Paper 1. Available
at http://wced.wcape.gov.za/documents/2008-exam-reports/reports/physical
_science_p1.pdf. Accessed 26 February 2010.
Western Cape Education Department 2008b. Physical Sciences - Paper 2. Available
at http://wced.wcape.gov.za/documents/2008-exam-reports/reports/physical
_science_p2.pdf. Accessed 26 February 2010.
AuthorNazeem Edwards is a science education Lecturer in the Department of Curri-culum Studies at Stellenbosch University and has 22 years teaching expe-rience. His research interests are in developing pre-service science teachers’conceptual understanding, science teachers’ pedagogical content knowledge,argumentation in science education and alignment studies.