Embed Size (px)
Citation preview

Journal of Management Research ISSN 1941-899X
2009, Vol. 1, No. 2: E2
www.macrothink.org/jmr 1
An Analysis of the Consequences of
Contract Administration Problems for Contract Types
Bill Davison, CPPO
Director of Purchasing, Stearns County
705 Courthouse Square, St. Cloud MN 56303
Tel : 1-320-656-3970 E-mail: [email protected]
Richard J. Sebastian, Ph.D.
Department of Management, St. Cloud State University
720 Fourth Avenue South, St. Cloud, MN 56301
Tel : 1-320-308-3226 E-mail: [email protected]
Abstract
The primary purpose of this research was to examine the perceived consequences of ten types of contract administration problems for each of seven contract types and to determine how likely each of these consequences were perceived to be. Building upon the earlier research of Davison and Sebastian (in press a, b), the research surveyed National Institute of Government Purchasing (NIGP) and Institute of Supply Management (ISM) members. For each of seven types of contract (e.g., supplies and small purchases) the respondents were asked to indicate the typical consequences they experienced for each of ten contract administration problems (e.g., wrong product). The major problematic consequences examined were contract delays, contract costs, and contract termination. The perceived likelihood of occurrence for each consequence, on the contracting process, was determined for each contract problem within each contract type. The major findings were that when contract administration problems occurred, problematic consequences were more likely than no consequences for all contract types except leases and that the types of problematic consequences that were most likely depended on the type of contract. The implications of the results from this research and Davison and Sebastian’s previous findings for procurement professionals and the purchasing process were discussed along with future research directions.
Keywords: Contract Administration, Risk/Risk Assessment, Procurement/Purchasing Processes

Journal of Management Research ISSN 1941-899X
2009, Vol. 1, No. 2: E2
www.macrothink.org/jmr 2
1. Introduction
“Contract administration” is a term used to describe the functions that are performed after the parties have signed the contract (Sherman, 1996). As a precise term, contract administration refers to those activities that take place after contract award and can encompass a plethora of activities ranging from routine to unusual. Typical contract administration activities are goal oriented, aimed at ensuring enforcement of the contract terms and conditions while giving attention to the achievement of the stated output and outcome of the contract. In other words, contract administration is about much more than simply the enforcement of the contract language. It requires the contract manager to remain focused on the program goals and objectives
The contractual goal, or end, of the procurement of any good or service should be successful project completion (Davison and Wright, 2004). Successful project completion is defined by NIGP as successful procurement of the right item, in the right quantity, for the right price, at the right time, with the right quality, known as the 5 “R’s” (Thai, 2004). To complete a project successfully, contractual goals should be established to accomplish each of the “5 R’s”. (NIGP, 2000). The establishment of contract goals begins with identifying the typical contract risks and potential contract administration problems associated with the purchase that could affect any of the “5 R’s”. The next steps are to assess the level of risk by determining the probability of occurrence for each type of problem and to develop a contract administration plan to avoid or minimize the problems (Davison & Wright, 2004).
Due to changes in technology, socioeconomic objectives, and legislation, the role of the procurement professional is itself changing from a clerical function and reactive order placer to a proactive strategic participant who is involved in major expenditure decisions (McCue & Gianakis, 2001; McCue & Pitzer, 2000). According to Hinson and McCue (2004) procurement professionals must change their focus from expending effort on the procurement of low value repetitive purchases to the planning and procurement of high value, high risk goods and services. Snyder (2006), furthermore, contended that as long as the efforts of procurement professionals are focused on the means (how something is purchased) instead of the ends (successful project completion), they will remain reactive, and all their decisions will be the result of decisions made by others. This, in turn, will make it difficult for the procurement professional to achieve the goal of becoming a strategic partner in the organization. Snyder further argued that procurement professionals must bridge the gap between balancing the need for successful project completion (ends) with the need for a transparent and effective process (means).
In response to increasing demand for services, coupled with a decrease in taxes, public organizations have flattened every aspect of their hierarchal structure and required departments “to do more with less” (Ancona, Kochan, Scully, Van Maanen, & Westney, 2005). The procurement profession has responded to the “do more with less” edict by increasing organizational efficiency by implementing E-procurement technologies, such as, on line requisitioning and P-cards (Drabkin and Thai, 2003). The adoption of E-Procurement technologies has allowed the procurement department to transfer much of the procurement
Journal of Management Research ISSN 1941-899X
2009, Vol. 1, No. 2: E2
www.macrothink.org/jmr 3
clerical function to end users (Bartle and Korosec, 2001). This transfer has provided procurement professionals with the opportunity to become strategic partners in all purchases by allowing them to apply their expertise to areas of the procurement process where they can best add value, such as, developing Requests for Proposals, performance based contracting, and contract management (Schwartz, 2006). As public organizations, like many of their private counterparts, get “flattened” and are required “to do more with less,” procurement professionals will also need to be increasingly efficient and will need to allocate their scarce human and financial resources to the highest value projects (Ancona, Kochan, Scully, Van Maanen, & Westney, 2005).
To bridge the gap between the ends and the means, procurement professionals will need to understand what the project’s goals are (ends). By understanding the relationship between the contract type and potential contract problems, procurement professionals can anticipate the types of contract administration problems that are likely to occur for a specific type of purchase. In turn this will allow them to prepare effective specifications, contracts, and contract administration plans (means) to avoid the potential problems or minimize the potential negative consequences (Davison & Wright, 2004). Conducting research to determine which problems are likely to occur and the consequences of these problems will provide procurement professionals with a rational framework on which to base their recommendations to management.
Currently, typical contract administration efforts focus on reacting to unforeseen problems (change order management, dispute resolution) after they occur. Reacting to problems is a waste of valuable human and financial resources. To be recognized as a strategic partner in the organization procurement professionals will need to become more involved in each of the six phases of the contract management process: procurement planning, solicitation planning, solicitation, source selection, contract administration, and contract closeout. The procurement official must demonstrate that by using the procurement tools at their disposal (specifications, contract pricing, contract monitoring, and payment options), they have the tools and skills to select the best procurement options that will reduce or minimize the risks that could lead to negative consequences.
Prior to our research no one had collected empirical data on the perceived likelihood of occurrence of contract administration problems and the severity of their consequences. With the help of research results public procurement professionals can use their professional judgment to select the appropriate procurement method that will minimize the likelihood of problems occurring, by developing a procurement framework that is based on theory, research, and best practices.
Innovative procurement tools and processes have been adopted by several states in response to recognized contract administration problems, such as poor performance, encountered when awarding to the low bid. The State of Minnesota has enacted Best Value Contracting (BVC) for the purchase of construction services. This alternative method of procurement uses an evaluation criteria consisting of 9 factors to evaluate the relationship between performance and price to achieve the best overall value and lowest long-term cost for government

Journal of Management Research ISSN 1941-899X
2009, Vol. 1, No. 2: E2
www.macrothink.org/jmr 4
construction projects. The State of Florida allows competitive negotiations for the acquisition of several professional services, such as, architectural, engineering, landscape architectural or surveying and mapping services.
Use of these innovative tools and processes can be controversial and widespread adoption has not yet occurred. One possible reason may be that the benefits of these new processes have not been compared with the consequences of the typical contract administration problems encountered. Providing formal research on the likelihood of occurrence and the potential consequences will provide procurement professionals with data to determine the possible costs of typical contract administration problems.
1.1 Identifying potential contract administration problems associated with any type of purchase
While there are numerous items and services that can be purchased, each purchase of goods and services faces the same set of contractual risks that affect the successful accomplishment of any of the 5 “R’s”. Abi-Karam (2002) suggested that every purchase should be evaluated for six types of risks: Proposal risk, Surety and liability risks, Schedule risk, Contractual risk, Performance risk and Price risk.
Davison and Wright (2004) expanded on the definition of these risks to include their relationship to the following five “R’s”:
Proposal risk: The legal document that defines the item or service procured (the right item), the mutual areas of agreement, and how risks will be allocated and rewarded.
Surety and liability risks: Protection of the agency’s financial and legal interests (the right price). The contract will define the insurance requirements, bonding requirements, and licensing that are necessary to protect the agency in the event of contract termination or to meet statutory requirements.
Schedule risk: Ensuring timely delivery (the right time). The contract will contain clear and specific language describing the contract deliverables, delivery terms, and any penalties for late delivery.
Contractual risk: Establishing change order procedures, dispute resolution process and termination procedures (the right price and time).The contract is a living document and allowances must be made to accommodate unforeseen conditions that may affect the purchase. The contract will specify who has the authority to make changes, how changes will be made, and what changes will be unilateral. The contract will specify how disputes will be resolved if mutual agreement cannot be reached. The contract will specify the termination process.
Performance risk: Defining acceptance (the right quality). The contract will define the conditions under which acceptance will occur and what type of inspection will be required.
Price risk: Defining payment terms (the right price). The contract will define how and when the Contractor will be paid.

Journal of Management Research ISSN 1941-899X
2009, Vol. 1, No. 2: E2
www.macrothink.org/jmr 5
Based on observation and communication with peers, Davison and Wright (2004), proposed that each of these six contractual risks is comprised of a set of contract problems that may occur each time the good or service is procured (Table 1). Each contract problem that occurs can threaten the success of the project by impacting any or all of the 5 “R’s” in an adverse manner, such as, delivery of incorrect product, incorrect quantity, an increase in project costs, a delay in delivery, poor quality or the ultimate unsuccessful result, contract termination.
Table 1. Types of Contract Administration Problems
Contractual Risk and Contract
Administration Problem
Example
Proposal risk: Unclear scope of
work
Ambiguous specifications lead to disputes over required performance,
acceptance.
Surety and Liability risk: Increased
cost
Inadequate bonds and insurance to cover vendor failure.
Schedule risk: Wrong product Purchase order or contract clearly identifies correct product, but vendor ships
incorrect. No dispute involved
Schedule risk: Delay Purchase order has clearly stated completion date. Completion date delayed
(any length of time) due to agency or vendor (with or without cause).
Contractual risk: Change order Change in the scope of work (additional work, money, time), after contract
award. Can be requested by either party for any reason.
Contractual risk: Dispute
resolution and personality conflict
Personality conflicts between agency project manager or staff and vendor
project manager or employees. Disagreement between the parties that cannot
be easily resolved. May involve scope of work, materials supplied, payment
schedules, or any other aspect of the contract.
Performance risk: Definition of
acceptance
Completion of project is delayed due to non acceptance of final product.
Example: difference in either party’s definition of what was supposed to be
delivered or provided
Performance risk: Poor
performance
Contract clearly states a level of expected performance (this is not in dispute)
and quality problems with vendor’s performance of work occur.
Performance risk: Sub Contractors The vendor uses subcontractors not on his payroll to perform any or all of the
work. Prior approval, for use of subcontractors, was received
Performance risk: Other sources There are very few vendors that can perform the work.
Performance risk: Risk of failure The project has a high risk of failure. i.e. New technology, new equipment,
new vendor, Project never been done before. Tight timeline or budget
Price Risk: Cost Project has a high cost.
1.2 Identifying contract types
Once again, based on observation and communication with peers, Davison and Wright (2004) also proposed that, it is possible that each purchase can be put into one of seven contract types (Table 2).

Journal of Management Research ISSN 1941-899X
2009, Vol. 1, No. 2: E2
www.macrothink.org/jmr 6
Table 2. Contract Types
Contract Type Examples
Commodities, Small Purchases MRO (Maintenance, Repair and Operating supplies)
Term Contracts: i.e. Office Supplies, One time orders for durable goods under
$5000
Capital Outlay Durable goods over $5000
Professional Services Architects, Consultants
Contracted Services Custodial Services, Food Service
Software Custom developed and shrink-wrap
Construction Any type and any dollar amount – New construction or remodeling
Leases Leased Space or equipment – lease without intent to own
1.3 Determining the likelihood of occurrence for each type of problem
Guided by this framework, Davison and Sebastian (in press a) surveyed NIGP and ISM members to determine empirically what types of problems were perceived to be most common for each of the contract types. They also analyzed their data to determine which types of contracts were perceived to have the most problems across all problem types and which problems were perceived to be most common across all contract types. The mean ratings of the perceived occurrence of contract administration problems over all types of contracts are summarized on Table 3.
Table 3. Perceived occurrence of contract administration problems over all types of contracts
Contract administration problem Mean Rank
Delays 5.73a 1
Cost 6.13b 2
Change Order 6.16b 3
Poor Performance 6.36b 4
Definition of Acceptance 6.66c 5
Conflict 6.73cd 6
Other Sources 6.93de 7
Subcontractors 7.08ef 8
Risk of Failure 7.24f 9
Wrong Product 7.29f 10
Note: Means that do not share a common subscript are significantly different at the .05 level.
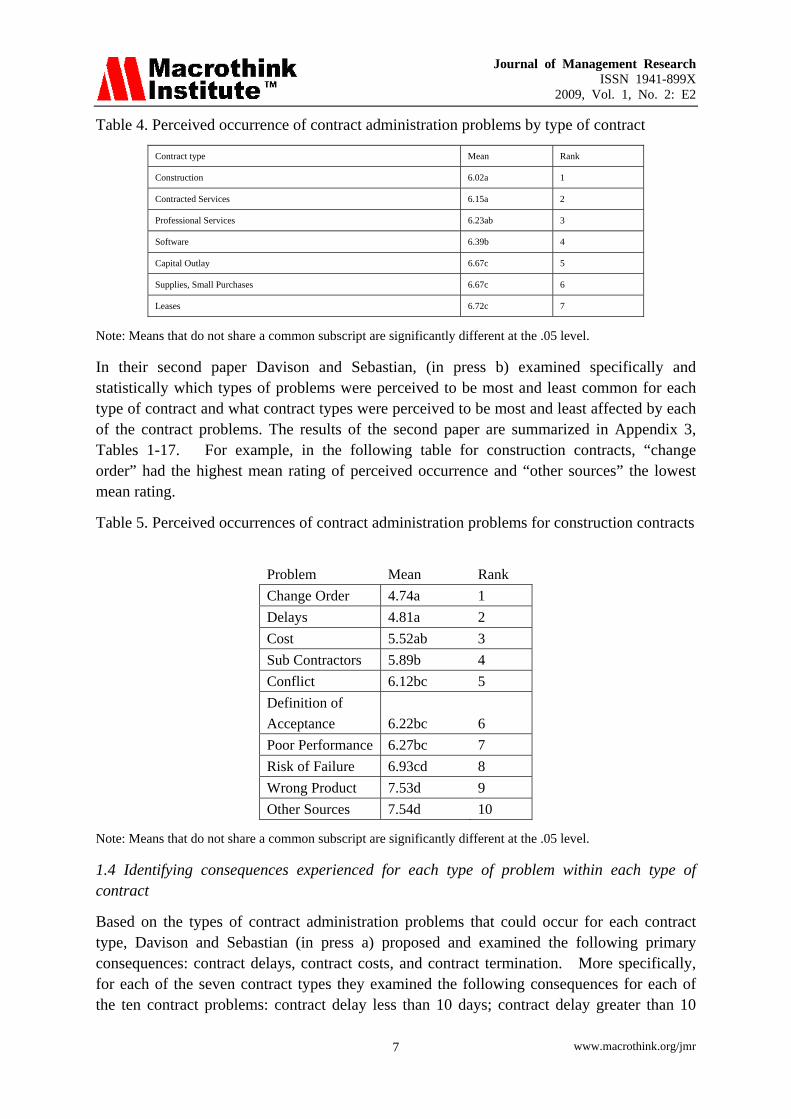
The mean ratings of the perceived occurrence of contract administration problems by type of contract are summarized on Table 4. The results of this research showed that delays and increased cost were the most commonly encountered contract administration problem for all types of contracts and construction contracts had the most contract administration problems.
Journal of Management Research ISSN 1941-899X
2009, Vol. 1, No. 2: E2
www.macrothink.org/jmr 7
Table 4. Perceived occurrence of contract administration problems by type of contract
Contract type Mean Rank
Construction 6.02a 1
Contracted Services 6.15a 2
Professional Services 6.23ab 3
Software 6.39b 4
Capital Outlay 6.67c 5
Supplies, Small Purchases 6.67c 6
Leases 6.72c 7
Note: Means that do not share a common subscript are significantly different at the .05 level.
In their second paper Davison and Sebastian, (in press b) examined specifically and statistically which types of problems were perceived to be most and least common for each type of contract and what contract types were perceived to be most and least affected by each of the contract problems. The results of the second paper are summarized in Appendix 3, Tables 1-17. For example, in the following table for construction contracts, “change order” had the highest mean rating of perceived occurrence and “other sources” the lowest mean rating.
Table 5. Perceived occurrences of contract administration problems for construction contracts
Problem Mean Rank Change Order 4.74a 1 Delays 4.81a 2 Cost 5.52ab 3 Sub Contractors 5.89b 4 Conflict 6.12bc 5 Definition of Acceptance 6.22bc 6 Poor Performance 6.27bc 7 Risk of Failure 6.93cd 8 Wrong Product 7.53d 9 Other Sources 7.54d 10
Note: Means that do not share a common subscript are significantly different at the .05 level.
1.4 Identifying consequences experienced for each type of problem within each type of contract
Based on the types of contract administration problems that could occur for each contract type, Davison and Sebastian (in press a) proposed and examined the following primary consequences: contract delays, contract costs, and contract termination. More specifically, for each of the seven contract types they examined the following consequences for each of the ten contract problems: contract delay less than 10 days; contract delay greater than 10
Journal of Management Research ISSN 1941-899X
2009, Vol. 1, No. 2: E2
www.macrothink.org/jmr 8
days; increased contract cost less than 10%; increased contract cost greater than 10%; contract termination; none of these consequences. This paper reports the results of this research.
2. Research Method
2.1 Subjects and Procedure
The subjects were the members of two organizations--the National Institute of Governmental Purchasing, Inc. (NIGP) and the Institute of Supply Management (ISM). A “blast” email with a hot link to the survey was sent to all 10627 NIGP members on May 2. ISM has over 40000 members. A random sample of 2000 members was sent a postcard with the survey URL printed on it. These cards were also left outside of meeting rooms at an ISM regional meeting and approximately 50 cards were picked up. The email to NIGP members that had the link to the survey had the preface (Appendix 1).
To pilot the survey it was sent to 10 NIGP members, 7 of whom replied. Though some commented on its length and complexity, no major issues were raised.
2.2 Survey Instrument
The survey initially asked a number of background questions, including, country in which the respondent worked, type of agency worked for, current position, total years in purchasing, years in current position, highest level of education, field of education, professional certifications currently held, year when most recent certification was obtained, approximate annual purchasing volume for the respondent’s entire agency, approximate annual purchasing volume made by the respondent, respondent’s level of purchasing authority, number of full time employees in respondent’s agency, number of full time employees in respondent’s purchasing unit, types of purchases respondent has current responsibility for, and the number of purchase orders or contracts issued by the respondent for the major contract categories investigated in the study—Commodities, Capital Outlay, Professional Services, Contracted Services, Software, Leases, Construction, and Other. A copy of the complete survey is in Appendix 2.
The survey then provided definitions of the seven major contract purchase types and ten major contract administration problems—Wrong Product, Delay, Final Acceptance, Change Order, Personality Conflict, Poor Performance, Sub Contractors, Cost, Other sources, and Risk of Failure. Using these definitions, respondents were then asked to rank order the frequency with which these problems occur for each type of contract. The exact instructions for this question follow:
“For purchases made within the past year, rank order the problems that apply in terms of how often they occur for each contract type with 1 being most frequent (as applicable) to 10 being least frequent (as applicable) or choose 99 for those that do not apply. The definitions of contract type are listed in Attachment A, and the definitions of contract problems are listed on Attachment B. Please use each of the ten ranks only once.”
Journal of Management Research ISSN 1941-899X
2009, Vol. 1, No. 2: E2
www.macrothink.org/jmr 9
Lastly, the respondents were asked to indicate the typical consequences they experienced for each type of problem within each type of contract. The exact wording of the question follows: “Using the following categories, indicate the typical consequences you experience for each type of problem within each type of contract using 1=Contract delay less than 10 days, 2=Contract delay greater than 10 days, 3=Increased contract cost less than 10%, 4=Increased contract cost greater than 10%, 5=Contract termination, 6=None of these consequences. Please check all that apply.” 3. Results 3.1 Response rate The total number of respondents from both samples was 557. Since all respondents accessed the survey through the same link, it is impossible to state definitively how many came from each organization. However, 492 of the respondents indicated they worked for a government or public agency. Only 16 said they worked for a private agency while 4 worked for a utility and 43 worked for an educational institution. Two respondents did not indicate where they worked. The timing of the responses as well as type of organizations for which they worked suggested that the vast majority of the respondents, approximately 500, were NIGP members. Because 442 of the emails were not delivered due to bad addresses, the response rate for NIGP is 5 % (500/10185). All that can be confidently stated is that the response rate for ISM was less than that for NIGP. These results are not surprising in that ISM members had to type in a long URL to access the survey whereas NIGP members simply had to click on a link. In addition, a small number (34) of the postcards which were sent were returned to the sender for a variety of reasons, such as no forwarding address, insufficient address, or insufficient postage for international addresses, further contributing to the relatively low response rate. Though the response rates were low, the overall size of the sample was good. The relatively low response rates were not surprising in view of the complexity and length of the survey. 3.2 Respondent characteristics The respondents were experienced in their fields and had substantial purchasing authority. The median number of years they said they had in purchasing was 16 with a median of 5 years in their current positions. The median annual purchasing volume for their entire agency was 50 million while their median purchasing volume for the last year was 7 million. The respondents also tended to work for rather large agencies. The median number of full time employees in their agencies was 600 and the median number of full time employees in their purchasing units was 8. The respondents, on average, were well educated with over 60 % of the sample having a 4 year college degree or beyond. Their educational fields of study were rather varied but the vast majority (56%) had studied business. Liberal arts (11%) and public administration (9%) were the other most common fields of study. 3.3 Consequences of problems for contract types The major results of this study are found in Tables 6-12 which present the respondents’ reported frequency and the computed percentage of the six consequences for each contract problem for each contract type. The percentage for each type of consequence is based on the total frequency of responses for that specific problem which are found in the final column

Journal of Management Research ISSN 1941-899X
2009, Vol. 1, No. 2: E2
www.macrothink.org/jmr 10
labeled Row Frequency Total. The total frequency of occurrence of each consequence and its percentage of the total reported consequences are found at the bottom of each table. For example, for supplies and small purchases the most common problematic consequences are wrong product (38.9%) and delays of less than ten days (43.0%). In addition, for supplies and small purchases, inspection of the bottom rows in the table reveals that there were problematic consequences 63 % of the time. The results in the other tables can be interpreted in the same way.
Table 6. Consequences of problems for small purchases contracts
No Effect
Contract
Delay < 10
days
Contract
Delay > 10
days
Increased Contract cost
<10%
Increased
Contract
cost >10% Contract Termination
Contract
Administration Problem Percent Freq Percent Freq Percent Freq Percent Freq Percent Freq Percent Freq
Row
Freq
Totals
Wrong Product 26.0% 81 38.9% 121 17.7% 55 9.0% 28 2.9% 9 5.5% 17 311
Delays 20.3% 64 43.0% 136 20.3% 64 7.6% 24 3.8% 12 5.1% 16 316
Definition of
Acceptance 44.0% 125 27.8% 79 12.3% 35 8.1% 23 3.5% 10 4.2% 12 284
Change Order 34.9% 98 21.7% 61 13.5% 38 17.4% 49 10.0% 28 2.5% 7 281
Conflict 38.6% 110 34.4% 98 13.7% 39 6.7% 19 2.8% 8 3.9% 11 285
Other Sources 47.9% 127 24.2% 64 13.6% 36 9.4% 25 2.6% 7 2.3% 6 265
Poor Performance 27.1% 79 29.2% 85 18.6% 54 9.3% 27 4.8% 14 11.0% 32 291
Risk of
Failure/Termination 46.0% 126 24.1% 66 9.1% 25 7.7% 21 4.4% 12 8.8% 24 274
Subcontractors 61.2% 153 17.2% 43 7.2% 18 7.2% 18 3.2% 8 4.0% 10 250
Cost 31.8% 91 22.7% 65 10.8% 31 19.2% 55 9.8% 28 5.6% 16 286
Column Totals 1054 818 395 289 136 151
Column % = the total occurrence
of each consequence/ the total
reported consequences (2843) 37.1% 28.8% 13.9% 10.2% 4.8% 5.3%

Journal of Management Research ISSN 1941-899X
2009, Vol. 1, No. 2: E2
www.macrothink.org/jmr 11
Table 7. Consequences of problems for Capital Outlay contracts
No Effect
Contract
Delay < 10
days
Contract
Delay > 10
days
Increased Contract cost
<10%
Increased
Contract
cost >10% Contract Termination
Contract Administration
Problem Percent Freq Percent Freq Percent Freq Percent Freq Percent Freq Percent Freq
Row
Freq
Totals
Wrong Product 40.0% 96 20.0% 48 22.5% 54 8.8% 21 4.2% 10 4.6% 11 240
Delays 27.6% 68 19.9% 49 32.1% 79 11.8% 29 6.1% 15 2.4% 6 246
Definition of Acceptance 43.1% 97 23.1% 52 16.9% 38 8.9% 20 4.0% 9 4.0% 9 225
Change Order 39.3% 86 13.2% 29 17.4% 38 17.4% 38 11.0% 24 1.8% 4 219
Conflict 40.7% 92 19.5% 44 23.0% 52 8.0% 18 4.4% 10 4.4% 10 226
Other Sources 53.6% 111 14.5% 30 13.0% 27 12.1% 25 4.8% 10 1.9% 4 207
Poor Performance 36.6% 83 16.3% 37 21.1% 48 10.6% 24 7.9% 18 7.5% 17 227
Risk of
Failure/Termination 46.7% 107 17.5% 40 14.4% 33 8.3% 19 7.9% 18 5.2% 12 229
Subcontractors 50.7% 107 15.2% 32 14.7% 31 10.0% 21 4.7% 10 4.7% 10 211
Cost 33.2% 77 16.4% 38 14.7% 34 15.9% 37 14.7% 34 5.2% 12 232
Column Totals 924 399 434 252 158 95 Column % = the total occurrence of
each consequence/ the total
reported consequences (2262) 40.8% 17.6% 19.2% 11.1% 7.0% 4.2%

Journal of Management Research ISSN 1941-899X
2009, Vol. 1, No. 2: E2
www.macrothink.org/jmr 12
Table 8. Consequences of problems for Professional Services contracts
No Effect
Contract Delay <
10 days
Contract
Delay > 10 days
Increased
Contract cost
<10%
Increased
Contract
cost >10%
Contract
Termination
Contract Administration
Problem Percent Freq Percent Freq Percent Freq Percent Freq Percent Freq Percent Freq
Row Freq
Totals
Wrong Product 56.9% 123 14.4% 31 13.0% 28 5.1% 11 6.5% 14 4.2% 9 216
Delays 26.3% 67 17.6% 45 27.8% 71 13.7% 35 11.8% 30 2.7% 7 255
Definition of Acceptance 41.9% 96 15.7% 36 18.3% 42 10.9% 25 9.2% 21 3.9% 9 229
Change Order 26.0% 64 12.6% 31 17.9% 44 19.5% 48 20.7% 51 3.3% 8 246
Conflict 31.0% 81 18.4% 48 21.5% 56 10.0% 26 12.6% 33 6.5% 17 261
Other Sources 52.7% 116 14.5% 32 11.4% 25 10.0% 22 7.7% 17 3.6% 8 220
Poor Performance 27.9% 75 16.7% 45 19.7% 53 13.4% 36 8.6% 23 13.8% 37 269
Risk of Failure/Termination 35.7% 91 15.3% 39 17.6% 45 10.6% 27 8.2% 21 12.5% 32 255
Subcontractors 41.5% 100 14.1% 34 14.5% 35 11.2% 27 9.1% 22 9.5% 23 241
Cost 25.4% 69 13.6% 37 14.3% 39 21.3% 58 17.6% 48 7.7% 21 272
Column Totals 882 378 438 315 280 171 Column % = the total occurrence of each
consequence/ the total reported
consequences (2264) 35.8% 15.3% 17.8% 12.8% 11.4% 6.9%

Journal of Management Research ISSN 1941-899X
2009, Vol. 1, No. 2: E2
www.macrothink.org/jmr 13
Table 9. Consequences of problems for Contracted Services contracts
No Effect
Contract Delay <
10 days
Contract
Delay > 10 days
Increased
Contract cost
<10%
Increased
Contract
cost >10%
Contract
Termination
Contract Administration
Problem Percent Freq Percent Freq Percent Freq Percent Freq Percent Freq Percent Freq
Row Freq
Totals
Wrong Product 48.8% 118 23.1% 56 7.9% 19 8.7% 21 4.1% 10 7.4% 18 242
Delays 30.8% 85 29.7% 82 18.1% 50 10.9% 30 4.7% 13 5.8% 16 276
Definition of Acceptance 38.7% 99 22.7% 58 16.4% 42 9.8% 25 5.5% 14 7.0% 18 256
Change Order 31.8% 84 17.8% 47 12.5% 33 20.8% 55 10.6% 28 6.4% 17 264
Conflict 31.3% 85 25.7% 70 17.3% 47 8.1% 22 7.7% 21 9.9% 27 272
Other Sources 48.5% 117 17.0% 41 12.4% 30 11.2% 27 7.9% 19 2.9% 7 241
Poor Performance 26.7% 77 18.1% 52 18.4% 53 10.8% 31 8.3% 24 17.7% 51 288
Risk of Failure/Termination 33.0% 89 21.9% 59 13.0% 35 8.9% 24 8.1% 22 15.2% 41 270
Subcontractors 41.5% 103 19.0% 47 11.7% 29 12.5% 31 8.1% 20 7.3% 18 248
Cost 29.2% 79 14.4% 39 12.5% 34 22.9% 62 12.2% 33 8.9% 24 271
ColumnTotals 936 551 372 328 204 237 Column % = the total occurrence of each
consequence/ the total reported
consequences (2628) 35.6% 21.0% 14.2% 12.5% 7.8% 9.0%

Journal of Management Research ISSN 1941-899X
2009, Vol. 1, No. 2: E2
www.macrothink.org/jmr 14
Table 10. Consequences of problems for Software contracts
No Effect
Contract Delay <
10 days
Contract
Delay > 10 days
Increased
Contract cost
<10%
Increased
Contract
cost >10%
Contract
Termination
Contract Administration
Problem Percent Freq Percent Freq Percent Freq Percent Freq Percent Freq Percent Freq
Row Freq
Totals
Wrong Product 40.8% 91 21.5% 48 16.6% 37 9.9% 22 5.4% 12 5.8% 13 223
Delays 27.5% 66 25.0% 60 25.4% 61 10.4% 25 5.8% 14 5.8% 14 240
Definition of Acceptance 37.0% 84 21.1% 48 14.1% 32 13.2% 30 7.9% 18 6.6% 15 227
Change Order 33.2% 72 14.3% 31 16.1% 35 17.5% 38 15.7% 34 3.2% 7 217
Conflict 39.3% 88 23.7% 53 17.4% 39 9.4% 21 5.8% 13 4.5% 10 224
Other Sources 49.5% 105 15.1% 32 14.6% 31 8.5% 18 9.4% 20 2.8% 6 212
Poor Performance 38.5% 87 15.5% 35 15.9% 36 10.6% 24 9.3% 21 10.2% 23 226
Risk of Failure/Termination 45.9% 101 16.8% 37 13.2% 29 8.2% 18 7.3% 16 8.6% 19 220
Subcontractors 53.9% 111 12.6% 26 12.1% 25 7.8% 16 4.4% 9 9.2% 19 206
Cost 34.3% 81 14.4% 34 15.3% 36 17.8% 42 11.0% 26 7.2% 17 236
Column Totals 886 404 361 254 183 143 Column % = the total occurrence of each
consequence/ the total reported
consequences (2231) 39.7% 18.1% 16.2% 11.4% 8.2% 6.4%
Journal of Management Research ISSN 1941-899X
2009, Vol. 1, No. 2: E2
www.macrothink.org/jmr 15
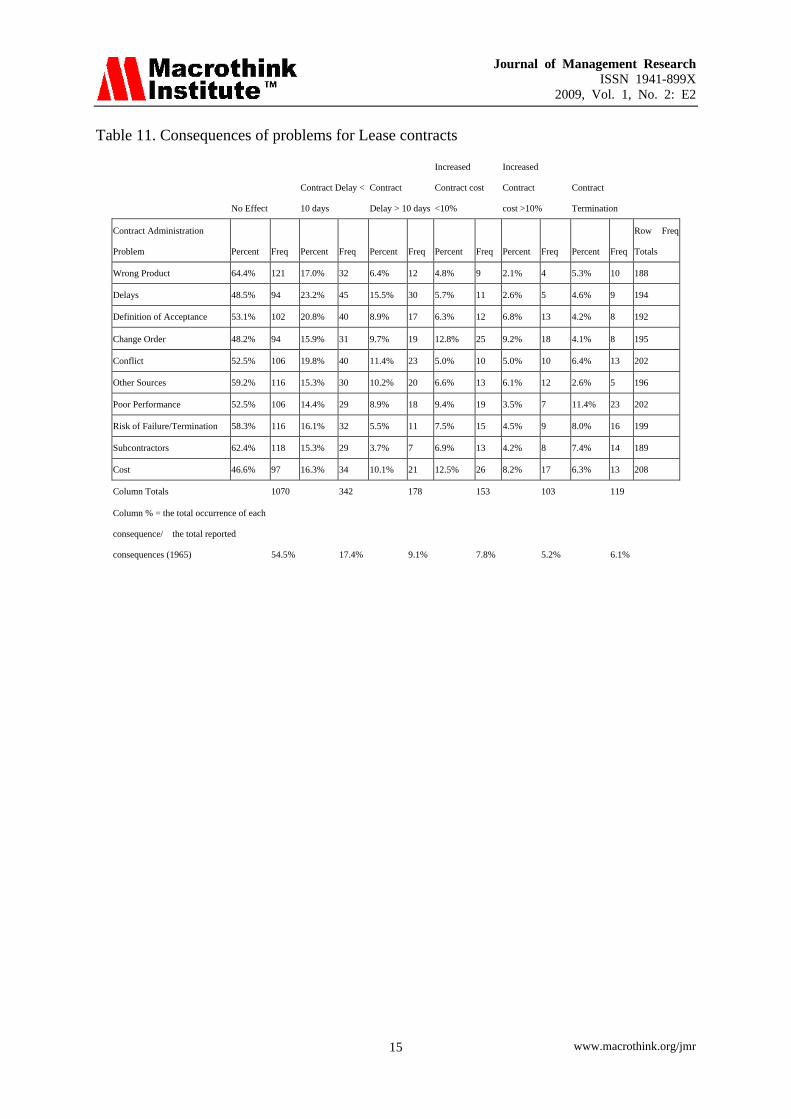
Table 11. Consequences of problems for Lease contracts
No Effect
Contract Delay <
10 days
Contract
Delay > 10 days
Increased
Contract cost
<10%
Increased
Contract
cost >10%
Contract
Termination
Contract Administration
Problem Percent Freq Percent Freq Percent Freq Percent Freq Percent Freq Percent Freq
Row Freq
Totals
Wrong Product 64.4% 121 17.0% 32 6.4% 12 4.8% 9 2.1% 4 5.3% 10 188
Delays 48.5% 94 23.2% 45 15.5% 30 5.7% 11 2.6% 5 4.6% 9 194
Definition of Acceptance 53.1% 102 20.8% 40 8.9% 17 6.3% 12 6.8% 13 4.2% 8 192
Change Order 48.2% 94 15.9% 31 9.7% 19 12.8% 25 9.2% 18 4.1% 8 195
Conflict 52.5% 106 19.8% 40 11.4% 23 5.0% 10 5.0% 10 6.4% 13 202
Other Sources 59.2% 116 15.3% 30 10.2% 20 6.6% 13 6.1% 12 2.6% 5 196
Poor Performance 52.5% 106 14.4% 29 8.9% 18 9.4% 19 3.5% 7 11.4% 23 202
Risk of Failure/Termination 58.3% 116 16.1% 32 5.5% 11 7.5% 15 4.5% 9 8.0% 16 199
Subcontractors 62.4% 118 15.3% 29 3.7% 7 6.9% 13 4.2% 8 7.4% 14 189
Cost 46.6% 97 16.3% 34 10.1% 21 12.5% 26 8.2% 17 6.3% 13 208
Column Totals 1070 342 178 153 103 119 Column % = the total occurrence of each
consequence/ the total reported
consequences (1965) 54.5% 17.4% 9.1% 7.8% 5.2% 6.1%

Journal of Management Research ISSN 1941-899X
2009, Vol. 1, No. 2: E2
www.macrothink.org/jmr 16
Table 12. Consequences of problems for Construction contracts
No Effect
Contract Delay <
10 days
Contract
Delay > 10 days
Increased
Contract cost
<10%
Increased
Contract
cost >10%
Contract
Termination
Contract Administration
Problem Percent Freq Percent Freq Percent Freq Percent Freq Percent Freq Percent Freq
Row Freq
Totals
Wrong Product 43.6% 95 11.9% 26 17.0% 37 11.5% 25 10.6% 23 5.5% 12 218
Delays 20.2% 53 14.1% 37 27.4% 72 16.7% 44 15.2% 40 6.5% 17 263
Definition of Acceptance 34.7% 78 16.9% 38 19.6% 44 11.1% 25 12.4% 28 5.3% 12 225
Change Order 20.0% 49 13.1% 32 17.6% 43 21.2% 52 23.7% 58 4.5% 11 245
Conflict 28.3% 73 13.6% 35 21.7% 56 12.8% 33 15.9% 41 7.8% 20 258
Other Sources 49.5% 103 12.0% 25 12.0% 25 12.0% 25 11.5% 24 2.9% 6 208
Poor Performance 26.1% 67 11.3% 29 23.0% 59 12.1% 31 14.8% 38 12.8% 33 257
Risk of Failure/Termination 37.1% 86 11.6% 27 18.1% 42 9.1% 21 14.2% 33 9.9% 23 232
Subcontractors 33.0% 76 12.6% 29 17.8% 41 11.7% 27 14.8% 34 10.0% 23 230
Cost 25.0% 65 11.2% 29 16.2% 42 18.1% 47 24.2% 63 5.4% 14 260
Column Totals 745 307 461 330 382 171 Column % = the total occurrence of each
consequence/ the total reported
consequences (2396) 31.1% 12.8% 19.2% 13.8% 15.9% 7.1%
The results can be summarized by observing that when contract problems occurred, the respondents reported that problematic consequences were more likely than no consequences for all contract types except lease contracts (Table 13). Problematic consequences were least likely for lease contracts, occurring 46% of the time, and most likely for construction contracts, occurring 69% of the time.
Table 13. Summary of Problematic Consequences for all Contract Problems for a Contract Type
Contract Type
Problematic
Consequences No Consequence
Supplies and
Small Purchases 62.9% 37.1%
Capital Outlay 59.2% 40.8%
Professional
Services 64.2% 35.8%
Contracted
Services 64.4% 35.6%
Software 60.3% 39.7%
Lease 45.5% 54.5%
Construction 68.9% 31.1%

Journal of Management Research ISSN 1941-899X
2009, Vol. 1, No. 2: E2
www.macrothink.org/jmr 17
4. Conclusion and Managerial Implications
When contract problems occur, the research found that problematic consequences were more likely than no consequence for all contract types except lease contracts (Table 13). The results also showed that when problems occur, the severity of the consequences depend on the type of contract. Advance knowledge of the likelihood of occurrence and the severity of consequences will allow procurement professionals to identify the likely contract administration problems for a specific contract type. Once the likely problems are identified the causal risks for each problem (complex specifications, tight timeline, tight budget, complex acceptance, etc) can be identified. Once the causal risks are identified the procurement professional can use the procurement process and the tools available (type of specifications, type of contract pricing, type of inspection, type of monitoring and type of payment) to identify methods to control risk by avoiding, shifting, minimizing or accepting risk. The procurement process can then be used as an effective risk mitigation tool.
An illustration of how to use these research results in combination with results earlier reported by Davison and Sebastian (in press a,b) follows. These researchers initially (Davison & Sebastian, in press a) reported that construction contracts were perceived to have the greatest overall occurrence of contract administration problems (Table 14).
Table 14. Perceived occurrence of contract administration problems by type of contract
Contract type Mean Rank
Construction 6.02a 1
Contracted Services 6.15a 2
Professional Services 6.23ab 3
Software 6.39b 4
Capital Outlay 6.67c 5
Supplies, Small Purchases 6.67c 6
Leases 6.72c 7
Note: Means that do not share a common subscript are significantly different at the .05 level.
In a subsequent more detailed analysis, they (Davison & Sebastian, in press b) found that change order and delays were the problems perceived as most likely to occur for construction contracts. For these two contract administration problems for construction contracts, this research (Table 12) shows the following consequences when these contract administration problems occur. If a change order occurs, the most likely consequences respectively are an increase in contract cost, delay, and lastly termination. If a delay occurs, the most likely consequences are a delay of more than 10 days, then an increase in cost, and lastly termination. The results from this line of research can be applied in the same manner for other types of contract, problems, and consequences of the problems. With this information the procurement professional can develop a proactive procurement plan that is based on determining which problems are likely to occur and assigning a risk factor for likely occurrence. The next step is to determine how serious the consequence is if the problem does occur and then assigning a risk factor for each consequence of the problems. The final

Journal of Management Research ISSN 1941-899X
2009, Vol. 1, No. 2: E2
www.macrothink.org/jmr 18
step is to combine both of the risk factors (likely occurrence and likely consequence) to determine an overall level of risk factor for each contract problem.
4.1 Managerial Implications
As pressure increases to reduce the overall costs of contracts, managers are evaluating the costs and benefits of performing the contract administration function for each contract. Managers will need accurate information on the severity of consequences of typical problems for each type contract to determine the costs of poor contract performance and how to allocate human and financial resources.
For each of the problems that have been identified as high combined risk, the contracting officer can perform a risk analysis to identify causal risk factors, such as poor specifications, project manager, time frame, etc, and then utilize the proactive contract administration planning tools, that were discussed earlier in this paper, to avoid or minimize the consequences of any contract administration problems instead of wasting valuable resources reacting to problems. The procurement process, especially the pre award activities, can be viewed as a critical component of any project management plan. By effectively using the existing procurement process and using information on potential problems, the procurement official, can select the best option at each stage of the procurement process to achieve the overall goal of successful project completion-- receiving the correct product at the correct time at the correct price without delays or cost overruns. This will allow procurement officials to demonstrate they are providing “more service “ (contract and project management) at a lower cost (fewer delays and cost overruns), thereby also demonstrating the strategic value of procurement.
4.2 Future Research
To assess the generalizability of the results future research can be carried out with additional samples of United States and international procurement professionals using different measurement formats. Future research can also be done to assess the value of this research as a risk assessment tool in the project management process.
References
Abi-Karam, T. (2001). “Risk Management in Design Build.” Paper presented at the International Conference on Construction in the 21st Century, April 25-26, 2002, in Miami, Florida.
Ancona, D., Kochan, T. A., Scully, M., Van Maanen, J., & Westney, D. E. (2005). Managing for the Future: Organizational Behavior & Processes (3rd ed.).South-Western College Publishing; Boston, MA
Bartle, J. R., & LaCourse Korosec, R. (2001). Procurement and Contracting in State Government (A Report of the Government Performance Project). Syracuse University, The Maxwell School Campbell Public Affairs Institute; Syracuse, NY
Journal of Management Research ISSN 1941-899X
2009, Vol. 1, No. 2: E2
www.macrothink.org/jmr 19
Davison, B., & Sebastian, R. J. (in press a) The relationship between contract administration problems and contract type. Journal of Public Procurement
Davison, B., & Sebastian, R. J. (in press, b) A detailed analysis of the relationship between contract administration problems and contract type. Journal of Public Procurement
Davison, B., & Wright, E. (2004) Contract Administration (CA). Washington D.C.: National Institute of Government Purchasing.
Drabkin, D., & Thai, K. V., (2003) U.S. Federal Government Procurement: Structure, Process and Current Issues (IPSERA). International Purchasing and Supply Education and Research Association’s Comparative Public Procurement Cases Workshop, Budapest Hungary.
Harris, Kathy (1998). Worst Practices? Discovering Knowledge in Failures (Publication ID Number KA-04-9834). Gartner Group, Stamford CT
Gordon, S.B., Zemansky, S.D. & Sekwat, A., (2000), The Public Purchasing Profession Revisited. Journal of Public Budgeting, Accounting & Financial Management, 12 (2): 248-271
Hinson, C., & McCue C. P. (2004) Procurement Planning, Sourcing and Requirements Analysis, Herndon VA. National Institute of Government Purchasing.
McCue, C. P., & Gianakis, G. A. (2001) Public Purchasing: Who’s Minding the Store? Journal of Public Procurement, 1, (1),71-95.
McCue, C. P., & Pitzer, J. T. ( 2005) Fundamentals of Leadership and Management in Public Procurement. Washington D.C, National Institute of Government Purchasing .
McCue, C. P., & Pitzer, J. T. (2000) Centralized vs. Decentralized Purchasing: Current Trends in Governmental Procurement Practices. Journal of Public Budgeting, Accounting and Financial Management, 12(3), 400-420
National Institute of Government Purchasing (NIGP). 2000 Contract Management (CM), 1st Edition.
Schwartz, J. I. (2006) Regulation and Deregulation in Public Procurement Law Reform in the United States. Boca Raton, FL. PrAcademics Press.
Sherman, S. N. (1996). Government Procurement Management. Germantown, MD: Wordcrafters Publications.
Snyder, K.F. (2006) Procurement Leadership: From Means to End Journal of Public Procurement, 6, (3), 274-294
Thai, K.V. (2004) Introduction to Public Procurement (IPP). Washington D.C.: National Institute of Government Purchasing (NIGP).

Journal of Management Research ISSN 1941-899X
2009, Vol. 1, No. 2: E2
www.macrothink.org/jmr 20
Appendix
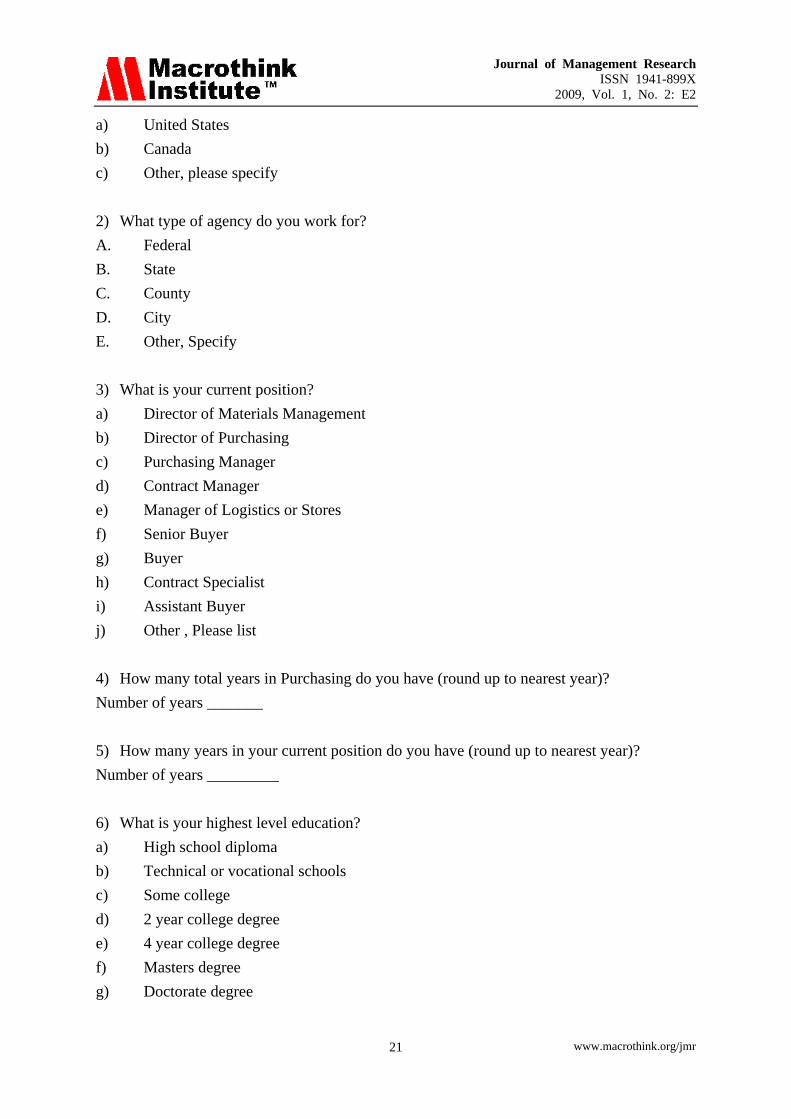
Appendix 1. Survey Letter Dear NIGP Member: We ask for your help in completing the following survey. It examines the relationship between the type of items or services procured and the problems typically encountered during contract administration. The results may help procurement professionals anticipate the types of administration problems that are likely to occur for specific types of purchases. This information, in turn, will help procurement professionals develop plans to avoid the problems or minimize their potential negative consequences. The survey will take approximately 10-15 minutes to complete. Your responses will be tabulated by university support personnel and will be completely confidential and anonymous. Please complete the survey at your earliest convenience or by May 8, 2006. Our survey is at the following location: http://surveys.stcloudstate.edu/contractsurvery/contractsurvey.htm Thank you in advance for your help. ---------------------------------------------------------------- The postcard sent to ISM members had the following information: "As part of the Institute for Supply Management(tm)'s mission to lead supply management, ISM encourages the pursuit of academic research. As a member of ISM, you have been selected to participate in this research project. Responding to the survey is completely voluntary. ISM Policy allows for the release of limited member information to researchers, to be used only for specific approved research projects." The Relationship between Contract Administration Problems and Contract Type http://surveys.stcloudstate.edu/contractsurvey/contractsurvey.htm We ask for your help in completing this survey. It examines the relationship between the type of items or services procured and the problems typically encountered during contract administration. The results may help procurement professionals anticipate the types of administration problems that are likely to occur for specific types of purchases. This information, in turn, will help procurement professionals develop plans to avoid the problems or minimize their potential negative consequences. The survey will take approximately 10-15 minutes to complete. Please complete the survey at your earliest convenience or by May 12, 2006. Thank you in advance for your help. Appendix 2. Survey Analysis of Contract Problems by Contract Type Survey April 2006 1) Country in which you work?
Journal of Management Research ISSN 1941-899X
2009, Vol. 1, No. 2: E2
www.macrothink.org/jmr 21
a) United States b) Canada c) Other, please specify 2) What type of agency do you work for? A. Federal B. State C. County D. City E. Other, Specify 3) What is your current position? a) Director of Materials Management b) Director of Purchasing c) Purchasing Manager d) Contract Manager e) Manager of Logistics or Stores f) Senior Buyer g) Buyer h) Contract Specialist i) Assistant Buyer j) Other , Please list 4) How many total years in Purchasing do you have (round up to nearest year)? Number of years _______ 5) How many years in your current position do you have (round up to nearest year)? Number of years _________ 6) What is your highest level education? a) High school diploma b) Technical or vocational schools c) Some college d) 2 year college degree e) 4 year college degree f) Masters degree g) Doctorate degree
Journal of Management Research ISSN 1941-899X
2009, Vol. 1, No. 2: E2
www.macrothink.org/jmr 22
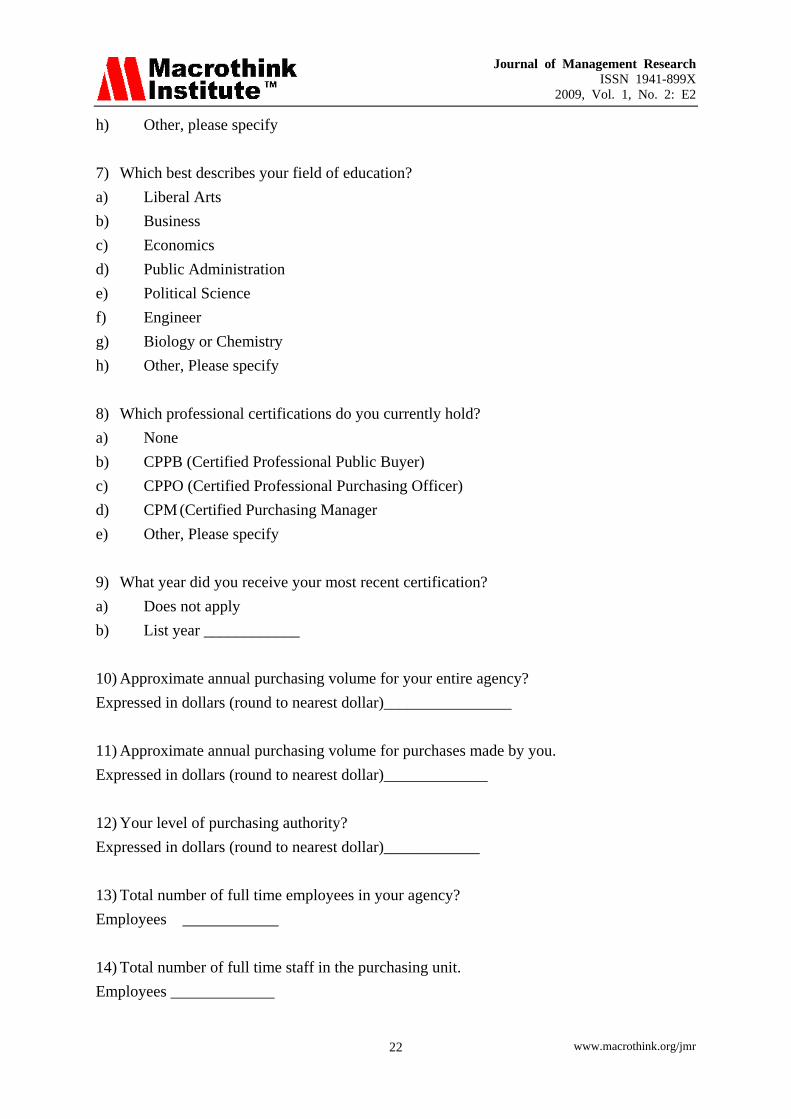
h) Other, please specify 7) Which best describes your field of education? a) Liberal Arts b) Business c) Economics d) Public Administration e) Political Science f) Engineer g) Biology or Chemistry h) Other, Please specify 8) Which professional certifications do you currently hold? a) None b) CPPB (Certified Professional Public Buyer) c) CPPO (Certified Professional Purchasing Officer) d) CPM (Certified Purchasing Manager e) Other, Please specify 9) What year did you receive your most recent certification? a) Does not apply b) List year ____________ 10) Approximate annual purchasing volume for your entire agency? Expressed in dollars (round to nearest dollar)________________ 11) Approximate annual purchasing volume for purchases made by you. Expressed in dollars (round to nearest dollar)_____________ 12) Your level of purchasing authority? Expressed in dollars (round to nearest dollar)____________ 13) Total number of full time employees in your agency? Employees ____________ 14) Total number of full time staff in the purchasing unit. Employees _____________

Journal of Management Research ISSN 1941-899X
2009, Vol. 1, No. 2: E2
www.macrothink.org/jmr 23
15) From the list of types of purchases identify the items you currently have responsibility for purchasing (check all that apply). Refer to definitions below. a) Commodities b) Capital Outlay c) Professional Services d) Contracted Services e) Software f) Leases g) Construction h) Other, please Specify 16) Within the past year estimate the number of purchase orders or contracts you have issued for each type of purchase. a) Commodities number of purchases _________ b) Capital Outlay number of purchases _________ c) Professional Services number of purchases _________ d) Contracted Services number of purchases _________ e) Software number of purchases _________ f) Leases number of purchases _________ g) Construction number of purchases _________ h) Other, please Specify number of purchases _________ Please use the following definitions in answering Question 17 & 18. Contract Purchase Types Commodities: MRO (Maintenance, Repair, Supplies) Office supplies, one time orders for durable goods under $5,000, blanket contracts. Capital Outlay: Durable goods over $5000 Professional Services: Architects, Consultants, Contracted Services: Custodial Services, Food Service etc. Software: Custom developed and shrink wrap. Leases: Leased Space or equipment – lease without intent to own Construction: Any type and any dollar amount – New construction or remodeling Contract Management Definitions Wrong Product received: Purchase order or contract clearly identifies correct product, but vendor ships incorrect. No dispute involved. Delay Purchase order or contract has a clearly stated delivery completion date. Delivery/completion is late (any length of time) due to either vendor or agency cause (any reason).
Journal of Management Research ISSN 1941-899X
2009, Vol. 1, No. 2: E2
www.macrothink.org/jmr 24
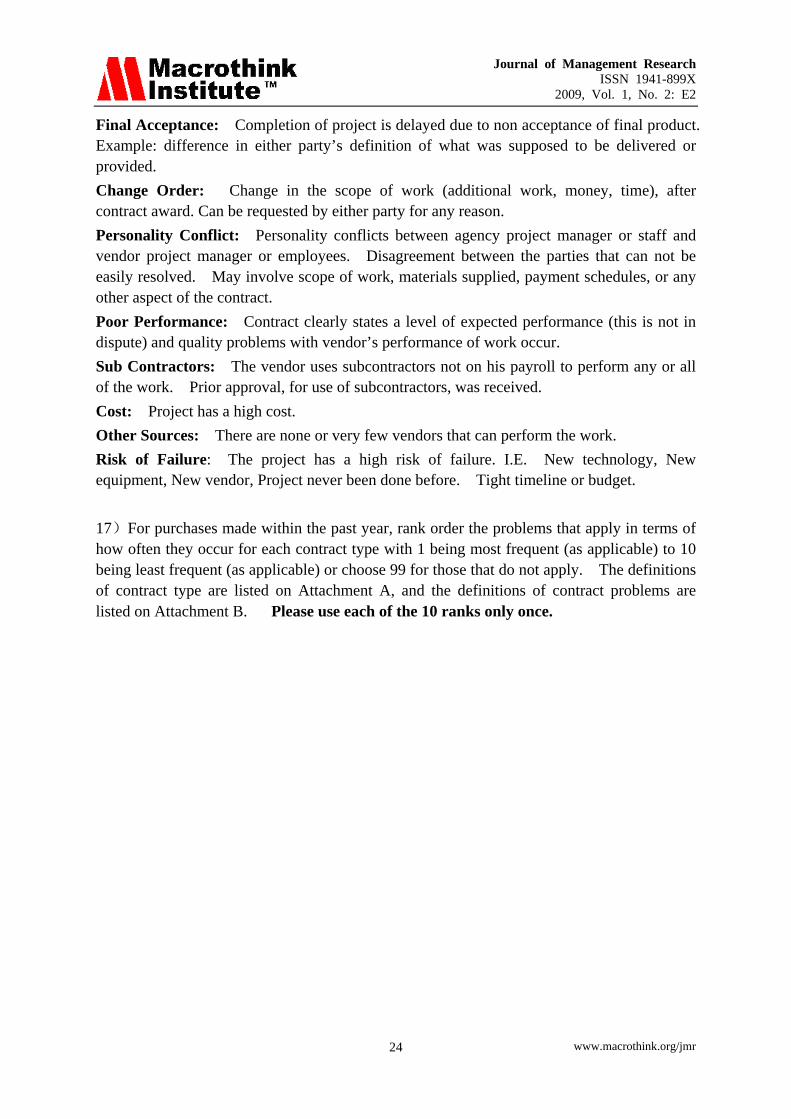
Final Acceptance: Completion of project is delayed due to non acceptance of final product. Example: difference in either party’s definition of what was supposed to be delivered or provided. Change Order: Change in the scope of work (additional work, money, time), after contract award. Can be requested by either party for any reason. Personality Conflict: Personality conflicts between agency project manager or staff and vendor project manager or employees. Disagreement between the parties that can not be easily resolved. May involve scope of work, materials supplied, payment schedules, or any other aspect of the contract. Poor Performance: Contract clearly states a level of expected performance (this is not in dispute) and quality problems with vendor’s performance of work occur. Sub Contractors: The vendor uses subcontractors not on his payroll to perform any or all of the work. Prior approval, for use of subcontractors, was received. Cost: Project has a high cost. Other Sources: There are none or very few vendors that can perform the work. Risk of Failure: The project has a high risk of failure. I.E. New technology, New equipment, New vendor, Project never been done before. Tight timeline or budget. 17)For purchases made within the past year, rank order the problems that apply in terms of how often they occur for each contract type with 1 being most frequent (as applicable) to 10 being least frequent (as applicable) or choose 99 for those that do not apply. The definitions of contract type are listed on Attachment A, and the definitions of contract problems are listed on Attachment B. Please use each of the 10 ranks only once.
Journal of Management Research ISSN 1941-899X
2009, Vol. 1, No. 2: E2
www.macrothink.org/jmr 25
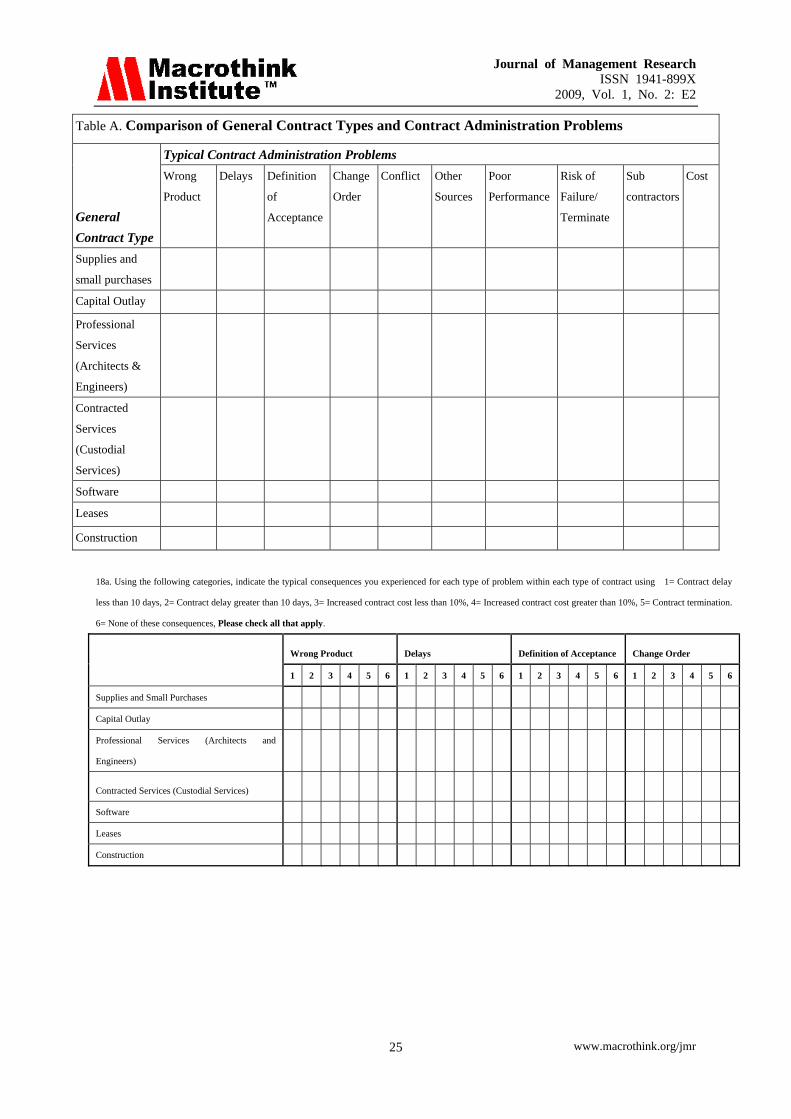
Table A. Comparison of General Contract Types and Contract Administration Problems
General Contract Type
Typical Contract Administration Problems Wrong
Product
Delays Definition
of
Acceptance
Change
Order
Conflict Other
Sources
Poor
Performance
Risk of
Failure/
Terminate
Sub
contractors
Cost
Supplies and
small purchases
Capital Outlay Professional
Services
(Architects &
Engineers)
Contracted
Services
(Custodial
Services)
Software Leases Construction
18a. Using the following categories, indicate the typical consequences you experienced for each type of problem within each type of contract using 1= Contract delay
less than 10 days, 2= Contract delay greater than 10 days, 3= Increased contract cost less than 10%, 4= Increased contract cost greater than 10%, 5= Contract termination.
6= None of these consequences, Please check all that apply.
Wrong Product Delays Definition of Acceptance Change Order
1 2 3 4 5 6 1 2 3 4 5 6 1 2 3 4 5 6 1 2 3 4 5 6
Supplies and Small Purchases Capital Outlay Professional Services (Architects and
Engineers)
Contracted Services (Custodial Services) Software Leases Construction

Journal of Management Research ISSN 1941-899X
2009, Vol. 1, No. 2: E2
www.macrothink.org/jmr 26
18b. Using the following categories, indicate the typical consequences you experienced for each type of problem within each type of contract
using 1=Contract delay less than 10 days, 2=Contract delay greater than 10 days, 3=Increased contract cost less than 10%, 4= Increased
contract cost greater than 10%, 5=Contract termination, 6=None of these consequences, Please check all that apply.
Conflict Other Sources Poor Performance
1 2 3 4 5 6 1 2 3 4 5 6 1 2 3 4 5 6
Supplies and Small Purchases Capital Outlay
Professional Services (Architects and Engineers)
Contracted Services (Custodial Services) Software Leases Construction 18c. Using the following categories, indicate the typical consequences you experienced for each type of problem within each type of contract
using 1=Contract delay less than 10 days, 2=Contract delay greater than 10 days, 3=Increased contract cost less than 10%, 4= Increased
contract cost greater than 10%, 5=Contract termination, 6=None of these consequences, Please check all that apply.
Risk of Failure/
Terminate Sub contractors Cost
1 2 3 4 5 6 1 2 3 4 5 6 1 2 3 4 5 6
Supplies and Small Purchases Capital Outlay
Professional Services (Architects and Engineers)
Contracted Services (Custodial Services) Software Leases Construction
Appendix 3. Results of Davison-Sebastian research on the relationship of contract administration problem and contract type. Means within a column form homogeneous subsets and means within the table that do not share a common subscript are significantly different at the .05 level.

Journal of Management Research ISSN 1941-899X
2009, Vol. 1, No. 2: E2
www.macrothink.org/jmr 27
Table 1. Supplies and Small Purchases
Problem N 1 2 3 Delays 290 5.75a Cost 233 6.59ab 6.59b Poor Performance 266 6.71b Change Order 249 6.76b Wrong Product 291 6.81b Other Sources 209 6.84b Conflict 227 7.31bc 7.31c Defn of Acceptance 229 7.38bc 7.38c Risk of Failure 200 7.74d Sub Contractors. 156 7.99d
Table 2. Capital Outlay
Problem N 1 2 3 4 5 Delays 207 5.70a Cost 177 6.14ab 6.14b Change Order 188 6.40ab 6.40b 6.40bcd Poor Performance 185 6.83bc 6.83bcd 6.83bcde Other Sources 154 6.89bc 6.89bcd 6.89bcde Conflict 180 7.26d 7.26de 7.26 Sub Contractors. 139 7.29d 7.29de 7.29 Defn of Acceptance 177 7.31d 7.31de 7.31 Risk of Failure 164 7.58e 7.58 Wrong Product 166 8.19
Table 3. Professional Services
Problem N 1 2 3 4 Change Order 213 5.45a Delays 204 5.75ab 5.75ab Cost 196 5.76ab 5.76ab Conflict 197 6.25ab 6.25abc 6.25abc Defn of Acceptance 190 6.52bc 6.52bc Poor Performance 208 6.55bc 6.55bc Sub Contractors. 166 6.80c Other Sources 148 6.95c Risk of Failure 186 7.03c Wrong Product 131 8.25d
Journal of Management Research ISSN 1941-899X
2009, Vol. 1, No. 2: E2
www.macrothink.org/jmr 28
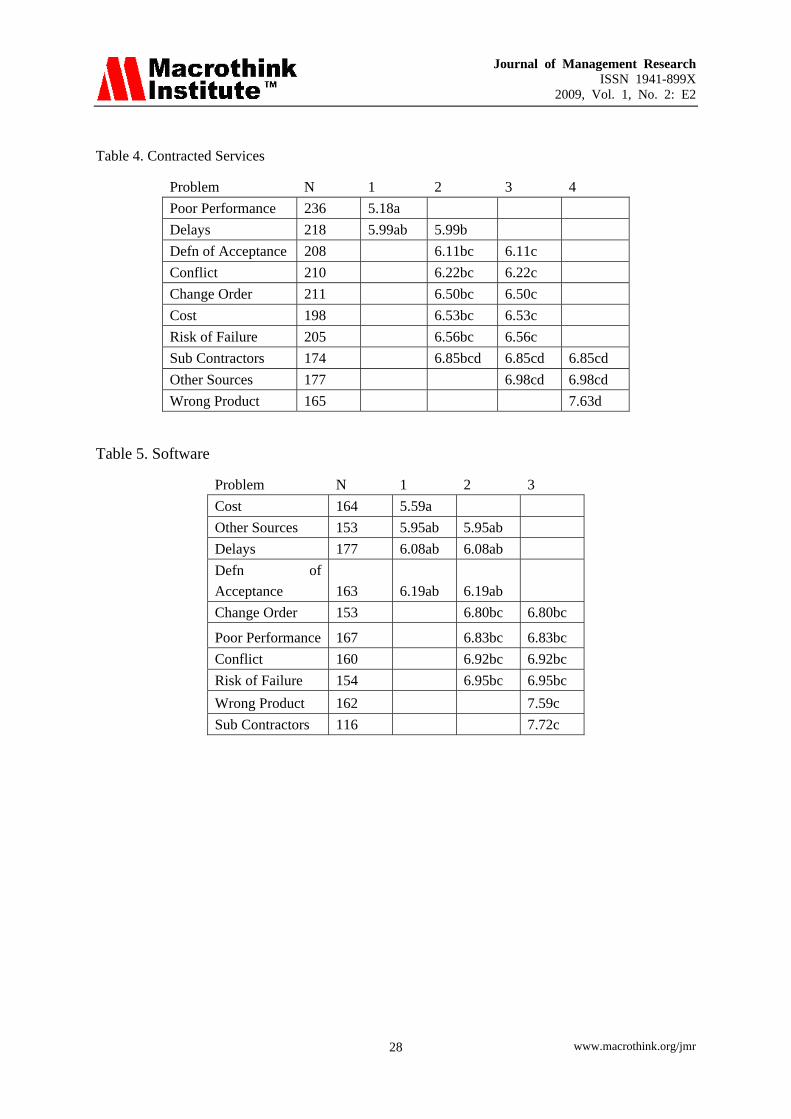
Table 4. Contracted Services
Problem N 1 2 3 4 Poor Performance 236 5.18a Delays 218 5.99ab 5.99b Defn of Acceptance 208 6.11bc 6.11c Conflict 210 6.22bc 6.22c Change Order 211 6.50bc 6.50c Cost 198 6.53bc 6.53c Risk of Failure 205 6.56bc 6.56c Sub Contractors 174 6.85bcd 6.85cd 6.85cd Other Sources 177 6.98cd 6.98cd Wrong Product 165 7.63d
Table 5. Software
Problem N 1 2 3 Cost 164 5.59a Other Sources 153 5.95ab 5.95ab Delays 177 6.08ab 6.08ab Defn of Acceptance 163 6.19ab 6.19ab Change Order 153 6.80bc 6.80bc
Poor Performance 167 6.83bc 6.83bc Conflict 160 6.92bc 6.92bc Risk of Failure 154 6.95bc 6.95bc Wrong Product 162 7.59c Sub Contractors 116 7.72c

Journal of Management Research ISSN 1941-899X
2009, Vol. 1, No. 2: E2
www.macrothink.org/jmr 29
Table 6. Leases
Problem N 1 2 Cost 126 6.06a Other Sources 111 6.87a 6.87ab Delays 121 6.93a 6.93ab Poor Performance 127 6.94a 6.94ab Defn of Acceptance 119 6.96a 6.96ab Change Order 118 7.06a 7.06ab Conflict 128 7.08a 7.08ab Risk of Failure 119 7.24a 7.24ab Sub Contractors 78 7.44b Wrong Product 93 7.68b
Table 7. Construction
Problem N 1 2 3 4 Change Order 178 4.74a Delays 176 4.81a Cost 154 5.52a 5.52ab Sub Contractors 162 5.89b Conflict 168 6.12b 6.12bc Defn of Acceptance 162 6.22b 6.22bc Poor Performance 173 6.27b 6.27bc Risk of Failure 161 6.93bc 6.93cd Wrong Product 130 7.53d Other Sources 132 7.54d
Table 8. Wrong Product
Contract N 1 2 Supplies 291 6.81a Construction 130 7.53ab 7.53ab
Software 162 7.59ab 7.59ab
Contracted Services 165 7.63ab 7.63ab
Leases 93 7.68ab 7.68ab
Capital Outlay 166 8.19b
Prof. Services 131 8.25b

Journal of Management Research ISSN 1941-899X
2009, Vol. 1, No. 2: E2
www.macrothink.org/jmr 30
Table 9. Delays
Contract N 1 2 3 Construction 176 4.81a Capital Outlay 207 5.70a 5.70ab Prof. Services 204 5.75a 5.75ab Supplies 290 5.75a 5.75ab Contracted Services 218 5.99b 5.99bc Software 177 6.08b 6.08bc Lease 121 6.93c
Table 10. Definition of Acceptance
Contract N 1 2 Contracted Services 208 6.11a Software 163 6.19a Construction 162 6.22a Prof. Services 190 6.52a 6.52ab Leases 119 6.96a 6.96ab Capital Outlay 117 7.31b Supplies 229 7.38b
Table 11. Change Order
Contract N 1 2 Construction 178 4.74a Prof. Services 213 5.45a Capital Outlay 188 6.40b Contracted Services 211 6.50b Supplies 249 6.76b Software 153 6.80b Leases 118 7.06b
Table 12. Conflict
Contract N 1 2 3 Construction 168 6.12a Contracted Services 210 6.22a 6.22ab Prof. Services 197 6.25a 6.25ab Software 160 6.92a 6.92ab 6.92bc Leases 128 7.08b 7.08bc Capital Outlay 180 7.26c Supplies 227 7.31c

Journal of Management Research ISSN 1941-899X
2009, Vol. 1, No. 2: E2
www.macrothink.org/jmr 31
Table13. Other Sources
Contract N 1 2 Software 153 5.95a Supplies 209 6.84a 6.84ab Leases 111 6.87a 6.87ab Capital Outlay 154 6.89a 6.89ab Prof. Services 148 6.95b Contracted Services 177 6.98b Construction 132 7.54b
Table 14. Poor Performance
Contract N 1 2 Contracted Services 236 5.18a Construction 173 6.27b Prof. Services 208 6.55b Supplies 266 6.71b Software 167 6.83b Capital Outlay 185 6.83b Leases 127 6.94b
Table 15. Risk of Failure
Contract N 1 2 Contracted Services 205 6.56a Construction 161 6.93a 6.93ab Software 154 6.95a 6.95ab Prof. Services 186 7.03a 7.03ab Leases 119 7.24a 7.24ab Capital Outlay 164 7.58b Supplies 200 7.74b

Journal of Management Research ISSN 1941-899X
2009, Vol. 1, No. 2: E2
www.macrothink.org/jmr 32
Table 16. SubContractors
Contract N 1 2 3 Construction 162 5.89a Prof. Services 166 6.80a 6.80ab Contracted Services 174 6.85a 6.85ab Capital Outlay 139 7.29b 7.29bc Leases 78 7.44b 7.44bc Software 116 7.72b 7.72bc Supplies 156 7.99c
Table 17. Cost
Contract N 1 2 3 Construction 154 5.52a Software 164 5.59a 5.59ab Prof. Services 196 5.76a 5.76ab 5.76bc Leases 126 6.06a 6.06ab 6.06bc Capital Outlay 177 6.14a 6.14ab 6.14bc Contracted Services 198 6.53ab 6.53bc Supplies 233 6.59c