Embed Size (px)
Citation preview
An Analysis of the Evolving ASEAN-China Trade LinkagesKEVIN C. CHUA, PH.D. RONALD U. MENDOZA, PH.D. MONICA M. MELCHORS H A N D O N G U N I V E R S I T Y A S I A N I N S T I T U T E O F M A N AG E M E N T A S I A N I N S T I T U T E O F M A N AG E M E N T
C E N T E R F O R E C O N O M I C R E S E A RC H P O L I CY C E N T E R P O L I CY C E N T E R
KC H U A @ S D U . E D U . C N R U M E N D O Z A @ A I M . E D U M M E L C H O R @ A I M . E D U
ASEAN and China – strategic trade partners or competitors?◦ Growing bilateral trade◦ While simultaneously competing in the exports of major goods to similar trade destinations
Quick survey of literature
Scope of paper◦ Reviews ASEAN-China trade statistics to assess the economic importance of China to ASEAN and vice-
versa.◦ Explores whether the evolving trade relations are competitive or complementary◦ Discusses the regional production chain to illustrate opportunities for ASEAN to promote mutual growth
with China
Background and Motivation

Data Inconsistencies across SourcesDatabase Comparison of ASEAN Trade with China (In US$ Billions)
ASEANstats Database China Statistical Yearbook UNCTADstat Database
Year Export Import Net Balanc
e
Total Volum
e
Export
Import Net Balanc
e
Total Volume
Export Import
Net Balanc
e
Total Volume
2000 14.2 18.1 -3.9 32.3 22.2 17.3 4.8 39.5 16.5 20.2 -3.7 36.72001 14.5 17.4 -2.9 31.9 23.2 18.4 4.8 41.6 16.7 21.0 -4.3 37.72002 19.5 23.2 -3.7 42.8 31.2 23.6 7.6 54.8 21.9 28.0 -6.1 49.92003 29.1 30.6 -1.5 59.6 47.3 30.9 16.4 78.3 30.9 34.2 -3.3 65.12004 41.4 47.7 -6.4 89.1 63.0 42.9 20.1 105.9 41.6 48.4 -6.8 90.02005 52.3 61.1 -8.9 113.4 75.0 55.4 19.6 130.4 52.7 63.0 -10.3 115.72006 65.0 75.0 -9.9 139.7 89.5 69.5 20.0 159.0 66.7 78.7 -11.9 145.42007 77.9 93.2 -15.2 171.1 108.4 94.1 14.2 202.5 79.1 98.0 -18.9 177.12008 87.6 109.3 -21.7 196.9 117.0 114.3 2.7 231.3 88.7 113.2 -24.4 201.92009 81.6 96.6 -15.0 178.2 106.7 106.3 0.4 213.0 82.4 97.5 -15.1 179.92010 118.5 117.7 0.8 236.2 154.7 138.2 16.5 292.9 113.7 127.2 -13.5 240.92011 142.5 147.1 -4.6 289.7 193.0 170.1 22.9 363.1 142.5 157.1 -14.6 299.62012 141.9 177.6 -35.7 319.5 195.9 204.3 -8.4 400.1 141.9 178.7 -36.8 320.62013 - - - - - - - - 153.2 205.0 -51.8 358.2
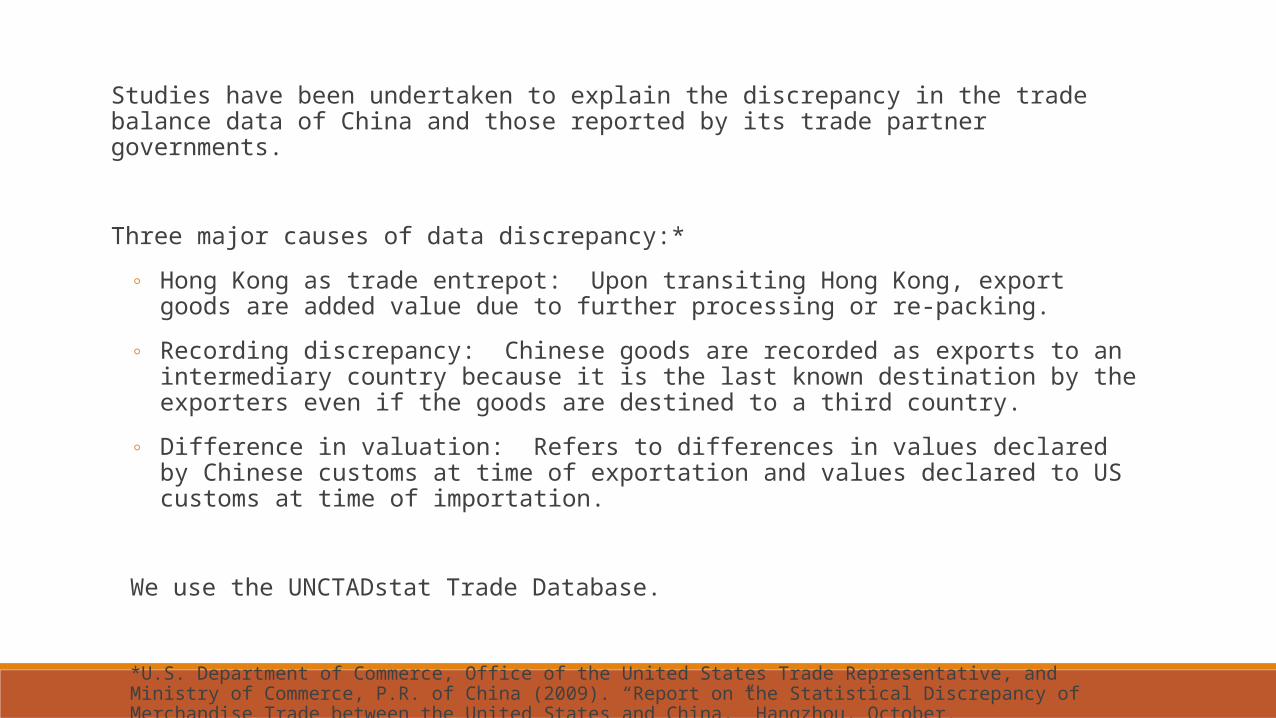
Studies have been undertaken to explain the discrepancy in the trade balance data of China and those reported by its trade partner governments.
Three major causes of data discrepancy:*
◦ Hong Kong as trade entrepot: Upon transiting Hong Kong, export goods are added value due to further processing or re-packing.
◦ Recording discrepancy: Chinese goods are recorded as exports to an intermediary country because it is the last known destination by the exporters even if the goods are destined to a third country.
◦ Difference in valuation: Refers to differences in values declared by Chinese customs at time of exportation and values declared to US customs at time of importation.
We use the UNCTADstat Trade Database.
*U.S. Department of Commerce, Office of the United States Trade Representative, and Ministry of Commerce, P.R. of China (2009). “Report on the Statistical Discrepancy of Merchandise Trade between the United States and China,” Hangzhou, October.
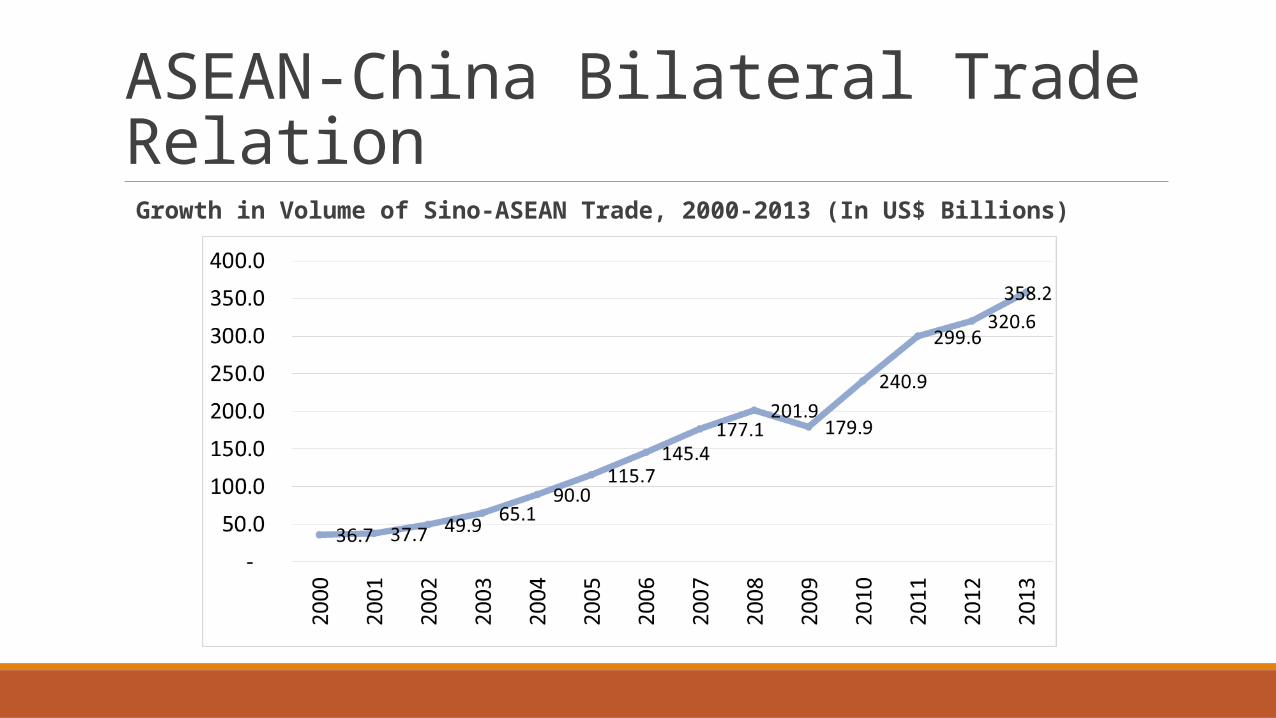
Growth in Volume of Sino-ASEAN Trade, 2000-2013 (In US$ Billions)
ASEAN-China Bilateral Trade Relation
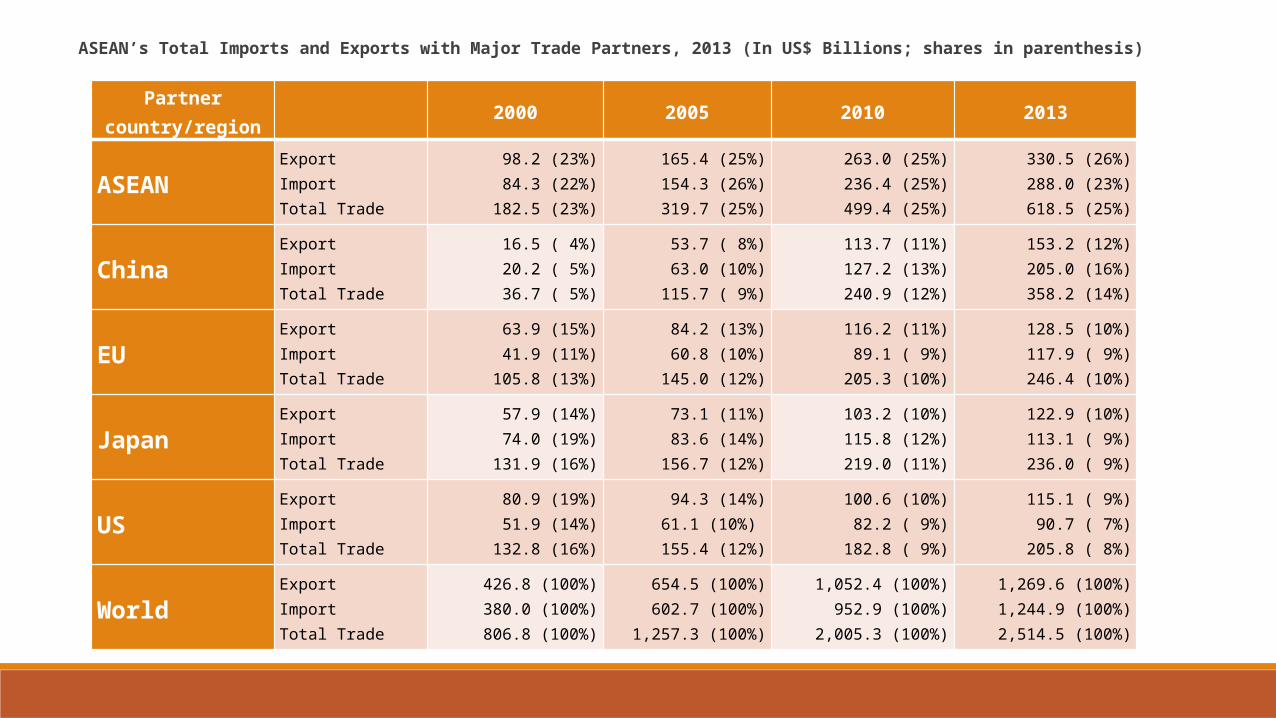
ASEAN’s Total Imports and Exports with Major Trade Partners, 2013 (In US$ Billions; shares in parenthesis)
Partner country/region 2000 2005 2010 2013
ASEANExportImportTotal Trade
98.2 (23%)84.3 (22%)
182.5 (23%)
165.4 (25%)154.3 (26%)319.7 (25%)
263.0 (25%)236.4 (25%)499.4 (25%)
330.5 (26%)288.0 (23%)618.5 (25%)
ChinaExportImportTotal Trade
16.5 ( 4%)20.2 ( 5%)36.7 ( 5%)
53.7 ( 8%)63.0 (10%)
115.7 ( 9%)
113.7 (11%)127.2 (13%)240.9 (12%)
153.2 (12%)205.0 (16%)358.2 (14%)
EU ExportImportTotal Trade
63.9 (15%)41.9 (11%)
105.8 (13%)
84.2 (13%)60.8 (10%)
145.0 (12%)
116.2 (11%)89.1 ( 9%)
205.3 (10%)
128.5 (10%)117.9 ( 9%)
246.4 (10%)
JapanExportImportTotal Trade
57.9 (14%)74.0 (19%)
131.9 (16%)
73.1 (11%)83.6 (14%)
156.7 (12%)
103.2 (10%)115.8 (12%)219.0 (11%)
122.9 (10%)113.1 ( 9%)236.0 ( 9%)
USExportImportTotal Trade
80.9 (19%)51.9 (14%)
132.8 (16%)
94.3 (14%)61.1 (10%)
155.4 (12%)
100.6 (10%)82.2 ( 9%)
182.8 ( 9%)
115.1 ( 9%)90.7 ( 7%)
205.8 ( 8%)
WorldExportImportTotal Trade
426.8 (100%)380.0 (100%)806.8 (100%)
654.5 (100%)602.7 (100%)
1,257.3 (100%)
1,052.4 (100%)952.9 (100%)
2,005.3 (100%)
1,269.6 (100%)1,244.9 (100%)2,514.5 (100%)
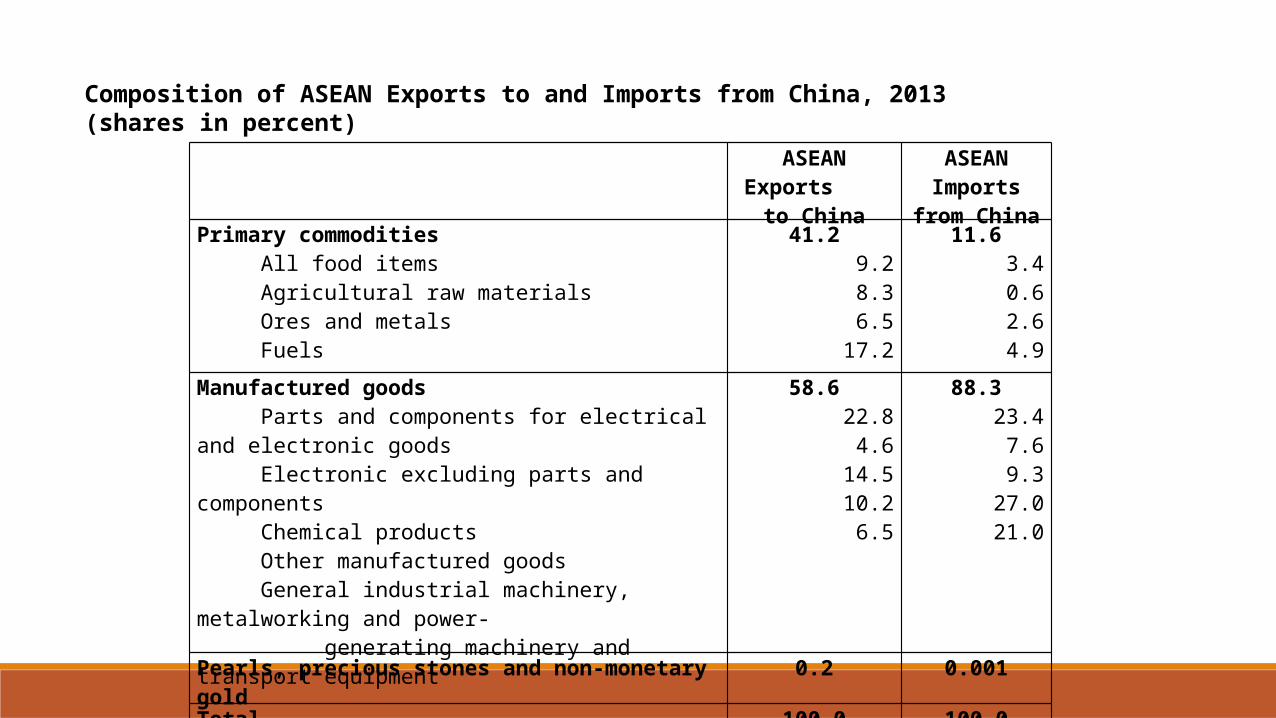
Composition of ASEAN Exports to and Imports from China, 2013 (shares in percent)
ASEAN Exports to China
ASEAN Imports from China
Primary commodities All food items Agricultural raw materials Ores and metals Fuels
41.29.28.36.5
17.2
11.63.40.62.64.9
Manufactured goods Parts and components for electrical and electronic goods Electronic excluding parts and components Chemical products Other manufactured goods General industrial machinery, metalworking and power- generating machinery and transport equipment
58.622.8
4.614.510.2
6.5
88.323.4
7.69.3
27.021.0
Pearls, precious stones and non-monetary gold 0.2 0.001
Total 100.0 100.0

The diversity among ASEAN economies leads to diverse trade performance with China.
ASEAN Member Country Trade with China, 2003, 2013 (In US$ Billions)
Country
2003 2013
Trade Volume
Share of ASEAN Trade
RankTrade
Volume
Share of ASEAN Trade
Rank
Brunei 0.3 0.5% 8 0.5 0.1% 10Cambodia 0.3 0.5% 9 3.2 0.9% 8Indonesia 7.4 11.4% 4 54.3 15.2% 5Laos 0.07 0.1% 10 1.2 0.3% 9Malaysia 14.1 21.6% 2 64.6 18.0% 3Myanmar 0.8 1.3% 7 4.2 1.2% 7Philippines 4.1 6.3% 6 15.1 4.2% 6Singapore 21.2 32.6% 1 92.3 25.8% 1Thailand 11.8 18.1% 3 65.0 18.1% 2Viet Nam 5.0 7.7% 5 57.8 16.1% 4Total ASEAN
65.1 100.0% 358.2 100.0%

ASEAN Countries Export-Import Ratio relative to China, 2000-2013
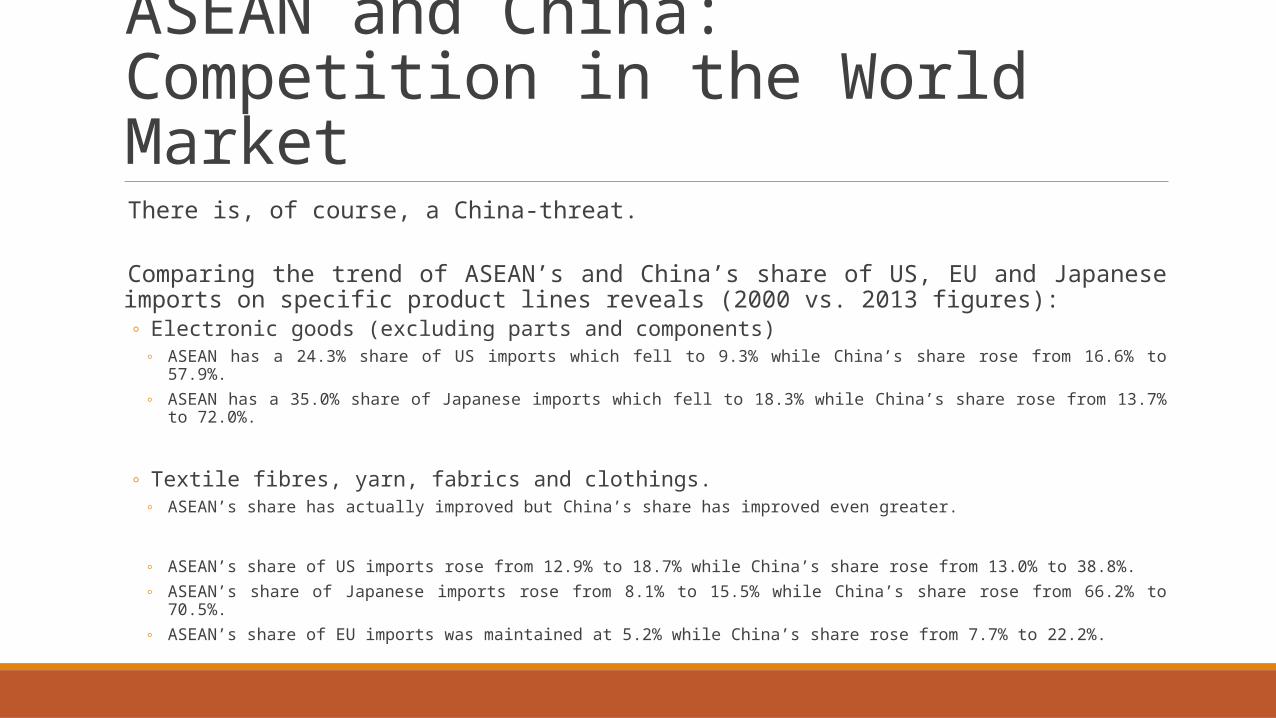
There is, of course, a China-threat.
Comparing the trend of ASEAN’s and China’s share of US, EU and Japanese imports on specific product lines reveals (2000 vs. 2013 figures):
◦ Electronic goods (excluding parts and components)◦ ASEAN has a 24.3% share of US imports which fell to 9.3% while China’s share rose from 16.6% to 57.9%.◦ ASEAN has a 35.0% share of Japanese imports which fell to 18.3% while China’s share rose from 13.7% to 72.0%.
◦ Textile fibres, yarn, fabrics and clothings.◦ ASEAN’s share has actually improved but China’s share has improved even greater.
◦ ASEAN’s share of US imports rose from 12.9% to 18.7% while China’s share rose from 13.0% to 38.8%.◦ ASEAN’s share of Japanese imports rose from 8.1% to 15.5% while China’s share rose from 66.2% to 70.5%.◦ ASEAN’s share of EU imports was maintained at 5.2% while China’s share rose from 7.7% to 22.2%.
ASEAN and China: Competition in the World Market

Balassa (1965) introduced the revealed comparative advantage (RCA) index to measure a country’s export performance vis-a-vis a set of countries for a specific commodity or industry.
◦ The comparative advantage is ‘revealed’ through the observed patterns of trade, instead of using
autarky prices which theories are generally unobservable.
The RCA index is computed as:
where refers to exports, is a country, is a set of countries, is a commodity or industry, and is a set of commodities or industries.

RCA Index on Manufactured Goods based on Degree of Manufacturing, 2013 ASEAN Countries (less Brunei, Laos, and Myanmar) and China
Manufactured goods China Cambodia Indonesia Malaysia Philippines Singapore Thailand Viet Nam
Labor-intensive and resource-intensive manufactures
1.76 6.67 2.82 0.77 0.98 0.14 0.70 3.53
Low-skill and technology-intensive manufactures
1.07 0.43 0.81 0.50 0.44 0.45 0.76 0.73
Medium-skill and technology-intensive manufactures
0.71 0.08 0.73 0.57 0.74 0.58 1.17 0.41
High-skill and technology-intensive manufactures
0.98 0.07 0.68 1.56 1.36 1.77 1.02 0.74
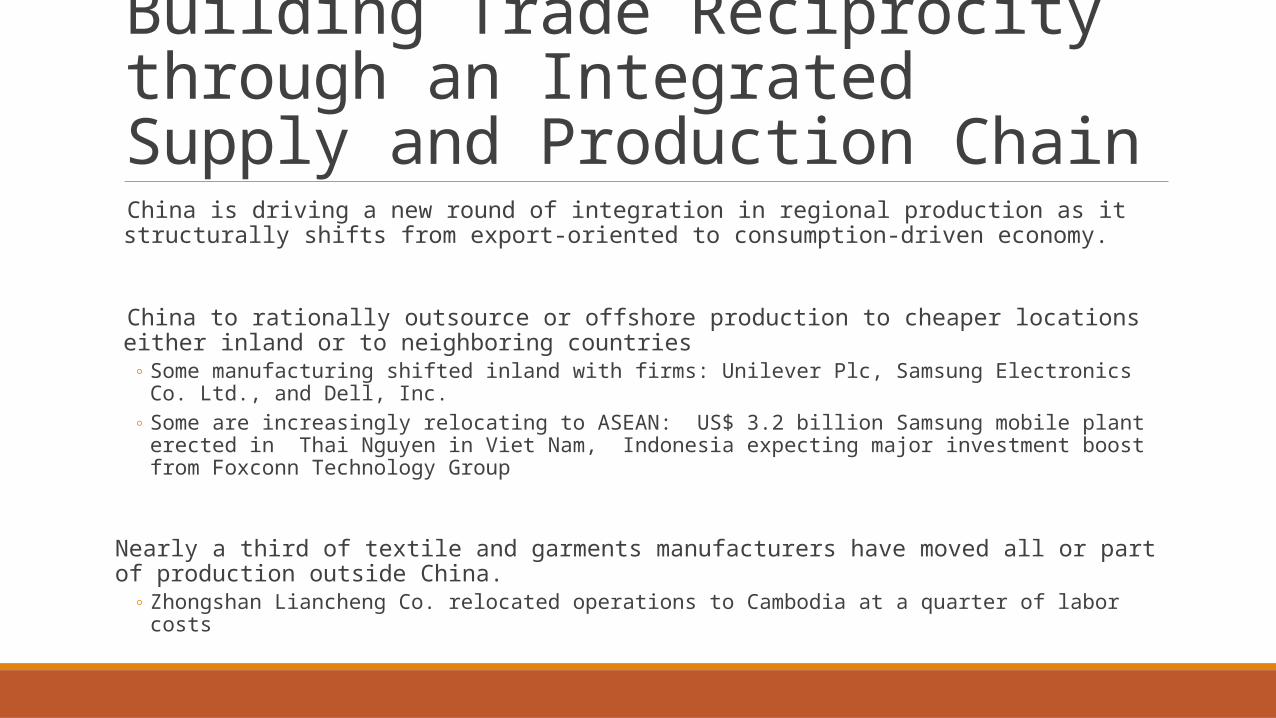
China is driving a new round of integration in regional production as it structurally shifts from export-oriented to consumption-driven economy.
China to rationally outsource or offshore production to cheaper locations either inland or to neighboring countries
◦ Some manufacturing shifted inland with firms: Unilever Plc, Samsung Electronics Co. Ltd., and Dell, Inc.◦ Some are increasingly relocating to ASEAN: US$ 3.2 billion Samsung mobile plant erected in Thai
Nguyen in Viet Nam, Indonesia expecting major investment boost from Foxconn Technology Group
Nearly a third of textile and garments manufacturers have moved all or part of production outside China.
◦ Zhongshan Liancheng Co. relocated operations to Cambodia at a quarter of labor costs
Building Trade Reciprocity through an Integrated Supply and Production Chain
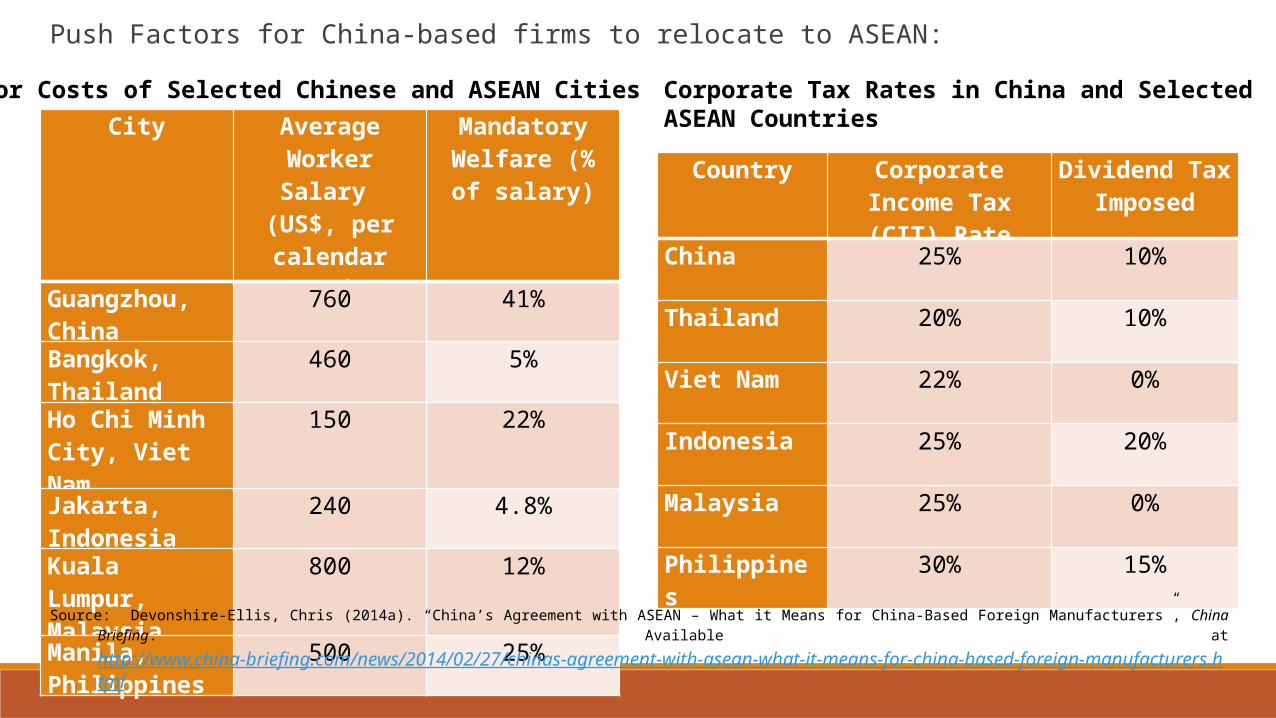
Labor Costs of Selected Chinese and ASEAN CitiesCity Average Worker
Salary (US$, per calendar month)
Mandatory Welfare (% of
salary)
Guangzhou, China
760 41%
Bangkok, Thailand
460 5%
Ho Chi Minh City, Viet Nam
150 22%
Jakarta, Indonesia
240 4.8%
Kuala Lumpur, Malaysia
800 12%
Manila, Philippines
500 25%
Corporate Tax Rates in China and Selected ASEAN Countries
Country Corporate Income Tax (CIT) Rate
Dividend Tax Imposed
China 25% 10%
Thailand 20% 10%
Viet Nam 22% 0%
Indonesia 25% 20%
Malaysia 25% 0%
Philippines 30% 15%
Source: Devonshire-Ellis, Chris (2014a). “China’s Agreement with ASEAN – What it Means for China-Based Foreign Manufacturers”, China Briefing. Available at
http://www.china-briefing.com/news/2014/02/27/chinas-agreement-with-asean-what-it-means-for-china-based-foreign-manufacturers.html
Push Factors for China-based firms to relocate to ASEAN:
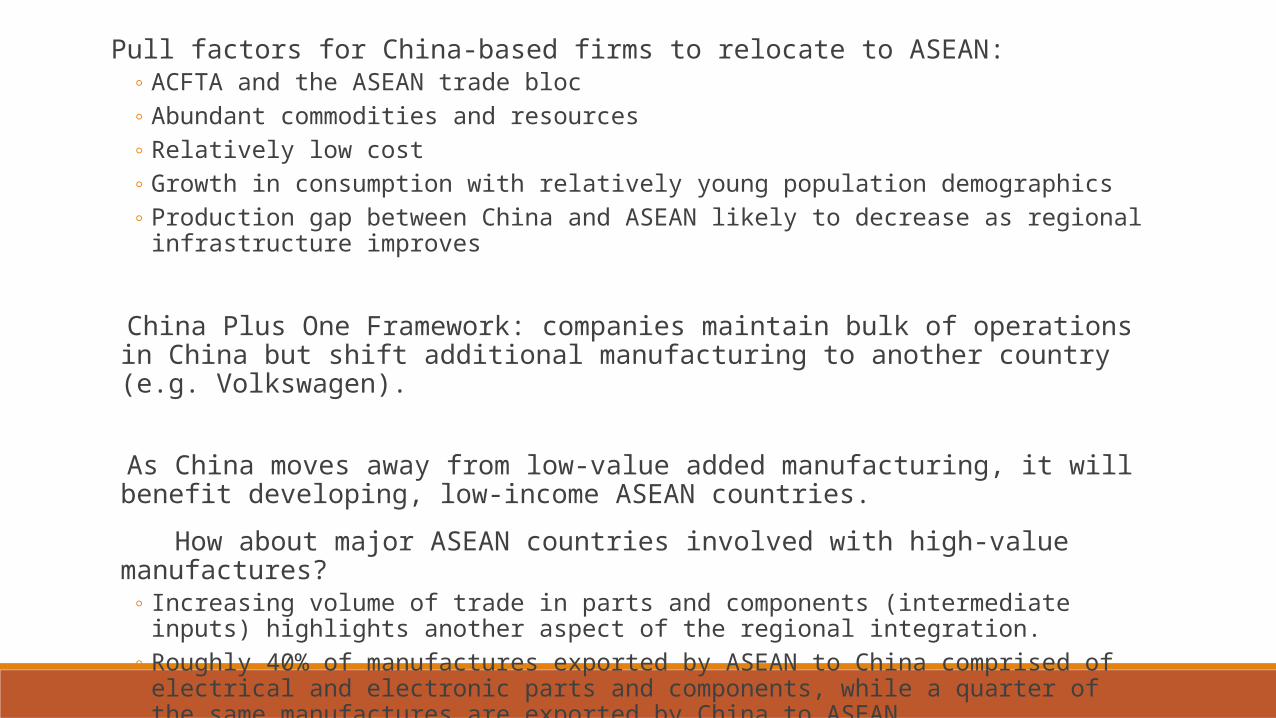
Pull factors for China-based firms to relocate to ASEAN:◦ ACFTA and the ASEAN trade bloc◦ Abundant commodities and resources◦ Relatively low cost◦ Growth in consumption with relatively young population demographics◦ Production gap between China and ASEAN likely to decrease as regional infrastructure improves
China Plus One Framework: companies maintain bulk of operations in China but shift additional manufacturing to another country (e.g. Volkswagen).
As China moves away from low-value added manufacturing, it will benefit developing, low-income ASEAN countries.
How about major ASEAN countries involved with high-value manufactures?◦ Increasing volume of trade in parts and components (intermediate inputs) highlights another aspect
of the regional integration.◦ Roughly 40% of manufactures exported by ASEAN to China comprised of electrical and electronic parts
and components, while a quarter of the same manufactures are exported by China to ASEAN.
Diversity among ASEAN economies leads to uneven relations between each country with China.
ASEAN, as a whole, benefits from its relation with China primarily since China offers itself as a huge market for ASEAN products. China has become ASEAN’s second largest trading partner.
The two regions are becoming more engaged, highlighted by the slow but sure emergence of an integrated regional supply chain.
Low-income ASEAN economies are benefitting in the shift of low-value manufacturing industries into their countries. The rest see a threat as China takes over production of high-value manufactures.
Strengthening the trade in parts and components is a way to improve trade complementarities.
Dealing with the realities of an advancing ASEAN-China economic integration means each country enhances its competitive advantages, finds a niche in the regional production chain, and manages the competition with its neighbor.
Conclusion

Thank you.KEVIN C. CHUA, PH.D. [email protected]
RONALD U. MENDOZA, PH.D. [email protected]
MONICA M. MELCHOR M M E L C H O R @ A I M . E D U