Embed Size (px)
Citation preview
An Analysis of the Financial Literacy of Senior Students Across Fields of Study at the University of Mississippi
by Robert Hollis Burrow
A thesis submitted to the faculty of The University of Mississippi in partial fulfillment of the requirements of the Sally McDonnell Barksdale Honors College.
Oxford May 2017
Approved by
____________________________________ Advisor: Professor Bonnie Van Ness
____________________________________
Reader: Professor Seong Byun
____________________________________ Reader: Professor Thomas Garrett

ii
Ó 2017 Robert Hollis Burrow
ALL RIGHTS RESERVED
iii
ACKNOWLEDGEMENTS
I would like to thank Dr. Bonnie Van Ness for her willing support, advice, and guidance throughout this process. Her kindness and sacrifice of time were crucial for the completion of this project. I would also like to thank Dr. Seong Byun and Dr. Thomas Garrett for agreeing to participate as my second and third readers and serve on the panel for my thesis defense. I am grateful for the numerous professors who took interest in my study and allowed me to use their class time to administer my surveys. I am also very thankful for the assistance of Serhat Yildiz in both educating and helping me run regressions using the Statistical Analysis System. I would be remiss if I did not also thank the Sally McDonnell Barksdale Honors College for all of the amazing opportunities I have been granted during my time at the University of Mississippi. My time here would not have been the same without those experiences and support. Lastly, I want to give thanks to God for blessing my life with enumerable friends and family members who have encouraged and loved me so well.
iv
ABSTRACT Robert Hollis Burrow: An Analysis of the Financial Literacy of Senior Students Across
Fields of Study at the University of Mississippi (Under the direction of Dr. Bonnie Van Ness)
This thesis examines the financial literacy of senior students at the University of
Mississippi, as well as which variables influence a student’s financial literacy level.
Financial literacy is crucial for both an individual’s current and long-term well-being and
financial health. Students in various major fields of study participated in a multiple-
choice survey, including demographic, socioeconomic, and financial literacy questions.
The student’s answers were analyzed using univariate analyses, an ordinary least squares
stepwise regression, and a logistic stepwise regression. The study found that the average
student score of 2.75 out of five financial literacy questions was comparable to the
national average of 2.9 out of five financial literacy questions. Six key variables were
found to influence financial literacy: gender, ethnicity, being enrolled in a business-
related field of study, father’s education level, parental income level, and actively
planning for retirement.
v
TABLE OF CONTENTS
Introduction ......................................................................................................................... 1
Chapter 1: Financial Issues Facing Millennials Today ...................................................... 4
Chapter 2: Current Financial Education Measures ......................................................... 10
Chapter 3: The Study’s Target Group and Process .......................................................... 12
Chapter 4: Participant Information Question Results ...................................................... 15
Chapter 5: Participant Financial Literacy Question Results ............................................ 26
Chapter 6: Univariate Analysis ......................................................................................... 31
Chapter 7: Ordinary Least Squares Stepwise Regression Analysis .................................. 37
Chapter 8: Logistic Stepwise Regression Analysis .......................................................... 41
Conclusion ........................................................................................................................ 43
Appendices ........................................................................................................................ 47
Bibliography ..................................................................................................................... 54
1
Introduction
Planning for retirement is a concept that is typically far removed from the average
college student’s mind. The idea of retirement seems so distant, and with all the activity
of youth and social life and school, it can be an easy thing to put off and disregard for
years. And even for those who are in the workforce and must begin to consider retirement
planning due to offerings of employee benefit packages, it is often a subject most people
would rather not think about. A recent survey from Schwab Retirement Plan Services
showed that, “40% of 401(k) participants said saving enough for a comfortable retirement
was a significant source of financial stress—even more than job security (24%), paying
off credit card debt (21%) and keeping up with monthly expenses (20%)” (Ebeling,
2016). Yet, knowing how to effectively plan and save enough for retirement is crucial for
both an individual’s well-being and the financial health of our society as a whole. This
conundrum begs the question; how does the average person know how to properly
manage his or her personal finances? The answer lies in their level of financial literacy.
Financial literacy is defined by the President’s Advisory Council on Financial
Literacy as, “the ability to use knowledge and skills to manage financial resources
effectively for a lifetime of financial well-being” (PACFL, 2008). It is the financial
knowledge used to buy a house, avoid defaulting on debt, create and balance a budget,
and prepare for a comfortable retirement. It is the key to understanding how a bank
account works, what a credit card really does, and which loans are manageable. In short,
2
financial literacy is necessary for making responsible decisions regarding personal
finances in order to achieve economic security. The benefits of increased financial
literacy on an individual basis are clear to see.
The importance of higher financial literacy rates on a societal level is also
increasingly great today. As the world becomes more interconnected with rapid advances
in technology, transportation, and communication, the financial and economic markets of
the world are also becoming more interconnected. And as these economic markets
become globalized, irresponsible decisions of financially illiterate people have greater
negative impacts on their domestic society, and have the capacity to ripple through more
worldwide networks than ever before. And this importance of financial literacy is only
multiplied by several changing factors in the United States specifically. As the baby
boomer generation ages and retires, the social security system is slowly drying up. This
depletion of social security resources will result in a major loss in government-provided
retirement funding for upcoming generations entering the workforce, namely the
Millennials. In addition to the loss of social security, the significant trend of businesses
changing from corporate-managed pension funds to employee controlled 401-(k) plans
has further placed the burden of financial planning on the shoulders of today’s
consumers. To make matters worse, the options for a potential investor today are nearly
enumerable and remarkably complex. Whereas in years past, when individuals could
follow a fairly straightforward retirement plan with relatively few decisions to be made, a
person now faces a daunting tangle of competing plans, products, and options. Adding to
the stress of retirement planning, the cost of retirement is steadily increasing as the
average lifespan continues to rise with further developments in modern healthcare
3
capabilities. This greater longevity of life means the amount of money an individual must
save for retirement is growing as the number of years of needed retirement income is
lengthening.
It is, therefore, imperative to analyze the level of financial literacy within the
American workforce today. This thesis will use the fairly unique positon of being able to
survey senior college students, who will soon be entering that workforce with a higher
education, to see how they matched up with the average American citizen to determine
what factors may contribute to their financial literacy levels.
4
Chapter 1: Financial Issues Facing Millennials Today
First and foremost, the Millennial generation is defined as those people born
between 1982 and 2002, making them currently around ages 15 to 35 years old (Elam,
2006). Millennials are the first generation to not remember a time without computers,
smartphones, and the internet. Social media has provided an outlet for accessing
practically anything, anywhere in the world. Conducting business online is becoming an
everyday occurrence. And as the Baby Boomer generation, born between 1942 and 1960,
is rapidly retiring from the workforce, the Millennials are stepping in to take their place
(Elam, 2006). But the retirement of the Baby Boomers has had issues, which is also
causing some financial trouble for the Millennials.
The Social Security System was first created in 1935 and encompasses many
social welfare programs, although it is most commonly thought of as a source of
retirement income. It is primarily funded through payroll taxes called the Federal
Insurance Contributions Act tax and the Self-Employed Contributions Act tax, both of
which are collected by the Internal Revenue Service. Almost all earned incomes are
subject to these taxes up to a specific amount. Social Security is supposed to maintain a
projected solvency of over 75 years. Yet the system is in a long-term shortfall, finding
itself “currently solvent only until 2033,” a meager 16 years from now (New York Times,
2013). This shortage is due, in large part, to the United States entering a retirement crisis.
According to the New York Times, “already, the majority of retirees — with annual
5
incomes up to $32,600 — get two-thirds to all of their income from Social Security. Even
at higher incomes, up to $57,960, Social Security is the single biggest source, accounting
for almost half. Only the top fifth of seniors, with incomes above $57,960, do not rely on
Social Security as their largest source of income, and most of them are still working”
(New York Times, 2013). And as the last of the Baby Boomer generation nears
retirement age, their reliance on social security is comparable to the current retirees.
“Less than half of households ages 55 to 64 have retirement savings, and of those, half
have less than $120,000. Many near-retirees also have lost home equity or a job” (New
York Times, 2013). The lack of proper revenue funding social security does not bode
well for the Millennial generation, as the possible retirement aid provided by the
government will likely either be greatly diminished or completely nonexistent long
before reaching retirement age. Therefore, Millennials must look to other sources for
retirement security, such as employee benefit plans.
Unfortunately, in recent years, even more of the burden of financial planning has
been placed on Millennials shoulders due to a large shift away from traditional defined
benefit pension plans of past generations to predominately 401-(k) style defined
contribution plans. “In 1980, 38 percent of private sector workers had a pension plan and
19 percent a 401(k) plan. By last year [2015], according to the U.S. Department of Labor,
the numbers had more or less reversed—just 15 percent had a pension and 43 percent a
401(k) plan” (Steverman, 2016). The difference between these two styles of retirement
benefit plans can dramatically affect an employee’s future security, especially an
employee with little to no financial literacy. The risks of a traditional pension plan’s
investments are almost exclusively taken on by the employer. From an employee’s point
6
of view, the plan appears to work automatically. A set amount of money, typically a
percentage of his or her yearly salary, is promised to be distributed periodically to each
employee after retirement. This plan is designed to guarantee a safe and comfortable
income at retirement. By guaranteeing a yearly retirement income and putting the risk
and responsibility under the management of trained professionals, the reigns are removed
from the hands of the less financially literate employees. A typical 401-(k) plan, on the
other hand, is largely controlled by the employees themselves. This shifts the risk and
responsibility onto the employee, away from the employer. Not only are employees
required to decide whether they would like to participate in the plan and how much
money they would like to contribute periodically, but they must decide where to invest
their savings between many offered financial options. And choosing the right investment
strategy has only become more difficult for both the financially literate and illiterate
alike, due to the ever-increasing quantity and complexity of today’s financial investment
options.
Today’s offering of different investment opportunities is dramatically different
than in years past. As if investing in stocks, bonds, and typical mutual funds was not
already complicated enough for the average person to understand, there are now
numerous financially engineered investment products available to consumers. A major
problem with such complex investments is that the risks are often not apparent or easy to
understand, even for a veteran investor. “For example, when an investor buys a simple
equity mutual fund, the investor will make money if the market goes up. However, in a
fund of hedge funds it is next to impossible to determine how the investor will make
money. It is essentially unknown. The more complicated the product, the less transparent
7
the risks” (Hawkins, 2008). In addition to this opaqueness of risk, there is also a
prevalence of asymmetric information. The producers and marketers of these products
naturally have a much more intimate understanding of how they work than the less
informed consumers. It is possible that consumers may be overpaying for a product they
do not fully understand. The subprime mortgage meltdown is a good example of how the
high complexity of derivative investments today can cause problems. Financial engineers
created many different derivative investments such as mortgage-backed securities from
simple mortgages. Consumers, rating agencies, and banks all did not understand the risks
associated with mortgage-backed securities and suffered big losses after the collapse.
Adding to the difficulty of gearing up for retirement planning, humans, on
average, are living longer lives. Life expectancy rates in the United States have been
slowly and steadily increasing in the last century, and now the “average male born in
2012 is expected to live till age 76.4, up 0.1 years over 2011, while the forecast for the
typical female is 81.4.” Longevity, or the average years measured past successfully
reaching age 65, has also improved and is now “83 for men and 85.5 for women.”
Further, “for upper-middle-class couples age 65 today, there’s a 43% chance that one or
both will survive to at least age 95, and by 2029 the odds of that 65-year-old reaching 95
climbs to 50%” (Wang, 2017). The problem with living longer is that people planning to
retire at age 65 now have more years to cover with a dependable retirement income than
ever before. Rather than 10 or 15 years of retirement for which to save, individuals are
faced with the very real possibility of 30 more years after retirement. Acquiring enough
savings to draw from for that long can be a seemingly insurmountable climb for some
aspiring retirees. And those that are less financially astute might not even be aware that
8
they need to take their longevity into consideration when making their plans. If this trend
of healthcare and science improvements continues, who knows how long Millennials
might live once they reach retirement age.
Millennials, specifically, are also currently dealing with high secondary-education
costs and large amounts of student debt. According to Forbes, “since 1985, the overall
consumer price index has risen 115% while the college education inflation rate has risen
nearly 500%. If the cost of college tuition was $10,000 in 1986, it would now cost the
same student over $21,500 if education had increased as much as the average inflation
rate but instead education is $59,800 or over 2 ½ times the inflation rate” (Odland, 2012).
A typical family income has increased by 147% since 1982. While this increase is more
than the increase in inflation, it does not come close to keeping up with the rapid rise of
college tuition. This deficiency, in turn, has resulted in greater amounts of student loan
debt. Several recent milestones include, “student loan debt exceed[ing] credit card debt in
2010 and auto loans in 2011, and it pass[ing] the $1 trillion mark in 2012.” More
worrisome than those figures, “in 1993-94, about half of bachelor’s degree recipients
graduated with debt, averaging a little more than $10,000. This year [2016], more than
two-thirds of college graduates graduated with debt, and their average debt at graduation
was about $35,000, tripling in two decades” (Kantrowitz, 2016). And the number of
students defaulting on their loan debt has reached crisis heights. The Wall Street Journal
reports that, “43% of the roughly 22 million Americans with federal student loans weren't
making payments as of Jan. 1, 2016. About 1 in 6 borrowers, or 3.6 million, were in
default on $56 billion in student debt, meaning they had gone at least a year without
making a payment. Three million more owing roughly $66 billion were at least a month

9
behind, and another three million owing almost $110 billion were in "forbearance" or
"deferment," meaning they had received permission to temporarily halt payments due to a
financial emergency, such as unemployment” (Mitchell, 2016). It is therefore extremely
important that steps be taken to ensure proper financial literacy levels amongst
Millennials to not only aid in decreasing the crushing weight of debt through wise
financial management, but also to combat all of these current issues they face today.
10
Chapter 2: Current Financial Education Measures
Some things are being done today to help provide financial education to those that
need it. Financial education is defined as “the process by which people improve their
understanding of financial products, services and concepts, so they are empowered to
make informed choices, avoid pitfalls, know where to go for help and take other actions
to improve their present and long-term financial well-being” (PACFL, 2008). Several
different governmental and non-profit programs have been created recently to attempt to
help solve financial literacy issues in the United States.
Established by the Fair and Accurate Credit Transactions Act of 2003, the
Financial Literacy and Education Commission was created to develop a strategy for
increasing financial education opportunities as well as a nationally accessible financial
education internet site. The Commission consists of 19 heads of other financially-oriented
federal agencies. While the website they created provides direction toward a large
quantity of financial education resources, the Commission reported in their latest update
that “as of 2015, less than a third of American adults had been offered financial education
at a school, college, or workplace, and only one in five say they participated in financial
education. Despite growing evidence that well-designed and implemented high school
personal finance mandates help prepare young people to successfully navigate their
financial lives, only 17 states require high school students to take a course in personal
finance” (FLEC, 2016). Mississippi does not require high school students to take a
11
personal finance course to graduate. In fact, there is barely any financial education
included in the Mississippi public high school system other than a minor amount
embedded in the mathematics common core standard and a one semester elective credit
in personal finance.
A major non-profit pushing for increased financial education in America’s youth
is the Jump$tart Coalition for Personal Financial Literacy. Founded in 1995, the
Jump$tart Coalition works to “unite organizations committed to advancing financial
literacy among pre-school through college-age youth” and “educate and prepare our
nation’s youth for life-long financial success” (Jump$tart Coalition, 2017). The coalition
includes around 150 national partners and 51 affiliated state organizations. One of
Jump$tart’s major agenda items is regularly providing all of their partner organizations
with updated National K-12 Personal Finance Education Standards in an attempt to
streamline and simplify the target goals of financial literacy.
12
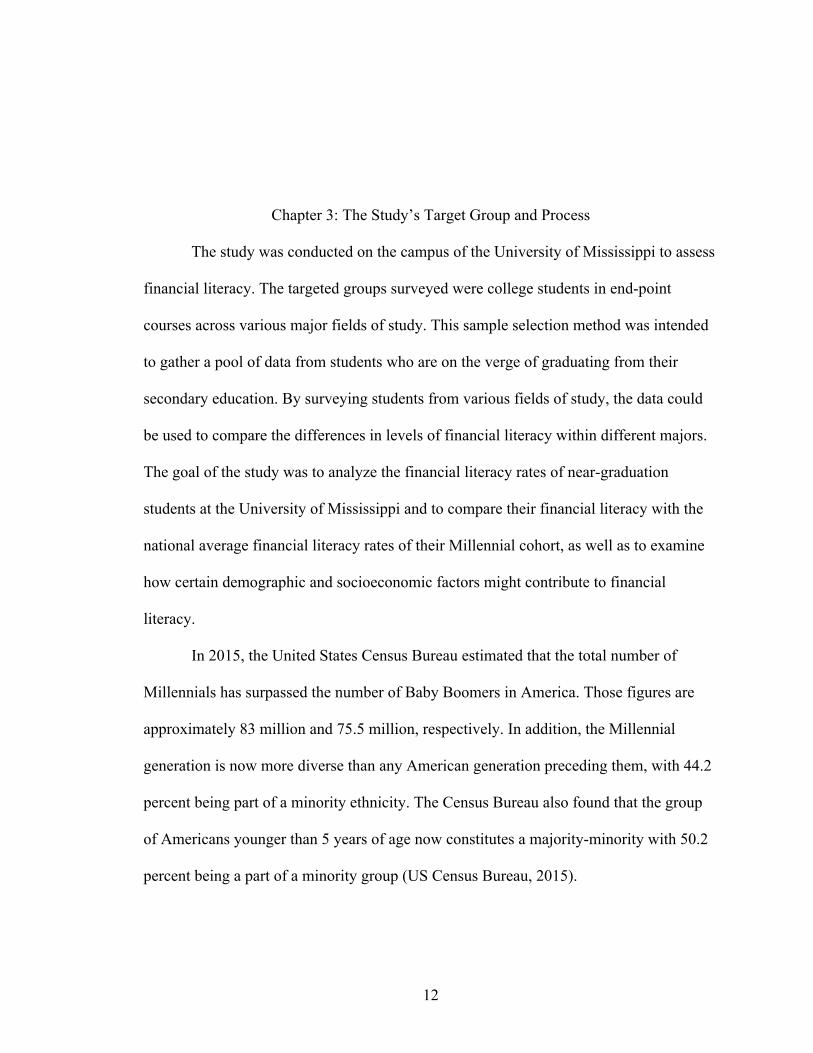
Chapter 3: The Study’s Target Group and Process
The study was conducted on the campus of the University of Mississippi to assess
financial literacy. The targeted groups surveyed were college students in end-point
courses across various major fields of study. This sample selection method was intended
to gather a pool of data from students who are on the verge of graduating from their
secondary education. By surveying students from various fields of study, the data could
be used to compare the differences in levels of financial literacy within different majors.
The goal of the study was to analyze the financial literacy rates of near-graduation
students at the University of Mississippi and to compare their financial literacy with the
national average financial literacy rates of their Millennial cohort, as well as to examine
how certain demographic and socioeconomic factors might contribute to financial
literacy.
In 2015, the United States Census Bureau estimated that the total number of
Millennials has surpassed the number of Baby Boomers in America. Those figures are
approximately 83 million and 75.5 million, respectively. In addition, the Millennial
generation is now more diverse than any American generation preceding them, with 44.2
percent being part of a minority ethnicity. The Census Bureau also found that the group
of Americans younger than 5 years of age now constitutes a majority-minority with 50.2
percent being a part of a minority group (US Census Bureau, 2015).
13
This trend of increasing racial diversity has continued into college enrollment.
The National Center for Education Statistics reports that “between 2000 and 2014,
Hispanic enrollment more than doubled (a 119 percent increase from 1.4 million to 3.0
million students), Black enrollment increased by 57 percent (from 1.5 million to 2.4
million students), and White enrollment increased by 7 percent (from 9.0 million to 9.6
million students)” (NCES, 2016). At the University of Mississippi specifically, the five-
year change in undergraduate enrollment by ethnicity from 2008 to 2012 followed a
similar pattern. Including satellite campuses, African American undergraduate enrollment
saw a 57.2 percent increase and Hispanic enrollment saw a 152.5 percent increase, while
Caucasian enrollment increased by only 19.8 percent (UM Diversity Matters, 2013).
Although there are many important reasons for increased diversity, the application for
this study is that there can be differences in financial literacy rates depending on a
person’s ethnicity (FINRA, 2013). Therefore, these increases in diversity, especially in
secondary education, provide an excellent opportunity for institutions, such as the
University of Mississippi, to begin aiding the financial education of minority groups.
The study’s survey was administered to a total of 546 students in classrooms of
varying end-point courses of different majors at the University of Mississippi. The
following classes were surveyed: one section of Education 419 containing 21 students,
one section of Management Information Systems 419 containing 22 students, one section
of Social Work 437 containing 29 students, one section of Journalism 575 containing 32
students, two sections of Finance 461 containing 37 students total, one section of
Integrated Marketing Communications 455 containing 34 students, one section of
Nutrition and Hospitality Management 462 containing 55 students, one section of
14
Exercise Science 446 containing 40 students, one section of Marketing 525 containing 50
students, one section of English 439 containing 16 students, one section of Accounting
401 containing 26 students, one section of Engineering 321 containing 59 students, one
section of Math 556 containing 10 students, one section of Management 582 containing
47 students, one section of Biochemistry 473 containing 51 students, and one section of
Public Policy and Leadership 310 containing 17 students.
The hard-copy survey was distributed to each student, individually, during their
regular class time. The survey was anonymous and returned to the administrator
incomplete if the student was under 18 years of age. Typically administered in the first
few minutes of each class, every student received a consent form as the administrator
explained the purpose of the study. Upon agreement, the participating students were
handed both a printed version of the survey and a scantron form. The scantron forms
were donated by the University of Mississippi School of Business Administration. The
administrator would explain a few technical points on answering the survey, then allow
the students to begin. The survey consisted of 20 multiple choice questions and 2 fill-in-
the-blank questions, for a total of 22 questions. Specifically, five of the questions directly
tested financial literacy, while the remaining 17 gathered basic socioeconomic,
demographic, and financial background information on the participants. The five
financial literacy questions were taken directly from the Financial Industry Regulatory
Authority’s financial capability study from 2012. These questions were chosen because
the results of the survey could be easily compared against FINRA’s national and state
level data for financial literacy. The survey can be found in the appendices.
15
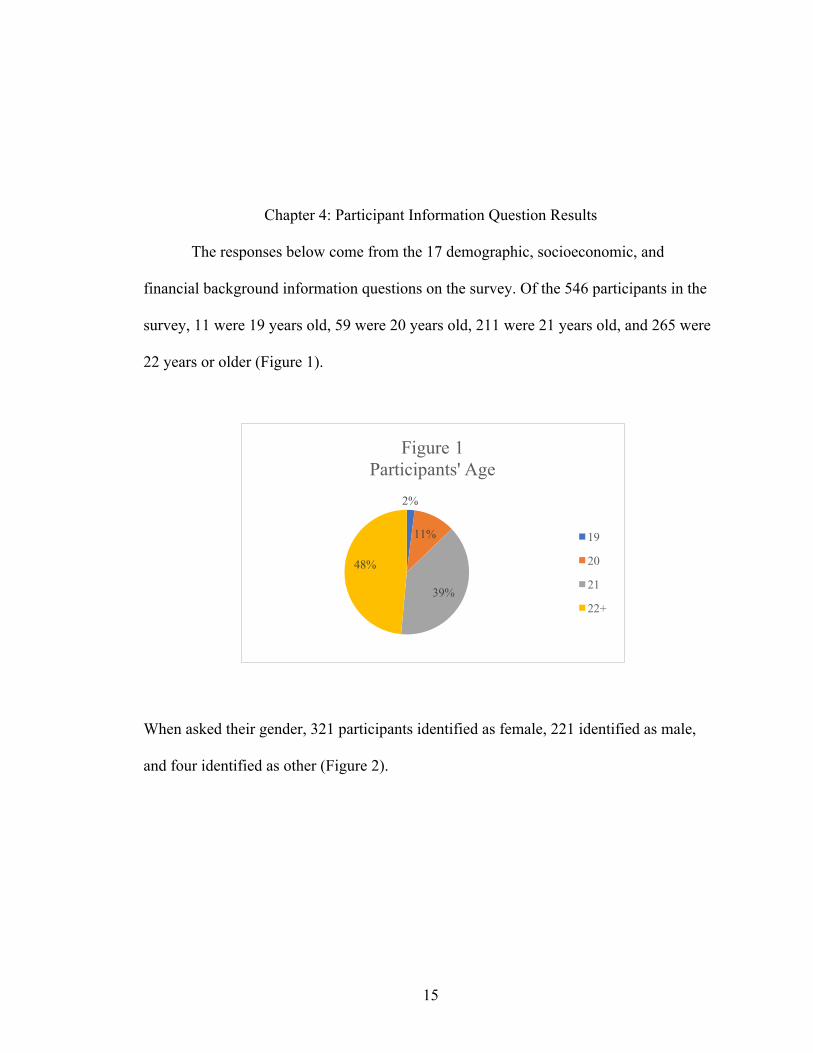
Chapter 4: Participant Information Question Results
The responses below come from the 17 demographic, socioeconomic, and
financial background information questions on the survey. Of the 546 participants in the
survey, 11 were 19 years old, 59 were 20 years old, 211 were 21 years old, and 265 were
22 years or older (Figure 1).
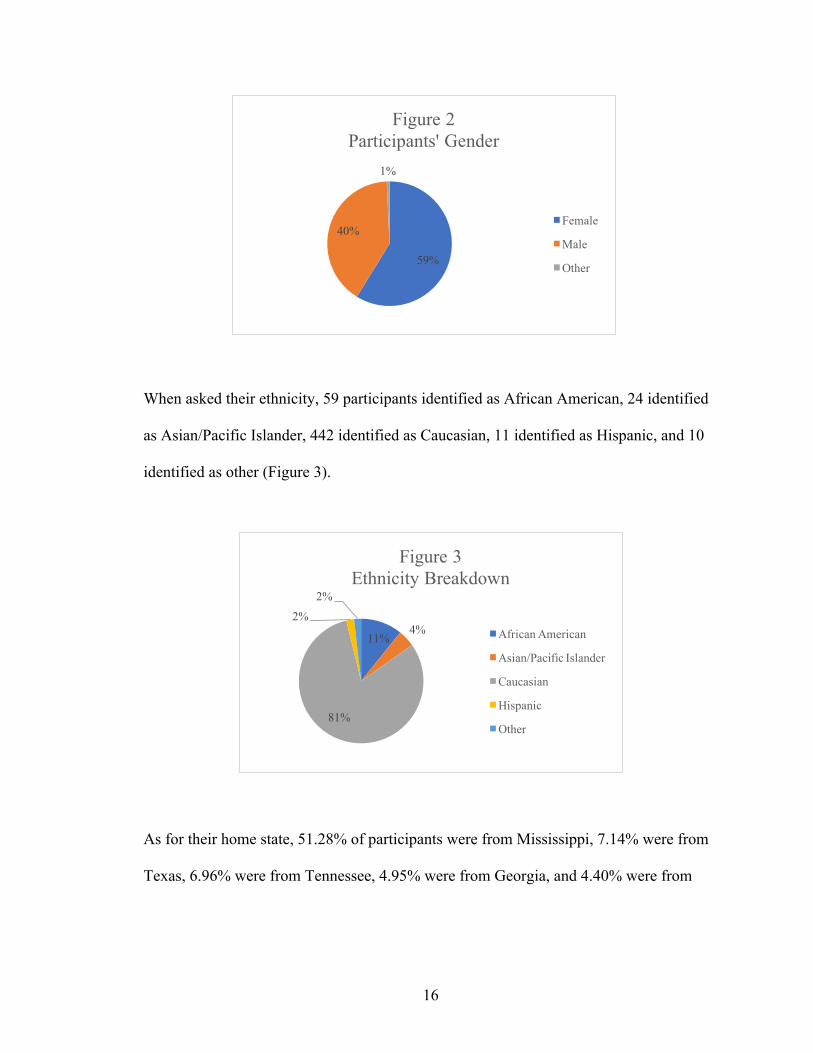
When asked their gender, 321 participants identified as female, 221 identified as male,
and four identified as other (Figure 2).
2%
11%
39%
48%
Figure 1Participants' Age
19
20
21
22+
16
When asked their ethnicity, 59 participants identified as African American, 24 identified
as Asian/Pacific Islander, 442 identified as Caucasian, 11 identified as Hispanic, and 10
identified as other (Figure 3).
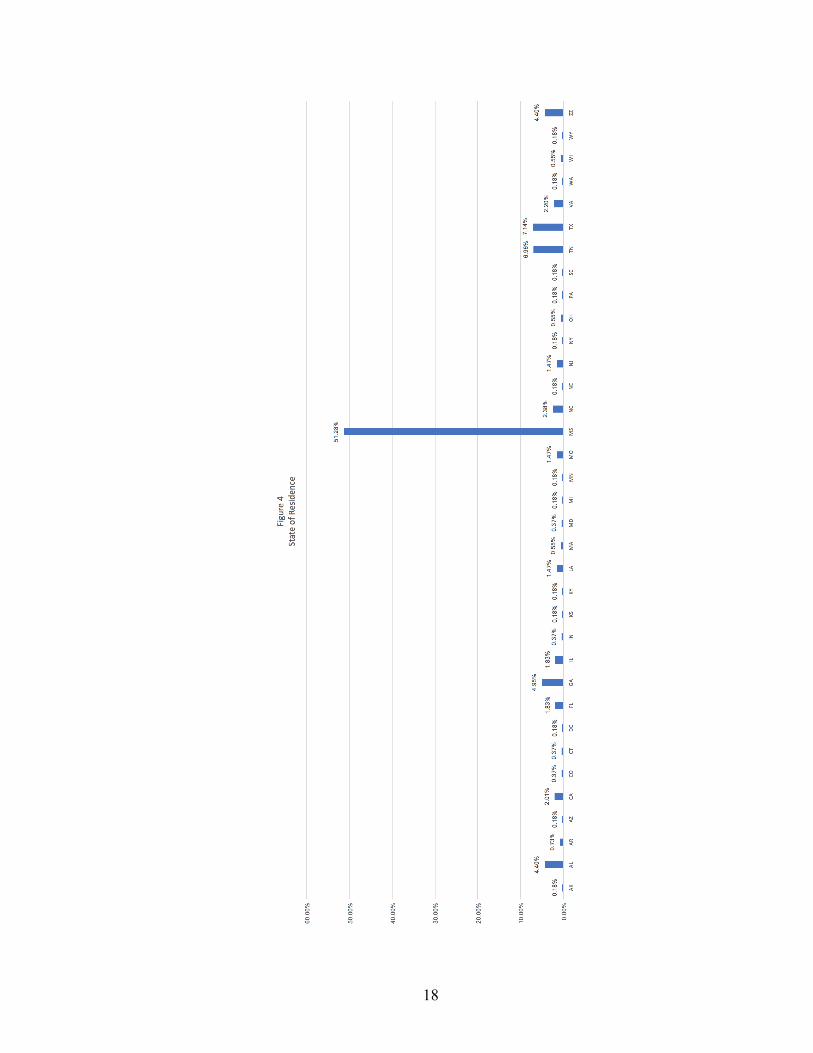
As for their home state, 51.28% of participants were from Mississippi, 7.14% were from
Texas, 6.96% were from Tennessee, 4.95% were from Georgia, and 4.40% were from
59%
40%
1%
Figure 2Participants' Gender
Female
Male
Other
11%4%
81%
2%
2%
Figure 3Ethnicity Breakdown
African American
Asian/Pacific Islander
Caucasian
Hispanic
Other

17
Alabama. Additionally, 4.40% identified as international students. Please note that, in
Figure 4, ZZ denotes international students. A total of .18% corresponds to one student.
18
19
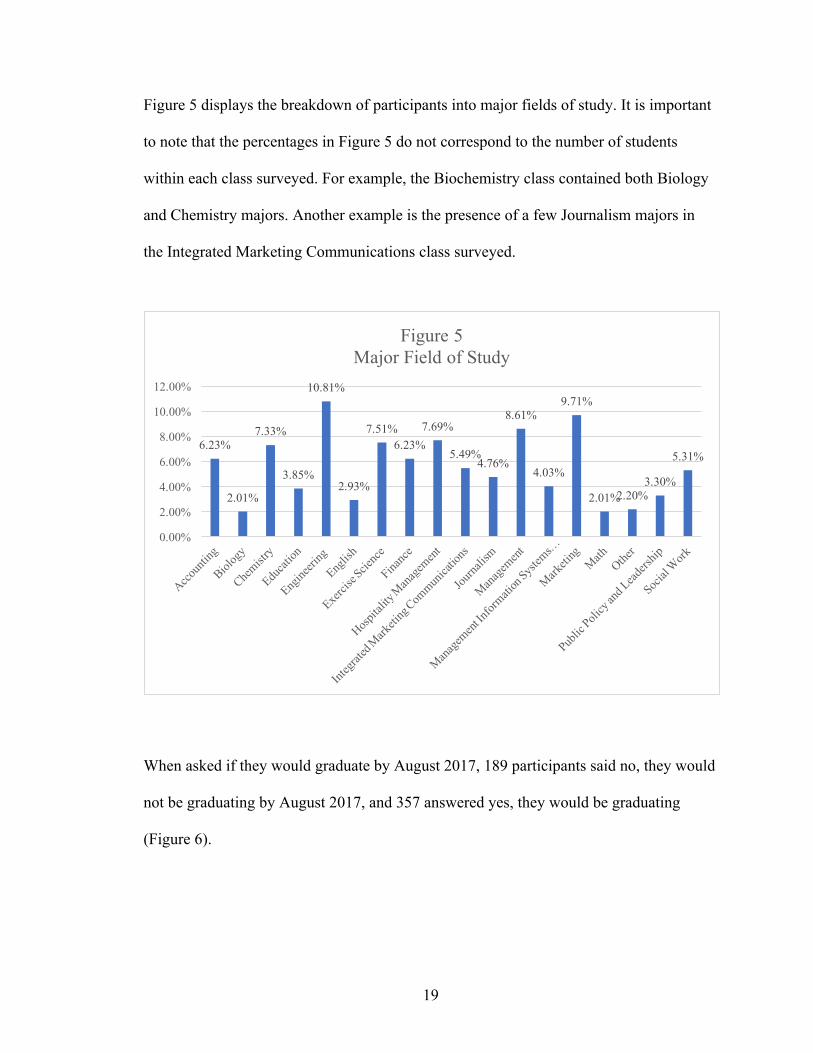
Figure 5 displays the breakdown of participants into major fields of study. It is important
to note that the percentages in Figure 5 do not correspond to the number of students
within each class surveyed. For example, the Biochemistry class contained both Biology
and Chemistry majors. Another example is the presence of a few Journalism majors in
the Integrated Marketing Communications class surveyed.
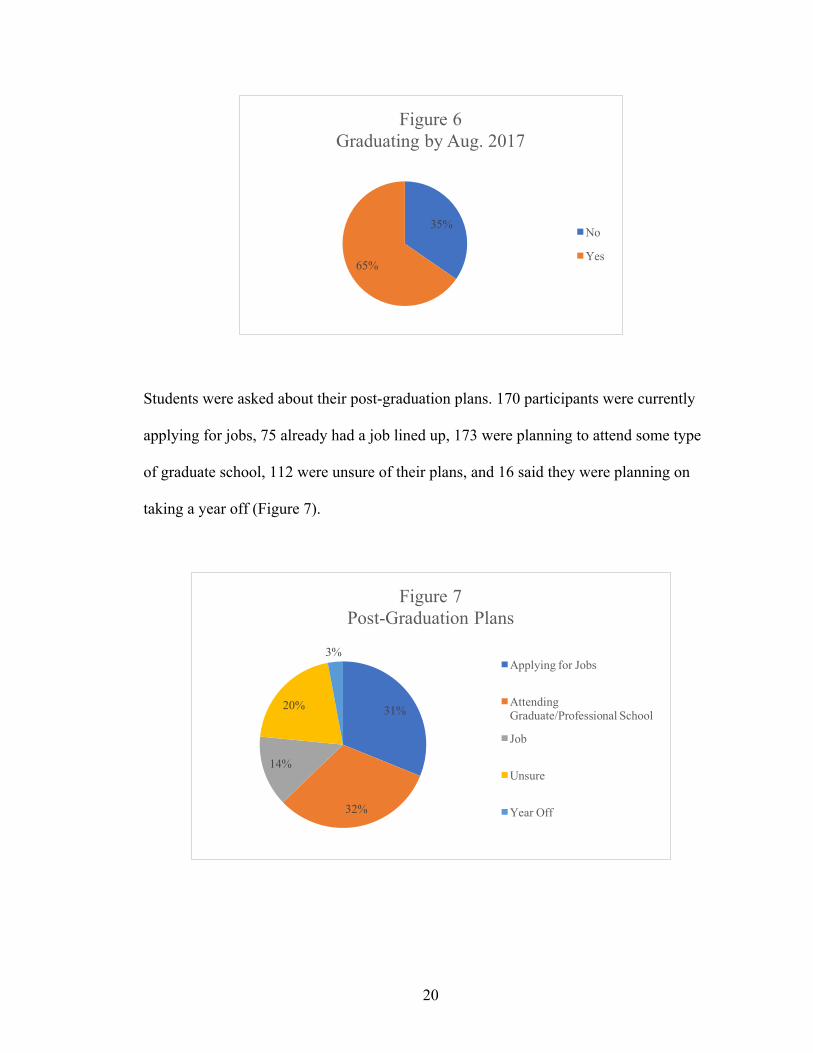
When asked if they would graduate by August 2017, 189 participants said no, they would
not be graduating by August 2017, and 357 answered yes, they would be graduating
(Figure 6).
6.23%
2.01%
7.33%
3.85%
10.81%
2.93%
7.51%6.23%
7.69%
5.49%4.76%
8.61%
4.03%
9.71%
2.01%2.20%3.30%
5.31%
0.00%
2.00%
4.00%
6.00%
8.00%
10.00%
12.00%
Figure 5Major Field of Study
20
Students were asked about their post-graduation plans. 170 participants were currently
applying for jobs, 75 already had a job lined up, 173 were planning to attend some type
of graduate school, 112 were unsure of their plans, and 16 said they were planning on
taking a year off (Figure 7).
35%
65%
Figure 6Graduating by Aug. 2017
No
Yes
31%
32%
14%
20%
3%
Figure 7Post-Graduation Plans
Applying for Jobs
Attending Graduate/Professional School
Job
Unsure
Year Off
21
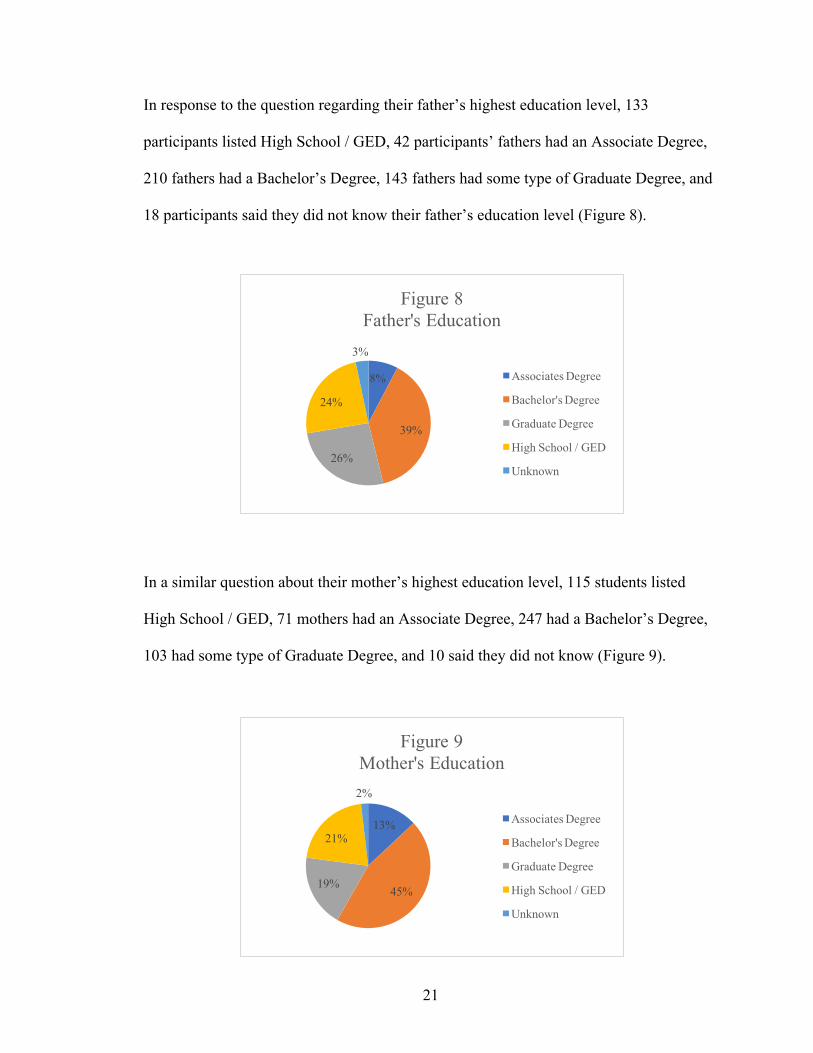
In response to the question regarding their father’s highest education level, 133
participants listed High School / GED, 42 participants’ fathers had an Associate Degree,
210 fathers had a Bachelor’s Degree, 143 fathers had some type of Graduate Degree, and
18 participants said they did not know their father’s education level (Figure 8).
In a similar question about their mother’s highest education level, 115 students listed
High School / GED, 71 mothers had an Associate Degree, 247 had a Bachelor’s Degree,
103 had some type of Graduate Degree, and 10 said they did not know (Figure 9).
8%
39%
26%
24%
3%
Figure 8Father's Education
Associates Degree
Bachelor's Degree
Graduate Degree
High School / GED
Unknown
13%
45%19%
21%
2%
Figure 9Mother's Education
Associates Degree
Bachelor's Degree
Graduate Degree
High School / GED
Unknown
22
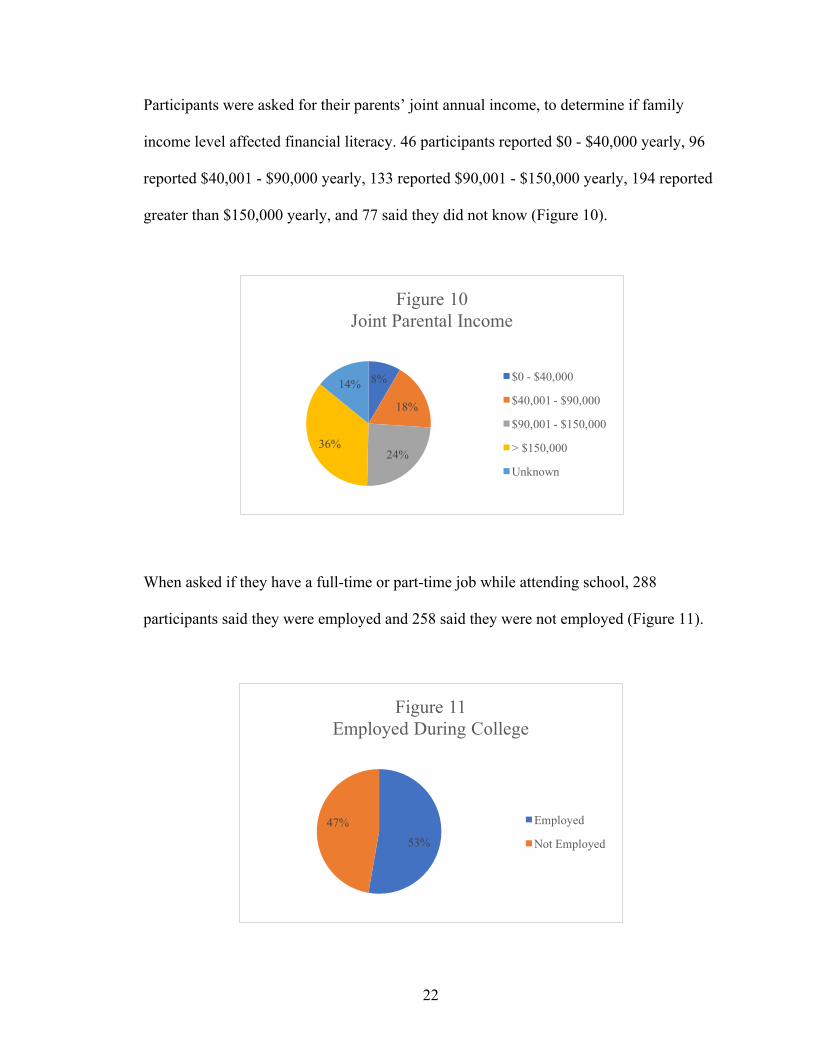
Participants were asked for their parents’ joint annual income, to determine if family
income level affected financial literacy. 46 participants reported $0 - $40,000 yearly, 96
reported $40,001 - $90,000 yearly, 133 reported $90,001 - $150,000 yearly, 194 reported
greater than $150,000 yearly, and 77 said they did not know (Figure 10).
When asked if they have a full-time or part-time job while attending school, 288
participants said they were employed and 258 said they were not employed (Figure 11).
8%
18%
24%36%
14%
Figure 10Joint Parental Income
$0 - $40,000
$40,001 - $90,000
$90,001 - $150,000
> $150,000
Unknown
53%
47%
Figure 11Employed During College
Employed
Not Employed
23
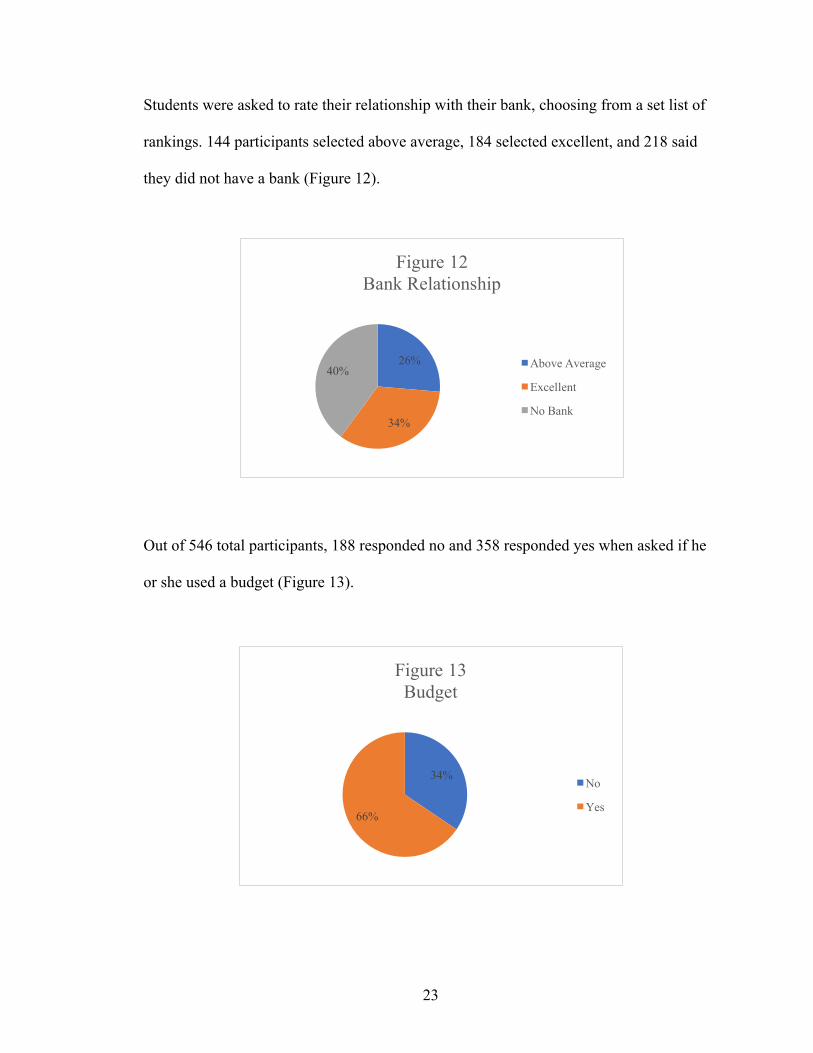
Students were asked to rate their relationship with their bank, choosing from a set list of
rankings. 144 participants selected above average, 184 selected excellent, and 218 said
they did not have a bank (Figure 12).
Out of 546 total participants, 188 responded no and 358 responded yes when asked if he
or she used a budget (Figure 13).
26%
34%
40%
Figure 12Bank Relationship
Above Average
Excellent
No Bank
34%
66%
Figure 13Budget
No
Yes
24
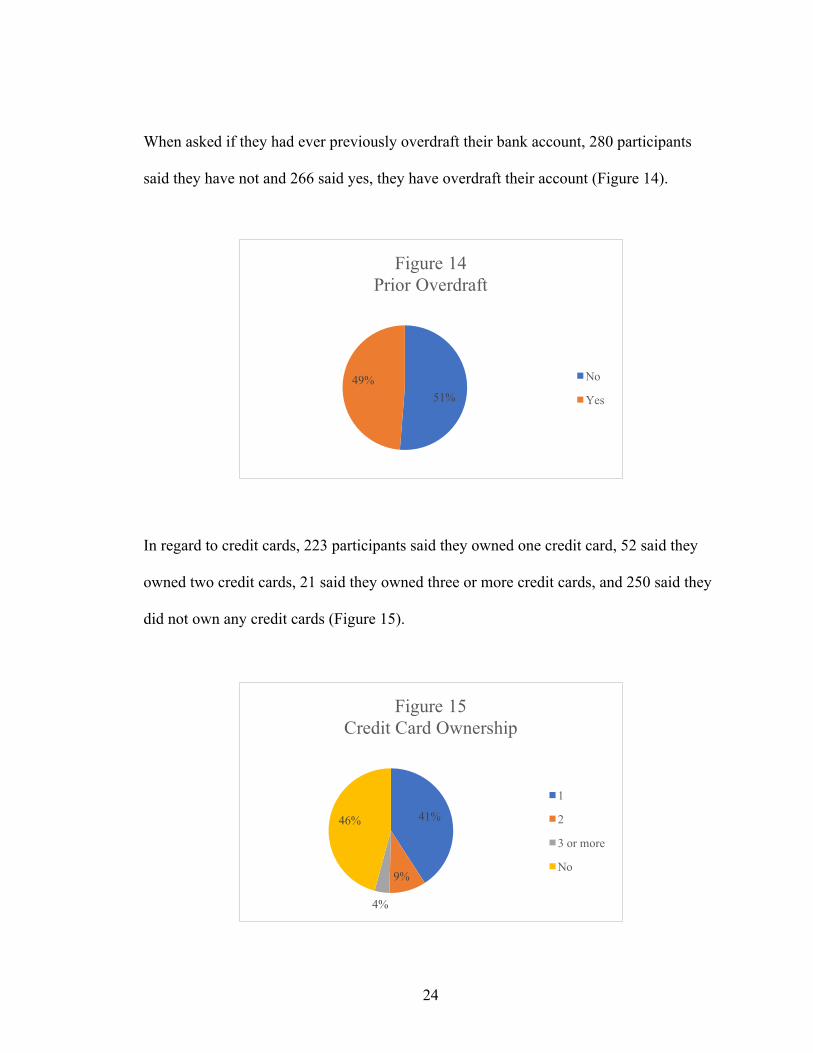
When asked if they had ever previously overdraft their bank account, 280 participants
said they have not and 266 said yes, they have overdraft their account (Figure 14).
In regard to credit cards, 223 participants said they owned one credit card, 52 said they
owned two credit cards, 21 said they owned three or more credit cards, and 250 said they
did not own any credit cards (Figure 15).
51%49%
Figure 14Prior Overdraft
No
Yes
41%
9%
4%
46%
Figure 15Credit Card Ownership
1
2
3 or more
No
25
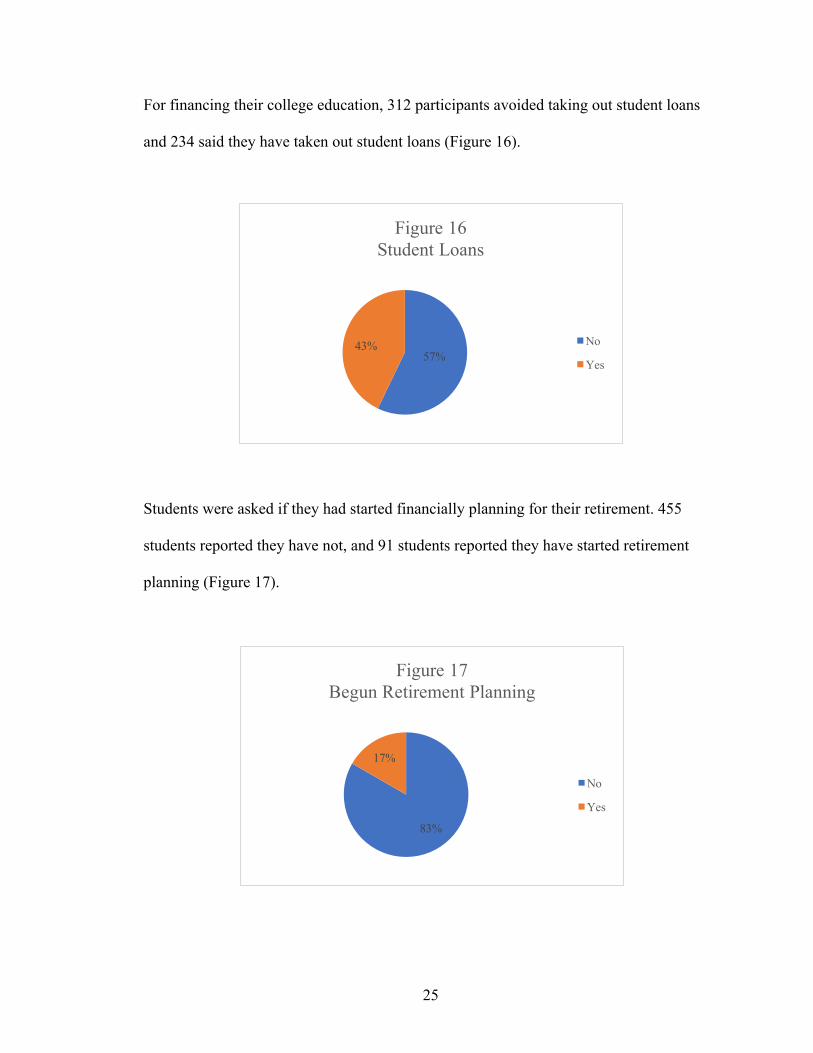
For financing their college education, 312 participants avoided taking out student loans
and 234 said they have taken out student loans (Figure 16).
Students were asked if they had started financially planning for their retirement. 455
students reported they have not, and 91 students reported they have started retirement
planning (Figure 17).
57%43%
Figure 16Student Loans
No
Yes
83%
17%
Figure 17Begun Retirement Planning
No
Yes
26
Chapter 5: Participant Financial Literacy Question Results
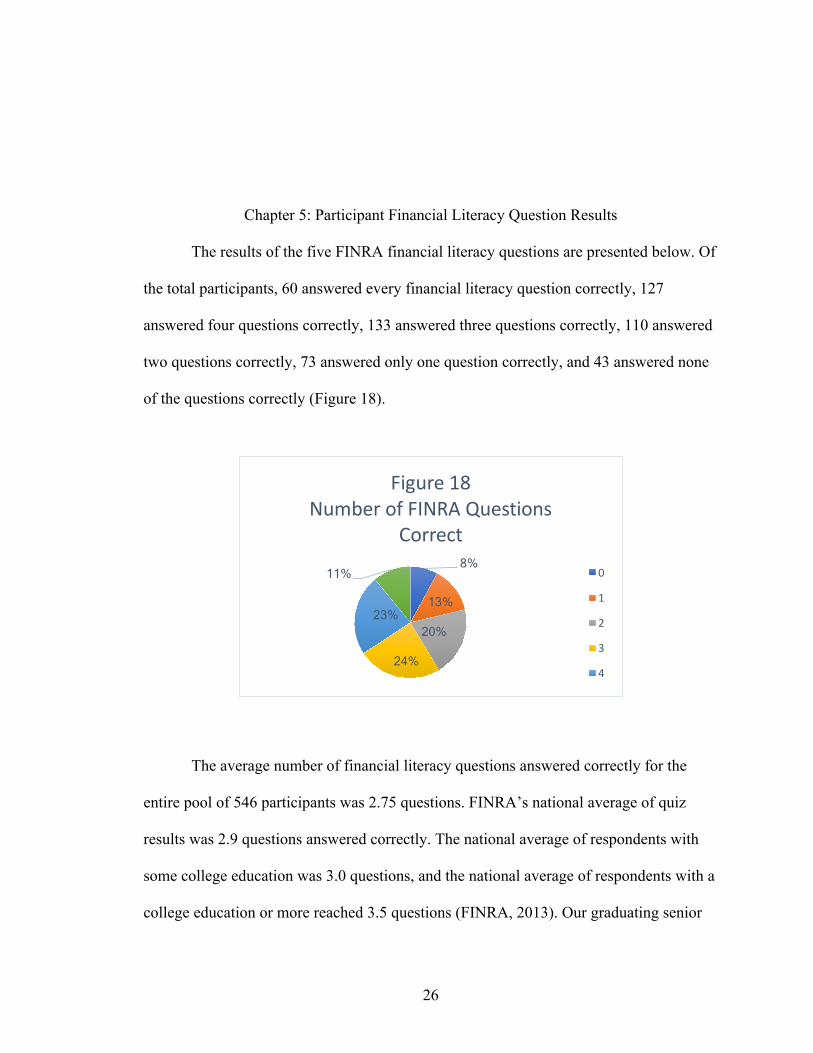
The results of the five FINRA financial literacy questions are presented below. Of
the total participants, 60 answered every financial literacy question correctly, 127
answered four questions correctly, 133 answered three questions correctly, 110 answered
two questions correctly, 73 answered only one question correctly, and 43 answered none
of the questions correctly (Figure 18).
The average number of financial literacy questions answered correctly for the
entire pool of 546 participants was 2.75 questions. FINRA’s national average of quiz
results was 2.9 questions answered correctly. The national average of respondents with
some college education was 3.0 questions, and the national average of respondents with a
college education or more reached 3.5 questions (FINRA, 2013). Our graduating senior
8%
13%
20%
24%
23%
11%
Figure18NumberofFINRAQuestions
Correct
0
1
2
3
4
27
cohort average should be found in the range of 3.0 to 3.5 questions correct as they all are
about to graduate college. However, this study’s average is nearer to the standard national
average. These national statistics are presented for comparison purposes. I did not,
however, test if my survey results were significantly different than FINRA’s results.
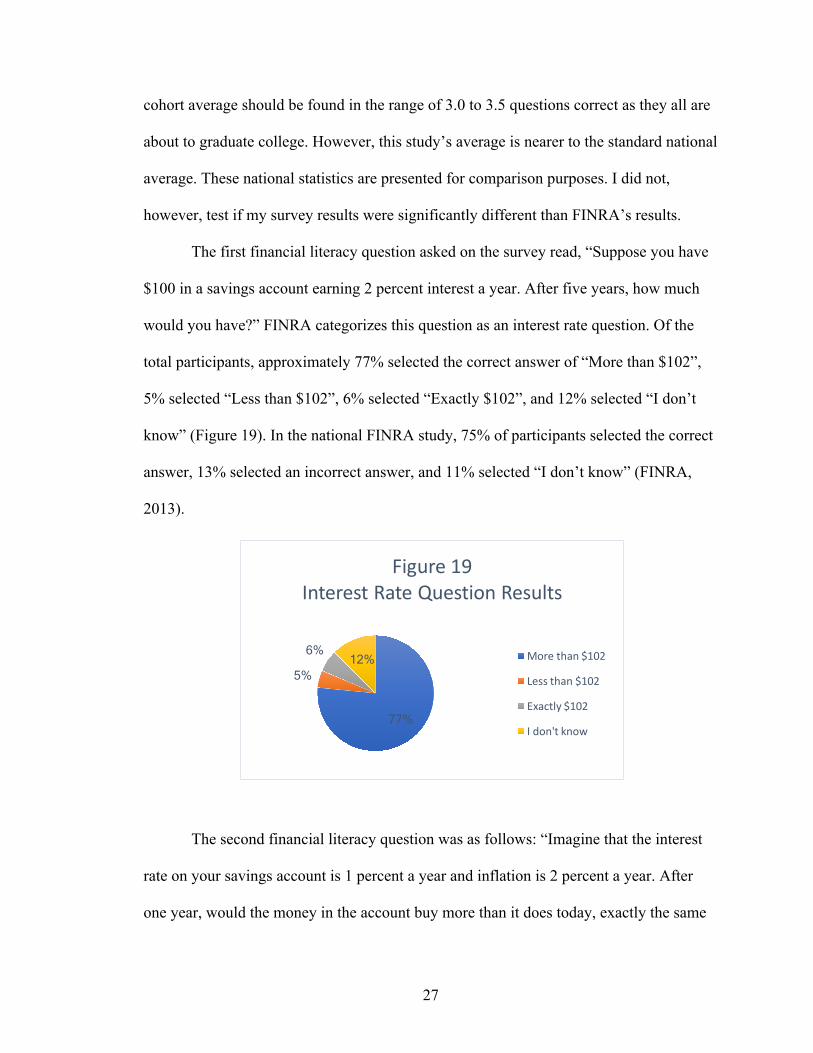
The first financial literacy question asked on the survey read, “Suppose you have
$100 in a savings account earning 2 percent interest a year. After five years, how much
would you have?” FINRA categorizes this question as an interest rate question. Of the
total participants, approximately 77% selected the correct answer of “More than $102”,
5% selected “Less than $102”, 6% selected “Exactly $102”, and 12% selected “I don’t
know” (Figure 19). In the national FINRA study, 75% of participants selected the correct
answer, 13% selected an incorrect answer, and 11% selected “I don’t know” (FINRA,
2013).
The second financial literacy question was as follows: “Imagine that the interest
rate on your savings account is 1 percent a year and inflation is 2 percent a year. After
one year, would the money in the account buy more than it does today, exactly the same
77%
5%
6% 12%
Figure19InterestRateQuestionResults
Morethan$102
Lessthan$102
Exactly$102
Idon'tknow
28
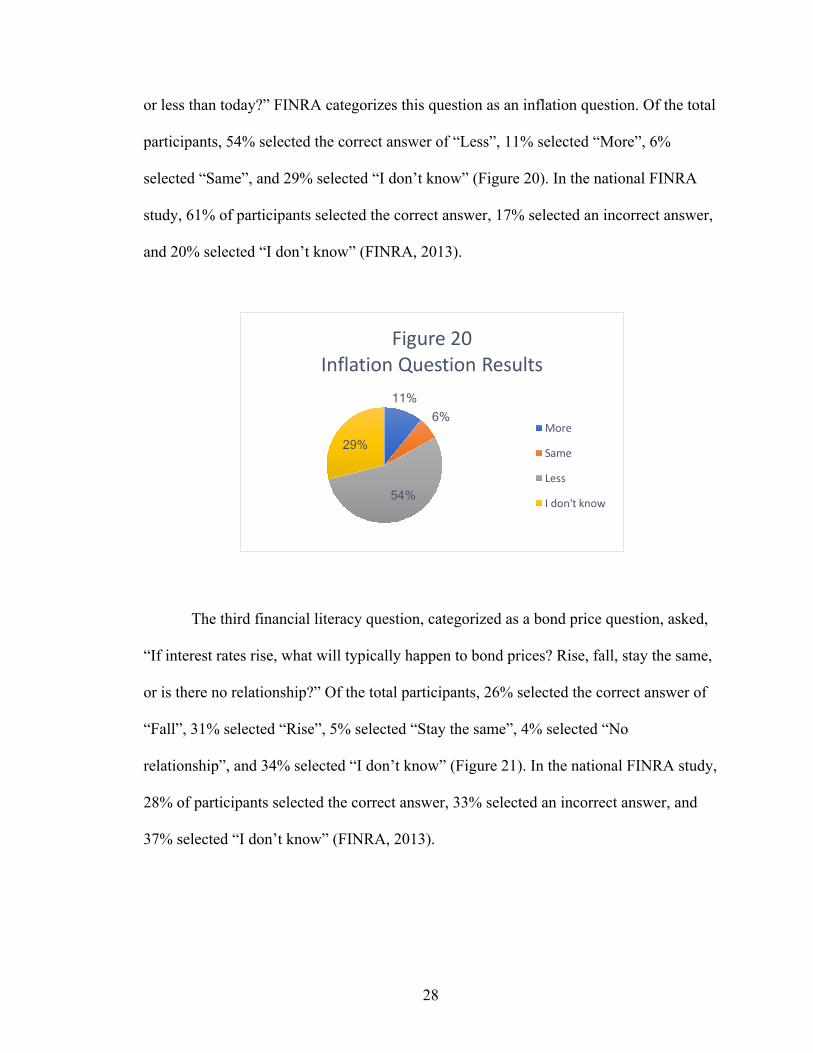
or less than today?” FINRA categorizes this question as an inflation question. Of the total
participants, 54% selected the correct answer of “Less”, 11% selected “More”, 6%
selected “Same”, and 29% selected “I don’t know” (Figure 20). In the national FINRA
study, 61% of participants selected the correct answer, 17% selected an incorrect answer,
and 20% selected “I don’t know” (FINRA, 2013).
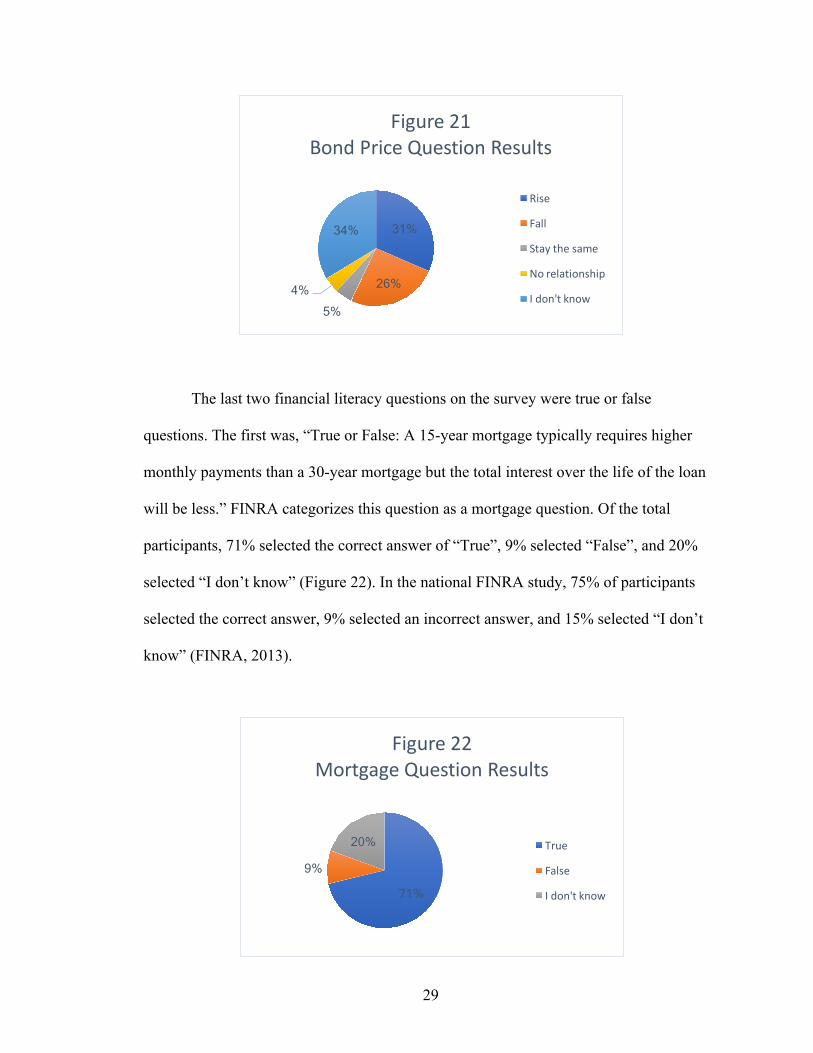
The third financial literacy question, categorized as a bond price question, asked,
“If interest rates rise, what will typically happen to bond prices? Rise, fall, stay the same,
or is there no relationship?” Of the total participants, 26% selected the correct answer of
“Fall”, 31% selected “Rise”, 5% selected “Stay the same”, 4% selected “No
relationship”, and 34% selected “I don’t know” (Figure 21). In the national FINRA study,
28% of participants selected the correct answer, 33% selected an incorrect answer, and
37% selected “I don’t know” (FINRA, 2013).
11% 6%
54%
29%
Figure20InflationQuestionResults
More
Same
Less
Idon'tknow
29
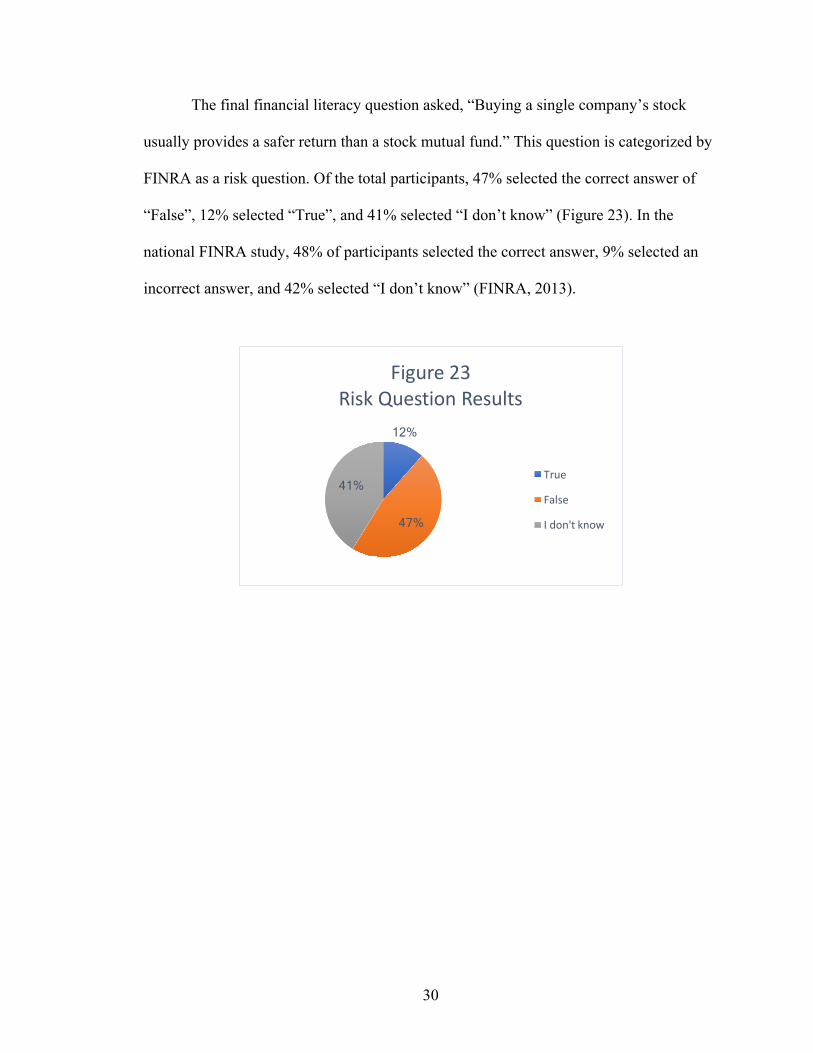
The last two financial literacy questions on the survey were true or false
questions. The first was, “True or False: A 15-year mortgage typically requires higher
monthly payments than a 30-year mortgage but the total interest over the life of the loan
will be less.” FINRA categorizes this question as a mortgage question. Of the total
participants, 71% selected the correct answer of “True”, 9% selected “False”, and 20%
selected “I don’t know” (Figure 22). In the national FINRA study, 75% of participants
selected the correct answer, 9% selected an incorrect answer, and 15% selected “I don’t
know” (FINRA, 2013).
31%
26%
5% 4%
34%
Figure21BondPriceQuestionResults
Rise
Fall
Staythesame
Norelationship
Idon'tknow
71%
9%
20%
Figure22MortgageQuestionResults
True
False
Idon'tknow
30
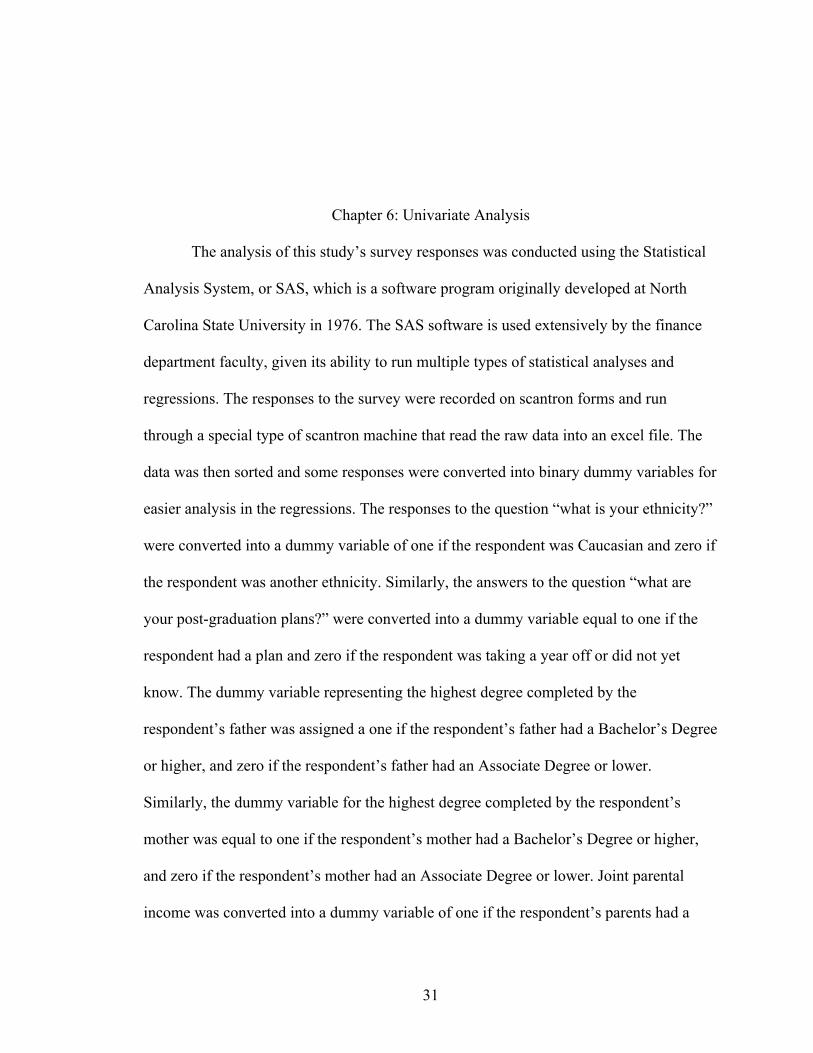
The final financial literacy question asked, “Buying a single company’s stock
usually provides a safer return than a stock mutual fund.” This question is categorized by
FINRA as a risk question. Of the total participants, 47% selected the correct answer of
“False”, 12% selected “True”, and 41% selected “I don’t know” (Figure 23). In the
national FINRA study, 48% of participants selected the correct answer, 9% selected an
incorrect answer, and 42% selected “I don’t know” (FINRA, 2013).
12%
47%
41%
Figure23RiskQuestionResults
True
False
Idon'tknow
31
Chapter 6: Univariate Analysis
The analysis of this study’s survey responses was conducted using the Statistical
Analysis System, or SAS, which is a software program originally developed at North
Carolina State University in 1976. The SAS software is used extensively by the finance
department faculty, given its ability to run multiple types of statistical analyses and
regressions. The responses to the survey were recorded on scantron forms and run
through a special type of scantron machine that read the raw data into an excel file. The
data was then sorted and some responses were converted into binary dummy variables for
easier analysis in the regressions. The responses to the question “what is your ethnicity?”
were converted into a dummy variable of one if the respondent was Caucasian and zero if
the respondent was another ethnicity. Similarly, the answers to the question “what are
your post-graduation plans?” were converted into a dummy variable equal to one if the
respondent had a plan and zero if the respondent was taking a year off or did not yet
know. The dummy variable representing the highest degree completed by the
respondent’s father was assigned a one if the respondent’s father had a Bachelor’s Degree
or higher, and zero if the respondent’s father had an Associate Degree or lower.
Similarly, the dummy variable for the highest degree completed by the respondent’s
mother was equal to one if the respondent’s mother had a Bachelor’s Degree or higher,
and zero if the respondent’s mother had an Associate Degree or lower. Joint parental
income was converted into a dummy variable of one if the respondent’s parents had a
32
joint yearly income of greater than $90,000, and zero if the respondent’s parents had a
joint yearly income of $90,000 or less. And finally, responses regarding the respondent’s
major field of study were converted into a dummy variable of one if the respondent’s
major was in the School of Business or Accountancy and zero if the respondent’s major
was in any non-business related field. Serhat Yildiz, a Ph.D. candidate in finance at the
University of Mississippi, analyzed this data using the SAS program.
The first tests conducted were univariate analyses. A difference in means analysis
was used to focus on data from one specific demographic or socioeconomic variable at a
time. The total number of correct responses to the five FINRA financial literacy questions
was the variable compared between the two groups. Using univariate analysis, a mean
sum was calculated for each of the variables considered. The mean sum represents the
average score of correctly answered financial literacy questions. A standard deviation
from the mean was also calculated for each variable, representing the dispersion of data
from the reported mean. The difference between the means for each respective variable
was then calculated to determine if the variable influenced the number of correct
responses to the financial literacy questions. Additionally, each difference in means was
identified as either significantly different from zero or not significantly different from
zero, which is the null hypothesis. The test statistic used was a standard t-statistic, with
statistical significance determined by the p-value, denoted by “Pr > |t|.” The p-value
represents the probability of obtaining a test statistic as large as the one calculated if the
null hypothesis, in this case that the means are equal, is true. A variable with a p-value of
less than 0.1 is generally accepted as statistically significant.
33
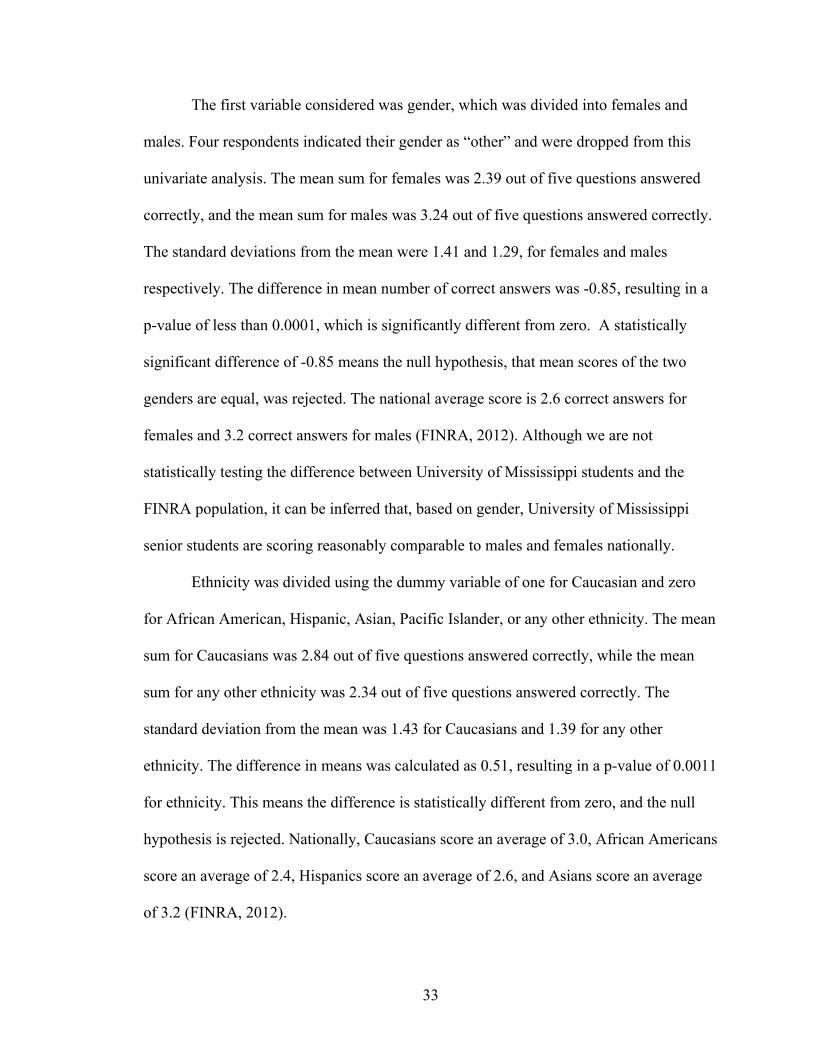
The first variable considered was gender, which was divided into females and
males. Four respondents indicated their gender as “other” and were dropped from this
univariate analysis. The mean sum for females was 2.39 out of five questions answered
correctly, and the mean sum for males was 3.24 out of five questions answered correctly.
The standard deviations from the mean were 1.41 and 1.29, for females and males
respectively. The difference in mean number of correct answers was -0.85, resulting in a
p-value of less than 0.0001, which is significantly different from zero. A statistically
significant difference of -0.85 means the null hypothesis, that mean scores of the two
genders are equal, was rejected. The national average score is 2.6 correct answers for
females and 3.2 correct answers for males (FINRA, 2012). Although we are not
statistically testing the difference between University of Mississippi students and the
FINRA population, it can be inferred that, based on gender, University of Mississippi
senior students are scoring reasonably comparable to males and females nationally.
Ethnicity was divided using the dummy variable of one for Caucasian and zero
for African American, Hispanic, Asian, Pacific Islander, or any other ethnicity. The mean
sum for Caucasians was 2.84 out of five questions answered correctly, while the mean
sum for any other ethnicity was 2.34 out of five questions answered correctly. The
standard deviation from the mean was 1.43 for Caucasians and 1.39 for any other
ethnicity. The difference in means was calculated as 0.51, resulting in a p-value of 0.0011
for ethnicity. This means the difference is statistically different from zero, and the null
hypothesis is rejected. Nationally, Caucasians score an average of 3.0, African Americans
score an average of 2.4, Hispanics score an average of 2.6, and Asians score an average
of 3.2 (FINRA, 2012).
34
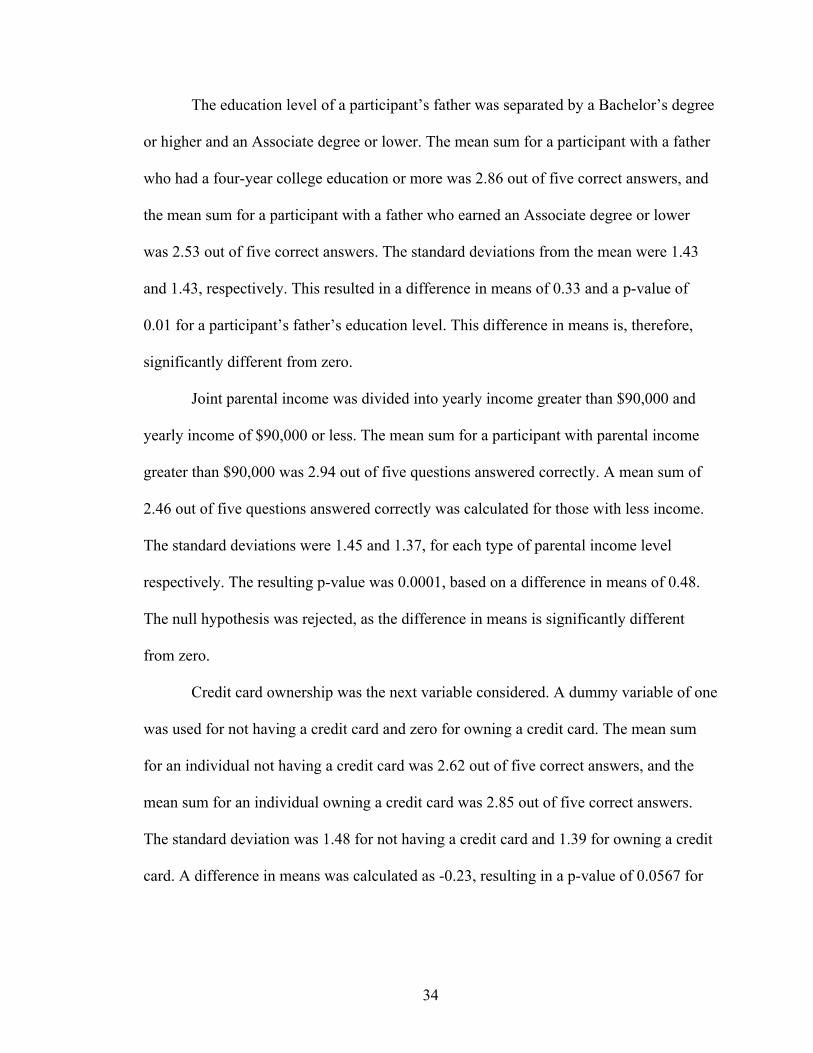
The education level of a participant’s father was separated by a Bachelor’s degree
or higher and an Associate degree or lower. The mean sum for a participant with a father
who had a four-year college education or more was 2.86 out of five correct answers, and
the mean sum for a participant with a father who earned an Associate degree or lower
was 2.53 out of five correct answers. The standard deviations from the mean were 1.43
and 1.43, respectively. This resulted in a difference in means of 0.33 and a p-value of
0.01 for a participant’s father’s education level. This difference in means is, therefore,
significantly different from zero.
Joint parental income was divided into yearly income greater than $90,000 and
yearly income of $90,000 or less. The mean sum for a participant with parental income
greater than $90,000 was 2.94 out of five questions answered correctly. A mean sum of
2.46 out of five questions answered correctly was calculated for those with less income.
The standard deviations were 1.45 and 1.37, for each type of parental income level
respectively. The resulting p-value was 0.0001, based on a difference in means of 0.48.
The null hypothesis was rejected, as the difference in means is significantly different
from zero.
Credit card ownership was the next variable considered. A dummy variable of one
was used for not having a credit card and zero for owning a credit card. The mean sum
for an individual not having a credit card was 2.62 out of five correct answers, and the
mean sum for an individual owning a credit card was 2.85 out of five correct answers.
The standard deviation was 1.48 for not having a credit card and 1.39 for owning a credit
card. A difference in means was calculated as -0.23, resulting in a p-value of 0.0567 for
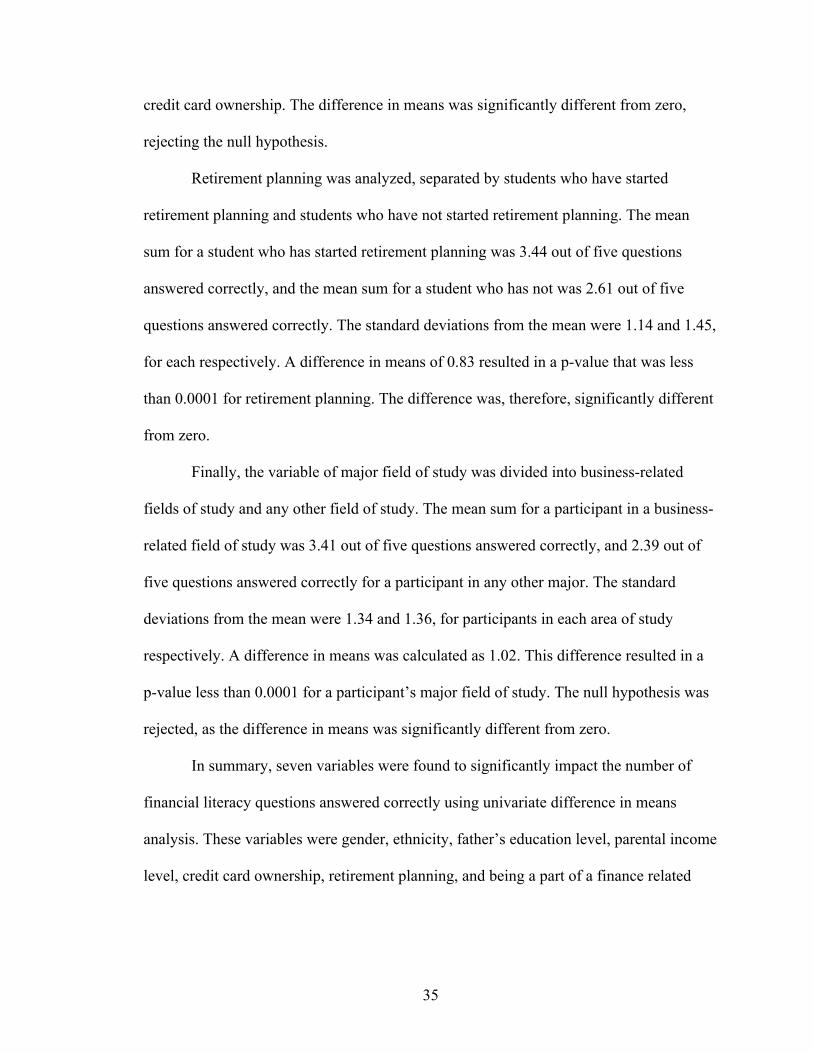
35
credit card ownership. The difference in means was significantly different from zero,
rejecting the null hypothesis.
Retirement planning was analyzed, separated by students who have started
retirement planning and students who have not started retirement planning. The mean
sum for a student who has started retirement planning was 3.44 out of five questions
answered correctly, and the mean sum for a student who has not was 2.61 out of five
questions answered correctly. The standard deviations from the mean were 1.14 and 1.45,
for each respectively. A difference in means of 0.83 resulted in a p-value that was less
than 0.0001 for retirement planning. The difference was, therefore, significantly different
from zero.
Finally, the variable of major field of study was divided into business-related
fields of study and any other field of study. The mean sum for a participant in a business-
related field of study was 3.41 out of five questions answered correctly, and 2.39 out of
five questions answered correctly for a participant in any other major. The standard
deviations from the mean were 1.34 and 1.36, for participants in each area of study
respectively. A difference in means was calculated as 1.02. This difference resulted in a
p-value less than 0.0001 for a participant’s major field of study. The null hypothesis was
rejected, as the difference in means was significantly different from zero.
In summary, seven variables were found to significantly impact the number of
financial literacy questions answered correctly using univariate difference in means
analysis. These variables were gender, ethnicity, father’s education level, parental income
level, credit card ownership, retirement planning, and being a part of a finance related

36
major field of study. The data related to these univariate analyses can be found in Table 1
and Table 2 in the appendices.
37
Chapter 7: Ordinary Least Squares Stepwise Regression Analysis
The second type of statistical analysis was an ordinary least squares stepwise
regression. A typical multivariate ordinary least squares regression analyzes all the
possible independent variables for significant impact on the dependent variable. The
dependent variable, in this case, is the number of correct answers to the five financial
literacy questions. Running this model as a stepwise regression changes the procedure
slightly from a normal OLS model. In a stepwise regression, there is a selection of
independent variables by an automatic process. Step by step, each independent variable is
considered for inclusion in the model based on pre-specified criteria. In this study, the
selection criterion was a significance level of 0.3 for each independent variable to enter
the model. For the selected independent variables to remain in the model, they had to
maintain a 0.35 significance level. After the independent variables were selected, the
regression was conducted. Coefficients were estimated for each independent variable,
representing the average increase or decrease in the number of questions answered
correctly for the variable being considered, holding all others constant. A change in the
independent variable of one, using dummy variables, will result in an average change in
the dependent variable equal to the coefficient. The p-value was used to judge the
statistical significance of each variable in the model, with a value of .1 or less indicating
the effect of the variable was significantly different from zero. The following information
pertains to only the variables that were statistically significant in the regression model.
38
The first independent variable to be added to the stepwise OLS model was being
in a business-related major. A dummy variable of one was used for participants in a
business-related major, and zero otherwise. The regression coefficient was 0.8104,
meaning that someone who is enrolled in a business field of study averages 0.8104
correct answers higher than those that are not. The variable was shown to be significant
by a p-value of less than 0.0001. These results mean that, in the presence of all the other
independent variables, enrollment in a business major matters towards the number of
financial literacy questions answered correctly.
Gender was segregated into dummy variables, with female being a one and male
being a zero. The four participants identifying as other gender were dropped. The
coefficient for gender was -0.7463, indicating that females average approximately three
fourths of a question less than males. This coefficient had a p-value of less than 0.0001.
Gender matters towards the total score of the financial literacy survey, in the presence of
all the variables.
Interestingly, the next most significant factor in this regression was whether a
person had already started to plan for retirement. If a participant had started retirement
planning, he or she was assigned a dummy variable of one. The coefficient indicated that
those who had started planning scored an average of 0.5018 correct answers higher than
those that had not. The p-value was 0.0009, meaning that retirement planning matters in
correctly answering the financial literacy survey.
A dummy variable of one was assigned to participants with joint parental income
of greater than $90,000, and zero to those with less. Based on the coefficient, seniors
whose parents earn more than $90,000 annually averaged 0.2689 correct answers higher.
39
The statistical significance was verified by a p-value of 0.0266, indicating parental
income level matters.
The next variable was the education level of a participant’s father, with a dummy
variable of one for student’s whose father achieved a Bachelor’s degree or higher. The
regression coefficient was 0.2878, so participants with a more highly educated father
answered more questions correctly. The variable was found to be significant based on the
p-value of 0.032.
Caucasians were assigned a dummy variable of one and all other ethnicities were
assigned a zero to analyze the influence of ethnicity within the model. A coefficient of
0.2609 showed that, on average, Caucasians were able to answer 0.2609 more questions
correctly compared to other ethnicities taking the survey. A p-value of 0.0834 indicated
statistical significance.
The last two variables shown to be significant within the OLS model are reported
as marginally significant in this regression. Owning three or more credit cards and being
employed while enrolled in college had p-values of 0.096 and 0.0981, respectively.
Surprisingly, the coefficient for owning three or more credit cards was 0.4851, meaning
that participants who currently own at least three credit cards averaged about one half
more correct answers than those who have less than three credit cards. One might think
that a person who signed up for that many credit cards while in college might be
financially uneducated or irresponsible, yet the results show that those in this study
actually performed better. The coefficient for someone who has held either a full or part-
time job while attending the University of Mississippi was 0.1853, meaning that working
while attending college positively influences the score on this financial literacy quiz.

40
In summary, eight independent variables were found to significantly impact the
number of financial literacy questions answered correctly using an ordinary least squares
stepwise regression. These variables were being enrolled in a business-related major,
gender, retirement planning, parental income level, father’s education level, ethnicity,
owning three or more credit cards, and having a full or part-time job. All of the relevant
information for this regression can be found in Table 3 in the appendices.
41
Chapter 8: Logistic Stepwise Regression Analysis
The third type of statistical test utilized was a logistic stepwise regression.
Because the dependent variable in the ordinary least squares regression was bounded and
discrete (rather than continuous), this logistic stepwise regression was conducted to
ensure that the variables that significantly influenced the financial literacy score in the
OLS model hold when the dependent variable is not assumed to be continuous and
normally distributed. This type of regression works differently than the previous test by
having a different dependent variable. In the case of a logistic regression, the dependent
variable must be a binomial response with only two possible outcomes. For this study, the
binomial response was based upon a participant answering more than three financial
literacy questions correctly. All of the independent variables are then analyzed in the
regression to determine if they influence the likelihood of a person answering more than
three finance questions correctly. This effect is reported by an estimated coefficient. A
positive coefficient means that a respondent is more likely to answer more than three
question correctly, while a negative coefficient means that the individual is less likely.
And again, because it is a stepwise regression, each variable must meet the selections
criteria. The criteria were a 0.3 significance level to enter the model and maintaining a
0.35 significance to remain in the model. Another difference to note is that, rather than a
p-value, a logistic regression uses a chi-square value to determine significance. But just
42
like the p-value, a chi-square value of less than .1 denotes statistical significance and is
therefore interpreted in a similar manner.
Five independent variables were found to be significant and positively affect the
likelihood of more than three correct answers on the financial literacy quiz, meaning all
five of the variables had positive coefficients. The factors were being enrolled in a
business-related major, having an annual joint parental income of greater than $90,000,
being a Caucasian, having started retirement planning, and having a father who attained a
Bachelor’s degree or higher. These results mean that being a part of any of these
categories increases the person’s likelihood of being able to answer more than three of
the FINRA questions correctly, and therefore being financially literate. All five variables
were found to be statistically significant with chi-square values well below 0.05.
Only one independent variable was found to be statistically significant in
negatively impacting the likelihood of answering more than three questions correctly. A
participant being a female was found to have a negative estimated coefficient, meaning
females were less likely to correctly answer over three questions. The gender variable
was found to be significant by a chi-square value of less than 0.0001.
In summary, five significant variables reported positive estimated coefficients and
one variable reported a negative coefficient. Majoring in a business field of study, having
a parental income over $90,000, being Caucasian, planning for retirement, or having a
father who completed at least a four-year college degree all increased the likelihood of
financial literacy as defined by the dependent variable. Being a female decreased the
likelihood of financial literacy. All of the relevant information pertaining to the logistic
stepwise regression can be found in Table 4 in the appendices.
43
Conclusion
Millennials are entering the workforce at a time of great fear in regard to the
potential loss of government-backed social security. And the burden of financial security
has become even greater for Millennials as the trend of defined contribution plans
continues and the number of potential financial investment options increases rapidly. And
as technological advances in healthcare extend the longevity of life for the average
American citizen, this longevity also increases the amount of retirement savings needed
for a comfortable life. Financial literacy is therefore very important for the Millennial
generation to achieve.
This study was conducted in an attempt to analyze the financial literacy levels of
near college graduates from the University of Mississippi to see how they compared with
national averages taken from the FINRA financial literacy quiz. Nationally, Americans
scored an average of 2.9 out of five questions correctly. However, the national average
for people aged 18 to 34 years old, the Millennials, was 2.3 out of five questions correct
(FINRA, 2013). Meanwhile, the average number of correctly answered questions from
this thesis study was found to be 2.75 out of five. At first glance, these numbers seem to
show that senior students at the University of Mississippi are scoring higher on average
than their Millennial cohorts. But FINRA also reported that Americans with some college
education scored an average of three correct answers, and those with a complete college
education or more averaged 3.5 out of five questions correct (FINRA, 2013). This data
44
implies that students nearing the completion of their degrees should be closer to a range
of 3.0 to 3.5, as they are now practically “college educated.”
In addition, analyses and regressions were conducted using collected demographic
and socioeconomic information to analyze each factor’s impact on the total number of
questions answered correctly and financial literacy. The first series of tests were
univariate analyses, looking at the statistical impact of each single independent variable
on the dependent variable of questions correctly answered. Seven variables were found to
significantly impact financial literacy, six of which improved the average and one which
lowered it. The six improving variables were being Caucasian compared to other
ethnicities, having a father with a Bachelor’s degree or higher, having a joint parental
income of greater than $90,000, owning a credit card, planning for retirement, and being
enrolled in a business-related major. The variable that negatively influenced the average
was being female.
An ordinary least square stepwise regression was then run to analyze the factors’
influence on the number of questions answered correctly, while in the presence of all the
other independent variables. Eight variables were reported as having statistical
significance, seven of which improved the average number of correct answers. Those
seven variables were being enrolled in a business-related major, planning for retirement,
having a parental income level over $90,000, having a father who earned a Bachelor’s
degree or higher, being Caucasian, owning three or more credit cards, and having a full or
part-time job while in school. Being a female was the one variable that lowered the
average.
45
Finally, a logistic stepwise regression was conducted to see which variables were
significant in affecting financial literacy, defined in this study as answering more than
three questions correctly. Six variables were found to be statistically significant, with five
showing a positive impact towards financial literacy and one impacting it negatively.
Majoring in a business field of study, having a parental income over $90,000, being
Caucasian, planning for retirement, or having a father who completed at least a four-year
college degree all increased the likelihood of being financially literate. Being a female
decreased the likelihood of financial literacy.
In general, I found six key variables in determining financial literacy: gender,
ethnicity, being enrolled in a business-related field of study, father’s education level,
parental income level, and actively planning for retirement. Only a couple of these
variables, chosen major field of study and active retirement planning, can be effectively
influenced by the University of Mississippi. While I am not advocating for all students at
the University of Mississippi to major in a business-related field, enrolling in a personal
finance class would likely have a positive influence on university students’ scores. The
topics related to the financial literacy questions, including retirement planning, are
covered in a personal finance course. Since it is unlikely that the University of
Mississippi would be willing to require all students to take a personal finance class,
encouraging enrollment as well as disseminating the results of this study might push
some students to work toward gaining more knowledge in the area of finance.
The University of Mississippi could also increase financial education
opportunities for students who are included in the demographic and socioeconomic
groups which this study indicates tend to perform worse on the financial literacy
46
questions. The Panhellenic Council could host a financial literacy event or workshop,
with qualified speakers addressing every member of a sorority on campus about financial
literacy topics. The University could provide financial education resources to campus
organizations catering to minorities, such as the Black Student Union, as well as
providing periodic volunteer instruction from finance professionals and teachers. Signs
and posters could be hung in campus housing with helpful personal finance tips and facts
to promote increased financial learning. The Office of Financial Aid could require any
student receiving financial support from the University to complete a short course on
money management, to help bridge the gap between the financial literacy rates of lower
income and higher income students. And these are just a few recommendations amongst
the numerous possibilities I am sure the University of Mississippi administration could
imagine. It is my hope that this study will bring awareness to the current issues of
financial literacy, and encourage future efforts to increase the level of financial
knowledge.
47
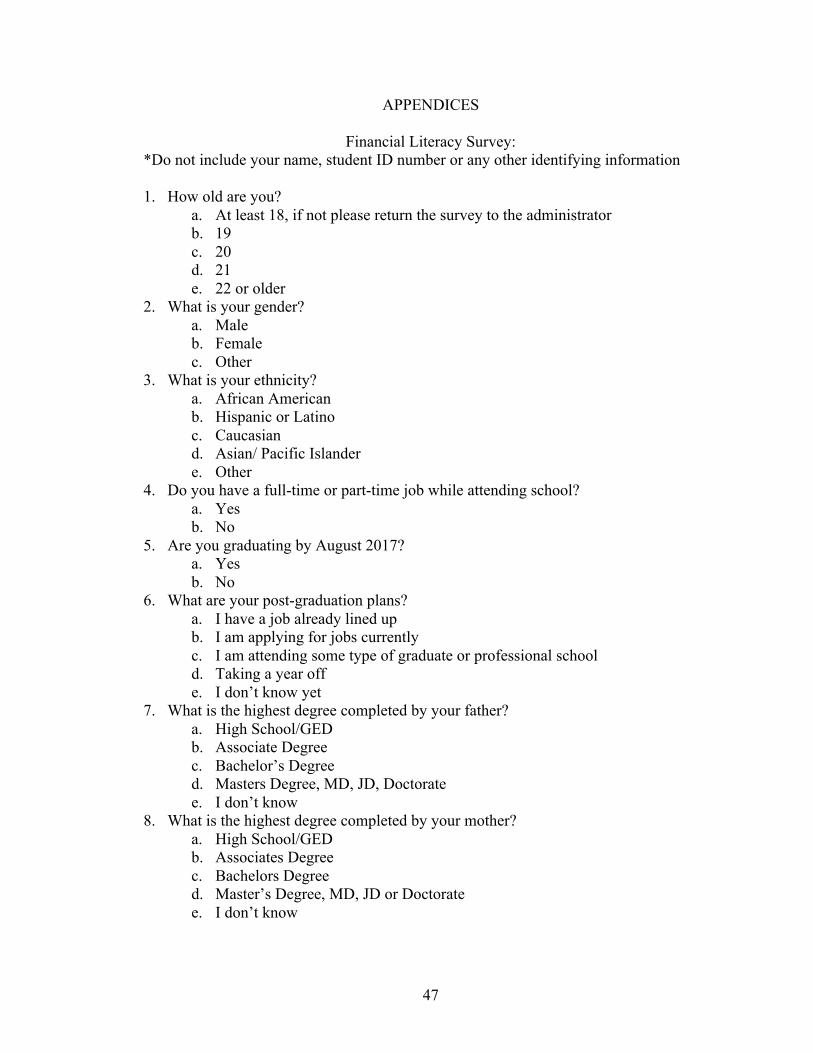
APPENDICES
Financial Literacy Survey: *Do not include your name, student ID number or any other identifying information
1. How old are you?
a. At least 18, if not please return the survey to the administrator b. 19 c. 20 d. 21 e. 22 or older
2. What is your gender? a. Male b. Female c. Other
3. What is your ethnicity? a. African American b. Hispanic or Latino c. Caucasian d. Asian/ Pacific Islander e. Other
4. Do you have a full-time or part-time job while attending school? a. Yes b. No
5. Are you graduating by August 2017? a. Yes b. No
6. What are your post-graduation plans? a. I have a job already lined up b. I am applying for jobs currently c. I am attending some type of graduate or professional school d. Taking a year off e. I don’t know yet
7. What is the highest degree completed by your father? a. High School/GED b. Associate Degree c. Bachelor’s Degree d. Masters Degree, MD, JD, Doctorate e. I don’t know
8. What is the highest degree completed by your mother? a. High School/GED b. Associates Degree c. Bachelors Degree d. Master’s Degree, MD, JD or Doctorate e. I don’t know
48
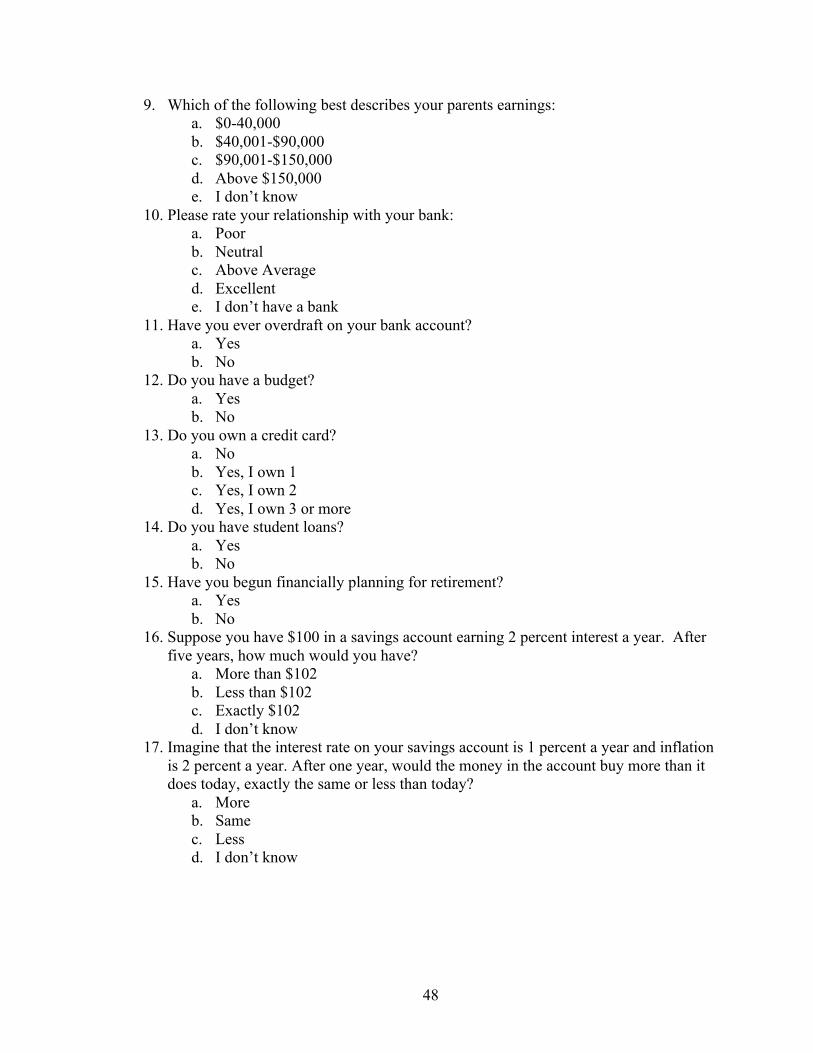
9. Which of the following best describes your parents earnings: a. $0-40,000 b. $40,001-$90,000 c. $90,001-$150,000 d. Above $150,000 e. I don’t know
10. Please rate your relationship with your bank: a. Poor b. Neutral c. Above Average d. Excellent e. I don’t have a bank
11. Have you ever overdraft on your bank account? a. Yes b. No
12. Do you have a budget? a. Yes b. No
13. Do you own a credit card? a. No b. Yes, I own 1 c. Yes, I own 2 d. Yes, I own 3 or more
14. Do you have student loans? a. Yes b. No
15. Have you begun financially planning for retirement? a. Yes b. No
16. Suppose you have $100 in a savings account earning 2 percent interest a year. After five years, how much would you have?
a. More than $102 b. Less than $102 c. Exactly $102 d. I don’t know
17. Imagine that the interest rate on your savings account is 1 percent a year and inflation is 2 percent a year. After one year, would the money in the account buy more than it does today, exactly the same or less than today?
a. More b. Same c. Less d. I don’t know

49
18. If interest rates rise, what will typically happen to bond prices? Rise, fall, stay the same, or is there no relationship?
a. Rise b. Fall c. Stay the same d. No relationship e. I don’t know
19. True or False: A 15-year mortgage typically requires higher monthly payments than a 30-year mortgage but the total interest over the life of the loan will be less.
a. True b. False c. I don’t know
20. Buying a single company’s stock usually provides a safer return than a stock mutual fund
a. True b. False c. I don’t know
Please turn to the back of the scantron, 21. In the first two columns for your LAST NAME, please bubble in your postal
abbreviation of your home state (two letter abbreviation). 22. In the IDENTIFICATION NO section, please bubble in your major field of study. A0 – Finance A1 – Accounting A2 – Management A3– Marketing A4 – Management Information Systems (MIS) A5 – Integrated Marketing Communications A6 – Journalism A7 – Public Policy and Leadership A8 – Croft Institute or International Studies A9 – Chemistry B0 – Biology B1 – Psychology
B2 – Engineering B3 – English B4– Education B5 – History B6 – Religious Studies B7 – Math B8 – Social Work B9 – Hospitality Management C0 – Exercise Science C1 – Foreign Language C2 – Economics C3 – Other
50
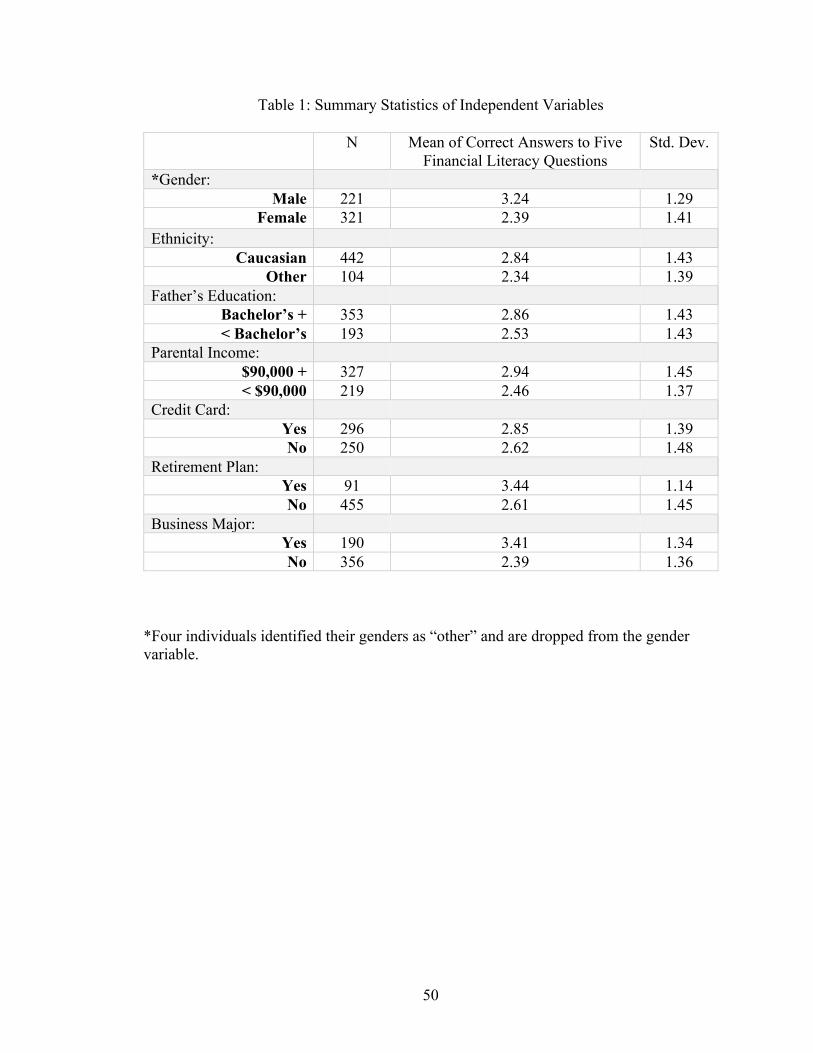
Table 1: Summary Statistics of Independent Variables
N Mean of Correct Answers to Five Financial Literacy Questions
Std. Dev.
*Gender: Male 221 3.24 1.29
Female 321 2.39 1.41 Ethnicity:
Caucasian 442 2.84 1.43 Other 104 2.34 1.39
Father’s Education: Bachelor’s + 353 2.86 1.43 < Bachelor’s 193 2.53 1.43
Parental Income: $90,000 + 327 2.94 1.45 < $90,000 219 2.46 1.37
Credit Card: Yes 296 2.85 1.39 No 250 2.62 1.48
Retirement Plan: Yes 91 3.44 1.14 No 455 2.61 1.45
Business Major: Yes 190 3.41 1.34 No 356 2.39 1.36
*Four individuals identified their genders as “other” and are dropped from the gender variable.
51
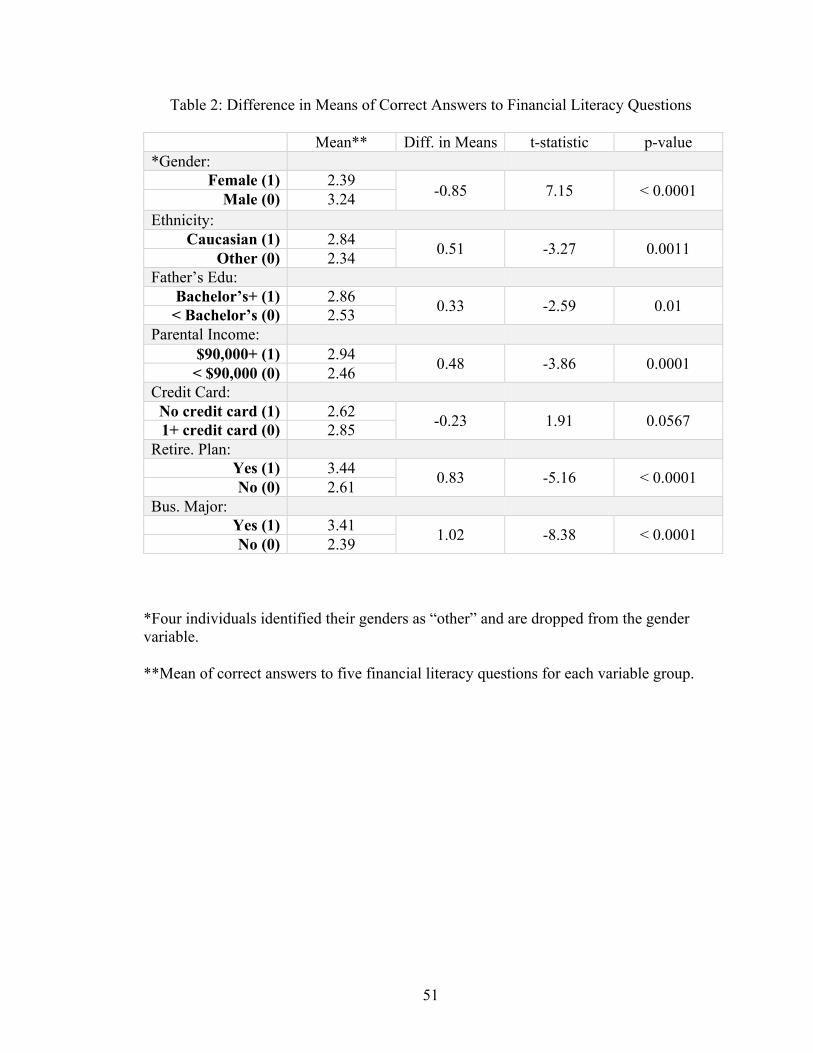
Table 2: Difference in Means of Correct Answers to Financial Literacy Questions
Mean** Diff. in Means t-statistic p-value *Gender:
Female (1) 2.39 -0.85 7.15 < 0.0001 Male (0) 3.24
Ethnicity: Caucasian (1) 2.84 0.51 -3.27 0.0011 Other (0) 2.34
Father’s Edu: Bachelor’s+ (1) 2.86 0.33 -2.59 0.01 < Bachelor’s (0) 2.53
Parental Income: $90,000+ (1) 2.94 0.48 -3.86 0.0001 < $90,000 (0) 2.46
Credit Card: No credit card (1) 2.62 -0.23 1.91 0.0567 1+ credit card (0) 2.85
Retire. Plan: Yes (1) 3.44 0.83 -5.16 < 0.0001 No (0) 2.61
Bus. Major: Yes (1) 3.41 1.02 -8.38 < 0.0001 No (0) 2.39
*Four individuals identified their genders as “other” and are dropped from the gender variable. **Mean of correct answers to five financial literacy questions for each variable group.
52
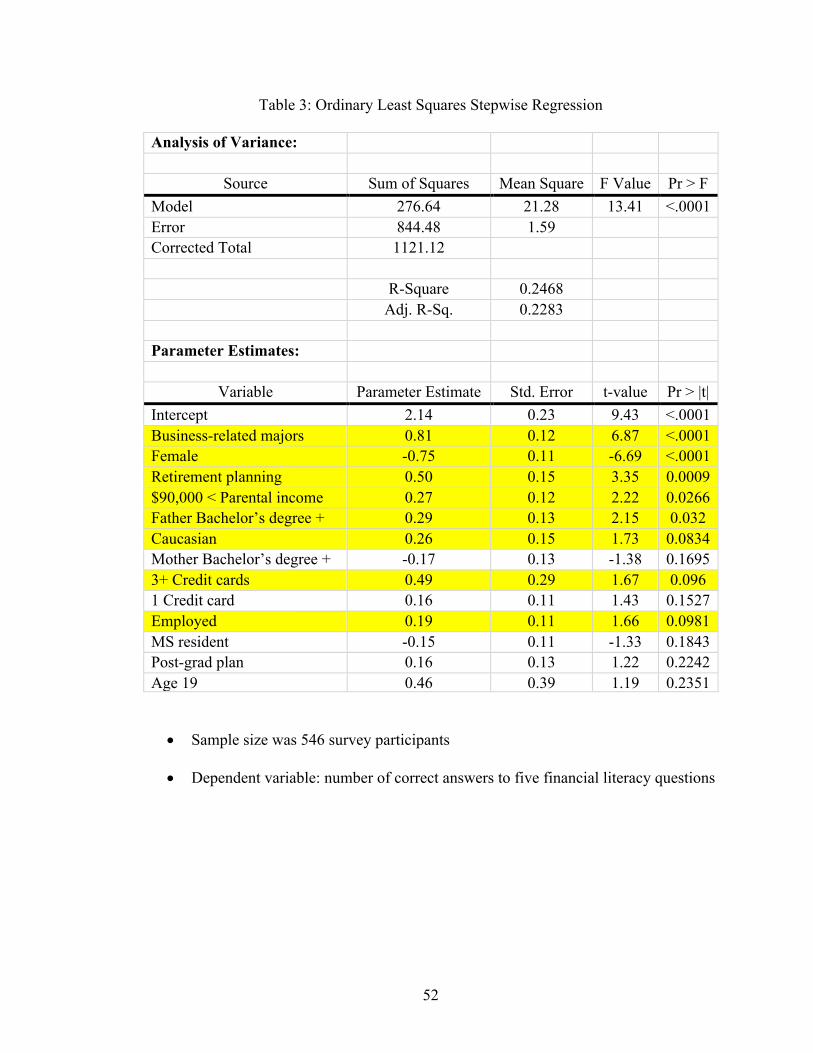
Table 3: Ordinary Least Squares Stepwise Regression
Analysis of Variance:
Source Sum of Squares Mean Square F Value Pr > F Model 276.64 21.28 13.41 <.0001 Error 844.48 1.59 Corrected Total 1121.12 R-Square 0.2468 Adj. R-Sq. 0.2283 Parameter Estimates:
Variable Parameter Estimate Std. Error t-value Pr > |t| Intercept 2.14 0.23 9.43 <.0001 Business-related majors 0.81 0.12 6.87 <.0001 Female -0.75 0.11 -6.69 <.0001 Retirement planning 0.50 0.15 3.35 0.0009 $90,000 < Parental income 0.27 0.12 2.22 0.0266 Father Bachelor’s degree + 0.29 0.13 2.15 0.032 Caucasian 0.26 0.15 1.73 0.0834 Mother Bachelor’s degree + -0.17 0.13 -1.38 0.1695 3+ Credit cards 0.49 0.29 1.67 0.096 1 Credit card 0.16 0.11 1.43 0.1527 Employed 0.19 0.11 1.66 0.0981 MS resident -0.15 0.11 -1.33 0.1843 Post-grad plan 0.16 0.13 1.22 0.2242 Age 19 0.46 0.39 1.19 0.2351
• Sample size was 546 survey participants
• Dependent variable: number of correct answers to five financial literacy questions
53
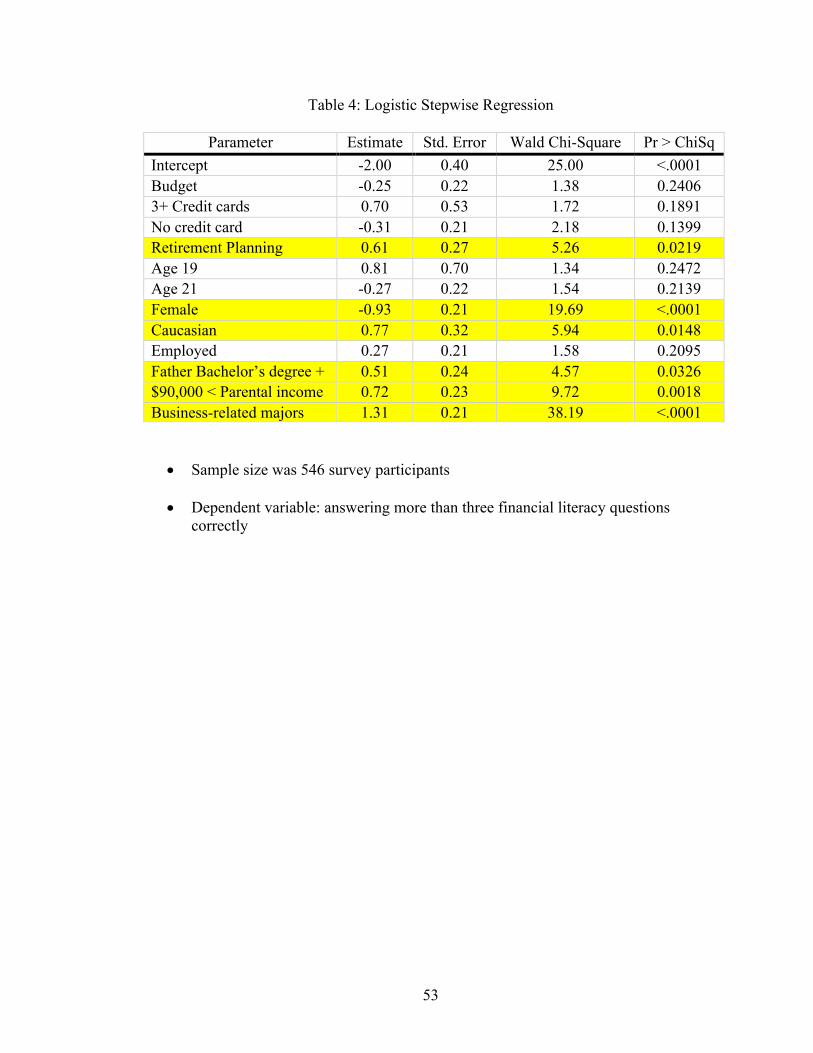
Table 4: Logistic Stepwise Regression
Parameter Estimate Std. Error Wald Chi-Square Pr > ChiSq Intercept -2.00 0.40 25.00 <.0001 Budget -0.25 0.22 1.38 0.2406 3+ Credit cards 0.70 0.53 1.72 0.1891 No credit card -0.31 0.21 2.18 0.1399 Retirement Planning 0.61 0.27 5.26 0.0219 Age 19 0.81 0.70 1.34 0.2472 Age 21 -0.27 0.22 1.54 0.2139 Female -0.93 0.21 19.69 <.0001 Caucasian 0.77 0.32 5.94 0.0148 Employed 0.27 0.21 1.58 0.2095 Father Bachelor’s degree + 0.51 0.24 4.57 0.0326 $90,000 < Parental income 0.72 0.23 9.72 0.0018 Business-related majors 1.31 0.21 38.19 <.0001
• Sample size was 546 survey participants
• Dependent variable: answering more than three financial literacy questions correctly
54
BIBLIOGRAPHY
American Financial Services Association Education Foundation. 2017. “State-by-State Assessment with Regard to Financial Literacy and Personal Finance Education Actions.” n.p. Web. Ebeling, Ashlea. 2016. “Is Everybody Stressed About Retirement?” Forbes. n.p. Web. Elam, Carol; Stratton, Terry; Gibson, Denise. 2006. “Welcoming a New Generation to College: The Millennial Students.” Journal of College Admission. n195, p20-25. Web. Financial Industry Regulatory Authority. 2013. “Financial Capability in the United States: Report of Findings from the 2012 National Financial Capability Study.” p1-40. Web. Financial Literacy and Education Commission. 2016. “Promoting Financial Success in the United States: National Strategy for Financial Literacy.” p1-47. Web. Goldman Sachs. 2016. “Millennials Infographic.” n.p., Web. Hawkins, Ken. 2008. “These Financial Products Are Too Complex for the Average Joe.” n.p. Web. Jump$tart Coalition. 2017. “About the Jump$tart Coalition for Personal Financial Literacy.” n.p. Web. Kantrowitz, Mark. 2016. “Why the Student Loan Crisis is Even Worse Than People Think.” TIME. n.p. Web. Mitchell, Josh. 2016. “More Than 40% of Student Borrowers Aren’t Making Payments.” Wall Street Journal. n.p. Web. National Center for Education Statistics. 2016. “Undergraduate Enrollment.” n.p. Web. New York Times. 2013. “Social Security, Present and Future.” n.p., Web. Odland, Steve. 2012. “College Costs Out of Control.” Forbes. n.p. Web. Organization for Economic Co-operation and Development. 2006. “The Importance of Financial Education.” n.p. Web. Pew Research Center. 2015. “Comparing Millennials to Other Generations.” n.p., Web. President’s Advisory Council on Financial Literacy. 2008. “2008 Annual Report to the President.” p1-71. Web.
55
Steverman, Ben. 2016. “The 401(k) Is Wreaking Havoc on Retirement.” Bloomberg. n.p. Web. TIME. 2012. “Op-Ed: Improving Financial Literacy Is Essential to Our Nation's Economic Health.” n.p. Web. University of Mississippi. 2016. “Diversity Matters.” p1-96. Web. US Census Bureau. 2015. “Millennials Outnumber Baby Boomers and Are Far More Diverse, Census Bureau Reports.” n.p. Web. Wang, Penelope. 2017. “You May Live Longer Than You Think. Here’s How to Afford It.” TIME. n.p. Web. Zucchi, Kristina. 2017. “Why Financial Literacy is So Important.” n.p. Web.