Embed Size (px)
Citation preview

Seton Hall UniversityeRepository @ Seton HallSeton Hall University Dissertations and Theses(ETDs) Seton Hall University Dissertations and Theses
Spring 2-5-2015
An Analysis of the Influence that CommunityDemographic Data have on Student Performanceon 2012 NJASK 8 Language Arts and MathematicsChristian John [email protected]
Follow this and additional works at: https://scholarship.shu.edu/dissertations
Part of the Curriculum and Instruction Commons, Educational Administration and SupervisionCommons, and the Educational Assessment, Evaluation, and Research Commons
Recommended CitationAngelillo, Christian John, "An Analysis of the Influence that Community Demographic Data have on Student Performance on 2012NJASK 8 Language Arts and Mathematics" (2015). Seton Hall University Dissertations and Theses (ETDs). 2066.https://scholarship.shu.edu/dissertations/2066
brought to you by COREView metadata, citation and similar papers at core.ac.uk
provided by Seton Hall University eRepository

AN ANALYSIS OF THE INFLUENCE THAT COMMUNITY DEMOGRAPHIC
DATA HAVE ON STUDENT PERFORMANCE ON 2012 NJ ASK 8 LANGUAGE ARTS AND MATHEMATICS
Christian John Angelillo
Dissertation Committee
Anthony Colella, Ph. D., Mentor Christopher Tienken, Ed. D. Janet Evers-Goodwin, Ed. D.
Peter Turnamian, Ed. D.
Submitted in partial fulfillment of the requirements for the degree of
Doctor of Education
Seton Hall University
2015

ii
© 2015 Christian John Angelillo

iii
Abstract
This correlational, explanatory, cross-sectional quantitative study intended to
analyze the influence that community demographic factors had on student performance
on the 2012 Grade 8 New Jersey Assessment of Skills and Knowledge (NJ ASK). The
data that were analyzed were procured from the New Jersey Department of Education
website as well as the U.S. Census Bureau’s American Factfinder. The sample size
included all New Jersey school districts with an eighth grade population of 25 or more
students. This ultimately equated to a sample size of N = 409. The studied explored the
community demographic variables that explained the greatest amount of variance on
students scoring Advanced Proficient and Proficient on the 2012 NJ ASK 8 Language
Arts and Mathematics. The statistical analysis showed that three independent variables
(predictors) explained the greatest amount of variance on student performance in both
Language Arts and Mathematics: no high school diploma, all people under poverty level,
and employment status. Language Arts scores related an R-square value of 67.2% with a
margin of error of +/- 7.1 and Mathematics had an R-square value of 63.2% with a
margin of error of +/- 9.8 when the independent variables were analyzed.
The statistically significant variables combined to accurately predict the
percentage of students scoring Proficient or Advanced Proficient in 89.0% of school
districts on the Language Arts section of the 2012 NJ ASK 8 and 89.2% of school
districts on the Mathematics section of the 2012 NJ ASK 8. This predictive power is
remarkable and provides data that demonstrate undeniably that student performance is
strongly influenced by factors that abrogate from teaching and learning in the classroom.

iv
The results from this study revealed that community demographic factors influenced
student results on the 2012 NJ ASK 8.
Acknowledgments
To Dr. Colella, I cannot thank you enough for your constant encouragement and
motivation. Whether it was a simple email or a quick phone call, your words not only
enlightened me but also always kept me focused on the task at hand. You were never too
busy to share your thoughts and offered your unconditional support from the very onset
of my research. Your patient, reassuring demeanor provided me with a real sense of calm
during what were some of my most chaotic moments! I hope that my research reflects
work that you are proud of, and I look forward in the hope that we will work together
again in the future.
To Dr. Tienken, I first came to appreciate your insightfulness and wisdom in 2011
when I was enrolled in your Curriculum Design and Engineering course. I remember
thinking, “What is this guy talking about?” and “Why wouldn’t we want to use
standardized assessment to measure the success of teachers and students?” Your “So
whats?” caused me to look critically at what test data really meant and for the last five
years I have made it my mission to ask others to consider “So what?” Thank you for
inspiring me to be a catalyst for change through my own research. Your delivery of
instruction always caused me to reflect. You have my respect and gratitude.
To Dr. Goodwin, I interrupted your day too many times to ask for your feedback
and advice as I felt I needed to “blow off steam.” Never once did you shut your door to
me (and, no, it was not because I am the principal and always barged in) when you were
busy with evaluations, curriculum revision, and all of the other wonderments that come

v
with being a school administrator. You always demonstrated a genuine care and concern
for my progress and, through your own experience, provided me with the reassurance
necessary to always forge ahead. Thank you.
To Dr. Turnamian, it was your research that initially served as the inspiration for
my own. I am so pleased that I was able to extend and complement your work and hope
that you, too, are proud of my research. I thank you for your willingness to always make
yourself available to me, especially as I began to set up my study. I hope that your work
continues to be reflected in the research of others for years to come.
To my mother, Nancy Duffy, you have always been the rock in our family. Your
love of history developed in me an appreciation for learning that still inspires me today.
Your love and support have never waivered even during some of life’s most trying times.
You are the very best mother a child could ever hope for! You have always expected the
best from me; and I hope that my actions as a son, husband, and father have always
reflected the best in you. I love you.
To my father, John Angelillo, I hope I have made you proud. Your greatest wish
was for me, Dennis, and Greg to receive a college education. We have all done that, and
then some! We have never used our situation as an excuse for failure, which was your
expectation. As a matter of fact, we have only used the lesson your illness taught as an
incentive for our success. I am the man I am today because of your influence.
To my pop, Tom Duffy, your support and advice have helped me to not only
develop and refine my leadership skills, but also created in me a work ethic that has
helped to bring me to the level of educational attainment that I am at this day. I am
forever grateful for your wisdom and love. You are a good man.

vi
To my brothers, Dennis and Greg, I will always be the biggest and strongest
brother! I admire both of you so much as sons, fathers, and husbands. Your character
and constant reminders of the importance of family have always kept us close and will be
passed on to our own children. I love you guys.
Finally, to James, Kirk, Cliff, Jason, Robert, and Lars, your voice, riffs, and fast,
rhythmic melodies kept me writing at a feverish pace that enabled me to bring this
process to conclusion!

vii
Dedication
To my beautiful wife and best friend, Carol, I am truly blessed to have you on this
earth as my partner. Your kindness and strong character are reflected in our children and
me and continue to bring out the best in all of us each day. Never once did you scoff at
the times I needed to “get work done.” You have always been the glue that keeps our
family together. You keep us grounded and always remind us of what is important in
life. You have fostered in Joey and Jenna the core values of respect and hard work that
will be the very foundation for their own success. Carol, I love you more than you could
imagine and am so grateful for your love, support, and intelligence. I am still amazed
that we get to spend every day together and look forward to many more tomorrows by
your side.
To my children, Joseph and Jenna, I am so proud of both of you. Each day with
you is a gift that I am so very thankful for. I smile widely and proudly when I think of
the two of you and all you are becoming. Remember that the old cliché “hard work pays
off” is absolutely true! You guys mean the world to me. Never forget how much you are
loved because it is an essential ingredient that will help drive your own success. Always
find the time to play and enjoy life’s little pleasures. They will forever keep you young.

viii
Table of Contents
Abstract…………………………………………………………………………………...ii
Acknowledgments………………………………………………………………..............iv
Dedication………………………………………………………………………………..vii
Table of Contents………………………………………………………………………..viii
List of Tables…………………………………………………………………………......xi
Chapter I. Introduction……………………………………………………………….........1 Purpose of the Study…………………………………………………………...........7 Statement of the Problem…………………………………………………................8 Research Questions…………………………………………………………….......11 Study Design and Methodology…………………………………………................12 Limitations of the Study……………………………………………………............12 Delimitations of the Study ...………………………………………………............13 Assumptions………………………………………………………………………..13 Definition of Terms…………………………………………………………….......14 Chapter Summary……………………………………………………………….....15 Organization of the Dissertation………………………………………...................16
Chapter II. Review of the Literature……………………………………………………..17
Introduction………………………………………………………………………...17 Existing Reviews…………………………………………………………………..19 Focus of Current Review……………………………………………………..........20 Significance of Existing Literature………………………………………...............21 Review Methods…………………………………………………………………...22 Limitations of the Review…………………………………………………….........23 Criteria for Inclusion and Exclusion of Literature…………………........................23 Methodological Issues with Existing Literature…………………….......................24 Examination of Current Literature: Body of the Review…….................................34 Practical and Research Significance…………………………………….................63 Brief Historical Perspective of NJ ASK 8................................................................64 Theoretical Framework……………………………………………………….........65
Chapter III. Methodology………………………………………………………………..70
Research Design…………………………………………………………………...70 Research Questions…………………………………………………………….......71 Null Hypothesis…………………………………………………………………....72 Population Sampled……………………………………………………………......72 Data Collection………………………………………………………………….....73

ix
Data Analysis………………………………………………………………………74 Reliability and Validity……………………………………………………….........76 Instrumentation………………………………………………………………….....79 Chapter Summary……………………………………………………………….....79
Chapter IV. Analysis of the Data………………………………………………………...81
Introduction………………………………………………………………………...81 Independent Variables………………………………………………………..........81 Interpretation of Table 1 for the Pearson Correlation for 2012 NJ ASK 8 LAL Scores………………………………………….........................................82 Interpretation of Table 2 for the Pearson Correlation for 2012 NJ ASK 8 Math Scores………………………………………............................................84 Simultaneous Multiple Regression – 2012 Grade 8 Language Arts….....................85 Simultaneous Multiple Regression – 2012 Grade 8 Mathematics............................89 Hierarchical Linear Regression Models………………………………....................91 Interpretation of the Hierarchical Linear Regression Model for 2012
Grade 8 NJ ASK Language Art Scores…...........................................................91 Interpretation of the Two-Way ANOVA for the Hierarchical
Linear Regression Model for 2012 Grade 8 LAL Scores…...............................93 Interpretation of the Standardized Coefficient Betas and Tolerance for the
Hierarchical Linear Regression Model for 2012 Grade 8 LAL Scores .............94 Interpretation of the Hierarchical Linear Regression Model
for 2012 Grade 8 NJ ASK Mathematics Scores…………….............................95 Interpretation of the Two-Way ANOVA for the Hierarchical Linear
Regression Model for 2012 Grade 8 Math Scores............................................96 Interpretation of the Standardized Coefficient Betas and Tolerance for the
Hierarchical Linear Regression Model for 2012 Grade 8 Mathematics Scores……………….…….................................................................................97
Predictive Power for the Dependent Variable of Language Arts…………….........99 Predictive Power for the Dependent Variable of Mathematics…..........................100 Research Questions and Answers for Dependent Variables………………….......101 Chapter Summary…………………………………………………………...........103
Chapter V. Conclusions and Recommendations…………………………….................106
General Observations………………………………………………..…...............106 General Conclusions 2012 NJASK Grade 8 for the Dependent Variable of
Language Arts …………………….................................................................107
General Conclusions 2012 NJASK Grade 8 for the Dependent Variable of
Mathematics…......................................................................................................................108 Recommendations for Policy and Practice………………….................................109 Recommendations for Future Research…………………..……............................112
References………………………………………………………………………............114

x
List of Tables
Table 1. Pearson Correlation Coefficient for 2012 NJ ASK 8 LAL Scores, where
N= 409…………………………………………………....................................83 Table 2. Pearson Correlation Coefficient for 2012 NJ ASK 8 Math Scores, where
N= 409…………………………………………................................................85 . Table 3. Grade 8 Language Arts Model Summary………………………………...........86 Table 4. Grade 8 Language Arts ANOVA Table………………………………….........86 Table 5. Grade 8 Language Arts Final Model Summary…………………….................87 Table 6. Grade 8 Language Arts Final ANOVA Table…………………………............87 Table 7. Grade 8 Language Arts Coefficient Table……………………………..............88 Table 8. Grade 8 Mathematics Model Summary………………………………..............89 Table 9. Grade 8 Mathematics ANOVA Table……………………………………........90 Table 10. Grade 8 Mathematics Coefficient Table……………………………...............90 Table 11. Grade 8 Language Arts Hierarchical Linear Regression
Model Summary……………………………………………............................92 Table 12. Grade 8 Language Arts Two-Way ANOVA Hierarchical Linear Regression…………………………………….....................................93 Table 13. Grade 8 Language Arts Standardized Coefficients Betas and
Tolerance for the Hierarchical Linear Regression Model…............................95 Table 14. Grade 8 Mathematics Hierarchical Linear Regression
Model Summary………………………………………………………............96 Table 15. Grade 8 Mathematics Two-Way ANOVA Hierarchical
Linear Regression………………………………………………………........97 Table 16. Grade 8 Mathematics Standardized Coefficients Betas and Tolerance
for the Hierarchical Linear Regression Model.................................................99

1
CHAPTER I
INTRODUCTION
The United States of America prides itself on being innovative in many areas
across a broad spectrum. Educational endeavors and the need for improvement in
education is one such area that continues to be of paramount importance if the United
States is going to remain at the top of a competitive, progressive, and global
society/economy. It is evident that the Reagan administration’s 1983 report, A Nation at
Risk, was focused on improving the quality of teaching and learning at all levels because
the sentiment at that time was that public schools were to blame for the decline of the
United States economy relative to the production of other developed international
competitors such as Japan and Germany (Tanner and Tanner, 2007). More than 25 years
later, the Obama administration assessed the ability of the nation’s students to graduate
from American schools ready to embrace the rigors of college and career and thus
developed the $4.35 billion investment know as Race to the Top (RTT), the aim of which
was to encourage education reform as a means of embracing innovations in teaching and
learning across a broad spectrum.
Ralph Tyler, Noam Chomsky, and Paolo Freire authored works that provided a
perspective that could assist policymakers in looking at issues in education more
holistically in order to demonstrate a more comprehensive and student-centered approach
to education reform in response to both A Nation at Risk and Race to the Top. Many
authors write to challenge schools, educators, and school leaders to work to transform
American schools by making bold reforms in order to move the American educational
system forward.

2
A recent article from the October 31, 2012, edition of Education Week titled
“Redefining the Federal Role in Education” by Paul Manna and Keenan Kelley presented
a contrasting opinion that disputed A Nation at Risk and RTT. The contents of the article
and position of Manna and Kelley are useful in representing a point of view consistent
with research questions I have delineated in my study as Manna and Kelley (2012)
indicated that federal and state government officials who imposed change are “more
likely to prompt bureaucratic busyness and efforts by states and localities to game the
system, rather than encouraging them to use their own detailed knowledge of
neighborhood conditions to improve how schools operate” (p. 28). I believe the
assessment of the government’s role here as specified by Manna and Kelley is destructive
and contrary to improving the quality of experience that students in our schools receive.
A Nation at Risk surveyed both the national and international academic
shortcomings that affected American schools for a number of years from the 1960s to the
1980s. President Reagan’s commission indicated that the United States was deficient in
nineteen academic tests where American students were never first or second in
comparison with other industrialized nations, particularly in the Scholastic Aptitude Test
(SAT). In response, the commission made recommendations in the areas of content,
standards, expectations, time, teaching, leadership, and fiscal support. The Obama
administration’s Race to the Top emphasized reform in five areas as well, including
designing and implementing rigorous standards and high quality assessments, attracting
and keeping great teachers and leaders in schools, supporting data systems that inform
decisions and improve instruction, using innovation and effective approaches to
transform struggling schools, and demonstrating and sustaining education reform. I

3
found these reports intriguing considering that little or no mention was made, particularly
in the RTT report, that substantiates data that compared “apples to apples.” Tienken and
Orlich (2013) indicate that the rhetoric portrayed in A Nation at Risk should be viewed
with skepticism. They refer to the war metaphor that is written in the document that says,
“If an unfriendly foreign power had attempted to impose on America the mediocre
instructional performance that exists today, we might well have viewed it as an act of
war” (Tienken & Orlich 2013, p. 28). As a result, according to Tienken and Orlich
(2013), the issue of national security was used to “drive an ideological public school
reform agenda” (p. 28). Tanner and Tanner (2007) identified that an essential tenet of A
Nation at Risk was founded under the guise that public schools were to be blamed for the
decline of “U.S. hegemony over global industrial markets, resulting in the economic rise
of Japan and Germany in industrial productivity” (p. 144). This sentiment was espoused
by politicians and policymakers and was used to reconfigure school curriculum so that
greater instructional focus could be placed on science and math in order for the United
States to gain preeminence in the space race (Tanner & Tanner, 2007). The resulting
rhetoric influenced a point of view among Americans and helped legitimize the belief
that America was, in fact, falling behind many contemporary, developed nations.
A 2012 report from Professor Michael Marder from the University of Texas
presented data that caused school administrators and teachers to reflect critically on
where students in the United States performed on standardized assessments relative to
those from other countries and the influence that poverty had on that data (2012).
Generally speaking, the United States outperformed other contemporary countries across
multiple areas. The information left me wondering if the issues debated in education
4
today are really as dire as our legislators and politicians would lead the general,
uninformed public to believe.
There are elements in both A Nation at Risk and RTT that supported a move
toward uniformity in the standards and expectations that must be designated in order to
transform schools and ensure that students are provided with the best possible
opportunities to succeed. It was evident that both reform initiatives transposed a degree
of top-down management with the proposals contained therein when investing in the
accountability measures that will drive potential reforms (move to national content
standards, evaluation models for staff, college/workplace readiness, etc.). A Nation at
Risk documented that the federal government would play an integral role in helping to
meet the needs of a diverse student learning population and also must ensure compliance
with constitutional and civil rights along with financial assistance. Yet, Noam Chomsky
(1999) would argue that it is incumbent upon individuals to take ownership of their
learning and, ultimately, control their own destinies (1999).
While A Nation at Risk and RTT and are both intended to provide the blueprint
for educational success, the bureaucratic rhetoric that each espouses speaks to Chomsky’s
position on neoliberalism; specifically, that the manufactured crisis by the government
that the United States is falling behind the rest of the world educationally has been
created solely for the profit of private groups at the expense of the public. It would seem
then that the involvement of the federal government is at the top of the paradigm shift and
the suggested transformation of the education system. This sort of attempted
indoctrination is quite contrary to the sentiment that Paulo Freire (1992) identified in his
Pedagogy of the Oppressed. Freire discussed the idea that there is no neutral education
5
process. His philosophy urged educators to practice freedom rather than submit to the
rising tide of conformity. State departments are supposed to act independently in making
their transformation take place, according to RTT, although states are encouraged to work
jointly to develop common standards. This left one wondering whether or not we are
truly free, even locally, to make sound educational decisions for students or if we are just
conforming as Freire indicated to the expectations that are being placed on school leaders
by federal and state departments? Are we establishing a culture for learning that allows
students to experience for themselves and learn from those experiences, as John Dewey
(1938) suggested, or is a culture of indoctrinated subjects inhabiting today’s classrooms
being nurtured? These are the questions that require true reflection by those leading our
schools and school districts. In his Basic Principles of Curriculum and Instruction, Ralph
Tyler (1947) contended that curriculum could come from anywhere. This sentiment
aligned perfectly with Dewey and connected to the ability of teachers to nurture a sound
philosophy of experience. Both Dewey and Tyler paralleled philosophies that could
assist policymakers in making more informed decisions, particularly when recognizing
that curriculum is not simply relevant in one place; i.e., the text that is conveyed to
students through direct instruction in the classroom. Curriculum and education at large
can take place in many forums and must be connected to the student.
Ralph Tyler (1947) played a critical role in the Eight Year Study (1930-42). His
service was critical, as Tyler was able to develop his four basic principles or “pillars.”
One of Tyler’s principles is of particular relevance to this study, as it provides an
essential tenet for curriculum development and connects well to Dewey’s philosophy of
experience. Namely, that it is incumbent upon school leaders and teachers to establish

6
useful learning experiences for students. Clearly, the main focus of both A Nation at Risk
and RTT is on the accountability of educators and the expectation for student
achievement. These reform initiatives provided little emphasis on the experience of
students and the influence that those experiences can have on future success. Both also
referred to issues such as the compensation of teachers. A Nation at Risk went so far as
to suggest that the salaries of teachers be both professionally competitive and
performance-based. Race to the Top identified the methodologies associated with
attracting and retaining great teachers and leaders in America’s classrooms and explicitly
indicated that this could be accomplished by improving teacher preparation and revising
teacher evaluation, “compensation,” etc. Regardless of which issue is being discussed, it
is evident that our legislators and leaders in the state and federal government are
committed to seeing that the education system is reformed to accommodate 21st century
skills associated with college and career readiness.
The National Commission on Excellence in Education in 1983 categorized
content change to curriculum by recommending increased rigor with four years of
English, three years of mathematics, three years of science, three years of social studies
and a half-year of computer science. RTT called for the development of more rigorous
standards by encouraging the growth of common academic standards that will “build
toward college and career readiness” (U.S. Department of Education, 2009, p. 1). This
competitive grant program helped to empower the states to be the change agents, as the
federal government’s involvement is merely to assist the states in this process by creating
the guidelines necessary for reform, but which I assert limits the involvement of the
certified education professionals in this process. Manna and Kelley (2012) wrote that

7
there is little to be optimistic about when trusting in the federal government’s inability to
effectuate change in education when one considered the fact that “The No Child Left
Behind Act is witness to confusion and poor sets of incentives such as Adequate Yearly
Progress” (p. 28). Manna and Kelley (2012) did indicate that there is the promise for our
federal leaders to help improve conditions in education, as they have the bully pulpit and
audience to “jump-start national conversations and highlight concerns in open, honest
dialogue with state legislators and local superintendents” (p. 28). However, there
remains little room for capacity building among educators to effectuate change
independent from local or federally motivated mandates. Relief from these mandates that
drive accountability measures stemming from student performance on standardized
assessments seems to be an apparition. Yet, the legislators across the state of New Jersey
fail to recognize that the influence of community demographic data in determining
student outcomes on standardized assessments is a reality that cannot be ignored.
Purpose of the Study
The purpose of this study was to extend the research of Turnamian (2012) in order
to explain how well community and family demographic factors found in the US census
data predict the percentage of students scoring Proficient or above on the 2012 Grade 8
New Jersey Assessment of Skills and Knowledge in both Language Arts and
Mathematics.
Turnamian’s (2012) study researched the effects of community wealth
demographic factors on student performance on the NJ ASK 3 in Language Arts and
Mathematics and broadened results gleaned from Maylone’s (2002) study. Ultimately,
the research in this study was limited to data derived from NJ ASK 8 student scores for

8
the 2012 testing year because results from previous studies concentrated on data from NJ
ASK student outcomes in primary grades. In addition, the U.S. Census data presented in
this study were obtained from updated information through American Factfinder for 2010
that was not available to Turnamian when his study was conducted in 20009.
Consequently, the updated data provided a more comprehensive investigation into family
and community demographic information that enhanced this research. Additional
variables were introduced in this study that Turnamian did not have access to, such as
lone parent male, lone parent female, employment status, and all people under poverty.
Similar to objectives identified as the result of Turnamian’s (2012) research, if out-of-
school variables are found to explain significant variance and in some cases predictive
power in district test scores, the value of using district test scores to measure the quality
of in-school variables may be in question.
Results collected from this study might assist legislators and school leaders in
developing policy that accounts for socioeconomic status as a reason for student
performance on standardized assessments. As a result of this research, stakeholders
might demonstrate a greater appreciation for the role that community wealth factors has
in predicting student outcomes on standardized assessments and might cause them to
reflect on the types of remedial programs that are offered to students based upon student
outcomes on such assessments.
Statement of the Problem
The value of using standardized assessment as an indicator of both teacher and
student success has long been debated among progressive and essentialist educational
theorists. The so-called “progressive” educational initiatives from the federal and state

9
governments aimed at increasing teacher and administrator accountability and student
achievement rarely take into consideration factors outside of the realm of classroom
instruction and administrative leadership (Leithwood, 2001). Factors impacting student
achievement such as the level of education of their parents, students coming from single
parent households, and median household income are not projected by the state and
federal government as viable factors for the proficiency or lack of proficiency of students
on state mandated assessments (Davis-Kean, 2005).
Furthermore, little quantitative, correlational, cross-sectional research has been
conducted that links student performance on standardized assessments such as the New
Jersey Assessment of Skills and Knowledge (NJ ASK) and the future success of students
educationally and/or professionally. Moreover, research on this topic has been limited
since 2010 with the inception of the Common Core era. However, results from empirical
evidence have demonstrated time and again that socioeconomic status proves to be a
major influence in determining the success or failure of students on standardized tests
(Tienken & Orlich, 2013).
Educational theorists have long advocated for an educational system marked by
rigor. Bower and Powers (2009) conducted a study to determine the essential
components of rigor. Bower and Powers (2009) indicated that rigor was defined as a
method by which curriculum was delivered within the classroom to ensure that students
were not only successful on standardized assessments but were also able to apply
knowledge to new situations both withinthe classroom and in the real world (2009).
Furthermore, Bower and Powers (2009) identified higher-order thinking skills and real-
world application as two critical aspects of rigor. As a result, rigor included the capacity

10
to apply the knowledge that had been gained by students through the instructional process
and assessment methods in an authentic manner. Thus, students are able to demonstrate
analysis and synthesis along the higher order of Bloom’s Taxonomy (1956).
The notion of a meaningful, authentic curriculum is not a new one. John Dewey
(1932) called for a curriculum that involved a critical but balanced understanding of the
culture and the prior knowledge of each child in order to extend learning. In 1996,
essentialist E.D. Hirsch published The Schools We Need and Why We Don't Have Them.
In it, Hirsch (1996) proposed that romanticized, anti-knowledge theories of education are
prevalent in America and are not only the cause of America's lackluster educational
performance but also a cause of widening inequalities in class and race. Hirsch (1996)
portrayed the focus of American educational theory as one which attempted to give
students intellectual tools such as "critical thinking skills" but which denigrated teaching
any actual content, labeling it "mere rote learning" (Hirsch, 1996). Hirsch stated that it is
this attitude that has failed to develop knowledgeable, literate students (Hirsch, 1996).
In his 2012 study, Peter Turnamian examined the influence that school
demographic data have in explaining student test scores on the NJ ASK Grade 3
Language Arts and Mathematics scores. Turnamian (2012) indicated in his research that
variables existing outside of the school such as family wealth indicators have been
proven to significantly influence student achievement as measured by standardized
assessments (Turnamian, 2012). Turnamian’s research provided clarity as it relates to the
debate regarding the influence of community wealth demographics on student results on
standardized assessments.

11
The modern educational systems of the 21st century focus on skills that promote
college and career readiness. Policymakers and legislators alike correlate the word
“readiness” with student proficiency on standardized assessments such as the NJ ASK
and have implications that extend beyond the realm of the student to factors such as
teacher accountability and principal leadership (Marzano, 2005). Yet little substantial
research has been conducted on the influence that factors explaining out-of-school
socioeconomic variables such as parent education level, single parent households and
median household income has in the overall success of students on the NJ ASK since the
Common Core era. This information would be extremely valuable to administrators as
they make recommendations for programming and staff professional development.
Looking at three main overarching research questions can support the essence of this
hypothesis:
Research Questions
This study examined three main research questions:
1. How much variance in 2012 NJ ASK Grade 8 test results in Language Arts and
Mathematics is explained by out-of-school socioeconomic variables?
2. How accurately can out-of-school socioeconomic and community-level
variables predict a school district's percentage of students scoring Proficient or
Advanced Proficient on the 2012 NJ ASK Grade 8 Language Arts and
Mathematics sections?
3. Which community-level variables account for the greatest amount of variance
in a school district's percentage of students passing the 2012 NJ ASK Grade 8
in Language Arts and Mathematics?
12
Study Design and Methodology
I used a correlational, explanatory, cross-sectional design with quantitative
methods to conduct the study. I used New Jersey School Report Card data to analyze
student outputs on the 2012 NJ ASK 8 Mathematics and Language Arts. The NJ ASK is
administered to students in Grades 3-8. The eighth grade year is the last year in which
students are administered the NJ ASK in New Jersey school districts. There is little
quantitative, correlational research that has been conducted linking student outputs on the
NJ ASK 8 to socioeconomic and other community factors to student performance on the
NJ ASK 8. The resulting study adds to available literature on this topic and provide as a
resource for future research.
Limitations of the Study
The following limitations were present in this study:
• The sample that was studied was limited to students educated in traditional
public school districts in the state of New Jersey and cannot be generalized to
other schools outside of the state of New Jersey.
• The study was based on student results from the Grade 8 New Jersey
Assessment of Skills and Knowledge and is, therefore, limited to that grade
level alone.
• The study was based on one form of standardized assessment, the NJ ASK,
and does not account for other standardized test results.
• The primary assessment used in the study is the NJ ASK, which is being
phased out after the 2013-2014 school year and replaced by the Partnership of
College and Career Readiness (PARCC).

13
Delimitations of the Study
The researcher in this study made the following generalizations:
• Research conducted in this study was not to be correlated with NJASK data
beyond that of Grade 8, as these were the only test results that were examined.
• The lone source of student achievement data used to conduct this study was
gathered from 2012 NJASK 8 test results in Mathematics and Language Arts,
as this was the only form of high-stakes, standardized assessment that was
administered to Grade 8 students in all districts throughout the state of New
Jersey.
• Research data cannot be generalized to school districts outside of the state of
New Jersey, as this was the only state that was examined in this study.
• Data that were collected for this study were assembled from two main
sources: New Jersey School Report Card data and United States Census
Bureau Factfinder.
Assumptions
The following assumptions were made while conducting this study:
• It was assumed in this study that information that was delineated in the New
Jersey School Report Card was accurate.
• It was assumed in this study that community wealth data reported in census
findings was accurate.
• It was assumed that all school districts that administered the NJ ASK 8 were
compliant with all testing regulations as designated by the New Jersey State
Department of Education and, therefore, test results were acceptable.

14
Definition of Terms
Adequate Yearly Progress (AYP): Provided that all students enrolled in public
schools who have taken the NJ ASK Grades 3-8 and High School Proficiency
Assessment in Grade 11 in both Language Arts and Mathematics would demonstrate
proficiency with their scores by 2014. School districts report these scores annually.
District Factor Group (DFG): Letter ratings labeling each school district in the state
of New Jersey as ranging from “A” (lowest) to “J” (highest). The ratings began in 1975
and have the purpose of comparing student performance on standardized assessments
from communities with similar socioeconomic status (New Jersey Department of
Education, 2014).
Nation at Risk: 1983 report of President Ronald Reagan administration’s National
Commission on Excellence. The publication is considered a landmark event in modern
American educational history. The commission’s report contributed to the body of
literature that was available at the time indicating that American schools were failing to
remain competitive with other developed nations. The report sparked a wave of local,
state, and federal reform efforts.
New Jersey Assessment of Skills and Knowledge (NJASK): The assessment that is
administered to all students enrolled in New Jersey public school districts in Grades 3-8
in both Language Arts and Mathematics. A science assessment is administered to
students in Grades 4 and 8. Scores range from 100 to 300. Partially Proficient is scored
as 100-199. Proficient is scores as 200-249. Advanced Proficient is scored as 250-300.
New Jersey School Report Card: The New Jersey School Report Card is an annual
report produced each year by the New Jersey State Department of Education for all

15
school districts and schools in New Jersey. The current School Report Card presents 35
fields of information for each school in the following categories: school environment,
students, student performance indicators, staff, and district finances; however, initially
the cards provided far less information (NJDOE, 2014).
No Child Left Behind Act (NCLB): Act passed by Congress in 2001 under
President George W. Bush. Provisions under NCLB allowed for states and school
districts to have flexibility in how tax dollars marked for education are spent in return for
holding educational professionals accountable for student results on standardized
assessments (U.S. Department of Education, 2002, p. 5).
Race to the Top (RTT): The Race to the Top program, a $4.35 billion fund created
under the American Recovery and Reinvestment Act of 2009 (ARRA), is the largest
competitive education grant program in U.S. history, warranting unprecedented
transparency and participation to ensure the best possible results. The $4 billion for the
Race to the Top State competition is designed to provide incentives to states to
implement large-scale, system-changing reforms that improve student achievement, close
achievement gaps, and increase graduation and college enrollment rates (U.S.
Department of Education, 2014).
Socioeconomic Status (SES): The measure of an individual’s or family’s economic
or social position based on education, income, or occupation.
Chapter Summary
The study being conducted adds to the growing amount of research available that
might assist educators, administrators, and legislators in recognizing the flaws that exist
in our current educational system with regard to the accountability measures that are

16
imposed by the New Jersey State Department of Education. As a result, a greater
understanding of the factors influencing student achievement can be extended in order to
provide a perspective that accounts for the reasons that students perform or underperform
on state assessments. The study gleaned information that impacts the practice of using
standardized assessment results to make decisions for teachers, students, and
administrators. Consequently, the study revealed that factors that are not within the
control of the teacher instructing the student in the classroom but rather stem from
community demographic data have an influence on student outcomes on standardized
assessments. The findings may be useful to help refocus the efforts of administrators and
legislators to redirect accountability measures based solely on test results.
Organization of the Dissertation
Chapter II of the dissertation is comprised of a literature review inclusive of all
the relevant literature on the topic of standardized assessment and community wealth
demographic data. Included in the chapter is information that spans theoretical
approaches to standardized assessment, the background on standardized assessment, and
the direct and indirect decision making processes of school administration as it relates to
student performance on standardized assessments. Chapter III provides the methodology
and instrument used for collecting data in response to the research questions driving the
study. Chapter IV presents the findings of the study, and Chapter V reports and discusses
the conclusions, recommendations for future research, and other implications of the
study.

17
CHAPTER II
REVIEW OF THE LITERATURE
Introduction
The following literature review examines research and applicable articles and data
related to the efficacy of high-stakes testing and the important decisions that are made for
students and teachers. Consequently, the dilemma exists that these data are rarely placed
into a context that considers how community wealth demographic factors influence such
decisions. This phenomenon is also explored in order to demonstrate that those factors
do play a significant role in predicting student outcomes on standardized assessments. As
a result, decisions made for students and teachers based on standardized test results may
be impacted by community wealth demographic factors. A variety of topics are explored
that provide a historical overview of the efficacy of high-stakes testing as well as a
synopsis of the decisions that are made that impact teachers and students as a result of
high-stakes testing. In order to present a broader context, the work of various critical
theorists in the field are included so that a more comprehensive study of the literature is
conducted that helps connect to policy and legislation that has been developed and that
impacts on the decisions that are made for students and teachers. A body of literature is
explored that is pertinent to NJ ASK 8 and the impact of district demographic data on
student achievement. The review provides information that enables researchers to
understand the efficacy of high-stakes testing to make decisions for teachers and students
by examining the following: a history of high-stakes/standardized testing, decisions and
legislation that has been developed as a result of high-stakes/standardized testing, and the
impact of those decisions and legislation on teachers and students. Furthermore, many of
18
the unintended negative consequences of standardized assessment can be attributed to
high-stakes testing and the results of those assessments.
Understanding the importance of this project, it was essential to include literature
that presents information that embodies research aligned to contemporary educational
initiatives. The intent of this review was to assist various groups, including educators,
policymakers, and researchers in having a body of work for future reference as high-
stakes testing and decisions impacting teachers and students becomes even more
prevalent.
The No Child Left Behind Act (NCLB) passed in 2001 by Congress maintained
that high standards and measurable goals for individual students would improve student
outcomes in education (2002). A basic tenet of NCLB requires that states develop and
administer assessments to students that enable educators to measure student basic skills in
mathematics, language arts, and science (2002). However, NCLB did not simply assess
student progress. School districts, individual schools, school administrators, and teachers
are all ranked and rated on their effectiveness as student performance on the New Jersey
Assessment of Skills and Knowledge (NJ ASK) is reported. These assessment data assist
teachers and school administrators in making decisions about curricular programs,
pedagogical practices, and student academic needs. NCLB can be viewed ultimately as a
bi-product of the 1983 Nation at Risk study conducted during President Ronald Reagan’s
administration (1983). This study was the result of the growing sentiment in the United
States that public education was failing students and the result was an individual that was
ill prepared for the rigors of a competitive workforce (1983). While both NCLB and A
Nation at Risk have been heralded by some as progressive thinking and as policy aimed

19
at informing educational reform and decisions, there are others who contest the
accountability measures, standards, and assessments as nothing more than rhetoric aimed
at appeasing an uninformed public and that ultimately hurts students.
Literature reviewed and of particular importance was comprised of assessment
data from the New Jersey Assessment of Skills and Knowledge (NJ ASK), School
Demographic Data delineated in the New Jersey School Report Card, and a variety of
pertinent information/data that can be found in scholarly journals and primary source
documents.
The data reviewed provides a historical analysis that connects information
between high-stakes testing and the important decisions that are made for both students
and teachers. The study of the pertinent literature assists school administrators and
educational leaders to draw conclusions about the connections between the two variables
and help inform future choices regarding the impact that high-stakes testing has on the
decisions that school leaders make, including instructional practices, professional
development, remedial programs, student enrichment opportunities, and curriculum
development/revision.
Existing Reviews
High-stakes testing is not a new phenomenon. High-stakes testing dates back to
the early 1900s. Edward Thorndike’s research with animals in 1911 was later related
specifically to assessment and intelligence testing. Thorndike’s study, Animal
Intelligence, an Experimental Study of the Associative Process in Animals, tested whether
animals could learn tasks through imitation or observation. Thorndike’s work with
animals extended to that of students when he theorized that learning takes place in

20
students when they associate the correct actions with successful responses (Aiken, 1942).
The United States army developed an aptitude system that was intended to measure the
leadership capabilities of soldiers preparing to be deployed during World War I. The
result was the creation of the Committee on Classification of Personnel from 1917-1919.
This committee was charged with measuring the intelligence of those in the army using
two forms: Beta Forms for illiterate recruits and Alpha Forms for literate recruits (Strong,
1918). Soon thereafter, students in schools across the country were being administered
standardized assessments to measure their intelligence. Policymakers and education
leaders looked to the past efficiency model for testing large numbers of subjects and
hence modified and adopted the Army Alpha Test for student academic
use (Pereira, 2011). The result is a contemporary educational system that relies on
a variety of standardized assessments to not only measure student and teacher
success/effectiveness, but also to use that information to make informed decisions about
teaching and learning.
The importance of identifying the impact on decision making for students and
teachers when using assessment data cannot be underestimated. The paradigm shift that
exists in contemporary education calls for increased accountability of school leaders and
teachers in order for students to remain competitive in a growing global society. There is
a variety of literature and research that has been conducted regarding the topic of the
efficacy of high-stakes testing and the important decisions that are made for teachers and
students.
Focus of Current Review
The focus of this review was an investigation of research conducted following

21
the implementation of the No Child Left Behind Act (NCLB) in 2001, research centered
on teachers and students in New Jersey and across the country and the impact that high-
stakes testing has had on those decisions that affect those two groups. The research
spanned information that was disseminated in studies ranging from The 1930 Eight Year
Study and The Johnson Administration’s Elementary and Secondary Education Act
(ESEA) of 1965 to the Reagan Administration’s 1983 A Nation at Risk, the Bush
Administration’s 2001 No Child Left Behind Act (NCLB), and President Obama’s Race
to the Top (RTT). The resulting research stemming from each of these legislative
initiatives is embedded throughout this literature review. The decisions that were made
as a result of the analysis of high-stakes testing may have both positive and negative
consequences for teachers and students.
The information presented in this review followed the framework of the Boote
and Beile scoring rubric (2005). In order for this process to be both meaningful and
relevant, it was imperative to present literature that identified the strengths and
weaknesses of decisions that were made that impacted students and teachers resulting
from test data and the inferences contained therein.
Significance of Existing Literature
The need to use student performance data of standardized assessments to assess
instructional and teacher effectiveness is an issue that is at the very forefront of education
discussions and debates in public schools across the country. This topic is of particular
importance to policymakers, educators, students, private corporations and various other
special interest groups. Both the proponents and opponents to this debate present
information in a fashion that is consistent with many of their peers. The information that

22
is referenced points to the view that the positive consequences of testing will lead to
enriched professional development opportunities for teachers as well as improved
instructional practices (Carnoy and Loeb, 2002), but also that the sanctions that can be
placed on teachers, students, and schools as a result of poor student performance on high-
stakes tests may be detrimental to students and teachers (Nichols & Berliner, 2008). Yet,
community demographic information is rarely, if ever, taken into consideration as a
viable reason for student performance on standard assessments. The contemporary
teacher and student of 2014 exist in an era of high-stakes testing. Therefore, the studies
and research conducted must provide direction and recommendations for future policies
that will be developed as a result of accountability measures and reform so that educators
and administrators can use the information gleaned from test data in a meaningful and
relevant way. The literature presented endeavored to this end and presented the research
in a manner that is consistent with existing literature and which may be helpful to direct
future research on this topic.
Review Methods
The literature reviewed for this comprehensive assessment was accessed through
an assortment of research databases that can be viewed through the Seton Hall library.
Databases included Academic Search Premier, EBSCOhost, ERIC, JSTOR, ProQuest,
and literature researched from educational journals. In addition, New Jersey School
Report Card data and various dissertations were referenced to assist in providing a
quantitative methodological approach to this study. Information from the United States
Department of Education website was referenced as well.
23
Limitations of the Review
Literature for this study was limited to public schools in the state of New Jersey
with a Grade 8 population of 25 or more students. Charter school information as well as
private school information was not included in this study. Furthermore, the population
that is targeted by many researchers limits their studies. Namely, special education
students are excluded from standardized testing data as reviewed by various researchers.
In addition, the overwhelming volume of literature on the unintended negative
consequences of high-stakes assessment far outweighs that which supports the use of
standardized/high-stakes assessment to make important decisions about teachers and
students. Thus, research appears to be skewed against high-stakes testing.
Criteria for Inclusion and Exclusion of Literature
The studies that were included in this literature review met the following criteria:
1. They were peer reviewed, dissertations, or government reports.
2. They used experimental, quasi-experimental, and non-experimental designs
with control groups or were of both qualitative and quantitative designs.
3. Published within the last 30 years unless they were seminal works that were
relevant to the review of a specific time period.
4. Report at least statistical significance.
The review stems from the reports that were initially conducted as a method for
improving student achievement in academic elementary and secondary education
settings. These results were gleaned from student performance on standardized
assessments. Information from some of the most influential studies and government
reports was disseminated, including The Eight Year Study, The Elementary and

24
Secondary Education Act, The Coleman Study, A Nation at Risk, and No Child Left
Behind (NCLB). An examination of some of the more influential theorists/researchers
such as Edward Thorndike, John Dewey, Ralph Tyler, and Amrein and Berliner (2003)
was also explored. The review also includes an analysis of influential studies in the field
related to the effects and use of high-stakes assessment to make important decisions as
well as an examination of studies conducted by Bolon (2001), Carnoy and Loeb (2002),
Stone and Lane (2003), and Jones (2008).
The review provides an analysis of literature that is relevant to specific variables
influencing student achievement such as household income, parental level of education,
and single-parent households by examining studies conducted by Maylone (2002) and
Jones (2008). These studies provide evidence within the broader context regarding
information concerning the validity and reliability of standardized assessment.
Methodological Issues with Existing Literature
The existing research available focuses primarily on the negative implications that
high-stakes testing has on teaching and learning. There is little research that supports
standardized assessment as a means of improving student achievement. However, the
research to that effect that does exist presents data that primarily focus on the rationale of
using high-stakes assessment data to help inform instructional practice gaps and
professional development opportunities for teaching staff that not only improves their
pedagogy but also can be used to effect student learning. In many cases, inconclusive
results were reported in studies that were researched. However, the body of research and
knowledge base continues to be expanded as new initiatives are created by the United
States Department of Education and new topics are explored.

25
Researchers such as Carnoy and Loeb (2002) and Rosenshine (2003) purport that
the focus of the educational endeavors of both teachers and students must stem from a
need to improve test scores through accountability systems if the United States is going to
remain at the top of a competitive, progressive, and global society/economy.
The Eight Year Study conducted from 1930 to 1942 consisted of 30 high schools
and 250 colleges. The study was an effort by the Progressive Education Association
(PEA) to have curriculum that was being taught by teachers in schools to refocus their
efforts to meet the needs of students who were both college bound and non-college
bound. Curriculum at the time was geared primarily toward the college bound student
population. The study that was guided by the PEA sought to determine if a more
cohesive curriculum inclusive of all students, whether college bound or not, would be
beneficial to all learners. The study ultimately gleaned information providing that the
curriculum revision of a more holistic nature did not impact on the college readiness or
success of those students who were, in fact, college bound. Furthermore, those students
who did attend college and had attended schools where fundamental changes to the
curriculum were made achieved at a level that exceeded many of those who had similar
ability and who were of comparable intelligence (Aiken, 1942). The study revealed some
significant findings that could be used for future reform but seemed to be lost in the years
following the Eight-Year Study. It would not be until nearly two decades later that the
topic of student achievement began to percolate again at the national level.
The inception of the Elementary and Secondary Education Act (ESEA) in 1965
during President Lyndon B. Johnson’s administration was intended to close the skills gap
in reading, writing, and mathematics between children from low-income households who

26
attended urban or rural school systems and children from the middle class who attended
suburban school systems. Under the provisions of Title I of ESEA, funding was to be
given to schools and school districts with a disproportionate percentage of low-income
students, as assigned by the federal government, to the state governments and, through
the local municipalities, to their school districts (U.S. Department of Education, 1992).
The Johnson administration reported that student achievement decreased as school
poverty levels increased. Thus, it was necessary to work through Title I to fund
impoverished schools with the idea that those students and schools that struggled to
achieve would improve if they had the necessary resources to ensure effective teaching
and learning. Yet, the Coleman Study (1966) conducted by sociologist James Coleman
reported that school-funding levels did not significantly impact student achievement.
Rather, Coleman’s (1966) work indicated that the primary indicator of student success
was influenced more by student background, socioeconomic status, and teacher
effectiveness in delivering instruction to students in the classroom.
The Reagan administration’s 1983 report, A Nation at Risk, was also focused on
improving the quality of teaching and learning at all levels because the sentiment at that
time was a prevailing attitude that “the rising tide of mediocrity threatened our future as a
nation and people” (USDOE, 1983). More than 25 years later, the Obama administration
assessed the nation’s ability to graduate its students from American schools ready to
embrace the rigors of college and career and thus developed the $4.35 billion investment
know as Race to the Top (RTT), the aim of which was to encourage education reform as
a means of embracing innovations in teaching and learning across a broad spectrum.

27
The works of Paulo Freire (1975), Noam Chomsky (1999), John Dewey (1902),
and Ralph Tyler (1950) have all facilitated a unique perspective that provides a
comprehensive outlook of the varying positions on the future direction of education in
contemporary society. A Nation at Risk and Race to the Top both support progressive
changes to education policy, practice, and curriculum development that dismantle the
status quo. While the two reform initiatives are separated by nearly 30 years, their
fundamental components resonate with an expansive audience. The perspective of each
of the four aforementioned authors provides a perspective that has assisted policymakers
in looking at issues in education more holistically in order to demonstrate a more
comprehensive and student-centered approach to education reform. In a recent article
from the October 31, 2012, edition of Education Week titled “Redefining the Federal
Role in Education,” Paul Manna and Keenan Kelly (2012) challenge schools, their
educators, and school leaders to work to transform American schools by making bold
reforms in order to move the American educational system forward. Manna and Kelley
indicate that federal and state government officials who impose change are “more likely
to prompt bureaucratic busyness and efforts by states and localities to game the system,
rather than encouraging them to use their own detailed knowledge of neighborhood
conditions to improve how schools operate” (Manna & Kelley, 2012).
A Nation at Risk (1983) surveyed both the national and international academic
shortcomings that affected American schools during a number of years from the 1960s to
the 1980s. Studies indicated that the United States was deficient in “19 academic tests
where American students were never first or second in comparison with other
industrialized nations,” particularly in the Scholastic Aptitude Test (SAT). In response,
28
the National Commission on Excellence made recommendations in the areas of content,
standards and expectations, time, teaching, leadership, and fiscal support. The Obama
administration’s Race to the Top emphasized reform in five areas as well, including
designing and implementing rigorous standards and high quality assessments, attracting
and keeping great teachers and leaders in schools, supporting data systems that inform
decisions and improve instruction, using innovation and effective approaches to
transform struggling schools, and demonstrating and sustaining education reform.
Professor Michael Marder from the University of Texas has presented data that inform
where students perform relative to those from other countries and the influence that
poverty has on that data (University of Texas, 2014). Generally speaking, the United
States outperforms other contemporary countries across multiple areas.
There are elements in both A Nation at Risk and RTT that support a move toward
uniformity with the standards and expectations that must be designated in order to
transform schools and ensure that students are provided with the best possible
opportunities to succeed from the instruction delivered by highly qualified teachers. A
Nation at Risk documents that the federal government would play an integral role in
helping to meet the needs of a diverse student learning population and also must ensure
compliance with constitutional and civil rights along with financial assistance. Yet,
Chomsky (1999) argues that it is incumbent upon individuals to take ownership of their
learning and ultimately control their own destinies (1999). While A Nation at Risk and
RTT and are both intended to provide the blueprint for educational success, the
bureaucratic rhetoric that each espouses speaks to Chomsky’s position on neoliberalism,
specifically that the manufactured crisis by the government that the United States is

29
falling behind the rest of the world educationally has been created solely for the profit of
private groups at the expense of the public.
It would seem then that the involvement of the federal government is at the top of
the paradigm shift and the suggested transformation of the education system. This sort of
attempted indoctrination is quite contrary to the sentiment that Paulo Freire identifies in
his Pedagogy of the Oppressed (1975). Freire discusses the idea that there is no neutral
education process. His philosophy urges educators to practice freedom rather than
submit to the rising tide of conformity. State departments are supposed to act
independently in making their transformation take place, according to RTT, although
states are encouraged to work jointly to develop common standards. This leaves one
wondering whether or not we are truly free, even locally, to make sound educational
decisions for students. Educators must not simply conform to the expectations that are
being placed on school leaders by federal and state departments, as Freire would indicate.
Instead, educators must work to establish a culture for learning that allows students to
experience for themselves. Students must then learn from those experiences as John
Dewey suggests and not operate in an environment where they act as merely
indoctrinated subjects that inhabit classrooms.
These points of emphasis require true reflection from those leading our schools
and school districts as they rely on high-stakes testing to make decisions impacting
teachers and students. In his Basic Principles of Curriculum and Instruction (1947),
Ralph Tyler contends that curriculum can come from anywhere. This sentiment aligns
perfectly with Dewey (1902) and connects to the ability of teachers to nurture a sound
philosophy of experience. Both Dewey and Tyler espouse parallel philosophies that

30
could assist policymakers in making better informed decisions, particularly when
recognizing that curriculum is not simply relevant in one place. Curriculum and
education at large can take place in many forums and must be connected to the student.
Ralph Tyler played a critical role in the Eight Year Study (1930-1942). His
service was critical, as Tyler was able to develop his four basic principles, or pillars. One
of Tyler’s principles is of particular relevance, as it provides an essential tenet for
curriculum development and connects well to Dewey’s philosophy of experience, namely
that it is incumbent upon school leaders and teachers to establish useful learning
experiences for students. Clearly, the main focus of both A Nation at Risk and RTT is on
the accountability of teachers and the expectation for student achievement. These
publications provide little emphasis on the experience of students and the role that those
experiences can have on future success. Both publications also refer to issues such as the
compensation of teachers. A Nation at Risk goes so far as to suggest that the salaries of
teachers be “professionally competitive and performance-based” (1983). Race to the Top
discusses the methodologies associated with attracting and keeping great teachers and
leaders in American classrooms and explicitly indicates that this can be accomplished by
improving teacher preparation, revising teacher evaluation, and even exploring the
concept of merit-based pay.
Regardless of which issue is being discussed, it is evident that our legislators and
leaders in the state and federal government are committed to seeing that the education
system is reformed to accommodate 21st century skills associated with college and career
readiness. The commission in 1983 categorized content change to curriculum by
recommending increased rigor with four years of English, three years of mathematics,

31
three years of science, three years of social studies and a half year of computer science.
RTT calls for the development of more rigorous standards by encouraging the growth of
common academic standards that will “build toward college and career readiness”
(NJDOE, 2013a). This competitive grant program helps to empower the states to be the
change agents, as the federal government’s involvement is merely to assist the states in
this process by creating the guidelines necessary for reform but limiting the involvement
of the certified education professionals in this process.
Manna and Kelley (2002) write that there is little to be optimistic about when
trusting in the federal government’s ability to effectuate change in education when one
considers the fact that “The No Child Left Behind Act is witness to confusion and poor
sets of incentives such as adequate yearly progress” (Manna & Kelley, 2012). Manna
and Kelley do indicate that there is the promise for our federal leaders to help improve
conditions in education as they have the pulpit and audience to “jump-start national
conversations and highlight concerns in open, honest dialogue with state legislators and
local superintendents” (2012). However, there remains little room for capacity building
among educators to effectuate change independent from local or federally motivated
mandates.
Yong Zhao (2009) writes of the need for students to grow and nurture their
talents, but that the ability of the student to foster creativity is being compromised as the
result of increasing pressures to focus on the core academic areas such as mathematics,
language arts, and science (2009). As a result, decisions are being made for students that
prohibit their innate sense of curiosity and exploration through creative outlets. Student
32
creativity is pacified at the expense of focusing on academic achievement in the
aforementioned core academic areas.
The 1966 Coleman Study commissioned by the United States Department of
Health, Education, and Welfare was intended to assess the educational opportunities
afforded to students from diverse backgrounds including varying races, origins, gender,
socioeconomic status, learning attitudes, and education/career goals. Coleman’s findings
accentuated the fact that the success of students and their achievement is based more
upon student demographic information such as socioeconomic status (SES) and
background than it is on the resources that are provided to them in school (1966).
Therefore, decisions are being influenced as the result of variables used in school such as
test data rather than taking into consideration factors such as demographic data that are
the result of variables outside of school.
A decisive measure was recently legislated in the state of New Jersey on teacher
tenure provisions and calls for greater teacher accountability based upon student
performance on statewide, standardized assessments. Prior to the 2013-14 school year,
teachers were able to obtain tenure after three years and one day of service in a teaching
position in the school district in which they were employed (NJDOE, 2013a). Recently
in 2013, legislation was passed as a result of teacher accountability measures imposed by
former New Jersey Education Commissioner Christopher Cerf and Governor Chris
Christie that increased tenure offered to teachers at four years of service (NJDOE,
2013a). Furthermore, teachers can lose tenure after two consecutive years of
“ineffective” ratings on a scale where teachers are rated by school administration as being
highly effective, effective, partially effective, or ineffective (NJDOE, 2013a). These
33
provisions were an outgrowth of recommendations made by the Educator Effectiveness
Task Force assembled by the New Jersey Department of Education in 2010.
In his 1999 publication, Profit Over People, Noam Chomsky calls people to
action and encourages them to take control of their future. Chomsky’s discussion on free
markets and his view of protectionism parallels the sentiment of modern day bureaucratic
rhetoric that seeks to use the influence of state and federal government to use public
funds for private power (Chomsky, 1999). The result is a legislature that imposes its will
on teacher unions and administrators rather than engaging in meaningful dialogue that
will assist them in making decisions that affect teachers and students on an issue such as
accountability (i.e., tenure). The question that remains is just how connected student
performance is to teacher tenure.
The inception of the No Child Left Behind Act (NCLB) under president George
W. Bush (2001) and contemporary revisionists including Arne Duncan, the current
Secretary of the U.S. Department of Education, called for greater accountability with
regard to student success. The result is an educational environment that is marked by
student achievement and teacher effectiveness as measured by standardized test results.
NCLB operates under a simple tenet; namely, that better academic achievement results
for students in the United States is imperative. What makes NCLB an unprecedented and
most controversial reform endeavor is its forceful provisions on attaching high-stakes
consequences to assessment. The stakes can either be sanctions or awards; they can be
leveled on students, teachers, or schools; and their severity can be low, moderate, or high
(Heubert & Hauser, 1999). NCLB initiatives require that schools look to close the
achievement gap between minority students in low performing, lower socioeconomic,

34
urban schools and their middle and upper class higher socioeconomic and higher
achieving White counterparts. The achievement gap between Blacks and Whites,
Hispanics and Anglos, the poor and the rich, are all hard to erase because the gap has
only a little to do with what goes on in schools, and a lot to do with social and cultural
factors that affect student performance (Berliner, 2006, 2009). This begs the question:
Should consequences and accountability measures be attached to high-stakes testing and
the subsequent results of those tests?
The push for increased student success and the narrowing of the achievement gap
led to numerous mandates from the federal government that trickled down to state
government and locally organized school districts. The result is a “one-size-fits-all”
curriculum that teaches to federally driven standards of achievement. A serious concern
that further erodes the movement toward uniformity with standards developed at the
national level is that the curriculum becomes further removed from the people who
actually have to use it: teachers, students, and administrators (Tienken & Orlich, 2013).
Examination of Current Literature: Body of the Review
College and career readiness is the newest motivation behind the “one-size- fits-
all” education system. Although national legislation and federal policies mandated for
public school systems since the 1950s have appeared to be in the best interest of student
learning, most of the decisions to increase academic rigor were predicated on fear, which
allowed the federal government a stronghold in public education and, whether intended
or not, has created a stifling, ineffective one-size-fits-all college readiness agenda
(Berliner, 2006; Ravitch, 2010; Zhao, 2009a, 2009b). There have been significant events
throughout the course of history that have caused both politicians and members of the
35
general public to surmise that the United States was falling behind in the endeavor to
compete with other developed nations in maintaining a high academic standard of
excellence. One such event was the launch of Sputnik by the Soviet Union in 1957. The
assumption in losing the “race to space” was that the United States lagged behind in the
area of scientific research and development (Zhao, 2009a). The result was the creation of
the National Defense Education Act (NDEA) of 1958 that aimed to fund educational
initiatives targeted toward students to foster and encourage the study of science, math,
computer technology, and foreign languages. The enactment of the NDEA allowed the
federal government to begin to create the road map for America’s public education
system (Barnes, 2013). This enactment and the resulting push to public schools to
motivate toward the aforementioned content areas was a step toward the college and
career readiness, one-size-fits-all agenda of the federal government. In the ten years
following the creation of the NDEA, the number of standardized assessments
administered to American students in public schools jumped from 10 million to 45
million with nearly 100% of high school students being administered standardized tests
(Flattau et al., 2006).
A second major maneuver by the federal government to support this agenda came
from the National Commission on Excellence in Education presented by former president
Ronald Reagan. The Commission’s report in A Nation at Risk (1983) specified that the
scores of American students on international assessments were poor when compared to
other developed nations. The recommendations of the commission to invigorate a
renewed focus on specific elements of teaching and learning according to content
standards perpetuated the one-size-fits-all sentiment that started with the National
36
Defense Education Act in 1958. Nearly 20 years later in 2001, former president George
W. Bush unveiled the No Child Left Behind Act meant to close the achievement gap that
is spoken of so glibly between poor, urban minority and rural students and White middle
to upper class suburban students. The supposed inequality between the two groups
propagates the one-size-fits-all, college readiness agenda of the federal government in a
manner consistent with its preceding legislation and led to the use of standardized
assessments as indicators of student success. The fact of the matter is that this reaction
may not be what is best for students because not all students learn at the same speeds;
develop cognitively, socially or morally at the same rates; or react to instruction the same
ways (Tienken & Zhao, 2010). The lack of student progress relative to international
peers on standardized assessments such as the Programme for International Student
Assessment (PISA) has been discussed as a point of emphasis by political pundits in
Washington, D.C. and has been the reason behind the rationale for uniformity with
respect to national curriculum standards. Interestingly, there is no solid correlation and
certainly not a cause and effect relationship between national standards and national
performance (Tienken & Zhao, 2010). There are a number of empirical studies that
analyze the relationship between scores on international tests and the economic strength
of the 17 strongest economies in the world. Those studies have found that the
relationship is actually negative or lack the statistical strength to provide a cause and
effect relationship between the two variables (Baker, 2007; Bils & Kenlow, 1998;
Bracey, 2003, 2005; Krueger, 1999; Psacharopoulos & Patrinos, 2002; Ramirez, Luo,
Schofer, &Meyer, 2006; Tienken, 2008). The resulting question that requires reflection
is if the results of these studies are, in fact, pointing to a lack of statistical strength

37
between the two variables, then why is the federal government insistent on developing
national standards and assessments and a one-size-fits-all educational system? Alfie
Kohn (2000) noted that politicians, business leaders, and others who have little
experience with education are saying that schools can be rated based on their test scores
and that teachers’ and administrators’ careers ought to depend on those results (Kohn,
2000). Ultimately, legislatures are creating school funding formulas that are contingent
upon student performance on high-stakes tests. The result is an educational system that is
forced to make decisions for teachers and students based upon those test results and that
is simply an irresponsible practice.
Chester Finn and Diane Ravitch (2007) are widely considered conservative school
critics. Originally an advocate of NCLB, Finn and Ravitch now view this constriction of
the curriculum at the expense of standardized testing as a terrible problem for American
students. They recant earlier statements of support for the pursuit of school reform
through high-stakes testing programs such as NCLB (Berliner, 2011). Finn and Ravitch
(2007) assert the following:
The liberal arts make us ‘competitive’ in the ways that matter most. They
make us wise, thoughtful and appropriately humble. They help our human
potential to bloom. And they are the foundation for a democratic civic polity,
where each of us bears equal rights and responsibilities.
We’re already at risk of turning U.S. schools into test-prepping skill factories
where nothing matters except exam scores on basic subjects. That’s not what
America needs nor is it a sufficient conception of educational accountability.
We need schools that prepare our children to excel and compete not only in

38
the global workforce but also as full participants in our society, our culture,
our polity, and our economy.
It is evident, then, that teaching to standardized test taking strategies and
minimizing the value of other non-academic, curricular areas such as the creative arts
is a result of decisions that are being made by legislators to indicate the effectiveness
of teachers and administrators as student performance on such assessments is
weighted. While the narrowing, and the test preparation that accompanies the
narrowing, is likely to result in higher scores on the tests that are so consequential for
teachers and administrators, there are many side effects of this response to the high-
stakes testing policies. Most notable is the clear evidence that a great deal of the
curriculum deemed desirable for our schools by a broad spectrum of citizens is,
instead, curtailed in high-stakes environments (Berliner, 2011).
While it is difficult to uncover much research that supports the efficacy of high-
stakes testing to make decisions for teachers and students, there are studies that examine
the effects of high-stakes testing on student achievement that present data that look at
both sides of the topic. One of the most notable studies to emerge to examine the effects
on high-stakes testing on student achievement was conducted by Amrein and Berliner
(2002), Rosenshine (2003), and Braun (2002). The authors analyzed the merits of high-
stakes testing to improve student achievement and used statistical analyses to express the
conflicting conclusions that were uncovered as the result of their study. Amrein and
Berliner (2002) analyzed the achievement trends that existed in states that utilized
standardized/high-stakes tests against that of a national average across a range of K-12
school levels. Using data from the Grades 4 and 8 National Assessment of Educational
39
Progress (NAEP) in math and reading, Amrein and Berliner analyzed results by state to
show whether there was strong or weak evidence to conclude if the scores of those
students who had taken the assessment had either increased or decreased. The resulting
conclusion indicated that scores went up or down in random patterns after high-stakes
tests were introduced and, therefore, showed that there were no consistent effects as a
function of high-stakes testing policies (Amrein & Berliner, 2002).
Rosenshine (2003) presented information that disputed that of Amrein and
Berliner’s primarily due to the fact that he felt there were flaws in their method and
design (Rosenshine, 2003). Rosenshine delved deeper into the data of Amrein and
Berliner (2002) and pointed specifically to the weakness of a lack of control group in
their study (Berliner et al., 2005). He found that average NAEP increases were greater in
states with high-stakes testing polices than those in a control group of states without.
Rosenshine concluded that “although attaching accountability to statewide tests worked
well in some high-stakes states it was not an effective policy in all states” even after
disaggregating the results (Berliner et al., 2005).
Ultimately, Rosenshine did not find a
consistent effect.
Lynn Davey (1992) writes in The Case for a National Testing System that both
schools and the labor market must work together to create meaning for students behind
the results of standardized assessments (1992). High-stakes testing results should not
simply be a snapshot of a moment in time to measure aptitude. Rather, in working
together school and the labor market must motivate students to believe that their results
will have an impact on future opportunities afforded to them whether that be in college of
the workforce. Davey argues that if employers started “asking for transcripts and
40
stressing academic achievement when hiring, scores on such tests could become a
valuable credential” to this endeavor (Davey, 1992). In order for there to be real meaning
behind the decisions that result from standardized assessment data, the information that is
disseminated must be both accurate and reliable. Testing results can be used with
students and teachers to set some obtainable, realistic goals for them to work toward as a
part of their own personal and professional growth and development. Other arguments in
support of high-stakes testing suggest the following (Amrein & Berliner, 2002):
• Students that score well on high-stakes tests will experience feelings of
accomplishment, thereby fostering intrinsic and extrinsic motivation.
• High-stakes testing provides a measure of the curriculum that is being
taught, thereby enabling teachers and administrators to make informed
decisions about revisions.
• High-stakes testing provides an equal opportunity for all students to
demonstrate their knowledge.
• Administrators can use test data to inform professional development
opportunities.
While these reasons are of a more logical nature, the fact remains that most
opponents of high-stakes testing argue that they are simply an attempt by legislators and
corporate executives to push their own agendas in an age where testing is big business.
The testing industry, like many other industries, is frequently bottom line profit driven
and has benefited dramatically from privatization (Moses & Nanna, 2007). It is evident
that we are living in an educational age where standardized testing is not only a fact of
life but is in high demand. As a result, the need of private companies to develop a

41
platform where tests can be developed, generated, and supplied to schools is paramount.
With the demand for tests growing, the testing industry can expect to see a large increase
in revenue; and with increased revenue come increases in marketing and lobbying power
(Moses & Nanna, 2007).
The state of New Jersey is preparing to transition from the NJ ASK in Grades 3-8
and the High School Proficiency Assessment (HSPA) for eleventh graders at the end of
the 2013-2014 school year. Subsequent school years will see the introduction of the
PARCC (Partnership for Assessment of Readiness for College and Careers). PARCC
assessments will require an individual student to participate in a total of nine testing
sessions throughout the course of the school year: five testing sessions on performance-
based assessments to be administered after approximately 75% of the school year in
language arts and mathematics and four end-of-year assessments to be administered after
approximately 90% of the school year in language arts and mathematics (PARCC, 2013).
Consequently, these assessments are all computer-based and could mean big business for
vendors vying for state contracts to implement the testing program to school districts
across the state as well as the other 17 member states and the District of Columbia.
The issue at hand with regard to the use of standardized testing, then, results not
from the tests themselves, but rather the political and ideological motivations that direct
and institutionalize their use (Moses & Nanna, 2007). Standardized tests became the
expedient outgrowth of the private sector’s standard-based reforms. A culmination of the
“power of accountability, incentives and markets” (Ravitch, 2010), the “ ‘test heavy’
model of education reform represents the growth of corporate influence” on politicians
(Gluckman, 2012). An outgrowth of high-stakes testing rests with those who stand to

42
profit from its very existence. The proliferation of standardized assessments has led to
opportunity for private corporations, and that opportunity will continue to be cultivated
with the addition of new forms of testing for our students in schools across the country.
Published in 2008 by Jacqueline Grimm, The Zenith case study explored the
perceptions of self-concept and academic achievement of tenth grade students in a
districtwide pull out program in the Osceola County School District in Florida. Florida
students take the Florida Comprehensive Assessment Test (FCAT). The Zenith case
study was aimed at improving the academic achievement of students in tenth grade from
their results on the ninth grade FCAT. The qualitative study involved 410 students, 87%
of whom were minority students, and used data from interviews to glean information that
analyzed the patterns and themes that existed among the students, reading their
perceptions of self-concept and academic achievement. The district was charged with
identifying the students in the schools that they targeted as low achieving to participate in
a one-year pull out program. One of the essential aspects that were studied by Grimm
was the idea of student grouping. Grimm analyzed the idea that grouping students by
ability level raised students’ self-esteem and as a result academic achievement increased
(2008). According to Grimm (2008), homogeneous grouping benefited teachers by
allowing them to focus on students with similar needs who would have similar questions,
thereby making the instructional process of the teacher in class that much more effective.
The bulk of instructional time on task would be spent on students with like ability levels;
as a result, the teacher could focus more on the specific needs of the students and help
ensure that the time the teacher was spending with students would be more productive.
Grimm pointed that students would learn at their own pace and do so in an environment
43
that was comfortable for them. Grimm’s (2008) study was guided by three essential
research questions:
1. What impact, if any, does attendance of ability grouping classes at Zenith
have on students’ self-concepts?
2. What impact, if any, does attendance at Zenith have on student perceptions of
academic achievement? What changes in academic performance are evident?
3. What other factors, if any, do students perceive might be involved in the
changes students experience while attending Zenith (Grimm, 2008)?
Grimm (2008) indicated that while the study was targeted at a specific population
in a specific school district and could ultimately be used as a standard for future research,
there were limitations. The limitations were namely that the study was relegated to one
alternative pull out program in Osceola County, Florida. Furthermore, the
generalizations that could be made as a result of the study were limited because only
students from one school were considered and the perceptions of those students who were
interviewed as a part of the study were considered only during the interview process
(Grimm, 2008). Therefore, Grimm’s research could not be generalized to other
populations. Finally, the research was limited to students who participated in the pull out
program based upon their FCAT scores and who were only from the ninth and tenth
grade from their particular zoned school.
Grimm (2008) used a mixed method of both qualitative and quantitative data to
conduct her research for this case study. The students that were sampled in the Zenith
study were administered two Lipsitt Self-Concept Surveys, one at the beginning of the
school year and one at the end. The surveys were used by the students to review 22

44
adjectives that described their feelings about themselves and rate them on a scale of 1 to
5. Five was the highest rating that a student could give and one was the lowest. The case
study then tracked the students who were involved in the Zenith program during the
2006-07 school year by looking at their performance on the FCAT and results were
mixed (Grimm, 2008).
There are both proponents and opponents to the topic of grouping by ability.
Schools across the country have experimented with and implemented grouping
heterogeneously and homogeneously. However, gifted students have experienced some
of the greatest benefits when they are grouped homogenously. When separated into
groups of like peers, gifted students are exposed to an enriched and accelerated
curriculum that provides them opportunity to learn from their peers in an augmented
classroom environment (Allan, 1991). Allan drew from the research on “peer modeling”
from educational psychology:
Further, the idea that lower ability students will look up to gifted students as
role models is highly questionable. Children typically model their behavior
after the behavior of other children of similar ability who are coping well
with school. Children of low and average ability do not model themselves on
fast learners. It appears that “watching someone of similar ability succeed at a
task raises the observer’s feelings of efficiency and motivates them to try the
task.” Students gain most from watching someone of similar ability “cope”
(that is, gradually improve their performance after some effort), rather than
watching someone who has attained “mastery” (that is, can demonstrate
perfect performance from the outset).

45
Wong and Watkins’ Big Fish Little Pond (BFLP) hypothesis (2001) indicates that
students will compare their own academic success with the academic achievement of
their peers. This can be a positive experience for the student provided that the student is
the big fish in a small pond. However, it can have the opposite effect if the student is a
small fish in a big pond. In the case of grouping students homogeneously, this refers to
an average or below average performing student in an academically high performing
school (the big pond). According to Marsh and Hau (2003), a poor performing student in
a high performing school may perform better in a school with lower performing students.
The students at Zenith, according to this theory, may perform better by increasing their
academic self- concept as a result of placing them in a little pond, Zenith (Grimm, 2008).
Ultimately, the BFLP theory hypothesized that students would have higher academic self-
concept when they are compared to students that are less able to perform well (Grimm,
2008). Conversely, the inference is that when students of lesser abilities are placed in a
setting where students perform consistently well, the outcome could be detrimental to the
student of low ability. Marsh and Hau indicate that there is a strong correlation between
self-concept and academic achievement when referring to the BFLP (2003). An
argument that supports this assertion is that teachers are able to focus pedagogy on a
specific group of students or set of learners rather than have to work to differentiate
instruction to accommodate a heterogeneous group of students. Students who are seen as
having promise to pass the tests are given more help than other students (Moses &
Nanna, 2007).
In Jeannie Oakes’ 1985 publication, Keeping Track: How Schools Structure
Inequality, there is evidence that disputes this notion. Oakes attested that she presented

46
conclusive data that students placed in higher tracks had better classroom opportunities.
Oakes examined 300 tracked high school English and mathematics classes and analyzed
an extensive body of literature on tracking studies. She found that the curriculum
content, instruction quality, and classroom climate varied substantially between different
tracks (Oakes, 1985). The students who were placed in the more advanced tracks learned
skills essential to critical thinking skills, thereby enabling them to problem solve more
critically. This would benefit students more in the long run as they were better prepared
for college entrance exams and demonstrated the skills associated with a college level
learner (Oakes, 1985). The students who were placed in the lower tracks were taught
content in a manner that was more consistent with memorization, using workbooks and
low-level pedagogy. According to Oakes, teachers placed in teaching assignments with
students of a higher track devoted more class time to learning, were more enthusiastic,
and had higher expectations of students than teachers in the lower tracks (Oakes, 1985).
Stone and Lane Study, 2003
The research that opposes the efficacy of high-stakes testing as a method for
making decisions that impact teachers and students is voluminous. Yet, it is difficult to
uncover substantial case studies, research, and/or evidence that support the use of
standardized assessment to make decisions. School administrators and teachers often
make decisions based upon the results of standardized assessments that affect
instructional practices, professional development, scheduling, programming, and even
hiring practices. Furthermore, accountability measures have been introduced that impact
both teachers and students and influence the decisions that are made that drive many of
the aforementioned topics. A major question that remains and that must be explored is as
47
follows: Should consequences and/or accountability be attached to the results of student
performance on high-stakes testing? Are there unintended positive consequences
associated with high-stakes testing?
Applying a growth-modeling approach, Stone and Lane (2003) empirically
demonstrated that longitudinal changes in a high-stakes state assessment were found to be
positively correlated with instructionally sound school and classroom practices. The
purpose of this study conducted by Stone and Lane was to examine this issue with regard
to the Maryland State Performance Assessment Program (MSPAP) and to explore the
relationship between two distinct elements:
1. Changes in MSPAP test scores for schools
2. Classroom instruction and assessment practices, student learning and
motivation, students’ and teachers’ beliefs about and attitudes toward the
MSPAP, and school characteristics.
Data were also analyzed that reflected different MSPAP subject areas
(mathematics, reading, writing, science, and social studies) for different sets of schools.
A stratified random sampling procedure was used to select schools for the study. The
strata were defined by three levels for each of two variables: (a) the percentage of free or
reduced-price lunches according to the 1994–1995 classification used by the Maryland
State Department of Education (MSDE) and (b) the MSPAP performance gains (Stone &
Lane, 2003). As a way to implement this procedure, the schools in the population were
first classified into one of three categories on the basis of their percentile rankings for the
free or reduced-price lunches participation variable and the MSPAP performance gains
variable: lower third, middle third, and upper third. On the basis of a cross-classification

48
of these two variables (nine combinations or cells), the percentage of schools reflecting
combinations of the variables varied from approximately 8% to 14%. Elementary and
middle schools reflecting each of the combinations were then randomly sampled. More
elementary schools were selected because they have fewer teachers per grade than those
in the middle schools (Stone & Lane, 2003). Stone and Lane selected 72 elementary
schools and 36 middle schools to participate in the study for mathematics and language
arts. Alternate schools were identified by Stone and Lane to be potential replacements
for the schools that declined to participate in the study. The final sample included 59
elementary schools (17 of which were alternative schools) and 31 middle schools (9 of
which were alternative schools) and represented 19 of the 24 counties in Maryland. The
school sample for social studies and science consisted of 103 of the 126 elementary
schools selected to participate (17 of which were alternative schools) and 58 of the 63
middle schools selected to participate (14 of which were alternative schools). Alternate
schools were identified to serve as possible replacements for the elementary and middle
schools that did not participate. The sample represented 22 of 24 counties in Maryland.
During the study, questionnaires consisting of both Likert-type and constructed
response items were administered that were specific to the different subject areas were
developed for elementary school (third- and fifth-grade) and middle school (eighth-grade)
teachers and students. The teachers of those students completed questionnaires prior to
administering the MSPAP. The students completed questionnaires within two weeks
following the administration of the MSPAP. Questions related to beliefs about and
support for the MSPAP were asked and the questionnaire return rates ranged from 68% to
87% across the subject areas for teachers and 64% to 78% across the subject areas for

49
students (Stone & Lane, 2003).
The conclusions that were reached as a result of the study provided some
correlational evidence for the positive impact of a statewide assessment program. This
result is curious considering the fact that most states in today’s educational system
implement some form of high-stakes assessment program. Stone and Lane (2003) found
that changes in scores from the MSPAP from 1993 to 1998 were related to school,
classroom, and student factors (Stone & Lane, 2003). An interesting result stemmed
from the data presented regarding the percentage of students who participated in the free
and reduced-lunch program. The performance of students in a school involved in that
program was found to be consistently related to MSPAP result but generally not related
to rates of change in performance with time. Teacher reports for some instruction-related
predictors and the general impact of the MSPAP were found to explain differences in
performance or to explain changes in performance with time in various content areas.
Certainly, these results could warrant further investigation by researchers. As for a
potential negative impact of the assessment program, student-reported engagement in
activities resembling the MSPAP format were also found to account for some of the
differences in performance or to explain changes in performance with time in some
content areas (Stone & Lane, 2003).
Synthesis
The Stone and Lane case study (2003) accentuates the fact that classroom
instruction can influence student test scores. However, the body of evidence that is
presented in the study fails to identify the amount of time spent “teaching to the test” and
the unintended consequences of fostering pedagogical practices to that effect. The

50
argument presented by Nichols and Berliner (2008) represents that even this aspect of
instruction may be lacking:
No longer are we measuring real-world math or reading skills. Instead, it
becomes a test of how well students memorized math content or how adept
students are at filling in test-booklet bubbles. In these instances, it isn’t
content mastery that matters, but how well (or efficiently) students can
memorize information that is rewarded (Nichols & Berliner, 2008).
Students from different cultural backgrounds also face similar problems of not
being exposed to all of the real world background information that is necessary to answer
certain questions on standardized tests (Kohn, 1999). The question that remains to be
answered is are students best served by participating in “rigorous” and “robust” high-
stakes assessments that place all of the focus on language arts, mathematics, and science,
or is there value in exposing students to a comprehensive educational experience
inclusive of elective courses and extracurricular activities? Does student involvement in
such elective courses and activities enhance student achievement on high-stakes
assessments? The “rigorous” and “robust” nature of the PARCC assessment that will be
used to assess the college and career readiness of students Grades 3-12 is being touted by
the New Jersey State Department of Education as an assessment system that will help
produce a more complete picture of student performance and will leverage new
technologies in assessment to get actionable student data to educators in real time
(PARCC, 2013).
The value of the “actionable” student data that PARCC will enable educators to
access remains to be seen, as PARCC is not slated for implementation in New Jersey

51
until the 2014-15 school year. In addition, if the assessment data of PARCC is going to
be used to supplant that of the current NJ ASK and HSPA high-stakes testing, then it is
questionable as to the value that those current assessment models hold. An area of study
that questions the validity of high-stakes testing stems from the interpretation and
meaning of external factors and variables outside of the school setting on student test
results.
Bolon Study, 2001
The Bolon study (2001) questioned the validity of using tenth grade mathematics
test scores on the Massachusetts Comprehensive Assessment System (MCAS) as the sole
criterion for high school graduation. The process for the inclusion of this requirement
began with the graduating class of 2003. Bolon suggests that the state was treating those
scores as though they were precise educational measures of high significance when, in
fact, they were not. Bolon reviewed community income to conduct a statistical analysis
that demonstrated that income is strongly correlated with tests scores and accounted for
more than 80% of the variance in average scores for a sample of 32 Boston area
communities (Bolon, 2001). This study considered 47 academic high schools in 32
metropolitan Boston communities through the average tenth-grade MCAS mathematics
test scores recorded for years 1998-2000. Although other factors such as students with
disabilities, free and reduced lunch, school spending levels, and percentage of schools
with limited English proficient students were taken into consideration, all failed to
associate substantial additional variance (Bolon, 2001).
Bolon indicated in his study that MCAS test scores presented results in a table
that ranked school success. According to Bolon, this “league table” approach begs the

52
question of whether such rankings are matters of chance or can be the result of factors
other than school performance. Bolon’s study explored the significance that can be
associated with such results. The school characteristics used in Bolon’s study were taken
from information reported by public schools to the Massachusetts Department of
Education for 1999 and published by the Department. He used MCAS test scores
summarized by schools from 1998-2000 Department reports. Bolon obtained census
information from the U.S. Bureau of the Census and other sources.
Synthesis
The research conducted by Bolon (2001) indicated that social factors had the
strongest impact on student performance. He showed that changes in student scores from
one year to the next were small, statistical uncertainties that could be explained by simple
variations in the data. While the percentage of limited English proficient students was
the second most significant influence, its impact was small in comparison to the social
factors that Bolon identified. Consequently, nearly two-thirds of teachers in
Massachusetts reported that their students experience test related stress, yet teachers in
that state have also been surveyed as being strong in their assertions that there are
benefits to high-stakes testing; namely, that there is a focus on raising the quality of
education and increasing student motivation to learn (Clarke et al., 2003).
Bolon’s research was limited to the communities in the Boston metropolitan area.
An interesting addendum to this research might include a study of various regions in the
surrounding New England area and might include schools located in both suburban and
urban areas. Also, comparative studies of student results on standardized assessments
and graduation rates might enable the researcher to garner information that leads to

53
correlation between the two variables. Bolon did not note this phenomenon. In addition,
the 2002 study of Carnoy and Loeb found a strong positive relationship between the level
of stakes attached to standardized assessment and the NAEP improvement (Carnoy &
Loeb, 2002). The result is a sentiment that supports the unintended positive relationships
that can be explored regarding the impact of high-stakes testing on teacher/student
outcomes. Those outcomes may provide teachers with outgrowths such as the
professional development opportunities afforded to them as the result of student
performance on high-stakes tests and the resulting sound testing practices that such
student data on those tests glean.
Carnoy and Loeb Study, 2002
Carnoy and Loeb (2002) examined factors that were associated with stronger
accountability measures and whether or not such measures improved student outcomes
on high-stakes testing. While student performance is a significant factor in controlling
educational improvement, Carnoy and Loeb felt that it should not be the only factor
they looked at to determine student improvement. Carnoy and Loeb indicated that
improvements on state tests may not be an accurate measure of educational gain since
schools may substitute for more durable student learning by using strategies to increase
performance on the particular testing instrument (Carnoy & Loeb, 2002). As a result,
they used alternative measures to gauge student performance, including National
Association of Educational Progress (NAEP) math test scores, ninth grade retention rates,
and the proportion of students who reach the twelfth grade. Carnoy and Loeb developed
a zero to five index of the strength of accountability in 50 states based on the use of high-
stakes testing to sanction and reward schools. They analyzed whether that index was

54
related to student gains on the NAEP mathematics tests in 1996-2000.
The NAEP was originally administered to 17-year-old senior students in 1969 as a
trial assessment to evaluate their skills in writing, science, and citizenship (Amrein &
Berliner, 2002a). The testing program has evolved in the years since NCLB was passed in
2001 and has been used as a gauge for assessing how American students compare to their
contemporary international peers. The inception of NCLB gave NAEP new importance,
as results could be used to informally monitor student results from other state
assessments in corresponding grades and content areas. State participation in NAEP was
required in reading and mathematics in Grades 4 and 8. Since other subject areas were
not assessed, NAEP developed different sampling plans for different grades and subject
areas to adjust to new reporting requirements (Amrein & Berliner, 2002a). The
assessment schedule for 2003 and beyond was reexamined, and NAEP was then to be
administered every other year to students in Grades 4 and 8 in reading and mathematics
in all states as well as testing students in Grade 12 in these content areas as often as had
been done in the past or at least every four years (Amrein & Berliner, 2002a). Carnoy
and Loeb (2002) did not discount the value of standards based reform; rather, they
developed a recursive model for their study that was used to analyze the effects of
strength of accountability on student performance. These data were then applied to
NAEP results to explain how demographics might influence results.
The recursive model employed by the researchers took a number of different
factors into account. Carnoy and Loeb (2002) estimated the accountability
implementation as a function of the average level of test scores in the state in the early
1990s. They also looked at test score gains in the early 1990s, the percentage of Latinos

55
and African Americans in the state, the state population, the percentage of school
revenues raised at the state level in 1963 and 1995, average per-pupil revenues in 1990,
and the yearly change in revenues in the early 1990s (2002). Carnoy and Loeb then
investigated student achievement as a function of accountability. They tested whether the
percentage of eighth graders or fourth graders achieving at the basic skills level or better
increased more between 1996 and 2000 in states with strong outcome-based
accountability than in states with weak accountability. The researchers then controlled
for the 1996 test scores to see whether the states with lower scores had a substantially
higher gain during the next four years independent of their accountability index. Carnoy
and Loeb were more interested in the percentage of students passing at different skill
levels because that allowed them to test whether stronger accountability affects gains just
in basic skills or also in higher level skills. They also checked the estimated coefficient
for accountability for potential bias due to exclusion from the NAEP math test of students
classified as special education or limited English proficient. Finally, the researchers
tested whether ninth grade retention rose more in the late 1990s in states with strong
accountability than in the states with weak accountability and if the twelfth grade survival
rates increased more in states with strong accountability than in states with weak
accountability (Carnoy & Loeb, 2002). All models were then checked.
The results of the Carnoy and Loeb study (2002) showed that there were
considerable gains in the students who scored at the basic skills level or better in eighth
grade, but moderate gains in those students from the fourth grade. They found that there
were significant relationships between proficiency and the strength of accountability
systems for all racial ethnic groups (Carnoy & Loeb, 2002). The states with higher

56
populations of minority students and lower achieving White students were more likely to
implement stronger accountability systems. The resulting data from the time period
assessed by Carnoy and Loeb (1996-2000) suggested that states across the country with
more robust accountability systems had better student outcomes on the eighth grade
mathematics NAEP. The results of fourth grade students were again not as significant
but nonetheless showed an improvement (Carnoy & Loeb, 2002). The results that
corresponded to student retention and progression, however, were not nearly as
significant. Carnoy and Loeb found no evidence of a relationship between accountability
and ninth grade retention, progression from tenth to twelfth grade, or eighth to twelfth
grade in White or Black students. However, the researchers could not rule out the
possibility that accountability systems were associated with the increased retention and
decreased progression of Hispanic students. In summary, the research conducted by
Carnoy and Loeb from 1996-2000 provides evidence that the implementation of stronger
accountability systems results in larger gains of students in both the fourth and eighth
grades on NAEP mathematics scores.
Additional research has been made available that suggests that high-stakes
assessments can bring about positive change in student learning outcomes. Rosenshine
(2003) conducted a re-analysis of the gains between state assessment and NAEP by
adding a control group with no stakes attached to the state assessment. The consequence
of that study indicated that NAEP scores increased in the schools where high-stakes were
attached to results, rather than in schools with no stakes at all (Rosenshine, 2003).
Synthesis
The review of the literature contained in this body of research indicates that

57
accountability systems have been designed to improve student achievement and improve
the experience of students in school as well as improve the quality of instruction of
teachers in the classroom. Unfortunately, the long-term results of this study remain to be
seen. The study captures the results of only a snapshot in time. Therefore, it would be
interesting to extend the work of Carnoy and Loeb for a longer period of time to uncover
information that leads to more robust results. In addition, the results of special education
were not fleshed out in the research. It would be interesting to note those results and
follow a cohort of special education students, as that population of students generally
underperforms on high-stakes assessments (Berliner, 2011).
Consequently, there is evidence and research that contradicts the study of Carnoy
and Loeb (2002). Amrein and Berliner (2003) looked at fourth grade NAEP mathematics
scores from 1992-2000 and reported that 50% of the states with high-stakes testing
policies posted increases in mathematics scores, while 50% posted losses or no effects at
all (Amrein & Berliner, 2003). In addition, 64% of eighth grade students showed either
losses or no effects in mathematics during the same time period. Amrein and Berliner
also looked at mathematics and reading scores as students moved from fourth to eighth
grade. Their results provided information that the only area where students demonstrated
growth as the result of accountability systems was in reading scores from 1994-1998,
where 69% of students showed improvement (Amrein & Berliner, 2003). According to
their research, there was not substantial data that supported the idea that high-stakes
testing policies and accountability systems increased student learning. Perhaps the most
significant outcome of the research conducted by Amrein and Berliner pointed to the fact
that their analysis of the NAEP data revealed that changes in the test scores of states were

58
influenced by the exclusion rates that states used. Scores could be affected either
positively or negatively depending upon the number of students who were excluded as
eligible test-takers (Amrein & Berliner, 2003). Therefore, student growth in certain
states could be the result of the fact that those states excluded more students from taking
the test than others.
Nonetheless, while the evidence that exists in support of the use high-stakes
assessment results/data as a method for making informed decisions surrounding policy
and accountability that impacts teachers and students is limited at best, there is a body of
research that supports their merits. Interestingly, the data that do exist rarely specify the
impact on groups of students such as those in the realm of special education but do
disaggregate data between White and minority students. An extensive look at the impact
of high-stakes testing on special education students would be a useful complement to the
existing body of research that is available and might help to explain the influence that the
disabling conditions of that population has on their results.
Research on student retention provides an interesting perspective on the debate of
the use of standardized assessment to make informed decisions for students without
taking into account community wealth data. Assessment results may be used to promote
students who demonstrate proficiency to future grade levels. Some recent studies have
investigated retention in this context. Roderick and Nagaoka (2005) investigated the
effects of the Chicago Public Schools policy that based promotion in Grades 3, 6, and 8
on standardized test scores. The researchers compared the performance of those students
who just missed the promotion benchmark against those students who were promoted.
Roderick and Nagaoka (2005) found that third grade students who had been retained

59
struggled during their repeat year. In addition these same students had higher rates of
placement in special education programs and demonstrated no advantage over those
students who had been promoted two years later (2005). Similarly, sixth grade students
who had been retained had lower achievement than their peers who had been promoted.
Interestingly, retention can increase the likelihood that a student will drop out of school.
Interestingly, students who have been retained are five times more likely to drop out than
those students who graduate (National Center for Education Statistics, 2006). As a
result, the achievement gap widens and the use of student results on standardized
assessments to make decisions such as promotion and retention could be viewed as
detrimental to student learning. Furthermore, Amrein and Berliner (2002) indicated that
transfer of learning is not a typical outcome of high-stakes testing policy (Amrein &
Berliner, 2002a).
Maylone Study, 2002
Maylone’s (2002) study on the impact that socioeconomic status had on student
achievement on the Michigan Education Assessment Program (MEAP) presented
intriguing data that supported the hypothesis that there was a significant correlation
between the SES of students enrolled in Michigan public schools and their performance
on the MEAP. Maylone’s research demonstrated that three SES factors produced a
predictive equation with the most power of a school district’s composite high school
MEAP score and included the percentage of students eligible for free or reduced lunch,
the percentage of single-parent households, and the mean household income. The study
conducted by Maylone expanded the work of Amrein and Berliner (2002), as it provided
further evidence that student results on high-stakes testing continued to be used as a

60
method for making decisions that impacted students. Consequently, the socioeconomic
background students’ families failed to be taken into consideration as a part of this
process and, as a result, “one-size-fits-all” testing policies were being developed that did
not account for children living in poverty.
Synthesis
Maylone’s (2002) research extended that of earlier researchers such as Coleman
(1966), who concluded that the most important factors that impact student achievement
are student backgrounds and teacher effectiveness. However, Maylone (2002) was able
to apply multiple regression analysis to narrow student background to the three specific
variables (household income, single-parent households, and free and reduced lunch) to
predict student outcomes on the MEAP. This research was extended by Turnamian
(2012) to provide a more comprehensive picture of the predictive power of these
variables in forecasting student performance on the Grade 3 NJ ASK Language Arts and
Mathematics sections. As a result, a broader body of research was developed that
provides further data that student achievement on standardized assessments could be
influenced by factors that have less to do with teaching and learning in the classroom and
are actually the result of the socioeconomic status of students and community/family
demographic dynamics.
Jones Study, 2008
Jones (2008) used data from student performance on the New Jersey High School
Proficiency Assessment (HSPA) to develop a predictive model that analyzed a
comparison between expected passing rates measured by HSPA results and actual
passing rates. The information on the HSPA was easily accessible through the New
61
Jersey School Report Card, which is open to the public and published each year.
Consequently, passing the HSPA is currently a New Jersey high school graduation
requirement for all students enrolled in New Jersey public schools and has been since
1975 with the inception of the Public School Education Act (PSEA). As a result, the test
can be categorized as a high-stakes assessment because one definition for the successful
completion of high school in New Jersey is scoring Proficient or Advanced Proficient on
the HSPA and, therefore, passing the HSPA for graduation is a decision by the NJDOE
that impacts students in the state. If a student scores Partially Proficient, he or she is
considered to have not passed and are not eligible to receive a diploma from a New
Jersey public school. The HSPA assesses students in much the same manner as the NJ
ASK and requires students to be assessed in various sections in Language Arts and
Mathematics. Scores range from 100-300 with Proficient scores categorized as 200-249,
Advanced Proficient as 250-300, and Partially Proficient as any score below 200.
Jones’ (2008) research sought to answer three main questions:
1. Which of the independent variables significantly predict the overall
percentage of students in a school who will pass the Language Arts section of
the New Jersey High School Proficiency Assessment (HSPA)?
2. Which of the independent variables significantly predict the percentage of
students in a school who will pass the Mathematics section of the New Jersey
High School Proficiency Assessment (HSPA)?
3. Are variables on the New Jersey School Report Card correlated to each
another?
Jones (2008) indicated that the dependent variable in his research was the

62
percentage of each subgroup of students scoring either Proficient or Advanced Proficient.
His independent variables were represented in 49 data sets that were placed into five
categories that mirrored those of the New Jersey School Report Card and included district
financial data, school environment, staff information, student information, and student
performance indicators. According to Jones (2008), eight of the 49 variables that were
represented in his study, including average verbal SAT score, percentage of budget
revenues from state taxes, percentage of Limited English Proficient (LEP) students,
percentage of graduates who are undecided about future plans, percentage of students
with disabilities, student mobility rate, student attendance, and student attendance
specifically for Grade 11, all accounted for nearly 90% of the variability of student
achievement on the Language Arts section of the HSPA (Jones, p. 89). Jones used a
similar method to calculate student achievement on the Mathematics section of the
HSPA. Jones (2008) did not account for SES or District Factor Group (DFG), and this is
a limitation of his study. However, the Jones study does provide evidence that student
performance on the HSPA could be explained by variables that did not directly correlate
to teaching and learning in the classroom.
Synthesis
The Jones (2008) and Maylone (2002) studies each provided compelling data that
supported the idea that factors outside of the school could predict student outcomes on
standardized assessments. Therefore, it could be argued that policymakers and legislators
could benefit from investigating the reliability of variables presented by both Jones and
Maylone as influencing student performance and look at the decisions that are made that
impact students and teachers as a result. The multiple regression models that they
63
developed would be helpful in identifying specific out-of-school variables related to
demographic information that might be analyzed to predict student achievement.
Practical and Research Significance
The research that has been presented in this study provides information that stems
from literature that both advocates the use of high-stakes testing to make important
decisions for teachers and students and disputes the value of using such data to the same
effect coupled with the influence that out-of-school demographic factors have on student
achievement. The body of research that exists emphasizes the negative implications that
high-stakes testing has on teachers and students. The literature that supports standardized
assessment to help teaching and learning is limited. The state of New Jersey is
transitioning away from the known assessments that have been implemented for the last
two decades, the NJ ASK and the HSPA. The 2014-15 school year brings with it a new
set of standardized assessments for students in Grades K-12 with the introduction of
PARCC (Partnership for the Assessment of Readiness for College and Careers), based on
the National Common Core Standards. Future research must focus on the efficacy of
these new assessments. There will be an entirely new body of literature that can be
contributed by researchers to aid in the process of developing meaningful data to this
effect. Topics such as teacher accountability, teacher retention, teacher evaluation, the
impact of PARCC on program offerings in the area of creative areas, student scheduling,
and student remedial programs may all be explored. While all of these topics will be of
interest to legislators and the New Jersey State Department of Education in developing
future accountability measures, they still fail to recognize the influence that community
wealth demographic factors have on student performance on standardized assessments.

64
Brief Historical Perspective of NJ ASK 8
The Grade 8 Proficiency Assessment, or GEPA, was originally administered to all
eighth grade students in 1999. The title of the assessment was changed to the New Jersey
Assessment of Skills and Knowledge Grade 8, or NJ ASK 8, in 2008. Together with the
New Jersey Assessment of Skills and Knowledge (NJ ASK) administered in Grades 3-7
and the HSPA (High School Proficiency Assessment) given to students in eleventh grade,
the GEPA was part of a battery of tests used to assess student performance in New
Jersey's public schools in three core areas: math, language arts, and science. The highest
rating a student could receive was Advanced Proficient, which was achieved by obtaining
a score of 250 or higher. This was followed by Proficient (achieved by a majority of non-
special needs students), anywhere between 200 and 250. Finally, the lowest rating was
Partially Proficient, which was a score below 200 (NJDOE, 2009b). Consequently, this
score structure is the same for the HSPA that is administered to all eleventh grade
students.
The state of New Jersey plans to phase out the NJ ASK that is administered to all
students enrolled in public schools in Grades 3-8 and replace it with the Partnership for
Assessment of Readiness for College and Careers (PARCC) beginning with the 2014-
2015 school year. This computer-based assessment will be given to all public school
students Grades K-12 to assess their knowledge in both Language Arts Literacy and
Mathematics. PARCC is based on the core belief that assessment should work as a tool
for enhancing teaching and learning. Because the assessments are aligned with the new,
more rigorous Common Core State Standards (CCSS), they ensure that every child is on
a path to college and career readiness by measuring what students should know at each

65
grade level. They will also provide parents and teachers with timely information to
identify students who may be falling behind and need extra help (PARCC, 2013). The
question of how PARCC data will be used to make decisions impacting on students and
teachers remains unanswered.
Theoretical Framework
A thorough review of the potential negative consequences of testing was
conducted by Mehrens (1998). According to Mehrens, the evidence for making any
strong conclusions about the asserted negative consequences were found to be lacking.
For example, he concluded the following:
• The evidence for a test's influence on either curricular content or
instructional process is not totally clear.
• The evidence regarding the effects of large-scale assessments on teacher
motivation, morale, stress, and ethical behavior is sketchy.
• With respect to assessment impacts on the effect of students, we are again
in a sub-area where there is not a great deal of empirical evidence.
Various schools of thought have emerged over many years that speak to the
different educational theories that have served as the basis for the arguments presented by
contemporary researchers. John Dewey’s Experience and Education speaks to the
struggle that exists between traditional and progressive education frameworks (1997).
Dewey writes of his beliefs and suggestions for engaging students and, ultimately,
educating the whole child. Dewey urges individuals to reflect on meaning and purpose in
Chapter 6 of his book. He indicates that reflection causes us to learn from the past and
make informed decisions about the future. Dewey explains that the formation of purpose

66
involves three parts: observing surrounding conditions, knowledge of the past, and
judgment of what is observed. Dewey reveals that purpose brings about desire and
desires help to motivate and call us to action (Dewey, 1997). It is from this call to action
that the rationale for decisions to be made can be born.
Dewey indicates that the traditional classroom limits intellectual and moral
freedom (Dewey, 1997). He encourages teachers to “stop and think” so that both
teachers and students can form a coherent plan that will cause them to provide a clear
road map for student learning. Dewey asserts his main goal in the final chapter of his
book when he explains that education must be based upon experience in order for the
individual learner to accomplish its end (Dewey, 1997). Therefore, there is a need for a
sound philosophy of experience.
Dewey emphasizes the need for connection between education and experience.
He explains that everything depends on the quality of experience and that through that
experience things are either agreeable or disagreeable and will influence later experiences
(Dewey, 1997). It is from these experiences that decisions can be made as to the future
direction of education, as Dewey would argue, and not necessarily from the results of
high-stakes testing.
Constructivist theorists purport that learning comes from the synthesis of prior
experience. Thus, education stems from analysis, discovery, and creativity. Jean
Piaget’s view of education was widely considered to be based in the constructivist school
of thought. Piaget identified four developmental stages that children experience and that
are linked to their maturation process: sensor-motor, pre-operational, concrete operations,
and formal operations. He noted that traditional education lies in the treatment of the

67
child as a ”small adult” who reasons and feels just as adults do, but without an adult’s
knowledge and experience (Tanner & Tanner, 2007). The resulting accountability
measures that come from high-stakes testing, then, might prohibit the experience of the
student to be used as a method for growth in the constructivist viewpoint because of the
social consequences that attached to such decision-making (Tanner & Tanner, 2007).
George Madaus (1999) points out that high-stakes testing is being used to make decisions
that have important social consequences such as graduation, promotion, and placement of
students and the evaluation and retention of teachers/administrators (Madaus, 1999).
Conversely, essentialist educational philosophy is deeply rooted in the notion that
students should learn through rigorous and comprehensive exposure to the traditional
academic content areas such as reading, writing, literature, mathematics, science, history,
art, and music. Essentialists such as E. D. Hirsch and William Bagley present a
viewpoint that is consistent with this philosophy. The teacher is at the very center of the
essentialist classroom, as the student participates in learning in a more passive role where
creativity is often stifled because the student is expected to conform to the methodology
of the teacher (Tanner & Tanner, 2007). Some educators have viewed the movement
toward a national curriculum and common core standards as a movement in essentialism.
The new common core standards will focus on what students need to know to be
productive members of society and, ultimately, may repress their innate sense of curiosity
and exploration but will be also represent a move toward 21st century learning with a
definite focus on college and career readiness (Brunner, 2012).

68
Conclusion
High-stakes testing is a phenomenon that is not going away. Yet, legislators and
policymakers appear to be steadfast in their resolve to refuse to acknowledge that
standardized assessment data do not account for community wealth demographic factors
in predicting the accuracy of student outcomes and the interpretation of those scores.
Tienken (2008) indicated that student test results in Grades 4, 8, and 11 can contain 6 to
13 scale-score points of error. However, legislators still will not account for the error and
label students as Proficient on the assessment when they have already been labeled as
Partially Proficient due to the error in scale-score point differential.
The efficacy and use of high-stakes testing to make important decisions for
teachers and students is an issue that will continue to be examined well into the future as
the landscape and scope of assessment evolves. The impact of new accountability
measures that have been imposed by both federal and state legislative bodies resulting
from the Common Core Standards and PARCC assessments remains to be seen. Topics
ranging from teacher tenure and evaluation to merit pay and student retention, promotion,
and graduation will all need to be explored as assessment results stemming from the new
standards are disseminated and used by legislators and educators to make important
decisions. The current climate in education as represented by political pundits and
legislators is not as dire as is sometimes reported, particularly when the facts inclusive of
both sides of the argument in favor of and against the efficacy of high-stakes tests on
national and international levels are compared accurately. The issues facing
contemporary educators and administrators are multi-faceted and involve many layers.
There is an opportunity to research many of the issues represented in this document

69
within the broader context, particularly within the framework of the aforementioned new
accountability measures. The prospect for future research is abundant and will help
accentuate the existing research on this topic, while also contributing to a body of
literature that remains yet to be explored.

70
CHAPTER III
METHODOLOGY
The purpose of this study was to identify which community wealth demographic
factors account for the greatest amount of variance in a New Jersey public school
district’s percentage scoring Proficient or above on the 2012 NJ ASK 8 in Language Arts
and Mathematics and the influence that community demographic data have on student
performance on the NJ ASK 8 in Language Arts and Mathematics.
Research Design
The study used a non-experimental, correlational, explanatory, cross-sectional
design with quantitative methods because the study provided research and corresponding
data that explored the relationship between two or more variables at one moment in time.
Multiple linear regression models were used in the study to determine the statistical
significance of the out-of-school variables that were reported in the 2012 NJ ASK 8
Language Arts and Mathematics student scores. Multiple regression (MR) analyses are
commonly employed in social science fields. Community wealth demographic factors
were considered in the study to determine the influence that those factors played in
predicting student outcomes on the 2012 NJ ASK. The strength and relationship between
the out-of-school variables and community wealth demographic factors remained
undetermined. The information and results of the data contained in research will
contribute to the limited body of literature that exists on this topic.
Johnson (2001) wrote that non-experimental research could be categorized in one
of three ways: descriptive, predictive, and explanatory (Johnson, 2001). The research
conducted aimed to collect data that were connected with an educational topic. Johnson

71
(2001) contended that non-experimental research is “frequently an important and
appropriate mode of research in education (Johnson, 2001, p. 3). The correlational study
that is being conducted investigated data that were gathered from one point in time;
namely, 2012 NJ ASK scores in Language Arts and Mathematics. Furthermore, my
study was non-experimental, cross-sectional and explanatory. Therefore, it was
appropriately designed because it aimed to investigate the relationship between two or
more variables using quantitative methods at one point in time.
Following a similar format to that of Turnamian’s (2012) study, multiple linear
regression models were used to determine the statistical significance of out-of-school
variables on school districts 2009 NJ ASK Grade 8 Language Arts and Mathematics
scores. The community variables presented in Chapter II were identified in the literature
as influencing student achievement measured by standardized assessments and provided
the basis for the theoretical framework of the study much in the same manner that
Turnamian’s (2012) study suggested. The strength of these variables' relationship to
school district 2012 NJ ASK Grade 8 scores was unknown.
Research Questions
The study that was conducted was guided by the following research questions:
Research Question 1: How much variance in 2012 NJ ASK Grade 8 test results in
Language Arts and Mathematics is explained by out-of-school socioeconomic
variables?
Research Question 2: How accurately can out-of-school socioeconomic and
community-level variables predict a school district's percentage of students scoring
Proficient or Advanced Proficient on the 2012 NJ ASK Grade 8 Language Arts and
72
Mathematics
Research Question 3: Which community-level variables account for the greatest amount
of variance in a school district's percentage of students passing the 2012 NJ ASK
Grade 8 in Language Arts and Mathematics?
Null Hypotheses
Null Hypothesis 1: There is no statistically significant relationship that exists between
2012 NJ ASK Grade 8 scores in Language Arts and Mathematics and the out-of-
school socioeconomic variables.
Null Hypothesis 2: There is no statistically significant relationship that exists between
out-of-school socioeconomic and community level variables in predicting a school
district’s percentage of students scoring Proficient or Advanced Proficient on the
2012 NJASK Grade 8 in Language Arts and Mathematics sections.
Null Hypothesis 3: There is no statistically significant relationship that exists between
community-level variables and a school district’s percentage of students passing the
2012 NJ ASK Grade 8 Language Arts and Mathematics sections.
Population Sampled
All school district data examined in this study related to Grade 8 student
achievement as measured by 2012 NJ ASK 8 for Language Arts and Mathematics.
According the New Jersey Department of Education, New Jersey has approximately 590
school districts categorized into eight different district factor group (DFG) categories
determined by 2010 U.S. Census data. The categories listed from districts located in the
state's poorest communities to districts located in the state's wealthiest districts are as
follows: A, B, CD, DE, FG, GH, I, J. The DFGs were calculated using the following six

73
variables that are closely related to socioeconomic status (SES) (NJDOE, 2010):
• Percentage of adults with no high school diploma
• Percentage of adults with some college education
• Occupational status
• Unemployment rate
• Percentage of individuals in poverty
• Median family income
Some of the 590 school districts in New Jersey include regional high schools and
county schools that do not serve elementary grades. The target population for this study
was 100% of all New Jersey school districts with both 2012 NJ ASK 8 data and 2010
U.S. Census data with at least 25 students enrolled in Grade 8. This information is
similar to that which was researched by Turnamian (2012). As a result, the available
population for the study was 409 districts and the sample size for the study was 409
school districts or 100% of the population.
Data Collection
The primary method for data collection was assessment results on the 2012 NJ
ASK for Grade 8 students in Language Arts and Mathematics that was administered
during the 2011-2012-calendar school year. Only valid student scores were considered
that indicated students as receiving either Proficient or Advanced Proficient ratings,
thereby representing “passing” scores for students. This information was available by
accessing New Jersey School Report Card data that are published annually on the New
Jersey Department of Education website and was downloaded in an Excel spreadsheet to
be used for analysis of the variables that were explored (NJDOE, 2011). There were two

74
distinct locations from which the data for the independent variables were collected. The
data regarding the percentage of economically disadvantaged families in the New Jersey
public school districts were downloaded into an Excel spreadsheet from the New Jersey
Department of Education website where annual school report card data are made
available (NJDOE, 2013b). Remaining data regarding independent variables for each
New Jersey school district were gathered from the American Community Survey (ACS).
Information gleaned from this location is available to the public through the U. S. Census
Bureau's decennial census program. Similar to Turnamian’s (2012) study, the data that
were collected from the ACS were based on five-year estimates from 2007-2012. This
information is representative of larger sample sizes and is published for areas with a
population of less than 20,000 and small geographic areas. Originally, information
published by the ACS was made available in one- and three-year segments beginning in
2005 and 2008, respectively. In 2010, ACS data were made available in five-year
periods, thereby showing change over a larger moment in time (U.S. Census, 2010, p. 1).
Data Analysis
The data for this research were analyzed in a manner that was consistent with
Turnamian’s (2012) study. Simultaneous multiple liner regression models, stepwise
regression, and hierarchical linear models were developed by importing the dependent
variable database into the SPSS analysis software program. A two-way ANOVA test was
generated for each dependent variable. Similar to Turnamian (2012), an F-Statistic was
analyzed to determine if the regression models that were generated were statistically
significant.
The research conducted in this study examined dependent and independent

75
variables that was consistent with Turnamian (2012) but that also explored the influence
that student performance on the 2012 NJ ASK 8 Language Arts and Mathematics has on
decisions that are made for students and teachers. The independent variables that were
examined include the following:
Household income, which is defined as:
• Employment status
• Percentage of annual household income under $25,000
• Percentage of annual household income under $35,000
• Percentage of annual household income above $200,000
• Percentage of family income under $25,000
• Percentage of family income under $35,000
• Percentage of family income above $200,000
• All families in poverty for 12 months
• All female households in poverty
• All people under poverty
Single-Parent households, which are defined as:
• Percentage of male households with no wife
• Percentage of female households with no husband
Parent level of education, which is defined as:
• Parents with less than a 9th grade education
• Percentage with no high school diploma
• Percentage that are high school graduates with some college education
• Percentage with a bachelor’s degree

76
• Percentage with an advanced degree
• Lone parent households, total
The dependent variables that were explored in this study were inclusive of school
district data obtained from 2012 NJ ASK 8 Language Arts and Mathematics results,
which were defined as the percentage of the student population that achieved a score of
either Proficient or Advanced Proficient on the assessment.
Reliability and Validity
It is of paramount importance that research that is conducted has achieved both
reliability and validity and should therefore be able to be replicated with similar
outcomes. In order to ensure reliability and validity, it is essential that data sources that
are being referenced provide a comprehensive representation of the information that is
being used in the study. The information that was used in this research was gleaned from
the New Jersey School Report Card, which has recently been renamed and is presently
referred to as the New Jersey School Performance Report and is available to the public
online. The data provided in this report are accurately portrayed, as they provided
evidence submitted by New Jersey public school districts to the New Jersey State
Department of Education (NJDOE, 2013b).
A primary goal of this study and the corresponding research was to have the data
align to that which was previously studied by Turnamian (2012). A recommendation of
Turnamian’s (2012) research was to “conduct a similar study using NJ ASK middle
school data to determine if the theoretical framework from this study explains the greatest
variance in scores (Turnamian, 2012, p. 206). Conceptually speaking, NJ ASK student
results are used to provide information to school officials that help them to make

77
judgments regarding student placement in courses, remedial programs, and a whole host
of other scheduling decisions. However, it is important to note that a standard error of
measurement existed in score reports for students on the NJ ASK as noted by Tienken
(2008). Tienken and Orlich (2013) indicated that almost “60% of State Education
Agencies (SEA) did not provide information about how or if they accounted for
Conditional Standard Error of Measurement (CSEM) in individual student test results”
(Tienken & Orlich, 2013, p. 91). Therefore, it would seem to be plausible that data that
were represented on student NJ ASK scores did not account for the CSEM and, as a
result, might have lacked the reliability necessary to make informed decisions for
students by district level school administration.
The dependent variable in this study was the NJ ASK 8 Language Arts and
Mathematics student scores that were reported for New Jersey school districts. The
reliability and validity of the results must be taken into consideration within the standard
error of measurement (SEM) that was ultimately reported by the New Jersey State
Department and in alignment with Turnamian’s (2012) stated results. Gay (2009)
indicated that it is imperative that proper measurement tools are used to help researchers
achieve their stated purpose when conducting a test (Gay et al., 2009). Cronbach’s alpha
ranges from 0 to 1.00, with values close to 1.00 indicating high consistency.
Professionally developed high-stakes standardized tests should have internal consistency
coefficients of at least .90. Lower-stakes standardized tests should have internal
consistencies of at least .80 or .85. For example, on a classroom exam, it is desirable to
have a reliability coefficient of .70 or higher. High reliability coefficients are required for
standardized tests because they are administered only once and the score on that one test

78
is used to draw conclusions about each student’s level on the trait of interest (Cronbach,
1970).
The NJ ASK 2011 Grades 3-8 Technical Report referred to the Standards for
Educational Psychological Testing (1999) and indicated the following:
Ultimately, the validity of an intended interpretation of test scores relies
on all the available evidence relevant to the technical quality of a testing
program. This includes evidence of careful test construction; adequate
score reliability; appropriate test administration and scoring; accurate
score scaling, equating, and standard setting; and careful attention to
fairness for all examinees (p. 139).
The report went on to further reveal the following:
The content-related evidence of validity includes the extent to which the
test items represent these specified content domains and cognitive
dimensions. Adequacy of the content representation of the NJ ASK is
critical because the tests must provide an indication of student progress
toward achieving the knowledge and skills identified in the Core
Curriculum Content Standards (CCCS), and the tests must fulfill the
requirements under NCLB (p. 140).
The Common Core State Standards (CCSS) in Language Arts and Mathematics in
New Jersey supplanted the Core Curriculum Content Standards (CCCS) with the
inception of the 2013-2014 school year (PARCC, 2013). Tienken and Orlich (2013)
contended that the “writers of the CCSS did not conduct any field or pilot test of any of
these standards in a classroom” (Tienken & Orlich, 2013, p. 104). As a result, there was

79
little evidence to suggest that the infusion of the new CCSS would effect different
outcomes for students on previous NJ ASK assessments. Furthermore, the influence of
school district demographic data on student outcomes was not considered. This
phenomenon is explored in Chapter IV of this study, using data from the 2012 NJ ASK
and U.S. Census data.
Instrumentation
The instrumentation for this study was inclusive of student scores in their
respective school districts on the 2012 NJ ASK Grade 8 in the Language Arts and
Mathematics sections of the assessment. The primary goal of the study was to determine
the amount of variance in 2012 NJ ASK Grade 8 scores as explained by out-of-school
district variables. Research conducted in this study mirrored that which was conducted
by Turnamian (2012), who investigated similar outcomes on the 2009 NJ ASK Grade 3
assessment. Data were gathered and accessed via the New Jersey School Report Card,
which is published annually and made available to the public online. Further information
was gathered by accessing information that was obtained on the New Jersey State
Department of Education (NJDOE) website and Achieve NJ, which provided data
regarding the decisions that are made for students and teachers based upon student test
results on standardized assessments, including the NJ ASK 8.
Chapter Summary
This chapter provided information relevant to the research design, research
questions explored, population sampled, data collection method, data analysis, and
instrumentation. The study specifically investigated the demographic data outside of
school districts and how those data were used to predict student outcomes on the NJ ASK
80
8 Language Arts and Mathematics sections. The research examined results from the
2012 NJ ASK 8 and U.S. Census data as well as information gleaned from Achieve NJ
online. The quantitative data were analyzed using the SPSS 20.0 data analysis program.
Pereira (2011) explored the influence of student and school variables on student
performance on the NJ ASK 8 in school districts with a District Factor Group of “DE.”
In order to gain a broader perspective of the influence that school district demographic
data had on student results on the NJ ASK 8, data were selected to be researched that
more closely paralleled that of Turnamian (2012) by exploring variables that looked at all
students, rather than those from one select population. The result was a study that
provided a perspective that could be helpful to policymakers, school administration, and
teaching staff in explaining the role that school district demographic data played in
explaining student outcomes on the NJASK Grade 8.

81
CHAPTER IV
ANALYSIS OF THE DATA
Introduction
The purpose of this study was to extend the research of Turnamian (2012) in order
to explain how well community and family demographic factors found in the U.S. Census
data predict the percentage of students scoring Proficient or above on the 2012 Grade 8
New Jersey Assessment of Skills and Knowledge in both Language Arts and
Mathematics.
Independent Variables
The independent variables listed below were paired with the dependent variables
of 2012 NJASK 8 scores of school districts in Language Arts and Mathematics to
determine the bivariate correlational results:
Household income, which is defined as:
• Employment status
• Percentage of annual household income under $25,000
• Percentage of annual household income under $35,000
• Percentage of annual household income above $200,000
• Percentage of family income under $25,000
• Percentage of family income under $35,000
• Percentage of family income above $200,000
• All families in poverty for 12 months
• All female households in poverty
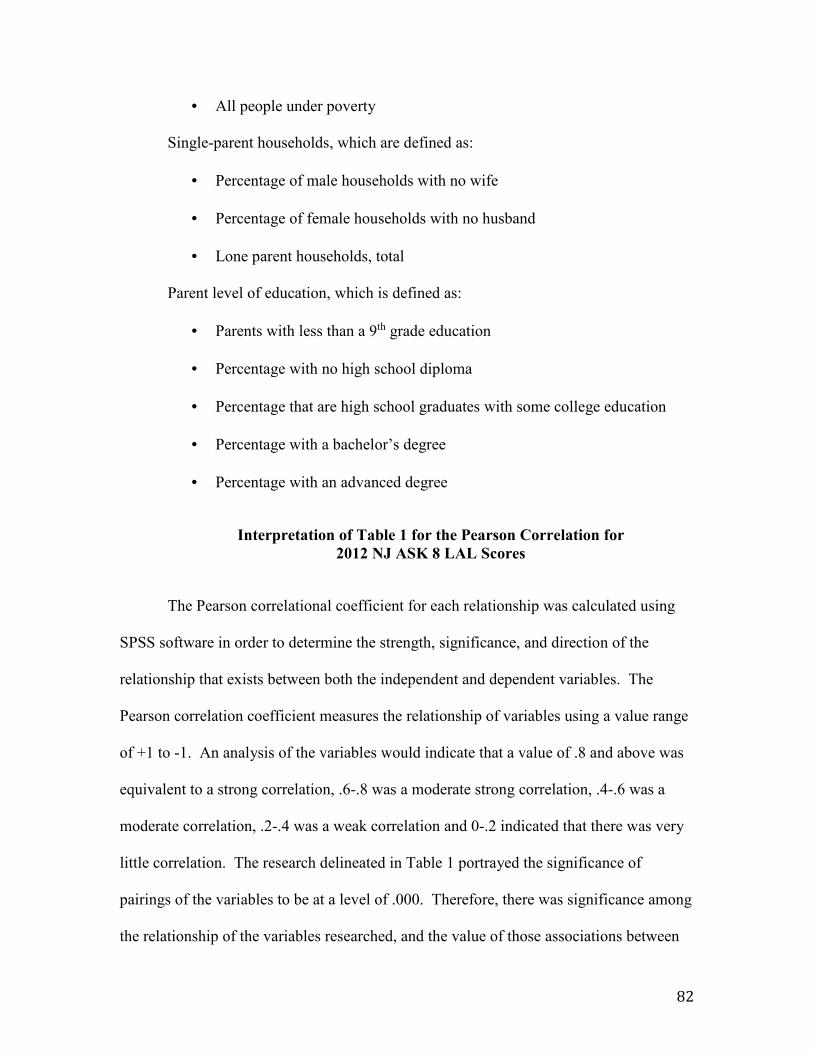
82
• All people under poverty
Single-parent households, which are defined as:
• Percentage of male households with no wife
• Percentage of female households with no husband
• Lone parent households, total
Parent level of education, which is defined as:
• Parents with less than a 9th grade education
• Percentage with no high school diploma
• Percentage that are high school graduates with some college education
• Percentage with a bachelor’s degree
• Percentage with an advanced degree
Interpretation of Table 1 for the Pearson Correlation for
2012 NJ ASK 8 LAL Scores
The Pearson correlational coefficient for each relationship was calculated using
SPSS software in order to determine the strength, significance, and direction of the
relationship that exists between both the independent and dependent variables. The
Pearson correlation coefficient measures the relationship of variables using a value range
of +1 to -1. An analysis of the variables would indicate that a value of .8 and above was
equivalent to a strong correlation, .6-.8 was a moderate strong correlation, .4-.6 was a
moderate correlation, .2-.4 was a weak correlation and 0-.2 indicated that there was very
little correlation. The research delineated in Table 1 portrayed the significance of
pairings of the variables to be at a level of .000. Therefore, there was significance among
the relationship of the variables researched, and the value of those associations between

83
variables was not random in nature.
A thorough review of the data indicated that there was a moderate strong
correlation between all people under the poverty level and families with a household
income of $35,000 with respect to student performance on the 2012 Grade 8 LAL portion
of the NJ ASK. Conversely, there was a weak correlation between employment status
and those with some college education and student outcomes on the 2012 Grade 8 LAL
portion of the NJ ASK.
Table 1 described the Pearson correlation coefficient for 2012 Grade 8 NJ ASK
LAL scores ranging from a strong to a weak correlation.
Table 1
Statistically Significant (p < .05) Pearson Correlation Coefficient for 2012 NJ ASK 8 LAL Scores, where N = 409
Variable Pearson Correlation Coefficient
% Family less than $35,000 -.759
All People under Poverty -.751
% Family less than $25,000 -.741
% Household less than $35,000 -.737
Lone Parent Household (total) -.729
% Household less than $25,000 -.719
No High School Diploma -.717
Lone Parent Female -.701
All Families under Poverty 12 Months -.694
Bachelor’s Degree .643
Less than 9th Grade Education -.590
Advanced Degree .564
% Household greater than $200, 000 .545
% Family greater than $200,000 .539
Lone Parent Male -.474
Female Household Poverty -.387
Employment Status -.276
Some College -.248

84
Interpretation of Table 2 for the Pearson Correlation for 2012
NJ ASK 8 Math Scores
The Pearson correlational coefficient for each relationship was calculated using
SPSS software in order to determine the strength, significance, and direction of the
relationship that exists between both the independent and dependent variables. The
Pearson correlation coefficient measures the relationship of variables using a value range
of +1 to -1. An analysis of the variables would indicate that a value of .8 and above was
equivalent to a strong correlation, .6-.8 was a moderate strong correlation, .4-.6 was a
moderate correlation, .2-.4 was a weak correlation and 0-.2 indicated that there was very
little correlation. The research delineated in Table 3 portrayed the significance of
pairings of the variables to be at a level of .000. Therefore, there was significance among
the relationship of the variables researched, and the value of those associations between
variables was not random in nature.
A thorough review of the data indicated that there was a moderate strong
correlation between the percentage of families making less than $35,000 and all people
under the poverty level with respect to student performance on the 2012 Grade 8
Mathematics portion of the NJ ASK. Conversely, there was a weak correlation between
some college education and employment status and student outcomes on the 2012 Grade
8 Mathematics portion of the NJ ASK. Consequently, the two independent variables of
some college education and employment status represented a weak correlation with
respect to student performance for both the Language Arts and Mathematics sections of
the 2012 Grade 8 NJASK. The same is true of the independent variable of all people
under poverty, which represented a moderate strong correlation on both portions of the

85
2012 Grade 8 NJ ASK.
Table 2 depicted the Pearson correlation coefficient for 2012 Grade 8 NJ ASK
Mathematics scores ranging from a strong to a weak correlation.
Table 2
Statistically Significant (p < .05) Pearson Correlation Coefficient for 2012 NJASK 8
Math Scores, where N = 409
Variable Pearson Correlation Coefficient
% Family less than $35,000 -.711
All People under Poverty -.703
Lone Parent Household (total) -.699
% Family less than $25,000 -.696
% Household less than $35,000 -.694
No High School Diploma -.691
Lone Parent Female -.681
% Household less than $25,000 -.670
All Families under Poverty 12 Months -.649
Bachelor’s Degree .649
Advanced Degree .591
% Household greater than $200,000 .578
Less than 9th Grade Education -.564
% Family greater than $200,000 .548
Lone Parent Male -.426
Female Household Poverty -.353
Some College -.298
Employment Status -.292
Simultaneous Multiple Regression – 2012 Grade 8 Language Arts
The first simultaneous regression model was run with all the predictor variables
included. The Model Summary and ANOVA results tables for the initial simultaneous
regression run are shown below (Table 3). The ANOVA results table (Table 4) showed
that the regression was statistically significant (F = 43.892, p= .001 < .05) and that the R
square for this regression is .672 (Table 4). Therefore, an R square value of .672

86
indicated that 67% of the variance is explained by the dependent variable of percentage
of students passing Language Arts. A model of best fit was then developed.
Table 3
Grade 8 Language Arts Model Summary
Model Summary
Model R R Square
Adjusted R
Square
Std. Error of
the Estimate
1 .820a .672 .657 6.759
a. Dependent Variable: % Passing LA
b. Predictors: (Constant), Advanced Degree, Female
House Pov, Lone Parent Male, Employ Status, Less
than 9th grade, Lone Parent Female, Some College, %
House <25K, %Family >200K, BA, All Fams
Pov 12 mnths, % Family <35K, % House >200K,
No HS, All People under Pov, % Family <25K, %
House <35K, Lone Parent household (total)
Table 4
Grade 8 Language Arts ANOVA Table
ANOVAa
Model
Sum of
Squares df Mean Square F Sig.
1 Regression 36088.893 18 2004.938 43.892 .000b
Residual 17586.545 385 45.679
Total 53675.437 403
a. Dependent Variable: % Passing LA
b. Predictors: (Constant), Advanced Degree, Female House Pov, Lone Parent Male,
Employ Status, Less than 9th grade, Lone Parent Female, Some College, % House
<25K, %Family >200K, BA, All Fams Pov 12 mnths, % Family <35K, %
House >200K, No HS, All People under Pov, % Family <25K, % House
<35K, Lone Parent household (total)

87
Table 5
Grade 8 Language Arts Final Model Summary
Model Summary
Model R R Square
Adjusted R
Square
Std. Error of
the Estimate
1 .820a .672 .660 6.731
a. Dependent Variable: % Passing Language Arts
b. Predictors: (Constant), Advanced Degree, Female House
Pov, Less than 9th grade, Employ Status, Lone Parent
household (total), Some College, % House <35K,
%Family >200K, BA, All Fams Pov 12 mnths, % House
>200K, % Family <35K, All People under Pov, NoHS
The result of the final Model Summary table (Table 5) demonstrated a change in
only the Adjusted R Square value, which changed from .657 in Table 3 to .660 in Table 5
and a shift in the standard error of the estimate, which changed from 6.759 in Table 3 to
6.731 in Table 5.
Table 6
Grade 8 Language Arts Final ANOVA Table
ANOVAa
Model
Sum of
Squares df Mean Square F Sig.
1 Regression 36051.937 14 2575.138 56.841 .000b
Residual 17623.500 389 45.305
Total 53675.437 403
a. Dependent Variable: % Passing LA

88
b. Predictors: (Constant), Advanced Degree, Female House Pov, Less than 9th
grade, Employ Status, Lone Parent household (total), Some College, % House
<35K, %Family >200K, BA, All Fams Pov 12 mnths, % House >200K, %
Family <35K, All People under Pov, No HS The coefficients table (Table 7) represented that the statistically significant
variables in the regression were lone parent household (total), no high school, all people
under poverty, and employment status.
Table 7
Grade 8 Language Arts Coefficient Table
Coefficientsa
Model
Unstandardized
Coefficients
Standardiz
ed
Coefficient
s
t Sig.
Collinearity
Statistics
B Std. Error Beta
Toleran
ce VIF
1 (Constant) 105.387 5.970 17.654 .000
Employ Status -.086 .043 -.075 -2.001 .046 .601 1.663
% House
<35K -.030 .095 -.027 -.311 .756 .111 9.041
% House
>200K -.060 .114 -.053 -.527 .598 .083 12.053
% Family
<35K -.087 .117 -.077 -.746 .456 .079 12.701
%Family
>200K .067 .077 .073 .874 .383 .122 8.182
All Fams Pov
12 mnths -.101 .139 -.074 -.723 .470 .081 12.322
Female House
Pov .033 .026 .053 1.257 .209 .478 2.093
All People
under Pov -.486 .222 -.248 -2.190 .029 .066 15.180
Lone Parent
household
(total)
-.618 .142 -.231 -4.352 .000 .301 3.326

89
Less than 9th
grade .255 .234 .086 1.089 .277 .137 7.318
No HS -.418 .189 -.251 -2.209 .028 .066 15.246
Some College -.155 .133 -.054 -1.168 .244 .397 2.521
BA .060 .096 .047 .629 .530 .153 6.546
Advanced
Degree .011 .099 .008 .108 .914 .149 6.709
a. Dependent Variable: % Passing LA
Simultaneous Multiple Regression – 2012 Grade 8 Mathematics
The first simultaneous regression model was run with all the predictor variables
included. The Model Summary and ANOVA results tables for the initial simultaneous
regression run are shown below (Table 8). The ANOVA results table (Table 9) showed
that the regression was statistically significant (F = 48.247, p= .001 < .05) and that the R
square for this regression is .632 (Table 8). Therefore, an R square value of .632
indicated that 63% of the variance is explained by the dependent variable of percentage
of students passing Mathematics. A model of best fit was then developed.
Table 8
Grade 8 Mathematics Model Summary
Model Summary
Model R R Square
Adjusted R
Square
Std. Error of
the Estimate
1 .795a .632 .619 9.188

90
a. Dependent Variable: % Passing Math
b. Predictors: (Constant), Advanced Degree, Female
House Pov, Less than 9th grade, Employ Status, Lone
Parent household (total), Some College, % House
<35K, %Family >200K, BA, All Fams Pov 12
mnths, % House >200K, % Family <35K, No HS,
All People under Pov
Table 9
Grade 8 Mathematics ANOVA Table
ANOVAa
Model
Sum of
Squares df Mean Square F Sig.
1 Regression 57027.606 14 4073.400 48.247 .000b
Residual 33180.413 393 84.429
Total 90208.018 407
a. Dependent Variable: % Passing Mathematics
b. Predictors: (Constant), Advanced Degree, Female House Pov, Less than 9th
grade, Employ Status, Lone Parent household (total), Some College, % House
<35K, %Family >200K, BA, All Fams Pov 12 mnths, % House >200K, %
Family <35K, No HS, All People under Pov
The coefficients table (Table 10) represented that the statistically significant
variables in the regression were lone parent household, no high school, some college, all
people under poverty, and percentage of households greater than $200,000.
Table 10 Grade 8 Mathematics Coefficient Table
Coefficientsa
Model
Unstandardized
Coefficients
Standardiz
ed
Coefficient
s t Sig.
Collinearity
Statistics

91
B Std. Error Beta
Toleran
ce VIF
1 (Constant) 94.872 8.029 11.816 .000
Employ Status -.047 .059 -.031 -.795 .427 .600 1.667
% House
<35K .081 .130 .057 .620 .536 .110 9.065
% House
>200K .299 .155 .204 1.922 .055 .083 12.040
% Family
<35K -.029 .160 -.020 -.182 .855 .079 12.714
%Family
>200K -.119 .105 -.099 -1.134 .257 .122 8.190
All Fams Pov
12 mnths -.207 .190 -.117 -1.089 .277 .081 12.379
Female House
Pov .052 .036 .064 1.456 .146 .479 2.088
All People
under Pov -.529 .302 -.209 -1.750 .081 .066 15.225
Loan Parent
household
(total)
-.857 .190 -.251 -4.504 .000 .302 3.313
Less than 9th
grade .144 .316 .037 .455 .649 .139 7.192
No HS -.518 .257 -.240 -2.015 .045 .066 15.164
Some College -.334 .179 -.090 -1.864 .063 .397 2.517
BA .039 .130 .024 .303 .762 .153 6.541
Advanced
Degree .063 .134 .037 .466 .641 .149 6.719
a. Dependent Variable: % Passing Mathematics
Hierarchical Linear Regression Models
Hierarchical linear regression models were constructed to explain the predictive
power of the three independent variables for each subject area (Language Arts and
Mathematics). First, I created three models for Grade 8 Language Arts and then I created
three models for Grade 8 Mathematics.

92
Interpretation of the Hierarchical Linear Regression Model for 2012 Grade 8
NJ ASK Language Arts Scores
An analysis of the hierarchical linear regression was used to estimate the
influence that the three models had on the dependent variable of the percentage of
students passing the Grade 8 Language Arts portion of the 2012 NJ ASK (Table 11). It
was evident from the data in Model 1 that the predictor of no high school explained
51.4% of the variance in the dependent variable of percentage of students passing
Language Arts with an R Square value of .514. Model 2 indicated that 60.5% of the
variance could be explained by combining the predictors of no high school and all people
under poverty in the dependent variable as represented by an R Square value of .605.
Model 3 demonstrated that when the three predictors of no high school, all people under
poverty, and employment status were combined, then 62.5% of the variance could be
explained in the dependent variable percentage of students passing Language Arts at an R
square value of .625. Consequently, an analysis of the three models showed that Model 3
explained the greatest amount of variance in the dependent variable of percentage of
students passing Language Arts. As each new predictor was introduced to the
hierarchical regression model, the R Square value became stronger.
Table 11
Grade 8 Language Arts Hierarchical Linear Regression Model Summary
Model Summary
Mod
el R
R
Square
Adjusted R
Square
Std. Error
of the
Estimate
Change Statistics
R Square
Change
F
Change df1 df2
Sig. F
Change
1 .717a .514 .513 8.054 .514 425.401 1 402 .000
2 .778b .605 .603 7.271 .091 92.221 1 401 .000

93
3 .791c .625 .622 7.093 .020 21.390 1 400 .000
a. Dependent Variable: % Passing LAL
b. Predictors: (Constant), No HS
c. Predictors: (Constant), No HS, All People under Pov
d. Predictors: (Constant), No HS, All People under Pov, Employ Status
Interpretation of the Two-Way ANOVA for the Hierarchical Linear Regression
Model for 2012 Grade 8 NJ ASK Language Arts Scores
An analysis of the two-way ANOVA table (Table 12) was conducted to establish
the impact of the three independent variables that were paired with the dependent
variable of percentage of students passing Language Arts. A review of the data
demonstrated that all three models were determined to be statistically significant as
shown in Table 12 and below:
Model 1 was significant at the .000 level, F = 425.401, df = 402.
Model 2 was significant at the .000 level, F = 307.076, df = 401.
Model 3 was significant at the .000 level, F = 222.257, df = 400.
Table 12
Grade 8 Language Arts Two-Way ANOVA Hierarchical Linear Regression
ANOVAa
Model
Sum of
Squares df Mean Square F Sig.
1 Regression 27596.742 1 27596.742 425.401 .000b
Residual 26078.695 402 64.872
Total 53675.437 403
2 Regression 32472.867 2 16236.433 307.076 .000c

94
Residual 21202.570 401 52.874
Total 53675.437 403
3 Regression 33549.122 3 11183.041 222.257 .000d
Residual 20126.315 400 50.316
Total 53675.437 403
a. Dependent Variable: % Passing LA
b. Predictors: (Constant), No HS
c. Predictors: (Constant), No HS, All People under Pov
d. Predictors: (Constant), No HS, All People under Pov, Employ Status
Interpretation of the Standardized Coefficient Betas and Tolerance for the
Hierarchical Linear Regression Model for 2012 Grade 8 NJ ASK
Language Arts Scores
An analysis of the coefficients table (Table 13) was conducted to determine how
each of the three predictors from Models 1, 2, and 3 influence the dependent variable of
percentage of students passing Language Arts. The data presented in Model 1 reported a
beta value of -.717 for those with no high school diploma. That independent variable
was statistically significant in Model 1 at the .000 level, t= -20.625. The beta was
negative, which indicated that student results decreased on the Language Arts portion of
the 2012 Grade 8 NJ ASK as the percentage of those parents without a high school
diploma increased.
The data presented in Model 2 increased in strength with a reported beta value of
-.330 for those with no high school diploma. It was statistically significant at the .000
level, t= -6.454. The added variable in Model 2 of all people under poverty reported a
beta of -.491 and was significant at the .000 level, t= -9.603. The beta was negative,
which indicated that student results decreased on the Language Arts portion of the 2012
Grade 8 NJ ASK as the percentage of those people under poverty increased.
The data presented in Model 3 increased in strength with a reported beta value of

95
-.268 for those with no high school diploma. It was statistically significant at the .000
level, t= -5.195. The reported beta value of -.522 was statistically significant at the .000
level, t= -10.378 for the predictor of all people under poverty. However, the strength of
that predictor decreased slightly from that of Model 2 when the reported beta was valued
at -.491. The variable of employment status was added in Model 3 and reported a beta of
-.148. The variable was statistically significant at the .000 level, t= -4.625.
Table 13
Grade 8 Language Arts Standardized Coefficients Betas and Tolerance for the
Hierarchical Linear Regression Model
Coefficientsa
Model
Unstandardized
Coefficients
Standardize
d
Coefficients
t Sig.
Collinearity
Statistics
B Std. Error Beta
Toleranc
e VIF
1 (Constant) 97.182 .712 136.499 .000
No HS -1.196 .058 -.717 -20.625 .000 1.000 1.000
2 (Constant) 97.452 .643 151.469 .000
No HS -.550 .085 -.330 -6.454 .000 .377 2.651
All People
under Pov -.963 .100 -.491 -9.603 .000 .377 2.651
3 (Constant) 109.253 2.628 41.576 .000
No HS -.447 .086 -.268 -5.195 .000 .352 2.841
All People
under Pov -1.024 .099 -.522 -10.378 .000 .370 2.700
Employ Status -.170 .037 -.148 -4.625 .000 .920 1.087
a. Dependent Variable: % Passing LA
Interpretation of the Hierarchical Linear Regression Model for 2012
Grade 8 NJ ASK Mathematics Scores
An analysis of the hierarchical linear regression was used to estimate the

96
influence that the three models have on the dependent variable of the percentage of
students passing the Grade 8 Mathematics portion of the 2012 NJ ASK (Table 14). It
was evident from the data in Model 1 that the predictor of no high school explained
47.9% of the variance in the dependent variable of percentage of students passing
mathematics with an R Square value of .479. Model 2 indicated that 54.5% of the
variance could be explained by combining the predictors of no high school and all people
under poverty in the dependent variable as represented by an R Square value of .545.
Model 3 demonstrated that when the three predictors of no high school, all people under
poverty, and employment status were combined, then 56.8% of the variance could be
explained in the dependent variable percentage of students passing mathematics at an R
square value of .568. Consequently, an analysis of the three models showed that Model 3
explained the greatest amount of variance in the dependent variable of percentage of
students passing Language Arts. As each new predictor was introduced to the
hierarchical regression model, the R Square value became stronger.
Table 14
Grade 8 Mathematics Hierarchical Linear Regression Model Summary
Model Summary
Mod
el R
R
Square
Adjusted R
Square
Std. Error
of the
Estimate
Change Statistics
R Square
Change
F
Change df1 df2
Sig. F
Change
1 .692a .479 .477 10.763 .479 372.784 1 406 .000
2 .738b .545 .543 10.070 .066 58.792 1 405 .000
3 .754c .568 .565 9.819 .023 21.927 1 404 .000
a. Dependent Variable: % Passing Mathematics
b. Predictors: (Constant), No HS
c. Predictors: (Constant), No HS, All People under Pov

97
d. Predictors: (Constant), No HS, All People under Pov, Employ Status
Interpretation of the Two-Way ANOVA for the Hierarchical Linear Regression
Model for 2012 Grade 8 NJ ASK Mathematics Scores
An analysis of the Two-Way ANOVA table (Table 15) was conducted to
establish the impact of the three independent variables that were paired with the
dependent variable of percentage of students passing Mathematics. A review of the data
demonstrated that all three models were determined to be statistically significant as
shown in Table 15 and below:
Model 1 was significant at the .000 level, F = 372.784, df = 406.
Model 2 was significant at the .000 level, F = 242.320, df = 405.
Model 3 was significant at the .000 level, F = 177.203, df = 404.
Table 15
Grade 8 Mathematics Two-Way ANOVA Hierarchical Linear Regression
ANOVAa
Model
Sum of
Squares df Mean Square F Sig.
1 Regression 43180.303 1 43180.303 372.784 .000b
Residual 47027.716 406 115.832
Total 90208.018 407
2 Regression 49141.723 2 24570.861 242.320 .000c
Residual 41066.296 405 101.398
Total 90208.018 407
3 Regression 51255.807 3 17085.269 177.203 .000d
Residual 38952.212 404 96.416
Total 90208.018 407
a. Dependent Variable: % Passing Mathematics

98
b. Predictors: (Constant), No HS
c. Predictors: (Constant), No HS, All People under Pov
d. Predictors: (Constant), No HS, All People under Pov, Employ Status
Interpretation of the Standardized Coefficient Betas and Tolerance for the
Hierarchical Linear Regression Model for 2012 Grade 8 NJ ASK
Mathematics Scores
An analysis of the coefficients table (Table 16) was conducted to determine how
each of the three predictors from Models 1, 2, and 3 influence the dependent variable of
percentage of students passing Mathematics. The data presented in Model 1 reported a
beta value of -.692 for those with no high school diploma. That independent variable was
statistically significant in Model 1 at the .000 level, t= -19.308. The beta was negative,
which indicated that student results decreased on the Mathematics portion of the 2012
Grade 8 NJ ASK as the percentage of those parents without a high school diploma
increased.
The data presented in Model 2 increased in strength with a reported beta value of
-.363 for those with no high school diploma. It was statistically significant at the .000
level, t= -6.660. The added variable in Model 2 of all people under poverty reported a
beta of -.418 and was significant at the .000 level, t= -7.668. The beta was negative,
which indicated that student results decreased on the Mathematics portion of the 2012
Grade 8 NJ ASK as the percentage of those people under the poverty level increased.
The data presented in Model 3 increased in strength with a reported beta value of
-.298 for those with no high school diploma. It was statistically significant at the .000
level, t= -5.437. The reported beta value of -.448 was statistically significant at the .000
level, t= -8.375 for the predictor of all people under poverty. However, the strength of

99
that predictor decreased slightly from that of Model 2 when the reported beta was valued
at -.418. The variable of employment status was added in Model 3 and reported a beta of
-.159. The variable was statistically significant at the .000 level, t= -4.683.
Table 16
Grade 8 Mathematics Standardized Coefficients Betas and Tolerance for the
Hierarchical Linear Regression Model
Coefficientsa
Model
Unstandardized
Coefficients
Standardize
d
Coefficients
t Sig.
Collinearity
Statistics
B Std. Error Beta
Toleranc
e VIF
1 (Constant) 90.273 .947 95.302 .000
No HS -1.492 .077 -.692 -19.308 .000 1.000 1.000
2 (Constant) 90.598 .887 102.109 .000
No HS -.782 .117 -.363 -6.660 .000 .379 2.639
All People
under Pov -1.057 .138 -.418 -7.668 .000 .379 2.639
3 (Constant) 106.994 3.607 29.663 .000
No HS -.643 .118 -.298 -5.437 .000 .355 2.816
All People
under Pov -1.135 .135 -.448 -8.375 .000 .373 2.679
Employ Status -.237 .051 -.159 -4.683 .000 .922 1.085
a. Dependent Variable: % Passing Mathematics
Predictive Power for the Dependent Variable of Language Arts

100
The results of the analysis for the statistics that were run as a part of this research
were combined with different predictors (independent variables) in order to develop an
algorithm that could be used to predict student outcomes on the Language Arts portion of
the 2012 Grade 8 NJ ASK. The following formula was applied:
(-.447*7.5)+(-1.024*10.9)+(-.170*77.9)+109.25
The formula above was inclusive of the values associated with each of the three
main independent variables of no high school, all people under poverty, and employment
status run in the regression. These values related to the value for the unstandardized
coefficient in Model 3 for no high school (-.447) multiplied by the value assigned to no
high school that was identified in the U.S. Census Bureau’s American Factfinder (7.5)
plus the value for the unstandardized coefficient in Model 3 for all people under poverty
(-1.024) multiplied by the value that was identified in American Factfinder (10.9) plus
the value in Model 3 for employment status (-.170) multiplied by the value that was
identified in American Factfinder (77.9) plus the Constant in Model 3 of the coefficients
table (109.25). The result was the predictive algorithm that was developed above. In the
Model 3 summary, the standard error of the estimate was calculated at 7.1. I then went
back to investigate the number of school districts with a value greater than 7.1 in
Language Arts for percentage passing Language Arts and the predictive column when
looking at the difference column to account for the standard error of the estimate. That
number was inclusive of 45 school districts in New Jersey from the study.
Predictive Power for the Dependent Variable of Mathematics
The results of the analysis for the statistics that were run as a part of this research
were combined with different predictors (independent variables) in order to develop an
101
algorithm that could be used to predict student outcomes on the Mathematics portion of
the 2012 Grade 8 NJ ASK. The following formula was applied:
(-.643*7.5)+(-1.135*10.9)+(-.237*77.9)+106.99
The formula above was inclusive of the values associated with each of the three
main independent variables of no high school, all people under poverty, and employment
status run in the regression. These values related to the value for the unstandardized
coefficient in Model 3 for no high school (-.643) multiplied by the value assigned to no
high school that was identified in the U.S. Census Bureau’s American Factfinder (7.5)
plus the value for the unstandardized coefficient in Model 3 for all people under poverty
(-1.135) multiplied by the value that was identified in American Factfinder (10.9) plus
the value in Model 3 for employment status (-.237) multiplied by the value that was
identified in American Factfinder (77.9) plus the Constant in Model 3 of the coefficients
table (106.99). The result was the predictive algorithm that was developed above. In the
Model 3 summary, the standard error of the estimate was calculated at 9.8. I then went
back to investigate the number of school districts with a value greater than 9.8 in
Mathematics for percentage passing Mathematics and the predictive column when
looking at the difference column to account for the standard error of the estimate. That
number was inclusive of 44 school districts in New Jersey from the study.
Research Questions and Answers for Dependent Variables
This study sought to answer three main research questions. As a result of the
examination of the information and literature and after a thorough analysis of the data,
the following responses to the research questions were delineated:
Research Question 1: How much variance in 2012 NJ ASK Grade 8 test results in
102
Language Arts and Mathematics is explained by out-of-school socioeconomic
variables?
Null Hypothesis: No statistically significant relationship exits between 2012 NJ ASK
Grade 8 test results in Language Arts and Mathematics that can be explained by out-
of-school socioeconomic variables.
Answer: The null hypothesis is rejected. The predictor variables of no high school, all
people under poverty, and employment status proved to be statistically significant
predictors of 2012 NJ ASK Grade 8 scores in Language Arts and Mathematics.
Research Question 2: How accurately can out-of-school socioeconomic and community-
level variables predict a school district's percentage of students scoring Proficient or
Advanced Proficient (percentage passing) on the 2012 NJASK Grade 8 Language
Arts and Mathematics sections?
Null Hypothesis: There is no statistically significant, research demonstrated,
combination of independent variables with reliable, predictive power for 2012 NJ
ASK Grade 8 test results in Language Arts and Mathematics for New Jersey school
districts.
Answer: The null hypothesis is rejected. A combination of no high school, all people
under poverty, and employment status was found to have reliable, predictive power
for 2012 NJ ASK Grade 8 test results in Language Arts and Mathematics for New
Jersey school districts. The statistically significant variables combined to accurately
predict the percentage of students scoring Proficient or Advanced Proficient in
89.0% of school districts on the Language Arts section of the 2012 NJ ASK 8 and in
89.2% of school districts in the Mathematics section of the 2012 NJ ASK 8.

103
Research Question 3: Which community-level variables account for the greatest amount
of variance in a school district's percentage of students passing the 2012 NJ ASK
Grade 8 in Language Arts and Mathematics?
Null Hypothesis: There is no statistically significant relationship that exists between
community-level variables and a school district’s percentage of students passing the
2012 NJ ASK Grade 8 Language Arts and Mathematics sections.
Answer: The null hypothesis is rejected. A combination of no high school, all people
under poverty, and employment status proved to account for the greatest amount of
variance in a school district’s percentage of students passing the 2012 NJ ASK
Grade 8 Language Arts and Mathematics sections.
Chapter Summary
The study conducted by Turnamian (2012) provided convincing data regarding
the influence of community demographic factors on the 2009 NJ ASK Grade 3 results of
students in New Jersey school districts. While Turnamian’s study was not the first of its
kind, his examination added to the research of others, including Tienken (2008), Maylone
(2002), Amrein and Berliner (2002), and Bolon (2001) and provided further evidence that
helped to explain student test results on standardized assessments that deviated from
variables in the classroom among teachers and students. A recommendation of
Turnamian’s for future research was to “conduct a similar study using NJ ASK middle
school data to determine if the theoretical framework from this study explains the greatest
variance in scores” (Turnamian, 2012). I was intrigued by the works of the other
researchers noted above and as a result was compelled to provide my own body of
research that could contribute to the literature on this topic.

104
The total population for the study included 409 school districts in the state of New
Jersey. Simultaneous multiple linear regression and hierarchical linear regression models
were then created by importing each dependent variable database into the IBM SPSS
(Statistical Package for the Social Sciences) predictive analytics software. A two-way
ANOVA test (analysis of variance) was generated for each dependent variable. An
analysis of each model's R-square value was conducted in order to determine which
model explained the greatest variance in each dependent variable. A standardized beta
coefficient was reported within each model’s independent variables. This information
was used to compare the strength of the effect of each independent variable on the
dependent variable within each statistically significant model.
The theoretical framework simultaneous multiple regressions identified the best
predictive model for the 2012 NJ ASK Grade 8 Language Arts scores with the standard
error of the estimate at 7.1. This model explained 67.2% of the variance in 2012 NJ ASK
Grade 8 Language Arts scores when combining the three independent variables of no
high school, all people under poverty, and employment status. A predictive formula was
developed of (-.447*7.5)+(-1.024*10.9)+(-.170*77.9)+109.25 by looking at the data
generated from the U.S. Census Bureau combined with the percentage of students passing
the 2012 Grade 8 Language Arts section when looking at the three independent variables
noted above. As a result of the standard error of the estimate represented as 7.1 in the
Language Arts model of best fit, 44 school districts’ scores were eliminated, as they
exceeded the 7.1 margin of error. The results showed that 89.3% of school districts’
scores qualified from the original sample group to be included in the analysis. With a
margin of error of +/- 7.1, 67.2% of student scores fell within the standard error of the

105
estimate on the 2012 NJ ASK Grade 8 Language Arts section in New Jersey.
The same is true for the 2012 NJ ASK Grade 8 Mathematics scores with the
standard error of the estimate at 9.8. The theoretical framework model explained 63.2%
of the variance on 2012 NJ ASK Grade 8 Mathematics scores when combining the same
three independent variables of no high school, all people under poverty, and employment
status. A predictive formula was developed that replicated that of the Language Arts
algorithm of (-.643*7.5)+(-1.135*10.9)+(-.237*77.9)+106.99 by looking at the data
generated from the U.S. Census Bureau combined with the percentage of students passing
the 2012 Grade 8 Mathematics section when looking at the three independent variables
noted above. As a result of the standard error of the estimate represented as 9.8 in the
Mathematics model of best fit, 45 school districts’ scores were eliminated, as they
exceeded the 9.8 margin of error. The results showed that 89.0% of school districts’
scores qualified from the original sample group to be included in the analysis. With a
margin of error of +/- 9.8, 63.2% of student scores fell within the standard error of the
estimate on the 2012 Grade 8 Mathematics section in New Jersey.
106
CHAPTER V
CONCLUSIONS AND RECOMMENDATIONS
The purpose of this quantitative study was to research the influence that
community demographic variables had on student performance on the 2012 Grade 8 New
Jersey Assessment of Skills and Knowledge (NJ ASK) in the areas of Language Arts and
Mathematics. This study extended the research of a similar analysis conducted by
Turnamian (2012). Simultaneous multiple regression analysis was applied to develop
data sets that complemented the research that had previously been conducted and added
to the body of evidence that already exists as delineated in the literature review in
Chapter II of this study. The interpretation of the data could be used by school
administration and policymakers to make informed decisions that reflect the influence
that community demographic data have on student performance on the NJ ASK and other
standardized assessments.
General Observations
This study demonstrated that there were three factors (no high school diploma, all
people under poverty, and employment status) that contributed heavily to student

107
performance on the NJ ASK 8 other than teaching and learning in the classroom,
namely that certain demographic factors could be used to explain student outcomes on
the NJ ASK 8 and that those factors warranted greater examination in order to show the
impact that they had on student performance. The reliance of policymakers on student
outcomes on standardized assessments to make decisions that impact teacher
accountability is simply too great. As a result, it is evident that test-based accountability
measures remove the responsibility from the parent and/or the families of students and
thrust the sole responsibility for student performance on the teacher in the classroom.
Ravitch stated that “test-based accountability, as currently defined and used, neglected to
acknowledge that students share in the responsibility for their academic performance”
(Ravitch, 2010). The results of this study cannot be ignored.
The predictive power of community demographic factors on student outcomes is
rarely, if ever, accounted for by politicians and legislators. Yet, money continues to be
pumped into schools in New Jersey labeled as “underperforming” in an effort to improve
test scores when evidence exists that demonstrates this philosophy is simply not always
prudent. Student-related characteristics such as parental education, parental aspirations
and support for their children’s education, and student health, motivation, ethnic
background, and cultural factors together have at least as much influence on scores
(Koretz, 2008). In addition, Koretz also researched the impact that social and economic
status had on test scores and indicated that both factors indirectly influence student
performance (Koretz, 2008).
General Conclusions 2012 NJ ASK Grade 8 for the Dependent Variable of
Language Arts
The existing empirical literature and results from this study suggested that student
108
outcomes on the 2012 Grade 8 Language Arts portion of the NJ ASK were significantly
influenced by out-of-school, demographic factors that were not associated to teaching and
learning in the classroom. The three predictors identified in this study that demonstrated
the strongest influence were no high school, all people under poverty, and employment
status. The statistically significant variables combined to accurately predict the
percentage of students scoring Proficient or Advanced Proficient in 89.0% of school
districts on the Language Arts section of the 2012 NJ ASK 8. This predictive power is
remarkable and provides data that demonstrate undeniably that student performance is
strongly influenced by factors besides teaching and learning in the classroom.
Consequently, the relationship between student performance on the 2012 Grade 8 NJASK
and parent level of education reversed in direction when parents achieved a bachelor’s or
advanced degree. The research demonstrated that education levels below a bachelor's
degree (high school diploma or high school diploma with some college) had an inverse
relationship with the dependent variable. The relationship changed to a direct
relationship and increased in power when a bachelor's degree had been achieved.
Subsequently, the results corresponded to that of Turnamian’s (2012). The research
conducted in this study further demonstrated the significance and influence that receiving
a four-year college degree has on student performance on standardized assessments such
as the NJ ASK. While each independent variable (predictor) demonstrated significance
as it was analyzed alone, the R-square value became stronger as each new predictor was
added to the model.
General Conclusions 2012 NJASK Grade 8 for the Dependent Variable of
Mathematics
Similar to the general conclusions identified for Language Arts, the results of the

109
study for student outcomes on the 2012 Grade 8 Mathematics portion of the NJ ASK
were also significantly influenced by the three predictors of no high school, all people
under poverty, and employment status. While the R-square value explained 63.2% of the
variance among the three predictors and was not as strong as that of Language Arts with
an R-square value of 67.2%, it is important to note that student performance on
Mathematics was still strongly influenced by the three predictors. The R-square value
became stronger as each new predictor was added to the model. The statistically
significant variables combined to accurately predict the percentage of students scoring
proficient or advanced proficient in 89.2% of school districts in the Mathematics section
of the 2012 NJ ASK 8. Simply stated, this result is too powerful to be ignored by
policymakers and educational leaders.
Recommendations for Policy and Practice
The New Jersey Assessment of Skills and Knowledge (NJ ASK), the Partnership
for the Assessment of College and Career Readiness (PARCC), the Scholastic Aptitude
Test (SAT), and other forms of standardized assessment used to measure student
academic proficiency and teacher effectiveness are not going away; they simply evolve as
they continue to align to the Common Core Standards. Studies have been conducted that
could help inform policymakers, educational leaders, and the general public about the
connections that exist between community demographic factors and student test results
on standardized assessments. This is not simply a phenomenon. Tienken and Orlich
(2013) indicate that poverty is the largest predictor of ultimate academic achievement on
traditional standardized tests in this country. Therefore, it would seem plausible that
those in power should account for those factors when tying teacher evaluation to student

110
performance on state assessments.
A recommendation for policymakers and educational leaders would be to
investigate professional development opportunities for staff in school districts where
poverty is pervasive in order to nurture the capacity to lead in students and empower
them to take greater ownership of their learning. Future studies might be conducted to
follow a cohort of students in these districts to determine the effectiveness of such
implementation. In addition, policymakers must recognize that education is not “one-
size-fits-all.” Rather, policymakers should acknowledge the unique context of individual
schools and urge educators and the students who attend their schools to engage in self-
assessment, reflection, and coordinated action to learn together and lead together (Budge
& Parrett, 2012). A collaborative approach must be fostered in order for a measurable
level of success to be realized. Tienken and Orlich (2013) remarked that there was a
“disconnect between a public school system charged with the development of innovative
thinking, creative thinking, strategizing, and problem-solving and a public education
system being directed and managed through policies based on control and predictable
output” (Tienken & Orlich, p. 39).
The common denominator in this equation is children. If our policymakers truly
want to effectuate change with student results on standardized assessments, then they
must be willing to collaborate with the certified and qualified professionals in the field in
order to do so. The flaws that exist with the current system cannot be ignored.
Developing programs for students living in poverty that provide for early intervention
may be an essential part of this process. The pre-adolescent years are the most formative
years for a child’s educational development and could be the root of academic success in
111
subsequent years. School districts should investigate the merits of devoting greater
resources to the earlier grades for students in kindergarten and pre-school. Because
achievement gaps are self-perpetuating, the earlier schools can intervene to reduce the
achievement gap, the more effective schools will be in closing the gap in the long run
(Reardon, 2013). These early childhood education policies and interventions might help
to promote the social, emotional, and cognitive development necessary to narrow the
economic achievement gap and foster a greater appreciation in students about the value
of education.
The value of rearing children in a household that is marked by stability and
security cannot be undervalued. Therefore, a recommendation for future policy might be
to have our legislators work within the public domain with community and education
leaders to create policies that will help alleviate the economic inequalities that exist
locally in school districts where students consistently underperform. Help those in
poverty to nurture a stable household that is fostered in safe, secure neighborhoods.
Provide opportunity at the local community colleges for those parents without high
school diplomas to participate in preparation courses that will enable them to obtain the
requisite knowledge necessary to pass the General Educational Development (GED)
battery of tests in order to secure the alternative high school diploma equivalent.
Policymakers and education leaders could work to improve the quality of
resources that students have available to them, including teaching staff, school resources,
and curriculum that is both cognitively stimulating and relevant to students of today as
21st century learners. Reardon noted that school districts today have become more
residentially segregated by income than they have been over the last four decades
112
(Reardon, 2013). School leaders can deal with this challenge by promoting an
educational system that addresses socioeconomic diversity. School leaders must present
teaching staff with meaningful professional development opportunities that assist them in
working with parents from underprivileged backgrounds. School leaders and teaching
staff can then use lessons learned from such professional development to create
informational parent forums that address specific strategies that will help parents to work
with their children at home as a means of teaching and re-teaching concepts that are
articulated to their children while they are at school. The gap in these bridges must be
closed if children are to work to achieve a greater degree of success on standardized
assessment in spite of the community demographic factors that could prohibit their
achievement.
Recommendations for Future Research
The analysis of the data presented in this study provided information that sought
to answer three main research questions. However, it is important to note that further
examination might extend that which is included in this body of research. As a result, the
following recommendations for future research are proposed:
• The 2014-15 school year introduced a new set of state assessments called the
Partnership for the Assessment of College and Career Readiness (PARCC) as
the NJ ASK was phased out. Conduct a similar study using data generated
from PARCC to test the influence of the predictors identified in this study in
order to determine if the theoretical framework explains the greatest variance
in test scores.
• Conduct a similar study using NJ ASK scores during a three-year period to

113
determine if a correlation exists over a greater time frame.
• Conduct a study where students are grouped by the three main predictors from
Model 3 of this study that served as the independent variables to test the
reliability of this study and to note the differences that might exist in student
achievement levels.
• Conduct a study to determine if a correlation exists between student marking
period averages and their performance on the NJ ASK.
• Conduct a study to determine effective interventions for students influenced
by the community demographic variables found to explain significant
variance in NJ ASK 8 scores.
• Conduct a similar study that follows the cohort of students in middle school
from Grades 6-8 and tracks the results of all New Jersey school districts on the
NJ ASK in successive years using the same construct.
• Conduct a similar study at the local level in an individual school to determine
if the variables that provided for the greatest amount of variance in NJ ASK
scores are consistent with those of this study.
• Conduct a similar study using student outcomes from standardized test results
in other states to see if the influence of community demographic data is
consistent with that from this study.
• Conduct a study to determine the effectiveness of professional development
pedagogical practices that is specifically geared to staff in school districts
where there are higher populations of economically disadvantaged students
and the impact on student results.

114
References
Aiken, W. M. (1942). The story of the Eight-Year Study. New York, NY:
Harper and Brothers.
Allan, S. (1991, March). Grouping and the gifted ability-grouping research reviews:
What do they say about grouping and the gifted? Educational Leadership, 48.
American Educational Research Association, American Psychological Association,
and National Council on Measurement in Education. (1999). Standards for
educational and psychological testing. Washington, DC: Author.
Amrein, A. L., & Berliner, D. C. (2002a). The impact of high-stakes tests on student
academic performance: An analysis of NAEP results in states with high-
stakes tests and ACT, SAT, and AP test results in states with high school
graduation exams. Tempe, AZ: Education Policy Studies Laboratory,
Arizona State University.
Amrein, A. L. & Berliner, D. C. (2002b). High-stakes testing, uncertainty, and
student learning. Education Policy Analysis Archives, 10(18).
Amrein, A. L., & Berliner, D. C. (2003). The effects of high-stakes testing on student
motivation and learning. Educational Leadership, 60(5), 32-38.

115
Barnes, W. (2013). College readiness is not one-size-fits-all. Current Issues in
Education, 16(1), 1-7.
Berliner, D. C. (2006). Our impoverished view of educational research. Teachers
College Record, 108(6), 949-995.
Berliner, D. C. (2011). Rational responses to high-stakes testing: The case of curriculum
narrowing and the harm that follows. Cambridge Journal of Education, 41(3),
287-302.
Berliner, D. C., Glass, G., Nichols, S. (2005, September). High stakes testing and student
achievement: Problems for the No Child Left Behind Act. East Lansing, MI:
Great Lakes Center for Education Research and Practice.
Bloom, B., Engelhart, M., Furst, E., Hill, W. H., & Krathwohl, D. R. (1956). Taxonomy
of educational objectives: The classification of educational goals. Handbook I:
Cognitive domain. New York, NY: David McKay Company.
Bolon, C. (2001,). Significance of test-based ratings for metropolitan Boston
schools. Education Policy Analysis Archives, 9(42). Retrieved from
http://epaa.asu.edu/epaa/v9n42/
Boote, D., & Beile, P. (2005). Scholars before researchers: On the centrality of the
dissertation literature review in research preparation. Educational Researcher,
34(6), 3-15.
Bower, H., & Powers, J. (2009). What is rigor? A qualitative analysis of one school’s
definition. Academic Leadership Live: The Online Journal, 7(4). Retrieved from
http://www. academicleadership.org/article/What_is_Rigor_

116
A_Qualitative_Analysis_ of_One_School_s_Definition
Brunner, J. (2012). Now I get it: Differentiate, engage, and read for deeper
meaning. Lanham, MD: Rowman and Littlefield Publishers.
Budge, K., & Parrett, W. (2012). Turning high poverty schools into high performing
schools. Alexandria, VA: ASCD.
Carnoy, M., & Loeb, S. (2002). Does external accountability affect student
outcomes? A cross-state analysis. Educational Evaluation and Policy
Analysis, 24, 305–331.
Chomsky, N. (1999). Profit over people. New York, NY: Seven Stories Press.
Clarke, M., Shore, A., Rhoades, K., Abrams, L., & Li, J. (2003). Perceived effects of state
mandated testing programs on teaching and learning: Findings from interviews
with educators in low, medium, and high stakes states. Chestnut Hill, MA:
Boston College, Lynch School of Education.
Coleman, J. S. (1966). Equality of educational opportunity. Ann Arbor, MI: Inter-
University Consortium for Political and Social Research.doi:
10.3886IICPSR06389.v3
Cronbach LJ (1970). Essentials of psychological testing. New York, NY: Harper & Row.
Davey, L. (1992). The case for a national testing system. ERIC Clearinghouse on Tests.
Measurement, and Evaluation. Retrieved from Eric database. (ED410239)
Davis-Kean, P. (2005). The influence of parent education and family income on
child achievement: The indirect role of parental expectations and the home
environment. Journal of Family Psychology, 19(2), 294-304.

117
Dewey, J. (1902). The child and the curriculum. Chicago, IL: University of Chicago
Press.
Dewey, J. (1997). Experience and education. New York, NY: Touchstone.
Dewey, J. (1938). Experience and education. New York, NY: Kappa Delta Pi.
Finn, C. E., & Ravitch, D. (2007). Not by geeks alone. The Education Gadfly, 7, 30.
Retrieved from http://www.edexcellence.net/gadfly/index.cfm?issue=302/1 a3539
See also The Wall Street Journal, Commentary, August 8, 2007, p. A13.
Flattau, P. E., Bracken, J., Van Atta, R., Bandeh-Ahmadi, A., de la Cruz, R., &
Sullivan, K. (2006). The National Defense Education Act of 1958: Selected
outcomes. Washington, DC: Science and Technology Policy Institute.
Freire, P. (1975). Pedagogy of the oppressed. New York, NY: Academic Press.
Gay, L., Mills, P., & Airasian, P. (2009). Education research: Competencies for analysis
and applications (9th ed.). Upper Saddle River, NJ: Pearson Education
International.
Gluckman, A. (2012, January-February). Testing…testing…one, two, three: The
commercial side of the standardized testing boom. Dollars & Sense, 239, 32-37.
Grimm, J. (2008). Closing the achievement gap: The Zenith case study (Doctoral
dissertation). Retrieved from www.googlescholar.com
Hart, C. (1999). Doing a literature review: Releasing the social science research
imagination. London: SAGE.
Hemphill, F. C., & Vanneman, A. (2010). Achievement gaps: How Hispanic and White
students in public schools perform in mathematics and reading on the National
Assessment of Educational Progress. Washington, DC: National Center for Education Statistics, Institute of Education Sciences.

118
Heubert, J., & Hauser, R. (1999). High stakes: Testing for tracking, promotion and
graduation. Washington, DC: National Academies Press.
Hirsch, E. D. (1996). The schools we need and why we don’t have them.
New York, NY: Doubleday Publishing.
Johnson, B. (2001). Toward a new classification of nonexperimental quantitative
research. Educational Researcher, 30(2), 3-13.
Jones, M. (2008, May). The influence of variables on school report cards regarding the
passing rates for students taking the high school proficiency assessment (HSPA)
in New Jersey comprehensive high schools (Doctoral dissertation). Retrieved
from http://gradworks.umi.comJ33/19/3319531.html
Kohn, A. (1999). The schools our children deserve: Moving beyond traditional
classrooms and “tougher standards.” New York, NY: Houghton Mifflin
Company.
Kohn, A. (2000). The case against standardized testing: Raising the scores, ruining the
schools. Portsmouth, NH: Heinemann.
Koretz, D. (2008). Measuring up: What educational testing really tells us. Cambridge,
MA: Harvard University Press.
Leithwood, K. (2001). School leadership and educational accountability.
International Journal of Educational Leadership, 3(4), 217-237.
Madaus, G. (1999). Issues in curriculum. Chicago, IL: University of Chicago Press.
Manna, P., & Kelley, K. (2012). Redefining the federal role in education. Education
Week, 32(10), 28.
Marder, M. (2011). Visualizing educational data. Retrieved from uteach.utexas.edu

119
Marder, M. (2014). Classroom observation and value-added models give
complementary information about quality of mathematics teaching.
San Francisco, CA: Jossey-Bass.
Marsh, H., & Hau, K. (2003). Big Fish Little Pond effect on academic self-concept:
A cross-culture test of the negative effects of academically selective
schools. American Psychologist, 58(5), 364-376.
Marzano, R., Waters, T., & McNulty, B. (2005). School leadership that works: From
research to results. Alexandria, VA: ASCD.
Maylone, N. (2002). The relationship of socioeconomic factors and district scores on
the Michigan educational assessment program tests: An analysis (Unpublished
doctoral dissertation). Eastern Michigan University, Ypsilanti, MI.
Mehrens, W. (1998). Consequences of assessment: What is the evidence? Education
Policy Analysis Archives, 6(13). Retrieved from http://olam.ed.asu.edu/
epaa/v6n13.html
Moses, M., & Nanna, M. (2007). The testing culture and the persistence of high stakes
testing reforms. Education and Culture, 23(1), 55-72.
National Center for Education Statistics. (2006). The condition of education 2006.
Washington, DC: Author.
New Jersey Department of Education. (2009a). Grades 3 and 4 New Jersey assessment
of skills and knowledge: Technical report. Trenton, NJ: Author.
New Jersey Department of Education. (2009b). NJ ASK 2009 score interpretation
manual. Trenton, NJ: Author.
New Jersey Department of Education. (2010). District factor groups (DFGs) for school
districts. Retrieved from www.nj.state.us

120
New Jersey Department of Education. (2011). Grade 8 New Jersey Assessment
of Skills and Knowledge, Spring 2011. Retrieved from http://www.nj.gov/education/schools/achievement/2012/njask8
New Jersey Department of Education. (2013a). AchieveNJ: Resources guide. Retrieved
from www.state.nj.us/education/AchieveNJ/
New Jersey Department of Education. (2013b). School performance report. Trenton,
NJ: Author. Retrieved from www.state.nj.us/njded/
Nichols, S., & Berliner, D. (2008). Collateral damage: How high stakes testing
corrupts America’s schools. Cambridge, MA: Harvard Education Press.
Oakes, J. (1985). Keeping track: How schools structure inequality. New Haven, CT:
Yale University Press.
Partnership for Assessment of Readiness for College and Careers (PARCC). (2013).
Retrieved from www.parcconline.org
Pereira, M. (2011). The influence of student and school variables on student
performance on the New Jersey Assessment of Skills and Knowledge in
Grade 8 (Doctoral dissertation). Retrieved from Seton Hall University
Dissertations and Theses (ETDs). Paper 1632.
Ravitch, D. (2010). The death and life of the great American school system: How testing
and choice are undermining education. New York, NY: Basic Books.
Reardon, S. (2013). The widening income achievement gap. Education Leadership,
70(8), 10-16.
Roderick, M., & Nagaoka, J. (2005). Retention under Chicago’s high-stakes testing
program: Helpful, harmful, or harmless?” Educational Evaluation and

121
Policy Analysis, 27(4), 309-40.
Rosenshine, B. (2003). High-stakes testing: Another analysis. Education Policy
Analysis Archives, 11(24), 4.
Russell, M., & Haney, W. (2000). The gap between technology and testing in schools.
National Board on Educational Testing and Public Policy, 1(2), 1-7. Retrieved
from www.bc.edu/research/nbetpp/statements/nbr1.pdf
Stone, C., & Lane, S. (2003). Consequences of state accountability programs: Examining
relationships between school performance gains and teacher, student and school
variables. Applied Measurement in Education, 16(1), 1-26
Strong, E. (1918). Work on the committee of classification of personnel in the army.
Journal of Applied Psychology, 2(2), 130-139.
Tanner, D., & Tanner, L. (2007). Curriculum development: Theory into practice.
Upper Saddle River, NJ: Prentice Hall.
Thorndike, E. L. (1911). Animal intelligence: Experimental studies. New Brunswick,
NJ: Transaction Publishers.
Tienken, C. (2008). Rankings of international achievement test performance and
economic strength: Correlation or conjecture. International Journal of
Education Policy and Leadership, 3(4): 1-15.
Tienken, C., & Orlich, D. (2013). The school reform landscape: Fraud, myths, and
lies. Lanham, MD: Rowman and Littlefield Publishers.
Tienken, C., & Zhao, Y. (2010). Common core national curriculum standards: More
Questions . . . and answers. American Association of School Administrators
Journal of Scholarship and Practice, 6(4), 3-11.
Turnamian, P. (2012). The value of NJ school district demographic data in
122
explaining school district NJ ASK grade 3 language arts and mathematics
scores (Doctoral dissertation). Retrieved from Seton Hall University
Dissertations and Theses (ETDs). Paper 1778. .
Tyler, R. (1950). Basic principles of curriculum and instruction. Chicago, IL:
University of Chicago Press.
U.S. Census Bureau. (2010). American factfinder. Retrieved from
http://www.factfinder.census.gov/history/www/programs/demographic/decennial
census.html
U. S. Department of Education. (1983). A nation at risk: The imperative for educational
reform. Retrieved from www.ed.gov.pubsNatATRisk.index.html
U. S. Department of Education. (1992, June). National assessment of the Chapter 1
program: The interim report. Washington, DC: Author.
U. S. Department of Education. (2002). No Child Left Behind: A desktop reference.
Jessup, MD: Education Publications Center.
U.S. Department of Education. (2009). Race to the Top. Retrieved from
www2.ed.gov/programs/racetothetop/index.html
Wong, M., & Watkins, D. (2001). Self-esteem and ability grouping: A Hong Kong
investigation of the big fish little pond effect. Educational Psychology, 21
(1), 79-87.
Zhao, Y. (2009a). Catching up or leading the way: American education in the age
of globalization. Alexandria, VA: ASCD.
Zhao, Y. (2009b). Comments on common core standards initiative. American
Association of School Administrators Journal of Scholarship and Practice,
6(3), 46-54.

123