Embed Size (px)
Citation preview

An analysis of the monitoring and evaluation system of the Public Service
Commission
MJ Motaung
Orcid.org/0000-0002-5976-8394
Mini-dissertation submitted in partial fulfilment of the requirements for the degree Master of Business
Administration at the North-West University
Supervisor: Prof RA Lotriet
Graduation: May 2018
Student number: 16331818

i
DECLARATION
I, the undersigned, hereby declare that the work contained in this mini-dissertation is my own
original work and has not been, previously in its entirety or part, been submitted at any
university for a degree.
Signature: _________________________________
Date: _____________________________________

ii
ACKNOWLEDGEMENTS
I would like to thank the following people from the bottom of my heart who made a
valuable contribution to this research being completed:
My supervisor, Professor R.A. Lotriet, who believed in what I wanted to do. He allowed me
to develop the original idea I had for research without imposing his ideas on me. I had an
opportunity of being extremely innovative and to grow tremendously during my research
process. His patience in guiding me to the level of excellence in conducting research is
unequalled. To him I say: Thank you for believing in me!
To my late parents, Aaron and Nelly Lenkwe for the initial sacrifice they made to get me to
university. Your belief in the power of education to change a person’s life has paid off. As a
result of your motivation and continuous belief in my ability to make it, I will wear my
newfound title with pride. The memories of my aunt, Dora Lenkwe, as a woman who wanted
the best for me, will always live with me.
A special word of thanks to the Office of the Public Service Commission (OPSC), in
particular the Director General, Dr D Mamphiswana, who granted me permission to do this
study, as well as the staff of branch M&E (monitoring and evaluation). Without them, this
study would not be possible.
To my fellow MBA students who acted as “critical advisors” and participated in the pilot
testing of the research instruments. Without their contribution this study would not be
comprehensive.
To my children, Tshepo and Palesa, for the encouragement they gave me to complete this
degree.
I also wish to thank my language editor, Rentia Mynhardt of SA Translator’s Institute (SATI)
who painstakingly took time to edit this document for language

iii
ABSTRACT
To design the monitoring and evaluation (M&E) system there are ten steps to be followed.
These ten steps are advocated for by the World Bank, pioneers in the field of M&E. This study is
qualitative in nature, addressing explanatory research perspectives. It focuses on the analysis
of the M&E system of the Public Service Commission (PSC) or the “Commission” in South
Africa. The central question it seeks to address is: How is the new PSC’s M&E system
designed, and more specifically, were the ten steps for designing the M&E system adhered to?
If not, what were the challenges and what can be done to improve it? The study therefore seeks
to engage with the discourse of theory and practice by determining if applicable procedures,
principles and best practices in designing the M&E system are used. The overall goal of this
study is to provide useful analytical feedback to M&E practitioners within the PSC; key
stakeholders and national and provincial departments on the status of the current M&E system
used by the PSC.
A total of 200 participants provided their views and opinions on the PSC’s M&E system. The
data was obtained from focus group discussions, non-participant/participant observations of
various meetings, workshops and the guest lecture and qualitative content analysis. The results
indicate that the PSC’s M&E system was properly designed, as there was an attempt to
replicate what the World Bank advocates for regarding the design of the M&E system. However,
although it is expected of the PSC to monitor compliance with constitutional values and
principles (CVPs) on an annual basis and to report to the National Assembly on its activities, the
PSC’s M&E system is found lacking as it mainly focuses on compliance monitoring and
development of indicators at an outcome and impact level. The other weaknesses of the PSC’s
M&E system relate to the legislative overlap (mandate creep) and lack of promotional activities
regarding CVPs. To improve on the system the PSC needs to develop interim norms and
standards for compliance with CVPs, whilst waiting for the process to be completed by the duly
elected Department of Public Service Administration (DPSA). There should also be a robust
programme of promotion of CVPs as departments (nationally and provincially) need to know
what CVPs are and what to do to comply with them.
Key terms: monitoring; evaluation; transversal M&E

iv
LIST OF ABBREVIATIONS
ACF International Action Contre La Faim
ADRI Act, Do (Deploy), Review and Improve
ARC Annual Report to Citizens
BEE Business Enabling Environment
CD Chief Director
CVPs Constitutional Values and Principles
D Director
DDG Deputy Director General
DG Director General
DID Department of International Development
DPME Department of Planning Monitoring and Evaluation
DPSA Department of Public Service Administration
FGD Focus Group Discussion
FIAS Foreign Investment Advisory Services
ICAD Institute of Community and Area Development
IFAD International Fund for Agricultural Development
IFC International Finance Corporation
IFRC International Federation of Red Cross
LF Logical Framework or Log-Frame
M&E Monitoring and Evaluation
MRS code Market Research Society code
NEPF National Environment Protection Fund
NT National Treasury
OM Outcome Mapping
OPSC Office of the Public Service Commission
PD Provincial Directors
PFMA Public Finance Management Act, 1, as amended by Act 29 of
1999
PE Programme Evaluation
PI Principal Investigator
PSC Public Service Commission
PSM&ES Public Service Monitoring & Evaluation System
SABS South African Bureau of Standards
SMART Simple, Measurable, Attainable, Reliable and Timely

v
SMS Senior Management Service
SMT Senior Management Team
SOPS State of the Public Service reports
TOC Theory of Change
WB World Bank

vi
TABLE OF CONTENTS
DECLARATION ............................................................ ERROR! BOOKMARK NOT DEFINED.
ACKNOWLEDGEMENTS ......................................................................................................... II
ABSTRACT ............................................................................................................................. III
LIST OF ABBREVIATIONS ..................................................................................................... IV
CHAPTER 1: NATURE AND SCOPE OF THE STUDY ......................................................... 1
1.1 INTRODUCTION ................................................................................................ 1
1.2 PROBLEM STATEMENT ................................................................................... 3
1.3 OBJECTIVES OF THE STUDY .......................................................................... 5
1.3.1 Primary objective ................................................................................................ 5
1.4 SECONDARY OBJECTIVES ............................................................................. 5
1.5 CONCEPTUAL FRAMEWORK .......................................................................... 5
1.6 SCOPE OF THE STUDY .................................................................................... 5
1.7 RESEARCH METHODOLOGY .......................................................................... 6
1.7.1 Research approach ............................................................................................ 6
1.7.2 Site selection, description of participants and sampling ...................................... 8
1.7.3 Data collection approach .................................................................................. 10
1.7.4 Data analysis .................................................................................................... 11
1.8 SIGNIFICANCE OF THE STUDY ..................................................................... 11
1.9 ETHICAL CONSIDERATIONS ......................................................................... 12
1.10 LIMITATIONS OF THE STUDY ........................................................................ 14
1.11 DEFINITION OF TERMS .................................................................................. 14
1.12 LAYOUT OF THE STUDY ................................................................................ 15

vii
CHAPTER 2: LITERATURE REVIEW ................................................................................. 17
2.1 INTRODUCTION .............................................................................................. 17
2.2 THE ORGANISATIONAL STRUCTURE OF THE PSC .................................... 17
2.3 THE ROLE OF BRANCH M&E ........................................................................ 19
2.4 THE HISTORY OF M&E IN THE PSC .............................................................. 21
2.5 KEY FEATURES OF THE PSC’s M&E SYSTEM FROM 1996 TO 2012 .......... 23
2.6 PROCESS OF DEVELOPMENT OF THE OLD M&E SYSTEM........................ 23
2.7 THE USE OF THE “GOVERNANCE SCORECARD” ...................................... 24
2.8 THE M&E ASSESSMENT TOOLS ................................................................... 25
2.9 M&E IN THE AFRICAN CONTINENT .............................................................. 25
2.9.1 M&E system in the Republic of Benin ............................................................... 26
2.9.2 M&E system in the Republic of Uganda ............................................................ 26
2.9.3 M&E system in the Republic of South Africa ..................................................... 27
2.10 M&E SYSTEMS INTERNATIONALLY ............................................................. 28
2.11 ELEMENTS FOR DESIGNING AN EFFECTIVE M&E SYSTEM ...................... 29
2.11.1 Step 1: conducting a readiness assessment ..................................................... 29
2.11.2 Step 2: agreeing on outcomes to monitor and evaluate .................................... 29
2.11.3 Step 3: selecting key performance indicators to monitor outcomes ................... 30
2.11.4 Step 4: setting baselines and gathering data on indicators ............................... 31
2.11.5 Step 5: planning for improvement – selecting results targets ............................ 31
2.11.6 Step 6: monitoring of results ............................................................................. 31
2.11.7 Step 7: using evaluation information ................................................................. 32
2.11.8 Step 8: reporting the findings ............................................................................ 33

viii
2.11.9 Step 9: using the findings ................................................................................. 34
2.11.10 Step 10: sustaining the M&E system within the organisation ............................ 34
2.12 THEORY OF CHANGE (TOC) ......................................................................... 35
2.13 IDENTIFIED KNOWLEDGE ROLES AND FUNCTIONS .................................. 35
2.14 CLEAR M&E PURPOSE .................................................................................. 36
2.15 RELEVANCE ................................................................................................... 36
2.16 CONCLUSION ................................................................................................. 37
CHAPTER 3: EMPIRICAL INVESTIGATION ...................................................................... 38
3.1 INTRODUCTION .............................................................................................. 38
3.2 DATA COLLECTION ....................................................................................... 38
3.2.1 Focus group discussions with key stakeholders ................................................ 38
3.2.2 Focus group discussions on norms and standards ........................................... 40
3.3 NON-PARTICIPANT/PARTICIPANT OBSERVATIONAL TOOL ..................... 40
3.4 QUALITATIVE CONTENT ANALYSIS ............................................................. 40
3.5 INSTRUMENTS AND TECHNIQUES FOR DATA COLLECTION .................... 45
3.6 RESULTS AND DISCUSSION ......................................................................... 45
3.6.1 Profile of the respondents ................................................................................. 45
3.7 RESULTS ......................................................................................................... 45
3.7.2 Agreeing on outcomes to monitor and evaluate ................................................ 52
3.7.3 Selecting key indicators to monitor and evaluate .............................................. 52
3.7.4 Baseline data on indicators ............................................................................... 53
3.7.5 Selecting result targets ..................................................................................... 53

ix
3.7.6 Monitoring for results ........................................................................................ 54
3.7.7 The role of evaluations ..................................................................................... 54
3.7.8 Reporting findings ............................................................................................. 55
3.7.9 Using findings ................................................................................................... 55
3.7.10 Sustaining the M&E system .............................................................................. 56
3.8 RESULTS ON WHAT THE CHALLENGES EXPERIENCED WERE
DURING THE DESIGN PROCESS .................................................................. 56
3.9 SUMMARY ....................................................................................................... 57
CHAPTER 4: CONCLUSION AND RECOMMENDATIONS ................................................. 58
4.1 INTRODUCTION .............................................................................................. 58
4.2 CONCLUSIONS AND RECOMMENDATIONS ................................................. 58
4.2.1 State of readiness to conduct M&E activities .................................................... 58
4.2.2 Agreeing on outcomes to monitor and evaluate ................................................ 60
4.2.3 Selecting key indicators to monitor and evaluate .............................................. 61
4.2.4 Baseline data on indicators ............................................................................... 61
4.2.5 Selecting results targets ................................................................................... 62
4.2.6 Monitoring for results ........................................................................................ 62
4.2.7 The role of evaluations ..................................................................................... 62
4.2.8 Reporting findings ............................................................................................. 63
4.2.9 Using findings ................................................................................................... 63
4.2.10 Sustaining the M&E system within the PSC ...................................................... 64
4.3 ACHIEVEMENTS OF THE OBJECTIVES OF THE STUDY ............................. 64
4.4 RECOMMENDATIONS FOR FUTURE STUDY ................................................ 64

x
4.5 SUMMARY ....................................................................................................... 64
LIST OF REFERENCES ......................................................................................................... 66
ANNEXURE 1: ORIGINAL COPY OF THE M&E SYSTEM .................................................. 70
ANNEXURE 2: THE NEW M&E SYSTEM ............................................................................ 72
ANNEXURE 3: THE NON-PARTICIPANT/PARTICIPANT OBSERVATION TOOL ............. 73
ANNEXURE 4: THE PLAN FOR ENGAGEMENTS WITH KEY STAKEHOLDERS ............. 74
ANNEXURE 5: A SHORTENED VERSION OF THE PSCS M&E FRAMEWORK ................ 75
ANNEXURE 6: A TEMPLATE USED TO CAPTURE FOCUS GROUP DISCUSSIONS ....... 77
ANNEXURE 7: INTERVIEW SCHEDULE USED FOCUS GROUP DISCUSSIONS ............. 78
ANNEXURE 8: A COPY OF THE LETTER OF APPROVAL TO CONDUCT THE
STUDY IN THE PSC ............................................................................................................... 79
ANNEXURE 9: LETTER FROM LANGUAGE EDITOR .......................................................... 81

xi
LIST OF TABLES
Table 1-1: How to operationalise the ADRI cycle ............................................................ 5
Table 1-2: Description of participants and the estimated sample ..................................... 8
Table 1-3: List of documents to be analysed ................................................................... 9
Table 2-1: How the PSC unpacked its constitutional mandate ...................................... 19
Table 2-2: Rating scale consisting of five performance bands ....................................... 22
Table 2-3: Ranking of departments ............................................................................... 23
Table 2-4: Indicator / criteria and standards .................................................................. 24
Table 2-5: M&E component and tools used in Uganda ................................................. 27
Table 2-6: Developing outcome statements .................................................................. 30
Table 2-7: Common types of monitoring ....................................................................... 31
Table 2-8: Summary of types of evaluations ................................................................. 32
Table 3-1: Governance Monitoring’s strategic mandate ................................................ 43

xii
LIST OF FIGURES
Figure 2-1: A single PSC ................................................................................................ 17
Figure 2-2: Organisational structure of the OPSC .......................................................... 18
Figure 2-3: Flowchart of the M&E process...................................................................... 22
Figure 2-4: The place of M&E in the logic model ............................................................ 36

1
CHAPTER 1: NATURE AND SCOPE OF THE STUDY
1.1 INTRODUCTION
This study is qualitative in nature, addressing explanatory research perspectives. It focuses on
the analysis of the monitoring and evaluation (M&E) system of the Public Service Commission
(PSC) or the “Commission” in South Africa. The central question it seeks to address is were the
ten steps of designing the M&E system advocated for by the World Bank (WB) followed in
designing the PSC’s M&E. If not, what are the challenges and what can be done to improve it?
The study therefore seeks to engage with the discourse of theory and practice by determining if
applicable procedures, principles and best practices in designing the M&E system are used.
The overall goal of this study is to provide useful analytical feedback to M&E practitioners within
the PSC; key stakeholders and national and provincial departments on the status of the current
M&E system used by the PSC.
The mandate of the Commission comes from Sections 195 and 196 of the Constitution of the
Republic of South Africa, 1996. The PSC made its constitutional mandate functional in 1996,
using the nine values and principles of public administration enshrined in Section 195. The nine
values and principles define “good governance” and are used to execute the PSC’s oversight
function in relation to government departmental performance. The M&E branch was established
to conceptualise and give effect to Section 194(4) (a) and (b), which states that the Commission
shall promote the constitutionally prescribed values and principles governing public
administration in the public service, enshrined in Section 195, report on its activities and the
performance of its functions and evaluate the extent to which the constitutional values and
principles (CVPs) are complied with (PSC News, 2012: 3).
The M&E system in the PSC started in 2001. It was referred to as the Transversal M&E system.
With Transversal M&E system it means that since the public sector is made up of over 150
departments, the system was implemented across national and provincial spheres of
government. The system allowed for comparisons in performance and enabled the sharing of
best practices (PSC News, 2012:5-6). The PSC had in 2001 developed its organisational
structure around the following focal areas: integrity and anti-corruption; performance and
evaluation of senior management leadership; human resources policy and practices reviews;
departmental performance; service delivery assessments and compliance evaluations and
grievance management. The Transversal M&E system also meant that all the organisational
structures of the PSC were involved in M&E activities in one way or the other.

2
The missing element, which impacted negatively on the effectiveness of the methodology used
by the PSC, was the lack of a developmental plan to address shortcomings identified and a
follow-up on the implementation of the plan. It was seen as impractical due to budgetary
constraints for M&E activities in the PSC. The PSC changed this methodology which was not
robust enough, in 2005/2006, and this led to a decline in performance (the performance of
departments increased incrementally from 20% to 56% in 2008/2009 and then fell back to 55%
for the 2009/2010 and 2010/2011), due to stricter measures. This M&E system used in the first
decade of implementation was plagued with huge challenges, which were documented as
follows (Naidoo & Henning in PSC News, 2012:11-12):
The system was placing much more emphasis on compliance. It was recommended that the
right balance be struck between service delivery performance and governance indicators.
The methodology used was not always robust enough, as the PSC mainly relied on
responses from government departmental managers interviewed.
Data was always not accessible and reliable, as there was total reliance on data from
government departments.
The system treated all departments the same, with the result that indicators were not always
appropriate in relation to the distinct roles of departments. Some government departments
did extremely well on the PSC’s scorecard. However, the media continued to report poor
performance and service delivery by government departments. In actual fact some of the
government departments that “performed well” according to the PSC were cited in media
reports. Delivery oriented sectors such as health, housing, agriculture and education
introduced mandatory core performance reporting measures. These reporting requirements
needed to be incorporated into the framework where appropriate, hence the gap.
Naidoo and Henning (PSC News, 2012), who were employees of the PSC then, further
indicated that the PSC needed to be careful in choosing performance indicators (PIs). They said
valid, accurate and reliable M&E findings are of no value without a constructive relationship
between government departments being assessed and the agency doing it. During this era
there was no consultation done with the government departments on the indicators and how
they are going to be assessed.
Also, M&E practitioners needed the technical expertise, such as being able to develop M&E
indicators that met the SMART (Simple, Measurable, Attainable, Reliable and Timely)
requirements. They also needed to be able to develop questionnaires and interview schedules,
for instance, based on acceptable standards. Apart from development of acceptable data

3
collection instruments, they needed to be able to use proper techniques in administering them
too.
From the PSC’s perspective, through M&E activities undertaken, there has been an
entrenchment of democracy. The evaluation work increased transparency and accountability
and citizens were kept informed about government’s performance through the Annual Report to
Citizens (ARC). However, of note, the M&E tool, commonly called the barometer was
discontinued in 2012 to allow for its review, which also saw the non-publication of the SOPS
reports, which were tabled in parliament, for reasons alluded to above.
1.2 PROBLEM STATEMENT
It has been about five years since the M&E tool (barometer) was discontinued, which means
that there has not been any formal evaluation of government performance on compliance with
CVPs as required by the PSC’s constitutional mandate. The discontinuation emanated from a
general dissatisfaction from government departments with the way the PSC was conducting its
M&E activities. Central to the dissatisfaction was the fact that there was no promotion of the
CVPs as required by the constitutional mandate.
Ijeoma (2014:202), on the ten steps to a result-based M&E system, advocates for striking an
agreement with relevant parties on outcomes to be used for monitoring and evaluation. Since
the promotion of CVPs was very weak, most government departments did not know what these
CVPs are and how the PSC intended to assess them for compliance. Also, they were not
consulted on performance indicators and the assessment tool and techniques to be used. In line
with acceptable assessment principles, the PSC was expected to be transparent about the
manner in which they want to assess government departments. The PSC’s system was viewed
as a top-down system (lacked buy-in) where government departments would only be told when
monitors and evaluators from the PSC would visit a particular government department to collect
information on the CVPs. The PSC as an oversight body did receive cooperation amidst the
silent discontent, as indicated by the SOPS which were published until 2011, which are based
on data from the departments.
The way the PSC went about determining compliance with CVPs could have easily been seen
as abuse of their powers, as they came across as being too imposing, tactless and policing over
being developmental. There was nothing done (no developmental plan) about the weak areas
identified during the M&E activities to assist government departments to improve, apart from
reflecting these weaknesses and challenges in the M&E reports and the SOPS. Other
challenges related to the level of expertise in conducting M&E activities are that monitors and

4
evaluators would go over prescribed questions to government departments as is, without
probing where necessary.
The most glaring anomaly with the M&E tool was the use of the zero score. For example, if a
particular government department was supposed to have a particular policy and it was not
approved yet, they would be given a zero. The use of the binary scale showed a lack of
understanding of assessment principles. A lot of government departments argued that, although
there might be no policy, their effort in developing it should be considered, which fell on deaf
ears. An interrogation of the database on M&E, reports and published information on the
evolution of the M&E system in the PSC show that there was:
A lack of transparency about the procedure and process of assessing compliance with
CVPs;
An ineffective system that did not accomplish much in terms of bringing the needed change
in government departments regarding compliance with CVPs and
The use of resources (human and financial), but having very little to show regarding impact
(PSC News, 2012).
The key issues mentioned above led to the old M&E system being seen as lacking effective
leadership and managerial skills on M&E, with specific reference to poor coordination of M&E
activities, control and collaboration. Departments were not properly engaged and feedback was
not given timeously, with the view towards improvement. Poor communication also
characterised this old M&E system. Needless to say that the PSC’s M&E system needs to get
(1) official recognition and (2) have “teeth” to bite as gatekeepers. Also, ideally, the cloud of
secrecy on what government departments are being evaluated on should be removed.
From the reports on M&E it is very clear that the concepts “monitoring and evaluation” were
used interchangeably, meaning that there was no clear distinction as to where monitoring
activities start and where evaluation activities need to start, considering the Logical Framework
argument, which will be explained in details in Chapter 2. The questions of interest in this study
are: where should critical changes in the PSC’s M&E system be made? How should the
identified changes be implemented? What kind of leadership in M&E is needed to drive the
change management process?

5
1.3 OBJECTIVES OF THE STUDY
1.1.1 Primary objective
The primary research objective for this study was to determine how the new PSC’s M&E system
was designed:
1.4 SECONDARY OBJECTIVES
The secondary research objectives of the study were:
How were the ten steps for designing the M&E system dealt with?
What were the challenges experienced during the design phase?
What can be done to improve the PSC’s M&E system to go forward?
1.5 CONCEPTUAL FRAMEWORK
The use of a planned and systematic approach to implementing the PSC’s M&E system, which
promotes self-reflection and external reference, is advocated for. The ADRI cycle for
improvement of the implementation process (Ile et al., 2012:21-32) is summed up in the table
below:
Table 1-1: How to operationalise the ADRI cycle
PLAN Development of an action plan, i.e. determine an Approach
ACT Implementation of the plan, i.e. Deployment
EVALUATE / MONITOR Determine progress against plan on an ongoing basis and effect changes / modifications when necessary; i.e. Review plan
IMPROVE Feedback of evaluation processes in order to generate Improvements
Source: Ile et al. (2012:21-32)
1.6 SCOPE OF THE STUDY
The study is about the PSC’s M&E system. The PSC is made up of the national office and nine
provincial offices. The M&E system is used on all national and provincial departments in South
Africa, which will be illustrated in Chapter 2. Although the PSC’s mandate includes the local
government (municipalities) to date and due to the lack of capacity, this sphere of government
has not been evaluated for compliance with CVPs. A total of twenty seven documents (reports)

6
will be analysed, participant observation schedule completed and reflective journal notes taken.
In addition reports from different consultative meetings with key departments such as National
Treasury (NT), The Presidency, DPME (Department of Planning, Monitoring and Evaluation)
and DPSA (Department of Public Service Administration) will be analysed to determine what
each key stakeholder had to say about the way the new M&E system should look like. There will
be over 200 participants involved in this study.
1.7 RESEARCH METHODOLOGY
1.1.2 Research approach
The general orientation to the conduct of this research is holistic and qualitative or descriptive
research (Welman et al., 2012:188; Creswell, 2013:43-48; Silverman, 2013:9-10). This research
approach emphasises words rather than numbers in the collection and analysis of data. It
adopts an inductive approach to the relationship between theory and research, in which the
emphasis is placed on generating rather than proving theories.
Qualitative research emphasises on the ways in which individuals interpret their social world. It
views social reality as constantly shifting and emergent, as interpreted by the individual
(insider’s view). Qualitative research on the other hand is the collection and analysis of primarily
non-numerical data (words, pictures and actions); a structured approach will be followed
(Bryman et al., 2016:31; Denzin & Lincoln, 2011:627; Welman et al., 2012:21; Creswell,
2013:47).
This study is posited within the critical realism epistemology, which recognises the reality of the
natural order, the events and discourses of the social world (Bryman et al., 2016:13). Critical
realism accepts that categories used to understand reality are likely to be provisional, not
permanent and theoretical terms are used to explain phenomena that are not directly
observable. What therefore makes critical realism critical is the prospect of introducing changes
that can transform the status quo. Furthermore the study will adopt constructivism as an
ontological stance. Constructivism asserts that social phenomena under scrutiny and their
meanings are being produced continually by social actors, individually and collectively, through
social interaction. This implies that reality is in a constant state of flux, is subjective and that
multiple realities exist (Welman et al., 2012:8-9).
The research involves an in-depth study of the review of the PSC’s M&E system. The intent is to
gain insight into the review process (Yin, 2014:221). A thorough examination of the current
legislative framework regarding compliance with CVPs will be done. Welman et al. (2012:112)
describe this type of case study as the explanatory case study where the researcher seeks to

7
derive a detailed understanding of a particular phenomenon. On the other hand Yin (2014:238)
says that an explanatory case study is the one which purpose is to explain how or why some
condition came to be (for example how or why some sequence of events occurred or did not
occur). This type of case study can also be a termed descriptive case study. In the context of
this study, the researcher will endeavour to find out whether the review process was followed to
the latter and what was discovered during the review process.
Although the relevance of reliability and validity for qualitative research has been questioned,
the researcher will strive to attain internal validity. Internal validity means whether or not there is
a good match between the researcher’s observations and the theoretical ideas developed or the
extent to which the available sources make it possible to rule out alternative explanations
(Bryman et al., 2016:43; Welman et al., 2012:190-191). To test the quality of the research
design of any empirical social research, the following must be done (Yin, 2014:45), which are
also relevant to case studies:
Pattern matching
Explanation building
Address rival explanations
Use logic models
A non-experimental design is appropriate when the phenomenon’s variables cannot be
separated from the context in which it operates and it is usually used as a research strategy in
many settings, more especially when the “how” and “why” questions are being posed, as well as
when the researcher has no control over the phenomenon being investigated (Creswell, 2014).
This study permits for “interpretation within context” (Gill & Johnson, 2010:148-149) and allows
for new insight obtained (refreshed theory) from the study to serve as “evidence-based
recommendations” for policy makers, programme implementers and other key stakeholders
(Binsardi, 2013:6).
Qualitative measures provide information on how people feel about a situation or about how
things are done. It may not necessarily be correct to say “quantitative information speaks for
itself”. Qualitative data requires just as much interpretation in order to make it meaningful, as
does quantitative data (Bryman et al., 2016). It may be a fact that government departments
scored 50 % and higher on compliance with CVPs, counting tells this, but it tells nothing about
why performance was at this level. In order to know that, one needs to conduct a
comprehensive literature review and empirical investigation to get to the bottom of this empirical

8
issue. The use of qualitative research is equally important in the sense that it emphasises the
importance of the value of subjective human interpretation in the evaluation process.
1.1.3 Site selection, description of participants and sampling
Since the team established to get buy-in to the “new” M&E system for the PSC is based at
national level, without representatives from the nine regional offices, the OPSC (Office of the
Public Service Commission) will be used as the site of investigation, where all the necessary
documents are generated and located. A non-probability sampling technique will be used;
specifically the purposive sampling seemed appropriate for this study (Creswell, 2013:156;
Leavy, 2014:541-542). The researcher used existing structures which will be documented,
platforms and essential meetings were held within the OPSC where deliberations regarding the
M&E system took place, to gather information (Bryman et al, 2016:178). A homogenous sample
using non-probability sampling techniques may give acceptable results if carefully planned and
controlled (Cooper et al., 2014:358-361). This procedure is mainly used for practical
considerations (time and cost) and a lot of information was obtained from various participants
from these targeted engagements.
A very small group of officials in branch M&E was tasked sometime in 2014 with the
responsibility of developing the M&E framework with indicators to monitor and evaluate. The
M&E framework would then be submitted and approved by the M&E specialist team which is
composed of commissioners and key members of branch M&E (see Annexure 1 for a copy of
the 2nd Research Guide and Assessment Questionnaire), as explained in detail in Chapter 2.
Directors and their individual teams would then be tasked with the responsibility of developing
assessment tools based on the indicators identified. Discussions and decisions on the new
M&E framework took place during different meetings, as indicated in Table 1-2 below:
Table 1-2: Description of participants and the estimated sample
No. Type of meeting Estimated number of participants
Estimated number of documents produced
1. Task team meetings to develop the M&E framework
5 2
2. Directorate meetings, led by individual directors of the five different directorates
25 2
3. Directors meetings led by the Chief Director: Governance Monitoring
7 1
4. Branch M&E meetings, led by the acting Deputy Director General (DDG): M&E, which are attended by everyone in the branch
27 1

9
No. Type of meeting Estimated number of participants
Estimated number of documents produced
5. M&E specialist team meetings 13 1
M&E internal workshops, as other officials within the OPSC would be invited.
Around 30 1
6. Consultative meetings with key stakeholders
Around 50 1
7. Operations meeting The DG (Director General), all DDGs (Deputy Director Generals), CDs (Chief Directors), Directors and Provincial Directors (PDs) (30)
1
8. Plenary meeting where major decisions are taken
All commissioners (13) 1
Totals 200 11
Qualitative content analysis and direct observation of how PSC’s members of top management,
M&E specialist team members, M&E practitioners in branch and M&E monitors and evaluators
of the regional offices do in reviewing the M&E system, will be done. The M&E data base that
originates inside the organisation will also be analysed, with specific reference to website
information on M&E, PSC News publications, reports on M&E and M&E tools used, including
documents from consultative engagements, as indicated in the table below:
Table 1-3: List of documents to be analysed
Name of document Description Number of documents
M&E assessment tool for 2010, 2011 and 2012
The tool has all indicators used and rating scale(s) and how the tool was to be used
3
Copies of SOPS To determine how the findings from the M&E activities were reported to parliament
3
Current framework for CVPs (in the process of being finalised)
For comparison purposes 1
PSC News for 2010, 2011 and 2012
To find out what was reflected upon and by whom
3
PSC’s 2016/2017 strategic plan To revisit PSC’s constitutional mandate. Were there changes made?
3
Any other M&E report covering the review period
To find out what was reflected upon and by whom
3
Total 16

10
1.1.4 Data collection approach
There are several methods of data collection used in this study. Firstly, the researcher assumed
the position of participant/non-participant observer over a period of twelve months in the PSC,
working in branch M&E which is responsible for designing and implementing the M&E system.
The researcher attended practically all meetings and workshops where deliberations on M&E
took place: asked questions, gave inputs and made comments. Additionally, the researcher
made observational notes on what was discussed by all and decided upon, where protocol did
not allow her to participate in discussions. The researcher did not make observations as a
detached observer, but experienced the deliberations first-hand as an insider (formed part of the
senior management services) (Bryman et al., 2016:244; Welman et al., 2012:190-194-196).
In other meetings, such as consultative meetings with key stakeholders held outside the PSC,
the researcher assumed the role of non-participant observer, as in such meetings it is
commissioners only who can contribute. A lot of focussed information was acquired as much of
the time was spent on listening to others, their tone of voice and watching non-verbal
communication (Bryman et al., 2016:244). Some of the meetings during participant and non-
participant observations were audio-taped with verbal consent from the chairperson, as
permission to conduct the study was granted before fieldwork could start. The questions asked
during these discussions were pre-planned and observational notes were carefully taken to
address the research questions in the study.
The Internet and PSC’s Intranet were also used as sources of documents and archived ones,
as advocated for by Bryman et al. (2016:283). Much of the information used to gain insight into
the PSC’s M&E between 2010 and 2012 was from the Internet. The researcher relied on these
official and organisational documents in terms of what was assessed and which assessment
instrument was used, as M&E champions of this era had left the Commission. Document
analysis, inter alia content analysis, was also used to collect data. The PSC’s website, Intranet
and M&E database is a rich source of public (SOPS reports) and organisational documents
(M&E assessment instruments) on M&E.
These documents provided the needed background to the development of the M&E system
within the PSC. These documents were not seen as necessarily revealing anything regarding
the manner in which the M&E system was designed; they were carefully examined in relation to
the context in which they were produced and the readership they intended to impress. The use
of document analysis will allow the researcher to get an impression of how the M&E system
operates without interrupting it or the participant’s routine.

11
One of the consultative meetings involving the DPSA and the PSC was used as a Focus Group
Discussion (FGD). The meeting was scheduled to discuss the overlapping legislative mandates
in relation to compliance with CVPs. Focus groups interviews are done to determine how
participants express their views and perspectives on an issue as members of a group (Welman
et al., 2012:232-238). There were a facilitator and moderator of the discussions. It was essential
for the researcher to know how the issue of standard setting regarding compliance with CVPs
will be dealt with going forward, as it had a direct impact on the efficiency and effectiveness of
the PSC’s M&E system, without clearly defined standards. All the data acquired will be analysed
in relation to the evaluation criteria developed on efficiency, effectiveness and relevance of the
PSC’s M&E system.
1.1.5 Data analysis
Analysis of qualitative data will start with determining key indicators for the review process
(relevance, effectiveness and efficiency) and collecting information around the indicators
through the focus group discussions, document analysis, content analysis, participants and non-
participant observations. Comments will then be organised into similar concerns, suggestions,
similar experiences, programme inputs, outputs, strengths, weaknesses and recommendations
(coding). The categories or themes will be labelled into concerns and suggestions. This will be
followed by identifying patterns, trends and causal relationships in the themes (statistics);
putting the information into perspective, that is, comparing the results to what an ideal M&E
system should be, describing the strengths and weaknesses of the programme, writing up the
findings and conclusions and working out possible ways forward (narrative) (Bryman et al.,
2016:359-360).
1.8 SIGNIFICANCE OF THE STUDY
The study has benefits to key stakeholders in various ways:
At a national level, in terms of policy development, determining how the system was
designed, the research results may provide the PSC, the custodian of the system, essential
information on the “implementation factor”.
At a provincial level, for the sake of consistency, it is essential that regional offices use the
“new M&E system” as designed, as they are expected to report on the extent to which
provincial departments comply with CVPs to the provincial legislatures.
At an operational level in the PSC, the research results would be useful to the Deputy
Director General: M&E, director: PSM&ES (Public Service Monitoring and Evaluation

12
System) and all officials in branch M&E who grapple with the realities and practicalities of
the implementation of the M&E system since the system is meant to improve government
performance.
To forge collaborative partnerships and ensuring cross-pollination of ideas on the PSC’s
M&E system, it would be essential to maintain links with the Department of Planning,
Monitoring and Evaluation (DPME) and the Department of Public Service Administration
(DPSA). These two departments have a role to play in the M&E space: DPSA with regard to
setting the standard for CVPs and DPME with regard to evaluation of specific outcomes
from the same government departments as the PSC.
Since the study involves over 150 departments, an opportunity is created to share best
practices.
Ultimately, the results of the study will serve the people of South Africa and honouring the
embedded / entrenched values of the Constitution.
1.9 ETHICAL CONSIDERATIONS
The trustworthiness of reported observations, document (content) analysis and interpretations of
focus group interviews would strive for maximum internal validity through the following
mechanisms:
Triangulation: multiple sources of data and various approaches for data collection (Collins &
Hussey, 2014:71) will increase the likelihood of understanding the phenomenon under study
from various points of view. Data triangulation will assist in determining whether the data
collected with one procedure or instrument confirmed the data collected using a different
procedure or instrument. The intention is to also find support for the document analysis,
observations, Internet usage, use of reflective journals and conclusions in more than one data
source. This method will also assist with the search for convergence of a major theme or pattern
in the data from these various sources which leads to credibility of the findings.
Informed consent: Fouka and Mantzorou (2011:4) say that it means that a person knowingly,
voluntarily, intelligently and in a clear and manifest way gives consent. With informed consent, a
participant’s right to autonomy is protected. The freedom to withdraw from the study at any
given point should also be afforded. The principle that will be adhered to here is that participants
will be fully informed about the research process.

13
The PSC will be made aware of the purpose (goal and objectives) and outcomes of the study.
The researcher will spell out the purpose of the research and implications thereof in a simple
language the participants will understand. Participants will be given as much information as they
need to enable them to decide whether they want to get involved in the study or not, as advised
by Bryman et al. (2016:124) and Welman et al. (2012:201). Covert observations will be avoided
at all cost.
Respect for confidentiality and anonymity: Fouka and Mantzorou (2011:6) suggest that
anonymity is protected when the participant’s identity cannot be linked to personal responses.
The PSC and its officials and government departments referred to in the final report will be
assured of confidentiality and anonymity (the identity of the cases will be masked; pseudo
names will be used). The MRS (Market Research Society) code is very clear here; the
objectives of any study do not give the researcher a special right to intrude on a respondent’s
privacy (Bryman et al., 2016:126). By assuring confidentiality this also means that participants
are free to give and withhold as much information as they wish to the person they choose.
Protection from harm (beneficence): the principle of beneficence refers to “be of benefit, do
not harm” Fouka and Mantzorou (2011:5). Harm can be physical, physiological, emotional,
social and economic in nature. It is important therefore to assure participants that they will be
indemnified against any “discomfort” or “harm” (Welman et al., 2012:201), where subjects must
be referred to appropriate professional intervention as necessary.
Protection against deception: The participating organisation will not be deceived in any way.
The research instruments will be designed to serve the purpose of eliciting information the study
intends to get. Deception occurs when the researcher presents the research as something other
than what it is not (Bryman et al, 2016:127).
Copyright, reciprocity and trust: In terms of reciprocity, the report generated will be available
to any of the departments used in the study, on request. A copy of the final report on the PSC
M&E system will be given to the PSC.
Member checks: the preliminary report will be taken back to the people from whom they were
derived to confirm the accuracy of the information (wherever possible and feasible). In addition,
participants will be asked to comment both on the categories developed for the analysis of data,
as well as the final narrative. Feedback from the participants will be used to further insights and
draw attention to some other aspects missed. Member checking demonstrates courtesy to the
participants by letting them see what has been written about them.

14
Building an audit trail: A database containing M&E data will be created. This is the only
information that will be utilised in the final analysis. A record of a summary of all deliberations
during meetings will be developed. The output of all the documents accessed, as well as from
the reflective journal and direct observations will be kept in a database (electronic and
manually).
1.10 LIMITATIONS OF THE STUDY
Ijeoma (2014) on weaknesses of external evaluations, says: someone from outside the
organisation or project may not understand the culture or even what the work is trying to
achieve; those directly involved may feel threatened by outsiders and be less likely to talk
openly and co-operate in the process and they may be very costly. An external evaluator
may misunderstand what the evaluation is all about and may not give those who requested
for the evaluation what they need.
Qualitative findings with a small sample provide very little basis for making scientific
generalisations and can therefore not be used to make broad generalisations. According to
Collins and Hussey (2014:52), such findings may be generalised to “theoretical propositions”
but not to all the provinces in the country that are engaged in the same activities.
In addition, research studies involving qualitative approaches usually result into huge
volumes of data that need to be managed and kept safe (having a research database). The
loss or omission of information could result in a lack of continuity or in incoherence in the
reporting of the result.
Non-probability sampling techniques are known for being subjective, which might increase
the chances for sampling error and bias.
Since there was not much time to do the study, not all aspects of the research could be
adequately covered, hence a mini-dissertation that just gives a brief and not so detailed
account of this study.
1.11 DEFINITION OF TERMS
M&E system is a set of organisational structures, management processes, standards,
strategies, plans, indicators, information systems, reporting lines and accountability
relationships which enables an organisation to effectively discharge its M&E functions
(Mapfumo, 2016: 31).

15
Monitoring and evaluation cannot be used interchangeably. Although not the same, they are
complementary in that, when monitoring sends signals that efforts are going off-track, evaluation
can help clarify the realities and trends noted (Gopane, 2012:52).
Monitoring is the systematic process of collecting, analysing and using information to track a
programme’s progress towards reaching its objectives and to guide management decisions.
Monitoring usually focuses on the process, such as when and where activities occur, who
delivers them and how many people or entities they reach (ACF International, 2011:19 in
Mapfumo, 2016:6; IFRC, 2011:11; Motingoe & Van der Waldt, 2013:2).
Govender and Reddy (2014:164) see monitoring as tracking interventions and using the data
collected to timeously fulfil or enhance the achievement of set target to the satisfaction of the
targeted stakeholders. A good monitoring system provides early warning signals so that
corrective action can be taken seriously (Mthethwa & Jili, 2016:106-107).
Evaluation is the systematic assessment of an activity, project, programme, strategy, topic,
theme, sector, operational area or institution’s performance. Evaluation focuses on expected
and unexpected accomplishments examining the results chain (inputs, activities, outputs,
outcomes and impacts), processes, contextual factors and causality in order to understand
achievements or the lack thereof. It aims at determining the relevance, impact, effectiveness,
efficiency and sustainability of interventions and the contributions of the intervention to the
results achieved (Ijeoma, 2014:12-13; IFRC, 2011:13).
According to Govender and Reddy (2014:165) evaluation plays an important role in the
improvement of service delivery. Minnaar (2010:156) confirms this view by stating that
evaluation implies the comparison of the actual impact of a project/activity against agreed upon
strategic plans.
1.12 LAYOUT OF THE STUDY
The following section provides a description of the structure and content of the mini-dissertation:
CHAPTER 1: NATURE AND SCOPE OF THE STUDY
In this chapter, an outline (synopsis) of the entire mini-dissertation will be made. There is an
explanation of the rationale for undertaking the study and the general and specific aims of the
research. The reader will be introduced to the “M&E language” used throughout this mini-
dissertation. The measures taken to establish validity and reliability in the research process will
be explained, with special reference to the limitations of the study in terms of how I dealt with
them. The chapter will conclude by giving a schematic representation of the research process.

16
CHAPTER 2: LITERATURE REVIEW
In this chapter, a critical description of the M&E system used in the PSC from 2010 to 2012 will
be presented. Best practice models for reviewing the M&E system for benchmarking purposes
will be identified and presented. Review criteria to be used (relevance, effectiveness and
efficiency) are also explained in detail.
CHAPTER 3: EMPIRICAL INVESTIGATION
In this chapter, an application of the research methodology described in Chapter 1 to address
the three critical research questions in the study will be done. The outcome of this research is to
present a comprehensive review report of the PSC’s M&E system in relation to relevance,
efficiency and effectiveness. Findings from focus group discussions conducted, observational
tools, documents analysed and content analysis will be made.
CHAPTER 4: CONCLUSION AND RECOMMENDATIONS
A final and overall analysis (synthesis) of the research findings of the empirical investigation,
present implications, commendations and recommendations will be done.

17
CHAPTER 2: LITERATURE REVIEW
2.1 INTRODUCTION
This chapter offers a synthesis of what others already have written on the design of an effective,
efficient and relevant M&E system, or not written, or wrote in a way that is conceptually or
methodologically inadequate or contextually inappropriate. The purpose is to show how this
particular research would address the “gap”, silence or weaknesses in the existing knowledge
base (M&E). Specifically, the organisational structure of the PSC will be provided, as it relates to
M&E provisioning. The background information to the nature of the PSC’s M&E system from
inception to 2012 will be given. The role of branch M&E as it relates to the PSC’s constitutional
mandate will be portrayed. A synopsis of M&E systems on the African continent and developed
countries will be given, which the PSC can draw lessons from. A description of a relevant,
effective and efficient M&E system will be done from theoretical propositions. The criteria to be
used for such a system will also be explained in full.
2.2 THE ORGANISATIONAL STRUCTURE OF THE PSC
The PSC consists of 14 commissioners, five of which are appointed for a five year term by the
president on recommendation from the National Assembly. One member is appointed by the
Premiers of the Provinces on the recommendation of a committee of the Provincial Legislature.
The PSC is accountable to the National Assembly. The PSC Act of 1997 provides for the
president to designate one commissioner as chairperson and another as deputy chairperson.
The current chairperson of the PSC is advocate Richard Sizani; the deputy chairperson is Ben
Mthembu. The DG is Dr Dovhani Mamphiswana (PSC, 2017). The figure below depicts what the
PSC refers to as the single PSC structure:
Figure 2-1: A single PSC

18
The key mandate of the PSC is to promote good governance in the public service. The plenary
is the highest decisions-making body of the PSC and is constituted by the commissioners. All
policy decisions are taken during plenary sessions. The executive committee is responsible for
the day to day implementation of decisions of plenary – it makes operational decisions based on
the recommendations submitted to it by the Director–General (DG). Specialist Teams (STs)
provide strategic oversight of the four key performance areas of the PSC. The organisational
structure of the OPSC is currently comprised of the four branches: Corporate Services (CS);
Leadership and Management Practices (LMP); M&E and Integrity and Anti-Corruption (IAC)
(PSC, 2017), as indicated below:
Figure 2-2: Organisational structure of the OPSC
CS provides the overall management of the PSC and centralised support services. LMP is
responsible for the promotion of sound public service leadership, human resource management,
labour relations and labour practices. M&E is responsible for establishing a high standard of
service delivery, monitoring and evaluation and good governance in the public service. The
position of DDG: M&E has been vacant for quite some time now (more than three years), a
situation that adds to the challenges regarding M&E activities. IAC is responsible for
undertaking public investigations, promotion of a high standard of professional ethical conduct
amongst public servants and contributes to the prevention and combat of corruption. The focus
in this study is going to be on branch M&E which is responsible for monitoring and evaluation of
CVPs.
The PSC started to execute its oversight role in relation to government performance in 1996.
The Monitoring and Evaluation (M&E) branch was established to undertake M&E activities in
relation to Section 194(4) (a) and (b), which requires the Commission to:

19
Promote the constitutionally prescribed values and principles governing public
administration in the public service, enshrined in Section 195;
Report on its activities and the performance of its functions and
Evaluate the extent to which the constitutional values and principles (CVPs) are complied
with.
The table below summarises the PSC’s constitutional mandate as it relates to M&E activities
(PSC, 2008:6-8):
Table 2-1: How the PSC unpacked its constitutional mandate
Constitutional provision Term Explanation
S196(4)(a): Promote the values and principles as set out in Section 195 throughout the public service
Promote The promotional role covers all CVPs in which findings, recommendations and directions are contained for improvement, using conferences, roundtables, workshops and public hearings
S196(6)(a): Report on its activities and the performance of its functions
Report In respect of CVPs, the PSC published the SOPS reports (see Annexure 1 for an example)
S196(4)(b): Monitor and evaluate the organisation, administration and the personnel practices of the public service
Monitor and evaluate
As defined in the booklet “Basic concepts in monitoring and evaluation” published in 2008. An assessment instrument with indicators of performance was applied on selected departments and a report with findings and recommendations generated
To adhere to its constitutional obligations, the PSC developed the M&E system which matured
to what they termed “Transversal M&E system”. Transversal M&E system means determining
compliance with CVPs from other M&E activities conducted in Branch LMP and IAC. The PSC
had stated in 2008 that it wants to position itself as a leader in the monitoring and evaluation of
the performance of the public service.
2.3 THE ROLE OF BRANCH M&E
Strategically, the purpose of branch M&E is to establish a high standard of service delivery,
monitoring and good governance in the public service (PSC, 2017). The branch is led by a
Deputy Director General (DDG): M&E. Branch M&E was established to give effect to the PSC’s

20
mandate to monitor and evaluate public administration and report on compliance with CVPs
governing public administration. It also seeks to address its mandate of promoting effective and
efficient service delivery. The branch is made up of two sub-programmes led by Chief Directors
(CDs):
Governance Monitoring (GM) Chief Directorate (CD), which is responsible for institutional
assessments and programme evaluations, is led by a Chief Director. GM is made up of the
Public Service Monitoring and Evaluation System (PSM&ES) and Programme Evaluation
(PE) directorates led by directors (D).
Service Delivery and Compliance Evaluation (SDCE) CD; its key mandate is to promote
effective and efficient service delivery and to propose measures to ensure effective and
efficient performance in the public service. SDCE is composed of the Compliance
Evaluation and Organisational Reviews (CEOR) and Consultative Evaluations (CE) led by
directors (D)
By 2012/2013 the PSC had issued 153 departmental assessment reports and 11 consolidated
reports emerging from the departmental reports. The PSC had also introduced the M&E
assessment tool (Barometer or Research Guide and Assessment Questionnaire) to assess the
performance of the public service. Eight programme evaluation reports had been published.
Specifically GM had published ten editions of the SOPS (PSC, 2013:30). Generally, the reports
showed that most departments were doing well regarding compliance with CVPs.
Despite this “good performance”, the PSC discontinued the M&E tool in the fiscal year
2012/2013 during their strategic planning session. The PSC felt that the M&E indicator-based
tool used to assess performance against the CVPs consumed an enormous amount of time,
energy and institutional capacity and its impact was limited. Decision-makers were of the
opinion that this tool stalled at the level of an assessment of performance/compliance with CVPs
against a set of indicators and the production of reports and had not shifted to the level of
diagnosing underlying problems and finding solutions to address them.
The branch (M&E) was given an opportunity to review the old M&E system which ended in 2012
and to come up with a new one which was to be put into effect in 2017. The assessment phase
will be followed by tracking the progress made regarding recommendations and to develop the
solution to the problems identified in the assessment phase. With the new M&E system, the
following products were envisioned: an institutional assessment report (diagnostic scan report);
a report on the structure, policies, programme design, processes, practices and guidelines

21
developed as solutions to the problems identified in the departments and a close-out and
learning report (PSC, 2013:14).
2.4 THE HISTORY OF M&E IN THE PSC
As stated in Chapter 1, the PSC’s M&E was initially referred to as the Transversal M&E system.
The latter is in essence a barometer of departmental performance against the nine values and
principles for public administration, forming the lens or framework for assessment. The PSC’s
Transversal M&E system assessed on an annual basis the actual performance of a government
department against a set of indicators and standards for each CVP. Since the same indicators
were used year after year it was possible to compare a sample of departments in a specific year
with that of the previous years. There was a rating scale linked to each standard to award a
score for the performance of a government department.
During this period, the PSC was also able to determine baseline data and provide trends in
performance covering a period of three years. Evidence about the actual state of performance
for the nine CVPs was obtained by conducting interviews with samples of key informants and
administering questionnaires and checklists. The qualitative and quantitative data were then
analysed according to measures in place. The “Governance Scorecard” which is explained in
Section 2.7 below was one system used during the first decade of implementation of the M&E
system. The State of Public Service (SOPS) report was then published on a yearly basis until
2012, for reasons explained in paragraph 7 below.
The process used in implementing the PSC’s M&E system was aimed at promoting
collaboration and partnership with government departments (PSC News, 2012:7-8).
Communication with government departments throughout the monitoring cycles was considered
essential, starting from the initial process whereby the system is introduced to top management,
engaging them on interim findings and finally presenting a report with recommendations to the
management forum of the particular government department. Departments were then given an
opportunity to comment and give additional input on the draft report (see flowchart below):

22
Figure 2-3: Flowchart of the M&E process
A rating scale was then used as follows (PSC News, 2012:8) to measure departmental
performance:
Table 2-2: Rating scale consisting of five performance bands
Performance band Score description Score %
5 Excellent 4,25 – 5,00 81% - 100%
4 Good 3,25 – 4,00 61% - 80%
3 Adequate 2,25 – 3,00 41% - 60%
2 Poor 1,25 – 2,00 21% - 40%
1 No performance 0,25 – 1,00 0% - 20%
For comparison purposes, departments were ranked against the standards for each principle
and categorised as follows:

23
Table 2-3: Ranking of departments
Non-performing 0% - 19%
Inadequate performance 20% - 59%
Adequate to excellent performance 60% - 100%
2.5 KEY FEATURES OF THE PSC’s M&E SYSTEM FROM 1996 TO 2012
The PSC’s M&E system from inception to 2012 is categorised as compliance monitoring
coupled with Programme Evaluation (PE). Compliance monitoring ensures conformity with
regulations and statutory laws and agreed-upon standards (IFRC, 2011:12). Programme
evaluation was defined as the evaluation of the success of a programme and how the design
and implementation of the programme contributed to that success (PSC, 2008:39), for example,
the evaluation of the poverty reduction programme in the Department of Agriculture.
2.6 PROCESS OF DEVELOPMENT OF THE OLD M&E SYSTEM
In terms of the process of development of the M&E system, before values were used, they were
stated in measurable terms (PSC, 2008:28-33). In simpler terms, all the values were explained.
For example, a high standard of professional ethics relates to compliance with ethical principles
as contained in the Code of Conduct for public servants. On the process level, this value relates
to whether ethics management practices or an ethics infrastructure have been established in
departments.
Since the values are rich concepts, the many dimensions of each value were identified. It is not
easy to show transparency as a value without developing dimensions that cover it. It was only
possible to measure a few dimensions that say something important about whether the value is
complied with. Compliance with the value was measured by means of indicators, as indicated in
Table 2-4 below. The old M&E system was characterised by an emphasis on values and not
values and principles. There is no definition of what a principle is in the earlier documents, nor is
there mentioning of how it was intended to be monitored and evaluated. With the revised M&E
framework of 2017, principles are explained and there is reference to the use of Batho Pele
principles.
An indicator was defined as a normative statement that expressed some aspects of the values
that needed to be complied with (PSC, 2008). Another way used was the development of
several criteria to measure compliance with the value and for each criterion specific standards

24
were defined. Standards were defined from values, as shown in Table 2-4. The table below
shows an extract from the PSC’s old M&E system on the indicator / criteria and standards used
for one value (PSC, 2008:27). The whole system is presented in Annexure 2.
Table 2-4: Indicator / criteria and standards
Value Criteria / indicator Standards
Efficient, economic and effective use of resources must be promoted
1. Expenditure is according to budget
2. Programme outputs are clearly defined and there is credible evidence that they have been achieved
Expenditure is as budgeted and material variances are explained
Programmes are implemented as planned or changes to implementation are reasonably explained
The values remained the same over the years (from inception of the M&E system to date), but
deeper and clearer explanations of values were sought after, indicators were revised and
changed accordingly and tougher standards were gradually introduced over the years. In
addition, the eight principles of Batho Pele (relevance, acceptance, empowerment,
appropriateness, sustainability, targeting and scale of engagement) were used as they gave
more perspective from which the public service could be evaluated (PSC, 2008:34-37). The
PSC’s M&E system was designed based on different perspectives. The system included (PSC,
2008):
Objective(s): a description of the aim or purpose of an activity.
Indicator(s): identifies specific numerical measures that track progress towards achieving a
goal.
Target: expresses a specific level of performance that the institution, programme or
individual aims to achieve.
Baseline: the current performance levels that an institution aims to improve when setting
performance targets.
2.7 THE USE OF THE “GOVERNANCE SCORECARD”
The then M&E system used the idea of the Balanced Scorecard of Kaplan and Norton to
develop its own “Governance Scorecard” for evaluation of values which are complex and multi-
dimensional in nature (PSC, 2008:19). This scorecard emphasises the use of the four

25
perspectives for evaluation of the performance of an organisation. Good governance was
viewed as compliance with all the values listed in Section 195 of the Constitution (PSC,
2008:21).
This scorecard had various ratings for different aspects of the individual values which were
added up and converted to an overall percentage. For example, a department that got an
overall percentage of 90–100% was regarded as performing excellently regarding CVPs, in
relation to the identified dimensions, as indicated in Table 2.2 above. In instances where there
was no evidence of performance, the rating scale allowed for a zero score. The Governance
Scorecard was discontinued as it was not revealing all the nuances of the assessment, such as
why is a particular department not performing.
2.8 THE M&E ASSESSMENT TOOLS
The barometer, 1st and 2nd Research Guide and Assessment Questionnaire as the assessment
instruments were called, came next. These were extremely long (over 100 pages) and covered
questions for all CVPs (see Annexure 1). This instrument was administered by PSC officials,
meaning that there were no outside monitors appointed to collect data at the selected
departments. This approach is highly commendable as it generally increases the opportunities
for hands-on practice with M&E tools and organisational learning.
However, on the down side, this M&E system was also beleaguered with the following
challenges: lack of consultation with key stakeholders; lack of extensive promotion of CVPs
prior to M&E activities; lack of transparency regarding what would be assessed and how it
would be done and lack of a good data management system, which affected the quality of data.
Seemingly, it lacked a strategic communication plan.
On the positive side, the PSC has helped to form the South African Monitoring and Evaluation
Association (SAMEA). It had since co-hosted two conferences (2009 and 2011). It has signed a
memorandum of understanding with SAMEA to ensure a long-term relationship, which it
believes is important to professionalise the discipline in the country (Naidoo, 2010:51-56).
2.9 M&E IN THE AFRICAN CONTINENT
According to the study conducted by CLEAR (Centre for Learning on Evaluation and Results) at
the University of Witwatersrand in 2012 of nine African M&E systems, the three countries that
emerged to have developed maturing M&E systems are Benin, South Africa and Uganda. M&E
systems in Africa operate in a complex terrain, as they are hostages to other forces in
government (Porter, 2012:8). The key elements of the institutional arrangements of the three

26
case countries are: mandates of units responsible for M&E, who are the champions, M&E tools
and methodologies within the system, financing, utilisation of M&E information and what
capacity is there within the system. The M&E systems of these three case countries illustrated
that further work still needs to be done to prevent monitoring masquerading as evaluation
(CLEAR, 2012:18).
2.9.1 M&E system in the Republic of Benin
As reported by Djidjoho and Houinsa (CLEAR, 2012: 20-22), the Office for the Evaluation of
Public Policy in the Office of the President/Prime Minister is responsible for evaluations of public
policy. This office conducts implementation and impact evaluations; the latter is focused on
poverty alleviation. The methodologies which the M&E system uses for data collection include
reports, site visits, M&E meetings and workshops and surveys. M&E tools used in order of
importance include activity reports; evaluation forms logical frameworks and computerised
systems. Financing for the M&E system comes from both internal and external sources.
The main source is the Public Expenditure Reform Adjustment Credit (PERAC), which permits
allocation of resources to M&E activities that does not exceed 2% of the sectoral budget. The
principal funding partners are Denmark, Germany, Switzerland, the United Nations
Development Programme, the World Bank, the European Union and the Netherlands.
The weak professionalism of the M&E system is in contrast with its relatively high status. The
system employs staff with an adequate basic education, but it does not help them to keep
informed and up to date. In addition, the different products delivered by the system lack
synergy; the data is often not available when progress reports need to be produced. The results
of M&E activities are not sufficiently taken into account, although there is evidence that this
situation is progressively changing. The driving force behind the culture change is compliance
with the requirements of the technical and financial partners (donors).
The institutionalisation of the evaluation practice gave rise to a National Evaluation Policy for
public policies. This policy defines the overall framework for planning and carrying out
evaluations, and for using the information derived there from. This is good M&E practice for
Benin.
2.9.2 M&E system in the Republic of Uganda
As described by Byamugisha and Asingwire (CLEAR, 2012:184-198), the Government
Evaluation Facility (GEF) is responsible for conducting evaluations of key government policies
and to institutionalise evaluations in government. The GEF is composed of a 2-year rolling

27
evaluation fund, where finances are pooled to facilitate the commissioning/conduct of
evaluations, rather than having to look for resources on a case by case basis; national
evaluation sub-committee composed of Uganda’s evaluation experts and small secretariat in
the Office of the Prime Minister (OPM), with a team of evaluation experts who facilitate the GEF.
In Uganda, the President himself is the champion for M&E and pronounces on benchmarks for
government performance. The following table summarises the M&E component and tools used
in Uganda:
Table 2-5: M&E component and tools used in Uganda
Component/sub-component Tool
Monitoring
Financial monitoring Output Budget Monitoring Tool and financial audits
Physical monitoring Value for money audits
Outcome/impact Household, Beneficiary Surveys
Evaluation
Impact evaluations Beneficiary surveys, Citizens Report Card
Mid-term/final evaluations Administrative data; Beneficiary assessments
Ex-ante/|Baseline evaluations Household surveys, Literature reviews
Inspection and control
Financial auditing Audit reports
supervision Supervision and monitoring reports
Process evaluations, based upon routine monitoring and social research are common. The Bi-
annual Government Performance Report provides a rich summary of findings from all these
sources facilitated through the Output Budgeting Tool (OBT). Impact evaluations are often done
through the Output Budgeting Tool (OBT). Impact evaluations are often done through a before
and after approach, where outcomes are typically measured at one point in time before
programme implementation and then at another point in time after implementation. Professional
skills and experience in M&E exist but the available few individuals with skills and experience
are scattered in various institutions and organisations all over the country. There is no effective
utilisation of M&E data. Limited utilisation is attributed to poor methods of information
dissemination.
2.9.3 M&E system in the Republic of South Africa
As narrated by Latib and Goldman (CLEAR, 2012:146-166), the Department of Planning,
Monitoring and Evaluation (DPME) is the custodian of the Government Wide Monitoring and
Evaluation System (GWM&ES). DPME establishes the framework for M&E, carries out
evaluations and research, supports the development of appropriate capacity and integrates data
for reporting purposes.

28
The M&E system covers all tiers of government (national, provincial and local), but is weak at
the local level. This system entails quarterly monitoring against departmental annual
performance plans (APPs); management performance monitoring; frontline service monitoring;
six monthly monitoring of individual performance and quarterly outcomes performance. The
outcomes approach represents a specific innovative orientation to building and establishing a
results-oriented approach in government.
There is a maturing focus on the use of M&E information to improve results and a greater
emphasis on involving the end users of the M&E information when commissioning evaluations.
It was conceded in this report that to ensure effective delivery of M&E related agreements, this
will require high-level capabilities within government, where it was noted that such focused
capacity takes time to establish and requires strong stakeholder engagement. It was also
reported that the M&E system faced challenges of poor data in many areas and weak data
collection and collation in other areas.
2.10 M&E SYSTEMS INTERNATIONALLY
Government performance is a global phenomenon. Whether it is calls for greater accountability
and transparency, enhanced effectiveness of development programmes in exchange for foreign
aid, governments are under pressure (internally and/or externally) to demonstrate tangible
results (World Bank, 2002:2; IFRC, 2011; Hardlife & Zhou, 2013). Developed countries
particularly those of the Organisation for European Cooperation and Development (OECD),
have had as many as 20 or more years of experience in M&E, while many developing countries
are just beginning to use this key public management tool.
Developed countries have chosen a variety of starting points for implementing the results based
M&E systems, including whole-of-government, enclave or mixed approaches. The M&E
systems in the 30 OECD countries differ in their path, approach, style and level of development.
According to the last survey, Australia, Canada, the Netherlands, Sweden and the United States
have the highest evaluation culture ranking among the OECD countries (Furubo et al, 2002; the
World Bank, 2010).
Although experts vary on the specific sequence of steps in building an effective results-based
M&E system, all agree on the overall intent. Regardless on the number of steps, the essential
actions involved in building a good M&E system are to: formulate outcomes and goals; select
outcome indicators to monitor; gather baseline data on the current condition; set specific targets
to reach and dates for reaching them; regularly collect data to assess whether the targets are
being met and analyse and report the results (OECD, 2002:12).

29
While substantial progress has been made in OECD countries on a number of fronts, there is
still room for improvement. The OECD survey of 2002 found that “only a limited number of
countries link performance targets to expenditures”, just to mention an example. Korea lacked
the sufficient number of professional and skilled people trained in M&E (Lee, 2002). M&E
system of the WB represents the best practice model for OECD countries (Gorgens & Kusek,
2009).
2.11 ELEMENTS FOR DESIGNING AN EFFECTIVE M&E SYSTEM
The M&E system is a powerful public management tool that can be used to improve the way
organisations achieve results. The result-based M&E system takes decision-makers one step
further in assessing whether and how goals are being achieved over time. When designed and
implemented properly the M&E system provides a continuous flow of information feedback into
the system. There is a general agreement amongst the World Bank, Foreign Investment
Advisory Services (FIAS), Department of International Development (DID), the Business
Enabling Environment (BEE) practitioners and the International Federation of Red Cross (IFRC)
on the elements needed to design the M&E system. There are ten steps to be followed in
designing and implementing M&E systems as described in a training manual developed by Ray
Rist (2011) who worked for the World Bank (pioneers of M&E) and wrote the M&E handbook
(Kusek & Rist, 2004:39-160; Ijeoma, 2014:202):
2.11.1 Step 1: conducting a readiness assessment
Step 1 is a unique addition to the many M&E systems that exist as it provides an analytical
framework to assess the given institutional capacity and political willingness to undertake M&E
activities. For all good intentions to advance the design, creation and use of M&E systems, too
little emphasis is placed on existing political, organisational and cultural factors and contexts.
Most M&E practitioners jump into the “what” questions; what are the indicators and not why it is
necessary to measure something. To answer the “why” questions there is a considerable
amount of preparatory work that needs to be done – the readiness assessment. A readiness
assessment is like constructing the foundation for a building. A good foundation provides
support for all that is above it. It is below ground; not seen, but critical (Kusek & Rist, 2004:40-
41).
2.11.2 Step 2: agreeing on outcomes to monitor and evaluate
For step 2, there is an old adage that says “If you do not know where you are going, any road
will take there” (Kusek & Rist, 2004:56). Outcomes are usually not directly measured; only
reported on. Unlike goals, outcomes are of intermediate time frames (five to ten years). From

30
outcomes one can then derive targets that are generally of a short range (one to three years). It
is not advisable to move directly to setting indicators since establishing outcomes will illustrate
what the anticipated change should look like. Using contrasting indicators are only relevant
when they measure against an objective. One cannot set indicators before determining
outcomes, because it is the outcomes, not indicators that will ultimately produce the results.
Outcomes will demonstrate whether change has been achieved or not (Kusek & Rist, 2004:56-
57). In short, outcomes will show what road to take.
It is also important to choose outcomes in consultation with key stakeholders and major concern
groups such as the DPSA and DPME. There is a political process in setting and agreeing upon
desired outcomes. The voices and views of stakeholders should be actively solicited. The
process of setting and agreeing on outcomes include identification of specific stakeholder
representatives, major concerns of stakeholder groups and translation of problems into
statements of possible outcome improvements. The table below shows how outcome
statements can be developed:
Table 2-6: Developing outcome statements
From To
It is no longer safe to go after dark Improve community safety
2.11.3 Step 3: selecting key performance indicators to monitor outcomes
According to step 3, Indicators are the quantitative and qualitative variables that provide a
simple and reliable means to measure achievement, to reflect the changes connected to an
intervention, or to help assess the performance of an organisation against the stated outcome
(Ijeoma, 2014:204). Indicators should be developed for all levels of the Logical Framework
(inputs, activities, outputs, outcomes and impact) of the M&E system. Performance indicators
conform to the CREAM acronym (Kusek & Rist, 2004:68):
Clear Precise and unambiguous
Relevant Appropriate
Economic Available at a reasonable time
Adequate Provide sufficient basis to assess performance
Monitorable Amenable to independent validation

31
Where the outcome cannot be measured directly, there might be a need to use proxy indicators.
2.11.4 Step 4: setting baselines and gathering data on indicators
The fourth step is essential to establish “where we are” relative to “where we want to be”. One
cannot project performance into the future (set targets) without firstly establishing a baseline.
The baseline is the first planned measurement of an indicator. The baseline is used to learn
about current or recent levels and patterns of performance for every indicator. It forms a
miniature M&E system. In building credible baseline information, the following questions need to
be answered (Kusek & Rist, 2004:81-82): What are the sources of data? What are the data
collection methods? Who will collect the data? How often will the data be collected? What is the
cost and difficulty in collecting data? Who will analyse the data? Who will report on the data?
Who will use the data? Piloting of indicators is essential. It is extremely risky to move to full
implementation of an indicator system at any level before thoroughly testing if the indicators will
give the needed data.
2.11.5 Step 5: planning for improvement – selecting results targets
The fifth step recommends the selection of result targets. A target is a specified objective that
indicates the number, timing and location of what is to be realised (IFAD, 2002:11; Ijeoma,
2014:23). In essence targets are the quantifiable levels of the indicators that an organisation
wants to achieve by a given time. One method to establish targets is to start with the baseline
indicator level and include the desired level of improvement to arrive at the performance target.
In so doing the starting point will be known, as will available resources to make progress
towards the target over a particular period of time (Kusek & Rist, 2004:91). Each indicator is
expected to have only one target over a specified time frame. The results target for CVP 7 could
be by 2017, all (100 %) requests for access to information are dealt within 30 days of receipt.
2.11.6 Step 6: monitoring of results
The sixth step is about monitoring of results. A monitoring system needs to be put together to
get the necessary data to better inform the decision-making process. The resulting data will
provide evidence on performance and flag any changes that may be needed for a given
programme. A results-based M&E system needs to align with annual plans and other work
plans of the organisation to become a true results-oriented system (Kusek & Rist, 2004:96).
IFRC (2011:12) provides the common types of monitoring:
Table 2-7: Common types of monitoring
1 Results: Tracks effects of results.

32
2 Process: (Activity) tracks the use of inputs and resources, progress of activities and the delivery of outputs.
3 Compliance: Ensures compliance with regulation, laws and standards. 4 Financial: Accounts for cost by input and activity within predefined categories of
expenditure (budget). 5 Institutional: Tracks institutional development and capacity building
2.11.7 Step 7: using evaluation information
The seventh step emphasises using evaluation information. Since monitoring data does not give
the basis for attribution and causality for change, it is essential to get evaluation data that will
provide evidence of how changes are coming about and address the weaknesses in the
system. Kusek and Rist (2004:115-116); Ijeoma (2011:130-132) and Gopane (2012:54) are in
agreement that evaluation can be used to:
Help make resource allocation decisions.
Help rethink the causes of a problem.
Identify emerging problems.
Support decision making on competing or best alternatives.
Support public sector reform and innovation.
Build consensus on the cause of a problem and how to respond.
Both NEPF (2011) in Ijeoma (2014:96-97) and IFRC (2011:15) agree on the types of
evaluations, which have been summed up in the table below:
Table 2-8: Summary of types of evaluations
Type of evaluation Explanation Timing
Diagnostic or pre-implementation
Preparatory research, often called “ex-ante” evaluation, to ascertain the current situation prior to an intervention
At key stages, prior to design or planning
Performance logic chain Used to analyse the theory of change After an intervention
Process implementation It ascertains what did or did not get implemented that was planned
Once or several times during the intervention
Rapid appraisal Allows for quick, real time assessment and reporting, providing decision makers with immediate feedback on
At any stage

33
Type of evaluation Explanation Timing
the progress of a given programme
Case study Used when in-depth information about the phenomenon is needed
When necessary
Impact Attempts to find out the changes that occurred and to what they can be attributed
Every 3 to 5 years
Meta-evaluation Synthesis of a range of evaluations to generalise findings and summarise trends
After a number of evaluations have been completed
Of importance is that evaluations should be (Kusek & Rist, 2004:126-127):
Impartial: evaluation information should be free of political or other bias and deliberate
distortions.
Useful: it should address the questions it intended to and be presented in a form desired
and best understood by the targeted audience.
Technically adequate: standards to be met include appropriate design, correct sampling
procedures, accurate wording of questionnaires and interview guides, appropriate statistical
analysis or content analysis, to name a few.
Stakeholder involvement: there should be evidence that stakeholders were consulted.
Feedback and dissemination: sharing evaluation information in an appropriate, targeted and
timely fashion is desirable.
Value for money: spend what is needed to gain the information desired and no more.
2.11.8 Step 8: reporting the findings
The eighth step is about reporting the findings. Reporting is too often the step to which
evaluators give the least thought. Performance information is to be used as a management tool.
Analysing and reporting performance findings are a critical step because it determines what is
reported, when it is reported and to whom it is reported. Evaluation reports serve many
purposes. The central purpose however is to “deliver the message”, that is to inform the
appropriate audiences about the findings and conclusions resulting from the collection, analysis
and interpretation of the evaluation information. It is essential to know the targeted audience
and how they want to see the information expressed. The interests, expectations and preferred
communications medium of the audience should be taken into account (Kusek & Rist,
2004:130). A communication strategy should be developed that will address the following

34
questions: who will receive what information and in what format? When? Who will prepare the
information? Who will deliver the information?
It is important to present performance data in comparison to the earlier data and to the baseline.
Data should be presented in a simple, clear and understandable format. The four dimensions to
reporting should be covered, which are: written summaries, executive summaries, oral
presentations and visual presentations.
2.11.9 Step 9: using the findings
According to step 9 in Kusek and Rist (2004:139) there are ten uses of findings as indicated in
the table below:
Table 2-9: Uses of findings from M&E activities
1. Help formulate and justify budget requests.
2. Help make operational resource allocation decisions.
3. For accountability purposes.
4. Trigger in-depth examinations of what performance problems exist and what corrections are needed.
5. Motivates personnel to continue making programme improvements.
6. Provides data for special and in-depth programme evaluations.
7. Help provide services more efficiently.
8. Support strategic and other long-term planning efforts.
9. Help monitor the performance of contracted consultants.
10. Communicate better with the public to build public trust.
2.11.10 Step 10: sustaining the M&E system within the organisation
The last step (10) emphasises the sustainability of the M&E system. An M&E system should be
regarded as a long-term effort, as opposed to an episodic effort for a short period or for the
duration of a specific programme. Sound technical skills in data collection and analysis are
necessary for the system’s sustainability. Kusek and Rist (2004:154) also believe that incentives
should be introduced to encourage the use of performance information. This means that
success needs to be acknowledged and rewarded, problems need to be addressed and

35
organisational learning should be valued. Underperforming departments should also be
penalised for it to be taken seriously.
In addition, Pasanen and Shaxson (2016:9) say that prior to undertaking M&E activities, it is
extremely important to have a good theory of change (TOC), identified knowledge roles and
functions and a clear M&E purpose in place. These essentials provide an understanding of
where, why and how the evaluation will improve performance of any organisation or entity in
any identified area. Having these three elements in place will support the design of a coherent
and fit-for-purpose M&E framework (a usable M&E system for the PSC).
2.12 THEORY OF CHANGE (TOC)
A well-thought out and regularly revisited TOC can be a very useful tool that describes a
process of planned change from the assumptions that guide its design, the planned outputs and
outcomes to the long-term impacts it seeks to achieve (Ijeoma, 2014:23). A TOC provides the
foundation of the M&E structure. If the aim is to improve performance in whatever area, it is
essential to think through how one expects this change to happen. A TOC will also guide one’s
choice of key evaluation questions, which are expected to address critical points in the TOC.
This will in turn make sure that the indicators are set up to measure all the relevant steps and
processes and not only to address one level such as outputs, for example.
A strong TOC also helps review processes – whether these are mid-term reviews or summative
evaluations – and allows putting any unintended or unanticipated outcomes in context.
According to Pasanen and Shaxson (2016:9) a useful tool to support the development of one’s
TOC is outcome mapping (OM). This approach focuses on changes in behaviour, relationships,
actions and activities of people, groups and organisations one is working with, engages with
and has an influence on. It uses categories such as “expect to see” to map desired changes. A
detailed TOC can be very complex. The challenge is to combine this complexity with a relatively
simple M&E framework so that together they can provide a coherent narrative about what was
planned and what has been achieved, taking into account any changes in context along the
way. The process of developing a TOC can help clarify the purpose of the M&E activity and
efforts.
2.13 IDENTIFIED KNOWLEDGE ROLES AND FUNCTIONS
Identified knowledge roles and functions of personnel and partners is an important part of
strategic planning in developing an effective M&E system. The process of identifying and
engaging with key stakeholders is not a simple one. There are different roles to be played to
ensure the M&E information is available, understandable and is actively used to inform

36
consultative engagements and policy debates, for example (Pasanen & Shaxson, 2016:9).
Specifically it is essential to have documents to be used during consultative meetings, which
details outcomes to be agreed upon and indicators to be used. The instrument for data
collections should be developed by those with the technical know-how in this area well in
advance. The organisation must also have a well-thought of data management plan.
2.14 CLEAR M&E PURPOSE
Thinking through and agreeing on the purposes or the uses of an M&E system will help develop
a common understanding of why it is being done. Is it for accountability purposes? Is it meant
for decision-making or wider learning purposes? Thinking through the purpose of the M&E
system can be a way to build relationships between partners and other key stakeholders.
Typical M&E purposes include: supporting management and decision making, learning,
accountability and stakeholder management. There are always trade-offs on what to focus on
and which purposes should get more attention; it is thus important to think through and weigh
up the relative importance of each constituent.
2.15 RELEVANCE
The M&E system is regarded as relevant in so far as it is consistent with the Constitutional
mandate regarding CVPs and applies acceptable principles during the design phase (Kimweli,
2013:13); it is also designed in accordance with acceptable principles and practices. This also
means that it has to cover all the pertinent aspects of monitoring and evaluation as espoused in
Section 195 and 196 of the Constitution and determine performance of all entities specified (all
the spheres of government and parastatals).
As the Figure below shows, monitoring activities focus on the progress and tracking of inputs,
implementation of activities and production of outputs. Evaluation tends to take place at specific
points / stages in a project and permits an assessment of progress over a long period of time.
The focus is on tracking changes in relation to outcomes and impact in relation to stated goals
(IFC Advisory Services, 2008:36).
Figure 2-4: The place of M&E in the logic model

37
2.16 CONCLUSION
There is tremendous power in measuring performance. Kusek and Rist (2004) stated the power
of measuring performance as follows:
If you do not measure results, you cannot tell success from failure.
If you cannot see success, you cannot reward it.
If you cannot reward success, you are probably rewarding failure.
If you cannot see success, you cannot learn from it.
If you cannot recognise failure, you cannot correct it.
If you can demonstrate results, you can win public support.
In the same way, the PSC needs to develop a good M&E system that will assist them to
measure the performance of departments regarding compliance with CVPs adequately, using
good models and tried and tested principles, including best practices from leading countries in
conducting M&E activities. Having a dynamic TOC is essential; including ensuring that there is
technical expertise prior to embarking on M&E activities. The next chapter deals with the actual
empirical investigation, where it will be shown how the PSCs M&E system is designed through
the interaction with key informants and other relevant parties involved in this process.

38
CHAPTER 3: EMPIRICAL INVESTIGATION
3.1 INTRODUCTION
The purpose of this chapter is to describe in detail how the empirical investigation was
conducted. The data acquired will be analysed to inform key stakeholders’ views on the
reviewed M&E system; then findings and results will be made. The presentation and analysis of
data collected are according to the three research questions of the study. Predetermined
themes were developed; these in fact represent an overarching construct used to classify
results (Welman et al., 2005:211). These themes are: the profile of the respondents; readiness
for conducting M&E activities; agreeing on outcomes to monitor and evaluate; selecting key
indicators to monitor and evaluate; baseline data on indicators; selecting results targets;
monitoring of results; the role of evaluations; using findings; sustaining the M&E system and
other evaluation criteria.
3.2 DATA COLLECTION
Permission from the Director General of the PSC to conduct the study on the PSC’s M&E
system was sought after and granted on 09 May 2016, prior to the collection of data (see
Annexure 7 for a copy of the letter of approval). In the following section is a detailed discussion
of how data was gathered.
3.2.1 Focus group discussions with key stakeholders
Focus group discussions (FGDs) also referred to as “group interviews”, “group discussions” or
“group interviewing” share a number of features with the in-depth interview (IDI), but also differ
from it in many important ways (Roller & Lavrakas, 2015:104). For example, although the depth
and detail can be gained via group discussions, it is generally less than what can be gained with
IDIs. On 09 July 2016 the PSC held face-to-face FGDs with key stakeholders.
The key stakeholders were given an opportunity to raise their issues and ask questions
regarding the current PSC’s M&E system. The key stakeholders who attended were: DPSA,
DPME, NT, AG, NSG and the Foundation for Human Rights (FHR). There was a facilitator of
the discussion, a commissioner and two moderators, a professor at the University of the
Witwatersrand and an independent consultant of M&E. Both moderators knew the work of the
PSC very well as they had previously worked with the PSC. All the commissioners were present
and PSC officials who had a role to play in terms of rolling out the PSC’s M&E system attended
as well. All the commissioners were in attendance and some key PSC officials who attended as
observers.
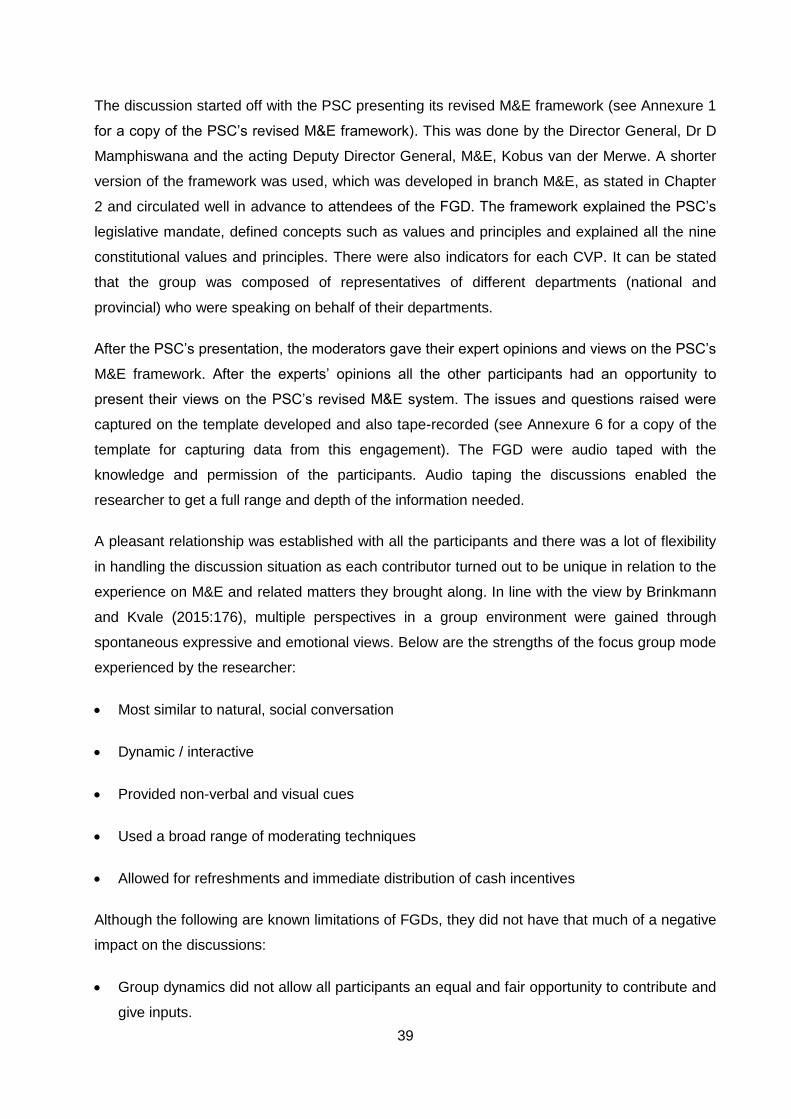
39
The discussion started off with the PSC presenting its revised M&E framework (see Annexure 1
for a copy of the PSC’s revised M&E framework). This was done by the Director General, Dr D
Mamphiswana and the acting Deputy Director General, M&E, Kobus van der Merwe. A shorter
version of the framework was used, which was developed in branch M&E, as stated in Chapter
2 and circulated well in advance to attendees of the FGD. The framework explained the PSC’s
legislative mandate, defined concepts such as values and principles and explained all the nine
constitutional values and principles. There were also indicators for each CVP. It can be stated
that the group was composed of representatives of different departments (national and
provincial) who were speaking on behalf of their departments.
After the PSC’s presentation, the moderators gave their expert opinions and views on the PSC’s
M&E framework. After the experts’ opinions all the other participants had an opportunity to
present their views on the PSC’s revised M&E system. The issues and questions raised were
captured on the template developed and also tape-recorded (see Annexure 6 for a copy of the
template for capturing data from this engagement). The FGD were audio taped with the
knowledge and permission of the participants. Audio taping the discussions enabled the
researcher to get a full range and depth of the information needed.
A pleasant relationship was established with all the participants and there was a lot of flexibility
in handling the discussion situation as each contributor turned out to be unique in relation to the
experience on M&E and related matters they brought along. In line with the view by Brinkmann
and Kvale (2015:176), multiple perspectives in a group environment were gained through
spontaneous expressive and emotional views. Below are the strengths of the focus group mode
experienced by the researcher:
Most similar to natural, social conversation
Dynamic / interactive
Provided non-verbal and visual cues
Used a broad range of moderating techniques
Allowed for refreshments and immediate distribution of cash incentives
Although the following are known limitations of FGDs, they did not have that much of a negative
impact on the discussions:
Group dynamics did not allow all participants an equal and fair opportunity to contribute and
give inputs.

40
Group interactions affected the direction of the outcome of the discussion.
The facilitator needed to be skilled to manage group dynamics, especially participants who
dominated discussions and those who were reluctant to talk.
Since participants were required to be at the same place at the same time, this led to low
levels of cooperation from the many stakeholders invited.
3.2.2 Focus group discussions on norms and standards
On 08 January 2017 there was another focus group discussion with the DPSA on the issue of
norms and standards. The key question was: what is the position of the DPSA regarding norms
and standards. Their views were captured during this formal setting.
3.3 NON-PARTICIPANT/PARTICIPANT OBSERVATIONAL TOOL
An observation tool was designed to assist in gathering data in relation to the three research
questions. Although the data collected during engagements with key stakeholders was primarily
of use to the PSC, using a non-participant/participant observational tool (see Annexure 3 for a
copy of the non-participant/participant observational tool), data needed to address the three
research questions in this study was also collected. The researcher is presented as a non-
participant/participant observer as in certain engagements protocol did not allow for active
participation in certain consultative meetings (engagements). As a non-participant the
researcher’s role was to strictly observe in a completely unobtrusive manner, without any
interaction with the research participants, either remotely or within the study environment. The
observations were overt in nature in that participants were made aware of the identity of the
researcher (Roller & Lavrakas, 2015:173). Observations were made during the following:
workshop with the independent consultant; internal workshop with an independent consultant to
iron out issues before the pilot of the M&E assessment tool; internal workshop on CVPs with
one of the commissioners; report back on CVPs to plenary and a guest lecture by Dr Ray Rist of
the World Bank in 2015.
3.4 QUALITATIVE CONTENT ANALYSIS
Qualitative content analysis is the systematic reduction (condensation) of content, analysed with
special attention on the context in which the data were created, to identify the themes and
extract meaningful interpretations (Roller & Lavrakas, 2015:230). To engage in primary content
analysis means to focus on existing content that is typically in textual form (for example books,

41
reports, newspapers, emails, government documents). In essence, content analysis is a
research method. There were two phases involved in qualitative content analysis, that is:
Phase 1: data generation, whereby the content selected for the study was coded so as to
produce the data.
Phase 2: data analysis, which involved the categorisation and interpretation of the data.
The emphasis on latent meanings and context, as well as the unobtrusive nature of primary
content analysis are key strengths of qualitative content analysis (Roller & Lavrakas, 2015:230).
In Phase 1 the process followed in dealing with the data was as follows:
The researcher endeavoured to gain an understanding of the complete content, which is the
content from all the data sources. It was important to get what is out there and get a sense
of the “whole picture”.
Determine the unit of analysis.
Develop unique codes.
Conduct preliminary coding.
Code the content.
For Phase 2 the researcher identified categories across the codes, identified themes or patterns
across categories and drew interpretations and implications from the data. The following are the
PSC documents analysed:
3.4.1.1 PSC’s M&E booklet
Although this was first published in 2008, it forms part of the PSC’s M&E framework as it is still
being used to date (PSC, 2008:21-80). The booklet provides the basics in M&E, such as the
definition of monitoring and evaluation, importance and purpose thereof. The book was written
during the time of Professor Stan Sangweni as the chairperson of the Commission. Professor
Sangweni was regarded as the champion for M&E during this time. Intended audiences of this
booklet are M&E practitioners, senior managers in the public service and managers of service
delivery units, who produce performance information and statistics, and who are also required
from time to time to reflect on and evaluate the success of their work. Like any other
government, South Africa is expected to demonstrate that tangible results are attained from
M&E activities. The purpose(s) of M&E are listed as: management decision making,

42
organisational learning and accountability, where the latter includes soliciting support for
programmes, supporting advocacy and promoting transparency.
The context of M&E is that of a developmental state. A developmental state is characterised by
strong state interventions and extensive regulation and planning (PSC, 2016). It is important to
know where M&E fits in the policy-making process and implementation cycle. The Cabinet of SA
mandated a Government Wide Monitoring and Evaluation System (GWM&ES). Departments at
the centre of government at the national level are: DPME, NT, DPSA, Stats SA (Statistic South
Africa), COGTA (Cooperate Governance Traditional Affairs) and SAMDI (South African
Management Development Institute). All the line departments at the provincial levels should
implement M&E. For Constitutional Departments, the PSC, AG and Human Rights Commission
should play a leading role in M&E. The PSC uses different perspectives in their M&E activities.
Perspectives point to the main focus of the evaluation. These perspectives are: financial;
customer; learning and growth and internal business process. Values are defined and since
they are multidimensional, the dimension(s) of interest is defined and explained. Then
standards of performance are derived from values.
Batho Pele principles are also used to measure compliance with CVPs. Lastly, how programme
evaluation should be done is explained. There is promotion of the use of logic models, result-
based management and theory-based management. The last chapter of the booklet deals with
the application of all these basics, that is how to design M&E frameworks, formulation of
evaluation frameworks and the use of different perspectives. This book provides the approach
the PSC takes on conducting M&E activities and can be regarded as their M&E framework. It
will be critical to determine if this booklet is still relevant and should be maintained in its current
form as part of the PSC’s M&E framework.
3.4.1.2 PSC’s strategic plans of 2009-2013
Major decisions on the PSC’s M&E system were taken during the strategic plans of between
2009 and 2013. The PSC’s strategic plan of 2009-2013 stated that governance monitoring
should assess the performance of the Department of Agriculture and the Offices of the Premier
in the Provinces, against the nine values in Section 195 of the Constitution, as they had never
been assessed before. The PSC advocated for the use of the Transversal M&E system which
has been operational since 2001. At this time 153 departments (national and provincial) had
been assessed. The PSC also planned for the review of this M&E system in the same financial
years to ensure that it remains relevant and that an appropriate balance is struck between
compliance with good administrative practice on the one hand and service delivery outcomes on
the other.

43
The PSC planned to continue with Programme Evaluation (PE) in the field of poverty reduction,
which remains a priority of government. In the 2011/2012 financial year, the focus of PE was on
the agricultural sector, because of its critical role in rural development, which is one of the
priorities of government. This was never done due to limited human resources and time
constraints. PE also gave the PSC the opportunity to evaluate whether the selected
programmes are achieving their outcome objectives and complementing the monitoring that the
PSC does by means of its Transversal M&E system. The following table summarises the
strategic mandate of chief directorate GM:
Table 3-1: Governance Monitoring’s strategic mandate
Objective Indicators 2010/2011 2011/2012 2012/2013
Improve governance and service delivery by providing departments with monitoring and evaluation information and analysis
Reports with recommendations
State of the public service assessed
State of the public service assessed
State of the public service assessed
Theme approved Reports on the evaluation of findings
Reports on the evaluation of findings
Reports on the evaluation of findings
Reviewed assessment framework
Consolidated M&E reports
Consolidated M&E reports
Consolidated M&E reports
Compliance with acceptable research and M&E
Transversal M&E framework fine-tuned as necessary
Transversal M&E framework fine-tuned as necessary
Transversal M&E framework fine-tuned as necessary
Fact sheet produced
Fact sheet on the state of the public service in the province produced
Fact sheet on the state of the public service in the province produced
Fact sheet on the state of the public service in the province produced
3.4.1.3 Recent strategic plan (2013/2014 – 2017/2018)
The recent strategic plan did not deviate much from the previous one. GM is still expected to
conduct institutional assessments and programme evaluations that support policy and
management decisions. Outputs required are:
17 reports on the evaluation findings of department’s adherence to CVPs.
12 consolidated M&E reports.
1 SOPS report.

44
1 report on the evaluation of findings.
46 % of recommendations implemented.
The main difference is that the PSC is of the view that there must be an action plan developed
to ensure that recommendations are implemented. It was critical to determine how the PSC’s
M&E system was reviewed over the years and what the leadership pronounced on its review,
hence the coding of the past and recent 5-year strategic plans.
3.4.1.4 M&E framework of 2010 to 2012
In Annexure 1, all principles are explained. Then performance indicators and standards were
stated. Underlying assumptions for each principle were given. A list of documents to be
collected from the department was given. The assessment process was then outlined, where
the rating scale to be used was given upfront. For example, if a case management system was
in place, a score of 2 was to be given and if not, 0. The M&E assessment tools of this period
were extremely long (over 100 pages). In cases where interviews were conducted, participants
were identified and interview questions included. In some instances checklists were used and
scores obtained were converted to a percentage (%). Between the 1st and the 2nd research
guide and assessment framework indicators were used and changed accordingly.
3.4.1.5 Current M&E framework
The final draft of the M&E framework was developed by a task team in branch M&E. It was
released on 08 December 2015 for approval by the M&E specialist team. This framework is not
that different from the previous M&E frameworks. The main differences are that the concept
values and principles are defined. Once the document was approved by the M&E specialist
team, it was used by commissioners for consultation with key stakeholders (see Annexure 4 for
the plan for engagements with key stakeholders). The views from these consultative meetings
were used to improve the framework. Also after the M&E tools for each CVP were developed
they were pilot tested, then the roll-out of the M&E framework took place. Annexure 5 contains a
shortened version of the PSC’s M&E framework with indicators for monitoring and evaluation
(PSC, 2016). Annexure 6 shows the template that was used to capture the focus group
discussions, whereas Annexure 7 shows the interview schedule used by the researcher during
FGDs:
The PSC’s M&E system is based upon the development of key performance indicators for each
CVP and development of M&E tools to measure performance of departments on them. The
following are the documents accessed from the PSC’s website (Internet and Intranet). Most of

45
the documents consulted are in the public domain. Since all the data was readily accessible, it
was gathered without the help of data gatherers. The researcher endeavoured to use data that
will help to answer the three research questions in the study.
3.5 INSTRUMENTS AND TECHNIQUES FOR DATA COLLECTION
The instruments for data collection were developed in a deeply intense process. The supervisor
provided guidance during the development of the questions in the instruments used. The
instruments started off with a set of basic questions, which were checked by the supervisor and
other MBA students the researcher regarded as “critical friends” and revised according to
suggestions and comments provided. The refinement of the instruments assisted in focusing the
questions more directly to the three research questions, thereby ensuring that the data collected
would be relevant only to the three research questions. Instruments were piloted before the
actual study and the responses and comments used to refine the instruments further.
3.6 RESULTS AND DISCUSSION
The presentation of the results is in line with the predetermined themes mentioned in section
3.1 above.
3.6.1 Profile of the respondents
There were more females than males for the first focus group discussion. This consultative
meeting was attended by 53 participants, however, only fifteen were actively involved in the
discussion. The rest was made up of PSC officials who attended as observers. Out of the 15,
nine (60%) were females and six (40%) were males. All (100%) participants were members of
the senior management services (SMS). There were representatives from DPSA, DPME, NT,
NSG, FHR, M&E experts and PSC officials.
3.7 RESULTS
To determine how the PSC’s M&E system was designed, the researcher used the ten point
analytical framework of the World Bank to find out if all the steps for designing a relevant,
effective and efficient M&E system were followed. The results of the focus group discussion,
which were corroborated through qualitative analysis results, in relation to the discussion below,
indicated the following:

46
3.7.1.1 Readiness for conducting M&E activities
The results from the focus group discussions, qualitative content analysis and non-participant
observations showed that: considering the three main parts of the readiness assessment which
are discussed below, the data from branch M&E indicates that the PSC is at a very high state of
readiness to conduct M&E activities:
Firstly, the driving need for conducting M&E is legislation. The PSC’s strategic framework
which was consulted shows that the PSC is obligated to determine compliance with CVPs
on an annual basis and report to parliament on its activities. To ensure the PSC is in a
position to meet this legislative/constitutional mandate, branch M&E has been established
and capacitated with the needed expertise in M&E. Additionally targets have been set in the
strategic plan to ensure the PSC meets this mandate.
Secondly, the M&E specialist team that is led by commissioners is also there to provide
strategic direction on how M&E is done within the PSC. The team, as the word denotes, is
made up of specialists in the area of M&E, who may be regarded as champions of the M&E
programme.
Thirdly, several workshops (3) within branch M&E were held to ensure that there is a
common understanding on what needs to be done to implement the reviewed M&E system.
An expert in M&E, Terence Beney (individual consultant), was also called in to help iron out
issues related to the new M&E system, prior to rolling out the system. Of importance, this
expert shed light on the number of indicators for monitoring and evaluation. The M&E expert
advised the PSC to reduce the number of indicators to 39 through prioritisation, the same
advice given by the World Bank representative during the guest lecture conducted in 2010.
When looking at capacity to conduct M&E within branch M&E, the acting DDG: M&E indicated
on being interviewed that all (100%) officials have received training on M&E. All deputy directors
(8) were sent to a refresher course on M&E conducted by the National School of Governance
(NSG) and DPME in 2016. Regarding the capacity
within branch M&E the guest lecture by a
representative of the World Bank also contributed in
improving the knowledge on M&E. The qualitative
content analysis of the published report on this guest
lecture was done. The results show what was
discussed as well as questions and comments posed
by PSC participants, with graphical illustrations:

47
Dr Ray Rist commended three developing countries for best M&E practices, namely: Chile for
Performance Budgeting, Sri Lanka for IT systems and South Africa for National Oversight. He
praised the PSC for promoting M&E in South Africa. According to Dr Rist, the PSC has the
strongest M&E unit in Africa. However, he addressed against five critical factors which he
termed “Warnings for effective M&E system”, namely: data quality, overdesign of systems,
crafting too many indicators, system’s decay and knowledge management. These warnings
formed the gist of his presentation. The following is an overview of Dr Rist’s warnings and the
subsequent questions, comments and responses flowing from his presentation. Dr Rist
highlighted the importance of the following critical factors for an effective M&E system:
Data quality: the PSC was encouraged to always ensure that data collected are credible
and valid and can be trusted. If data are distrusted, then the organisation is distrusted. In the
final analysis, the credibility and reputation of the organisation may be compromised. Data
quality can be assured by having a panel of experts or group of professors to verify the data
and by making use of the national statistics bureau.
Do not overdesign: the presenter made it clear that it is important to keep systems simple
and non-complicated in order to be able to understand and explain them. This is advisable
as many people are still new in the M&E field and therefore may not cope with complicated
systems. Furthermore, avoid setting rigorous data collection standards. This will ensure
compliance or positive response.
Monitoring systems: do not commit to too many indicators: the PSC needs to avoid
having too many indicators as this complicates the system and puts high expectations that
may not be met. Craft only those indicators that you need. M&E systems have a propensity
to be big. It is advisable to start small and keep it simple.
Systems constantly decay: regarding systems, people leave, which necessitates constant
capacity building, updating systems and hard work in order to avoid data loss.
Organisational capacity is important in order “to stay good and get better” at your activities.
Knowledge management: Knowledge sharing and trust, according to the presenter, are
crucial to the success of an organisation. It is important to determine what you know and what

48
you don’t know and to close the gap between what you know and what you don’t know.
Questions and responses
Official 1: What is the appropriate length of an executive summary?
Answer: Long M&E reports are hostile as nobody tends to want to read them. The executive
summary should not be more than four pages. Keep the report short, simple and reader friendly.
Structure the report to be utilisation focused. Take
into account the four types of utilisations, i.e.:
instrumental, behavioural, political and
enlightenment.
Commissioner: How does one deal with the
lack of knowledge/information sharing in an
organisation?
Answer: This can be achieved by changing the
organisational culture. One possible way is to create incentives for people who share
information. Do not reward bad behaviour, or not sharing information. Create conditions for
change.
Official 2: What should the OPSC do to validate and support the data given by client
departments in order to ensure that findings and recommendations are solid and based on
comprehensive information?
Answer: The OPSC needs to conduct triangulation in its data collection process and this can
be done by, amongst others, using different methods, citizens’ surveys, video summaries,
YouTube, content analysis and applying the principle of “trust but still verify”. Citizen scorecards
are powerful tools for gaining insight on public performance as well as a sense of what’s
happening in departments.

49
Official 3: How important is the quality of systems used to analyse data?
Answer: The quality of the systems ensures quality data, authenticity, verification and
credibility. One is able to interpret the findings better and give an account of how one arrived at
a certain conclusion(s). The significance of the people who have to analyse such data has also
been emphasised.
Official 4: Should there be a limit with the number of indicators even though one may have
not achieved the objective or should one continue developing more indicators till the ultimate
objective has been achieved?
Answer: There should not be more than seven indicators. Set only indicators on what you need
to know.
Official 5: How does one evaluate a programme with unclear objectives and indicators?
Answer: What gets measured gets done. When wrong things are measured, wrong things are
done.
Comments by the PSC officials
Comment 1: The talk by Ray Rist was extremely important and well timed. However, once-off
lectures have limited impact if the intended outcome is greater awareness regarding data
integrity, knowledge management and organisational culture. Assessing the unit against the
principles listed by Ray, would be very useful and insightful. The findings could be used to
develop a more sustained skills development programme for staff. In my opinion we must
develop data analysis techniques which will allow us to mine the considerable database (paper
based) we currently have. This will allow us to make more effective interventions.
The PSC’s current status as a policing body (SIU is exceeding us by far) instead of
promoting/providing solutions to poor and inefficient governance is not sustainable. PSC should
be the (think tank) for government. The OPSC does not have an advocacy and lobbying
strategy (beyond occasional media releases), nor does it appear to have formed relationships
with civil society organisations and other constitutional bodies which will considerably extend
the reach and capacity of the OPSC.
Comment 2: The striking feature about the doctor’s discussion is that he singled out the
importance of knowledge management and the fact that organisations should acknowledge that
there are things that they do not know and should avoid systems decay by improving on human
capacity through training. Furthermore, the regions should always be involved and that M&E

50
systems should be made simple for easy application or implementation. Emphasis was also put
on keeping quality standards for data simple.
Comment 3: I found the lecture to be very interesting and insightful, especially the warnings as
they play a very pivotal role in our M&E reports. Dr Rist mentioned that there is a need for
constant capacity building in order for the organisation to be successful. I fully support him in
this regard. I also felt that concerns and questions were responded to in a professional
comprehensive manner. My concern was whether there should be a limit on the number of
indicators even though one may have not achieved the objective, or should one continue
developing more indicators till the ultimate objective has been achieved?
Comment 4: Dr Rist’s lecture was quite good, especially because he pointed out the strength of
the South African M&E system and importantly that we are the best in Africa. One would have
liked this comparison to be taken further and included
developed countries to know how we compare
globally. What did not come out clearly was which
system this refers to. Does this refer to the PSC’s, the
Presidency’s or those residing in different
departments or even a combination of the three?
Nevertheless it felt good to know how someone from
the World Bank organisation, an M&E guru, feels
about our efforts as a country and the PSC as a
leading government institution in monitoring and evaluation of the SA government. I do not think
anyone would have been as frank as Dr Rist in pointing out areas of weaknesses. I am also
glad that this was said to the right audience with the right leadership able to take those
comments further.
Comment 5: I think the pointers by Ray have strategic implications for the culture in the office,
our work processes and also for the organisational structure of the branch: M&E. These in short
are:
Organisational culture: We have to start encouraging creativity and initiative in the office
again - we have become so timid and rigid in the ways we approach our work, especially
what is permitted to be in our reports and the way we write that we are adding no value with
these reports that are casted in the "correct" format. We are still under the spell of "fear".
Work processes: Following on the culture, our work processes have also become very rigid -
not allowing for any development; even the lengthy reports!

51
Organisational structure of the branch: M&E. It was clear that customer satisfaction surveys
are monitoring tools. It should therefore sit with CD: GM and the system should be further
developed just like the M&E system - the regional office can also become involved in these
and we could do more in a financial year! The D: PE could be moved to CD: SDCE because
all of these programmes that are evaluated are focusing on service delivery.
Comment 6: On data quality Dr Rist emphasised the importance of ensuring that the data we
use is of good quality. I therefore think it will be very crucial if officials could be trained in the
development of databases for all the data we use. Maybe such training can be done in
conjunction with Stats SA as they are experts in data management.
On knowledge management: The establishment of formal mentoring programmes can be
used to ensure development of junior officials.
On citizen scorecards: Citizens’ scorecards can be used in conjunction with our citizens’
satisfaction survey in order to augment the information that is received through our usual
citizen survey.
Comment 7: The guest lecture offered us a rare opportunity of interacting with Dr Rist, a
respected international M&E expert. Like a true father of M&E he warned us against five critical
M&E pitfalls. His warnings will remain indelible in my memory for many years to come and will
certainly guide me throughout my M&E career. Like a kindergarten teacher he presented in a
simple, sweet, succinct, step by step and logical manner; even an M&E beginner could have
benefitted from his presentation. How I wish we could have more lectures of this nature!
Comment 8: My comment is on the way forward, particularly the role of the PSC in ensuring
that such powerful message (Rist’s presentation) gets to the officials tasked with performing
M&E function in departments. Whilst we need to applaud ourselves as the best performing
institution in the region, we also have a responsibility to ensure that the rest of the public service
understand what they need to do and how to do it as far as M&E is concerned. I believe that if
we are able to address a matter of this nature, we will be able to deal with a lot of challenges
experienced in departments regarding M&E.
The above lecture and intense engagement by the officials within branch M&E, clearly show
that those officials within this branch had insight on what M&E is all about. However, the missing
element is a documented TOC (theory of change), which in essence should spell out how the
PSC intends to improve performance of departments regarding compliance with CVPs.

52
3.7.2 Agreeing on outcomes to monitor and evaluate
Experts in M&E say the following: When choosing outcomes, do not travel the road alone. This
means that key stakeholders need to be consulted to give their inputs. The acting DDG: M&E
on being interviewed stated that all (100%) key stakeholders were consulted regarding the
development of indicators to monitor and evaluate. However, they were not required to give
their inputs on the outcomes to monitor and evaluate. The reason for not requiring key
stakeholders to give inputs regarding the choice of outcomes is that the outcomes for CVPs are
a given; they are derived from the PSC’s mandate itself.
It is critical that key stakeholders have a say on the outcomes to monitor and evaluate, so as to
get their buy in. Care was taken by the PSC to invite key stakeholders during the first focus
group discussion to get their view and opinions on the new PSC’s M&E system. Imposing
outcomes on them may prove detrimental in the long run as they may turn and say that this is
not what they have committed themselves to do. When it comes to indicators, key stakeholders
were given sufficient time to discuss them within their departments and to give inputs and
comments to the PSC. Their inputs were used to further improve on them. M&E experts,
Terence Beney and Professor Fitzgerald, who were invited by the PSC, also gave advice on
indicators, for example; the M&E expert said that the indicators should be reduced from over
100 to 39 to make them manageable; advice that was given by Dr Ray Rist as well.
3.7.3 Selecting key indicators to monitor and evaluate
Additional to the above discussion, during one of the focus group discussions experts in M&E
made it clear that a lot still needs to be done regarding the indicators. They advised on
prioritising on those indicators that will really help to measure the performance of the
departments on CVPs. From prioritisation, then the number could be reduced. The use of proxy
indicators was also highlighted as in certain instances it was very difficult to indicate how the
outcome will be measured. As indicated during focus group discussions by M&E experts, it is
better to be approximately correct than precisely wrong. The PSC selected what they call
SMART indicators and the process of doing this is very clear. All the departments were written
letters where the draft indicators were included and given an opportunity to give inputs.
Although not all departments responded, some comments were useful in assisting to refine the
indicators further. Below is an excerpt from what one of the M&E experts said during one of the
focus group meetings:
“Indicators will have to be designed and re-designed and thought through again and again
through many meetings and iterations. Ambitious intellectual project here – hang in there – if

53
you stay on course, the M&E instrument can greatly benefit the country. This is an enormous
technical and coordination task. You will need to be on your best game.”
On principles of designing the M&E system participants said the following: key stakeholders
(100%) were consulted regarding the development of indicators to monitor and evaluate,
however they were not required to give their inputs on the outcomes to monitor and evaluate.
Experts in M&E say it is critical that key stakeholders have a say on the outcomes to monitor
and evaluate, so as to get their buy in. Imposing outcomes on them may prove detrimental in
the long run as they may turn and say this is not what they have committed themselves to
doing. When it comes to indicators key stakeholders were given sufficient time to discuss them
within their departments and to give inputs and comments to the PSC. Their inputs were used to
further improve on them. M&E experts who were invited by the PSC also gave advice on
indicators for example; Terence Beney said the indicators should be reduced from over 100 to
39 to make them manageable.
3.7.4 Baseline data on indicators
Baseline data on indicators has been kept over the years (since the inception of the M&E
system). This was done manually, that is in electronic files and hard copies. There is a record of
indicators used over particular periods, those that were dropped in the process and new
additions. The principle here is that an indicator should be used for a period of three years and
once it is clear what kind of information it provides, it should be improved. The indicators that
were dropped during the development of the new M&E tool were the ones in which the PSC had
sufficient information about the departments already. It was deemed not necessary to collect the
same information again.
To manage the data on indicators, there has been a shift from the manual system to the use of
a web-based data warehouse which was established in 2016. It was envisaged with this data
warehouse that, instead of conducting site visits to collect data, departments will be required to
submit the needed data on MS-Excel through the data warehouse. This data would then be
analysed and a report generated. Of importance, the data warehouse is to enable the PSC to
track the progress departments are making regarding implementation of the recommendations
made. A key element regarding the new M&E system is the conduct of pilots. Three pilots were
conducted between 2016 and 2017 and the results used to further refine the M&E tool.
3.7.5 Selecting result targets
The new M&E system shows that result targets are set annually as the PSC is expected to
determine compliance with CVPs on an annual basis. These targets clearly specify what is

54
being tracked, the expected amount of change or improvement and a timeframe by which the
target will be achieved. Based on non-participant observations made, it can be safely stated that
careful consideration was taken in setting targets. All the needed inputs were taken into
account. Qualitative content analysis of the M&E assessment tool showed that each indicator
has only one target over a specified timeframe.
3.7.6 Monitoring for results
Qualitative content analysis of the PSC’s M&E framework showed that the PSC is attempting
result monitoring. With result-based monitoring outcomes and targets should link to annual work
plans as well as the continuous flow of information up and down the system. The biggest
challenge the PSC faces is that there is no evidence that departments are consciously planning
for meeting PSC’s targets regarding CVPs in their strategic plans. The monitoring and
evaluation is therefore happening in a vacuum and that is why it is difficult to see the impact of
the PSC’s efforts.
Regarding monitoring of compliance with CVPs, there is no routine collection and analysis of
information to track progress against set plans and to check compliance to established
standards. Although generalisation of results is an acceptable practice, the PSC only gets an
indication on how departments perform on CVPs from a very small sample. The ideal is for the
PSC to develop a mechanism where all the departments will account on a regular basis
(quarterly) on meeting agreed-upon targets for performance in CVPs. It will then be easy to
identify which departments are not performing according to the set standard, where a different
process (evaluation) should be put into place to determine why there is no expected
performance and what can be done to help improve performance. If the PSC is unable to get
first-hand information, it needs to collaborate with the DPME or NT to get quarterly reports from
them. Currently the monitoring and evaluation lines are too blurry; it seems as if monitoring is
masqueraded as evaluation.
3.7.7 The role of evaluations
Evaluations involve identifying and reflecting upon the effects of what has been done and
judging their worth. Evaluation of findings allows for learning from the experience and
improvement of future interventions. Undoubtedly, the PSC has over the years documented
their learning in the PSC News and endeavoured to improve how they conduct M&E activities.
There is very little evidence that key stakeholders, who include local communities and different
societal groups, are involved in the evaluation. The negative effect of this is that it limits getting
different perspectives, learning and ownership of the evaluation findings. The approach and

55
method used in an evaluation should be determined by the audience and purpose of the
evaluation.
3.7.8 Reporting findings
Results from the PSC’s strategic plan indicate that careful consideration was taken on
determining what outputs will be produced. For example, with the current capacity within branch
M&E, there will be:
17 M&E reports produced.
12 consolidated M&E reports produced.
1 SOPS report.
1 report on the evaluation of the findings.
46% of the recommendations implemented.
However, it is questionable whether the M&E information will serve the needs of the intended
audience since departments do not know much about what CVPs are all about. The fact that
M&E reports are sent to individual departments for inputs before they are published, the final
M&E reports convey technically accurate information.
3.7.9 Using findings
The ultimate goal of M&E findings is to improve performance. Over the years there has been a
challenge in measuring the efforts of the PSC in this area. However, with the reviewed M&E
system there is a conscious decision to track the implementation of recommendations. Those
who make recommendations will be required to make appropriate ones that address the issue
at hand. This is one major difference between the earlier M&E system and the new one. To
ensure that there is learning, there will be a report issued by the departments from which data
was used. One of the major platforms of the PSC is the National Assembly where they are
expected to share the findings of performance on CVPs with parliamentarians. This means M&E
findings are widely disseminated, but there is still more that can be done in the form of journal
articles, conference presentations and workshops with all involved.
All stakeholders concurred with the recommendations made by the PSC in their reports. A quick
glance over the recommendations made in the SOPS report of 2012 shows that appropriate
recommendations were made. The challenge is with the implementation of those

56
recommendations, especially where there is a negative finding. The other challenge is with
regards to the follow up by the PSC on the implementation of the recommendations.
3.7.10 Sustaining the M&E system
The issue of standards poses a serious challenge towards the sustainability of the PSC’s M&E
system. Since the Office of Standards of the DPSA has been tasked with the responsibility of
developing minimum norms and standards for CVPs, a DPSA representative said the following
during the focus group discussions: “You cannot go and measure indicators if you have not
determined standards (the process is at this stage: vision has been communicated; consultation
to follow).” According to the DPSA, a norm is defined as a legal instrument; standard: best
practice, which is acceptable and applicable, determined by the designated committee during a
formal process. Morality and ethics are defined in legal terms, however there are behavioural
aspects.
The participant further indicated that the issue of ethics is that things get codified (there is
general social mores, generally accepted from morality of a grouping of people which helps you
arrive at ethics). Then what about value-laden issues? To arrive at this determination, whose
social mores dictates what is regarded as acceptable? When you codify something we need to
come to a common understanding – because if you want to take compliance action against
someone who has deviated from ethics, you have to be clear that the ethical basis came from a
generally accepted system, something that will only be addressed during the standard setting
process before even coming to indicators.
3.8 RESULTS ON WHAT THE CHALLENGES EXPERIENCED WERE DURING THE
DESIGN PROCESS
The main challenge regarding the PSC’s M&E system is the legislative overlap with the DPSA
on norms and standards for CVPs. The PSC is mandated to monitor compliance with CVPs,
whereas the PAMA Act requires the DPSA to develop norms and standards for monitoring
compliance with CVPs. Unfortunately the process of development of norms and standards by
the DPSA is at an initial stage, as explained by the DPSA during the discussion. The question of
which norms and standards will be used by the PSC and whose norms and standards will be
used become relevant. Of importance is, should the PSC wait until the DPSA has completed the
process of development of norms and standards, which is intense on its own, if they should
develop their own norms and standards in the meantime.
On the promotion of CVPs, there is not much evidence that what the PSC regards as
promotional activities are effective enough, as most departments still do not know what CVPs

57
are. The situation of the past promotional activities has not changed much to date. There was
talk about having banners with CVPs being used during meetings, as one of the promotional
activities, however, due to financial constraints this idea has not taken off. There was also
another idea of printing CVPs on official’s salary advises, however, by the time of the end of this
study, this had not happened. It is apparent that departments are not consciously planning for
attainment of the goals and objectives of the CVPs in their strategic plans. A sample of 10
national and 30 provincial departments’ annual reports for the financial year 2015/2016 showed
that none (0%) had anything to report on CVPs. It was also very difficult to trace units within
these departments that could be held accountable regarding CVP activities. This trend has
persisted since the inception of the M&E system in the PSC.
With regard to the use of proper research designs, the current M&E system shows a
tremendous improvement of the past one in that all the M&E tools developed were pilot tested
prior to rolling out the implementation. Proper sampling techniques are used to draw a
representative sample. Unfortunately there are no systems in place to ensure that there is
adherence to proper M&E standards and ethical clearance consideration as the PSC does not
have the ethics committee, nor is it affiliated to any organisation that promotes acceptable M&E
standards.
There is no routine collection and analysis of information to track progress against set plans and
to check compliance to established standards on CVPs. The PSC gets an indication on how
departments perform on CVPs from a very small sample, which may not be representative of
the entire population. Scientifically, this poses a challenge regarding generalisability of results.
Although the PSC has over the years conducted programme evaluations, there is a range of
evaluation types which need to be explored. To mention a few: formative evaluations;
summative evaluations; midterm evaluations; final evaluations; internal evaluations; external
evaluations; real-time evaluations and meta-evaluations (IFRC, 2011:15). There is also no
evidence of a documented Theory of Change.
3.9 SUMMARY
The new M&E system was analysed in relation to the ten steps of developing a good M&E
system advocated for by the World Bank. The data mainly came from focus group discussions,
non-participant / participant observation tools and qualitative content analyses. The results
indicate that the PSC is doing well on a lot of areas of analysis. For example, the fact that there
is capacity in terms of the requisite skills and expertise regarding M&E is unquestionable.
However, despite all this, there are areas that need to be strengthened and improved going
forward. This will be highlighted in Chapter 4.

58
CHAPTER 4: CONCLUSION AND RECOMMENDATIONS
4.1 INTRODUCTION
In this chapter, the overall analysis of the research results in relation to the main research
problem, implications of the findings and recommendations will be made. The main research
question was: “How relevant, effective and efficient is the PSC’s new M&E system?” To make
the question operational, three research sub-questions dealing with how the PSC’s M&E system
was designed, what were the challenges experienced during the review process and what
needs to be done to improve it. There was a ten point analytical framework used for this study
advocated for by the World Bank for designing a good result-based M&E system. The PSC’s
new M&E system was evaluated against this analytical framework. Strengths and weaknesses
in each area were identified. This chapter will address the following: what can be done to
improve the PSC’s M&E system going forward?
4.2 CONCLUSIONS AND RECOMMENDATIONS
Any system should be subjected to the review process to determine if it is going according to
plan. It was extremely good for the PSC when they realised that the old M&E system is not
giving them the needed results to put it on hold and embark on its review. The review process
took almost six years. The feedback information from this exercise was used to effect the
needed changes. These sentiments are in line with the conceptual framework of this study
stated in Chapter 1. The section below details the conclusion(s) of this study.
4.2.1 State of readiness to conduct M&E activities
Strengths: a readiness assessment is like constructing the foundation for a building. A good
foundation provides support for all that is above it. It is below ground, not seen, but critical. The
extent of consultation with key stakeholders cannot be questioned in this regard. There is ample
evidence that the consultation was planned and systematic. The data showed that during the
review (design) process the PSC developed a document that was used during the consultative
meetings with key stakeholders. This document was in essence the M&E framework. It detailed
everything regarding what will be monitored and evaluated, why, how and by whom. It also
explained the PSC’s constitutional mandate and clarified terms to the reader. The development
of this consultative document was an intense process that did not happen overnight as there
was a lot of research to be done.

59
The responsibility of developing the new M&E framework was given to a small task team made
up of experienced M&E practitioners and long-serving officials of the PSC who had a history of
the implementation of the M&E system. A shorter version of this document was used by
commissioners during their consultative meetings. It was also given to M&E experts for the
purpose of critiquing it. The inputs from these experts were used to further refine the M&E
framework. All the national and provincial departments were given the same document to
provide their inputs and comments. Although not all departments responded, a few did give
valuable inputs that were considered and used to further improve on the PSC’s M&E framework.
The establishment of the web-based data warehouse was also one of the strengths of the
PSC’s M&E system. With this type of data warehouse massive data acquired on indicators will
be managed more effectively, unlike manually. Data from the guest lecture by a World Bank
representative cautioned against the quality of data used in the previous M&E reports. Indeed,
even the PSC acknowledged the difficulty of getting accurate and dependable data from
departments. It is on the basis of getting quality data where the M&E report could be said to be
technically accurate.
The fact that there is a high state of readiness to conduct M&E activities is indisputable. Informal
interviews within branch M&E indicated that all (100 %) of the officials within that branch were
well trained on M&E. They had been engaged in M&E activities since 2001. They also benefited
from the guest lecture by a World Bank representative, pioneers of M&E.
Weaknesses: technical skills of employees in branch M&E in the following areas are not up to
standard:
Project and programme management.
Data analysis
Project and programme goal establishment
Budget planning and management
Performance auditing
Although there was a project plan for the piloting and roll-out of the M&E system, it was not
adhered to. The quality of data acquires determines to a large extent the quality of data
analysis. The data showed that the PSC does not have cutting edge data analysis tools such as
the SPSS for analysis of quantitative data and Atlas Ti for analysis of qualitative data. Very high
project and programme goals were set and it is unlikely that they will be met. Participants

60
specifically indicated that it would be difficult to reach the 46 % of implemented
recommendations. Much of the allocated budget in branch M&E goes into salaries and very little
goes into M&E activities. There is no mechanism in place to measure the impact of the PSC on
improving compliance with CVPs. Other factors may be contributing to the performance other
than the PSC.
Recommendations: although there was consultation with key stakeholders on the choice of
indicators, they were not required to give inputs on outcomes to monitor and evaluate. M&E
experts say that it is important to get key stakeholders’ buy-in regarding outcomes; otherwise
they may turn around and say that they did not commit themselves to those outcomes.
Technical skills of those involved in M&E activities need to be improved by way of training. The
PSC should also conduct performance audits in departments to determine what contributes to
the performance or lack thereof in the area of CVPs.
The PSC must develop an effective promotional programme on CVPs where officials in
departments will get to know about the work of the PSC, what CVPs are and what to do to
comply with them. Such promotional work may include road shows and workshops. However
the current situation cannot be condoned as it renders the M&E efforts useless.
4.2.2 Agreeing on outcomes to monitor and evaluate
Strengths: all the relevant key stakeholders were consulted. Specifically the PSC had a focus
group discussion with the DPSA to thresh out issues on norms and standards for monitoring
compliance with CVPs. Key departments such as the DPME, NT and AG were invited to give
their inputs and comments on the new M&E framework. Of note, letters were written to all
departments where their inputs of the new M&E framework were solicited and used to further
refine it.
Weaknesses: although there was consultation with key stakeholders on the choice of
indicators, they were not required to give inputs on outcomes to monitor and evaluate. M&E
experts say that it is important to get key stakeholders’ buy-in regarding outcomes; otherwise
they may turn around and say that they did not commit themselves to those outcomes. The
other critical weakness of the system is the lack of promotional activities on CVPs. Officials in
departments do not know what CVPs are and what to do to comply with them. The PSC focuses
on compliance monitoring, understandably so, as this is their mandate, however, other forms of
evaluation are needed, such as impact assessments.

61
Recommendations: the PSC should not rely on letters and consultative meetings to consult
with key stakeholders. They should hold intense workshops where the process of setting and
agreeing upon outcomes is followed. This process entails:
Identification of specific stakeholder representatives.
Identification of major concerns of stakeholder groups.
Translation of problems into statements of possible outcome improvements.
Disaggregation of outcomes to capture key desired ones.
Development of a plan on how these outcomes will be achieved.
4.2.3 Selecting key indicators to monitor and evaluate
Strengths: all departments and key stakeholder representatives were consulted on indicators to
monitor and evaluate. Valuable inputs were received which were used to further refine the
indicators. An expert in M&E offered valuable inputs on what needs to be done to have a set of
good indicators. The PSC did not develop indicators in one go; it took more than one try and
arriving at the final set of indicators took time. Since the M&E tool was pilot tested, the results of
the pilot were used to further refine the indicators.
Weaknesses: some of the indicators developed indicated that there was no technical expertise.
For example indicators for CVP 5 were not constructed in line with acceptable principles. They
sounded like mere statements.
Recommendations: improvement of technical expertise in the development of indicators is
essential.
4.2.4 Baseline data on indicators
Strengths: baseline data on indicators is available and was managed manually in the past. The
PSC has an electronic copy of how indicators performed over different periods of M&E. The
establishment of the web-based data warehouse was also one of the strengths of the PSC’s
M&E system. With this type of data warehouse massive data acquired on indicators will be
managed more effectively, unlike manually. Data from the guest lecture by a World Bank
representative cautioned against the quality of data used in the previous M&E reports. Indeed,
even the PSC acknowledged the difficulty of getting accurate and dependable data from

62
departments. It is on the basis of getting quality data where the M&E report could be said to be
technically accurate. Again, this data warehouse will assist with management of baseline data.
Weaknesses: not all officials in branch M&E were trained on the use of the newly established
web-based data warehouse. New technologies may be frowned upon by older employees and
require a total shift of mindset.
Recommendations: all officials in branch M&E should receive the needed training on the use
of the web-based data warehouse.
4.2.5 Selecting results targets
Strengths: since baseline data was available within the PSC on indicators, targets were based
on known resources (financial and organisational), plus a reasonable projection of the available
resource base over a fixed period of time. Of importance, each indicator had its own target. A
participatory and collaborative process assisted greatly in setting realistic targets.
Weaknesses: none
Recommendations: to continue engaging departments on targets
4.2.6 Monitoring for results
Strengths: although the PSC is involved in compliance monitoring as required by Law, it is
doubtful if they are monitoring results.
Weaknesses: the PSC’s M&E system is not aligned with annual plans of departments and
work-plans. The PSC focuses on implementation monitoring (inputs, activities, outputs),
whereas result monitoring requires that targets be set at the outcome and impact levels.
Recommendations: indicators and targets for monitoring and evaluation must be set at all
levels of the logical framework (inputs, activities, outputs, outcomes and impacts).
4.2.7 The role of evaluations
Strengths: in fulfilment of the legislative mandate, compliance monitoring is done. Programme
evaluation is also conducted.
Weaknesses: The PSC also mainly focuses on programme evaluation, having a dedicated
directorate for this. This means, based on the monitoring reports, areas of weakness are
identified and an in-depth evaluation is done to determine the reasons why that particular

63
programme did not perform well. It is critical to know when to conduct monitoring activities and
when to do evaluations; clearly the PSC is applying the logical framework well. The evaluation
reports of the PSC can be used by individual departments to help make resource allocation
decisions, rethink the causes of a problem and identify emerging problems, if used
appropriately.
Recommendations: It is also important to conduct impact assessments and not focus on
compliance monitoring only. The timing of evaluations is also important. Any time that there are
concerns about which evaluation information can be useful, is the time to gather evaluative
information.
4.2.8 Reporting findings
Strengths: The other strength of the PSC’s M&E system is in the area of reporting. As a
requirement, the PSC needs to report to the provincial legislatures and national assembly on
the state of the public service. With the new M&E system the reporting will still happen as
mandated. There is an improvement on implementation of recommendation. The PSC will now
track implementation of recommendation to ensure that areas of weakness are addressed. The
web-based data warehouse will assist in tracking implementation of recommendations. There
are oral presentations and written reports to the target audience. The structure of the SOPS
reports is good, with room for executive summaries and visual presentation of data. The
PowerPoint presentations to be used at the National Assembly and Provincial Legislatures
stand to convey a very clear message on the state of the public service.
Weaknesses: none
Recommendations: to strive towards ensuring that the reports are technically accurate
4.2.9 Using findings
Strengths: M&E information can make a dramatic contribution to improving departmental
performance if it is effectively communicated to stakeholders, including citizens. With the SOPS
reports all departments will get to know the state of public service regarding the CVPs.
Weaknesses: it is one thing to get a report, but another to use the information and implement
the recommendations. A lot of participants highlighted the fact that nothing is being done to
departments who do nothing about the PSC’s findings.

64
Recommendations:
4.2.10 Sustaining the M&E system within the PSC
Strengths: There seems to be no challenges regarding the sustainability of the PSC’s M&E
system as the mandate is legislative. There is evidence that the PSC is carrying out its mandate
as in section 195 and 196 of the Constitution.
Weaknesses: none
Recommendations: the PSC needs to increase the budget allocation for branch M&E to
ensure much in the area of M&E is done.
4.3 ACHIEVEMENTS OF THE OBJECTIVES OF THE STUDY
The study was about the analysis of the PSCs M&E system. In analysing the PSCs M&E
system the researcher determined if the ten steps of designing the M&E system as advocated
for by the World Bank were followed. Different sources were consulted to determine how an
effective M&E system can be designed. Also, focus group discussion with different
stakeholders, qualitative content analysis and participant/non participant observations was
conducted. As indicated, the results did not come from only one source of data but different
sources. The challenges experienced during the design of the new M&E system were also
identified and probable solutions sought after. The data collected showed that the PSCs M&E
system was designed very well, with a few areas of concern.
4.4 RECOMMENDATIONS FOR FUTURE STUDY
The challenges towards full-scale implementation of M&E due to lack of funding, necessitates a
study in the area of cost effectiveness of the M&E system in the PSC.
4.5 SUMMARY
The PSCs M&E system was designed well, in line with the ten steps of designing a good M&E
system, with a few areas of concern. The main areas of weakness are the lack of promotional
activities of CVPs, Theory of Change and the legislative overlap regarding CVPs. To improve on
these areas the PSC need to ensure departments are aware of what CVPs through promotional
activities, develop and document a Theory of Change and use interim norms and standards for
determining compliance with CVPs, whilst waiting for the DPSA process to be completed. The
PSCs mandate to determine compliance with CVPs cannot be stopped due to the fact that the
DPSA has been tasked with the responsibility of developing norms and standards for

65
compliance with CVPs. The thorny issue in this whole process is the lack of consequences for
non-performance by government departments. It has been mentioned in Section 2.7 above that
departments that scored 0% - 20% on the Governance Scorecard are said to be non-performing
and those that end with a score of 21% - 40% are regarded as poor performers. As a matter of
principle, a development plan should be put in place to help these departments to improve their
performance. However, if after development plans there is still no improvement, there must be
consequences, otherwise, leaving the situation as is defeats the purpose of M&E.

66
LIST OF REFERENCES
ACF International (2011) in Mapfumo, T. 2016. Monitoring and Evaluation of HIV/AIDS
programmes by Non-Governmental Organisations: a case Study of uMngeni Local Municipality,
KwaZulu-Natal, South Africa. Masters Dissertation. Durban University of Technology. South
Africa.
Binsardi, A. 2013. Business Research methods. London. Northwest Academic Publications.
Byamugisha, A. & Asingwire, N. 2012 in CLEAR (Centre for Learning on Evaluation and
Results), 2012. African Monitoring and Evaluation Systems: Exploratory Case Studies.
Graduate School of Public and Development, University of the Witwatersrand, Johannesburg.
Bryman, A., Bell, E., Hirschohn, P., dos Santos, A., du Toit, J., Masenge, A., & Wagner, C.
Research Methodology: Business and Management Contexts. Oxford University Press.
Southern Africa (Pty) Ltd.
Chaplowe, S. G. 2008. Guidelines on Monitoring and Evaluation. Short Cuts, September
2008:1-11.
Cooper, D.R., & Schindler, P.S., 2014. Business Research Methods 12th Ed. Asia: McGraw-Hill
Education.
Collins, J. & Hussey, R. 2014. Business Research: a practical guide for undergraduate and
postgraduate students. United Kingdom. Palgrave Mcmillian.
Creswell, J. W. 2014. Research Design: Qualitative and Quantitative Approaches. London:
Sage.
Creswell, J. W. 2013. Qualitative Inquiry and Research Design. London. SAGE.
Denzin, N. K. & Lincoln, Y. S. 2011. The Handbook of Qualitative Research. London. Sage
Publications.
Djidjoho, A. N. & Houinsa, D. G. 2012 in CLEAR (Centre for Learning on Evaluation and
Results), 2012. African Monitoring and Evaluation Systems: Exploratory Case Studies.
Graduate School of Public and Development, University of the Witwatersrand, Johannesburg.

67
Fouka, G. & Mantzorou, M. 2011. What are the major ethical issues in conducting research? Is
there a conflict between the research ethics and the nature of nursing? Health Science Journal:
5(1): 3-14.
Furubo, J.E.R., Rist, C., & Sandahl, R. 2002. International Atlas of Evaluation. New Brunswick,
NJ: Transaction Press.
Gill, J. & Johnson, P. 2010. Research Methods for Managers. London. Sage Publications.
Gopane, O. M. 2012. Effectiveness of the eastern Cape Provincial Department of Local
Government and Traditional Affairs to Monitor and Evaluate the Performance of Municipalities:
A case Study of Cacadu District Municipality. Masters Dissertation. Cape Peninsula University
of Technology. South Africa.
GÖrgens, M & Kusek, J. Z. 2009. Making Monitoring and Evaluation Systems Work: A capacity
development toolkit. The World Bank, Washington DC, USA.
Govender, I.G. Monitoring and Evaluation systems for enhancing governance and government
legitimacy in South Africa. Journal of Public Administration, 48(4.1):811-823.
Govender, I.G. & Reddy, P.S. 2014. Monitoring and Evaluation in Municipalities: a case study of
KwaZulu-Natal Province. Administration Publica, 22(4):160-177.
Hardlife, Z. & Zhou, G. 2013. Utilisation of Monitoring and Evaluation Systems by Development
Agencies: the case of the UNDP in Zimbabwe. American International Journal of Contemporary
Research. 4(3):70-83.
Ile, I., Eresia-Eke, C., & Allen-Ile, C. 2012. Monitoring and Evaluation of Policies, Programmes
and Projects. Hatfield, Pretoria: Van Schaik Publishers.
Ijeoma, E. 2014. Introduction to South Africa’s Monitoring and Evaluation in Government.
University of Fort Hare: Verity Publishers.
IFAD (International Fund for Agricultural Development). (2002) in Kusek, J. Z. & Rist, R. C.
2004. Ten Steps to a Results Based Monitoring and Evaluation System. The World Bank.
Washington: United States of America.
IFC (Investment Climate Department). 2008. The Monitoring and Evaluation Handbook. Danver,
MA. United States of America.

68
IFRC (International Federation of Red Cross). 2011. Project/Programme Monitoring and
Evaluation (M&E) Guide. Geneva. Switzerland.
Kimweli, J. M. 2013. The Role of Monitoring and Evaluation Practices to the success of Donor
Funded Food Security Intervention Projects: A case study of Kibwezi District. International
Journal of Academic Research in Business and Social Sciences, 3(6):9-19.
Kusek, J. Z. & Rist, R. C. 2004. Ten Steps to a Results Based Monitoring and Evaluation
System. The World Bank. Washington: United States of America.
Kusek, J. Z. & Rist, R. C. (2004) in Ijeoma, E. 2014. Introduction to South Africa’s Monitoring
and Evaluation in Government. University of Fort hare: Verity Publishers.
Lazenby, K. 2015. The Strategic Management Process: A South African Perspective. Pretoria:
Van Schaik Publishers.
Leavy, P. 2014. The Oxford Handbook of Qualitative Research. Oxford. Oxford University Press
Lewis, C. (1865) in Kusek, J. Z. & Rist, R. C. 2004. Ten Steps to a Results Based Monitoring
and Evaluation System. The World Bank. Washington: United States of America.
Mapfumo, T. 2016. Monitoring and Evaluation of HIV/AIDS programmes by Non-Governmental
Organisations: a case Study of uMngeni Local Municipality, KwaZulu-Natal, South Africa.
Masters Dissertation. Durban University of Technology. South Africa.
McKay, K., 2007. How to Build M&E Systems to Support Better Government. Washington, D.C.
The World Bank.
Minnaar, F. Strategic and Performance Management in the Public Sector. Pretoria: Van Schaik
Publishers.
Motingoe, R. S. & van der Waldt, G. 2013. A Monitoring and Evaluation System Utilisation
Model for Support to South African Municipalities. Politiea: South African Journal for Political
Science and Public Administration, 32(3):4-29.
Mthethwa, R.M. & Jili, N.N. 2016. Challenges in implementing monitoring and evaluation (M&E):
the case of the Mfolozi municipality. African Journal of Public Affairs, 9(4):102-113.
NEPF (National Evaluation Policy Framework) (2011) in Ijeoma, E. 2014. Introduction to South
Africa’s Monitoring and Evaluation in Government. University of Fort Hare: Verity Publishers.

69
Osborne, D. & Gaebler, T. 1999. Reinventing Government. Boston, Mass: Addison-Wesley
Publishing.
Pasanen, T., & Shaxson, L. 2016. How to design a monitoring and evaluation framework for a
policy research project. A Methods Lab Publication. London: Overseas Development Institute.
Phillips, S. & Porter, S. 2012 in CLEAR (Centre for Learning on Evaluation and Results), 2012.
African Monitoring and Evaluation Systems: Exploratory Case Studies. Graduate School of
Public and Development, University of the Witwatersrand, Johannesburg.
PSC News. 2012. Evolution of Monitoring and Evaluation in South Africa in the South African
Public Service. Commission House: Pretoria.
PSC. 2008. Basic Concepts in Monitoring and Evaluation. Commission House. Pretoria.
Rist, R. 2011. Training Manual in Designing and Implementing M&E Systems, 5-6 September
2011.
Salim, L. & Goldman, I. 2012 in CLEAR (Centre for Learning on Evaluation and Results), 2012.
African Monitoring and Evaluation Systems: Exploratory Case Studies. Graduate School of
Public and Development, University of the Witwatersrand, Johannesburg.
Silverman, D. 2013. Doing Qualitative Research. London. SAGE Publications Ltd.
Thompson, A. A; Peteraf, M. A; Gamble, J. E; Strickland III, A. J. Janes, A & Sutton, C. 2013.
Crafting and Executing Strategy: The quest for competitive advantage. McGraw-Hill Education:
Spain.
UNICEF (United Nations International Children’s Fund), 2010. From Policy to Results:
developing capacities for country monitoring and evaluation systems. UNICEF Evaluation
Office, [email protected].
Welman, C., Kruger, F., & Mitchell, B. 2015. Research Methodology. 3rd Edition. United
Kingdom. Oxford University Press.
Yin, R.K., 2014. Case Study Research: design and methods. Singapore. SAGE Publications
Ltd.
Zikmund, W.G., Babin, B. J., Carr, J. C., & Griffin, M., 2013. Business Research Methods 9th
Ed. South-Western: CENGAGE Learning.

70
ANNEXURE 1: ORIGINAL COPY OF THE M&E SYSTEM
2nd Research Guide
and Assessment Framework - 31 Jan 12 - Updated 27 Feb 12 (2).pdf

71

72
ANNEXURE 2: THE NEW M&E SYSTEM
FINAL FRAMEWORK
OF CVP 17 JULY 2015 8 Dec15 docx 16h40 (2).pdf

73
ANNEXURE 3: THE NON-PARTICIPANT/PARTICIPANT
OBSERVATION TOOL
Observation_tool(1).p
df

74
ANNEXURE 4: THE PLAN FOR ENGAGEMENTS WITH KEY
STAKEHOLDERS
Project Plan on the
roll-out of the CVP project 2015 - 2017.pdf

75
ANNEXURE 5: A SHORTENED VERSION OF THE PSCS M&E
FRAMEWORK
CVP SUMMARY TO
USE IN ENGAGEMENTS Priorities 13 September.pdf

76

77
ANNEXURE 6: A TEMPLATE USED TO CAPTURE FOCUS GROUP
DISCUSSIONS
Semi_structured_inte
rview_ tool(1).pdf

78
ANNEXURE 7: INTERVIEW SCHEDULE USED FOCUS GROUP
DISCUSSIONS
Observation_tool(1).p
df

79
ANNEXURE 8: A COPY OF THE LETTER OF APPROVAL TO
CONDUCT THE STUDY IN THE PSC

80

81
ANNEXURE 9: LETTER FROM LANGUAGE EDITOR