Embed Size (px)
Citation preview
This Analysis is strictly for internal use. This document must not be used as an evidence for any advise provided to clients or outside users
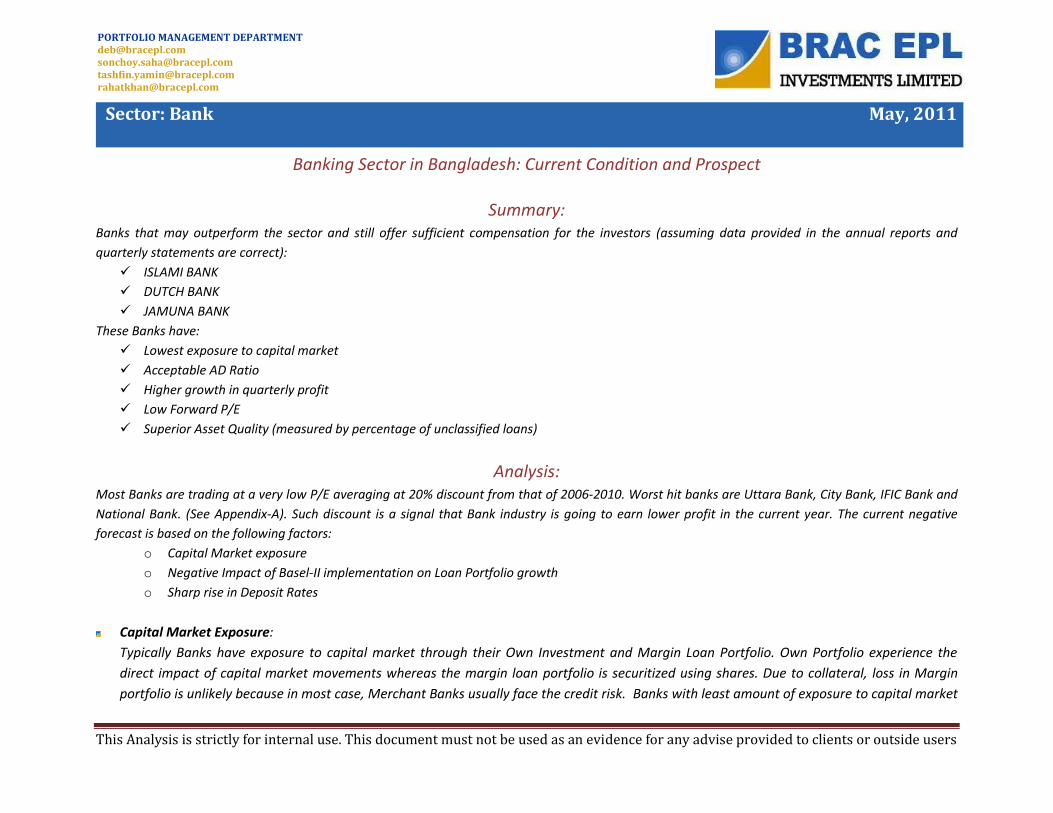
Banking Sector in Bangladesh: Current Condition and Prospect
Summary: Banks that may outperform the sector and still offer sufficient compensation for the investors (assuming data provided in the annual reports and
quarterly statements are correct):
ISLAMI BANK
DUTCH BANK
JAMUNA BANK
These Banks have:
Lowest exposure to capital market
Acceptable AD Ratio
Higher growth in quarterly profit
Low Forward P/E
Superior Asset Quality (measured by percentage of unclassified loans)
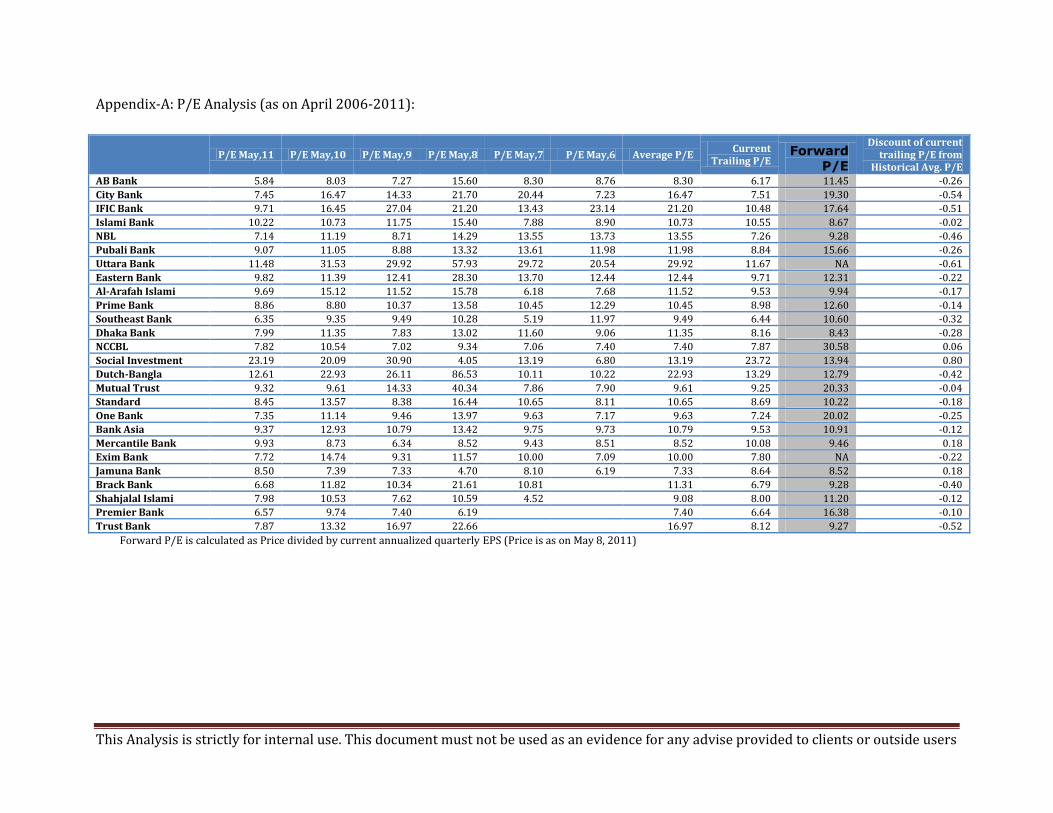
Analysis: Most Banks are trading at a very low P/E averaging at 20% discount from that of 2006-2010. Worst hit banks are Uttara Bank, City Bank, IFIC Bank and
National Bank. (See Appendix-A). Such discount is a signal that Bank industry is going to earn lower profit in the current year. The current negative
forecast is based on the following factors:
o Capital Market exposure
o Negative Impact of Basel-II implementation on Loan Portfolio growth
o Sharp rise in Deposit Rates
Capital Market Exposure:
Typically Banks have exposure to capital market through their Own Investment and Margin Loan Portfolio. Own Portfolio experience the
direct impact of capital market movements whereas the margin loan portfolio is securitized using shares. Due to collateral, loss in Margin
portfolio is unlikely because in most case, Merchant Banks usually face the credit risk. Banks with least amount of exposure to capital market
Sector: Bank May, 2011
PORTFOLIO MANAGEMENT DEPARTMENT [email protected] [email protected] [email protected] [email protected]
This Analysis is strictly for internal use. This document must not be used as an evidence for any advise provided to clients or outside users
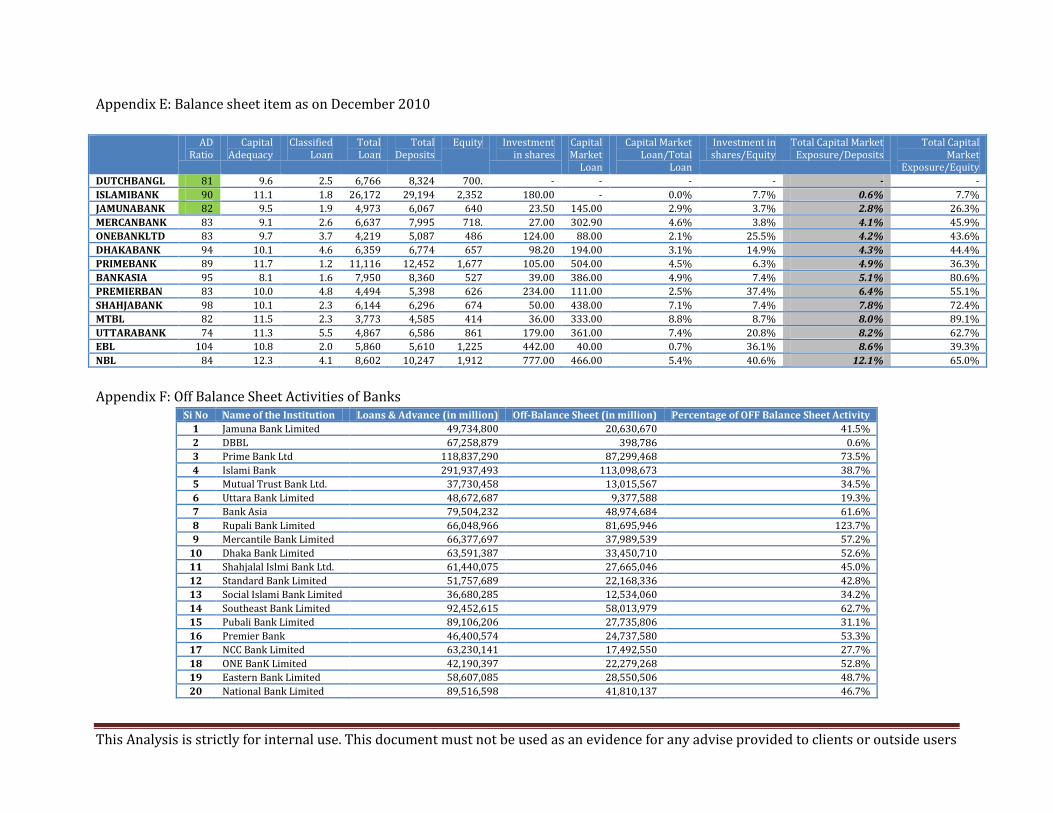
will have most strong performance. (DBBL, ISLAMI BANK.). Among the banks we studied, NBL had the largest Own portfolio of approximately
BDT 800 crore from which the bank earned approximately BDT 360 crore. We expect that such huge profit from share market is unlikely to
come in the current year (EBL: Share market profit BDT 130 crore . Those banks with high Total Capital Market Exposure to Deposit Ratios like
NBL, EBL may lose heavily due to such exposure. So investors should analyze these heavily exposed banks critically. (See Appendix E)
Basel-II Implementation:
With the implementation of BASEL-II, Banks have to follow strict risk management. For every taka lent, Banks have to maintain adequate capital. So
those banks with smaller amount of risk capital base may not continue lending following a normal trend. For 2010 Financial Year, Banks had to
maintain 9% CAR (Capital Adequacy Ratio) and for 2011 the ratio is 10%. Most banks have successfully maintained this ratio for 2010 and are
expected to maintain it for the current year. Among the banks we studied, NBL maintained the highest ADR whereas the ratio is very satisfactory for
ISLAMI BANK and Prime BANK. The banks that have maintained higher ADR can certainly extend higher risk lending. Anyway, the difference in ADR
ratio among the banks is small. So based on this metric, it is difficult to judge superiority of any bank. AD Ratio is a critical input in this regard. As
per Bangladesh Bank prudential guidelines, Conventional Banks are advised to maintain AD Ratio of 85% and Islamic Banks to maintain 90%. During
the current year those banks violating this guideline may be forced to cut down loans portfolio (this action will result in lower interest revenue and
also no reduction in deposit interest cost) or increase the deposit base (this action will increase deposit interest but interest revenue would remain
flat).In both the cases the ultimate result is the fall in interest spread. EBL, DHAKABANK, BANKASIA may face difficulty under this current issue,
whereas DUTCHBANGLA, ISLAMIBANK and JAMUNABANK having lower AD Ratio should benefit by being able to extend loans in a normal and
unconstrained way. .
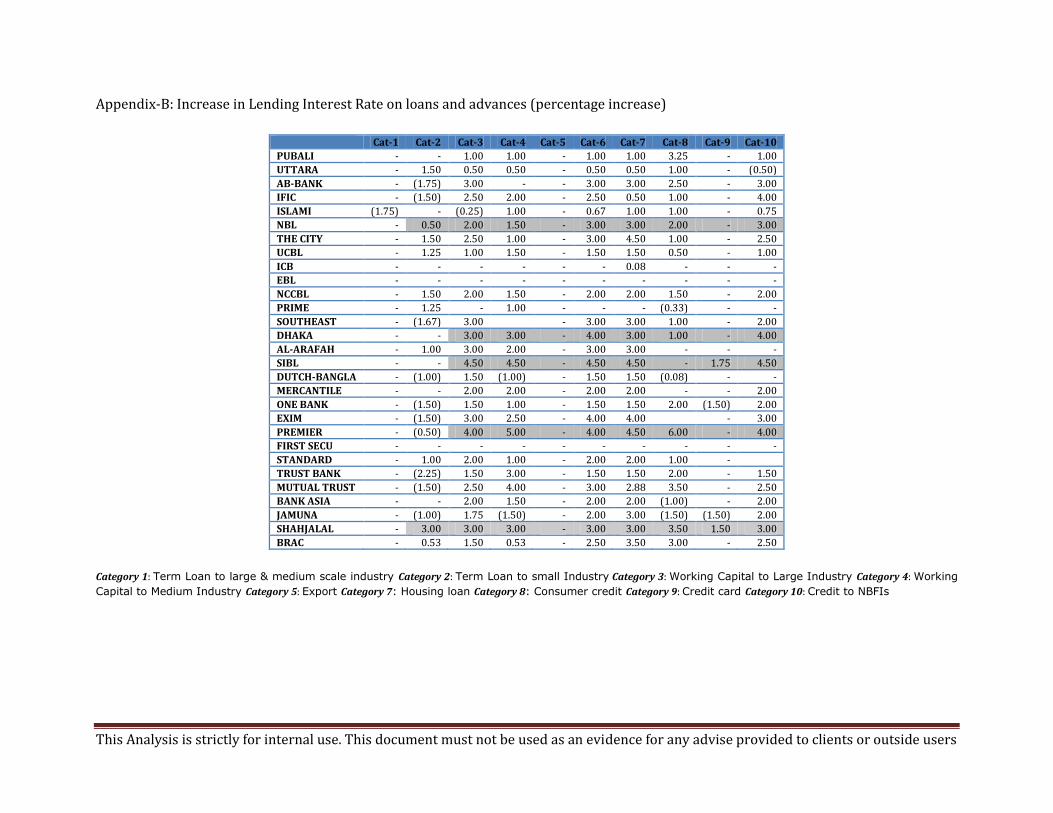
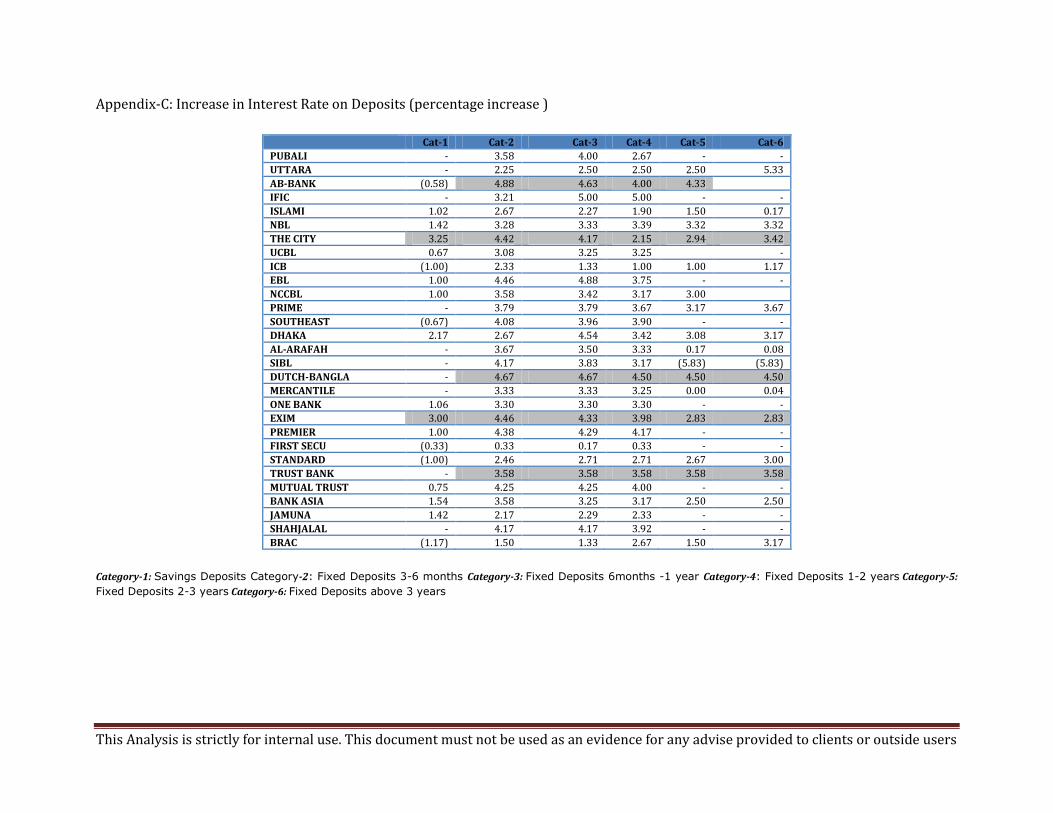
Rate Increase in Loans, Deposits: There is a widespread understanding that most Banks had to raise deposit interest rate which is expected to
reduce banks’ profitability. Interestingly most banks have also raised their loans and advance rates to offset the deposit cost. So, for most banks it
can be concluded that the interest spread that the banks have earned to date would remain intact. (see Appendix-B and C)
This Analysis is strictly for internal use. This document must not be used as an evidence for any advise provided to clients or outside users
Some Relevant Facts:
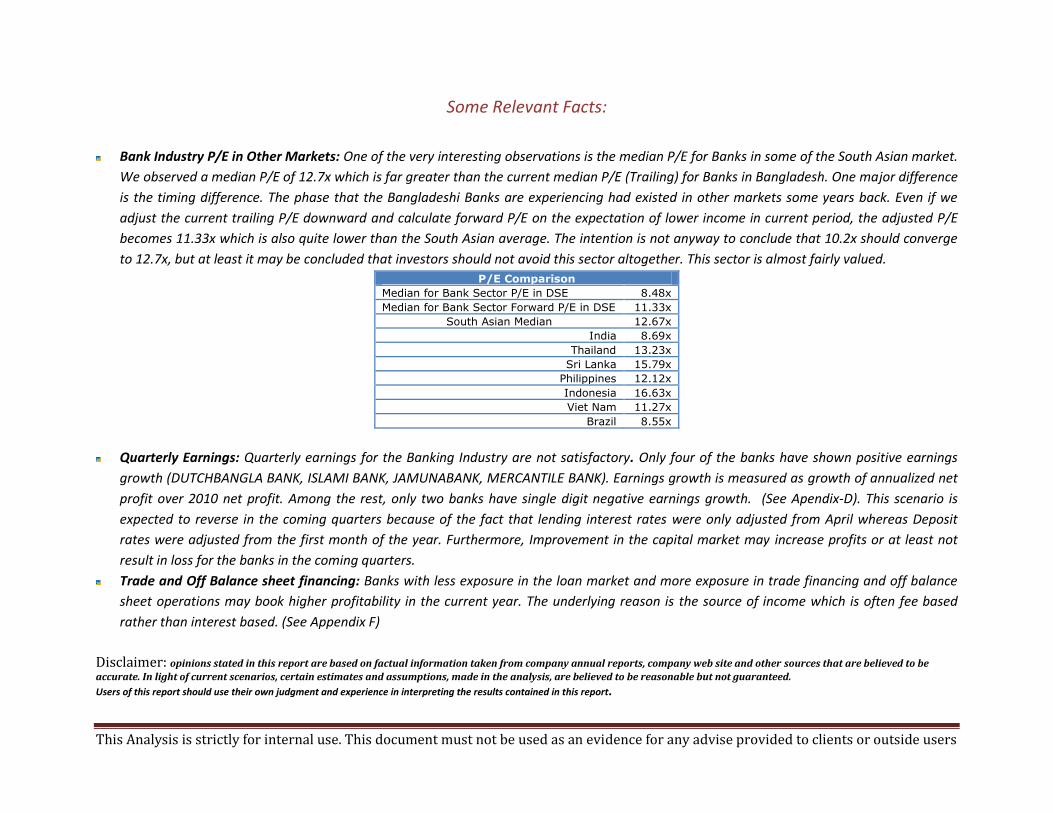
Bank Industry P/E in Other Markets: One of the very interesting observations is the median P/E for Banks in some of the South Asian market.
We observed a median P/E of 12.7x which is far greater than the current median P/E (Trailing) for Banks in Bangladesh. One major difference
is the timing difference. The phase that the Bangladeshi Banks are experiencing had existed in other markets some years back. Even if we
adjust the current trailing P/E downward and calculate forward P/E on the expectation of lower income in current period, the adjusted P/E
becomes 11.33x which is also quite lower than the South Asian average. The intention is not anyway to conclude that 10.2x should converge
to 12.7x, but at least it may be concluded that investors should not avoid this sector altogether. This sector is almost fairly valued.
P/E Comparison
Median for Bank Sector P/E in DSE 8.48x
Median for Bank Sector Forward P/E in DSE 11.33x
South Asian Median 12.67x
India 8.69x
Thailand 13.23x
Sri Lanka 15.79x
Philippines 12.12x
Indonesia 16.63x
Viet Nam 11.27x
Brazil 8.55x
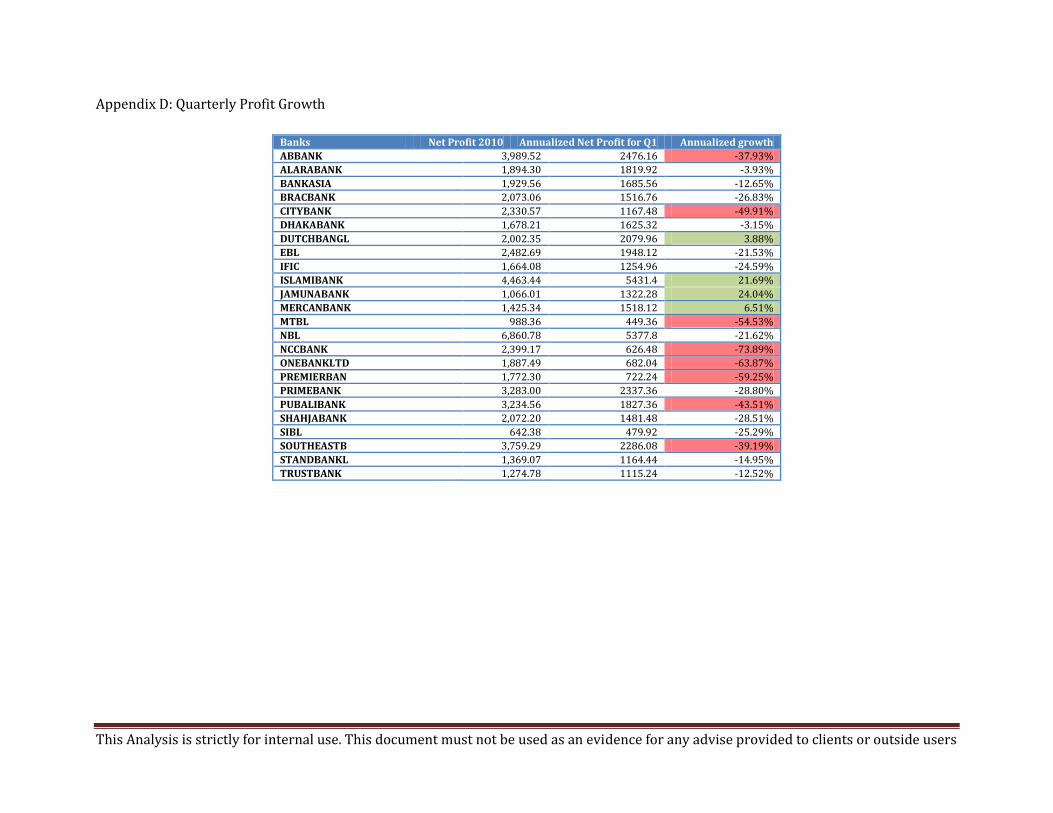
Quarterly Earnings: Quarterly earnings for the Banking Industry are not satisfactory. Only four of the banks have shown positive earnings
growth (DUTCHBANGLA BANK, ISLAMI BANK, JAMUNABANK, MERCANTILE BANK). Earnings growth is measured as growth of annualized net
profit over 2010 net profit. Among the rest, only two banks have single digit negative earnings growth. (See Apendix-D). This scenario is
expected to reverse in the coming quarters because of the fact that lending interest rates were only adjusted from April whereas Deposit
rates were adjusted from the first month of the year. Furthermore, Improvement in the capital market may increase profits or at least not
result in loss for the banks in the coming quarters.
Trade and Off Balance sheet financing: Banks with less exposure in the loan market and more exposure in trade financing and off balance
sheet operations may book higher profitability in the current year. The underlying reason is the source of income which is often fee based
rather than interest based. (See Appendix F)
Disclaimer: opinions stated in this report are based on factual information taken from company annual reports, company web site and other sources that are believed to be
accurate. In light of current scenarios, certain estimates and assumptions, made in the analysis, are believed to be reasonable but not guaranteed.
Users of this report should use their own judgment and experience in interpreting the results contained in this report.
This Analysis is strictly for internal use. This document must not be used as an evidence for any advise provided to clients or outside users
Appendix-A: P/E Analysis (as on April 2006-2011):
P/E May,11 P/E May,10 P/E May,9 P/E May,8 P/E May,7 P/E May,6 Average P/E
Current Trailing P/E
Forward
P/E
Discount of current trailing P/E from
Historical Avg. P/E
AB Bank 5.84 8.03 7.27 15.60 8.30 8.76 8.30 6.17 11.45 -0.26
City Bank 7.45 16.47 14.33 21.70 20.44 7.23 16.47 7.51 19.30 -0.54
IFIC Bank 9.71 16.45 27.04 21.20 13.43 23.14 21.20 10.48 17.64 -0.51
Islami Bank 10.22 10.73 11.75 15.40 7.88 8.90 10.73 10.55 8.67 -0.02
NBL 7.14 11.19 8.71 14.29 13.55 13.73 13.55 7.26 9.28 -0.46
Pubali Bank 9.07 11.05 8.88 13.32 13.61 11.98 11.98 8.84 15.66 -0.26
Uttara Bank 11.48 31.53 29.92 57.93 29.72 20.54 29.92 11.67 NA -0.61
Eastern Bank 9.82 11.39 12.41 28.30 13.70 12.44 12.44 9.71 12.31 -0.22
Al-Arafah Islami 9.69 15.12 11.52 15.78 6.18 7.68 11.52 9.53 9.94 -0.17
Prime Bank 8.86 8.80 10.37 13.58 10.45 12.29 10.45 8.98 12.60 -0.14
Southeast Bank 6.35 9.35 9.49 10.28 5.19 11.97 9.49 6.44 10.60 -0.32
Dhaka Bank 7.99 11.35 7.83 13.02 11.60 9.06 11.35 8.16 8.43 -0.28
NCCBL 7.82 10.54 7.02 9.34 7.06 7.40 7.40 7.87 30.58 0.06
Social Investment 23.19 20.09 30.90 4.05 13.19 6.80 13.19 23.72 13.94 0.80
Dutch-Bangla 12.61 22.93 26.11 86.53 10.11 10.22 22.93 13.29 12.79 -0.42
Mutual Trust 9.32 9.61 14.33 40.34 7.86 7.90 9.61 9.25 20.33 -0.04
Standard 8.45 13.57 8.38 16.44 10.65 8.11 10.65 8.69 10.22 -0.18
One Bank 7.35 11.14 9.46 13.97 9.63 7.17 9.63 7.24 20.02 -0.25
Bank Asia 9.37 12.93 10.79 13.42 9.75 9.73 10.79 9.53 10.91 -0.12
Mercantile Bank 9.93 8.73 6.34 8.52 9.43 8.51 8.52 10.08 9.46 0.18
Exim Bank 7.72 14.74 9.31 11.57 10.00 7.09 10.00 7.80 NA -0.22
Jamuna Bank 8.50 7.39 7.33 4.70 8.10 6.19 7.33 8.64 8.52 0.18
Brack Bank 6.68 11.82 10.34 21.61 10.81 11.31 6.79 9.28 -0.40
Shahjalal Islami 7.98 10.53 7.62 10.59 4.52 9.08 8.00 11.20 -0.12
Premier Bank 6.57 9.74 7.40 6.19 7.40 6.64 16.38 -0.10
Trust Bank 7.87 13.32 16.97 22.66 16.97 8.12 9.27 -0.52
Forward P/E is calculated as Price divided by current annualized quarterly EPS (Price is as on May 8, 2011)
This Analysis is strictly for internal use. This document must not be used as an evidence for any advise provided to clients or outside users
Appendix-B: Increase in Lending Interest Rate on loans and advances (percentage increase)
Cat-1 Cat-2 Cat-3 Cat-4 Cat-5 Cat-6 Cat-7 Cat-8 Cat-9 Cat-10
PUBALI - - 1.00 1.00 - 1.00 1.00 3.25 - 1.00
UTTARA - 1.50 0.50 0.50 - 0.50 0.50 1.00 - (0.50)
AB-BANK - (1.75) 3.00 - - 3.00 3.00 2.50 - 3.00
IFIC - (1.50) 2.50 2.00 - 2.50 0.50 1.00 - 4.00
ISLAMI (1.75) - (0.25) 1.00 - 0.67 1.00 1.00 - 0.75
NBL - 0.50 2.00 1.50 - 3.00 3.00 2.00 - 3.00
THE CITY - 1.50 2.50 1.00 - 3.00 4.50 1.00 - 2.50
UCBL - 1.25 1.00 1.50 - 1.50 1.50 0.50 - 1.00
ICB - - - - - - 0.08 - - -
EBL - - - - - - - - - -
NCCBL - 1.50 2.00 1.50 - 2.00 2.00 1.50 - 2.00
PRIME - 1.25 - 1.00 - - - (0.33) - -
SOUTHEAST - (1.67) 3.00 - 3.00 3.00 1.00 - 2.00
DHAKA - - 3.00 3.00 - 4.00 3.00 1.00 - 4.00
AL-ARAFAH - 1.00 3.00 2.00 - 3.00 3.00 - - -
SIBL - - 4.50 4.50 - 4.50 4.50 - 1.75 4.50
DUTCH-BANGLA - (1.00) 1.50 (1.00) - 1.50 1.50 (0.08) - -
MERCANTILE - - 2.00 2.00 - 2.00 2.00 - - 2.00
ONE BANK - (1.50) 1.50 1.00 - 1.50 1.50 2.00 (1.50) 2.00
EXIM - (1.50) 3.00 2.50 - 4.00 4.00 - 3.00
PREMIER - (0.50) 4.00 5.00 - 4.00 4.50 6.00 - 4.00
FIRST SECU - - - - - - - - - -
STANDARD - 1.00 2.00 1.00 - 2.00 2.00 1.00 -
TRUST BANK - (2.25) 1.50 3.00 - 1.50 1.50 2.00 - 1.50
MUTUAL TRUST - (1.50) 2.50 4.00 - 3.00 2.88 3.50 - 2.50
BANK ASIA - - 2.00 1.50 - 2.00 2.00 (1.00) - 2.00
JAMUNA - (1.00) 1.75 (1.50) - 2.00 3.00 (1.50) (1.50) 2.00
SHAHJALAL - 3.00 3.00 3.00 - 3.00 3.00 3.50 1.50 3.00
BRAC - 0.53 1.50 0.53 - 2.50 3.50 3.00 - 2.50
Category 1: Term Loan to large & medium scale industry Category 2: Term Loan to small Industry Category 3: Working Capital to Large Industry Category 4: Working
Capital to Medium Industry Category 5: Export Category 7: Housing loan Category 8: Consumer credit Category 9: Credit card Category 10: Credit to NBFIs
This Analysis is strictly for internal use. This document must not be used as an evidence for any advise provided to clients or outside users
Appendix-C: Increase in Interest Rate on Deposits (percentage increase )
Cat-1 Cat-2 Cat-3 Cat-4 Cat-5 Cat-6
PUBALI - 3.58 4.00 2.67 - -
UTTARA - 2.25 2.50 2.50 2.50 5.33
AB-BANK (0.58) 4.88 4.63 4.00 4.33
IFIC - 3.21 5.00 5.00 - -
ISLAMI 1.02 2.67 2.27 1.90 1.50 0.17
NBL 1.42 3.28 3.33 3.39 3.32 3.32
THE CITY 3.25 4.42 4.17 2.15 2.94 3.42
UCBL 0.67 3.08 3.25 3.25 -
ICB (1.00) 2.33 1.33 1.00 1.00 1.17
EBL 1.00 4.46 4.88 3.75 - -
NCCBL 1.00 3.58 3.42 3.17 3.00
PRIME - 3.79 3.79 3.67 3.17 3.67
SOUTHEAST (0.67) 4.08 3.96 3.90 - -
DHAKA 2.17 2.67 4.54 3.42 3.08 3.17
AL-ARAFAH - 3.67 3.50 3.33 0.17 0.08
SIBL - 4.17 3.83 3.17 (5.83) (5.83)
DUTCH-BANGLA - 4.67 4.67 4.50 4.50 4.50
MERCANTILE - 3.33 3.33 3.25 0.00 0.04
ONE BANK 1.06 3.30 3.30 3.30 - -
EXIM 3.00 4.46 4.33 3.98 2.83 2.83
PREMIER 1.00 4.38 4.29 4.17 - -
FIRST SECU (0.33) 0.33 0.17 0.33 - -
STANDARD (1.00) 2.46 2.71 2.71 2.67 3.00
TRUST BANK - 3.58 3.58 3.58 3.58 3.58
MUTUAL TRUST 0.75 4.25 4.25 4.00 - -
BANK ASIA 1.54 3.58 3.25 3.17 2.50 2.50
JAMUNA 1.42 2.17 2.29 2.33 - -
SHAHJALAL - 4.17 4.17 3.92 - -
BRAC (1.17) 1.50 1.33 2.67 1.50 3.17
Category-1: Savings Deposits Category-2: Fixed Deposits 3-6 months Category-3: Fixed Deposits 6months -1 year Category-4: Fixed Deposits 1-2 years Category-5:
Fixed Deposits 2-3 years Category-6: Fixed Deposits above 3 years
This Analysis is strictly for internal use. This document must not be used as an evidence for any advise provided to clients or outside users
Appendix D: Quarterly Profit Growth
Banks Net Profit 2010 Annualized Net Profit for Q1 Annualized growth
ABBANK 3,989.52 2476.16 -37.93%
ALARABANK 1,894.30 1819.92 -3.93%
BANKASIA 1,929.56 1685.56 -12.65%
BRACBANK 2,073.06 1516.76 -26.83%
CITYBANK 2,330.57 1167.48 -49.91%
DHAKABANK 1,678.21 1625.32 -3.15%
DUTCHBANGL 2,002.35 2079.96 3.88%
EBL 2,482.69 1948.12 -21.53%
IFIC 1,664.08 1254.96 -24.59%
ISLAMIBANK 4,463.44 5431.4 21.69%
JAMUNABANK 1,066.01 1322.28 24.04%
MERCANBANK 1,425.34 1518.12 6.51%
MTBL 988.36 449.36 -54.53%
NBL 6,860.78 5377.8 -21.62%
NCCBANK 2,399.17 626.48 -73.89%
ONEBANKLTD 1,887.49 682.04 -63.87%
PREMIERBAN 1,772.30 722.24 -59.25%
PRIMEBANK 3,283.00 2337.36 -28.80%
PUBALIBANK 3,234.56 1827.36 -43.51%
SHAHJABANK 2,072.20 1481.48 -28.51%
SIBL 642.38 479.92 -25.29%
SOUTHEASTB 3,759.29 2286.08 -39.19%
STANDBANKL 1,369.07 1164.44 -14.95%
TRUSTBANK 1,274.78 1115.24 -12.52%
This Analysis is strictly for internal use. This document must not be used as an evidence for any advise provided to clients or outside users
Appendix E: Balance sheet item as on December 2010
AD
Ratio Capital
Adequacy Classified
Loan Total Loan
Total Deposits
Equity Investment in shares
Capital Market
Loan
Capital Market Loan/Total
Loan
Investment in shares/Equity
Total Capital Market Exposure/Deposits
Total Capital Market
Exposure/Equity
DUTCHBANGL 81 9.6 2.5 6,766 8,324 700. - - - - - -
ISLAMIBANK 90 11.1 1.8 26,172 29,194 2,352 180.00 - 0.0% 7.7% 0.6% 7.7%
JAMUNABANK 82 9.5 1.9 4,973 6,067 640 23.50 145.00 2.9% 3.7% 2.8% 26.3%
MERCANBANK 83 9.1 2.6 6,637 7,995 718. 27.00 302.90 4.6% 3.8% 4.1% 45.9%
ONEBANKLTD 83 9.7 3.7 4,219 5,087 486 124.00 88.00 2.1% 25.5% 4.2% 43.6%
DHAKABANK 94 10.1 4.6 6,359 6,774 657 98.20 194.00 3.1% 14.9% 4.3% 44.4%
PRIMEBANK 89 11.7 1.2 11,116 12,452 1,677 105.00 504.00 4.5% 6.3% 4.9% 36.3%
BANKASIA 95 8.1 1.6 7,950 8,360 527 39.00 386.00 4.9% 7.4% 5.1% 80.6%
PREMIERBAN 83 10.0 4.8 4,494 5,398 626 234.00 111.00 2.5% 37.4% 6.4% 55.1%
SHAHJABANK 98 10.1 2.3 6,144 6,296 674 50.00 438.00 7.1% 7.4% 7.8% 72.4%
MTBL 82 11.5 2.3 3,773 4,585 414 36.00 333.00 8.8% 8.7% 8.0% 89.1%
UTTARABANK 74 11.3 5.5 4,867 6,586 861 179.00 361.00 7.4% 20.8% 8.2% 62.7%
EBL 104 10.8 2.0 5,860 5,610 1,225 442.00 40.00 0.7% 36.1% 8.6% 39.3%
NBL 84 12.3 4.1 8,602 10,247 1,912 777.00 466.00 5.4% 40.6% 12.1% 65.0%
Appendix F: Off Balance Sheet Activities of Banks Si No Name of the Institution Loans & Advance (in million) Off-Balance Sheet (in million) Percentage of OFF Balance Sheet Activity
1 Jamuna Bank Limited 49,734,800 20,630,670 41.5%
2 DBBL 67,258,879 398,786 0.6%
3 Prime Bank Ltd 118,837,290 87,299,468 73.5%
4 Islami Bank 291,937,493 113,098,673 38.7%
5 Mutual Trust Bank Ltd. 37,730,458 13,015,567 34.5%
6 Uttara Bank Limited 48,672,687 9,377,588 19.3%
7 Bank Asia 79,504,232 48,974,684 61.6%
8 Rupali Bank Limited 66,048,966 81,695,946 123.7%
9 Mercantile Bank Limited 66,377,697 37,989,539 57.2%
10 Dhaka Bank Limited 63,591,387 33,450,710 52.6%
11 Shahjalal Islmi Bank Ltd. 61,440,075 27,665,046 45.0%
12 Standard Bank Limited 51,757,689 22,168,336 42.8%
13 Social Islami Bank Limited 36,680,285 12,534,060 34.2%
14 Southeast Bank Limited 92,452,615 58,013,979 62.7%
15 Pubali Bank Limited 89,106,206 27,735,806 31.1%
16 Premier Bank 46,400,574 24,737,580 53.3%
17 NCC Bank Limited 63,230,141 17,492,550 27.7%
18 ONE BanK Limited 42,190,397 22,279,268 52.8%
19 Eastern Bank Limited 58,607,085 28,550,506 48.7%
20 National Bank Limited 89,516,598 41,810,137 46.7%