Embed Size (px)
Citation preview
Proceedings of the Second International Conference on Global Business, Economics, Finance and
Social Sciences (GB14Chennai Conference) ISBN: 978-1-941505-14-4
Chennai, India 11-13 July 2014 Paper ID: C4107
1
www.globalbizresearch.org
An Analysis on Consumer Perception towards Corporate Social
Responsibility Practices in Salem City
A. Jayakumar,
Professor & Former Controller of Examinations,
Department of Commerce,
Periyar University,
Salem, India.
Email: [email protected]
K. Geetha,
Department of Commerce,
Periyar University,
Salem, India.
Email: [email protected]
_____________________________________________________________________
Abstract
Corporations of the twenty-first century can derive enormous benefits when they are
perceived as being socially responsible by their stakeholders. Among all the stakeholders,
one important group that appears to be particularly susceptible to a company’s Corporate
Social Responsibility (CSR) initiatives is its consumers. CSR has positive influence on
consumers’ evaluations and purchase intentions of company/product. The positive link
between CSR and consumer patronage makes managers realize that CSR is not only an
ethical imperative, but also an economic one in today’s marketplace. The purpose of this
paper is to explore the perception of respondents on corporate social responsibility, to find
out the perception and knowledge of consumers of companies towards CSR practices in
Salem city, to identify whether the CSR practices has made any effect in consumer decision
making while purchasing the products, and their willingness to pay a premium price for the
CSR practices. Questionnaire was used to collect the primary data. Convenient sampling
technique was used to select the respondents. The sample consists of 100 respondents. The
study concluded that though the consumers in Salem may not aware of the mandatory
provisions of CSR, they have showed their willingness to buy CSR products and willingness to
pay premium price for the CSR practicing companies’ products. Hence, a positive link exists
between the CSR and consumer behavior. CSR not only create positive attitude towards the
company, it also a weapon for attaining sustainable tomorrow.
___________________________________________________________________________
Key words: Consumer Perception, Corporate Social Responsibility, Consumer Behaviour
Proceedings of the Second International Conference on Global Business, Economics, Finance and
Social Sciences (GB14Chennai Conference) ISBN: 978-1-941505-14-4
Chennai, India 11-13 July 2014 Paper ID: C4107
2
www.globalbizresearch.org
1. Introduction
Corporations of the twenty-first century can derive enormous benefits when they are
perceived as being socially responsible by their stakeholders. Among all the stakeholders,
one important group that appears to be particularly susceptible to a company‟s Corporate
Social Responsibility (CSR) initiatives is its consumers (Bhattacharya and Sen, 2004). CSR
has positive influence – across a range of product categories – on consumers‟ evaluations and
purchase intentions of company/product. The positive link between CSR and consumer
patronage makes managers realize that CSR is not only an ethical/ideological imperative, but
also an economic one in today‟s marketplace.
1.1 CSR in India
The World Business Council on Sustainable Development defines CSR as “the
commitment of business to contribute to sustainable economic development, working with
employees, their families and local community and society at large to improve their quality of
life‖.
Corporate social responsibility can be defined as “ethical payback of corporate house
towards the society”.
The Indian society is highly social in nature. The concept of CSR has always been a part
of Indian business in some way or other. In the beginning, the CSR was influenced by
culture, religion, family customs and industrialisation. Some of the high profile business and
industrial families as Tata, Birla, Godrez and so on pioneered the concept of CSR in terms of
charity and philanthropy. India being a fast growing economy is booming with opening up of
national and multinational firms. And also at the same time, India faces social challenges like
poverty, population growth, corruption and illiteracy etc., therefore, in order to create and
facilitate an environment of equitable partnership between the civil society and business, it is
all the more important for the Indian companies to see CSR in the right perspective.
1.2 Types of CSR activities in post liberalized Indian scenarios
But the scenario around the world has been changing since 1950. Rapid industrialization
and globalization have led to corporate fitting to find foot hold in global market and also as a
better employer. After opening up of Indian economy in 1990, Indian corporate houses were
exposed to threat of external competitors for the first time. Global competitors had deep
pockets and were able to pay high so the concern of employee satisfaction and happiness
increased among Indian corporate house thus leading to sudden surge of private sector
companies who were profit makers pre 1990 into social/employee concern affairs like CSR.
These CSR activities were more concentrated towards creation of employable population in
the society and the retaining them from switching to other competing companies.

Proceedings of the Second International Conference on Global Business, Economics, Finance and
Social Sciences (GB14Chennai Conference) ISBN: 978-1-941505-14-4
Chennai, India 11-13 July 2014 Paper ID: C4107
3
www.globalbizresearch.org
1.3 Mandate of CSR activities
In 2009, the government made it mandatory for all public sector oil companies to spend 2
per cent of their net profits on corporate social responsibility. Besides the private sector, the
government is also ensuring that the public sector companies participate actively in CSR
initiatives. Adding to this, On 27th February 2014, the Government of India has notified
provisions and corresponding rules pertaining to Corporate Social Responsibility under the
Companies Act, 2013 (2013 Act) and this came into force with effect from 1 April 2014. As
per the provisions of the new Companies Act, any company having a turnover of more than
Rs. 1,000 crore or a networth of over Rs. 500 crore or a net profit of over Rs. 5 crore, has to
spend 2 per cent of their annual net profit on CSR activities. Hence, this provision will bring
major changes in the country as a whole.
2. Review of Literature
Andre Sobczak, Gervaise Debucquet and Christelle Havard (2006)1, in this paper, the
authors analysed the impact of education on students‟ and young managers‟ perception of
companies and corporate social responsibility. The research is based on an electronic
questionnaire for students and alumni of different institutions of higher education of higher
education in Nantes (France). The main result of this exploratory study is the impact of the
different types of academic institutions on the respondents‟ perception on companies and their
attitude towards CSR concepts and tools.
Jean – Marie Codron, Lucie Siriex and Thomas Reardon (2006)2, this paper focuses
on the environmental and ethical attributes of food products and their production processes.
The paper first presented the four movements that have brought to the fore new aspects of
food product quality, to wit: 1) aspects of environmental ethics and 2) social ethics.
Consumers tend to perceive the organic production movement and the integrated agricultural
movement as a single group because they both deal with the environment. Finally, the paper
identified challenges faced by those promoting food products with environmental and
social/ethical attributes as they attempt to communicate coherent signals to consumers at this
crucial moment in the emergence of a mass market for these products.
Lei Wang and Heikki Juslin (2011)3, In this paper the authors determined the effects
of personal values on individual perceptions of CSR issues. The authors investigated 980
1 Andre Sobczak, Gervaise Debucquet and Christelle Havard (2006), “The impact of higher education
on students‟ and young managers‟ perception of companies and CSR: an exploratory analysis”,
Corporate Governance, Vol.6, No.4, pp.463-474. 2 Jean – Marie Codron, Lucie Siriex and Thomas Reardon (2006), “Social and Environmental attributes
of food products in an emerging mass market: Challenges of Signaling and consumer perception, with
European illustrations”, Agriculture and Human Values, I-23, pp.283-297. 3 Lei Wang and Heikki Juslin (2011), “The Effects of Value on the Perception of Corporate Social
Responsibility Implementation: A study of Chinese Youth”, Corporate Social Responsibility and
Environmental Management, No.18, pp.246-262, 2011.

Proceedings of the Second International Conference on Global Business, Economics, Finance and
Social Sciences (GB14Chennai Conference) ISBN: 978-1-941505-14-4
Chennai, India 11-13 July 2014 Paper ID: C4107
4
www.globalbizresearch.org
Chinese young people, finding that: Chinese youth displayed a mixed value structure of
traditional and emerging western values, stronger self-transcendent values than self-
enhancement values, and stronger openness values than conservation values. Chinese youth
have negative perceptions of corporate social performance of corporations in China,
especially on the environmental dimension. Personal values have a significant effect on
perception of Chinese youth of CSR. The practical ethical contribution of this study suggested
that value cultivation is a good way to develop ethical behavior and responsibility, which in
turn affect the development of CSR in china.
PHAM Duc Hieu, (2011)4, the author of this paper has examined how executives and
managers from different Vietnamese enterprises represent their awareness and their
perceptions of corporate social responsibility, as well as whether the attitude of Vietnamese
consumers towards CSR. Structured questionnaires have been used to collect data from
managers and customers. 30 selected companies operating in three main sectors namely,
Banking, Brewery and Clothing and Textiles have been taken into account. Based on the
analysis, the paper provided evidence that while a large proportion of managers expressed a
highly positive attitude towards CSR and its reporting, consumers‟ perception is at low state
and questionable. Although the consumers do not have a clear attitude, the research results
showed that the awareness of consumers and their purchasing decisions influence
significantly on the CSR implementation as well as CSR disclosure of companies.
Percy Marquina Feldman and Arturo Z. Vasques-Parraga (2013)5, the objective of
this research is to explain key antecedents to consumer social responses, in particular, the
comparative effects of CSR initiatives and CA in the consumer purchasing behavior. A
choice-based conjoint model was applied to quota consumer samples from two disparate
countries (USA and Peru) in the shoe industry. The variables used in the study are
company‟s environmental commitment, corporate giving to worthy causes, good labour
practices, leadership in the industry, product quality and technological innovation. The main
results of the study demonstrated that some CSR initiatives such as companies‟ environmental
commitments, along with some CA, such as product quality significantly explain the nature of
consumer responses and a trade-off effect on consumers‟ willingness to pay for a product.
2.1 Statement of the Problem
Consumers are an important and complex factor in the CSR equation: Undoubtedly, they
may contribute to its diffusion through their purchase behavior. Firms need to become more
4 PHAM Duc Hieu, (2011), “Corporate social responsibility: A study on awareness of managers and
consumers in Vietnam”, Journal of Accounting and Taxation, Vol. 3, No.8, pp.162-170, December
2011. 5 Percy Marquina Feldman and Arturo Z. Vasques-Parraga (2013), “Consumer social responses to CSR
initiatives versus corporate abilities”, Journal of Consumer Marketing, Vol.30, No.2, 2013, pp.100-
111.

Proceedings of the Second International Conference on Global Business, Economics, Finance and
Social Sciences (GB14Chennai Conference) ISBN: 978-1-941505-14-4
Chennai, India 11-13 July 2014 Paper ID: C4107
5
www.globalbizresearch.org
proactive with respect to consumer social responsibility if they want to make their CSR
initiatives more effective as the consumer attitude, decision, purchases and behaviour are still
the elements determining the demand for goods and services most directly. Lack of
awareness about CSR practices is a limiting factor in consumers‟ ability to reward / punish
corporations appropriately. The present study is a modest attempt to study the consumer
perception on CSR practices in Salem City.
It becomes important to investigate whether customers value the dedication of
organization towards CSR endeavours. A very little research has been carried out to
investigate any preference given to companies following CSR practices by the customers, and
hence it becomes very important to study whether customers value the CSR practices adopted
by organizations, and give preference to the products/services offered by organizations
practising CSR. The study is undertaken to determine the extent of consumer preferences and
consumers‟ willingness to buy and pay CSR products.
2.2 Scope of the Study
Socially responsible behaviour of the company is good market practice and that it
generates positive consequences for the business is increasingly accepted, but there is still a
lack of research on potential benefits of social responsibility from the marketing perspective,
as well as on its effects on the consumer segment. The empirical evidence about the relation
between Corporate Social Responsibility Practices and consumer behavior is still limited.
Hence, the current work aims to shed light on the corporate social responsibility practices on
consumer perspective in Salem City.
2.3 Objectives of the study
The main objective of the study is to study the Corporate Social Responsibility Practices
on consumer perspective in Salem City.
The secondary objectives are,
To create awareness and to find out the perception and knowledge of consumers of
companies towards CSR practices in Salem city.
To identify whether the CSR practices has made any effect in consumer decision making
while purchasing the products.
To know about the consumer preference towards the CSR practices.
To know whether the consumer are willing to pay a premium price for the CSR practices.
3. Research Methodology
This research is based on the survey method.
3.1 Data collection
In this study, both primary and secondary were collected. The primary data were
collected by using a well-structured questionnaire. The secondary data were collected from
Proceedings of the Second International Conference on Global Business, Economics, Finance and
Social Sciences (GB14Chennai Conference) ISBN: 978-1-941505-14-4
Chennai, India 11-13 July 2014 Paper ID: C4107
6
www.globalbizresearch.org
various companies‟ websites from published articles, magazines, newspapers and
miscellaneous records.
Sample design
The persons who know about CSR are the respondents of the study. A convenient
sampling technique was used to select the respondents. The sample consists of 100
respondents was taken for the study.
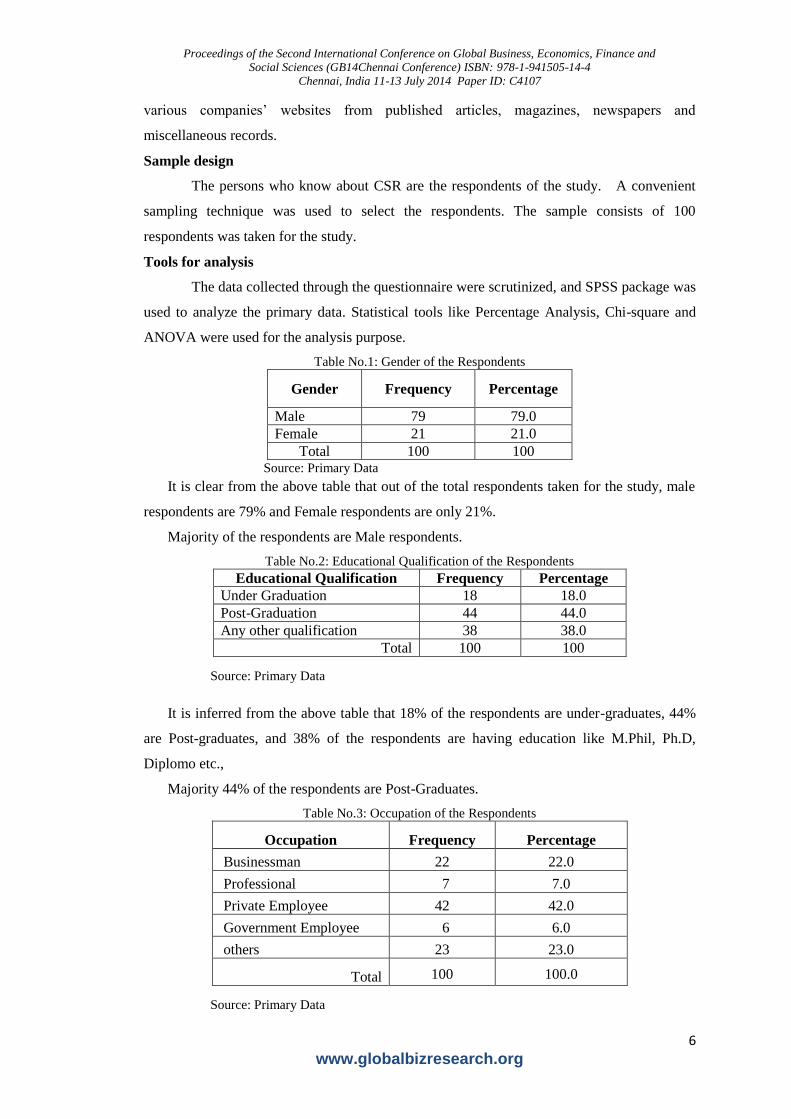
Tools for analysis
The data collected through the questionnaire were scrutinized, and SPSS package was
used to analyze the primary data. Statistical tools like Percentage Analysis, Chi-square and
ANOVA were used for the analysis purpose.
Table No.1: Gender of the Respondents
Gender Frequency Percentage
Male 79 79.0
Female 21 21.0
Total 100 100 Source: Primary Data
It is clear from the above table that out of the total respondents taken for the study, male
respondents are 79% and Female respondents are only 21%.
Majority of the respondents are Male respondents.
Table No.2: Educational Qualification of the Respondents
Educational Qualification Frequency Percentage
Under Graduation 18 18.0
Post-Graduation 44 44.0
Any other qualification 38 38.0
Total 100 100
Source: Primary Data
It is inferred from the above table that 18% of the respondents are under-graduates, 44%
are Post-graduates, and 38% of the respondents are having education like M.Phil, Ph.D,
Diplomo etc.,
Majority 44% of the respondents are Post-Graduates.
Table No.3: Occupation of the Respondents
Occupation Frequency Percentage
Businessman 22 22.0
Professional 7 7.0
Private Employee 42 42.0
Government Employee 6 6.0
others 23 23.0
Total 100 100.0
Source: Primary Data

Proceedings of the Second International Conference on Global Business, Economics, Finance and
Social Sciences (GB14Chennai Conference) ISBN: 978-1-941505-14-4
Chennai, India 11-13 July 2014 Paper ID: C4107
7
www.globalbizresearch.org
It is known from the above table that out of the total respondents 22% of the respondents
are Businessman, 7% of the respondents are Professionals, 42% of the respondents are Private
employees, 6% of the respondents are Government employees and 23% of the respondents
are students, Research Scholars, etc.,
Majority 42% of the respondents are Private employees.
Table No.4: Monthly income of the respondents
Occupation Frequency Percentage
Upto `10,000 24 24.0
`10,001 - `20,000 44 44.0
`20,001 - `30,000 26 26.0
Above `30,000 6 6.0
Total 100 100.0
Source: Primary Data
It is found from the above table that out of the total respondents 24% of the respondents‟
monthly income is upto `10,000, 44% of the respondents‟ monthly income is between
`10,001 - `20,000, 26% of the respondents‟ monthly income is between `20,001 - `30,000, and
6% of the respondents‟ monthly income is above `30,000.
Majority 44% of the respondents‟ monthly income is between `10,001 - `20,000.
Table No.5: Major Responsibility of the company
Responsible for Frequency Percentage
Customer 33 33.0
Employees 6 6.0
Shareholders 12 12.0
Local Society 4 4.0
Global Society 17 17.0
Environment 24 24.0
Others 4 4.0
Total 100 100.0
Source: Primary Data
It is inferred from the above table that out of the total respondents, 33% of the
respondents opined that the company is responsible for its customers, 6% of the respondents
opined that the company is responsible for its employees, 12% opined that the company is
responsible for its Shareholders, 4% opined that the company is responsible for the local
society, 17% of the respondents opined that the company is responsible for the Global
society, 24% of the respondents opined that the company is responsible for the Environment
and 4% opined that the company is responsible for its suppliers etc.,

Proceedings of the Second International Conference on Global Business, Economics, Finance and
Social Sciences (GB14Chennai Conference) ISBN: 978-1-941505-14-4
Chennai, India 11-13 July 2014 Paper ID: C4107
8
www.globalbizresearch.org
Majority 33% of the respondents opined that the company is responsible for its
customers.
Table No.6: Sources of Awareness of CSR
Sources Frequency Percentage
Press 30 30.0
Family and Friends 6 6.0
Company's annual reports 14 14.0
Books 28 28.0
Internet 5 5.0
Any other sources 17 17.0
Total 100 100.0
Source: Primary Data
The above table exhibits the sources of awareness of CSR, 30% of the respondents came
to know the CSR through the press, 6% of the respondents came to know through Family and
Friends, 14% of the respondents came to know the CSR through Company‟s annual reports,
28% of the respondents came to know through the Internet, and 17% of the respondents came
to know the CSR activities through Seminars and Conferences.
Majority 30% of the respondents came to know the CSR through the press.
Table No.7: Awareness of CSR Activities
Sources Frequency Percentage
Yes 61 61.0
No 39 39.0
Total 100 100.0
Source: Primary Data
The above table shows the opinion of the respondents on the awareness of CSR activities.
61% of the respondents opined that they aware CSR activities and 39% of the respondents do
not aware of the CSR activities.
Majority, 61% of the respondents‟ are aware of CSR activities.
Table No.8: The industry which is considered to be important for CSR
Sources Frequency Percentage
Healthcare 26 26.0
Food & Beverages 16 16.0
Automotive 29 29.0
Financial Services 5 5.0
Media 11 11.0
Apparel 6 6.0
Any other industry 7 7.0
Total 100 100.0
Source: Primary Data

Proceedings of the Second International Conference on Global Business, Economics, Finance and
Social Sciences (GB14Chennai Conference) ISBN: 978-1-941505-14-4
Chennai, India 11-13 July 2014 Paper ID: C4107
9
www.globalbizresearch.org
It is clear from the above table that out of the total respondents, 26% of the respondents
opined that the Healthcare industry is considered to be important for CSR activities, 16% of
the respondents opined that the Food & Beverages industry is important, 29% of the
respondents opined that the Automotive industry is considered to be important, 5% of the
respondents opined the Financial Services industry is important, 11% of the respondents
opined that the Media is important for CSR, 6% of the respondents opined that the Apparel
industry is important and 7% of the respondents opined that the industries like Energy,
Technology are considered to be important for CSR.
Majority 29% of the respondents opined that the Automotive industry is considered to be
important for CSR activities.
Table No.9: Preference of CSR activities
Sources Frequency Percentage
Healthcare 20 20.0
Education 16 16.0
Disaster Relief 15 15.0
Environment 24 24.0
Rural Development 18 18.0
Animal Welfare 4 4.0
Any other practices 3 3.0
Total 100 100.0
Source: Primary Data
It is understood from the above table that out of the total respondents 20% preferred the
Healthcare related CSR activities, 16% preferred the Education related CSR activities, 15%
preferred the Disaster relief related CSR activities, 24% preferred Environment protection
related CSR activities, 18% preferred Rural Development, 4% preferred Animal Welfare

Proceedings of the Second International Conference on Global Business, Economics, Finance and
Social Sciences (GB14Chennai Conference) ISBN: 978-1-941505-14-4
Chennai, India 11-13 July 2014 Paper ID: C4107
10
www.globalbizresearch.org
related CSR activities and 3% preferred other CSR practices such as, Vocational training for
the backward people, Women empowerment, child welfare etc.,
Majority 24% of the respondents‟ preferred Environment protection related CSR
activities.
Table No.10: Opinion on Willingness to buy CSR products
Opinion Frequency Percentage
Yes 69 69.0
No 31 31.0
Total 100 100.0
Source: Primary Data
The above table depicts the Opinion of the respondents on willingness to buy CSR
products. Out of the total respondents 69% of the respondents are willing to buy CSR
products and 31% of the respondents are not willing to buy CSR related products.
Majority 69% of the respondents are willing to buy CSR products.
Table No.11: Opinion on Willingness to pay premium price
Sources Frequency Percentage
Yes 53 53.0
No 47 47.0
Total 100 100.0
Source: Primary Data
It is understood from the above table that 53% of the respondents are willing to pay
premium price for the CSR practising company‟s products, and 47% of the respondents are
not willing to pay extra price for the CSR practising company‟s products.
Majority 53% of the respondents are willing to pay premium price for the CSR practising
company‟s products.

Proceedings of the Second International Conference on Global Business, Economics, Finance and
Social Sciences (GB14Chennai Conference) ISBN: 978-1-941505-14-4
Chennai, India 11-13 July 2014 Paper ID: C4107
11
www.globalbizresearch.org
Table No.12: Awareness on Mandatory Provision of CSR
Opinion Frequency Percentage
Yes 41 41.0
No 59 59.0
Total 100 100.0
Source: Primary Data
The above table exhibits the opinion of the respondents on Mandatory Provision of CSR.
41% of the respondents have known about the mandatory provision of CSR and 59% of the
respondents have not known about the Mandatory provision.
Majority 59% of the respondents have not known about the Mandatory provision.
4. Chi Square Analysis
1. Association between the Educational qualification of the Respondents and Mandatory
Provision of CSR activities:
Ho: There is no association between the Education of the Respondents and Mandatory
provisions of CSR activities.
H1: There is an association between the Education of the Respondents and Mandatory
provisions of CSR activities.
Table No.13
Educational Qualification Mandatory provision of CSR
Total Aware Not Aware
Under-graduation 5 13 18
Post-graduation 18 26 44
Any other qualification 18 20 38
Total 41 59 100
In order to find out the relationship between the Education of the Respondents and
Mandatory provisions of CSR activities, Chi-square analysis was used and the result of the
test is shown in the following table:
Value df P value Remark
Pearson Chi-
Square 1.938 2 0.379 Not Significant
It is clear from the above table, the „P‟ value is greater than 0.05 and hence the result is
not significant at 5% level of significance. Hence, the Null Hypothesis education

Proceedings of the Second International Conference on Global Business, Economics, Finance and
Social Sciences (GB14Chennai Conference) ISBN: 978-1-941505-14-4
Chennai, India 11-13 July 2014 Paper ID: C4107
12
www.globalbizresearch.org
qualification and awareness on Mandatory Provisions of CSR are not associated does hold
well.
From this analysis, it is concluded that there is no close relationship between the
Educational Qualification and awareness on Mandatory Provision of CSR. Hence, there is no
difference in Educational Qualifications of the respondents in knowing the mandatory
provisions of CSR activities.
2. Association between the place of the Respondents and willingness to buy CSR
products:
Ho: There is no association between the place of the Respondents and willingness to
buy csr products.
H1: There is an association between the place of the Respondents and willingness to
buy csr products.
Table No.14
Place Willingness
Total Yes No
Urban 47 21 68
Semi urban 6 4 10
Rural 16 6 22
Total 69 31 100
In order to find out the relationship between the place of the respondents and willingness
to buy CSR products, Chi-square analysis was used and the result of the test is shown in the
following table:
Value df P value Remark
Pearson Chi-
Square .522 2 .770 Not Significant
It is noted from the above table, the „P‟ value is greater than 0.05 and hence the result is
not significant at 5% level of significance. Hence, the Null Hypothesis the place of the
Respondents and willingness to buy CSR products are not associated does hold well.
From this analysis, it is concluded that there is no close relationship between the place of
the Respondents and willingness to buy CSR products. Hence, the place of the respondents is
not a major factor in buying CSR products.
3. Association between the monthly income of the Respondents and willingness to pay
premium price for CSR products:
Ho: There is no association between the monthly income of the Respondents and willingness
to pay premium price for CSR products.

Proceedings of the Second International Conference on Global Business, Economics, Finance and
Social Sciences (GB14Chennai Conference) ISBN: 978-1-941505-14-4
Chennai, India 11-13 July 2014 Paper ID: C4107
13
www.globalbizresearch.org
H1: There is an association between the monthly income of the Respondents and willingness
to pay premium price for CSR products.
Table No.15
Monthly Income Willingness
Total Yes No
Upto Rs.10,000 9 15 24
Rs.10,001- Rs.20,000 26 18 44
Rs.20,001-Rs.30,000 15 11 26
Above Rs.30,000 3 3 6
Total 53 47 100
In order to find out the relationship between the monthly income of the respondents and
willingness to pay premium price for CSR products, Chi-square analysis was used and the
result of the test is shown in the following table:
Value df P value Remark
Pearson Chi-
Square 3.222 3 .359 Not Significant
It is noted from the above table, the „P‟ value is greater than 0.05 and hence the result is
not significant at 5% level of significance. Hence, the Null Hypothesis the monthly income
of the Respondents and willingness to pay premium price for CSR products are not associated
does hold well.
From this analysis, it is concluded that there is no close relationship between the monthly
income of the respondents and willingness to pay premium price for CSR products. Hence,
there is no difference in monthly incomes in willing to pay premium price for CSR products.
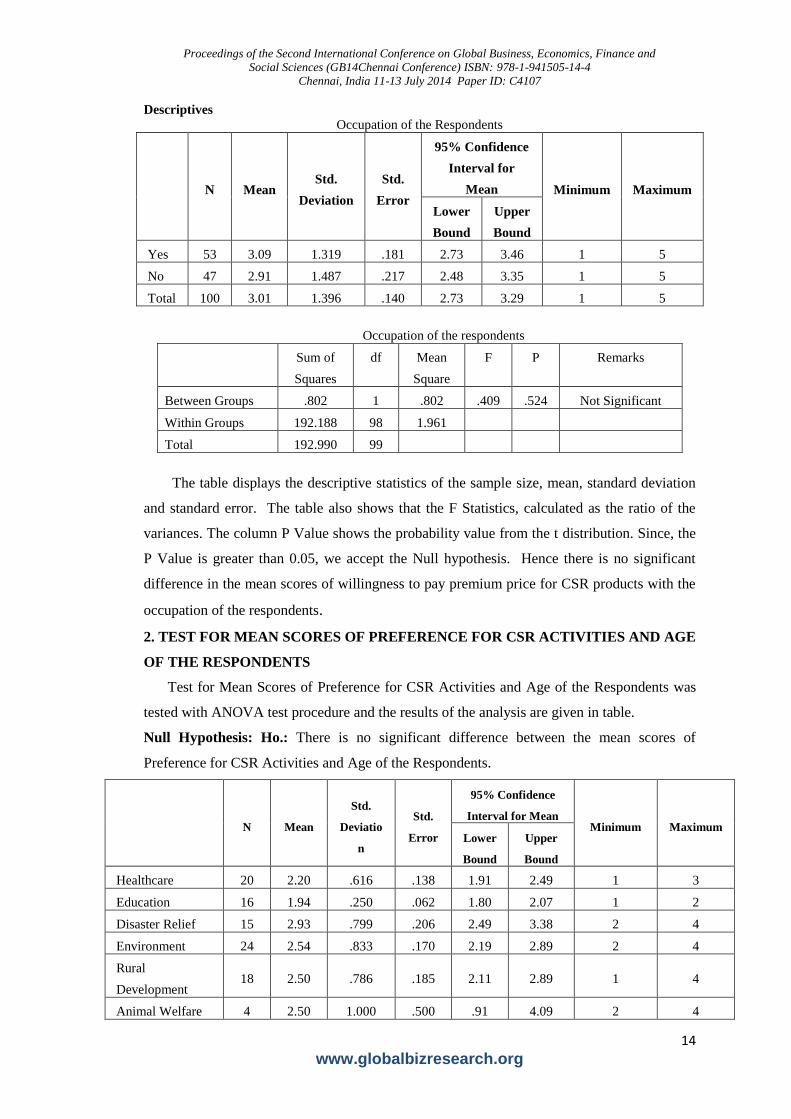
4. ANOVA
1. TEST FOR MEAN SCORES OF WILLINGNESS TO PAY PREMIUM PRICE FOR
CSR PRODUCTS REGARDING WITH THE OCCUPATION OF THE
RESPONDENTS
Test for Mean Scores of willingness to Pay Premium Price for CSR Products with the
Occupation of the Respondents was tested with ANOVA test procedure and the results of the
analysis are given in table.
Null Hypothesis: Ho.: There is no significant difference between the mean scores of
willingness to pay premium price for CSR products with the occupation of the respondents.
Table No.16
Proceedings of the Second International Conference on Global Business, Economics, Finance and
Social Sciences (GB14Chennai Conference) ISBN: 978-1-941505-14-4
Chennai, India 11-13 July 2014 Paper ID: C4107
14
www.globalbizresearch.org
Descriptives Occupation of the Respondents
N Mean Std.
Deviation
Std.
Error
95% Confidence
Interval for
Mean Minimum Maximum
Lower
Bound
Upper
Bound
Yes 53 3.09 1.319 .181 2.73 3.46 1 5
No 47 2.91 1.487 .217 2.48 3.35 1 5
Total 100 3.01 1.396 .140 2.73 3.29 1 5
Occupation of the respondents
Sum of
Squares
df Mean
Square
F P Remarks
Between Groups .802 1 .802 .409 .524 Not Significant
Within Groups 192.188 98 1.961
Total 192.990 99
The table displays the descriptive statistics of the sample size, mean, standard deviation
and standard error. The table also shows that the F Statistics, calculated as the ratio of the
variances. The column P Value shows the probability value from the t distribution. Since, the
P Value is greater than 0.05, we accept the Null hypothesis. Hence there is no significant
difference in the mean scores of willingness to pay premium price for CSR products with the
occupation of the respondents.
2. TEST FOR MEAN SCORES OF PREFERENCE FOR CSR ACTIVITIES AND AGE
OF THE RESPONDENTS
Test for Mean Scores of Preference for CSR Activities and Age of the Respondents was
tested with ANOVA test procedure and the results of the analysis are given in table.
Null Hypothesis: Ho.: There is no significant difference between the mean scores of
Preference for CSR Activities and Age of the Respondents.
N Mean
Std.
Deviatio
n
Std.
Error
95% Confidence
Interval for Mean Minimum Maximum
Lower
Bound
Upper
Bound
Healthcare 20 2.20 .616 .138 1.91 2.49 1 3
Education 16 1.94 .250 .062 1.80 2.07 1 2
Disaster Relief 15 2.93 .799 .206 2.49 3.38 2 4
Environment 24 2.54 .833 .170 2.19 2.89 2 4
Rural
Development 18 2.50 .786 .185 2.11 2.89 1 4
Animal Welfare 4 2.50 1.000 .500 .91 4.09 2 4

Proceedings of the Second International Conference on Global Business, Economics, Finance and
Social Sciences (GB14Chennai Conference) ISBN: 978-1-941505-14-4
Chennai, India 11-13 July 2014 Paper ID: C4107
15
www.globalbizresearch.org
Any other
practices 3 2.00 .000 .000 2.00 2.00 2 2
Total 100 2.41 .753 .075 2.26 2.56 1 4
Age of the respondents
Sum of
Squares
df Mean
Square
F P Remarks
Between Groups 9.661 6 1.610 3.218 .006 Significant
Within Groups 46.529 93 .500
Total 56.190 99
The table displays the descriptive statistics of the sample size, mean, standard deviation
and standard error. The table also shows that the F Statistics, calculated as the ratio of the
variances. The column P Value shows the probability value from the t distribution. Since, the
P Value is less than 0.05, we reject the Null hypothesis. Hence there is a significant difference
in the mean scores of Preference for CSR Activities and Age of the Respondents.
5. Findings of the Study
It is clear from the study that majority 79% of the respondents are male.
Majority 44% of the respondents are Post-Graduates.
Majority of the respondents‟ age is between 21-30 years.
Majority 42% of the respondents are Private employees.
Majority 44% of the respondents‟ monthly income is between `10,001 - `20,000.
Majority 68% of the respondents opined that the companies have the responsibility
towards the improvement of the society.
It was depicted from the study that majority 33% of the respondents opined that the
company is responsible for its customers.
The study reveals that majority 30% of the respondents came to know CSR through the
press.
It is found from the study that majority, 61% of the respondents‟ are aware of CSR
activities.
It is understood from the study that majority 29% of the respondents opined that the
automotive industry is considered to be important for CSR activities.
Majority 24% of the respondents‟ preferred Environment protection related CSR
activities.
More than half of the respondents (69%) are willing to buy CSR products.

Proceedings of the Second International Conference on Global Business, Economics, Finance and
Social Sciences (GB14Chennai Conference) ISBN: 978-1-941505-14-4
Chennai, India 11-13 July 2014 Paper ID: C4107
16
www.globalbizresearch.org
Majority 53% of the respondents are willing to pay premium price for the CSR practising
company‟s products.
Majority 59% of the respondents have not known about the Mandatory provision.
From the Chi-Square analysis, it is concluded that there is no close relationship between
the Gender and the awareness on CSR.
From the Chi-Square analysis, it is concluded that there is no close relationship between
the Educational Qualification and awareness on Mandatory Provision of CSR.
From the Chi-Square analysis this analysis, it is concluded that there is no close
relationship between the place of the Respondents and willingness to buy CSR products.
From the ANOVA, it is found that there is no significant difference in the mean scores of
willingness to pay premium price for CSR products with the occupation of the
respondents.
From the ANOVA, it is found that there is a significant difference in the mean scores of
Preference for CSR Activities and Age of the Respondents.
6. Conclusion
Globalization of Indian economy has led to a paradigm shift in the way corporate social
responsibilities were performed in India. The way companies used to look at CSR activities
has also changed from a philanthropic activity to more professional activity. CSR activity has
become more of a responsibility and compulsion to Indian corporate from all perspectives of
their existence. The CSR activities in India will keep moving towards more holistic
upliftment of Indian society. In this study, to sum up, majority of the respondents preferred
Environment protection related CSR activities. More than half of the respondents are willing
to buy and half of the respondents are willing to pay premium price for CSR products. But,
not more than half of the respondents did not aware of the CSR mandatory provisions. The
consumers in Salem City know about CSR but they did not aware of the practices done by the
companies. They expect that the companies CSR practices should be disclosed through the
media. CSR is one such concept through which the country can attain its sustainable
development.
References
Andre Sobczak, Gervaise Debucquet and Christelle Havard, “The impact of higher education
on students‟ and young managers‟ perception of companies and CSR: an exploratory
analysis”, Corporate Governance, Vol.6, No.4, pp.463-474.
Jean – Marie Codron, Lucie Siriex and Thomas Reardon, “Social and Environmental
attributes of food products in an emerging mass market: Challenges of Signaling and
consumer perception, with European illustrations”, Agriculture and Human Values, I-23,
pp.283-297.

Proceedings of the Second International Conference on Global Business, Economics, Finance and
Social Sciences (GB14Chennai Conference) ISBN: 978-1-941505-14-4
Chennai, India 11-13 July 2014 Paper ID: C4107
17
www.globalbizresearch.org
Jothi M, “Competitiveness, sustainability and CSR initiatives of commercial banks in India:
An empirical study of BSE listed commercial banks”, The Alternative – Journal of
Management studies and research, Vol. X, No. 1, Oct – March 2011, Pgs. 21-37.
Kailash Tuli, “Sustainable Business Strategy or Eyewash for unethical business practices: A
study of the CSR initiatives of Coca Cola India”, Management & Change, Vol.14, No.2,
2010.
Kamal Singh, “Business Ethics and Corporate Social Responsibility – Time for action now”,
Effective Executive, Vol.XII, No.10, October 2009, pgs.58-64.
Kavitha W and Anitha P, “Disclosures about a CSR practices: A literature Review”, The IUP
Journal of corporate Governance, Vol.X, No.1, January 2011, Pgs.45-55.
Lei Wang and Heikki Juslin, “The Effects of Value on the Perception of Corporate Social
Responsibility Implementation: A study of Chinese Youth”, Corporate Social Responsibility
and Environmental Management, No.18, pp.246-262, 2011.
Maksimainen J, P Saariluoma, and P Jokivuori, “Corporate Social Responsibility and Values
in Innovation Management”, World Academy of Science, Engineering and Technology 53
2009.
Malvinder Singh, “Corporate Social Responsibility- Contribution to sustainable
development”, productivity News, Vol.45, No.3, May-June 2007, Pgs.52-54.
Mercia Selva Malar, “Social Cause Marketing - The CSR responsibility of B-Schools”,
Effective Executive, Vol.XII, No.9, September 2009, Pgs. 17-18.
Muruganantham G, Case study on Corporate Social Responsibility of MNC‟s in India,
International Trade & Academic Research Conference (ITARC) - London 2010.
Parvinder Arora, Ajay K Garg and S C Vaidya, “Efficacy of Integrating Corporate Social
Responsibility and Procurement Strategy – A case study of leading cotton Textile
Manufacturing Company in India”, South Asian Journal of Management, Vol.14, No.1-2,
Jan-June 2007, Pgs.105-119.
Peggy Simcic Brønn and Albana Belliu Vrioni, Corporate social responsibility and cause-
related marketing: an overview, International Journal of Advertising, Vol. 20, No.2, 2001,
Pgs.207-222.
Percy Marquina Feldman and Arturo Z. Vasques-Parraga, “Consumer social responses to
CSR initiatives versus corporate abilities”, Journal of Consumer Marketing, Vol.30, No.2,
2013, pp.100-111.
PHAM Duc Hieu, “Corporate social responsibility: A study on awareness of managers and
consumers in Vietnam”, Journal of Accounting and Taxation, Vol. 3, No.8, pp.162-170,
December 2011.

Proceedings of the Second International Conference on Global Business, Economics, Finance and
Social Sciences (GB14Chennai Conference) ISBN: 978-1-941505-14-4
Chennai, India 11-13 July 2014 Paper ID: C4107
18
www.globalbizresearch.org
Rohit Pande, “Corporate social responsibility: A Human Face for the Global Economy”, The
Alternative - Journal of Management studies and Research, Vol. VIII, No.2, April –
September 2009, Pgs. 57-69.
Satish Kumar and Ritesh Tiwari, “Corporate Social Responsibility: Insights into
contemporary research”, The IUP Journal of Corporate Governance, Vol. X, No.1, January
2011, Pgs.22-44.
Websites
http://www.csrquest.net
http://www.csrwire.com
http://www-935.ibm.com
http://oae.sagepub.com
http://csr-news.net
http://www.indianet.nl