Embed Size (px)
Citation preview
An Anatomy of a Decision-Support System for Developing and Launching Line ExtensionsAuthor(s): Morris A. Cohen, Jehoshua Eliashberg and Teck H. HoSource: Journal of Marketing Research, Vol. 34, No. 1, Special Issue on Innovation and NewProducts (Feb., 1997), pp. 117-129Published by: American Marketing AssociationStable URL: http://www.jstor.org/stable/3152069 .
Accessed: 15/04/2013 10:19
Your use of the JSTOR archive indicates your acceptance of the Terms & Conditions of Use, available at .http://www.jstor.org/page/info/about/policies/terms.jsp
.JSTOR is a not-for-profit service that helps scholars, researchers, and students discover, use, and build upon a wide range ofcontent in a trusted digital archive. We use information technology and tools to increase productivity and facilitate new formsof scholarship. For more information about JSTOR, please contact [email protected].
.
American Marketing Association is collaborating with JSTOR to digitize, preserve and extend access toJournal of Marketing Research.
http://www.jstor.org
This content downloaded from 128.91.110.146 on Mon, 15 Apr 2013 10:19:14 AMAll use subject to JSTOR Terms and Conditions
MORRIS A. COHEN, JEHOSHUA ELIASHBERG, and TECK H. HO*
For most firms producing fast-moving consumer packaged goods, line extension is central to their new product development (NPD) strategy. The authors present a decision-support system for managing the NPD process in this industry, which explicitly evaluates the financial prospects of new line extension concepts. The system developed is based on an in- depth analysis of 51 new product projects launched over a three-year period at a major food manufacturer. It embodies historical knowledge about the productivity of the firm's NPD process and captures some key research and development resource inputs that can affect this productiv- ity. It also provides shipment forecasts at various stages of the NPD process and thus can be used at new product project review gates to evaluate line extension concepts systematically. Finally, the system also can be used to improve the practice of the NPD process by enabling its users to take a product line perspective, using incremental sales evalua- tion, and by facilitating cross-functional and inter-project learning. Although the system has been developed specifically for a packaged food company environment, its underlying design principles are generic and
applicable to a wide range of industries.
An Anatomy of a Decision-Support
System for Developing and
Launching Line Extensions
For most industrial and consumer product firms, success- ful new products are engines of growth for sales and prof- itability. Although there is consensus about the strategic im- portance of new product development (NPD), no universal formula for success has been prescribed. Firms in different industries wrestle with different competitive imperatives and formulate different strategies to succeed in the marketplace.
In Cohen, Eliashberg, and Ho (1996), we present an ana- lytical model for managing the trade-offs between a target level of product performance and the time to market, two critical factors for success in high-technology industries (e.g., computers, packaged software). Because objective measures for product performance can be determined in these industries fairly easily, the primary objective of a de- sign team becomes launching a product with sufficiently high performance in the shortest time possible. We also show that the ability to achieve success in this type of in-
*Morris A. Cohen is the Matsushita Professor of Manufacturing and Logistics, Operations & Information Management Department, and Jehoshua El iashberg is Professor of Marketing, Operations and Information Management, Department of Marketing, Wharton School, University of Pennsylvania. Teck H. Ho is Assistant Professor of Operations and Tech- nology Management, Anderson School of Management, University of Cal- ifornia, Los Angeles.
dustry, characterized by a high rate of product obsolescence and a narrow window of market opportunity, depends on the interaction of a number of factors, including the level of cap- ital investment to support development (e.g., use of comput- er-aided design and engineering), the productivity of the en- gineering resource (i.e., how fast it can improve product per- formance), the number of engineering hours allocated to dif- ferent research activities in the NPD process, an appropriate choice of a target level for product performance, and time to market.
The challenges faced by firms in the packaged goods (e.g., food, detergents) industry are somewhat different. Us- ing an in-depth analysis of 51 new products launched over a three-year period at a major packaged goods company, we observed that it is often impossible to develop objective measures of product performance. Consequently, the drivers of success of NPD for packaged goods are different from those in the high-technology industry. Firms cannot perfect- ly determine customer wants ex ante (especially for truly new products), so they must invest relatively more time and effort as they move through the design process to capture the "voice of the customer," so that the new product will be more likely to meet customers' needs (Akao 1992).
Therefore, the critical input resources are those that help to identify, and later to influence, customers' wants. We have
Journal of Marketing Research Vol. XXXIV (February 1997), 117-129 117
This content downloaded from 128.91.110.146 on Mon, 15 Apr 2013 10:19:14 AMAll use subject to JSTOR Terms and Conditions
JOURNAL OF MARKETING RESEARCH, FEBRUARY 1997
found that these inputs include the level of experience of the new product design team leader and the amount of cus- tomer-based information collected during the NPD process. In addition, a significant amount of promotion and advertis- ing dollars must be invested to launch such products suc- cessfully.
The difficulty and risk associated with determining cus- tomers' needs have prompted many firms in the fast-moving consumer goods industries to rely heavily on line extensions for stimulating demand for their brands. Indeed, a recent study of leading consumer packaged goods companies re- vealed that only 5% of new product introductions are new brands, 6% are brand extensions, and the remaining 89% are line extensions (Aaker 1991).1 Many believe that line exten- sions will continue to be central to NPD strategy in con- sumer packaged goods markets (Aaker 1991). Therefore, the importance of effectively managing the line extension process is quite high. Moreover, despite the lower risk in- volved in line extensions, managers feel that their NPD process is successful less than 50% of the time (Group EFO Limited 1994).
One way to improve the NPD process is to rely on deci- sion-support systems (DSSs). The use of computer-based support systems to improve decision making in marketing is not new. Several successful implementations of DSSs have been reported, supporting such activities as marketing mix (Little 1970, 1975), sales calling (Lodish 1971), retailing (Lodish 1981), consumer promotion (Keon and Bayer 1986), commercialization and communication of new prod- ucts (Rangaswamy et al. 1987), new product launching (Choffray and Lilien 1986; Ram and Ram 1989), and mar- ket trends detection (Schmitz, Armstrong, and Little 1990).
We describe a DSS designed for packaged goods manu- facturers to improve the evaluation and selection of new line extension concepts, the allocation of the necessary re- sources, and the promotion of links between research and development (R&D) and marketing decisions. The DSS is model-based and comparable to ADBUDG (Little 1970), CALLPLAN (Lodish 1971), and BRANDAID (Little 1975). Several empirical relationships, which can be developed from company historical records of line extension launches, are embedded into the system. These empirical relationships are used to predict the impact of alternative resource input mix choices on anticipated product performance and to gen- erate sales volume forecasts at various stages of the NPD process. As a result, the system can help improve the selec- tivity of the NPD process so that inferior concepts can be screened out early on, thereby enabling superior concepts to be developed successfully (Kotler 1994; Wind 1982).
We illustrate how the system can be used to support a food company's line extension strategy. The article is orga- nized as follows: First we describe the overall system design and its major functions and highlight its unique features. Next, we illustrate how the system was customized for use by the food company. The system currently is being evalu- ated as a basis for a corporatewide methodology to assess line extension concepts that have product-market character-
IA brand extension occurs when a successful product's brand name is used to enter a completely different product category (e.g., Ivory shampoo). A line extension occurs when an existing brand name is used to enter a new market segment in the same product category (e.g., Levi's Wrinkle-Free Dockers slack series).
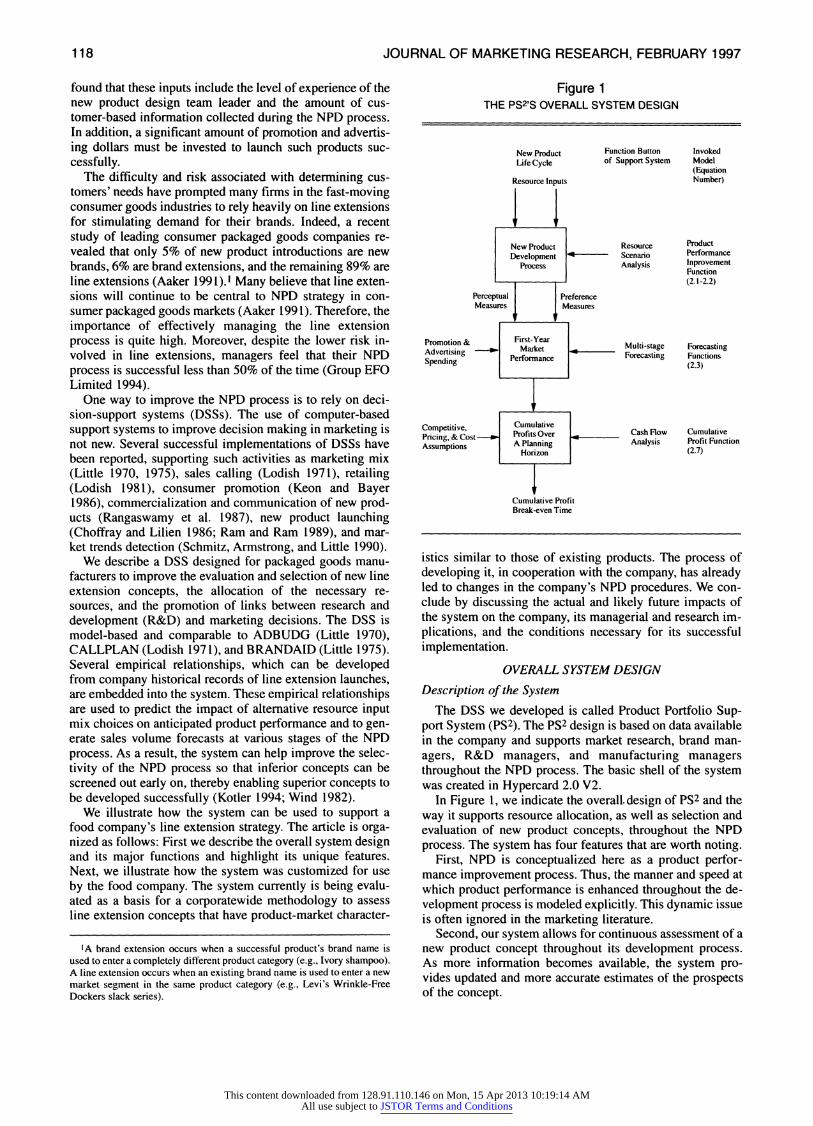
Figure 1 THE PS2'S OVERALL SYSTEM DESIGN
New Product Life Cycle
Promotion & Advertising Spending
Competitive, Pricing, & Cos Assumptions
Function Button of Support System
Invoked Model (Equation Number)
Resource Product Scenario Performance
Analysis Inprovement Function (2.1-2.2)
Multi-stage Forecasting Forecasting Functions
(2.3)
Cash Flow Cumulative Analysis Profit Function
(2.7)
Cumulative Profit Break-even Time
istics similar to those of existing products. The process of developing it, in cooperation with the company, has already led to changes in the company's NPD procedures. We con- clude by discussing the actual and likely future impacts of the system on the company, its managerial and research im- plications, and the conditions necessary for its successful implementation.
OVERALL SYSTEM DESIGN
Description of the System The DSS we developed is called Product Portfolio Sup-
port System (PS2). The PS2 design is based on data available in the company and supports market research, brand man- agers, R&D managers, and manufacturing managers throughout the NPD process. The basic shell of the system was created in Hypercard 2.0 V2.
In Figure 1, we indicate the overall. design of PS2 and the way it supports resource allocation, as well as selection and evaluation of new product concepts, throughout the NPD process. The system has four features that are worth noting.
First, NPD is conceptualized here as a product perfor- mance improvement process. Thus, the manner and speed at which product performance is enhanced throughout the de- velopment process is modeled explicitly. This dynamic issue is often ignored in the marketing literature.
Second, our system allows for continuous assessment of a new product concept throughout its development process. As more information becomes available, the system pro- vides updated and more accurate estimates of the prospects of the concept.
118
This content downloaded from 128.91.110.146 on Mon, 15 Apr 2013 10:19:14 AMAll use subject to JSTOR Terms and Conditions
Line Extensions
Third, we adopt a life cycle perspective to NPD. With a given set of competitive, pricing, and cost assumptions, the PS2 can estimate both the cumulative revenue and cost of the new product over its life cycle. In this way, the firm is en- couraged to take a long-term perspective in evaluating the potential return on the investment in a new product concept.
Fourth, our experience suggests that management often focuses only on the individual new product project, ignoring product line considerations. The system developed here evaluates the performance of the entire product line with and without the new product under consideration and thus deter- mines the incremental impact of the new product.
Our overall approach links R&D and marketing activities, thus promoting greater cross-functional integration between the two functions. Research and development resource in- puts are evaluated in light of their ultimate incremental sales and profit contributions so that they are allocated to the de- velopment of the most promising product concepts. Adver- tising and promotion dollars are employed to launch only those products that score well with respect to product attrib- utes and customer reactions, because they are the most like- ly to succeed in the market. As a consequence, we believe that PS2 is likely to lead to the development of more effec- tive new product strategies in the future.
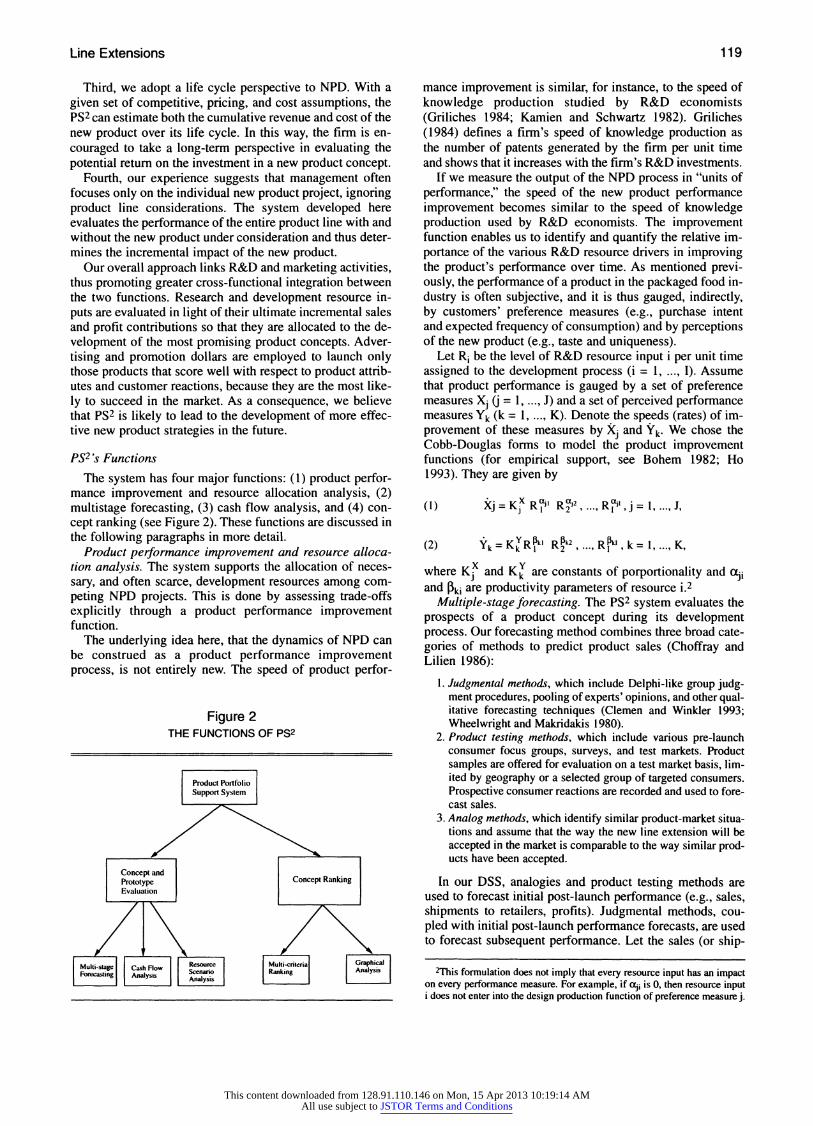
PS2 's Functions
The system has four major functions: (1) product perfor- mance improvement and resource allocation analysis, (2) multistage forecasting, (3) cash flow analysis, and (4) con- cept ranking (see Figure 2). These functions are discussed in the following paragraphs in more detail.
Product performance improvement and resource alloca- tion analysis. The system supports the allocation of neces- sary, and often scarce, development resources among com- peting NPD projects. This is done by assessing trade-offs explicitly through a product performance improvement function.
The underlying idea here, that the dynamics of NPD can be construed as a product performance improvement process, is not entirely new. The speed of product perfor-
Figure 2 THE FUNCTIONS OF PS2
mance improvement is similar, for instance, to the speed of knowledge production studied by R&D economists (Griliches 1984; Kamien and Schwartz 1982). Griliches (1984) defines a firm's speed of knowledge production as the number of patents generated by the firm per unit time and shows that it increases with the firm's R&D investments.
If we measure the output of the NPD process in "units of performance," the speed of the new product performance improvement becomes similar to the speed of knowledge production used by R&D economists. The improvement function enables us to identify and quantify the relative im- portance of the various R&D resource drivers in improving the product's performance over time. As mentioned previ- ously, the performance of a product in the packaged food in- dustry is often subjective, and it is thus gauged, indirectly, by customers' preference measures (e.g., purchase intent and expected frequency of consumption) and by perceptions of the new product (e.g., taste and uniqueness).
Let Ri be the level of R&D resource input i per unit time assigned to the development process (i = 1, .... I). Assume that product performance is gauged by a set of preference measures Xj (j = 1, ..., J) and a set of perceived performance measures Yk (k = 1, ..., K). Denote the speeds (rates) of im- provement of these measures by Xj and Yk. We chose the Cobb-Douglas forms to model the product improvement functions (for empirical support, see Bohem 1982; Ho 1993). They are given by
(I) j = Kx R' R2...R ,j= 1,..., J,
(2) Yk = KkRI' R2 ...R , k = 1,..., K,
Y where Kx and Kk are constants of porportionality and oaji and 3ki are productivity parameters of resource i.2
Multiple-stage forecasting. The PS2 system evaluates the prospects of a product concept during its development process. Our forecasting method combines three broad cate- gories of methods to predict product sales (Choffray and Lilien 1986):
1. Judgmental methods, which include Delphi-like group judg- ment procedures, pooling of experts' opinions, and other qual- itative forecasting techniques (Clemen and Winkler 1993; Wheelwright and Makridakis 1980).
2. Product testing methods, which include various pre-launch consumer focus groups, surveys, and test markets. Product samples are offered for evaluation on a test market basis, lim- ited by geography or a selected group of targeted consumers. Prospective consumer reactions are recorded and used to fore- cast sales.
3. Analog methods, which identify similar product-market situa- tions and assume that the way the new line extension will be accepted in the market is comparable to the way similar prod- ucts have been accepted.
In our DSS, analogies and product testing methods are used to forecast initial post-launch performance (e.g., sales, shipments to retailers, profits). Judgmental methods, cou- pled with initial post-launch performance forecasts, are used to forecast subsequent performance. Let the sales (or ship-
2This formulation does not imply that every resource input has an impact on every performance measure. For example, if aji is 0, then resource input i does not enter into the design production function of preference measure j.
119
This content downloaded from 128.91.110.146 on Mon, 15 Apr 2013 10:19:14 AMAll use subject to JSTOR Terms and Conditions
JOURNAL OF MARKETING RESEARCH, FEBRUARY 1997
ments) volume forecasts (in units) in the first time period after the product is launched (e.g., year or quarter) be denoted by Sl. Denote the level of marketing spending on a particular advertising and promotion method I by Ml (1 = 1, ..., L). Then, we can invoke, for example, the widely accepted linear relationship:
(3) S = 00 + OXXI +... + OXJO + XJ Yl +... + +OYK + OMMI +... + OML,
where Xs and Ys are consumers' preferences for and perfor- mance perceptions of the new product concept and proto- type. These measures are collected sequentially as the prod- uct flows through the NPD process. In the next section, we use Equation 3 to obtain three best-fit models as more infor- mation (Xs, Ys, and Ms) becomes available at the three suc- cessive development stages.
The company's collected consumer preference measures for the new product concept include purchase intent, which is widely used in practice for sales forecasting for new prod- ucts at the concept stage. Tauber (198 1) suggests that the use of purchase intent to develop sales forecasts will continue to dominate in practice because of its simplicity despite the discrepancy between intent and actual behavior. Tauber (1975) shows that a concept's purchase intent relates posi- tively to new product awareness and trial purchase but not to its repeat purchase. He concludes that a concept's purchase intent should not be used alone to make go/no go decisions at new product review gates. In addition to a concept's pur- chase intent, consumers' perceptions of taste and uniqueness for the concept, purchase intent for the prototype, and first- year advertising expenditure are employed in our sales fore- casting equations.
The sales of the new product in the subsequent time peri- ods (St, t > 2) can be estimated using the estimated first-pe- riod sales level (SI) and managers' subjective judgments about the market environment. Denote the (unobservable) attraction of the new product by A. It is assumed that A is fixed at launch and remains unchanged throughout the life cycle. The total attraction of all other products in the cate- gory (i.e., all products except the line extension under con- sideration) is denoted by TAo(t). Note that the latter variable may vary over time.3 Let Dt be the size of the product cate- gory at time t. Using the classic attraction model (Bell, Keeney, and Little 1975), we express the sales volume of the new product under consideration at time t, St, as
(4) S = D? ,t = 1,2, ...,T. A + TAo(t)
Dividing Equation 4 by St_ - = Dt * A/[A + TAo (t + 1)] and rearranging terms, we have
(5) St = St Dt_ A+ TA0(t -
) D
A
TAo(t - 1) T A + TAo(t) .t=2.
TAo(t - 1) TAo(t - 1)
where T is the sales cycle (e.g., end of the product life cycle). Let rt = A/TAo(t) = St/(Dt - St) (from Equation 4), rto = [TAo(t) - TAo(t - l)]/TA0(t - 1), and gt = (Dt - Dt _ )/ Dt- 1. Then Equation 5 can be written as
rt_ + I (6) St = St- (I + gt) ,t = 2,...,T.
rt_1 + I + rt?
Using the recursive Equation 6 and SI (from Equation 3), we can estimate St for t > 1. Note that rt is the relative attrac- tion of the new line extension vis-a-vis all other products in the category, rot is the growth rate of the total attraction of all other products in the category, and gt is the growth (or decline if it is negative) rate of the size of the total product category at time period t. rot and gt can be determined, as in Little (1970), by using judgmental methods (e.g., pooling estimates from the appropriate brand managers). In Equa- tion 6, rt - I is computed using values of St _ l and Dt_ 1 obtained in the previous recursion.
We chose to rely mainly on judgmental methods to obtain ro and gt because the use of analog methods to forecast sales in the subsequent time periods presents some problems. On the one hand, products that have been launched recently are likely to be more representative of new product concepts un- der consideration, but sales for the distant future have yet to be realized. On the other hand, older products have all the needed sales data, but they tend to be less predictive of sales for the new product concepts under consideration, because the competitive environment for the new products is likely to be different from that of the old products. It is also worth noting that PS2 consists of multiple forecasting equations and incorporates consumer reactions as they become avail- able at the different stages of the NPD process. The system automatically adapts and improves forecasting accuracy by incorporating new information items into a revised forecast- ing equation. Thus, new product concepts can be reassessed for their potential payoff throughout their development process.
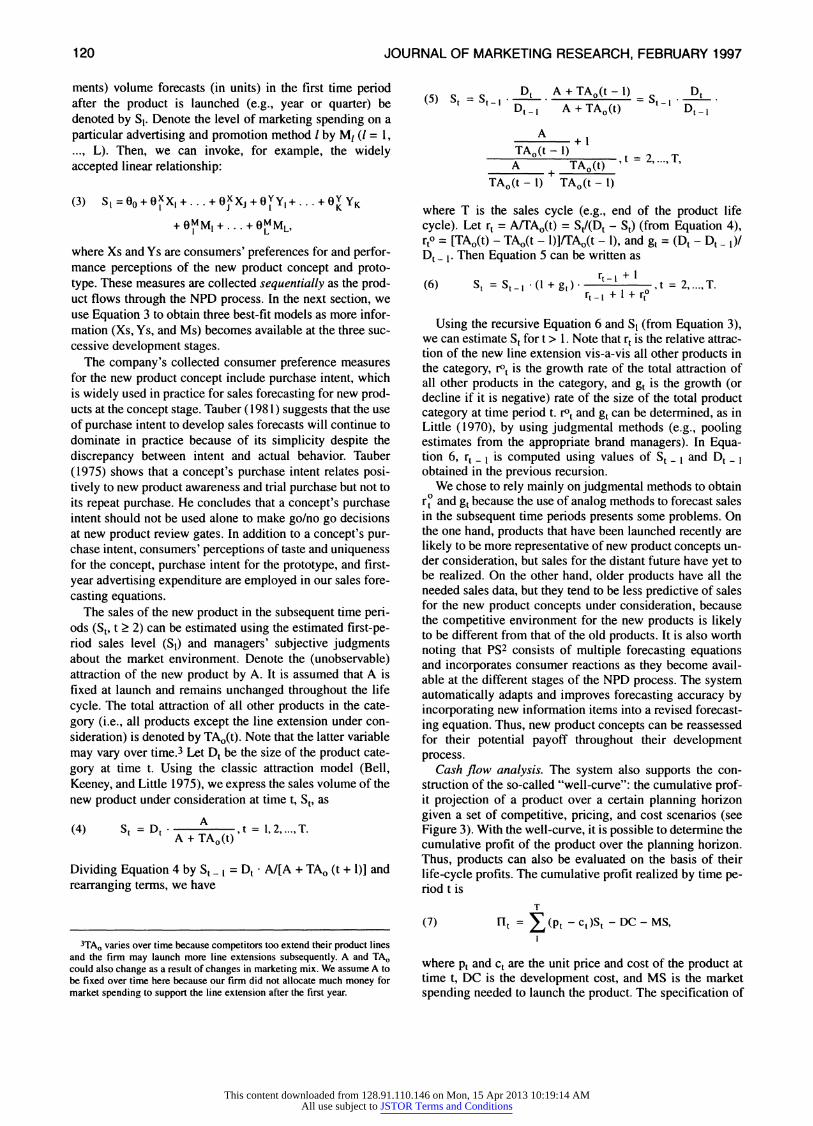
Cash flow analysis. The system also supports the con- struction of the so-called "well-curve": the cumulative prof- it projection of a product over a certain planning horizon given a set of competitive, pricing, and cost scenarios (see Figure 3). With the well-curve, it is possible to determine the cumulative profit of the product over the planning horizon. Thus, products can also be evaluated on the basis of their life-cycle profits. The cumulative profit realized by time pe- riod t is
(7)
3TAo varies over time because competitors too extend their product lines and the firm may launch more line extensions subsequently. A and TAo could also change as a result of changes in marketing mix. We assume A to be fixed over time here because our firm did not allocate much money for market spending to support the line extension after the first year.
T
Flt = (Pt - ct)St - DC - MS,
where Pt and ct are the unit price and cost of the product at time t, DC is the development cost, and MS is the market spending needed to launch the product. The specification of
120
This content downloaded from 128.91.110.146 on Mon, 15 Apr 2013 10:19:14 AMAll use subject to JSTOR Terms and Conditions
Line Extensions
Figure 3 THE WELL-CURVE, OR CUMULATIVE PROFIT PROJECTION
UNDER TWO COMPETITIVE SCENARIOS
Cumulative
4
v I
Less Intense / Competition \
Break-even Time I
Fixed Cost
ucts in the same product category. Thus, consistent with a product line perspective, it is important to analyze the sources of sales volume to determine the incremental impact of the line extension. For mature product categories such as packaged food products, there is often little or no growth in the category volume. Thus, the sales volume of the line ex- tension can come from either cannibalization of the firm's existing product line or reduced sales of competitive prod- ucts. Our system enables users to develop an estimate of the degree of cannibalization and provides a forecast of the in- cremental sales.
Let TA,(t) be the total attraction of the firm's current product line (i.e., excluding the new concept) in the catego- ry in period t, and TS(0) be the firm's total shipment volume in period 0. Then, the total shipment volume of the firm in period I if the line extension under consideration is not launched, TSn?(l), is
(8)
Development Cycle
Sales Cycle
the pricing and cost scenarios are based on judgmental esti- mates obtained from managers. Anticipated competitive reactions (captured by r?t) affect sales volume St (see Equa- tion 6), and hence the cumulative profits at time t.
In Figure 3, we show how this feature can enable the brand manager to evaluate the new product concept under two competitive scenarios. As a result of more intense com- petition, the new product is likely to have a longer break- even time and a smaller cumulative profit. The construction of the well-curve also makes it possible to generate several useful new product performance metrics, such as the break- even time and rate of return of the project. Firms frequently use these performance metrics to manage NPD. For exam- ple, Hewlett Packard's BET/2 strategy is directed toward re- ducing product break-even time (BET) by one-half for all its new products (House and Price 1991).
Ranking of concepts. Different criteria for evaluating a development project can be applied at different times during the NPD process in order to rank new product concepts, which involves using, for example, a concept's consumer- based scores, first-year sales, or total life-cycle profits. This feature permits the firm to change the evaluation criteria at different times to gain a balanced assessment of a new prod- uct concept. For example, a superior new product concept (i.e., high concept score) may be hard to operationalize and thus may score poorly as a prototype or have high expected unit cost. Such a concept may be rejected as a result of such an evaluation.4
For many line extensions, total sales may not be adequate for determining the success of the NPD process, because most line extensions cannibalize the sales of existing prod-
4To support managerial decision making further, the system also offers several graphical tools to allow visual comparison of new product concepts.
TSno?() = Dl * TAf(l)
= DI TAf() TAo(0) TAo(0) TAo(l)
= (I + gl) TS(O) I + r Il+rl?
If the line extension is launched, the total attraction of the firm's products in period 1 becomes A + TAf(O). Here the firm's total shipment volume in period 1, TSYes(l), is
(9) TSYes(l) = D A + TA() A + TAo(l)
= - A + D TAf(0) TAo(I)
A+TA(l) TAo(l) TAo((I)+ A
= S, +(l+ g)' TS(O) ? I - .
Note that all terms on the right-hand side are either known or can be elicited from managers. The incremental shipment in period I due to the line extension is given by
(10) IS(I) = TSYes(l) - TSN?(1).
Equations 8 and 9 assume that Luce's choice axiom (which states that the ratio of the market shares between two existing products remains unchanged before and after the line extension) holds. Ho and Tang (1995) provide a proce- dure for estimating incremental sales when Luce's axiom does not hold.
The return from a new product concept in terms of total sales, incremental sales, or life-cycle profit should be as- sessed against its required level of development resources and marketing expense. We can easily formulate the overall resource allocation problem of the entire product line as a constrained optimization program. The objective of the re- source allocation problem is to maximize the overall ex- pected return of the product line subject to the given re- source constraints.
User Interface The PS2 system is designed with the following principles
in mind:
121
This content downloaded from 128.91.110.146 on Mon, 15 Apr 2013 10:19:14 AMAll use subject to JSTOR Terms and Conditions
JOURNAL OF MARKETING RESEARCH, FEBRUARY 1997
1. Modular: PS2 is modular in that additional modules can be added easily. Additional empirical relationships can be added to PS2 by using functional buttons (see the next item). This will reduce the lead time for modifying the system.
2. Button-driven: We use data and function buttons. Data buttons enable the firm to develop different levels of aggregation to view the data. For instance, a data button for unit product cost can be created if it is useful to break this aggregate cost into its components. There is no limit to the level of aggregation allowed. The function buttons invoke different embedded em- pirical models to analyze and evaluate product concepts. The embedded empirical models are "best-fit" relationships de- rived from the historical data of similar products in the prod- uct category (see multistage forecasting and resource alloca- tion analysis).
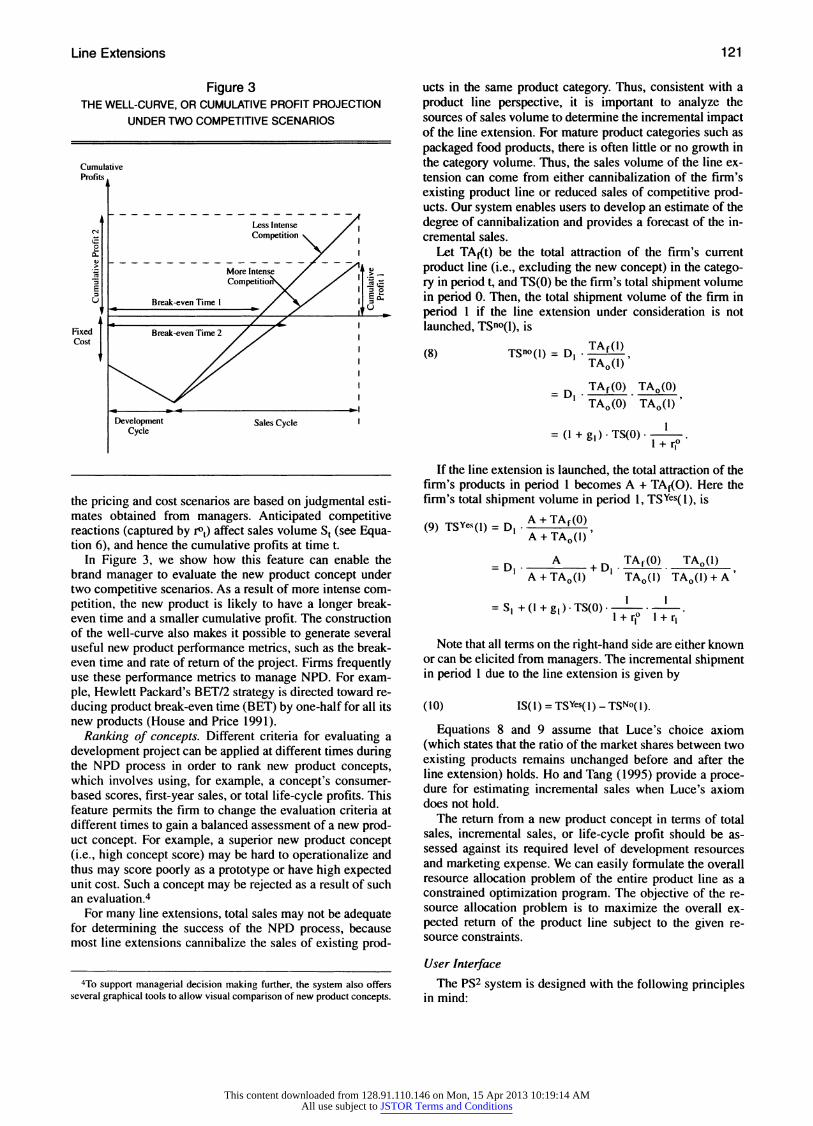
3. Single-screen: The use of function and data buttons enables us to adopt a single screen design. By "calling" the name of a product concept, the system provides a "card" that captures all relevant aggregate data about the product concept. Additional details of a data item for the concept can be viewed by click- ing the associated data button. In Figure 4, we show how the Market Spending data button is broken into its components.
IMPLEMENTATION ISSUES
Overall NPD Process
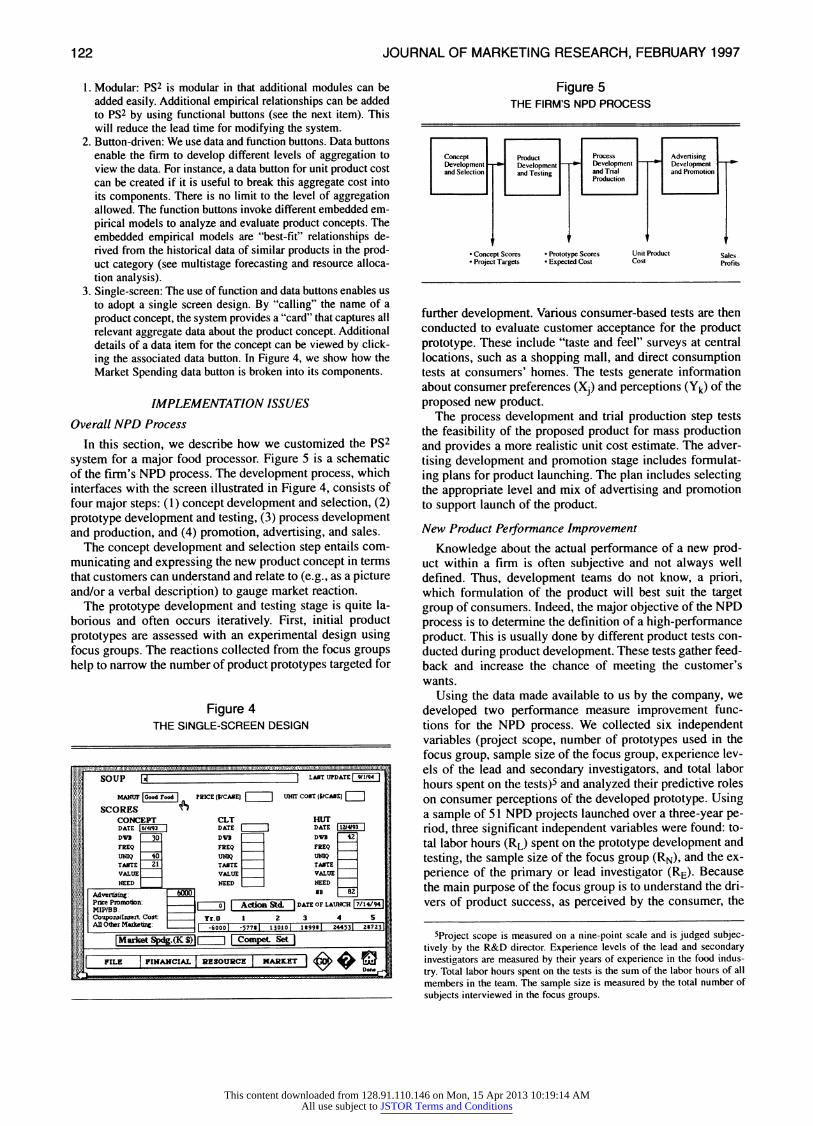
In this section, we describe how we customized the PS2 system for a major food processor. Figure 5 is a schematic of the firm's NPD process. The development process, which interfaces with the screen illustrated in Figure 4, consists of four major steps: (1) concept development and selection, (2) prototype development and testing, (3) process development and production, and (4) promotion, advertising, and sales.
The concept development and selection step entails com- municating and expressing the new product concept in terms that customers can understand and relate to (e.g., as a picture and/or a verbal description) to gauge market reaction.
The prototype development and testing stage is quite la- borious and often occurs iteratively. First, initial product prototypes are assessed with an experimental design using focus groups. The reactions collected from the focus groups help to narrow the number of product prototypes targeted for
Figure 4 THE SINGLE-SCREEN DESIGN
?*-.* . *. .* .~~~~~~~~~~~ . .* . . . . . T
. . ..
I f SO U P |\i | LAT UPDATE | 91 I4 |
MAMNUF |Goot Food | PRICE (WCASE) | | NT COST ($ICAE E)
SCORES ^
*. ii CONCEPT CLT HUT |i DATE 614693 I DATE I I DATE 12/493 |
| "i DVB 30 DVB DVB 42
FREQ = FREQ _ FREQ ___
UNQ 40 TQ UiQ _Q TABTE 21 TAXTE TAXTE VALUE VALUE __ VALUE
NEED N____ EED N____ EED
Advertisig: 6000 BB 82
MIPricBBe P?| o| | Actioa Std. | DATE OF LAUHCH 7/14/94
CouponsluIreut Cost: r____ yO I 2 3 4 5 AllOtherMaketn: -6000 -57781 130101 1899|1 244531 287231
Market Spdg.(K$)1 -1 | CompetL Set I
| FILE FINANCIAL RESOURCE MARKET i e( > a
Figure 5 THE FIRM'S NPD PROCESS
Concept Product Process Advertising Development -- Development - Development 4 Development --- and Selection and Testing and Trial and Promotion
Production
t t I + * Concept Scores * Prototype Scores Unit Product Sales * Project Targets * Expected Cost Cost Profits
further development. Various consumer-based tests are then conducted to evaluate customer acceptance for the product prototype. These include "taste and feel" surveys at central locations, such as a shopping mall, and direct consumption tests at consumers' homes. The tests generate information about consumer preferences (Xj) and perceptions (Yk) of the proposed new product.
The process development and trial production step tests the feasibility of the proposed product for mass production and provides a more realistic unit cost estimate. The adver- tising development and promotion stage includes formulat- ing plans for product launching. The plan includes selecting the appropriate level and mix of advertising and promotion to support launch of the product.
New Product Performance Improvement
Knowledge about the actual performance of a new prod- uct within a firm is often subjective and not always well defined. Thus, development teams do not know, a priori, which formulation of the product will best suit the target group of consumers. Indeed, the major objective of the NPD process is to determine the definition of a high-performance product. This is usually done by different product tests con- ducted during product development. These tests gather feed- back and increase the chance of meeting the customer's wants.
Using the data made available to us by the company, we developed two performance measure improvement func- tions for the NPD process. We collected six independent variables (project scope, number of prototypes used in the focus group, sample size of the focus group, experience lev- els of the lead and secondary investigators, and total labor hours spent on the tests)5 and analyzed their predictive roles on consumer perceptions of the developed prototype. Using a sample of 51 NPD projects launched over a three-year pe- riod, three significant independent variables were found: to- tal labor hours (RL) spent on the prototype development and testing, the sample size of the focus group (RN), and the ex- perience of the primary or lead investigator (RE). Because the main purpose of the focus group is to understand the dri- vers of product success, as perceived by the consumer, the
5Project scope is measured on a nine-point scale and is judged subjec- tively by the R&D director. Experience levels of the lead and secondary investigators are measured by their years of experience in the food indus- try. Total labor hours spent on the tests is the sum of the labor hours of all members in the team. The sample size is measured by the total number of subjects interviewed in the focus groups.
. ................ ... ll. . . . .. . .. ll e X. . . . . . ........... ...... ... . ... ... .. .............. ........ J.
,j En
Iu-
I
122
This content downloaded from 128.91.110.146 on Mon, 15 Apr 2013 10:19:14 AMAll use subject to JSTOR Terms and Conditions
Line Extensions
total number of subjects used in the tests is a reasonable measure for the extensiveness of these tests. RE is measured by the number of years of experience of the primary (R&D) investigator; presumably, more experience leads to better- quality information.
The two dependent variables in the performance measure improvement function are preference measures.6 The first measures consumers' average liking for the product (i.e., the "scoreboard," XI = SC), and the second measures the con- sumers' purchase intent (i.e., the percentage checking "defi- nitely will buy" X2 = DWBp) after a direct consumption test is administered. DWBp (ranges from 0 to 100%) is measured by consumers' willingness to purchase the product when asked to evaluate the product in their own home. SC (ranges from 10 to 90%) is a measure of how much the consumers like the product.7 Because all new products are developed under a one-year schedule to conform to an industry prod- uct-launching season, new product performance at the time of launch is used as a measure for the rate of the product per- formance improvement during that year. The total personnel hours expended is equivalent to the rate of the labor input. Equation 1, when applied to our data set, is thus given by
(11)
(12)
SC = KXRL RE R(N,
DWBp = K2R-L RL2E RN .
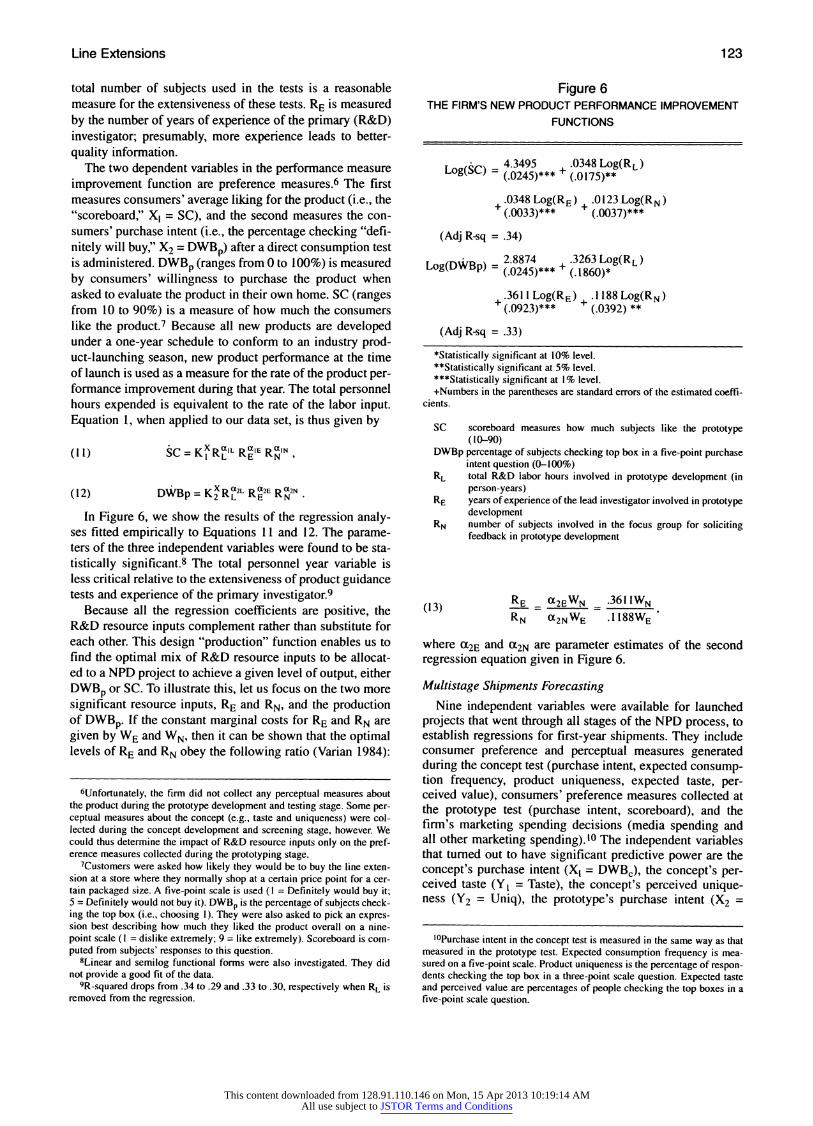
In Figure 6, we show the results of the regression analy- ses fitted empirically to Equations 11 and 12. The parame- ters of the three independent variables were found to be sta- tistically significant.8 The total personnel year variable is less critical relative to the extensiveness of product guidance tests and experience of the primary investigator.9
Because all the regression coefficients are positive, the R&D resource inputs complement rather than substitute for each other. This design "production" function enables us to find the optimal mix of R&D resource inputs to be allocat- ed to a NPD project to achieve a given level of output, either DWBp or SC. To illustrate this, let us focus on the two more significant resource inputs, RE and RN, and the production of DWBp. If the constant marginal costs for RE and RN are given by WE and WN, then it can be shown that the optimal levels of RE and RN obey the following ratio (Varian 1984):
6Unfortunately, the firm did not collect any perceptual measures about the product during the prototype development and testing stage. Some per- ceptual measures about the concept (e.g., taste and uniqueness) were col- lected during the concept development and screening stage, however. We could thus determine the impact of R&D resource inputs only on the pref- erence measures collected during the prototyping stage.
7Customers were asked how likely they would be to buy the line exten- sion at a store where they normally shop at a certain price point for a cer- tain packaged size. A five-point scale is used (I = Definitely would buy it; 5 = Definitely would not buy it). DWBp is the percentage of subjects check- ing the top box (i.e., choosing 1). They were also asked to pick an expres- sion best describing how much they liked the product overall on a nine- point scale (I = dislike extremely; 9 = like extremely). Scoreboard is com- puted from subjects' responses to this question.
8Linear and semilog functional forms were also investigated. They did not provide a good fit of the data.
9R-squared drops from .34 to .29 and .33 to .30, respectively when RL is removed from the regression.
Figure 6 THE FIRM'S NEW PRODUCT PERFORMANCE IMPROVEMENT
FUNCTIONS
Log(SC) = (.05)*** + .0348 Log(R)
O 4.3495 .0348Log(RL) Log(SC) = (.0245)***
' (.0175)**
+ .0348 Log(RE) + .0 123 Log(RN) (.0033)*** (.0037)***
(Adj R-sq = .34)
LogD Bp = 2.8874 + .3263 Log(RL) Log(DWBp) = (.0245)*** + (.1860)*
.3611 Log(RE) .1188 Log(RN) (.0923)*** (.0392) **
(Adj R-sq = .33)
*Statistically significant at 10% level. **Statistically significant at 5% level. ***Statistically significant at 1% level. +Numbers in the parentheses are standard errors of the estimated coeffi-
cients.
SC scoreboard measures how much subjects like the prototype (10-90)
DWBp percentage of subjects checking top box in a five-point purchase intent question (0-100%)
RL total R&D labor hours involved in prototype development (in person-years)
RE years of experience of the lead investigator involved in prototype development
RN number of subjects involved in the focus group for soliciting feedback in prototype development
(13) RE (a2EWN .3611WN
RN Oa2NWE .1188WE
where a2E and Oa2N are parameter estimates of the second regression equation given in Figure 6.
Multistage Shipments Forecasting Nine independent variables were available for launched
projects that went through all stages of the NPD process, to establish regressions for first-year shipments. They include consumer preference and perceptual measures generated during the concept test (purchase intent, expected consump- tion frequency, product uniqueness, expected taste, per- ceived value), consumers' preference measures collected at the prototype test (purchase intent, scoreboard), and the firm's marketing spending decisions (media spending and all other marketing spending). o The independent variables that turned out to have significant predictive power are the concept's purchase intent (XI = DWBc), the concept's per- ceived taste (Yt = Taste), the concept's perceived unique- ness (Y2 = Uniq), the prototype's purchase intent (X2 =
10Purchase intent in the concept test is measured in the same way as that measured in the prototype test. Expected consumption frequency is mea- sured on a five-point scale. Product uniqueness is the percentage of respon- dents checking the top box in a three-point scale question. Expected taste and perceived value are percentages of people checking the top boxes in a five-point scale question.
123
This content downloaded from 128.91.110.146 on Mon, 15 Apr 2013 10:19:14 AMAll use subject to JSTOR Terms and Conditions
JOURNAL OF MARKETING RESEARCH, FEBRUARY 1997
Figure 7 THE SALES FORECASTING FUNCTIONS
Concept Stage
Sales = -932.54 + 14.65(DWBc + Taste) + 21.48Uniq (292.8 1)** (4.34)** (5.27)**
(Adj R-Sq = .44)
Prototype Stage
Sales = -931.30 + 11.41(DWBc + Taste) + 18.51Uniq (337.13)** (5.16)** (5.71)**
+ 10.86 DWBp (4.63)**
(AdjR-Sq = .51)
Marketing Stage
Sales = -872.38 + 12.85(DWBc + Taste) + 13.37Uniq (320.93)** (4.90)** (5.82)**
+ 2.85DWBp + 79.39Media (1.48)** (30.88)**
(Adj R-Sq = .66)
*Statistically significant at 5% level. **Statistically significant at 1% level. +Numbers in the parentheses are standard errors of the estimated coeffi-
cients.
At the concept stage, subjects were presented with a picture of the con- cept. The following were collected:
DWBp percentage of subjects checking top box in a five-point ques- tion about purchase intent (0-100%)
Taste percentage of subjects checking top box in a five-point ques- tion about expected taste (0-100%)
Uniq percentage of subjects checking top box in a three-point question about uniqueness (0-100%)
At the prototype stage, subjects consumed the prototype at home. The following was collected:
DWBp percentage of subjects checking top box in a five-point ques- tion about purchase intent (0-100%)
After first-year of launch, the following were collected: Sales first-year shipment volume (in thousands of cases) Media media spending during the first year of product launch (in
millions of dollars)
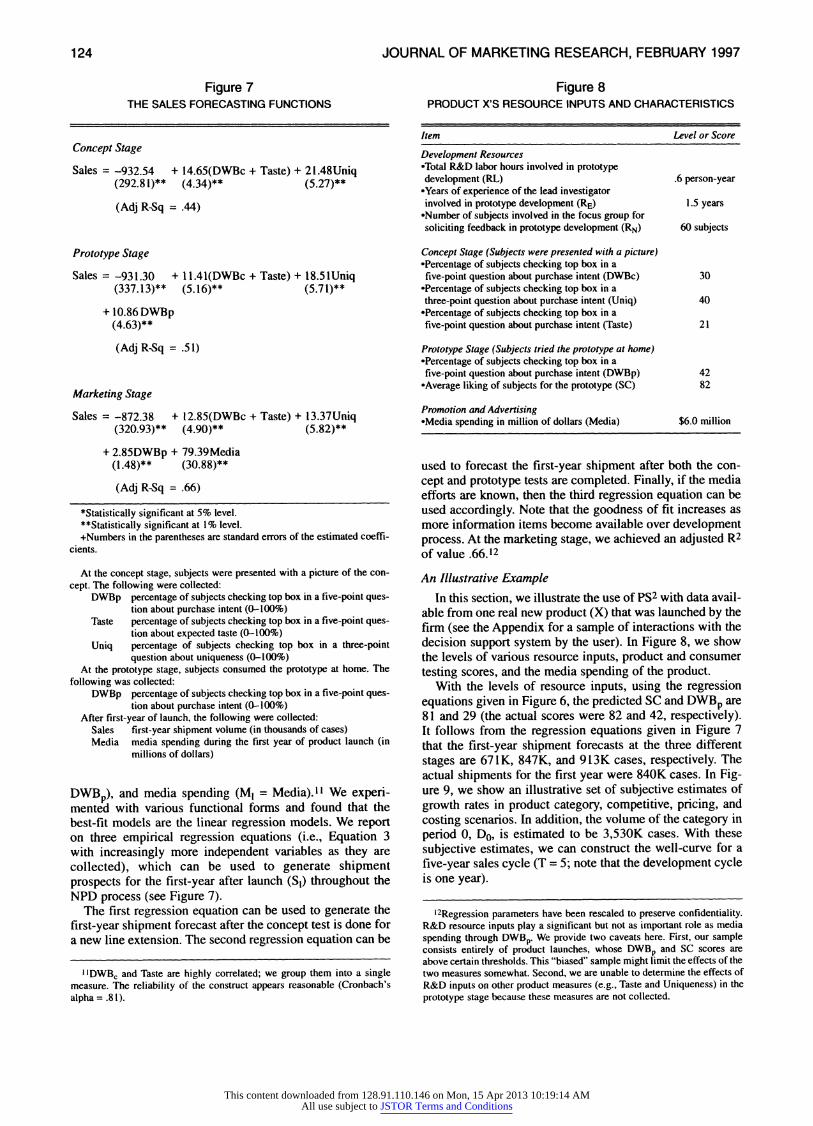
DWBp), and media spending (MI = Media).11 We experi- mented with various functional forms and found that the best-fit models are the linear regression models. We report on three empirical regression equations (i.e., Equation 3 with increasingly more independent variables as they are collected), which can be used to generate shipment prospects for the first-year after launch (SI) throughout the NPD process (see Figure 7).
The first regression equation can be used to generate the first-year shipment forecast after the concept test is done for a new line extension. The second regression equation can be
IIDWBC and Taste are highly correlated; we group them into a single measure. The reliability of the construct appears reasonable (Cronbach's alpha = .8 1).
Figure 8 PRODUCT X'S RESOURCE INPUTS AND CHARACTERISTICS
Item Level or Score
Development Resources *Total R&D labor hours involved in prototype development (RL) .6 person-year
*Years of experience of the lead investigator involved in prototype development (RE) 1.5 years
*Number of subjects involved in the focus group for soliciting feedback in prototype development (RN) 60 subjects
Concept Stage (Subjects were presented with a picture) *Percentage of subjects checking top box in a five-point question about purchase intent (DWBc) 30
*Percentage of subjects checking top box in a three-point question about purchase intent (Uniq) 40
*Percentage of subjects checking top box in a five-point question about purchase intent (Taste) 21
Prototype Stage (Subjects tried the prototype at home) *Percentage of subjects checking top box in a five-point question about purchase intent (DWBp) 42
*Average liking of subjects for the prototype (SC) 82
Promotion and Advertising *Media spending in million of dollars (Media) $6.0 million
used to forecast the first-year shipment after both the con- cept and prototype tests are completed. Finally, if the media efforts are known, then the third regression equation can be used accordingly. Note that the goodness of fit increases as more information items become available over development process. At the marketing stage, we achieved an adjusted R2 of value .66.12
An Illustrative Example
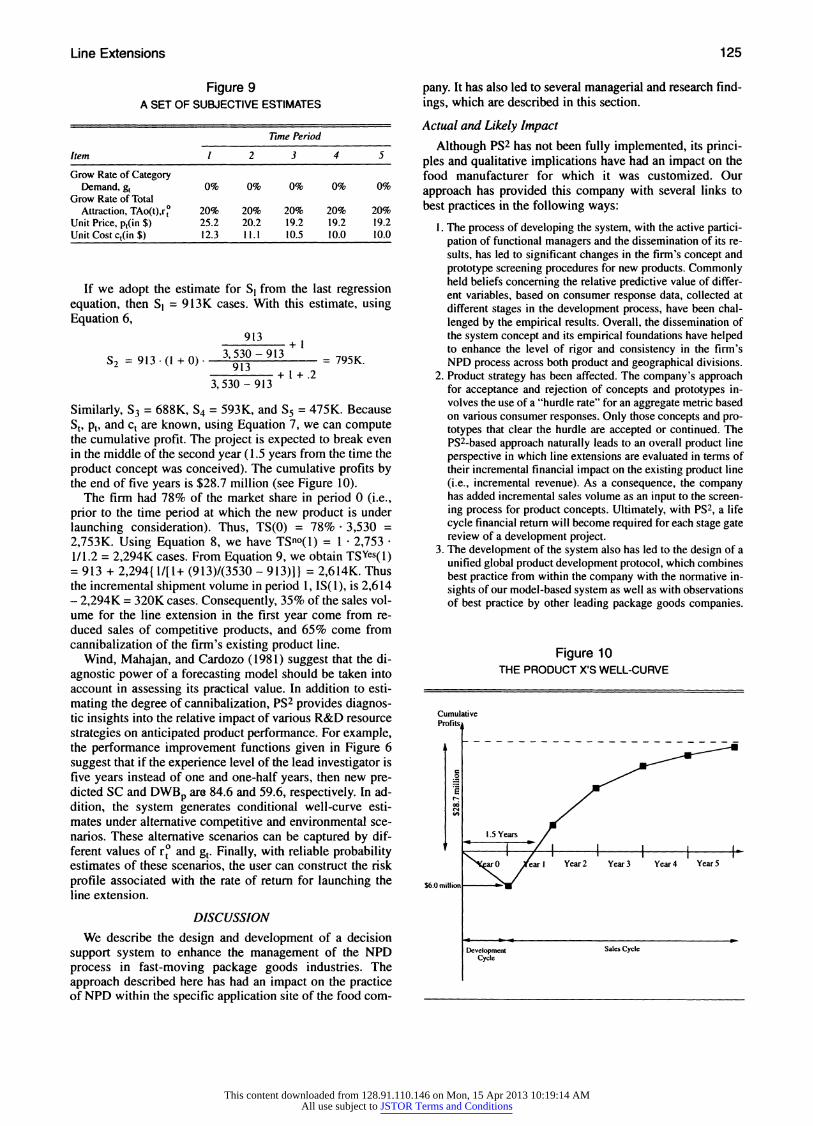
In this section, we illustrate the use of PS2 with data avail- able from one real new product (X) that was launched by the firm (see the Appendix for a sample of interactions with the decision support system by the user). In Figure 8, we show the levels of various resource inputs, product and consumer testing scores, and the media spending of the product.
With the levels of resource inputs, using the regression equations given in Figure 6, the predicted SC and DWBp are 81 and 29 (the actual scores were 82 and 42, respectively). It follows from the regression equations given in Figure 7 that the first-year shipment forecasts at the three different stages are 671K, 847K, and 913K cases, respectively. The actual shipments for the first year were 840K cases. In Fig- ure 9, we show an illustrative set of subjective estimates of growth rates in product category, competitive, pricing, and costing scenarios. In addition, the volume of the category in period 0, Do, is estimated to be 3,530K cases. With these subjective estimates, we can construct the well-curve for a five-year sales cycle (T = 5; note that the development cycle is one year).
12Regression parameters have been rescaled to preserve confidentiality. R&D resource inputs play a significant but not as important role as media spending through DWBp. We provide two caveats here. First, our sample consists entirely of product launches, whose DWBp and SC scores are above certain thresholds. This "biased" sample might limit the effects of the two measures somewhat. Second, we are unable to determine the effects of R&D inputs on other product measures (e.g., Taste and Uniqueness) in the prototype stage because these measures are not collected.
124
This content downloaded from 128.91.110.146 on Mon, 15 Apr 2013 10:19:14 AMAll use subject to JSTOR Terms and Conditions
Line Extensions
Figure 9 A SET OF SUBJECTIVE ESTIMATES
lime Period
Item 1 2 3 4 5
Grow Rate of Category Demand, gt 0% 0% 0% 0% 0%
Grow Rate of Total Attraction, TAo(t),rt 20% 20% 20% 20% 20%
Unit Price, pt(in $) 25.2 20.2 19.2 19.2 19.2 Unit Cost ct(in $) 12.3 11.1 10.5 10.0 10.0
If we adopt the estimate for SI from the last regression equation, then SI = 913K cases. With this estimate, using Equation 6,
913 +I
S2 = 913 (I + 0) 3,530 - = 795K. +
913 I .2
3, 530 - 913
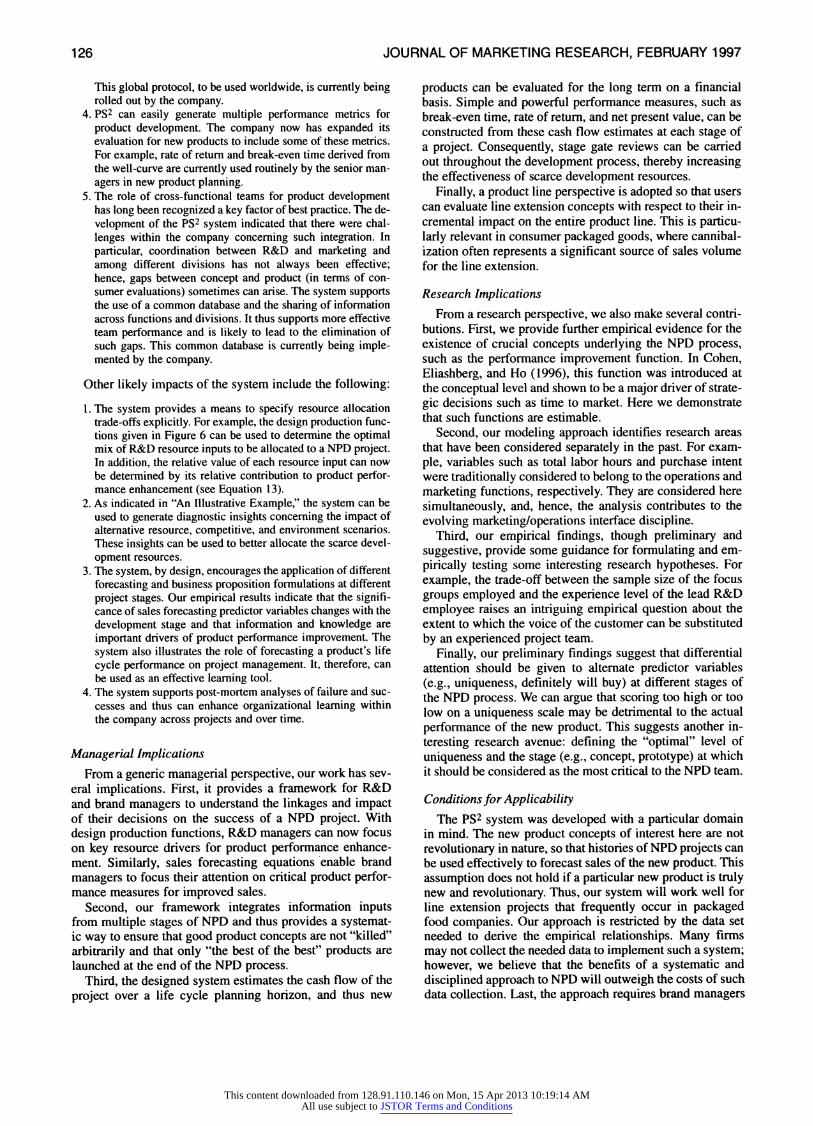
Similarly, S3 = 688K, S4 = 593K, and S5 = 475K. Because St, Pt, and ct are known, using Equation 7, we can compute the cumulative profit. The project is expected to break even in the middle of the second year (1.5 years from the time the product concept was conceived). The cumulative profits by the end of five years is $28.7 million (see Figure 10).
The firm had 78% of the market share in period 0 (i.e., prior to the time period at which the new product is under launching consideration). Thus, TS(0) = 78% * 3,530 = 2,753K. Using Equation 8, we have TSn?(l) = 1 * 2,753 1/1.2 = 2,294K cases. From Equation 9, we obtain TSYes(l) = 913 + 2,294{ 1/[l+ (913)/(3530 - 913)]} = 2,614K. Thus the incremental shipment volume in period 1, IS(1), is 2,614 - 2,294K = 320K cases. Consequently, 35% of the sales vol- ume for the line extension in the first year come from re- duced sales of competitive products, and 65% come from cannibalization of the firm's existing product line.
Wind, Mahajan, and Cardozo (1981) suggest that the di- agnostic power of a forecasting model should be taken into account in assessing its practical value. In addition to esti- mating the degree of cannibalization, PS2 provides diagnos- tic insights into the relative impact of various R&D resource strategies on anticipated product performance. For example, the performance improvement functions given in Figure 6 suggest that if the experience level of the lead investigator is five years instead of one and one-half years, then new pre- dicted SC and DWBp are 84.6 and 59.6, respectively. In ad- dition, the system generates conditional well-curve esti- mates under alternative competitive and environmental sce- narios. These alternative scenarios can be captured by dif- ferent values of ro and gt. Finally, with reliable probability estimates of these scenarios, the user can construct the risk profile associated with the rate of return for launching the line extension.
DISCUSSION
We describe the design and development of a decision support system to enhance the management of the NPD process in fast-moving package goods industries. The approach described here has had an impact on the practice of NPD within the specific application site of the food com-
pany. It has also led to several managerial and research find- ings, which are described in this section.
Actual and Likely Impact
Although PS2 has not been fully implemented, its princi- ples and qualitative implications have had an impact on the food manufacturer for which it was customized. Our approach has provided this company with several links to best practices in the following ways:
1. The process of developing the system, with the active partici- pation of functional managers and the dissemination of its re- sults, has led to significant changes in the firm's concept and prototype screening procedures for new products. Commonly held beliefs concerning the relative predictive value of differ- ent variables, based on consumer response data, collected at different stages in the development process, have been chal- lenged by the empirical results. Overall, the dissemination of the system concept and its empirical foundations have helped to enhance the level of rigor and consistency in the firm's NPD process across both product and geographical divisions.
2. Product strategy has been affected. The company's approach for acceptance and rejection of concepts and prototypes in- volves the use of a "hurdle rate" for an aggregate metric based on various consumer responses. Only those concepts and pro- totypes that clear the hurdle are accepted or continued. The PS2-based approach naturally leads to an overall product line perspective in which line extensions are evaluated in terms of their incremental financial impact on the existing product line (i.e., incremental revenue). As a consequence, the company has added incremental sales volume as an input to the screen- ing process for product concepts. Ultimately, with PS2, a life cycle financial return will become required for each stage gate review of a development project.
3. The development of the system also has led to the design of a unified global product development protocol, which combines best practice from within the company with the normative in- sights of our model-based system as well as with observations of best practice by other leading package goods companies.
Figure 10 THE PRODUCT X'S WELL-CURVE
Cumulative ProfitsA
0
E
?l
$6.0 million
1.5 Years
\Y earO Year I Year 2 Year3 Year4 Year5
Development Sales Cycle Cycle
125
This content downloaded from 128.91.110.146 on Mon, 15 Apr 2013 10:19:14 AMAll use subject to JSTOR Terms and Conditions
JOURNAL OF MARKETING RESEARCH, FEBRUARY 1997
This global protocol, to be used worldwide, is currently being rolled out by the company.
4. PS2 can easily generate multiple performance metrics for product development. The company now has expanded its evaluation for new products to include some of these metrics. For example, rate of return and break-even time derived from the well-curve are currently used routinely by the senior man- agers in new product planning.
5. The role of cross-functional teams for product development has long been recognized a key factor of best practice. The de- velopment of the PS2 system indicated that there were chal- lenges within the company concerning such integration. In particular, coordination between R&D and marketing and among different divisions has not always been effective; hence, gaps between concept and product (in terms of con- sumer evaluations) sometimes can arise. The system supports the use of a common database and the sharing of information across functions and divisions. It thus supports more effective team performance and is likely to lead to the elimination of such gaps. This common database is currently being imple- mented by the company.
Other likely impacts of the system include the following:
1. The system provides a means to specify resource allocation trade-offs explicitly. For example, the design production func- tions given in Figure 6 can be used to determine the optimal mix of R&D resource inputs to be allocated to a NPD project. In addition, the relative value of each resource input can now be determined by its relative contribution to product perfor- mance enhancement (see Equation 13).
2. As indicated in "An Illustrative Example," the system can be used to generate diagnostic insights concerning the impact of alternative resource, competitive, and environment scenarios. These insights can be used to better allocate the scarce devel- opment resources.
3. The system, by design, encourages the application of different forecasting and business proposition formulations at different project stages. Our empirical results indicate that the signifi- cance of sales forecasting predictor variables changes with the development stage and that information and knowledge are important drivers of product performance improvement The system also illustrates the role of forecasting a product's life cycle performance on project management. It, therefore, can be used as an effective learning tool.
4. The system supports post-mortem analyses of failure and suc- cesses and thus can enhance organizational learning within the company across projects and over time.
Managerial Implications From a generic managerial perspective, our work has sev-
eral implications. First, it provides a framework for R&D and brand managers to understand the linkages and impact of their decisions on the success of a NPD project. With design production functions, R&D managers can now focus on key resource drivers for product performance enhance- ment. Similarly, sales forecasting equations enable brand managers to focus their attention on critical product perfor- mance measures for improved sales.
Second, our framework integrates information inputs from multiple stages of NPD and thus provides a systemat- ic way to ensure that good product concepts are not "killed" arbitrarily and that only "the best of the best" products are launched at the end of the NPD process.
Third, the designed system estimates the cash flow of the project over a life cycle planning horizon, and thus new
products can be evaluated for the long term on a financial basis. Simple and powerful performance measures, such as break-even time, rate of return, and net present value, can be constructed from these cash flow estimates at each stage of a project. Consequently, stage gate reviews can be carried out throughout the development process, thereby increasing the effectiveness of scarce development resources.
Finally, a product line perspective is adopted so that users can evaluate line extension concepts with respect to their in- cremental impact on the entire product line. This is particu- larly relevant in consumer packaged goods, where cannibal- ization often represents a significant source of sales volume for the line extension.
Research Implications From a research perspective, we also make several contri-
butions. First, we provide further empirical evidence for the existence of crucial concepts underlying the NPD process, such as the performance improvement function. In Cohen, Eliashberg, and Ho (1996), this function was introduced at the conceptual level and shown to be a major driver of strate- gic decisions such as time to market. Here we demonstrate that such functions are estimable.
Second, our modeling approach identifies research areas that have been considered separately in the past. For exam- ple, variables such as total labor hours and purchase intent were traditionally considered to belong to the operations and marketing functions, respectively. They are considered here simultaneously, and, hence, the analysis contributes to the evolving marketing/operations interface discipline.
Third, our empirical findings, though preliminary and suggestive, provide some guidance for formulating and em- pirically testing some interesting research hypotheses. For example, the trade-off between the sample size of the focus groups employed and the experience level of the lead R&D employee raises an intriguing empirical question about the extent to which the voice of the customer can be substituted by an experienced project team.
Finally, our preliminary findings suggest that differential attention should be given to alternate predictor variables (e.g., uniqueness, definitely will buy) at different stages of the NPD process. We can argue that scoring too high or too low on a uniqueness scale may be detrimental to the actual performance of the new product. This suggests another in- teresting research avenue: defining the "optimal" level of uniqueness and the stage (e.g., concept, prototype) at which it should be considered as the most critical to the NPD team.
Conditions for Applicability The PS2 system was developed with a particular domain
in mind. The new product concepts of interest here are not revolutionary in nature, so that histories of NPD projects can be used effectively to forecast sales of the new product. This assumption does not hold if a particular new product is truly new and revolutionary. Thus, our system will work well for line extension projects that frequently occur in packaged food companies. Our approach is restricted by the data set needed to derive the empirical relationships. Many firms may not collect the needed data to implement such a system; however, we believe that the benefits of a systematic and disciplined approach to NPD will outweigh the costs of such data collection. Last, the approach requires brand managers
126
This content downloaded from 128.91.110.146 on Mon, 15 Apr 2013 10:19:14 AMAll use subject to JSTOR Terms and Conditions
Line Extensions
to provide estimates for the size of the product category, its growth rate, and the evolution of competitive product per- formance over time. These estimates may be subjective, but their inclusion forces managers to consider relevant strategic factors.
We believe that our PS2 system can have a wider applica- bility. The system can easily be customized to suit other packaged goods companies. Our system will also be valu- able to other industries that have the following characteris- tics:
*Objective product performance measures are difficult to ob- tain. The NPD process, therefore, is a process of continuously testing the extent to which consumers' wants and needs are met.
*The major investment in NPD occurs at the launch of the new product (i.e., advertising and promotion) so that new product concepts can still be killed after the prototype stage. This will increase the value of the sales forecasting equations. The po- tential impact of the system will be smaller if the cost of devel- opment prior to launch is a substantial part of the total cost of the new product. Line extension represents a substantial portion of the new prod- uct activities. This will increase the predictive value of the em- pirical relationships derived from the existing products.
APPENDIX
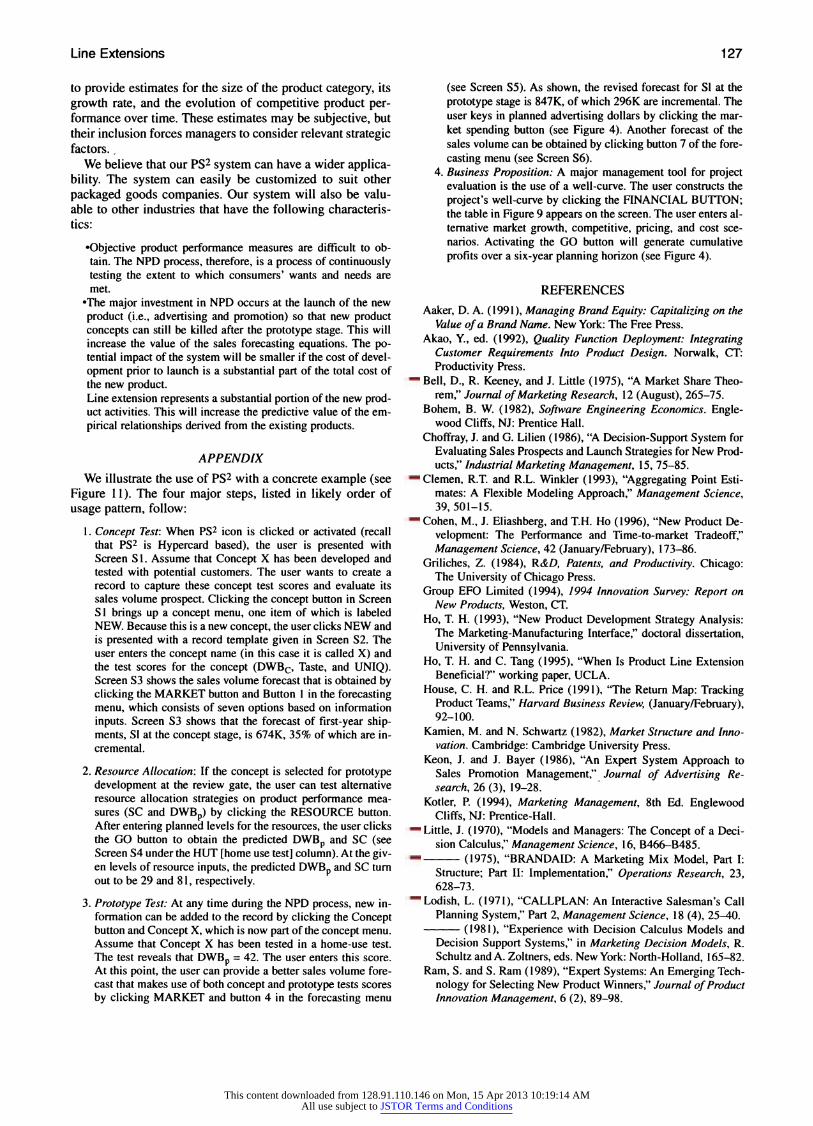
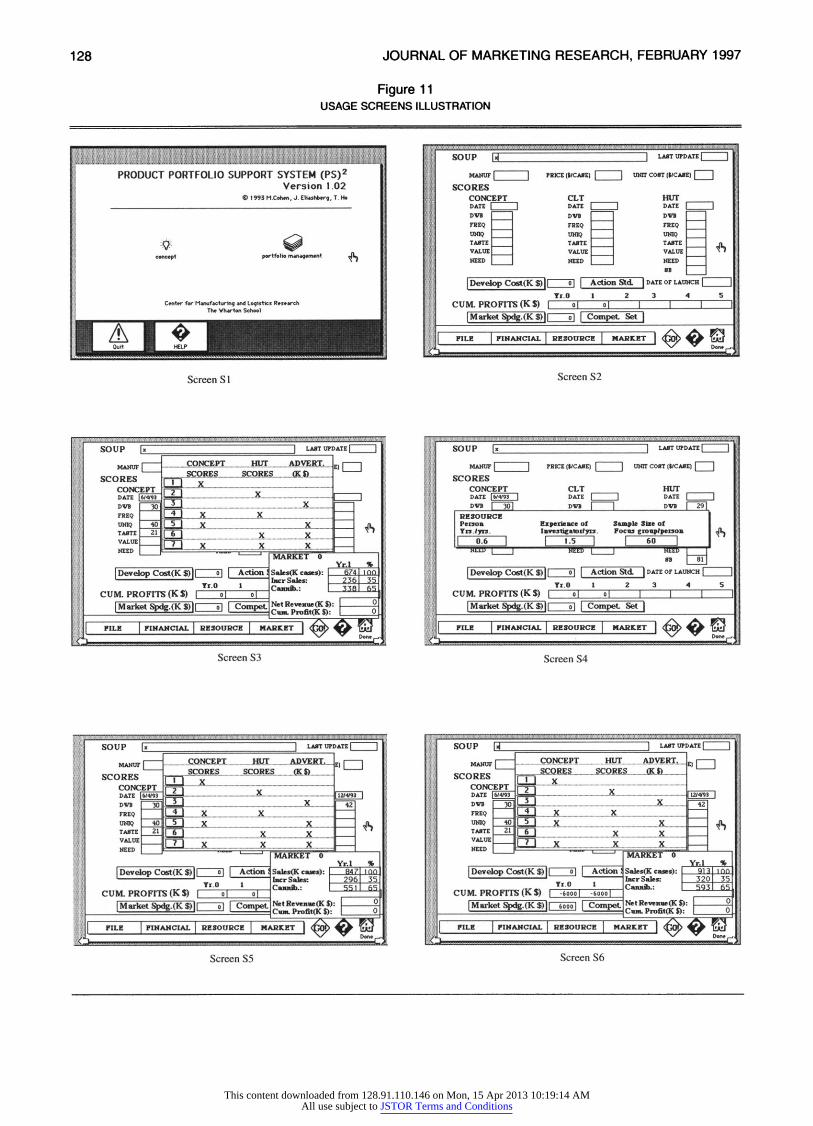
We illustrate the use of PS2 with a concrete example (see Figure 11). The four major steps, listed in likely order of usage pattern, follow:
1. Concept Test: When PS2 icon is clicked or activated (recall that PS2 is Hypercard based), the user is presented with Screen S 1. Assume that Concept X has been developed and tested with potential customers. The user wants to create a record to capture these concept test scores and evaluate its sales volume prospect. Clicking the concept button in Screen S I brings up a concept menu, one item of which is labeled NEW. Because this is a new concept, the user clicks NEW and is presented with a record template given in Screen S2. The user enters the concept name (in this case it is called X) and the test scores for the concept (DWBC, Taste, and UNIQ). Screen S3 shows the sales volume forecast that is obtained by clicking the MARKET button and Button 1 in the forecasting menu, which consists of seven options based on information inputs. Screen S3 shows that the forecast of first-year ship- ments, Sl at the concept stage, is 674K, 35% of which are in- cremental.
2. Resource Allocation: If the concept is selected for prototype development at the review gate, the user can test alternative resource allocation strategies on product performance mea- sures (SC and DWBp) by clicking the RESOURCE button. After entering planned levels for the resources, the user clicks the GO button to obtain the predicted DWBp and SC (see Screen S4 under the HUT [home use test] column). At the giv- en levels of resource inputs, the predicted DWBp and SC turn out to be 29 and 81, respectively.
3. Prototype Test: At any time during the NPD process, new in- formation can be added to the record by clicking the Concept button and Concept X, which is now part of the concept menu. Assume that Concept X has been tested in a home-use test. The test reveals that DWBp = 42. The user enters this score. At this point, the user can provide a better sales volume fore- cast that makes use of both concept and prototype tests scores by clicking MARKET and button 4 in the forecasting menu
(see Screen S5). As shown, the revised forecast for SI at the prototype stage is 847K, of which 296K are incremental. The user keys in planned advertising dollars by clicking the mar- ket spending button (see Figure 4). Another forecast of the sales volume can be obtained by clicking button 7 of the fore- casting menu (see Screen S6).
4. Business Proposition: A major management tool for project evaluation is the use of a well-curve. The user constructs the project's well-curve by clicking the FINANCIAL BUTTON; the table in Figure 9 appears on the screen. The user enters al- ternative market growth, competitive, pricing, and cost sce- narios. Activating the GO button will generate cumulative profits over a six-year planning horizon (see Figure 4).
REFERENCES
Aaker, D. A. (1991), Managing Brand Equity: Capitalizing on the Value of a Brand Name. New York: The Free Press.
Akao, Y., ed. (1992), Quality Function Deployment: Integrating Customer Requirements Into Product Design. Norwalk, CT: Productivity Press.
Bell, D., R. Keeney, and J. Little (1975), "A Market Share Theo- rem," Journal of Marketing Research, 12 (August), 265-75.
Bohem, B. W. (1982), Software Engineering Economics. Engle- wood Cliffs, NJ: Prentice Hall.
Choffray, J. and G. Lilien (1986), "A Decision-Support System for Evaluating Sales Prospects and Launch Strategies for New Prod- ucts," Industrial Marketing Management, 15, 75-85.
Clemen, R.T. and R.L. Winkler (1993), "Aggregating Point Esti- mates: A Flexible Modeling Approach," Management Science, 39, 501-15.
Cohen, M., J. Eliashberg, and T.H. Ho (1996), "New Product De- velopment: The Performance and Time-to-market Tradeoff," Management Science, 42 (January/February), 173-86.
Griliches, Z. (1984), R&D, Patents, and Productivity. Chicago: The University of Chicago Press.
Group EFO Limited (1994), 1994 Innovation Survey: Report on New Products, Weston, CT.
Ho, T. H. (1993), "New Product Development Strategy Analysis: The Marketing-Manufacturing Interface," doctoral dissertation, University of Pennsylvania.
Ho, T. H. and C. Tang (1995), "When Is Product Line Extension Beneficial?" working paper, UCLA.
House, C. H. and R.L. Price (1991), "The Return Map: Tracking Product Teams,"' Harvard Business Review, (January/February), 92-100.
Kamien, M. and N. Schwartz (1982), Market Structure and Inno- vation. Cambridge: Cambridge University Press.
Keon, J. and J. Bayer (1986), "An Expert System Approach to Sales Promotion Management," Journal of Advertising Re- search, 26 (3), 19-28.
Kotler, P. (1994), Marketing Management, 8th Ed. Englewood Cliffs, NJ: Prentice-Hall.
Little, J. (1970), "Models and Managers: The Concept of a Deci- sion Calculus," Management Science, 16, B466-B485.
(1975), "BRANDAID: A Marketing Mix Model, Part I: Structure; Part II: Implementation," Operations Research, 23, 628-73.
Lodish, L. (1971), "CALLPLAN: An Interactive Salesman's Call Planning System," Part 2, Management Science, 18 (4), 25-40.
(1981), "Experience with Decision Calculus Models and Decision Support Systems;'," in Marketing Decision Models, R. Schultz and A. Zoltners, eds. New York: North-Holland, 165-82.
Ram, S. and S. Ram (1989), "Expert Systems: An Emerging Tech- nology for Selecting New Product Winners," Journal of Product Innovation Management, 6 (2), 89-98.
127
This content downloaded from 128.91.110.146 on Mon, 15 Apr 2013 10:19:14 AMAll use subject to JSTOR Terms and Conditions
JOURNAL OF MARKETING RESEARCH, FEBRUARY 1997
Figure 11 USAGE SCREENS ILLUSTRATION
PRODUCT PORTFOLIO SUPPORT SYSTEM (PS)2 Version 1.02
? 1993 M.Cohen, J. Eliashberg, T. Ho
concept portfolio mnaomnt portfolio managenent
Center for Manufacturing and Logistics Research The Vharton School
Screen S 1I
SOUP | LASTUPDATE [ |
MAMUF | | PRICE ($CASE) L Uot COST (CApE) [ SCORES
CONCEPT CLT mHUT DATE DATE DATE AE DVB ~__ DVB DVI
FREQ -
FREQ ____ FEQ ___
| UNE UONQ UNIQ _ TAETE ____ TASTE ____ TATE i I VALUE ____ VALUE ____ VALUE MEED ____ HEED N____ EED
|Develop Co(K $)I Action Std. DATE OF LAUNLH| Z
i v,.oTr. 1 2 3 4 5 CUM.L PROFITS (K$) I ol o I I I
Market SpfI.(K$)I | CompeL Set I
IFILE |FINANCIAL RESOURCE j MARKET | O
........... .. ... , .. ........
Screen S2
SOUP Ix I LA!T UPDATE |
I MA. , --- CONCEPT HUT ADVERT. ,,[,
SCORES SORES SCOR {KS . CONCEPT F'T-"--.- DATE 649 '.-x
DVB 30 . X
FREQ ! 4 x x I UNK _40 x x -
| TAOTE _21.- '
_ T Tx ...........x J VALUE __
- - Y __ i I--~~~~~I 'EED ' ' MARKET 0
Yr.l % Develop Cost(K $)1 1I Actionm Sales(K cases): 674 100
I 1 ' ---- ' IncrSalles 236 35
[ lr.O I _m._.0 YE0 1 CarnaL: 338 65 CUM. PROFITS (K $) I o01 ol
} I arkt .,,,~ ; m~, ,, I Com,.,,t NetRevene(K 0:Io Market Spdg.(K$)I|Z3 CompeL FILE FINANCIAL . MA Profit(K s)
I FILE | FINiANCIAL |RESOURCE |MARKE-T| W>^ 3 .,L1\ V r
Dene,~,
Screen S3
SOUP Ix
MAHUFL
SCORES CONCEPT DATE U413 DVB 30 FREQ UMH) 40 TASTE 21 VALUE HEED
I LAST UP DATE I I
"1-E= -.-..--CONCEPT HUT AV IT_. SCORES SCORES (i$)
r112/14193 I I
4 x x 4 XX X
r 6 x x !--7 x x P- - x M A R... E T..
I--' - .... '-' MARKET 0 I}____~~~~ ~~Yr.l %
Develop Cost(K $)IL 1 | Action Sales(K cases): 847 100 :.:v~ 'n~ bu~Ihcr Sabes: 296 35
} ~ ~~~~~~Yr. 0 I? Yr.O ~ CaumaL: 551 65 CUM. PROFITS (KS)
I o l
" .
Market Spdg.(K $)-lZo I CompeL NetRe(K): FILE ...FI...CI - jRESOURCEC ProfitK :
ILE FINANCIAL RESOURCE MARKET ,-'V~~~~~~~~~~~~~~ Done,-
SOUP HI LArT tDATEII
4MAHMtF ....CONCEPT HUT...AVERT. ET El--I
SCORES .Q.(.S SCORES (... CONCEPT , DATE h16493 2..L 1214 , t
DVB 30 2 FREQ x X---
UHQ zIFr- x x ..... TASTE 21 6-X X--- VALUE X X X NEED .
Yr.l % Develop Cost(K $) 1 Action I Sales(K cases): 913 1
I ~~' lnT 1 ~IncrSales: I 320 35 Tr.0 I C ~ . 1
CamaRob.: I 593 65 CUM. PROFITS (K S) I -600 -6000 .
Market Spdgt.(K $)I 6ooo CompeL etRe ): S Cure. Pr-ofit(K S):
IFILE FINANCIAL RESOURCE MARKET > , S .~ ^~~~~~~~v Dorner.
- .. ., . . ..... . . ... ......Screen S6....... . ... . Screen S6
128
Screen S4
.:-:......:.::, .::: ? ' :: :, ."''v'' = : .....
..: I:- : .':: :-::....... ...............'...::: :::: : ::.~ :14- : " -.: ;., :: ~: :: :: 4: .:. ~ : ,.
- :-~ , : : , :: %I
I-' - JI
..... 1- .......r - ---- ?-
.< -
I- - -- - - - - .^ J .........I...U ...U .^ .I.I.UJ.I.I.U. ..... .. - 1.... ..I ....... I I. ...I. I I. I. ...I. ......l . .1 . 1 .. .11.1 . I
!??
N*^
V
Screen S5
This content downloaded from 128.91.110.146 on Mon, 15 Apr 2013 10:19:14 AMAll use subject to JSTOR Terms and Conditions

Line Extensions
Rangaswamy, A., R. Burke, Y. Wind, and J. Eliashberg (1987), "'Expert Systems for Marketing" Report No. 87-107. Cam- bridge, MA: Marketing Science Institute.
Schmitz, J., G. Armstrong, and J. Little (1990), "Cover Story: Au- tomated News Finding in Marketing," in DSS Transactions, Lin- da Bolino, ed. Providence, RI: TIMS College on Information Systems.
Tauber, E. (1975), "Predictive Validity in Consumer Research," Journal of Advertising Research, (October), 59-64.
(1981), "Utilization of Concept Testing for New-Product Forecasting: Traditional Versus Multiattribute Approaches," in
New Product Forecasting, Y. Wind, V. Mahajan, and R. Cardozo, eds. Lexington, MA: D. C. Heath and Company.
Varian, H. (1984), Microeconomic Analysis, 2d ed. New York: W. W. Norton & Company.
Wheelwright, S. and S. Makridakis (1980), Forecasting Methods for Management. New York: John Wiley & Sons.
Wind, Y. (1982), Product Policy: Concepts, Methods, and Strategy. Reading, MA: Addison Wesley.
, V. Mahajan, and R. Cardozo, eds. (1981), New-Product Forecasting. Lexington, MA: D.C. Heath and Company.
AMA's recent books will keep you current.
Dictionary of Marketing Terms OAMA Marketing Encyclopedia Issues and Trends
Peter D. Bennett, editor Spin the Fure Pennsylvania State University
Lfmm . . n. Jeffrey Heilbrunn, editor T his completely revised and
expanded edition is an essential reference for business
professionals and students alike. Fully , - H. cross-referenced for ease of use, this comprehensive resource lists more than 2500 up-to-date definitions of today's most important marketing terms. Covering both the day-to-day terminology and the specialized vocabulary in corporate and academic use, the Dictionary helps everyone from newcomers to senior-level marketing executives gain a more thorough understanding of critical marketing concepts.
$32.95 AMA Members/$39.95 Nonmembers 1995.
W ith an emphasis on recent and emerging issues, a panel of leading marketing
experts surveys the key areas of marketing, identifies current trends, and provides realistic prescriptions for the future. Contributors include industry leaders and top- name academics, as well as pioneers and inventors of key marketing strategies and techniques: Tony Alessandra, John Hauser, Philip Crosby, Philip Kotler, Jack Trout, Al Ries, Don E. Schultz, Jagdish Sheth, and many others. The past, present, and future of marketing is shaped in this renowned book.
$42 AMA Member/$47.95 Nonmembers 1995.
129
CALL TOLL-FREE 1-800-AMA- 1 150 TO PLACE YOUR ORDER. HAVE YOUR CREDIT CARD AND AMA MEMBERSHIP NUMBER HANDY. REFER TO JR297 WHEN YOU CALL.
AM E R I C A N MI ARKETING ASSOCIATION 250 S. Wacker Drive, Suite 200, Chicago, IL 60606-5819
.................. Ill l I I I I l I I II I I III I I I I I IIIIIIIIIIIIlll IIII
a I will I
Sol -U-011IN - - --------
This content downloaded from 128.91.110.146 on Mon, 15 Apr 2013 10:19:14 AMAll use subject to JSTOR Terms and Conditions