Embed Size (px)
Citation preview
ASIAN DEVELOPMENT BANK
AN ASSESSMENT OF FINANCIAL SECTOR DEVELOPMENT IN BHUTANRebel A. Cole and Sarah Carrington
ADB SOUTH ASIA WORKING PAPER SERIES
NO. 44
August 2016
ADB South Asia Working Paper Series
An Assessment of Financial Sector Development in Bhutan
Rebel A. Cole and Sarah Carrington
No. 44 August
Rebel Cole is professor, Department of Finance, DePaul University. Sarah Carrington is former Economist, Asian Development Bank.
ASIAN DEVELOPMENT BANK
Asian Development Bank 6 ADB Avenue, Mandaluyong City 1550 Metro Manila, Philippines www.adb.org © 2016 by Asian Development Bank
2016 ISSN 2313-5867 (Print), 2313-5875 (e-ISBN) Publication Stock No. WPS168000-2
Unless otherwise noted, “$” refers to US dollars. The ADB South Asia Working Paper Series is a forum for ongoing and recently completed research and policy studies undertaken in ADB or on its behalf. It is meant to enhance greater understanding of current important economic and development issues in South Asia, promote policy dialogue among stakeholders, and facilitate reforms and development management. The ADB South Asia Working Paper Series is a quick-disseminating, informal publication whose titles could subsequently be revised for publication as articles in professional journals or chapters in books. The series is maintained by the South Asia Department. The series will be made available on the ADB website and on hard copy.
The views expressed in this publication are those of the authors and do not necessarily reflect the views and policies of the Asian Development Bank (ADB) or its Board of Governors or the governments they represent.
ADB does not guarantee the accuracy of the data included in this publication and accepts no responsibility for any consequence of their use. The mention of specific companies or products of manufacturers does not imply that they are endorsed or recommended by ADB in preference to others of a similar nature that are not mentioned.
By making any designation of or reference to a particular territory or geographic area, or by using the term “country” in this document, ADB does not intend to make any judgments as to the legal or other status of any territory or area.
This work is available under the Creative Commons Attribution 3.0 IGO license (CC BY 3.0 IGO) https://creativecommons.org/licenses/by/3.0/igo/. By using the content of this publication, you agree to be bound by the terms of this license.
This CC license does not apply to non-ADB copyright materials in this publication. If the material is attributed to another source, please contact the copyright owner or publisher of that source for permission to reproduce it. ADB cannot be held liable for any claims that arise as a result of your use of the material.
CONTENTS TABLES AND FIGURES .............................................................................................................................................. iv ABSTRACT ........................................................................................................................................................................ v ABBREVIATIONS ......................................................................................................................................................... vi 1. INTRODUCTION .................................................................................................................................................. 1 2. OVERVIEW OF THE FINANCIAL SYSTEM .............................................................................................. 4 2.1 Recent Major Developments in the Financial Sector ................................................................... 5 2.2 Review of the Health of the Financial Sector .................................................................................. 8 3. KEY ISSUES FACING THE FINANCIAL SECTOR ................................................................................ 13 3.1 Excessive Concentration Risk.............................................................................................................. 13 3.2 Excessive Credit Growth ....................................................................................................................... 14 3.3 Deteriorating Asset Quality ................................................................................................................. 15 3.4 Market Risks Foreign Exchange and Interest Rates .................................................................. 17 3.5 Availability of Credit: Credit Rationing and Collateral ............................................................... 17 3.6 Judicial Efficiency ..................................................................................................................................... 18 3.7 Thinness of the Treasury Bond and Corporate Bond Markets ............................................... 19 3.8 Restrictions on Agriculture ................................................................................................................... 19 4. REVIEW OF REGULATORY ARRANGEMENTS IN BHUTAN ....................................................... 19 4.1 History of Regulatory Arrangements in Bhutan ........................................................................... 19 4.2 Current Regulatory Arrangements in Bhutan ............................................................................... 20 4.3 Stress Testing in Bhutan ........................................................................................................................ 23 5. PROPOSED IMPROVEMENTS TO SUPERVISION OF FINANCIAL INSTITUTIONS ........ 24 5.1 Improvements to Regulation .............................................................................................................. 24 5.2 Improvements to Judicial Efficiency ................................................................................................. 25 5.3 Eliminating Price Fixing in the Credit Markets ............................................................................... 25 5.4. Improving and Expanding Stress Testing ........................................................................................ 25 5.5 Government Payment of Contractors............................................................................................. 26 5.6 System of Early Warning Indicators ................................................................................................. 26 5.7 Thinness of Treasury Bond and Corporate Bond Markets ..................................................... 27 5.8 Restrictions on Agriculture .................................................................................................................. 28 6. CONCLUSION ................................................................................................................................................... 28 APPENDIXES ................................................................................................................................................................ 29 BIBLIOGRAPHY ............................................................................................................................................................ 33
TABLES AND FIGURES
TABLES
1 Bhutan Government Revenues and Expenditures (% of GDP), 2010–2014 ..................................... 2 2 Bhutan Balance of Payments, 2011–2014 ....................................................................................................... 3 3 Bhutan Banks and Nonbanks, 2014 ............................................................................................. .................... 5 4 Financial Stability Indicator for the Financial Sector, 2005–2014 ......................................................... 8 5 Core Financial Soundness Indicators for Bhutan and Neighboring Countries ............................... 11 6 Bank and Nonbank Balance Sheets .............................................................................................................. 12 7 Bank Loan and Deposit Rates, 2005–2012 ................................................................................................... 13 8 Credit Growth by Industry .................................................................................................................................15 9 Nonperforming Loans by Industry (Percent of Total NPLs) ............................................................... 16 10 Nonperforming Loans by Industry (% of Industry Loans) .................................................................... 17
FIGURES
1 Growth in Real GDP: Bhutan vs. Neighboring Countries, 2005–2014 ................................................. 1 2 Growth in Credit and in Real GDP, 2007–2014 ........................................................................................... 4 3 Bhutan Financial Sector Assets and Credit, 2005–2014 .......................................................................... 6 4 Bhutan Financial Sector Capital Adequacy Ratio, 2005–2014 .............................................................. 9 5 Bhutan Financial Sector Asset Quality, 2005–2014 ................................................................................... 9 6 Bhutan Financial Sector Profitability (ROA), 2005–2014 ...................................................................... 10 7 Bhutan Financial Sector Liquidity (Statutory Liquidity Ratio), 2005–2014..................................... 10 8 Sectoral Distribution of Credit, 2014 ..............................................................................................................14 9 Outstanding Credit at Financial Institutions: 2005–2014 .......................................................................15
ABSTRACT
This paper presents the results of an investigation into the performance and stability of Bhutan’s banking system. The study has found that economic growth has fueled a large demand for household credit over recent years, and in turn, banks have responded by substantially increasing their loan portfolios. Private sector credit growth took off from its earlier steady pace in the years preceding 2008, reaching over 40% growth year-on-year in the 2009-10 fiscal year, and has retained a relatively high growth rate even as heavy import restrictions remain in place. Although the largest recipient of credit is the building and construction sector, personal loans now make up more than 18% of credit extended to the private sector. And while non-performing loans have decreased substantially from their peak of close to 40% in the mid-1990s, they are still relatively high, and are decreasing as much due to total private sector credit growth as they are to loan recovery rates. Within this context, this paper discusses policy recommendations to strengthen and improve the banking sector. These policy measures include fostering banking sector competition, improving regulatory practices—on both the monitoring and the enforcement side—and enhancing risk diversification and liquidity management practices.
ABBREVIATIONS
ADB – Asian Development Bank ATM – automated teller machine BDFCL – Bhutan Development Finance Corporation BIL – Bhutan Insurance BNBL – Bhutan National Bank CAR – capital adequacy ratio CCCB – countercyclical capital buffer CIB – Credit Information Bureau FSI – financial indicator GDP – gross domestic product IMF – International Monetary Fund Nu – ngultrum NPL – nonperforming loan NPPF – National Pension and Provident Fund PNB – Punjab National Bank RICBL – Royal Insurance Corporation of Bhutan RMA – Royal Monetary Authority of Bhutan SBI – State Bank of India SCR – sectoral capital requirement SLR – statutory liquidity ratio UTB – Unit Trust of Bhutan
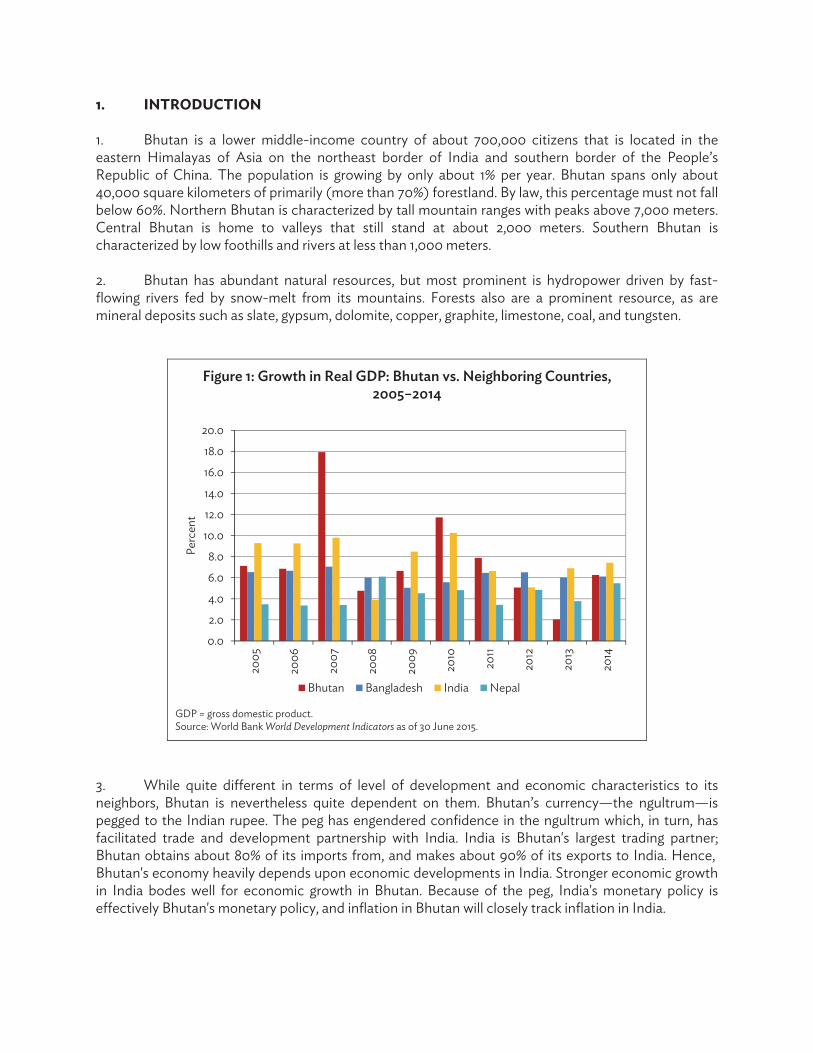
1. INTRODUCTION 1. Bhutan is a lower middle-income country of about 700,000 citizens that is located in the eastern Himalayas of Asia on the northeast border of India and southern border of the People’s Republic of China. The population is growing by only about 1% per year. Bhutan spans only about 40,000 square kilometers of primarily (more than 70%) forestland. By law, this percentage must not fall below 60%. Northern Bhutan is characterized by tall mountain ranges with peaks above 7,000 meters. Central Bhutan is home to valleys that still stand at about 2,000 meters. Southern Bhutan is characterized by low foothills and rivers at less than 1,000 meters. 2. Bhutan has abundant natural resources, but most prominent is hydropower driven by fast-flowing rivers fed by snow-melt from its mountains. Forests also are a prominent resource, as are mineral deposits such as slate, gypsum, dolomite, copper, graphite, limestone, coal, and tungsten.
Figure 1: Growth in Real GDP: Bhutan vs. Neighboring Countries, 2005–2014
GDP = gross domestic product. Source: World Bank World Development Indicators as of 30 June 2015.
3. While quite different in terms of level of development and economic characteristics to its neighbors, Bhutan is nevertheless quite dependent on them. Bhutan’s currency—the ngultrum—is pegged to the Indian rupee. The peg has engendered confidence in the ngultrum which, in turn, has facilitated trade and development partnership with India. India is Bhutan's largest trading partner; Bhutan obtains about 80% of its imports from, and makes about 90% of its exports to India. Hence, Bhutan's economy heavily depends upon economic developments in India. Stronger economic growth in India bodes well for economic growth in Bhutan. Because of the peg, India's monetary policy is effectively Bhutan's monetary policy, and inflation in Bhutan will closely track inflation in India.
0.0
2.0
4.0
6.0
8.0
10.0
12.0
14.0
16.0
18.0
20.0
2005
2006
2007
2008
2009
2010
2011
2012
2013
2014
Perc
ent
Bhutan Bangladesh India Nepal
2 ADB South Asia Working Paper Series No. 44
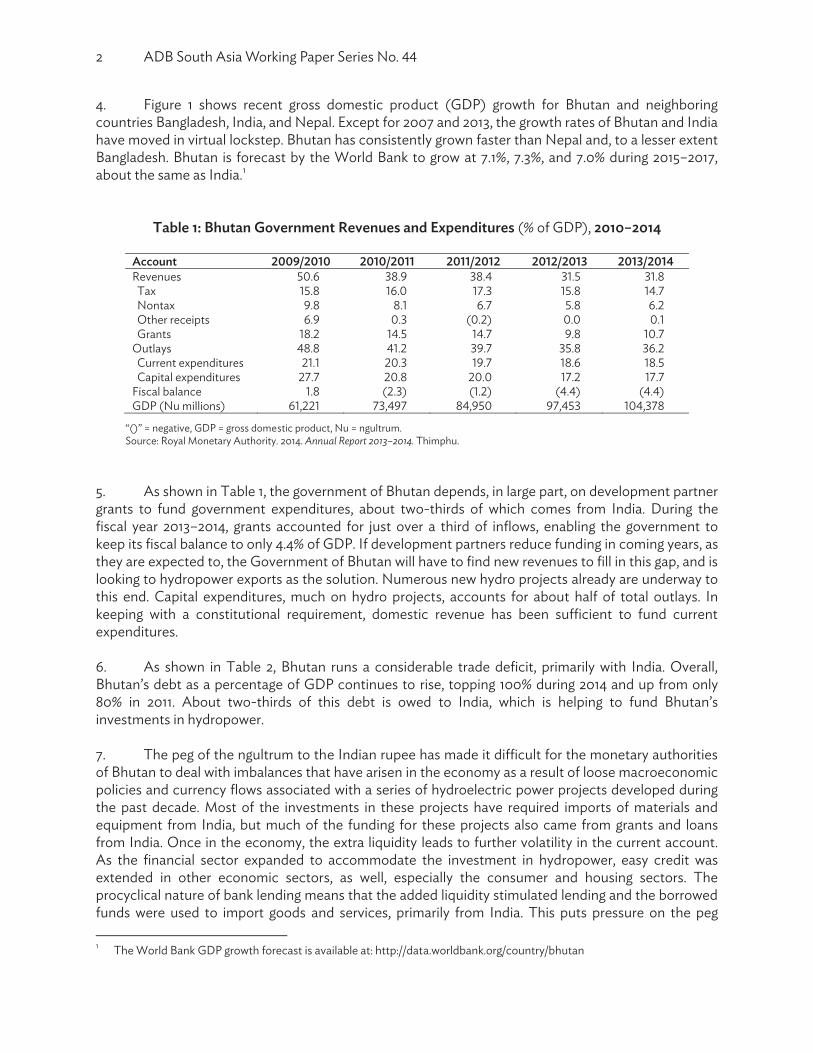
4. Figure 1 shows recent gross domestic product (GDP) growth for Bhutan and neighboring countries Bangladesh, India, and Nepal. Except for 2007 and 2013, the growth rates of Bhutan and India have moved in virtual lockstep. Bhutan has consistently grown faster than Nepal and, to a lesser extent Bangladesh. Bhutan is forecast by the World Bank to grow at 7.1%, 7.3%, and 7.0% during 2015–2017, about the same as India.1
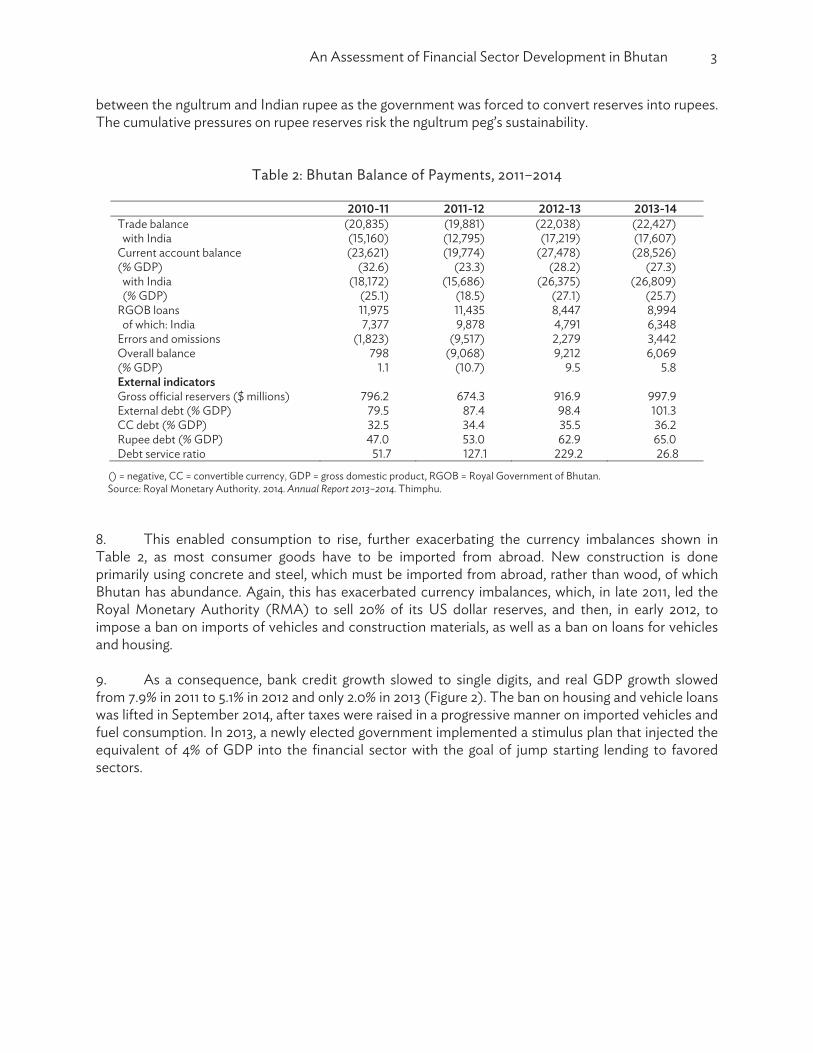
Table 1: Bhutan Government Revenues and Expenditures (% of GDP), 2010–2014
/ / / / /
Tax Nontax Other receipts Grants
Fiscal balance GDP (Nu millions)
“()” = negative, GDP = gross domestic product, Nu = ngultrum. Source: Royal Monetary Authority. 2014. Annual Report 2013–2014. Thimphu.
5. As shown in Table 1, the government of Bhutan depends, in large part, on development partner grants to fund government expenditures, about two-thirds of which comes from India. During the fiscal year 2013–2014, grants accounted for just over a third of inflows, enabling the government to keep its fiscal balance to only 4.4% of GDP. If development partners reduce funding in coming years, as they are expected to, the Government of Bhutan will have to find new revenues to fill in this gap, and is looking to hydropower exports as the solution. Numerous new hydro projects already are underway to this end. Capital expenditures, much on hydro projects, accounts for about half of total outlays. In keeping with a constitutional requirement, domestic revenue has been sufficient to fund current expenditures. 6. As shown in Table 2, Bhutan runs a considerable trade deficit, primarily with India. Overall, Bhutan’s debt as a percentage of GDP continues to rise, topping 100% during 2014 and up from only 80% in 2011. About two-thirds of this debt is owed to India, which is helping to fund Bhutan’s investments in hydropower. 7. The peg of the ngultrum to the Indian rupee has made it difficult for the monetary authorities of Bhutan to deal with imbalances that have arisen in the economy as a result of loose macroeconomic policies and currency flows associated with a series of hydroelectric power projects developed during the past decade. Most of the investments in these projects have required imports of materials and equipment from India, but much of the funding for these projects also came from grants and loans from India. Once in the economy, the extra liquidity leads to further volatility in the current account. As the financial sector expanded to accommodate the investment in hydropower, easy credit was extended in other economic sectors, as well, especially the consumer and housing sectors. The procyclical nature of bank lending means that the added liquidity stimulated lending and the borrowed funds were used to import goods and services, primarily from India. This puts pressure on the peg 1 The World Bank GDP growth forecast is available at: http://data.worldbank.org/country/bhutan
An Assessment of Financial Sector Development in Bhutan 3
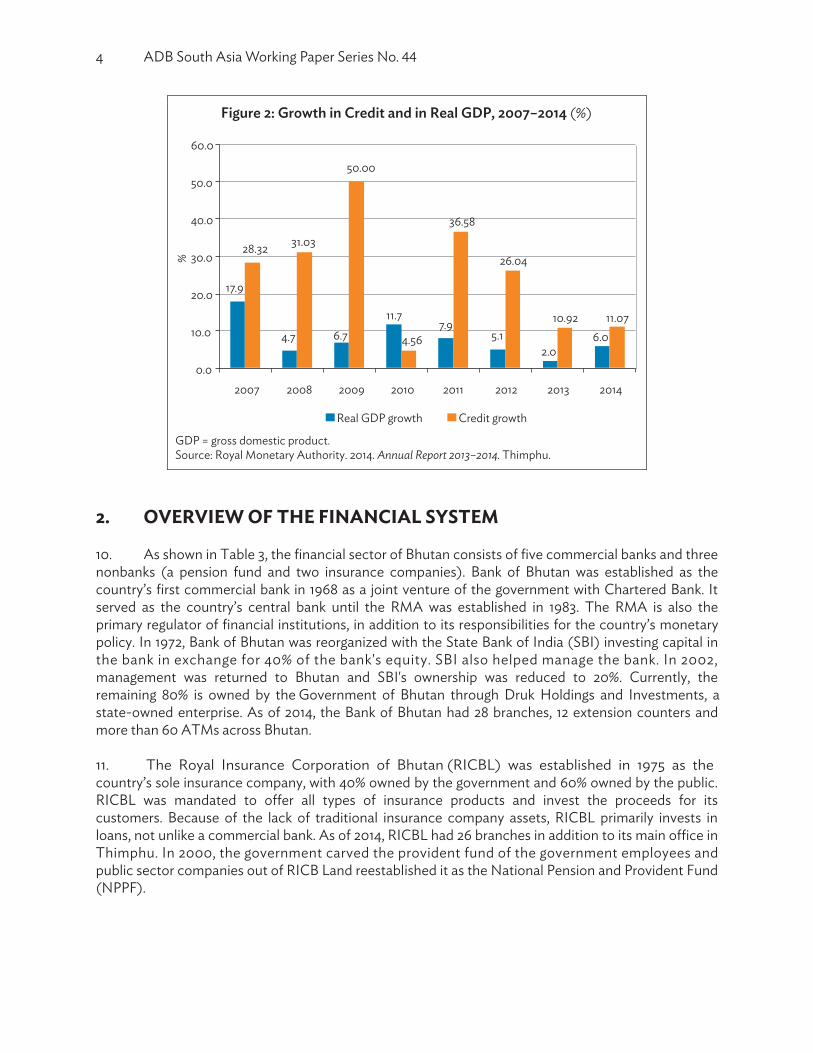
between the ngultrum and Indian rupee as the government was forced to convert reserves into rupees. The cumulative pressures on rupee reserves risk the ngultrum peg’s sustainability.
Table 2: Bhutan Balance of Payments, 2011–2014
2010-11 2011-12 2012-13 2013-14Trade balance (20,835) (19,881) (22,038) (22,427) with India (15,160) (12,795) (17,219) (17,607)Current account balance (23,621) (19,774) (27,478) (28,526)(% GDP) (32.6) (23.3) (28.2) (27.3) with India (18,172) (15,686) (26,375) (26,809) (% GDP) (25.1) (18.5) (27.1) (25.7)RGOB loans 11,975 11,435 8,447 8,994 of which: India 7,377 9,878 4,791 6,348Errors and omissions (1,823) (9,517) 2,279 3,442Overall balance 798 (9,068) 9,212 6,069(% GDP) 1.1 (10.7) 9.5 5.8External indicators Gross official reservers ($ millions) 796.2 674.3 916.9 997.9External debt (% GDP) 79.5 87.4 98.4 101.3CC debt (% GDP) 32.5 34.4 35.5 36.2Rupee debt (% GDP) 47.0 53.0 62.9 65.0Debt service ratio 51.7 127.1 229.2 26.8
() = negative, CC = convertible currency, GDP = gross domestic product, RGOB = Royal Government of Bhutan. Source: Royal Monetary Authority. 2014. Annual Report 2013–2014. Thimphu.
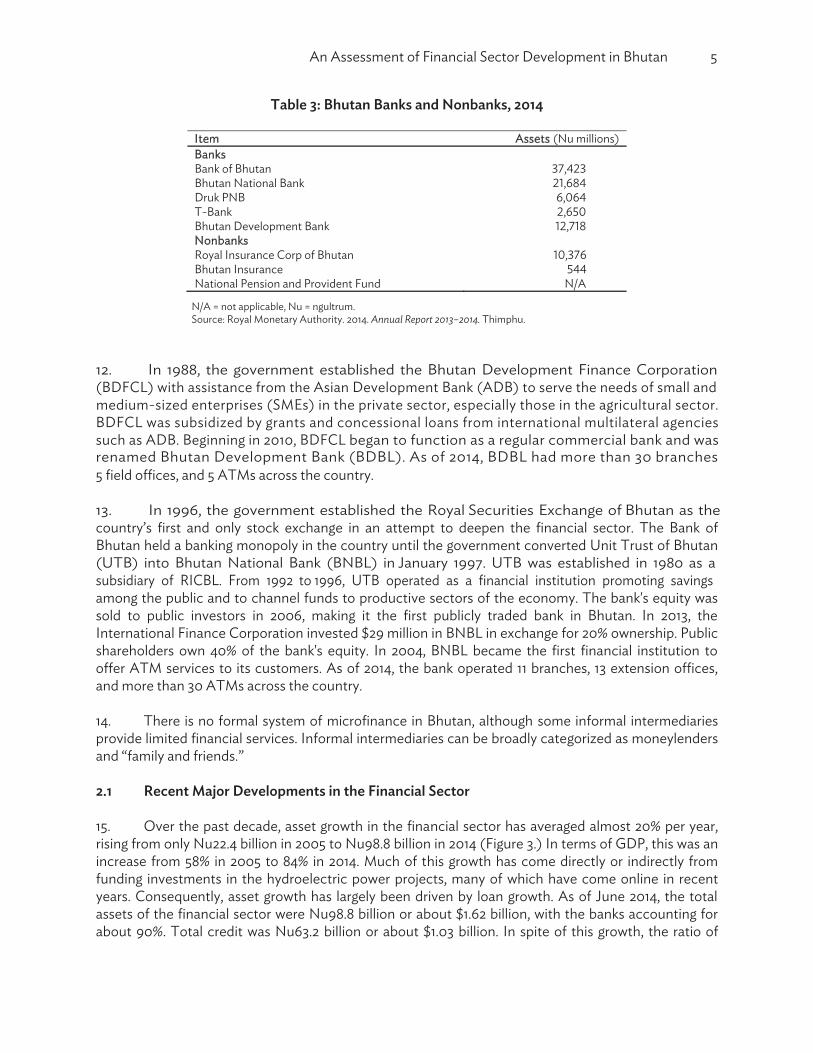
8. This enabled consumption to rise, further exacerbating the currency imbalances shown in Table 2, as most consumer goods have to be imported from abroad. New construction is done primarily using concrete and steel, which must be imported from abroad, rather than wood, of which Bhutan has abundance. Again, this has exacerbated currency imbalances, which, in late 2011, led the Royal Monetary Authority (RMA) to sell 20% of its US dollar reserves, and then, in early 2012, to impose a ban on imports of vehicles and construction materials, as well as a ban on loans for vehicles and housing. 9. As a consequence, bank credit growth slowed to single digits, and real GDP growth slowed from 7.9% in 2011 to 5.1% in 2012 and only 2.0% in 2013 (Figure 2). The ban on housing and vehicle loans was lifted in September 2014, after taxes were raised in a progressive manner on imported vehicles and fuel consumption. In 2013, a newly elected government implemented a stimulus plan that injected the equivalent of 4% of GDP into the financial sector with the goal of jump starting lending to favored sectors.
4 ADB South Asia Working Paper Series No. 44
Figure 2: Growth in Credit and in Real GDP, 2007–2014 (%)
GDP = gross domestic product. Source: Royal Monetary Authority. 2014. Annual Report 2013–2014. Thimphu.
2. OVERVIEW OF THE FINANCIAL SYSTEM 10. As shown in Table 3, the financial sector of Bhutan consists of five commercial banks and three nonbanks (a pension fund and two insurance companies). Bank of Bhutan was established as the country’s first commercial bank in 1968 as a joint venture of the government with Chartered Bank. It served as the country’s central bank until the RMA was established in 1983. The RMA is also the primary regulator of financial institutions, in addition to its responsibilities for the country’s monetary policy. In 1972, Bank of Bhutan was reorganized with the State Bank of India (SBI) investing capital in the bank in exchange for 40% of the bank's equity. SBI also helped manage the bank. In 2002, management was returned to Bhutan and SBI's ownership was reduced to 20%. Currently, the remaining 80% is owned by the Government of Bhutan through Druk Holdings and Investments, a state-owned enterprise. As of 2014, the Bank of Bhutan had 28 branches, 12 extension counters and more than 60 ATMs across Bhutan. 11. The Royal Insurance Corporation of Bhutan (RICBL) was established in 1975 as the country’s sole insurance company, with 40% owned by the government and 60% owned by the public.
customers. Because of the lack of traditional insurance company assets, RICBL primarily invests in loans, not unlike a commercial bank. AsThimphu. In 2000, the government carved the provident fund of the government employees and public sector companies out of RICB Land reestablished it as the National Pension and Provident Fund (NPPF).
17.9
4.7 6.711.7
7.95.1
2.06.0
28.32 31.03
50.00
4.56
36.58
26.04
10.92 11.07
0.0
10.0
20.0
30.0
40.0
50.0
60.0
2007 2008 2009 2010 2011 2012 2013 2014
%
Real GDP growth Credit growth
An Assessment of Financial Sector Development in Bhutan 5
Table 3: Bhutan Banks and Nonbanks, 2014
Item Assets (Nu millions) Banks Bank of Bhutan Bhutan National Bank Druk PNB
Bhutan Development BankNonbanks Royal Insurance Corp of Bhutan Bhutan Insurance National Pension and Provident Fund N/A
N/A = not applicable, Nu = ngultrum. Source: Royal Monetary Authority. 2014. Annual Report 2013–2014. Thimphu.
12. In 1988, the government established the Bhutan Development Finance Corporation (BDFCL) with assistance from the Asian Development Bank (ADB) to serve the needs of small and
medium-sized enterprises (SMEs) in the private sector, especially those in the agricultural sector. BDFCL was subsidized by grants and concessional loans from international multilateral agencies such as ADB. Beginning in 2010, BDFCL began to function as a regular commercial bank and was
13. In 1996, the government established the Royal Securities Exchange of Bhutan as the country’s first and only stock exchange in an attempt to deepen the financial sector. The Bank of Bhutan held a banking monopoly in the country until the government converted Unit Trust of Bhutan (UTB) into Bhutan National Bank (BNBL) in January 1997. UTB was established in 1980 as a subsidiary of RICBL. From 1992 to 1996, UTB operated as a financial institution promoting savings among the public and to channel funds to productive sectors of the economy. The bank's equity was sold to public investors in 2006, making it the first publicly traded bank in Bhutan. In 2013, the International Finance Corporation invested $29 million in BNBL in exchange for 20% ownership. Public shareholders own 40% of the bank's equity. In 2004, BNBL became the first financial institution to
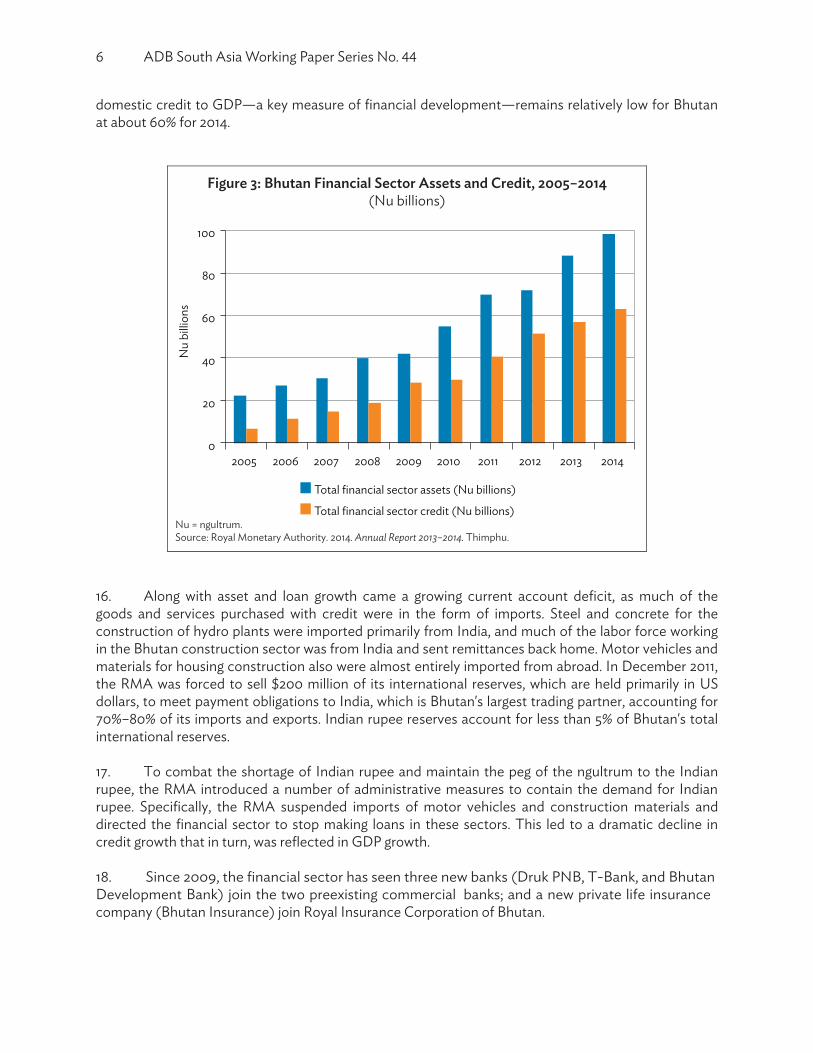
ATM services to itsand more than 30 ATMs across the country. 14. There is no formal system of microfinance in Bhutan, although some informal intermediaries provide limited financial services. Informal intermediaries can be broadly categorized as moneylenders and “family and friends.” 2.1 Recent Major Developments in the Financial Sector 15. Over the past decade, asset growth in the financial sector has averaged almost 20% per year, rising from only Nu22.4 billion in 2005 to Nu98.8 billion in 2014 (Figure 3.) In terms of GDP, this was an increase from 58% in 2005 to 84% in 2014. Much of this growth has come directly or indirectly from funding investments in the hydroelectric power projects, many of which have come online in recent years. Consequently, asset growth has largely been driven by loan growth. As of June 2014, the total assets of the financial sector were Nu98.8 billion or about $1.62 billion, with the banks accounting for about 90%. Total credit was Nu63.2 billion or about $1.03 billion. In spite of this growth, the ratio of
renamed Bhutan Development Bank (BDBL). As of 2014, BDBL had more than 30 branches
6 ADB South Asia Working Paper Series No. 44
domestic credit to GDP—a key measure of financial development—remains relatively low for Bhutan at about 60% for 2014.
Figure 3: Bhutan Financial Sector Assets and Credit, 2005–2014 (Nu billions)
Nu = ngultrum. Source: Royal Monetary Authority. 2014. Annual Report 2013–2014. Thimphu.
16. Along with asset and loan growth came a growing current account deficit, as much of the goods and services purchased with credit were in the form of imports. Steel and concrete for the construction of hydro plants were imported primarily from India, and much of the labor force working in the Bhutan construction sector was from India and sent remittances back home. Motor vehicles and materials for housing construction also were almost entirely imported from abroad. In December 2011, the RMA was forced to sell $200 million of its international reserves, which are held primarily in US dollars, to meet payment obligations to India, which is Bhutan's largest trading partner, accounting for 70%–80% of its imports and exports. Indian rupee reserves account for less than 5% of Bhutan's total international reserves. 17. To combat the shortage of Indian rupee and maintain the peg of the ngultrum to the Indian rupee, the RMA introduced a number of administrative measures to contain the demand for Indian rupee. Specifically, the RMA suspended imports of motor vehicles and construction materials and directed the financial sector to stop making loans in these sectors. This led to a dramatic decline in credit growth that in turn, was reflected in GDP growth. 18. Since 2009, the financial sector has seen three new banks (Druk PNB, T-Bank, and Bhutan Development Bank) join the two preexisting commercial banks; and a new private life insurance company (Bhutan Insurance) join Royal Insurance Corporation of Bhutan.
0
20
40
60
80
100
2005 2006 2007 2008 2009 2010 2011 2012 2013 2014
Nu
billio
ns
Total financial sector assets (Nu billions)
Total financial sector credit (Nu billions)
An Assessment of Financial Sector Development in Bhutan 7
19. Druk PNB Bank (Druk Bank) was chartered in January 2010 by Punjab National Bank India (PNB) and several domestic promoters. PNB owns 51% of the bank, the domestic promoters 19%, and
branches and 14 ATMs across the country. 20. T-Bank was chartered in March 2010 by three domestic promoters who each owned 20%
The bank is listed on the Bhutan stock exchange. As of 2014, T-Bank had four branches and 10 ATMs.
21. Bhutan Insurance (BIL) was chartered in July 2009 to deepen Bhutan's insurance sector. As of 2014, its promoters owned 32% of its shares and public investors owned the remaining 68%. BIL focuses on nonlife insurance products, such as personal, commercial, industrial, and liability insurance products. As of 2014, BIL operates 12 offices across the country. 22. The other nonbank institution is the National Pension and Provident Fund (NPPF), which manages retirement accounts in Bhutan. NPPF was created in March 2000. Before that, public pensions were managed by RICBL and covered only government workers. NPPF also manages pensions for private sector workers. To facilitate investment of pension assets, NPPF was licensed by
loans. NPPF is one of the largest real estate developers in Bhutan. 23. The government allows nonbanks to engage in retail lending because of the lack of alternative assets by which to fund their liabilities. Supply of government bonds, which only began to be issued in 2009, is very limited. 24. The stock exchange—the Royal Securities Exchange of Bhutan—was established in 1993 with four listed firms. As of 2014, 22 firms traded on the Royal Securities Exchange of Bhutan, with a market capitalization of about Nu20 billion—about one-fifth of financial sector assets. The market cap has doubled in just the past 4 years. Shareholders numbered more than 62,000 as of 2014, up about 50% from 2010. 25. In recent years, Bhutan has taken steps to deepen the financial sector by establishing credit and collateral registries. The Credit Information Bureau (CIB) was established within the RMA in 2009 to facilitate monitoring of borrowers to improve access to credit. The Central Registry for Secured Transactions for moveable properties was formally established in July 2014 within the RMA to encourage secured transactions and ease collateral requirements imposed by lenders, thereby improving access to credit. In 2013, CIB was delinked from the RMA and became an independent institution. Since 2013, CIB has been used by all Bhutan financial institutions and covers all loans except for informal microfinance, covering 97% of individuals and 50% of corporate borrowers. These new entities should help lenders to better identify sound credits so that they can expand lending, especially to SMEs. The Ministry of Finance also began to issue Treasury Bills in 2009 for fiscal management and monetary policy. A system for electronic funds transfers and clearing was put into place in June 2010, allowing for electronic transfer of salaries, dividends, and utility payments. In December 2011, the RMA began operation of the Bhutan Financial Switch, a national card switch system for ATMs and point-of-sale terminals. At the same time, the RMA made available to the public the National Electronic Funds Transfer System to facilitate transfers among individuals and institutions. In 2014, the RMA, in consultation with the Ministry of Finance and the Ministry of
8 ADB South Asia Working Paper Series No. 44
Capital Market Master Plan for Bhutan 2014–2024, which seeks to lessen reliance upon commercial banks by providing alternative sources of financial intermediation, including microfinance intermediaries, both depository and nondepository. The RMA also established the Financial Stability Unit in 2014 to monitor and assess risks arising from deepening the financial system.
Table 4: Financial Stability Indicator for the Financial Sector, 2005–2014
Bank CAR Nonbank CAR
Bank NPL ratio Nonbank NPL ratio
Bank ROA Nonbank ROA
Bank assets Nonbank assets Total financial sector credit (Nu billions) Bank credit Nonbank credit
( ) = negative, - = not available, b.p. = basis points, CAR = capital adequacy ratio, NPL = nonperforming loan, Nu = ngultrum, SLR = statutory
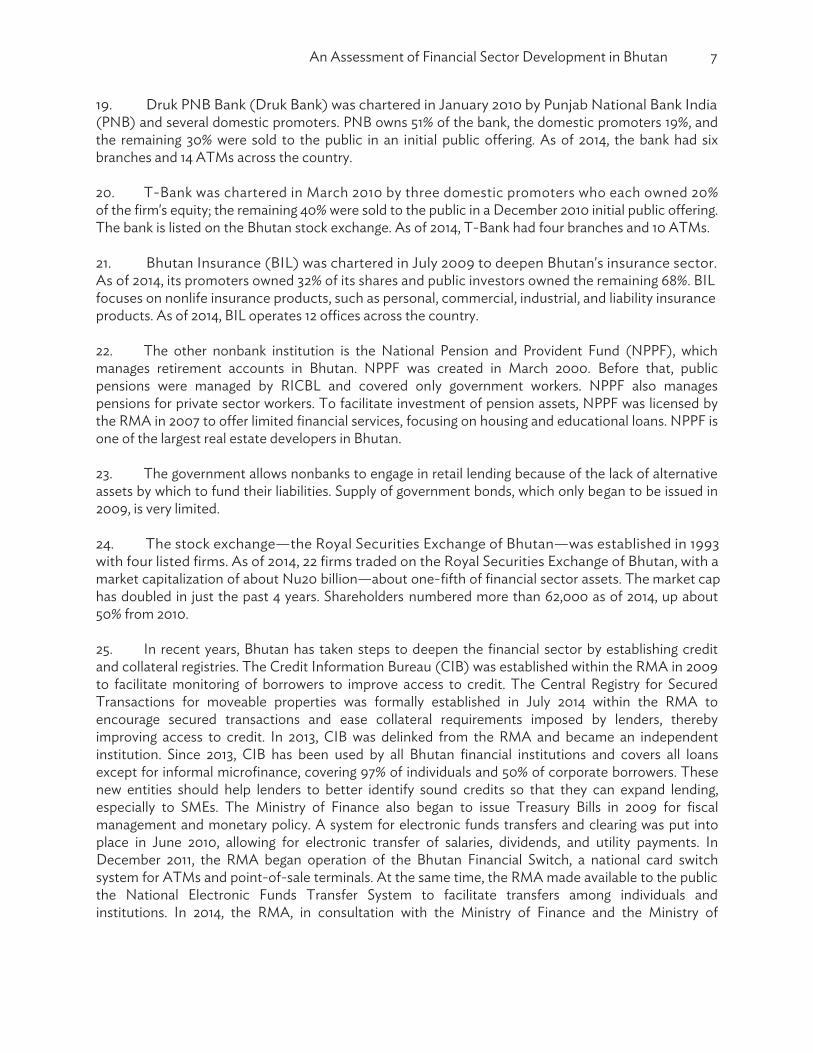
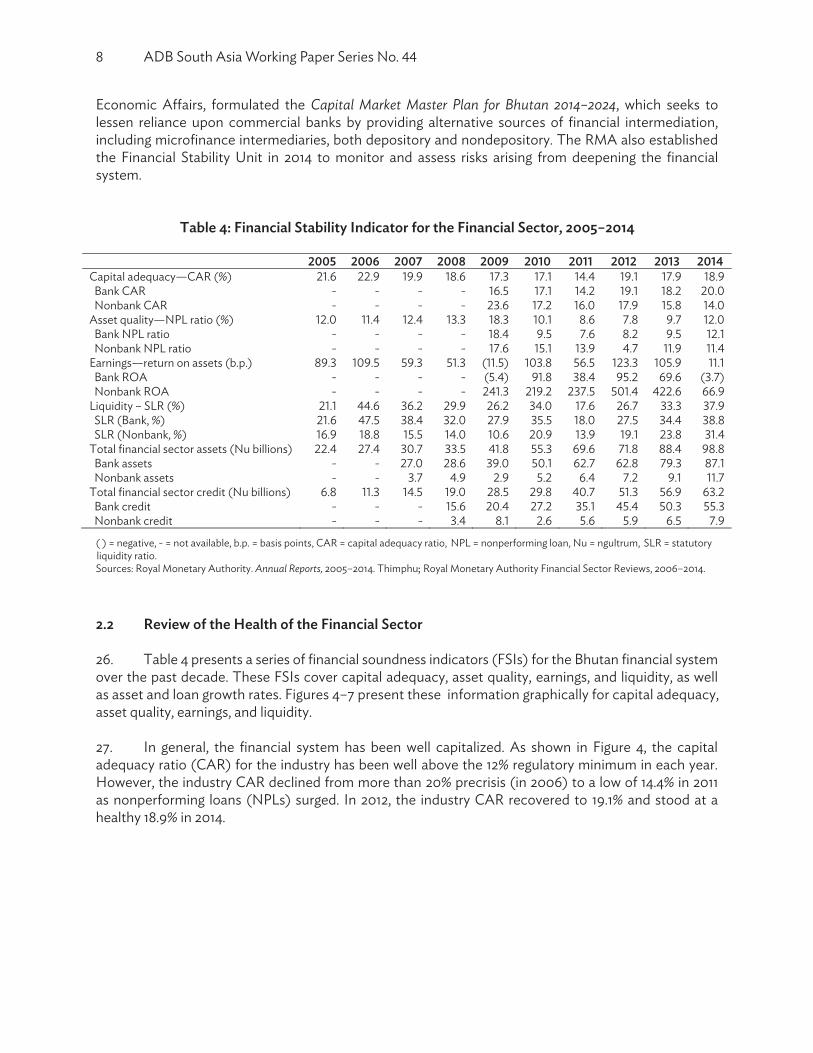
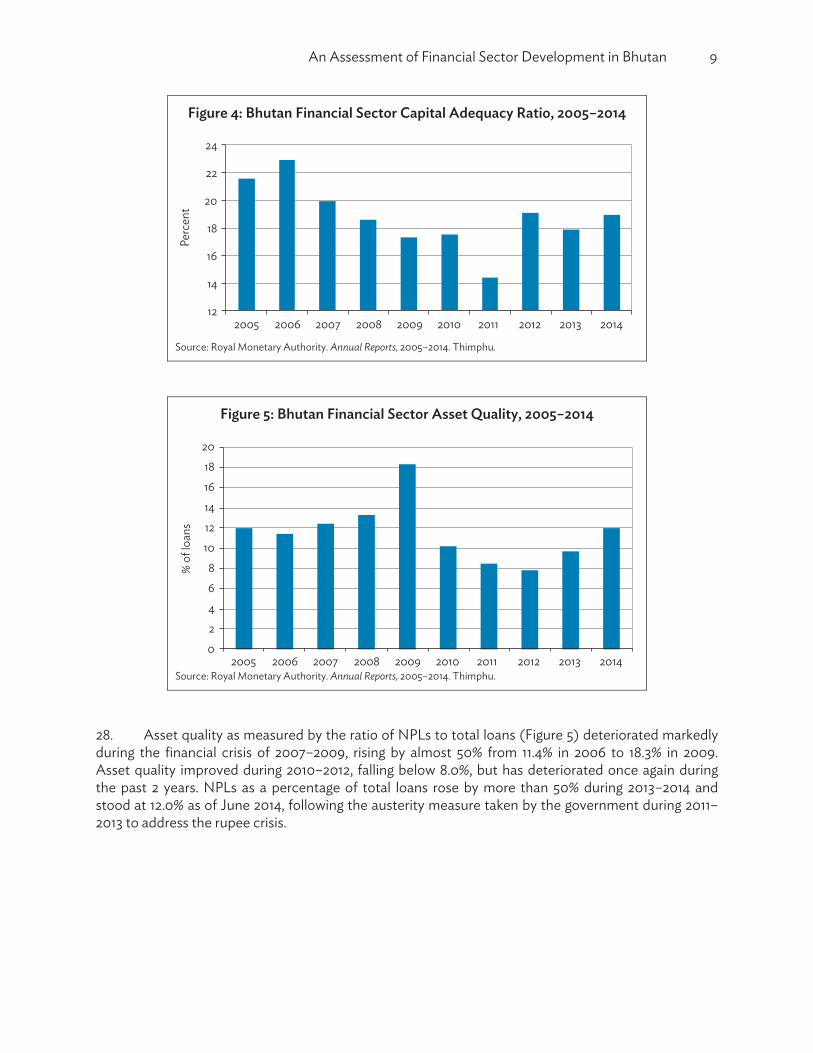
Sources: Royal Monetary Authority. Annual Reports, 2005–2014. Thimphu; Royal Monetary Authority Financial Sector Reviews, 2006–2014. 2.2 Review of the Health of the Financial Sector 26. Table 4 presents a series of financial soundness indicators (FSIs) for the Bhutan financial system over the past decade. These FSIs cover capital adequacy, asset quality, earnings, and liquidity, as well as asset and loan growth rates. Figures 4–7 present these information graphically for capital adequacy, asset quality, earnings, and liquidity. 27. In general, the financial system has been well capitalized. As shown in Figure 4, the capital adequacy ratio (CAR) for the industry has been well above the 12% regulatory minimum in each year. However, the industry CAR declined from more than 20% precrisis (in 2006) to a low of 14.4% in 2011 as nonperforming loans (NPLs) surged. In 2012, the industry CAR recovered to 19.1% and stood at a healthy 18.9% in 2014.
liquidity ratio.
An Assessment of Financial Sector Development in Bhutan 9
Figure 4: Bhutan Financial Sector Capital Adequacy Ratio, 2005–2014
Source: Royal Monetary Authority. Annual Reports, 2005–2014. Thimphu.
Figure 5: Bhutan Financial Sector Asset Quality, 2005–2014
Source: Royal Monetary Authority. Annual Reports, 2005–2014. Thimphu.
28. Asset quality as measured by the ratio of NPLs to total loans (Figure 5) deteriorated markedly during the financial crisis of 2007–2009, rising by almost 50% from 11.4% in 2006 to 18.3% in 2009. Asset quality improved during 2010–2012, falling below 8.0%, but has deteriorated once again during the past 2 years. NPLs as a percentage of total loans rose by more than 50% during 2013–2014 and stood at 12.0% as of June 2014, following the austerity measure taken by the government during 2011–2013 to address the rupee crisis.
12
14
16
18
20
22
24
2005 2006 2007 2008 2009 2010 2011 2012 2013 2014
Perc
ent
02468
1012141618
20
2005 2006 2007 2008 2009 2010 2011 2012 2013 2014
% o
f loa
ns
10 ADB South Asia Working Paper Series No.
Figure 6: Bhutan Financial Sector Profitability (ROA), 2005–2014
ROA = return on asset. Source: Royal Monetary Authority. Annual Reports, 2005–2014. Thimphu.
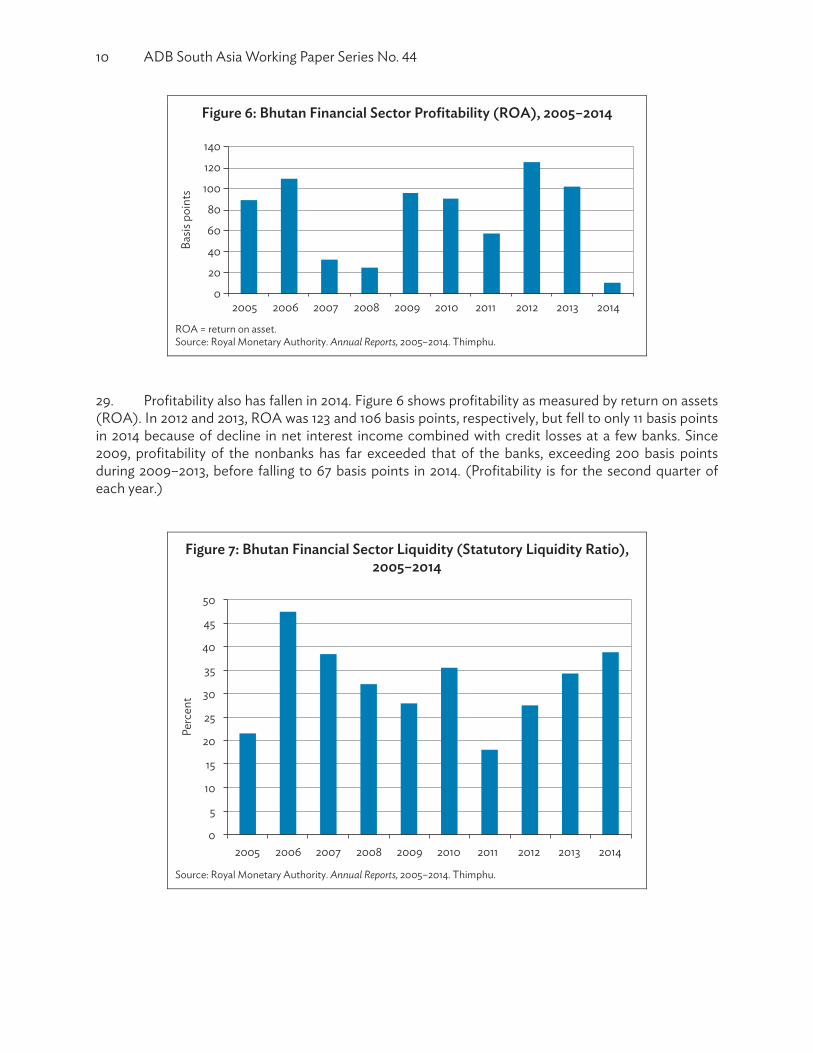
29. Profitability also has fallen in 2014. Figure 6 shows profitability as measured by return on assets (ROA). In 2012 and 2013, ROA was 123 and 106 basis points, respectively, but fell to only 11 basis points in 2014 because of decline in net interest income combined with credit losses at a few banks. Since 2009, profitability of the nonbanks has far exceeded that of the banks, exceeding 200 basis points during 2009–2013, before falling to 67 basis points in 2014. (Profitability is for the second quarter of each year.)
Figure 7: Bhutan Financial Sector Liquidity (Statutory Liquidity Ratio), 2005–2014
Source: Royal Monetary Authority. Annual Reports, 2005–2014. Thimphu.
0
20
40
60
80
100
120
140
2005 2006 2007 2008 2009 2010 2011 2012 2013 2014
Basis
poi
nts
0
5
10
15
20
25
30
35
40
45
50
2005 2006 2007 2008 2009 2010 2011 2012 2013 2014
Perc
ent
An Assessment of Financial Sector Development in Bhutan 11
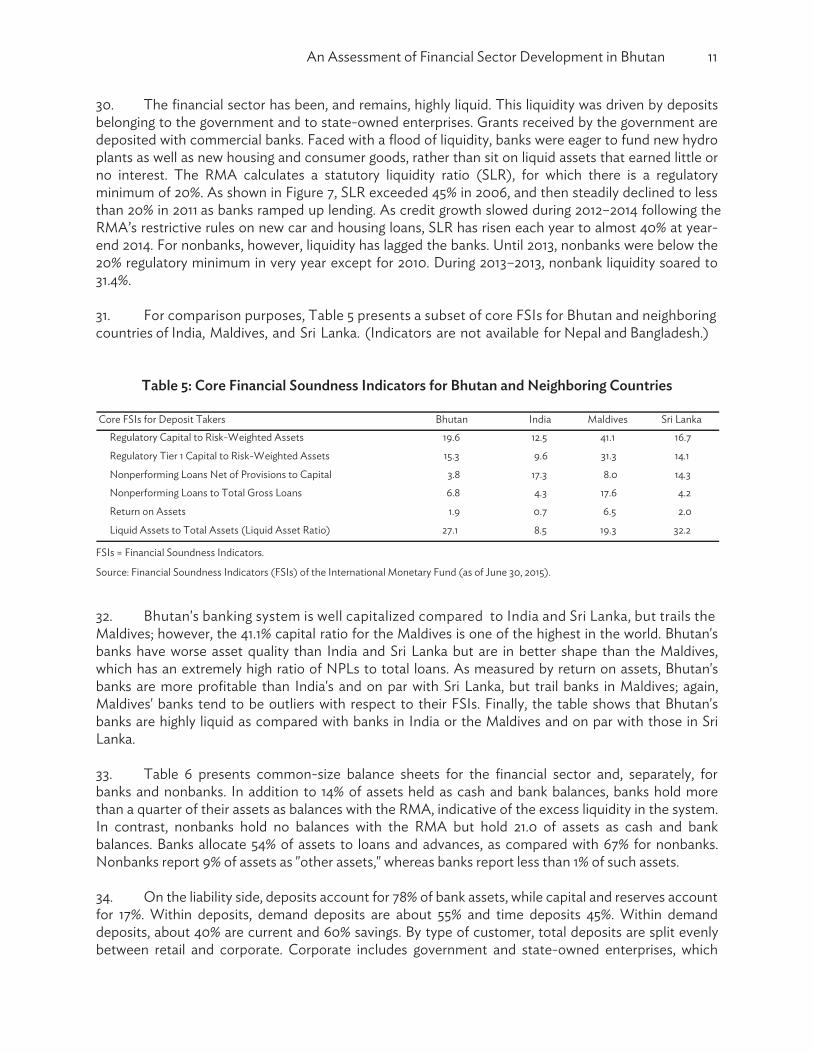
30. The financial sector has been, and remains, highly liquid. This liquidity was driven by deposits belonging to the government and to state-owned enterprises. Grants received by the government are deposited with commercial banks. Faced with a flood of liquidity, banks were eager to fund new hydro plants as well as new housing and consumer goods, rather than sit on liquid assets that earned little or no interest. The RMA calculates a statutory liquidity ratio (SLR), for which there is a regulatory minimum of 20%. As shown in Figure 7, SLR exceeded 45% in 2006, and then steadily declined to less than 20% in 2011 as banks ramped up lending. As credit growth slowed during 2012–2014 following the RMA’s restrictive rules on new car and housing loans, SLR has risen each year to almost 40% at year-end 2014. For nonbanks, however, liquidity has lagged the banks. Until 2013, nonbanks were below the 20% regulatory minimum in very year except for 2010. During 2013–2013, nonbank liquidity soared to 31.4%. 31. For comparison purposes, Table 5 presents a subset of core FSIs for Bhutan and neighboring countries of India, Maldives, and Sri Lanka. (Indicators are not available for Nepal and Bangladesh.)
Table 5: Core Financial Soundness Indicators for Bhutan and Neighboring Countries
Core FSIs for Deposit Takers Bhutan India Maldives Sri Lanka
Regulatory Capital to Risk-Weighted Assets 19.6 12.5 41.1 16.7
Regulatory Tier 1 Capital to Risk-Weighted Assets 15.3 9.6 31.3 14.1
Nonperforming Loans Net of Provisions to Capital 3.8 17.3 8.0 14.3
Nonperforming Loans to Total Gross Loans 6.8 4.3 17.6 4.2
Return on Assets 1.9 0.7 6.5 2.0
Liquid Assets to Total Assets (Liquid Asset Ratio) 27.1 8.5 19.3 32.2
FSIs = Financial Soundness Indicators.
Source: Financial Soundness Indicators (FSIs) of the International Monetary Fund (as of June 30, 2015).
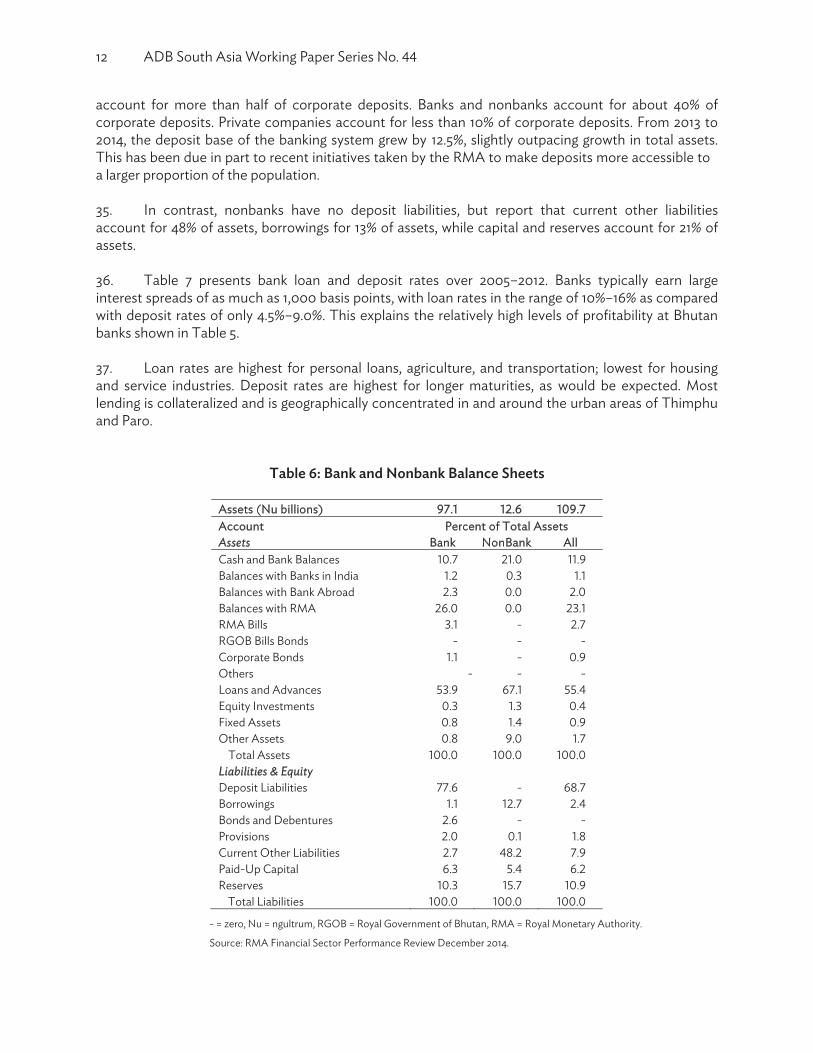
32. Bhutan's banking system is well capitalized compared to India and Sri Lanka, but trails the Maldives; however, the 41.1% capital ratio for the Maldives is one of the highest in the world. Bhutan's banks have worse asset quality than India and Sri Lanka but are in better shape than the Maldives, which has an extremely high ratio of NPLs to total loans. As measured by return on assets, Bhutan's banks are more profitable than India's and on par with Sri Lanka, but trail banks in Maldives; again, Maldives' banks tend to be outliers with respect to their FSIs. Finally, the table shows that Bhutan's banks are highly liquid as compared with banks in India or the Maldives and on par with those in Sri Lanka. 33. Table 6 presents common-size balance sheets for the financial sector and, separately, for banks and nonbanks. In addition to 14% of assets held as cash and bank balances, banks hold more than a quarter of their assets as balances with the RMA, indicative of the excess liquidity in the system. In contrast, nonbanks hold no balances with the RMA but hold 21.0 of assets as cash and bank balances. Banks allocate 54% of assets to loans and advances, as compared with 67% for nonbanks. Nonbanks report 9% of assets as "other assets," whereas banks report less than 1% of such assets. 34. On the liability side, deposits account for 78% of bank assets, while capital and reserves account for 17%. Within deposits, demand deposits are about 55% and time deposits 45%. Within demand deposits, about 40% are current and 60% savings. By type of customer, total deposits are split evenly between retail and corporate. Corporate includes government and state-owned enterprises, which
12 ADB South Asia Working Paper Series No. 44
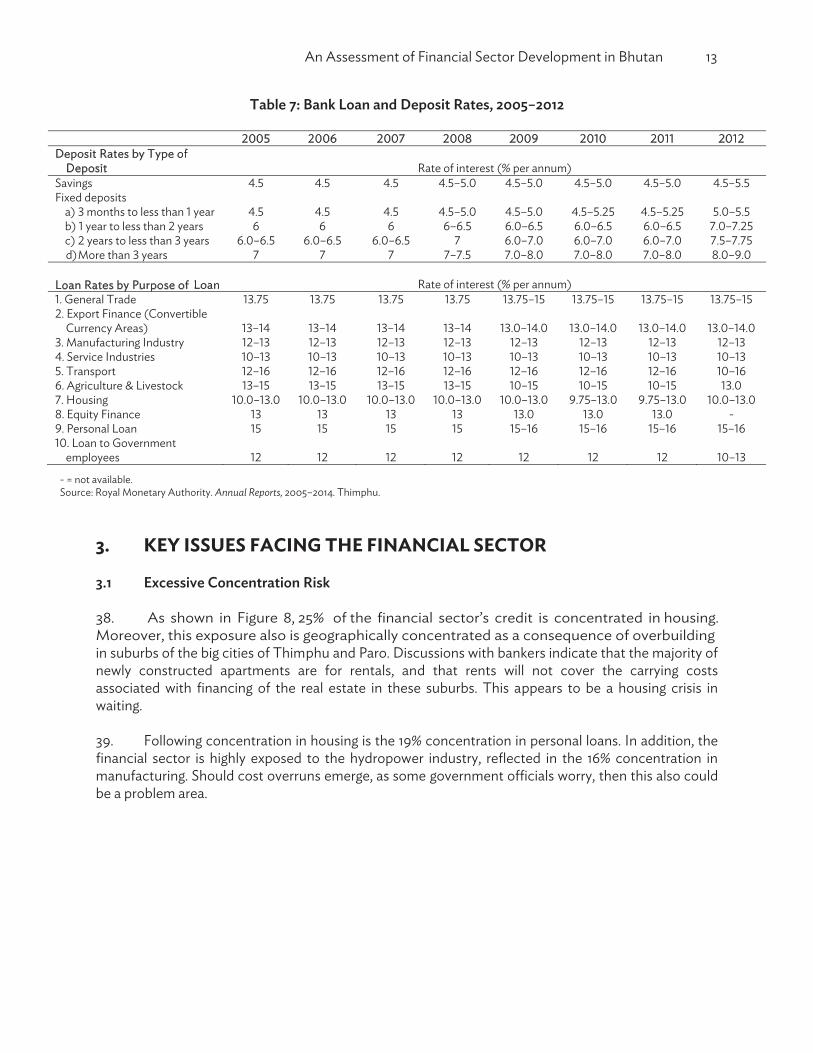
account for more than half of corporate deposits. Banks and nonbanks account for about 40% of corporate deposits. Private companies account for less than 10% of corporate deposits. From 2013 to 2014, the deposit base of the banking system grew by 12.5%, slightly outpacing growth in total assets. This has been due in part to recent initiatives taken by the RMA to make deposits more accessible to a larger proportion of the population. 35. In contrast, nonbanks have no deposit liabilities, but report that current other liabilities account for 48% of assets, borrowings for 13% of assets, while capital and reserves account for 21% of assets. 36. Table 7 presents bank loan and deposit rates over 2005–2012. Banks typically earn large interest spreads of as much as 1,000 basis points, with loan rates in the range of 10%–16% as compared with deposit rates of only 4.5%–9.0%. This explains the relatively high levels of profitability at Bhutan banks shown in Table 5. 37. Loan rates are highest for personal loans, agriculture, and transportation; lowest for housing and service industries. Deposit rates are highest for longer maturities, as would be expected. Most lending is collateralized and is geographically concentrated in and around the urban areas of Thimphu and Paro.
Table 6: Bank and Nonbank Balance Sheets
Assets (Nu billions) . . . Account Percent of Total Assets Assets Bank NonBank All
Balances with Banks in India Balances with Bank Abroad Balances with RMA RMA Bills RGOB Bills Bonds - - - Corporate BonOthers
ds - - -
Loans and Advances Equity Investments Fixed Assets Other Assets
Total Assets Liabilities & Equity Deposit Liabilities
Bonds and Debentures
Current Other Liabilities Paid-Up Capital
Total Liabilities
- = zero, Nu = ngultrum, RGOB = Royal Government of Bhutan, RMA = Royal Monetary Authority. Source: RMA Financial Sector Performance Review December 2014.
An Assessment of Financial Sector Development in Bhutan 13
Table 7: Bank Loan and Deposit Rates, 2005–2012
Deposit Rates by Type of
Deposit Savings Fixed deposits
Loan Rates by Purpose of Loan
Currency Areas)
-
employees
- = not available. Source: Royal Monetary Authority. Annual Reports, 2005–2014. Thimphu.
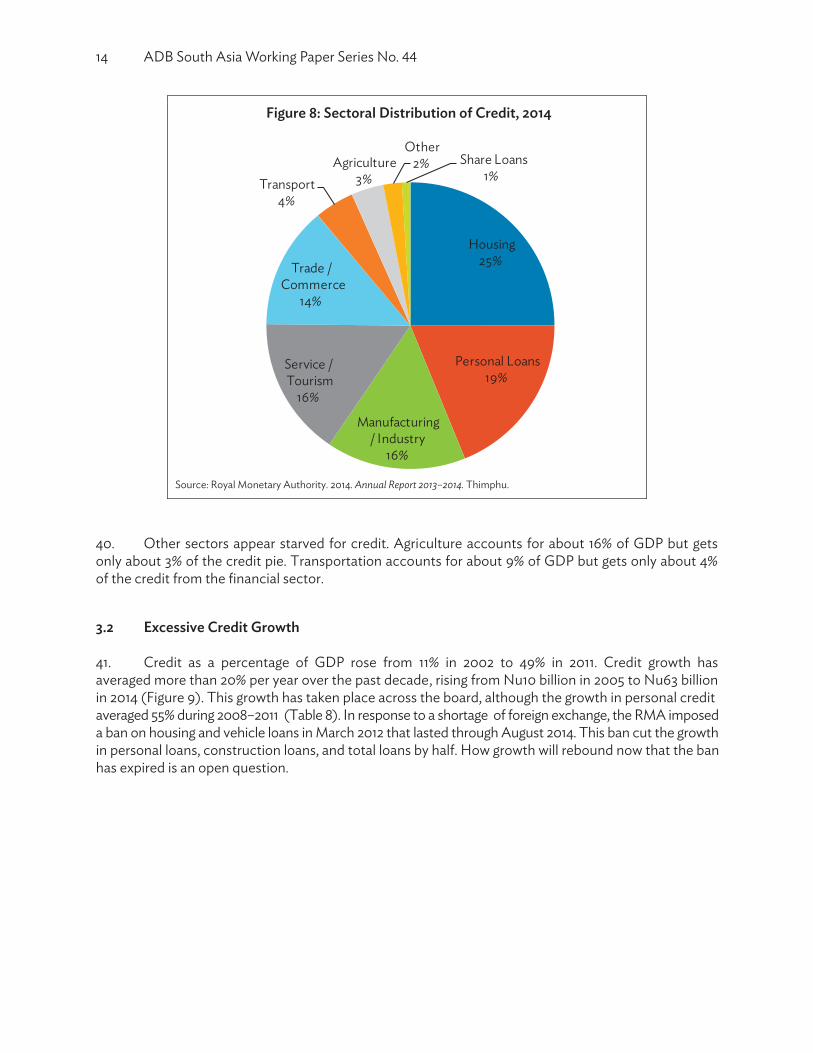
3. KEY ISSUES FACING THE FINANCIAL SECTOR 3.1 Excessive Concentration Risk 38. As shown in Figure 8, 25% of the financial sector’s credit is concentrated in housing. Moreover, this exposure also is geographically concentrated as a consequence of overbuilding in suburbs of the big cities of Thimphu and Paro. Discussions with bankers indicate that the majority of newly constructed apartments are for rentals, and that rents will not cover the carrying costs associated with financing of the real estate in these suburbs. This appears to be a housing crisis in waiting. 39. Following concentration in housing is the 19% concentration in personal loans. In addition, the financial sector is highly exposed to the hydropower industry, reflected in the 16% concentration in
his also could be a problem area.
d)
14 ADB South Asia Working Paper Series No. 44
Figure 8: Sectoral Distribution of Credit, 2014
Source: Royal Monetary Authority. 2014. Annual Report 2013–2014. Thimphu.
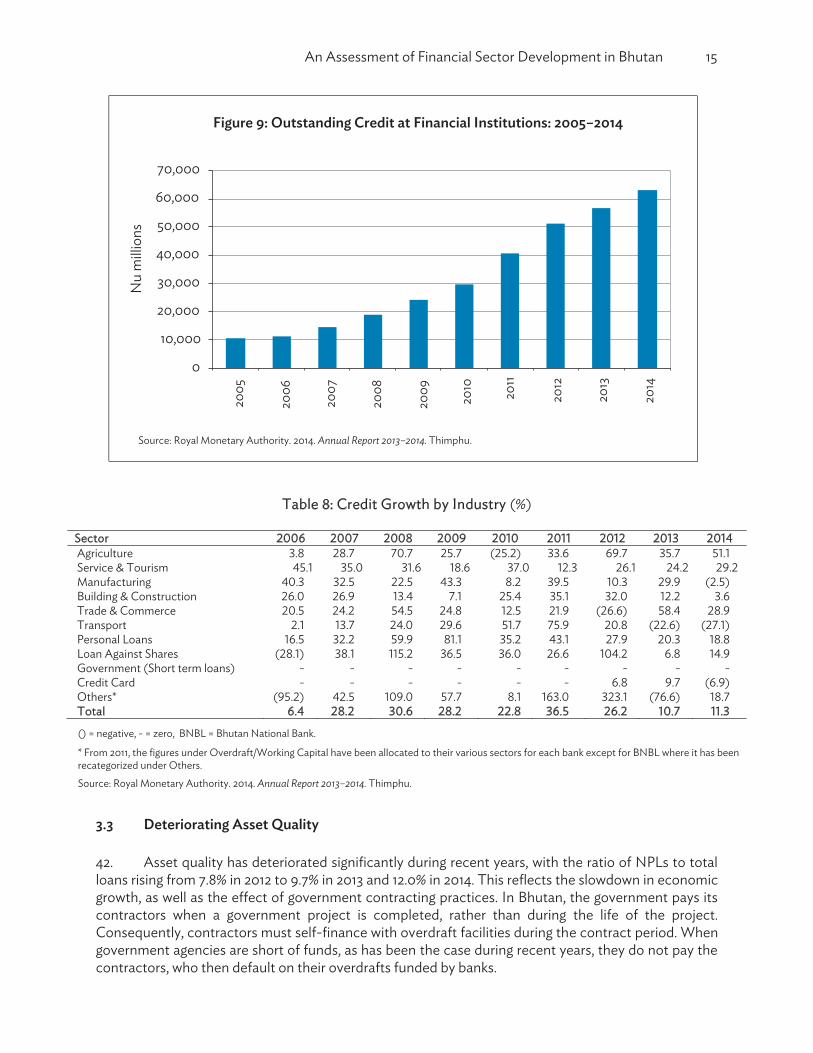
40. Other sectors appear starved for credit. Agriculture accounts for about 16% of GDP but gets only about 3% of the credit pie. Transportation accounts for about 9% of GDP but gets only about 4% of the credit from the financial sector. 3.2 Excessive Credit Growth 41. Credit as a percentage of GDP rose from 11% in 2002 to 49% in 2011. Credit growth has averaged more than 20% per year over the past decade, rising from Nu10 billion in 2005 to Nu63 billion in 2014 (Figure 9). This growth has taken place across the board, although the growth in personal credit averaged 55% during 2008–2011 (Table 8). In response to a shortage of foreign exchange, the RMA imposed a ban on housing and vehicle loans in March 2012 that lasted through August 2014. This ban cut the growth in personal loans, construction loans, and total loans by half. How growth will rebound now that the ban has expired is an open question.
Housing25%
Personal Loans19%
Manufacturing / Industry
16%
Service / Tourism
16%
Trade / Commerce
14%
Transport4%
Agriculture3%
Other2% Share Loans
1%
An Assessment of Financial Sector Development in Bhutan 15
Figure 9: Outstanding Credit at Financial Institutions: 2005–2014
Source: Royal Monetary Authority. 2014. Annual Report 2013–2014. Thimphu.
Table 8: Credit Growth by Industry (%)
Sector Agriculture Service & Tourism Manufacturing Building & Construction Trade & Commerce Transport Personal Loans Loan Against Shares Government (Short term loans) - - - - - - - - - Credit Card - - - - - - Others* Total . . . . . . . . .
() = negative, - = zero, BNBL = Bhutan National Bank.
* From 2011, the figures under Overdraft/Working Capital have been allocated to their various sectors for each bank except for BNBL where it has been recategorized under Others.
Source: Royal Monetary Authority. 2014. Annual Report 2013–2014. Thimphu.
3.3 Deteriorating Asset Quality 42. Asset quality has deteriorated significantly during recent years, with the ratio of NPLs to total loans rising from 7.8% in 2012 to 9.7% in 2013 and 12.0% in 2014. This reflects the slowdown in economic
contractors when a government project is completed, rather than during the life of the project. Consequently, contractors must self-finance with overdraft facilities during the contract period. When government agencies are short of funds, as has been the case during recent years, they do not pay the contractors, who then default on their overdrafts funded by banks.
0
10,000
20,000
30,000
40,000
50,000
60,000
70,000
2005
2006
2007
2008
2009
2010 2011
2012
2013
2014
Nu
milli
ons
16 ADB South Asia Working Paper Series No. 44
Table 9: Nonperforming Loans by Industry (Percent of Total NPLs)
Sector
Service & Tourism
Trade & Commerce Transport
Loan Against Shares Government (short term) - - - - - - - - - Credit Card Others -
Total NPL , , , , , , , , , - = not available, BNBL = Bhutan National Bank, NPL = nonperforming loan. * From 2011, the figures under Overdraft/Working Capital have been allocated to their various sectors for each bank except for BNBL where it has been recategorized under Others.
Source: Royal Monetary Authority. 2014. Annual Report 2013–2014. Thimphu.
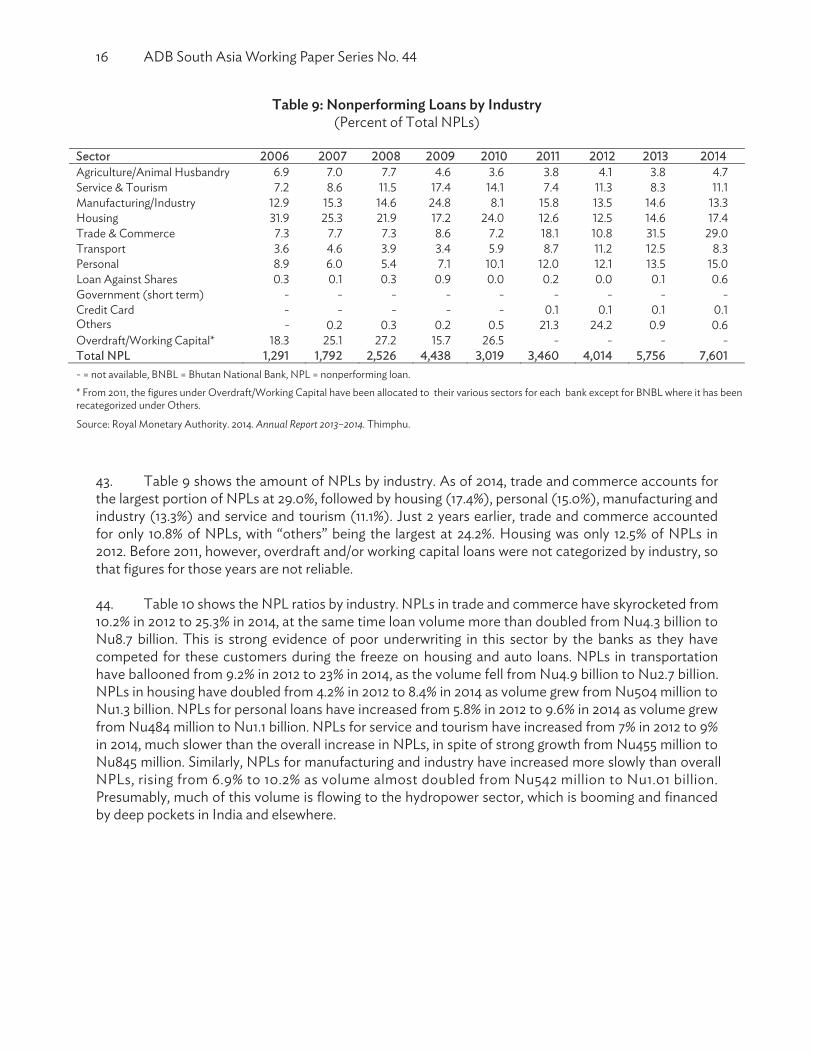
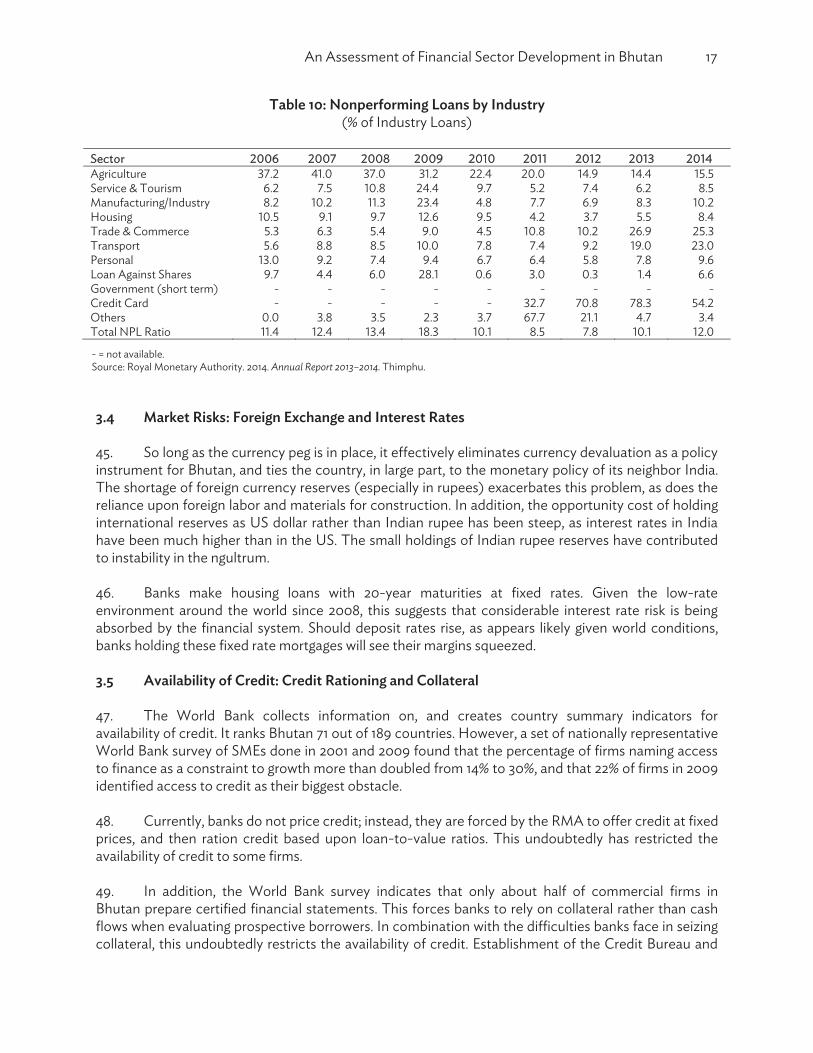
43. Table 9 shows the amount of NPLs by industry. As of 2014, trade and commerce accounts for the largest portion of NPLs at 29.0%, followed by housing (17.4%), personal (15.0%), manufacturing and industry (13.3%) and service and tourism (11.1%). Just 2 years earlier, trade and commerce accounted for only 10.8% of NPLs, with “others” being the largest at 24.2%. Housing was only 12.5% of NPLs in 2012. Before 2011, however, overdraft and/or working capital loans were not categorized by industry, so that figures for those years are not reliable. 44. Table 10 shows the NPL ratios by industry. NPLs in trade and commerce have skyrocketed from 10.2% in 2012 to 25.3% in 2014, at the same time loan volume more than doubled from Nu4.3 billion to Nu8.7 billion. This is strong evidence of poor underwriting in this sector by the banks as they have competed for these customers during the freeze on housing and auto loans. NPLs in transportation have ballooned from 9.2% in 2012 to 23% in 2014, as the volume fell from Nu4.9 billion to Nu2.7 billion. NPLs in housing have doubled from 4.2% in 2012 to 8.4% in 2014 as volume grew from Nu504 million to Nu1.3 billion. NPLs for personal loans have increased from 5.8% in 2012 to 9.6% in 2014 as volume grew from Nu484 million to Nu1.1 billion. NPLs for service and tourism have increased from 7% in 2012 to 9% in 2014, much slower than the overall increase in NPLs, in spite of strong growth from Nu455 million to Nu845 million. Similarly, NPLs for manufacturing and industry have increased more slowly than overall NPLs, rising from 6.9% to 10.2% as volume almost doubled from Nu542 million to Nu1.01 billion. Presumably, much of this volume is flowing to the hydropower sector, which is booming and financed by deep pockets in India and elsewhere.
An Assessment of Financial Sector Development in Bhutan 17
Table 10: Nonperforming Loans by Industry (% of Industry Loans)
Sector
Service & Tourism Manufacturing/
Trade & Commerce Transport
Loan Against Shares Government (short term) - - - - - - - - -Credit Card Others Total NPL Ratio
- = not available. Source: Royal Monetary Authority. 2014. Annual Report 2013–2014. Thimphu. 3.4 Market Risks: Foreign Exchange and Interest Rates 45. So long as the currency peg is in place, it effectively eliminates currency devaluation as a policy instrument for Bhutan, and ties the country, in large part, to the monetary policy of its neighbor India. The shortage of foreign currency reserves (especially in rupees) exacerbates this problem, as does the reliance upon foreign labor and materials for construction. In addition, the opportunity cost of holding international reserves as US dollar rather than Indian rupee has been steep, as interest rates in India have been much higher than in the US. The small holdings of Indian rupee reserves have contributed to instability in the ngultrum. 46. Banks make housing loans with 20-year maturities at fixed rates. Given the low-rate environment around the world since 2008, this suggests that considerable interest rate risk is being absorbed by the financial system. Should deposit rates rise, as appears likely given world conditions, banks holding these fixed rate mortgages will see their margins squeezed. 3.5 Availability of Credit: Credit Rationing and Collateral 47. The World Bank collects information on, and creates country summary indicators for availability of credit. It ranks Bhutan 71 out of 189 countries. However, a set of nationally representative World Bank survey of SMEs done in 2001 and 2009 found that the percentage of firms naming access to finance as a constraint to growth more than doubled from 14% to 30%, and that 22% of firms in 2009 identified access to credit as their biggest obstacle. 48. Currently, banks do not price credit; instead, they are forced by the RMA to offer credit at fixed prices, and then ration credit based upon loan-to-value ratios. This undoubtedly has restricted the availability of credit to some firms. 49. In addition, the World Bank survey indicates that only about half of commercial firms in Bhutan prepare certified financial statements. This forces banks to rely on collateral rather than cash flows when evaluating prospective borrowers. In combination with the difficulties banks face in seizing collateral, this undoubtedly restricts the availability of credit. Establishment of the Credit Bureau and
18 ADB South Asia Working Paper Series No. 44
collateral registry at least mitigate this problem. The government also has established the Accounting and Auditing Standards Board of Bhutan with the goal of aligning local accounting standards with International Financial Reporting Standards by 2021. For financial institutions, listed, and large public sector companies, an initial 18 Bhutan Accounting Standards take effect in 2014, and likely will be complemented by International Auditing Standards. The government plans to develop a local accounting professional body with training accredited by one or more foreign institutes. Over time, these developments should increase the extent and quality of disclosures by financial institutions and other companies and address risks associated with reliance on foreign standards and practices. 3.6 Judicial Efficiency 50. The World Bank collects information on, and creates summary indicators for, judicial efficiency of countries around the world. More specifically, it collects data on the time, cost, and outcomes of insolvency proceedings involving domestic legal entities, and evaluates the adequacy and integrity of the existing legal framework applicable to liquidation and reorganization. Unfortunately, the information collected by the World Bank does not cover proceedings against individuals, only corporations. The World Bank assigns Bhutan a “no practice” rating because it was unable to find any cases involving judicial reorganization, liquidation or debt enforcement and/or foreclosure. 2 51. The World Bank also collects data on the time, cost, and procedural complexity of resolving a commercial lawsuit. In this publication, the World Bank reports that it requires 47 procedures spanning 225 days and costing 23% of the value of a claim to enforce a commercial contract, placing Bhutan 74 out of 189 countries ranked by the World Bank. For South Asia, the average comparable numbers are 43 procedures spanning 1,077 days and costing 30% of the value of the claim, so Bhutan is much more judicially efficient than its neighbors. 52. Discussions with bankers tell a much different story than the World Bank indicators. Bankers indicate that banks cannot seize collateral in a timely manner when borrowers default because of an inefficient judicial system that favors the borrowers at the expense of creditors. When borrowers fail to appear at judicial proceedings, the court doesn’t take action; instead, it postpones the case, stretching out the foreclosure process into years. This forces lenders to reduce the availability of credit to all but the most trustworthy borrowers, which undoubtedly has negative effects on economic growth. Bhutan needs judicial reform that will speed up this process. According to lenders, they can’t even publish names of delinquent borrowers because borrowers complain to Human Rights Commission, which then imposes sanctions on the lender. Another problem mentioned by lenders is the ability of a delinquent borrower to game the credit registry by applying for new credit in the name of his wife, child, or other family member. There is no comprehensive list of related parties to protect lenders. 53. Yet another lender mentioned the Removable Property Act, which gives a lender the right to seize collateral underlying a delinquent loan, but requires the lender to get permission from borrower. Needless to say, such permission is rarely granted. Lenders also complained about the scarcity of judges who know and understand corporate law. As is, lenders have to register their complaint as a civil case, which gives the borrower 6 months to respond. Car loans have proved problematic as a lender will sell his car to a third party without notifying the lender, after which the buyer takes the car out of the country and sells it to an unknown third party. This makes it virtually impossible for the lender to repossess the vehicle and mitigate the loss on his vehicle loan.
2 World Bank. 2014. Doing Business 2015: Going Beyond Efficiency. Bhutan. Washington, DC: World Bank Group. DOI:
10.1596/978-1-4648-0351-2
An Assessment of Financial Sector Development in Bhutan 19
54. The Government of Bhutan has begun to implement a number of initiatives to improve its Ease of Doing Business indicators with the support of the World Bank under its Fiscal Sustainability and Investment Climate Project (World Bank 2014).3 These include registration of collateral, the creation of a property registry, the creation of a business licensing policy, company act amendments, enterprise registration policy, reduced red tape on construction activity, and improved public–private partnership mechanisms. Progress over time in this dimension should also help make the banking and financial sector more efficient. 3.7 Thinness of the Treasury Bond and Corporate Bond Markets 55. While the government began issuing Treasury Bonds in 2009, it still does not maintain an active Treasury Bond market. Instead, it prefers to borrow directly from state-controlled banks. This complicates monetary policy by constraining monetary operations. In conjunction with the thinness in the corporate bond market, this practice creates a shortage of high-quality liquid assets. This is especially a problem for insurance companies and pension funds, as long-term financial instruments to finance their long-term liabilities is insufficient. Consequently, the insurance companies must fund their long-term liabilities with short maturity loans, in direct competition with the commercial banks. 3.8 Restrictions on Agriculture 56. One would expect a country with arable land and water to be self sufficient in respect to food. However, the younger generations no longer want to follow their parents in working the land. Yet current laws restrict the ability of a farmer to bring in agricultural workers from out of the country, so domestic farms are unable to meet the agricultural needs of Bhutan. Instead, the country must import much of its food, exacerbating its balance-of-payments problems. From 2012 to 2013, Bhutan’s food trade deficit increased by 24% from Nu4.2 billion to Nu5.2 billion. During 2013, food imports totaled Nu6.3 billion. 4. REVIEW OF REGULATORY ARRANGEMENTS IN BHUTAN 4.1 History of Regulatory Arrangements in Bhutan 57. The RMA is the primary regulator in Bhutan, responsible for regulating and supervising not only for banks, but also nonbanks, the stock market, and pension funds. The RMA was established in 1982 and began operations in 1983, taking over liability for notes and coins previously issued by the Ministry of Finance, as well as taking over unissued note and coins held by the government. From that point forward, the RMA oversaw operation and management of Bhutan's foreign exchange reserves. The RMA introduced the cash reserve ratio in 1984 for liquidity management and prudential purposes. With assistance from the International Monetary Fund (IMF), the RMA published its first annual report in 1985. In 1988, the RMA began to serve as the banker to the government by holding the majority of government deposits, and to provide short-term loans to the government when needed. In 1992, the National Assembly passed the Financial Institutions Act, which provided the RMA with the legal framework to license, regulate, supervise, and inspect financial institutions. In 1993, the RMA established the Royal Securities Exchange of Bhutan to facilitate development of Bhutan's capital
3 World Bank. 2014. Bhutan - Fiscal Sustainability and Investment Climate Project. Washington, DC. http://documents.worldbank.org/curated/en/2014/08/20160277/bhutan-fiscal-sustainability-investment-climate-project
20 ADB South Asia Working Paper Series No.
market and enable public participation in public companies. The RMA discount bills were introduced as a monetary policy too in 1993. These were replaced in 2009 by the Royal Government of Bhutan Treasury Bills. In 1996, the RMA introduced the reserve repurchase as its second debt instrument; it was discontinued in 2002. In 1997, the Unit Trust of Bhutan was converted into Bhutan National Bank, a commercial bank. Also in 1997, check clearing facilities were first established to enable commercial banks to settle claims against each other. In 1999, the Moveable and Immoveable Property Act was passed to provide the legal framework for seizing loan collateral. In 2009, the first Royal Government of Bhutan Treasury Bills were issued, replacing the RMA discount bills. In 2010, the Royal Monetary Authority of Bhutan Act was enacted by the new Parliament, replacing the 1982 act. The 2010 act made the RMA an autonomous Central Bank with greater powers. Since passage of the act, the RMA has performed all of the Central Bank functions that are typically performed in other countries. 4.2 Current Regulatory Arrangements in Bhutan 58. The Financial Institutions Act of Bhutan 1992 has empowered the RMA to promulgate sound banking and financial policies within the economy. The implementation of appropriate prudential regulations and guidelines for financial institutions to operate within is in the scope of the RMA’s regulatory function. Supervision of financial institutions remains largely compliance-based rather than risk-based.4 59. The Prudential Regulations 2002 sets out microprudential regulations related to institutional framework of financial institutions; related party transactions; shares trading; and capital, liquidity, and provisioning requirements designed to preserve the health of individual financial institutions. Issues of licensing, corporate governance, disclosure requirements, and general structural regulations governing banking, insurance, securities businesses, and other financial services are covered in the Financial Services act of 2011. 60. Basic prudential regulations in place for Bhutan since enactment of the Prudential Regulations 2002 are requirements on capital adequacy and liquidity as well as limits on credit concentration. Capital serves as reserves for financial institutions and thus it is necessary for financial institutions to have sufficient capital to withstand unforeseen losses. The RMA sets out a minimum capital paid–up requirement for licensing of financial institutions. Also, financial institutions are required to maintain a minimum the CAR and core capital adequacy ratio (CCAR). CAR is computed as the ratio of the institution’s capital fund to its risk weighted assets, plus risk weighted off-balance sheet items. The CCAR is the ratio of the institution’s total Tier 1 capital to its risk weighted assets, plus risk weighted off-balance sheet items. Risk-weights and definitions of capital are detailed in the Prudential Regulations 2002. 61. Aside from maintaining adequate capital, financial institutions must keep a liquidity position to ensure that contractual obligations are met. Minimum requirements for liquidity management are the cash reserve ratio and SLR. The RMA also assesses the maturity mismatch for financial institutions and mismatch benchmarks are set for each financial institution for the spot less than 1 week and spot greater than 1 month regulations. 62. Concentration of credit to a certain borrower, or group of borrowers, also exposes financial institutions to risks, as any unfavorable developments in the business or the sector to which the borrower belongs to can severely affect the position of the institution. A credit ceiling limits
4 The RMA has adopted Basel I, but not Basel II.
An Assessment of Financial Sector Development in Bhutan 21
concentrations to a maximum of 30% of the total capital fund; an additional 10% may be permitted for exposures to lending to the infrastructure sector. There also is a limit on the amount of credit that can be extended to a financial institution’s ten largest borrowers, equal to 30% of total credit. The credit cap not only minimizes financial institution exposures, but also encourages portfolio diversification. More details for the provision are found in Prudential Regulations 2002, Royal Monetary Authority of Bhutan, Financial Regulation and Supervision Department. 63. To strengthen the regulatory framework for Bhutan, a framework for a more comprehensive macroprudential regulation was developed during 2013–2014.5 The seven regulations in the framework developed are: (i) the leverage ratio, (ii) the loan-to-value (LTV) and loan-to-income (LTI) ratios, (iii) the debt-to-equity ratio, (iv) restrictions on the distribution of profit, (v) time varying capital provisioning and margin requirement, (vi) countercyclical capital buffer (CCCB), and (vii) sectoral capital requirement (SCR). The time varying capital provisioning and margin requirement—CCCB and SCR—are set to be implemented in 2016, while the rest have been effective since 2014. 64. The leverage ratio serves as a supplementary measure to the CAR. It is meant to ensure that the capital stock of the banking sector is adequate, even if the risk weighting procedure is not robust. In instances when asset risks are factored and the risk measures are not robust, the CAR might not capture capital inadequacy as it might not be showing deterioration and the leverage ratio can be a supplementary measure since it treats all assets equally. This is to be maintained alongside the CAR to ensure that financial institutions do not keep a disproportionately high level of risky assets and to monitor asset quality. The leverage ratio for Bhutan is calculated as the ratio of Tier 1 capital to total assets. Total assets refer to the sum of on- and off-balance sheet exposures of financial institutions. Financial institutions have to maintain a leverage ratio of at least 3%. 65. Financial institutions face risks of default either from fall in collateral values or inadequate repayment capacity of borrower. The LTV–LTI regulation is meant to mitigate these risks. The LTV ratio addresses the risk arising from fall in collateral values as it limits the loan value to a certain percentage of its collateral base. The limit to how much can be extended depends on the type of property being acquired to account for the differential risks attached. Since the ratio is applicable to property loans, the regulation is an indirect method of addressing overexposure in the property sector. The LTI ratio is meant to mitigate default risks from arising from repayment capacity and is computed as it compares total monthly obligations on all loans including the loan being acquired and the total monthly income. The limits on the maximum allowable LTI ratio increase with income. 66. The debt-to-equity ratio for project financing regulation in Bhutan imposes a debt cap on project financing. It stipulates that debt finances no more than 75% of the total project cost or equivalently at least 25% of the project cost should be financed by equity and it must come from the borrower’s own resources. Giving the investor a stake in the business not only lowers exposure risk for the financial institution but encourages more prudent actions for the business owner, which reduces the likelihood of excessive risk taking that can affect financial position. 67. The restriction on the distribution of profits balances both the interests of small deposit holders and shareholders. Limiting profit distribution is for the interest of depositors as it allows financial institutions to build up capital, which can protect it against unexpected losses. Profit distribution encourages participation of investors in the public ownership of banks and to rationalize
5 For more details, see Royal Monetary Authority of Bhutan. Macro-Prudential Rules and Regulations. Thimphu.
http://www.rma.org.bt/laws_bylawstp2.jsp
22 ADB South Asia Working Paper Series No.
profit distribution, it is linked to the financial performance of the financial institutions. Moreover, introducing a standard regulation on dividend payments introduces discipline and uniformity to the practice of dividend distribution across the financial sector. For an institution to be qualified to distribute dividends, it must have a CAR of at least 10% on the year it proposes to distribute dividends. The maximum dividend that can be paid out depends on the CAR in the previous 2 years and the NPL ratio. The two indicators are used together to gauge the performance of the financial institution in those years. 68. Regulations were introduced to address the cyclicality in capital accumulation. Financial institutions hold capital provisions against NPLs to ensure capital adequacy when losses are incurred. Provisioning is generally procyclical such that during good times, NPLs are low and thus provisioning requirements are also low.The reverse is true during bad times when high NPLs translate into higher provisioning requirements and the additional burden on capital requirements may result in a decline in credit further exacerbating dwindling profits. Bhutan’s regulation on time varying capital provisioning helps address this as capital buffer is built in good times to meet additional capital requirements in down times. Under the provision, institutions are required to keep a 60% provisioning capital ratio. In good times, this is likely to be high as 60% coverage on NPLs may not be necessary and as such additional capital is accumulated. In down times, provisioning requirements might be higher but such capital may be drawn from the buffer and not leading to lower credit. 69. The CCCB also requires institutions to build capital in good times to safeguard the intermediation activities by ensuring they have adequate capital in hand during the downward phase of the economic cycle. Buffers are built when the gap of the credit–GDP ratio from its trend value is at least 500 basis points. The amount of buffer at any given point depends on the size of the gap but shall not exceed 2.5% of risk weighted assets. When the gap is less than 500 basis points, no additional capital is built or that the buffer is maintained and when the gap is zero or less, the buffer is released so that capital requirements are still met and lending activities can continue. 70. It can also be the case that the credit boom is experienced by a specific sector; SCR may be applicable in this case and capital buffers are built against the risk weighted assets of a particular sector. It is possible that it is applicable to more than one sector at a time, but total size of buffer shall not exceed 2.5% of the total risk-weighted assets. SCR may be imposed if a given sector accounts for 15% or more of the economy’s total outstanding credit, and the growth of credit to the sector exceeds the overall growth of credit in the economy by 500 basis points or more. 71. Apart from the macroprudential regulations, the RMA imposes policies on the setting of interest rates and foreign currency holdings. The standard for calculating the minimum rate that lending institutions would lend is in the Base Rate Operational Guidelines,6 which became effective in July 2013. Each bank calculates its own base rate on a cost-plus basis, adding the cost to the financial institution for undertaking the lending activity (this includes the cost of deposits, which represents the basic cost of lending plus overhead costs then adjusted downward for the interest earned) plus a profit margin, calculated as the ratio of net profit to total deposits. The actual lending rate would be calculated as this base rate plus the borrower or loan specific costs. The base rate system promotes fair pricing and competition in financial markets and prevents interest rate undercutting. And since lending rates cannot go below the floor set by the base rate, excessive credit disbursal and overheating may be prevented. Monetary policy transmission may also be enhanced through signaling. For example, the
6 Royal Monetary Authority of Bhutan. 2013. Base Rate Operational Guidelines 2013. Thimphu. http://www.rma.org.bt/ laws_bylawstp2.jsp
An Assessment of Financial Sector Development in Bhutan 23
base rate declines with a fall in the deposit rate from an expansionary monetary policy stance. Increased transparency in rate setting can improve confidence in the financial system and encourage more participation. 72. Foreign currency regulation is governed by the Foreign Exchange Regulation 2013, which 7
repealed and replaced the Foreign Exchange Regulations 1997 and the Import and Export of Currency Regulations 2013. Besides being more comprehensive, the current regulation designates the Indian rupee as a foreign currency. Moreover, the current regulation explicitly specifies that all payments and transfers within Bhutan are to be made in ngultrum. 73. The regulation controls the flow of foreign currency by requiring people importing or exporting foreign currency worth $10,000 or more to declare the value of the same at customs. The same threshold for import–export of the Indian rupee, to and from countries other than Nepal or India, is Rs10,000. When leaving Bhutan, people other than residents or citizens of Bhutan can take back the balance amount of convertible currency left over from the amount that they brought into the country while a resident of Bhutan can take out checks drawn on a foreign currency account maintained with a bank in Bhutan, and banknotes, travellers’ checks, or other instruments denominated in foreign currencies. The current regulation also sets out the acceptable activities of authorized banks and foreign 74. The Credit Rating Agency Regulation,8 which defines a framework for the development of credit rating agencies in Bhutan should help in the intermediation activities of financial institutions with more borrower information. To implement the above regulations, the RMA must be aware of any systemic risk building in the economy. This will require macroeconomic monitoring, regular reporting of risks to financial stability and stress-testing of the financial sector to possible emergent risks. The Financial Stability Unit within the RMA has been set up to conduct the monitoring activities. 4.3 Stress Testing in Bhutan 75. In 2015, the RMA developed an Excel-based stress testing template and began periodic stress testing exercises consisting of single-factor sensitivity tests for credit risk and liquidity risk, with plans to expand to cover interest-rate risk, foreign-exchange risk, and interbank contagion risk. Two simulations had been conducted through May 2015. Credit Risk Three credit shocks were tested:
X% of doubtful loans migrates into loss status, All NPLs increase by X percentage points, and X% of loans in specific economic sectors migrates into nonperforming status.
76. For the first shock, required loan loss reserves are recalculated according to the RMA's provisioning requirements, which are 1% for performing loans, 1.5% for watch, 15% for substandard, 50%
7 Royal Monetary Authority of Bhutan. 2013. Foreign Exchange Regulations 2013. Thimphu. http://www.rma.org.bt/
laws_bylawstp2.jsp 8 Royal Monetary Authority of Bhutan. 2014. Credit Rating Agency Regulation 2014. Thimphu. http://www.rma.org.bt/
laws_bylawstp2.jsp
24 ADB South Asia Working Paper Series No.
for doubtful, and 100% for loss. Next, loan loss provisions are transferred from the bank's equity capital to its loan loss reserve account, and then the bank's risk-weighted assets and CAR are recalculated to see if it remains above the RMA's regulatory minimum CAR of 10%. 77. For the second and third shocks, the RMA does not distinguish among the three categories of NPLs, so that it makes an undocumented assumption about required provisions, most probably 50%. Otherwise, the calculations are similar to those for the first shock. Liquidity 78. For liquidity risk, the RMA simulates two deposit-run shocks: (i) all banks face the same daily percentage rate of deposit withdrawals, and (ii) daily percentage withdrawals vary by the asset size of the bank. For both shocks, the run is assumed to last only 5 days. Assumed withdrawal rates are higher for demand deposits than time deposits. 79. Assets are classified into three categories: quick, liquid, and nonliquid. The proportion of each type of asset that can be liquidated each day also is assumed. 80. For each of the 5 days, the net cash flow is calculated as new inflows less new outflows. If this difference is positive, then the bank is deemed liquid; if not, the bank is deemed illiquid and fails the test. 5. PROPOSED IMPROVEMENTS TO SUPERVISION OF FINANCIAL
INSTITUTIONS 81. The following subsections describe proposed measures for the improvement of banking sector stability. It should be noted that some of these measures are currently being developed and supported under ADB Strengthening Economic Management Program II9 and the technical assistance program10 underpinning this. 5.1 Improvements to Regulation 82. The RMA should update its capital adequacy framework to account for operational and market risks consistent with the simple or standardized approaches of Basel II and III. 83. With regard to liquidity management, SLR does not account for asset–liability mismatches. High quality liquid assets are in short supply due to thinness of the corporate and government bond markets. Instead, banks rely on claims against other banks. Currently, the RMA does not collect information on maturity mismatches.
9 ADB. 2015. Report and Recommendation of the President to the Board of Directors: Proposed Policy-Based Loan, Grant, and Technical Assistance Grant to the Kingdom of Bhutan: Strengthening Economic Management Program II. Manila.
10 ADB. 2015. CDTA 8901 Supporting Implementation of Strengthening Economic Management. Manila.
An Assessment of Financial Sector Development in Bhutan 25
84. With regard to interest rate risk management, the RMA does not yet collect information on repricing of assets and liabilities, making it difficult if not impossible to assess the exposure of the financial system to interest rate risk. 85. With regard to crisis management, the RMA should develop policies for crisis management to deal with the possibility of a bank failure. This may involve changes to the Bankruptcy Act,11 in order to deal with a financial institution. The government needs to plan for implementation of a scheme for deposit insurance to support confidence of retail depositors in the event of a crisis of confidence.12 86. There are plans to expand CIB to include information from microfinance intermediaries, and to develop credit scoring models. There are plans to expand the collateral registry to include moveable as well as immovable collateral. There are plans to divest insurance companies of banking business (i.e., lending) but this will have to await the deepening of the government bond market, stock exchange, and corporate bond market. 87. Geography remains a major impediment to access to finance. Both microfinance and technology tied to mobile phones and electronic funds transfer should be targeted to bringing easy access to finance to outlying areas. 5.2 Improvements to Judicial Efficiency 88. The Parliament should pass legislation to improve judicial efficiency. It should mandate that the credit bureau develop a comprehensive list of related parties to protect lenders from delinquent borrowers who seek additional funds in the names of family members or related parties. The Parliament also should amend Removable Property Act to eliminate the requirement of permission from a borrower to seize collateral. 5.3 Eliminating Price Fixing in the Credit Markets 89. The RMA should take steps to encourage bankers to price credit rather than just to ration credit. In other words, bankers should be allowed to charge borrowers different rates for the same credit product, so long as the rate differentials are based upon the riskiness of the borrower and the loan. This may require passage of some sort of "safe harbor" regulation protecting bankers from lawsuits by borrowers claiming disparate treatment. Disparate treatment in the form of differential loan rates prices according to the riskiness of the borrower is a normal outcome in healthy, well-functioning credit markets. By allowing bankers to price credit, the RMA will be reducing the incentives of bankers to simply ration credit, thereby increasing the availability of credit to potential borrowers that currently are rationed out of the credit market. 5.4 Improving and Expanding Stress Testing 90. The first credit-risk stress test migrates a portion of doubtful loans into loss status. A logical extension of this test is a formal credit-migration stress test, where a portion of standard loans migrate to substandard, a portion of substandard migrate to doubtful and a portion of doubtful migrate to loss.
11 Royal Monetary Authority of Bhutan. 1999. Bankruptcy Act of the Kingdom of Bhutan 1999. Thimphu. http://www.rma
.org.bt/laws_bylawstp2.jsp 12 The RMA does not consider implementation of deposit insurance to be a pressing issue because of the relatively sound
banking indicators and strong regulatory regime, but also because it does not wish to create implicit liabilities for the RMA.
26 ADB South Asia Working Paper Series No. 44
This type of test would obviate the need for the second credit risk stress test, and also could be applied to the sectoral credit-risk stress test. This would allow the RMA to apply its actual provisioning requirements rather than an assumed generic NPL provisioning standard. 91. The RMA also could apply this sort of stress test to each bank's largest exposures. In this type of test, the assumed shock is the default by the bank's largest (or three to five largest) borrowers. 92. Given the concentration of exposures in Paro and Thimphu, the RMA should consider incorporating geographic shocks, such as a housing crisis in those metropolitan areas. 93. Regarding liquidity stress tests, the assumption of a 5-day run is inconsistent with the new Basel III liquidity coverage ratio, which seeks to ensure that a bank has sufficient liquidity to meet a 20 calendar day liquidity stress scenario. 94. As a complement for its existing liquidity stress tests, the RMA should consider a stress test for a large-depositor run. Here, the assumed shock would be the immediate withdrawal of all deposits by the bank's largest (or three to five largest) depositors. 95. In the longer term, the RMA should consider more sophisticated cash flow-based liquidity stress tests that incorporate the actual maturities of the bank's assets and liabilities. 96. The RMA already plans to implement stress tests for interbank contagion and for market risks, such as foreign exchange risk and interest rate risk. It should proceed with these tests as soon as practicable. The RMA also should begin to develop multifactor sensitivity tests that combine shocks based upon an assumed historical event, such as an earthquake. In the longer run, the RMA should develop dynamic macro-linked stress tests where historical relationships between macroeconomic variables and bank financials drive scenario stress tests. It should be noted that capacity constraints such as the lack of available data have hamstrung the RMA in the development of more comprehensive and advanced stress tests. 5.5 Government Payment of Contractors 97. Requiring government contractors to self-finance work-in-progress, transfers credit risk from the government to the private sector, obscuring the underlying risk, which is sovereign risk. The government should transition away from this practice and begin paying contractors on a monthly or bi-monthly basis. In the interim, the RMA should estimate how much private sector credit is tied to this contracting practice to better quantify sovereign credit risk. 5.6 System of Early Warning Indicators 98. The RMA should formalize a set of early warning and financial soundness indicators. The IMF publishes a standardized set of “core” and “encouraged” financial soundness indicators, many of which the RMA provides to the IMF and already reports in its publications.13 Appendix 3 shows the FSIs currently reported for Bhutan by the IMF. Currently, Bhutan reports to the IMF all of the 12 “core”
FSIs for deposit takers, and reports eight of the 13 “encouraged” FSIs for deposit takers. Missing are:
13 See the concepts and definitions at: http://fsi.imf.org/misc/FSI%20Concepts%20and%20Definitions.pdf
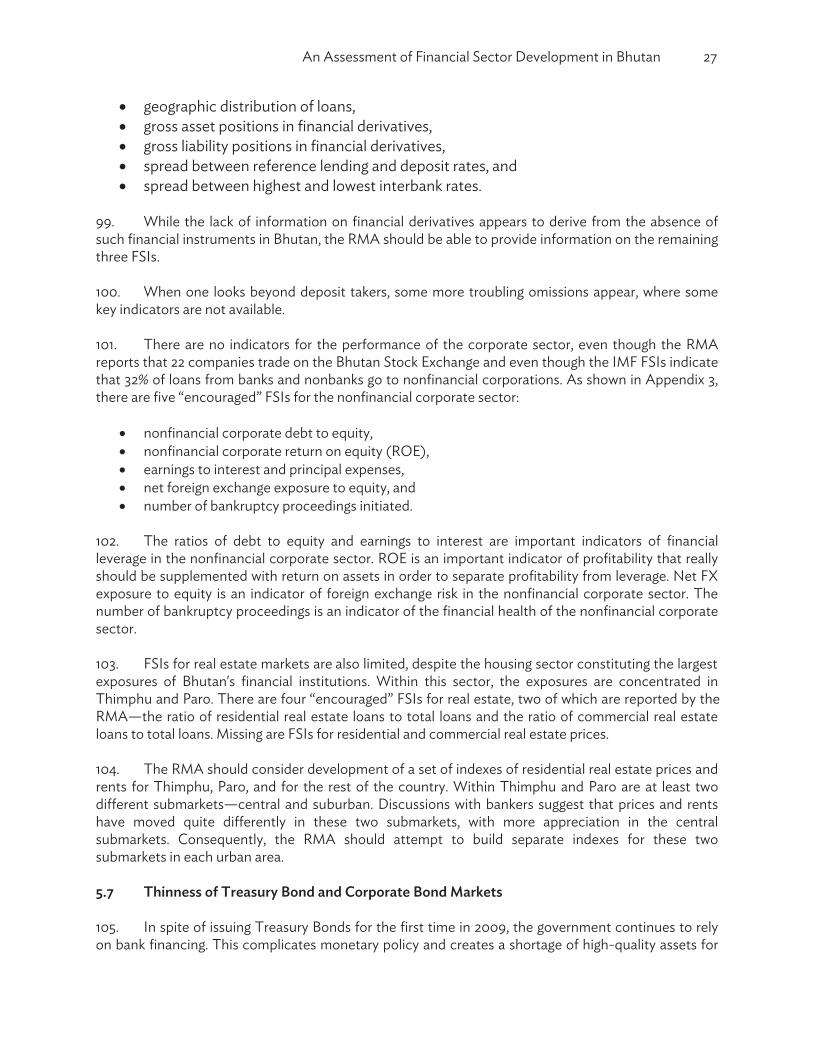
An Assessment of Financial Sector Development in Bhutan 27
geographic distribution of loans, gross asset positions in financial derivatives, gross liability positions in financial derivatives, spread between reference lending and deposit rates, and spread between highest and lowest interbank rates.
99. While the lack of information on financial derivatives appears to derive from the absence of such financial instruments in Bhutan, the RMA should be able to provide information on the remaining three FSIs. 100. When one looks beyond deposit takers, some more troubling omissions appear, where some key indicators are not available. 101. There are no indicators for the performance of the corporate sector, even though the RMA reports that 22 companies trade on the Bhutan Stock Exchange and even though the IMF FSIs indicate that 32% of loans from banks and nonbanks go to nonfinancial corporations. As shown in Appendix 3, there are five encouraged FSIs for the nonfinancial corporate sector:
nonfinancial corporate debt to equity, nonfinancial corporate return on equity (ROE), earnings to interest and principal expenses, net foreign exchange exposure to equity, and number of bankruptcy proceedings initiated.
102. The ratios of debt to equity and earnings to interest are important indicators of financial leverage in the nonfinancial corporate sector. ROE is an important indicator of profitability that really should be supplemented with return on assets in order to separate profitability from leverage. Net FX exposure to equity is an indicator of foreign exchange risk in the nonfinancial corporate sector. The number of bankruptcy proceedings is an indicator of the financial health of the nonfinancial corporate sector. 103. FSIs for real estate markets also limited, despite the housing sector constituting the largest exposures of Bhutan's financial institutions. Within this sector, the exposures are concentrated in Thimphu and Paro. There are four encouraged FSIs for real estate, two of which are reported by the RMA—the ratio of residential real estate loans to total loans and the ratio of commercial real estate loans to total loans. Missing are FSIs for residential and commercial real estate prices. 104. The RMA should consider development of a set of indexes of residential real estate prices and rents for Thimphu, Paro, and for the rest of the country. Within Thimphu and Paro are at least two different submarkets—central and suburban. Discussions with bankers suggest that prices and rents have moved quite differently in these two submarkets, with more appreciation in the central submarkets. Consequently, the RMA should attempt to build separate indexes for these two submarkets in each urban area. 5.7 Thinness of Treasury Bond and Corporate Bond Markets 105. In spite of issuing Treasury Bonds for the first time in 2009, the government continues to rely on bank financing. This complicates monetary policy and creates a shortage of high-quality assets for
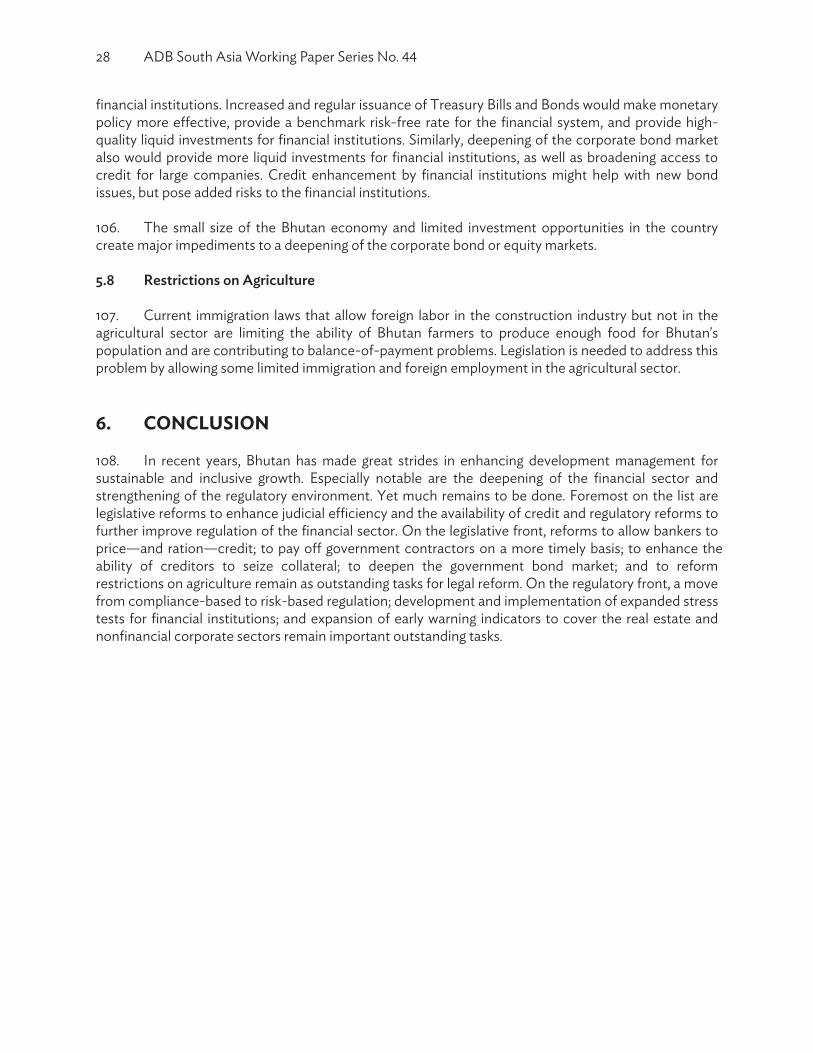
28 ADB South Asia Working Paper Series No.
financial institutions. Increased and regular issuance of Treasury Bills and Bonds would make monetary policy more effective, provide a benchmark risk-free rate for the financial system, and provide high-quality liquid investments for financial institutions. Similarly, deepening of the corporate bond market also would provide more liquid investments for financial institutions, as well as broadening access to credit for large companies. Credit enhancement by financial institutions might help with new bond issues, but pose added risks to the financial institutions. 106. The small size of the Bhutan economy and limited investment opportunities in the country create major impediments to a deepening of the corporate bond or equity markets. 5.8 Restrictions on Agriculture 107. Current immigration laws that allow foreign labor in the construction industry but not in the agricultural sector are limiting the ability of Bhutan farmers to produce enough food for Bhutan's population and are contributing to balance-of-payment problems. Legislation is needed to address this problem by allowing some limited immigration and foreign employment in the agricultural sector. 6. CONCLUSION 108. In recent years, Bhutan has made great strides in enhancing development management for sustainable and inclusive growth. Especially notable are the deepening of the financial sector and strengthening of the regulatory environment. Yet much remains to be done. Foremost on the list are legislative reforms to enhance judicial efficiency and the availability of credit and regulatory reforms to further improve regulation of the financial sector. On the legislative front, reforms to allow bankers to price—and ration—credit; to pay of government contractors on a more timely basis; to enhance the ability of creditors to seize collateral; to deepen the government bond market; and to reform restrictions on agriculture remain as outstanding tasks for legal reform. On the regulatory front, a move from compliance-based to risk-based regulation; development and implementation of expanded stress tests for financial institutions; and expansion of early warning indicators to cover the real estate and nonfinancial corporate sectors remain important outstanding tasks.
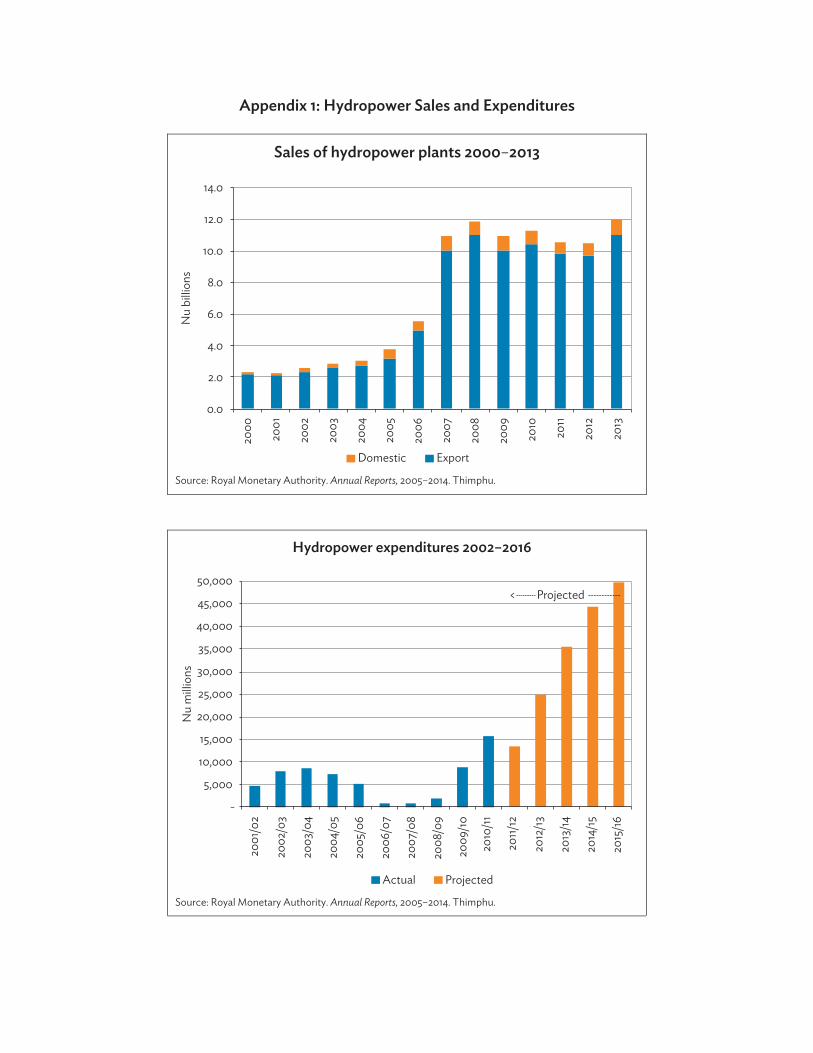
Appendix 1: Hydropower Sales and Expenditures
Sales of hydropower plants 2000–2013
Source: Royal Monetary Authority. Annual Reports, 2005–2014. Thimphu.
Hydropower expenditures 2002–2016
Source: Royal Monetary Authority. Annual Reports, 2005–2014. Thimphu.
0.0
2.0
4.0
6.0
8.0
10.0
12.0
14.0
2000
2001
2002
2003
2004
2005
2006
2007
2008
2009
2010
2011
2012
2013
Nu
billio
ns
Domestic Export
ProjectedActual
-
5,000
10,000
15,000
20,000
25,000
30,000
35,000
40,000
45,000
50,000
2001
/02
2002
/03
2003
/04
2004
/05
2005
/06
2006
/07
2007
/08
2008
/09
2009
/10
2010
/11
2011/
12
2012
/13
2013
/14
2014
/15
2015
/16
Nu
milli
ons
<--------- Projected ------------
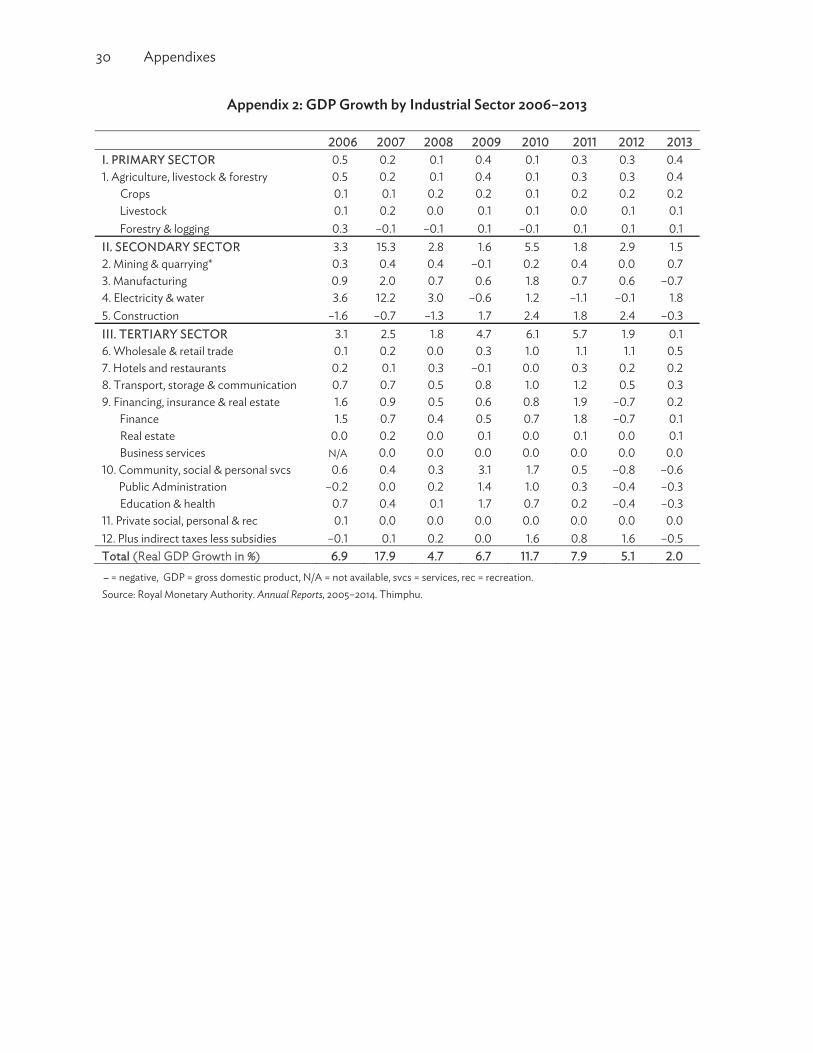
30 Appendixes
Appendix 2: GDP Growth by Industrial Sector 2006–2013
I. PRIMARY SECTOR
II. SECONDARY SECTOR
III. TERTIARY SECTOR
Total (Real GDP Growth in . . . . . . . . = negative, GDP = gross domestic product, N/A
N/A
= not available, svcs = services, rec = recreation. Source: Royal Monetary Authority. Annual Reports, 2005–2014. Thimphu.
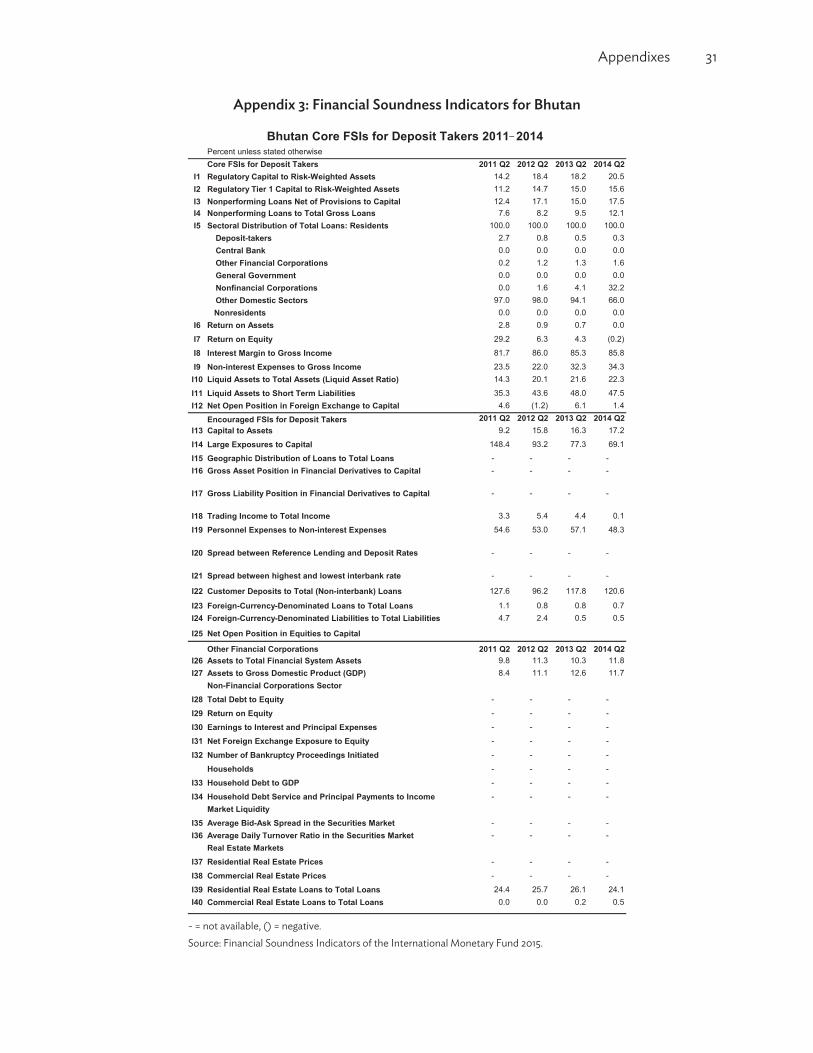
Appendixes 31
Appendix 3: Financial Soundness Indicators for Bhutan
Percent unless stated otherwise2011 Q2 2012 Q2 2013 Q2 2014 Q2
I1 Regulatory Capital to Risk-Weighted Assets 14.2 18.4 18.2 20.5I2 Regulatory Tier 1 Capital to Risk-Weighted Assets 11.2 14.7 15.0 15.6I3 Nonperforming Loans Net of Provisions to Capital 12.4 17.1 15.0 17.5I4 Nonperforming Loans to Total Gross Loans 7.6 8.2 9.5 12.1I5 Sectoral Distribution of Total Loans: Residents 100.0 100.0 100.0 100.0
Deposit-takers 2.7 0.8 0.5 0.3Central Bank 0.0 0.0 0.0 0.0Other Financial Corporations 0.2 1.2 1.3 1.6General Government 0.0 0.0 0.0 0.0Nonfinancial Corporations 0.0 1.6 4.1 32.2Other Domestic Sectors 97.0 98.0 94.1 66.0
Nonresidents 0.0 0.0 0.0 0.0I6 Return on Assets 2.8 0.9 0.7 0.0
I7 Return on Equity 29.2 6.3 4.3 (0.2)
I8 Interest Margin to Gross Income 81.7 86.0 85.3 85.8
I9 Non-interest Expenses to Gross Income 23.5 22.0 32.3 34.3I10 Liquid Assets to Total Assets (Liquid Asset Ratio) 14.3 20.1 21.6 22.3
I11 Liquid Assets to Short Term Liabilities 35.3 43.6 48.0 47.5I12 Net Open Position in Foreign Exchange to Capital 4.6 (1.2) 6.1 1.4
Encouraged FSIs for Deposit Takers 2011 Q2 2012 Q2 2013 Q2 2014 Q2
2011 Q2 2012 Q2 2013 Q2 2014 Q2
I13 Capital to Assets 9.2 15.8 16.3 17.2
I14 Large Exposures to Capital 148.4 93.2 77.3 69.1
I15 Geographic Distribution of Loans to Total Loans - - - -I16 Gross Asset Position in Financial Derivatives to Capital - - - -
I17 Gross Liability Position in Financial Derivatives to Capital - - - -
I18 Trading Income to Total Income 3.3 5.4 4.4 0.1
I19 Personnel Expenses to Non-interest Expenses 54.6 53.0 57.1 48.3
I20 Spread between Reference Lending and Deposit Rates - - - -
I21 Spread between highest and lowest interbank rate - - - -
I22 Customer Deposits to Total (Non-interbank) Loans 127.6 96.2 117.8 120.6
I23 Foreign-Currency-Denominated Loans to Total Loans 1.1 0.8 0.8 0.7I24 Foreign-Currency-Denominated Liabilities to Total Liabilities 4.7 2.4 0.5 0.5
I25 Net Open Position in E
Other Financial Corporations
quities to Capital
I26 Assets to Total Financial System Assets 9.8 11.3 10.3 11.8I27 Assets to Gross Domestic Product (GDP) 8.4 11.1 12.6 11.7
Non-Financial Corporations SectorI28 Total Debt to Equity - - - -
I29 Return on Equity - - - -
I30 Earnings to Interest and Principal Expenses - - - -
I31 Net Foreign Exchange Exposure to Equity - - - -
I32 Number of Bankruptcy Proceedings Initiated - - - -
Households - - - -
I33 Household Debt to GDP - - - -
I34 Household Debt Service and Principal Payments to Income - - - -Market Liquidity
I35 Average Bid-Ask Spread in the Securities Market - - - -I36 Average Daily Turnover Ratio in the Securities Market - - - -
Real Estate MarketsI37 Residential Real Estate Prices - - - -
I38 Commercial Real Estate Prices - - - -
I39 Residential Real Estate Loans to Total Loans 24.4 25.7 26.1 24.1I40 Commercial Real Estate Loans to Total Loans 0.0 0.0 0.2 0.5
Core FSIs for Deposit Takers
Bhutan Core FSIs for Deposit Takers 2011 2014
- = not available, () = negative. Source: Financial Soundness Indicators of the International Monetary Fund 2015.

BIBLIOGRAPHY International Monetary Fund. 2015. Financial Soundness Indicators-Concepts and Definitions.
Washington, DC. http://fsi.imf.org/misc/FSI%20Concepts%20and%20Definitions.pdf Royal Monetary Authority. Laws and Regulations. Thimphu. http://www.rma.org.bt/laws_bylawstp2.jsp ————. (2005–2014). Annual Report. Thimphu. http://www.rma.org.bt/annualreporttp.jsp ————. (2005–2014). Financial Sector Performance Reviews. http://www.rma.org.bt/financial%20sector
%20performancetp.jsp World Bank. 2014. Doing Business 2015: Going Beyond Efficiency: Bhutan. Washington, DC. DOI:
10.1596/978-1-4648-0351-2. Available at: http://documents.worldbank.org/curated/en/2014/10/ 20342688/doing-business-2015-going-beyond-efficiency-bhutan
————. 2014. Bhutan - Fiscal Sustainability and Investment Climate Project. Washington, DC. (English).
http://documents.worldbank.org/curated/en/2014/08/20160277/bhutan-fiscal-sustainability -investment-climate-project
————. 2015. World Development Indicators Database. Available at: http://data.worldbank.org/data
-catalog/world-development-indicators
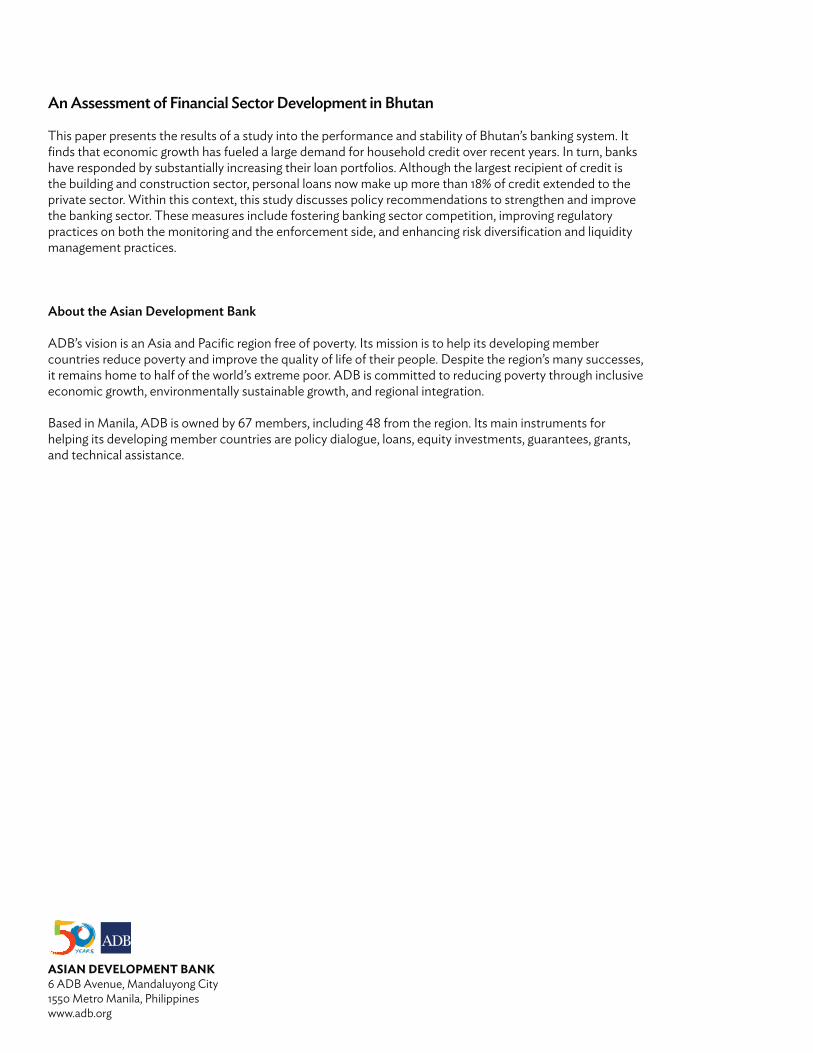
ASIAN DEVELOPMENT BANK6 ADB Avenue, Mandaluyong City1550 Metro Manila, Philippineswww.adb.org
An Assessment of Financial Sector Development in Bhutan
This paper presents the results of a study into the performance and stability of Bhutan’s banking system. It finds that economic growth has fueled a large demand for household credit over recent years. In turn, banks have responded by substantially increasing their loan portfolios. Although the largest recipient of credit is the building and construction sector, personal loans now make up more than 18% of credit extended to the private sector. Within this context, this study discusses policy recommendations to strengthen and improve the banking sector. These measures include fostering banking sector competition, improving regulatory practices on both the monitoring and the enforcement side, and enhancing risk diversification and liquidity management practices.
About the Asian Development Bank
ADB’s vision is an Asia and Pacific region free of poverty. Its mission is to help its developing member countries reduce poverty and improve the quality of life of their people. Despite the region’s many successes, it remains home to half of the world’s extreme poor. ADB is committed to reducing poverty through inclusive economic growth, environmentally sustainable growth, and regional integration.
Based in Manila, ADB is owned by 67 members, including 48 from the region. Its main instruments for helping its developing member countries are policy dialogue, loans, equity investments, guarantees, grants, and technical assistance.