Embed Size (px)
Citation preview

.
An Assessment of Home Renovation and Rehabilitation Needs of Older Adult Homeowners in Minnesota
Estimates of Need and Costs for Minnesota Housing and Minnesota Department of Human Services
D E C E M B E R 2 0 1 6
Prepared by: Cael Warren, Christin Lindberg, Madeleine Hansen, and Brian Pittman
Photo courtesy of Greater Metropolitan Housing Corporation

Home Renovation Needs of Older Adults Wilder Research, December 2016
Contents Summary ............................................................................................................................. 1
Introduction and background .............................................................................................. 3
Data sources and methods ................................................................................................... 5
Cost computation methodology .................................................................................... 5
Definition of home and community-based services (HCBS) ....................................... 6
Population covered in the study .................................................................................... 6
Findings............................................................................................................................... 7
How many extremely low-income older adult homeowner households have home rehabilitation or improvement work that is needed for them to age-in-place appropriately? ............................................................................................................... 7
How much will it cost to do this rehabilitation/improvement work? ......................... 11
How many of the older adult households that need home rehabilitation also have unmet home and community-based service needs? .................................................... 14
What are effective strategies for pairing home rehabilitation and in-home services to better serve older adults? ............................................................................................ 17
Cost comparison of home-based and facility-based strategies to meet older adults’ needs ........................................................................................................................... 20
Next steps .......................................................................................................................... 22
Appendix A – Consumer survey ....................................................................................... 24
Appendix B – Cost parameters and assumptions .............................................................. 53
Appendix C – Findings from existing data ....................................................................... 55
Appendix D – Data sources and methodological details .................................................. 63
Appendix E – Bibliography .............................................................................................. 70

Home Renovation Needs of Older Adults Wilder Research, December 2016
Figures
1. Geographic distribution of costs ................................................................................. 2
2. Age and geographic distribution of statewide eligible population and surveyed population ................................................................................................................... 6
3. Estimated counts of eligible households with home improvement needs (Only surveyed households with annual incomes below $24,000 per year) ......................... 8
4. Geographic distribution of households with home improvement needs ..................... 9
5. Detailed rates of self-reported home improvement needs for safety and accessibility (All surveyed households) .......................................................................................... 9
6. Detailed rates of self-reported home improvement needs for maintenance (All surveyed households) ................................................................................................ 10
7. Self-reported need for any improvements (All surveyed households) ..................... 10
8. Characteristics and condition of house (N=386 ± 3) (All surveyed households) ..... 11
9. Estimated household and statewide costs of needed home improvements (All surveyed households) ................................................................................................ 12
10. Geographic distribution of costs ............................................................................... 13
11. Projected home improvement costs .......................................................................... 14
12. Estimated rates of Home and Community-Based Service (HCBS) need among extremely-low-income households with home improvement needs ......................... 15
13. ADL difficulties among households with annual incomes below $24,000 .............. 16
14. Home and Community-Based Service (HCBS) needs among households with annual incomes below $24,000 ............................................................................................ 17
15. Comparison of Average Monthly Long-Term Care Costs ....................................... 21

Home Renovation Needs of Older Adults Wilder Research, December 2016
Acknowledgments The authors wish to thank John Patterson of Minnesota Housing Finance Agency for his guidance throughout this study.
We are grateful for the valuable feedback and insight provided by additional Minnesota Housing Finance Agency staff and representatives of partner agencies, including Krissi Hoffman (MHFA), Kari Benson (Minnesota Board on Aging), Miriam DeVaney (MN Department of Human Services), Rolf Hague (MN Department of Human Services), Jackie Peichel (MN Department of Human Services), Mark Schulz (Minnesota Board on Aging), Dawn Simonson (Metropolitan Area Agency on Aging), Diane Sprague (Lifetime Home Project), and Tony Sjogren (Rebuilding Together).
We also wish to thank the following individuals who agreed to be interviewed or contributed their expertise to the cost estimates for the study: Paul Soenneker and John Hott (Greater Metropolitan Housing Corporation), Beth Davies (Arrowhead Economic Opportunity Agency), Dave Kumm (Minnesota Valley Action), Ali Joens and Jesse Schott (Southwest Minnesota Housing Partnership), and Tony Sjogren (Rebuilding Together). The cost estimates presented in this study would have been impossible without the contributions of these knowledgeable experts in the home improvement field. We would also like to thank the following individuals who connected us with these experts: Barb Akerson (Arrowhead Economic Opportunity Agency), Carolyn Olson and Suzanne Snyder (Greater Metropolitan Housing Corporation), and Judd Schultz (Minnesota Valley Action).
Our deep thanks to the McKnight Foundation for their generous financial contributions to this research.
Finally, we appreciate the work of our colleagues at Wilder Research who assisted in the review of literature, study implementation, and reporting. Contributors include Jenny Bohlke, Cheryl Bourgeois, Jackie Campeau, Jennifer Collins, Marilyn Conrad, Phil Cooper, Amanda Eggers, Michelle Decker Gerrard, Hollis Henry, and Dan Swanson.

Home Renovation Needs of Older Adults 1 Wilder Research, December 2016
Summary In 2016, the Minnesota Housing Finance Agency (Minnesota Housing), with support from the McKnight Foundation, contracted with Wilder Research to conduct a study to identify the home improvement needs of extremely low-income older adult homeowners in Minnesota. As part of the study, Wilder Research also estimated the cost of making necessary improvements that would allow these older adults to continue living in their homes and thereby avoid more costly and restrictive settings such as assisted living or nursing home care. Wilder also investigated ways in which home rehabilitation can be paired with home and community-based services. Through multiple methods, including a survey of older adult homeowners, interviews with experts in the home improvement field, and review of studies conducted locally and nationally, Wilder Research staff were able to answer key questions identified by Minnesota Housing and the Minnesota Department of Human Services to help in planning efforts. Details of each key finding as well as study methods can be found in the full report.
How many extremely low-income older adult homeowner households have home rehabilitation or improvement work that is needed for them to age-in-place appropriately?
Estimate: 16,400 households (32% of households with extremely-low-income older adult homeowners) need home rehabilitation or improvement work in order for older adults to remain in their homes for the next five years. This includes 10,400 households in Greater Minnesota and 6,000 households in the 7-county metro area.
Additional information: An estimated 17,900 additional households (35%) say that their home is in need of improvements, although they feel they could remain in their homes for the next five years without them.
The following estimates apply to the 16,400 households that need rehabilitation or improvement work to stay in their homes for the next five years.
How much will it cost to do this rehabilitation or improvement work?
Estimate: $15,749 per household
Additional information: $258 million statewide per 5 years, including $164 million for Greater Minnesota and $94 million for the 7-County Metro Area (see Figure 1)
Projected statewide cost in 2040: approximately $438 million per 5 years

Home Renovation Needs of Older Adults 2 Wilder Research, December 2016
1. Geographic distribution of costs
Number of households with extremely-low-income older adult
homeowners
Households with home
improvement needs
Total statewide cost (typical) Lower bound Upper bound
Greater MN 32,548 10,400 $163,789,600 $126,578,400 $359,330,400
Metro 18,947 6,000 $94,494,000 $73,026,000 $207,306,000 Total 51,495 16,400 $258,283,600 $199,604,400 $566,636,400
Note: The estimates of the distribution of costs assume the same per-household costs and the same rate of need between greater Minnesota and the 7-county metro area.
How many of the older adult households that need home rehabilitation or improvement also have unmet home and community-based service needs? Estimate: 12,100 households
Additional information: an estimated 74 percent of extremely-low-income older adult households that have improvement needs in order to stay in their homes for the next five years, will also need some kind of home and community-based service (HCBS).
What are effective strategies for pairing home rehabilitation and in-home services to better serve older adults?
Studies of older adults show that meeting the individual needs of adults, and supporting their caregivers in addressing these needs, can allow them to remain in their homes and communities as long as possible. However, few studies have examined the effectiveness of programs that use an integrated approach to addressing low-income older adults’ desire to age in place. One promising model is The Community Aging in Place, Advancing Better Living for Elders (CAPABLE) program in Baltimore. This program applies a patient-directed and team-based intervention of a handyman, registered nurse, and occupational therapist who work with older adults to identify and address both their environmental housing and daily living needs. Minnesota has piloted three models that appear to have promising approaches. Further research and evaluation could demonstrate positive outcomes.
Cost comparison of home-based and facility-based strategies to meet older adults’ needs1 Estimated monthly cost of aging in place (home rehab and HCBS): $3,346
Assisted living monthly cost: $4,357
Skilled nursing facility monthly cost: $7,567
1 These cost estimates are necessarily oversimplified to present the typical cost of care in each setting, while the
true costs of care vary widely. The full report contains details of the assumptions underlying these estimates.

Home Renovation Needs of Older Adults 3 Wilder Research, December 2016
Introduction and background One of the important issues facing the nation today is our changing demographic profile and exponential growth in the older adult population. In the state of Minnesota, the population of those 65 and older will more than double by 2035. Older adults are also increasingly choosing to remain in their homes as long as possible, even with chronic conditions or disabilities. With a broad array of home and community-based services to help them live independently in the community as they age, older adults are able to avoid more costly and restrictive settings.
However, the ability of older adults to age in place is a complex issue, and reduced financial resources may further complicate their living situations. Lower-income older adults may spend disproportionately on housing, thereby reducing financial resources available for other necessities, including food, medicine, and services that can increase the potential for older adults to remain at home. Lack of these resources can in turn jeopardize well-being and increase the likelihood of institutionalization. Increasing frailty and accumulating functional limitations may also make it difficult to maintain a home. The needs of older adults who are both housing cost-burdened and who may require long-term care services and supports as a result of chronic health conditions or disabilities is likely to increase. This will make demands on service systems throughout the state.
Housing that is not designed to accommodate the physical needs of older adults with accessible or adaptable supports can further impede older adults’ ability to live safely and independently. Adapting living space via structural changes or assistive devices is an important first response in helping older adults to live independently for as long as possible. Rising health care costs and the increased incidence of chronic conditions that result in functional limitations among older adults demonstrate the need for innovations that are designed to integrate resources.
Minnesota Housing’s Rehabilitation Loan Program serves extremely low-income older adult homeowners, providing interest-free, deferred loans to homeowners to make health, safety, accessibility, and energy efficiency improvements to their homes. Eligible improvements include:
Safety and accessibility updates (e.g., ramps, railings, first floor accommodations)
Electrical wiring
Furnace/boiler repair or replacement
Plumbing repairs

Home Renovation Needs of Older Adults 4 Wilder Research, December 2016
Well and septic repair or replacement
Mold remediation
Windows
Siding
Roof repair or replacement
Addressing lead paint hazards
In 2016, Minnesota Housing Finance Agency (Minnesota Housing), with support from the McKnight Foundation, contracted with Wilder Research to conduct a study to better understand the home rehabilitation/improvement and service needs of extremely low-income older adult homeowners who want and are capable of aging-in-place.
In order to make well-informed funding decisions and help Minnesota Housing and Minnesota Department of Human Services (DHS) leaders and their partners understand the scope of the needs of extremely low-income older adults to remain in their homes, the study was designed to address the following main questions:
How many extremely low-income older adult homeowner households have home rehabilitation or improvement work that is needed for them to age-in-place appropriately?
How much will it cost annually to do this rehabilitation or improvement work?
How many of the older adult households that need home rehabilitation or improvement also have home and community-based service needs?
What are effective strategies for pairing home rehabilitation and in-home services to better serve older adults?
This report includes four sections. The first section provides information about the data sources and methodologies used for the study. The second section presents findings from the four components of the study. The third section outlines issues to consider, based on the findings. The Appendices contain the data tables for the homeowner survey, cost parameters explanation, data from secondary sources, and a full bibliography of references.

Home Renovation Needs of Older Adults 5 Wilder Research, December 2016
Data sources and methods This study gathered information and results from a diverse range of existing national and statewide sources, as well as the perspectives and opinions of experts in the field and homeowners. The four main sources of information and data included:
Survey of low-income older adult homeowners
Interviews with key experts in the home improvement field
Review of existing literature on home rehabilitation and community-based services
Analysis of existing data sources
Each of these sources is described in detail in Appendix D.
Cost computation methodology
The per-household home improvement cost was computed as the sum of the costs of all improvements that homeowners reported would be necessary in their home within the next five years. This computation requires two elements:
A list of the improvements that the household said they will need within the next five years.
A cost estimate for each of the listed improvements.
After gathering information on each household’s home improvement needs and the approximate cost of each of the improvements, we computed the total home improvement cost for each household. This cost was computed as the sum of the costs for all home improvements reported as necessary for that household within the next five years. For example, for a household that indicated that they would need new windows, a shower at floor level, and a main floor laundry, the “typical” cost estimate for that household would be ($6,803 + $3,598 + $3,675 = ) $14,076. Finally, the average per-household cost was computed as the simple average of these individual household cost estimates (excluding households that did not indicate a need for any of the listed improvements).
These methods are discussed in greater detail in Appendix D.

Home Renovation Needs of Older Adults 6 Wilder Research, December 2016
Definition of home and community-based services (HCBS)
AARP defines HCBS as “assistance with daily activities that generally helps older adults and people with disabilities to remain in their homes. Many people with functional limitations or cognitive impairments need assistance with activities of daily living (ADLs) such as bathing, dressing, and using the toilet, or instrumental activities of daily living (IADLs) such as shopping, managing money or medications, and doing laundry… Services such as personal care, chore assistance, transportation, congregate meals, or adult day services all constitute HCBS.”2
Population covered in the study
In this study, “eligible households” refers to Minnesota households who:
Own their home.
Have a household head that is 65 or older.
Qualify for Minnesota Housing’s Rehabilitation Loan Program and Emergency & Accessibility Loan Program based on income.
Based on Integrated Public Use Microdata Series (IPUMS) data from the U.S. Census Bureau’s American Community Survey (2014), there are approximately 51,495 households in Minnesota that meet these criteria. Their distributions of age and geography are shown in Figure 2 below, alongside those of the respondent population of the consumer survey. The age distribution of the survey respondent population aligns very closely with that of the overall eligible population, while the survey over-represents Greater Minnesota and under-represents the 7-county metro area.
2. Age and geographic distribution of statewide eligible population and surveyed population
Age Percentage of
surveyed population Percentage of
statewide eligible population
65-74 39% 43%
75-84 41% 35%
85+ 20% 21%
Location
Greater MN 79% 63%
7-County Metro 21% 37%
2 Retrieved from Home and Community-Based Long-Term Services and Supports for Older People, AARP
Public Policy Institute Fact Sheet. https://assets.aarp.org/rgcenter/ppi/ltc/fs222-health.pdf

Home Renovation Needs of Older Adults 7 Wilder Research, December 2016
Findings Wilder Research completed a study for Minnesota Housing to better understand what extremely-low-income older adults in Minnesota need to remain in their homes. This section of the report expands on key findings related to four evaluation questions.
How many extremely low-income older adult homeowner households have home rehabilitation or improvement work that is needed for them to age-in-place appropriately?
How much will it cost to do this rehabilitation or improvement work?
How many of the older adult households that need home rehabilitation or improvement also have home and community-based service needs?
What are effective strategies for pairing home rehabilitation and in-home services to better serve older adults?
How many extremely low-income older adult homeowner households have home rehabilitation or improvement work that is needed for them to age-in-place appropriately?
Estimates: 16,400 households in total
− Greater Minnesota (outside the 7-county metro area): 10,400 households
− 7-county metro area: 6,000 households
Supporting data
We estimate that approximately 16,400 older adult households in Minnesota need at least one of the 16 home improvements asked about in the consumer survey in order to remain in their homes for the next five years.3 These households comprise about one-third (32%) of the estimated 51,495 older adult (age 65+) households in Minnesota that meet the income requirements for Minnesota Housing’s Rehabilitation Loan Program and Emergency & Accessibility Loan Program (Figure 3).
3 This estimate is based on two figures: (1) an estimate of the total eligible population in the state of
Minnesota, derived from Census microdata as described in the methods section, multiplied by (2) the proportion of surveyed older adult households that reported needing home improvements in order to remain in their homes for the next five years. Details are described in the methods section.

Home Renovation Needs of Older Adults 8 Wilder Research, December 2016
Survey respondents were asked whether their home would need specific improvements related to maintenance, safety and accessibility during the next five years. They were also asked whether or not they thought they could remain in their homes for the next five years, with or without such improvements.4 Almost two-thirds of eligible households (62%) reported that although they could remain in their homes for the next five years without making modifications or repairs, they also felt that their homes would need at least one of the improvements listed in the next five years. 5 This may indicate that the needed improvements are unrelated to health or mobility, or that they are not so severe or urgent that they would impact the homeowner’s ability to continue living in the home.
Three percent of households said that their homes needed at least one improvement but that, even with improvements, they would be unable to remain in the home for the next five years. In this case, homeowners may have felt that their inability to continue living in the home was unrelated to the home’s condition or attributable to other factors.
3. Estimated counts of eligible households with home improvement needs (Only surveyed households with annual incomes below $24,000 per year)
Will need improvements to remain in home for the next five years
Percentage of surveyed population
(N=144)
Estimated statewide count of households
Needs at least one listed improvement 31.9% 16,400
None of the listed improvements are needed 3.5% 1,800
Can remain in home for the next five years without improvements
Needs at least one listed improvement, which is not required to stay in the home 34.7% 17,900
None of the listed improvements are needed 27.1% 14,000
Cannot remain in home for the next five years, even with improvements
Needs at least one listed improvement 2.8% 1,400
None of the listed improvements are needed - -
Total eligible households in Minnesotaa 51,495b
a Eligible households are defined as those eligible for Minnesota Housing’s Rehabilitation Loan Program and Emergency & Accessibility Loan Program (income cut points in effect from 5/31/16), with household head that is a homeowner age 65+ b Disaggregated counts do not precisely sum to total due to rounding.
4 The full consumer survey instrument is provided at the end of Appendix A. 5 These home improvements and their estimated costs are listed in Figure B1 in Appendix B. The 16 listed
items fall into two general categories: safety and accessibility (e.g., entrance ramp, grab bars and handrails, etc.) and maintenance (e.g., replacement of roof, furnace, windows, etc.).

Home Renovation Needs of Older Adults 9 Wilder Research, December 2016
4. Geographic distribution of households with home improvement needs
Estimated eligible population
Estimated count of households
with home improvement needs to stay in the home
Greater Minnesota 32,548 10,400
7-County Metro 18,947 6,000
Total eligible households 51,495 16,400
Note: Rates of home improvement need are assumed to be the same between the 7-county metro area and greater MN. Survey results indicate a slightly higher rate of need among greater Minnesota households, but the difference was not statistically significant.
Consumer survey respondents were more likely to report needing maintenance work (54%) rather than safety or accessibility improvements (43%; Figure 7). The maintenance work that was most often needed was a new water heater (27%) or new windows (25%; Figure 6). The safety and accessibility improvements that were most often needed were grab bars or hand rails (21%) and a shower at floor level (20%; Figure 5).
5. Detailed rates of self-reported home improvement needs for safety and accessibility (All surveyed households)
Safety and accessibility N Will need this Already
have this
Do not think we will
need this
Install grab bar or hand rail 366 21% 39% 41%
Shower at floor level* 364 20% 31% 49%
Main floor laundry* 369 14% 40% 46%
Lever door handles 371 13% 33% 53%
Wider doorways for a wheelchair or walker 362 11% 24% 66%
Entrance ramp* 366 10% 8% 82%
Install stair railing 361 8% 65% 28%
Non-slip or level flooring* 370 7% 54% 39%
Lower kitchen cabinets and counters for wheelchair accessibility* 368 5% 7% 88%
Bathroom on main floor* 375 4% 81% 16%
Elevator* 368 2% 2% 97%
* High cost item Note: Totals may not equal 100% due to rounding.

Home Renovation Needs of Older Adults 10 Wilder Research, December 2016
6. Detailed rates of self-reported home improvement needs for maintenance (All surveyed households)
N Will need this Already
have this
Do not think we will
need this
New water heater 375 27% 41% 33%
New windows* 374 25% 40% 35%
New roof* 378 21% 55% 24%
New central air conditioner 374 20% 33% 47%
New furnace or boiler* 368 18% 44% 38%
* High cost item Note: Totals may not equal 100% due to rounding.
7. Self-reported need for any improvements (All surveyed households)
Will need this
Any safety or accessibility item 43%
Any maintenance item 54%
Any improvement 65%
Any high-cost improvement (est. $3000+) 53%
It is important to note that self-reported needs, particularly related to safety and accessibility, are likely underreported due to respondent optimism about their future health and mobility. For this reason, the survey question distinguished between respondents who have already made these improvements to their homes in preparation for aging and those who believe they will not need the improvements.

Home Renovation Needs of Older Adults 11 Wilder Research, December 2016
Figure 8 presents several characteristics of respondents’ homes that might indicate the level of need for certain home improvements. For example, most households have at least one step up to enter their home, and more than one-quarter (27%) have four or more steps, a likely indication of need for entrance ramps. Half of households have no main-floor laundry facilities, and 12 percent have no bedroom on their main floor.
8. Characteristics and condition of house (N=386 ± 3) (All surveyed households)
House has four or more steps to enter home 27%
House has one to three steps to enter home 56%
House has more than one story of living space 46%
House does not have a bedroom on the main floor 12%
House does not have laundry on the main floor 53%
House is in poor or very poor condition 8%
Average age of house (based on year house was built) 58 years
How much will it cost to do this rehabilitation/improvement work?
Estimates: $15,749 per household
− Statewide (per 5 years): $258 million
− Greater MN: $164 million
− 7-County Metro Area: $94 million
− Projected statewide cost in 2040: approximately $438 million (per 5 years)
Estimate range: $12,171 - $34,551 per household, approximately $200 million - $567 million statewide
Supporting data
Home improvement needs are expected to cost $15,749 per household for the 16,400 households in need, totaling approximately $258 million to enable these households to remain in their homes for the next five years (Figure 9). This typical cost was computed by first summing the total estimated cost for each household (using the typical cost parameters identified in the key stakeholder interviews, combined with whether the household indicated that they would need each home improvement listed in the survey), and then taking the average across household who reported needing any of the listed

Home Renovation Needs of Older Adults 12 Wilder Research, December 2016
home improvements in the next five years.6 The details of the cost computations are described in Appendix D.
Just over half of this cost (56%) goes to maintenance needs (new roof, furnace, etc.), while the remainder is needed for safety and accessibility improvements like an entrance ramp and widened doorways for a wheelchair. The full list of improvements and their corresponding cost assumptions are shown in Figure B1 in Appendix B, while the details of this cost breakdown are shown in Figure B2 in Appendix B.
9. Estimated household and statewide costs of needed home improvements (All surveyed households)
Typical cost Lower bound cost Upper bound cost
Cost per
household
Total statewide
cost Cost per
household
Total statewide
cost Cost per
household
Total statewide
cost
Will need at least one listed improvement to remain in home for the next five years
$15,749 $258,283,600 $12,171 $199,604,400 $34,551 $566,636,400
Could remain in home with no improvements, but home will need improvements in next five years
$8,456 $151,356,875 $6,696 $119,856,212 $18,721 $335,108,979
Cannot remain in home even with improvements, but home needs improvements in next five years
$12,180 $17,052,595 $9,315 $13,041,467 $26,557 $37,179,100
6 While the per-household cost estimates in Figure 9 are based on the full surveyed population, the total
statewide costs in the figure are computed using the rate of need among the lowest-income subset (i.e., to compute the statewide totals, the per-household cost from the full surveyed population was multiplied by the household count that was derived using the lowest-income subset, the household count shown in Figure 3). We opted for this approach because the full surveyed population provides a larger sample size to better represent the diversity in home improvement needs. This approach does, however, result in slightly lower cost estimates than would be found if the estimate were based on the costs of meeting improvement needs of the lowest-income subset.

Home Renovation Needs of Older Adults 13 Wilder Research, December 2016
The costs of any given home improvement project can vary widely from one house to the next. To account for this variation, upper and lower bound estimates are presented in addition to the estimated typical cost. The lower-bound estimate of $12,171 per household represents the best-case scenario, with all homes requiring only the low-cost version of each improvement (generally meaning small homes with convenient circumstances requiring no customized approaches or abatement of lead or asbestos). In this best-case scenario, the total statewide cost is approximately $199.6 million to enable this group of households to remain in their homes for the next five years.
On the other hand, key stakeholders noted that maintenance tends to be lacking in the homes of many extremely low-income older adults, leading to higher costs for many routine tasks as other problems often surface after work begins. In particular, asbestos and lead abatement costs are relatively common and quite large when encountered. As a result, while the upper bound cost ($34,551 per household) will certainly not be required for every household, the true total statewide cost is likely to fall between the typical and upper bound estimates.
While this report focuses on eligible households who indicated that they require home improvements in order to remain living in their homes for the next five years, many other households noted their need for home improvements as well. In particular, 35 percent of households reported being able to remain in their homes for the next five years without home improvements, but also indicated that their household would need one or more of the listed improvements in the next five years (Figure 3). The typical cost of the needed improvements for these households is $8,456 (Figure 9).
Figure 10 presents the geographic distribution of home improvement costs between Greater Minnesota and the 7-county metro area. Because greater Minnesota contains nearly two-thirds of eligible households, the estimated cost to meet the home improvement needs of the extremely low-income older adult population in greater Minnesota is approximately $164 million over five years, compared to $94 million to serve the metro area population.
10. Geographic distribution of costs
Eligible households
Households with home improvement needs
to stay five years Total statewide cost (typical) Lower bound Upper bound
Greater MN 32,548 10,400 $163,789,600 $126,578,400 $359,330,400
Metro 18,947 6,000 $94,494,000 $73,026,000 $207,306,000
Total 51,495 16,400 $258,283,600 $199,604,400 $566,636,400
Note: The estimates of the distribution of costs assume the same per-household costs and the same rate of need between greater Minnesota and the 7-county metro area.

Home Renovation Needs of Older Adults 14 Wilder Research, December 2016
Based on current population growth projections for the population age 65+ and assuming a constant per-household home improvement cost, the statewide five-year costs of meeting these home improvement needs is expected to rise steadily to about $438 million by 2040 (Figure 11). Because these costs cover a five-year period, the next set of five-year costs listed in the table is on top of the costs from the previous five-year period. A whole new set of older adults will have rehabilitation needs, or additional rehabilitation may be needed.
11. Projected home improvement costs
Eligible households
Households with home
improvement needs
Total statewide cost (per 5 years)
2020 63,760 20,300 $319,704,700
2025 74,725 23,800 $374,826,200
2030 83,370 26,600 $418,923,400
2035 86,949 27,700 $436,247,300
2040 87,203 27,800 $437,822,200
Note: The mean cost per household (expressed in 2016 dollars) and the proportion of the eligible older adult population are assumed to remain constant, while the household count is inflated based on projected growth of the population of adults age 65+ (Minnesota Compass, http://www.mncompass.org/aging/demographics#1-11581-d). The assumption of constant per-household cost over time implies that, in each five-year period, the home improvement needs of the population aging into the 65+ age group will be comparable to those of the current population, and that new home improvement needs will arise among the current population to replace the needs that are met by funds allocated during the previous period.
How many of the older adult households that need home rehabilitation also have unmet home and community-based service needs?
Estimate: 12,100 households
Supporting data
The need for home and community-based services (HCBS) varies widely across groups of survey respondents. To examine these differences, first note that the surveyed households with home improvement needs fall into three categories based on how their home improvement needs relate to their ability to stay in their housing (Figure 12):
Households who reported that home improvements would be necessary in order for them to remain in their homes for the next five years (32%) are more likely than the others to have an unmet HCBS needs (74%). Based on this finding, we estimate that 12,100 households in Minnesota would need both home improvements and HCBS to age in place.

Home Renovation Needs of Older Adults 15 Wilder Research, December 2016
Households who reported that they could live in their homes for the next five years even without home improvements, but also indicated that their home would need improvements (35%) also reported unmet HCBS needs one-half of the time (50%). Based on this finding, we estimate that 9,000 households in Minnesota might be able to continue living in their house with only HCBS.
Households who reported that they could not remain in their homes for the next five years even with improvements, but who reported that their home would need improvements within the next five years (3%) also reported unmet HCBS needs one-half of the time (50%). Based on this finding, we estimate that 700 households in Minnesota would require improvements and HCBS, and still would not be able to age in place.
12. Estimated rates of Home and Community-Based Service (HCBS) need among extremely-low-income households with home improvement needs
Estimated count of households with home
improvement needs
Percentage with at least one unmet
HCBS need a
Estimated count of households with
both home improvement and
unmet HCBS needs
Will need at least one listed improvement to remain in home for the next five years 16,400 74% 12,100
Could remain in home with no improvements, but home will need improvements in next five years 17,900 50% 9,000
Cannot remain in home even with improvements, but home needs improvements in next five years 1,400 50% 700
a The percentage with at least one unmet HCBS need is based on households that need at least one of the home improvements addressed in the survey (and need them in order to remain in their homes for five years), and have annual incomes below $24,000 per year (the same population on which the estimated count of households with home improvement needs is based).
Of surveyed households with annual incomes below $24,000, one in five households said someone in their household has difficulty with at least one of the four Activities of Daily Living (ADLs) addressed in the survey, including 17 percent who have difficulty going up or down stairs and 15 percent who have difficulty leaving home to shop or visit the doctor (Figure 13). These rates of difficulty are higher among those who will need home modifications in order to remain in their homes for the next five years, with 35 percent of these households expressing difficulty with at least one ADL on the survey.

Home Renovation Needs of Older Adults 16 Wilder Research, December 2016
13. ADL difficulties among households with annual incomes below $24,000 (N=143-144)
At least one adult in household has difficulty or needs help with…
Could remain in home for five years with no
modifications (N=88-89)
Will need home modifications to remain in
home for the next five years) (N=50-51)
Total (N=143-144)
Getting in and out of bed or a chair 2% 10% 5%
Going up or down stairs 8% 28% 17%
Getting around inside the home 3% 6% 4%
Going outside the home to shop or visit a doctor's office 6% 27% 15%
At least one of the items above 12% 35% 22%
Note: The rates of ADL difficulties are not shown for households who stated that they could not remain in their homes for the next five years (even with modifications) because there were fewer than 10 households in that group. These households are included in the total column.
Two-thirds (68%) of surveyed households with annual incomes below $24,000 reported either needing or receiving at least one of the home and community-based services (HCBS) covered in the survey. Almost one in three (29%) said they receive some kind of HCBS and nearly half (47%) said they need at least one HCBS that they are not currently receiving (Figure 14). The most common HCBS needed and received was help with home repairs and maintenance, a service received by 22 percent of households but needed by another 42 percent of households. About one in 10 households also receive help with light housekeeping and transportation, while another one in 10 households need those services.
Rates of HCBS use are highest among households who said they could remain in their homes for the next five years with no modifications, and rates of unmet HCBS need are highest among households who said they would need home modifications to remain in their homes. Aside from their significant need for help with home improvements (reported by 63% of the households who need home modifications to remain in their homes), these households also reported relatively high levels of unmet need for help with light housekeeping (16%), transportation (16%), and a home health aide (10%).

Home Renovation Needs of Older Adults 17 Wilder Research, December 2016
14. Home and Community-Based Service (HCBS) needs among households with annual incomes below $24,000 (N=139-142)
Could remain in home for five years with no
modifications (N=86-89)
Will need home modifications to
remain in home for the next five years)
(N=49-51) Total
(N=139-142)
At least one adult in household gets or needs help with…
Get this help
Need this help
Get this help
Need this help
Get this help
Need this help
Meals that are brought to your home or prepared for you 3% - 4% 6% 5% 2%
Help with light housekeeping or cleaning 11% 8% 6% 16% 11% 11%
Home repairs or maintenance 24% 31% 16% 63% 22% 42%
Help with bathing or getting dressed or using the toilet 2% 1% 2% 6% 3% 3%
Rides to appointments or errands 10% 7% 10% 16% 11% 11%
Health worker (aide, nurse, etc.) who comes to your home to help with medical needs 2% - 6% 10% 4% 4%
At least one of the items above 30% 35% b 24% 67%b 29%a 47%a
a Because any given household could simultaneously receive one HCBS while having an unmet need for another, the total (met and unmet) need for HCBS is slightly less than the sum of these two figures; a total of 68 percent of households (with annual income below $24,000) receive and/or need HCBS.
b Rates of overall HCBS needs presented here differ from those presented in Figure 12 because Figure 12 is limited to respondents that stated a need for one or more of the specific home improvement items on the survey (questions 8 & 9, shown in Appendix A). The data presented in this figure are based only on their HCBS needs and the respondents’ stated ability to remain in their homes for the next five years, with or without modifications (question 13), even if they did not indicate a need for any of the specific home improvements addressed in survey questions 8 and 9.
What are effective strategies for pairing home rehabilitation and in-home services to better serve older adults?
Wilder Research conducted a review of the literature to find evidence of effective models for pairing home rehabilitation and in-home services for older adults. Older adults’ desire to age in place, the barriers created by difficulties with activities of daily living (ADLs), and the importance of home and community-based services for older adults are well documented in current literature, but as distinct issues. Numerous articles also discussed the need for integrated approaches, but there were very few that highlighted specific models with evidence of improved outcomes.
Recently, Minnesota has piloted three models that appear to have promising approaches. These, as well as one Baltimore-area model that has shown some preliminary evidence, are described below.

Home Renovation Needs of Older Adults 18 Wilder Research, December 2016
Rebuilding Together Twin Cities (RTTC)7
In 2014, the Minnesota Department of Human Services funded a two year pilot project that completed accessibility modifications to the homes of 12 low-income older adults. The main objective was to pair occupational therapy interventions with home safety modifications to extend the ability of older adults to age in place.
The results appear promising. One assessment tool, The Live Well at Home Rapid Screen, measured the likelihood that an older adult will be forced to move to a long term care facility in the near future. Before implementation of the Rebuilding Together initiative, clients received an average score of 4, which indicated a high risk of moving. After implementation of the initiative, these clients’ scores decreased to an average of less than 2, which indicated a low to moderate risk. Clients also reported less anxiety about falling, fewer activities for which they required assistance, and more support from caregivers. Caregivers also reported that they felt less stressed.
RTTC is expecting that assessment tools and protocols may be replicated by additional national Rebuilding Together affiliates. Expanded interventions and further study could reveal additional quantitative and qualitative outcomes, especially considering the small number of households that were included in the initial pilot
Mahube-Otwa Community Action Partnership8
The Minnesota Department of Human Services funded a demonstration project implemented through Mahube-Otwa (in Mahnomen, Hubbard, Becker, Otter Tail, and Wadena counties) with the goal of providing ongoing homemaking/chore or one-time home repair/remodel assistance to low-income older adults living in rural Minnesota. This Live Well at Home grant-funded project began in 2015.
Repair and remodel services included larger roofing repairs, appliance repairs or replacements, septic tanks, and wells. Smaller home repairs for health and safety included steps, grab bars, entrance ramps, windows and doors.
Limited outcome information is available at this time, as the project is still in its early stages. The most recently available service data indicates that among clients aged 65 and older, 53 have received homemaker services and 36 have received home repair services. Program staff report that interventions have allowed older adults to remain in their homes for as long as possible, and that consumer feedback has been positive. A comprehensive evaluation and analysis of program data could demonstrate promising practices and positive outcomes.
7 Results and program information provided by MN DHS staff 8 Ibid.

Home Renovation Needs of Older Adults 19 Wilder Research, December 2016
Sustainable Resources Center (SRC)9
Funded through a Live Well at Home grant, SRC has implemented a program that uses HUD’s Healthy Homes Rating System risk assessment, a weatherization audit, and universal design assessments for a “whole house” approach to health risks and safety for low-income older adults in Hennepin County, as well as the Live Well at Home Rapid Screen. The goal of the program is to “account [for] the full range of factors that allow for successful aging in place, (SRC-Attachment A),” and complete repairs and modifications in order to create safe and comfortable homes for 120 older adults. The program was first implemented for two years, beginning in July 2014, with a subsequent contract to expand upon this work in 2016.
Preliminary and follow-up interviews were completed with consumers to assess their subjective perceptions of benefit from the intervention. Housing inspections to assess the work were also completed. Early results indicate that consumers are satisfied with the quality of the work and believe that the modifications help them live more safely and comfortably. According to notes in a quarterly report, program staff stated that “…we are learning that a little goes a long way. Having grab bars, railings, proper lighting and higher toilets do have an actual impact on our clients’ actual and perceived safety (Quarter 4: 4/1 to 6/30).” It will be important to evaluate the effectiveness of this approach to determine whether hoped for outcomes are achieved.
CAPABLE
One promising national model provides structured services for older adults in a holistic way. Community Aging in Place, Advancing Better Living for Elders (CAPABLE), is currently being tested in Baltimore by John Hopkins and is funded by the Centers for Medicare and Medicaid Services (CMS) Innovation Center. The model involves the team-based intervention of a handyman, registered nurse, and occupational therapist (OT) who work together with low-income older adults to identify and address their functional needs. Successfully aging in place requires that both the environmental housing needs and the daily living needs of the individual be managed. Innovative aspects of this model include a patient-directed approach, and expanding care beyond a purely clinical or medical approach.
The model allows up to $1,300 per household on home modifications and includes up to 10 home sessions (four by the nurse and six with the OT) over the course of five months. The sessions help identify functional challenges, and participants create goals to drive the interventions.
9 Results and program information provided by MN DHS staff.

Home Renovation Needs of Older Adults 20 Wilder Research, December 2016
Early results indicated that older adults showed improvement in their daily functioning, as well as a reduction in the total numbers of difficulties related to ADLs. Additionally, older adults reported reduced depressive symptoms, and researchers noted a reduction in the numbers of home hazards. It is unclear the extent to which the per household funding provides a return on investment, but researchers determined that the program likely saves on health care expenses by redirecting expenditures in the home environment. Further study could result in a clearer picture of the overall cost savings (Szanton, 2015).10
Cost comparison of home-based and facility-based strategies to meet older adults’ needs
Estimated Monthly costs:
− Skilled nursing facility: $7,567
− Assisted living: $4,357
− Aging in place (home rehab combined with HCBS): $3,346
Supporting data
The combined monthly costs of housing, home improvements, and home and community-based services associated with aging in place sum to an estimated $3,346. This estimate includes $263 per month for the typical home improvements costs (spread over five years), $399 in housing costs (property taxes, insurance, and utilities, assuming mortgage is paid off 11), and $2,684 for fairly intensive, in-home health services (Figure 15). The monthly costs of facility-based care are significantly higher, from $4,357 for assisted living to $7,567 for skilled nursing home care.12
10 Szanton, S. L., Wolff, J. L., Leff, B., Roberts, L., Thorpe, R. J., Tanner, E. K., … Gitlin, L. N. (2015).
Preliminary data from Community Aging in Place, Advancing Better Living for Elders, a patient‐directed, team‐based intervention to improve physical function and decrease nursing home utilization: The first 100 individuals to complete a Centers for Medicare and Medicaid Services innovation project. Journal of the American Geriatrics Society, 63(2), 371–374
11 This average housing cost estimate may be low as some homeowners over the age of 65 may not have paid off their mortgage.
12 It is important to note two significant caveats to this analysis. First, the home improvement costs are borne up front (by the state), with no guarantee that the homeowner will remain in the home for the full five years that are assumed in computing the monthly home improvement costs. Still, if the resident remains in their home for a minimum of 13 months after the home improvements are funded, the total monthly cost of housing, home care, and home improvements would still be less than those of assisted living. ($15,749/13 = $1211/month, plus $399 for housing and $2,684 for home care, = $4,294/month.) Second, while a large portion of the costs of aging in place can be shared among two or more residents, the facility costs are for one person only. The cost savings of aging in place would therefore be even larger for multi-resident households.

Home Renovation Needs of Older Adults 21 Wilder Research, December 2016
15. Comparison of Average Monthly Long-Term Care Costs
Setting Monthly Average
Cost (MN Statewide) Monthly Average
Cost (Metro) Assisted Livinga $4,357 $4,597
Nursing Homeb $7,567 $7,787
Aging in Place (Total) $3,346 $2,988
Home Care (Home Health Aide)c $2,684 $2,326
Home improvements $263 $263
Housing costsd $399 $399
Notes. All figures are based on MetLife study, with 2012 figures adjusted for inflation to 2015 US Dollars. Due to data limitations, housing costs and improvement costs are assumed to be the same between the metro and statewide estimates. Monthly home improvement costs are based on the estimate of $15,749 (Figure 9) distributed evenly over 5 years (60 months). The home care estimate is based on the costs of a home health aide, the most intensive (and expensive) service of home care, for 20 hours per week. a Cost includes average monthly assisted living base rate (specific to MN statewide and Twin Cities metro), plus the national average monthly cost of a limited set of services. These services include: assistance with bathing ($187), dressing ($244), other personal care ($520), and medication management ($358). b Average monthly cost for nursing home private room. A semi-private room would reduce this cost by approximately 7 percent. c Home care cost assumes services for 20 hours per week. Note that this cost does not include the cost of services provided for free by family members, friends, and neighbors. These costs rarely factor into economic modeling due to the difficulty of quantifying them, but in the case of high-need residents, they can be quite substantial. d Median monthly housing costs (property taxes, insurance, utilities) for a Minnesota homeowner age 65+ with an annual income of $20,600 or less who has paid off their mortgage, computed by Minnesota Housing Finance Agency using ACS 2014 microdata (5-yr sample)
To provide a single cost estimate for any of these housing and service arrangements is to oversimplify a very complex issue, as the costs of each arrangement will vary greatly across providers and across residents based on their specific needs. In order to provide a useful cost comparison between aging in place and assisted living, these estimates aim to represent the cost of similar levels of care in each of these two settings. The assisted living cost includes the average monthly assisted living base rate, in addition to the average monthly service fees for medication management, as well as assistance with bathing, dressing, and other personal care. The in-home care cost assumes a home health aide for 20 hours per week, and this aide is assumed to provide these personal care and medication management services (most likely in addition to other services). The costs of in-home care could be much higher for a high-needs client, while the costs of assisted living could be much lower (a statewide base rate of $3,048) for someone who does not require these additional services. As a result, aging in place may be most cost-effective for residents with relatively few service needs, while a group care setting may be most cost-effective for high-need residents.

Home Renovation Needs of Older Adults 22 Wilder Research, December 2016
Next steps This study suggests that there is value in providing home rehabilitation or renovations for extremely low-income older adult households to help delay a move to more costly and restrictive settings, such as assisted living or skilled nursing facilities. The input from homeowners and key experts shows that there is a need for, and interest in, housing that can accommodate the needs of older adults as they age. There are few integrative models that have been studied for evidence of the effectiveness of a holistic approach. However, in order to support older adults in staying in their homes as long as possible, state and local agencies need greater inter-agency and inter-sector collaboration, blended funding, and individualized planning to connect homeowners with home modifications that are integrated with home and community-based supports.
The following are issues to consider when determining next steps.
Cross-systems collaboration and innovative approaches
Staff from Minnesota Housing and Minnesota Department of Human Services identified the needs related to low-income older adults as a priority, due to the growth that is expected in this population over the next decade. These agencies have initiated the process of exploring strategies to meet the range of housing and service needs for older adults.
Possible approaches:
Increase inter-agency partnerships such as the Rebuilding Together Twin Cities, Mahube-Otwa (Mahnomen, Hubbard, Becker, Otter Tail, and Wadena counties) Community Action Partnership, and Sustainable Resources Center that expand innovative practices, help to identify and avoid duplication of efforts, and contribute greater cost efficiencies. Supporting and replicating these efforts may strengthen the response to the growth in need over the next decade.
Develop an assessment for older adult homeowners that identifies their housing, health, and HCBS needs, as well as strengths related to family and community supports that are in place. This assessment can be used by older adults and their families to help guide decisions and choices related to their housing.
Develop a pre-home-rehabilitation counseling protocol to help homeowners create a plan that realistically matches their immediate and upcoming health-related needs with the most beneficial home modification intervention. For some homeowners with substantial care needs, it may not be feasible to address those needs in their current housing. However, for many, an individualized housing and service plan developed in

Home Renovation Needs of Older Adults 23 Wilder Research, December 2016
a pre-home-rehabilitation counseling session may help them stay in their homes with appropriate supports.
Fund and evaluate innovative pilot programs that are designed to address the housing and service needs of older adults, in order to understand the level of support needed to produce good outcomes and which interventions work well for older adults with differing characteristics (examining outcomes based on levels of health-related needs and/or support from friends and family).
Create ways to share results and best practices from innovative approaches more widely.
Research
The current literature contains very little evidence of outcomes related to programs that connect interventions related to aging in place, home and community-based services, and housing; this is a topic ripe for further exploration.
This limited-scope study could only present broadly generalized cost estimates for facility-based care options and in-home care. The complexity and nuances involved in selecting the most appropriate and cost-effective housing and care plan for each household are not yet well documented in the literature. Documenting these would provide policy and decision-makers the tools to effectively deploy public and private resources.
Capacity Building
While cross-systems collaboration and innovation will be important, basic capacity building will also be critical. This assessment documents the very large and rapidly increasing need to support extremely-low-income older adult homeowners in Minnesota as they age in place. Building capacity of providers will be important to effectively deliver home rehabilitation and HCBS.
Home Renovation Needs of Older Adults 24 Wilder Research, December 2016
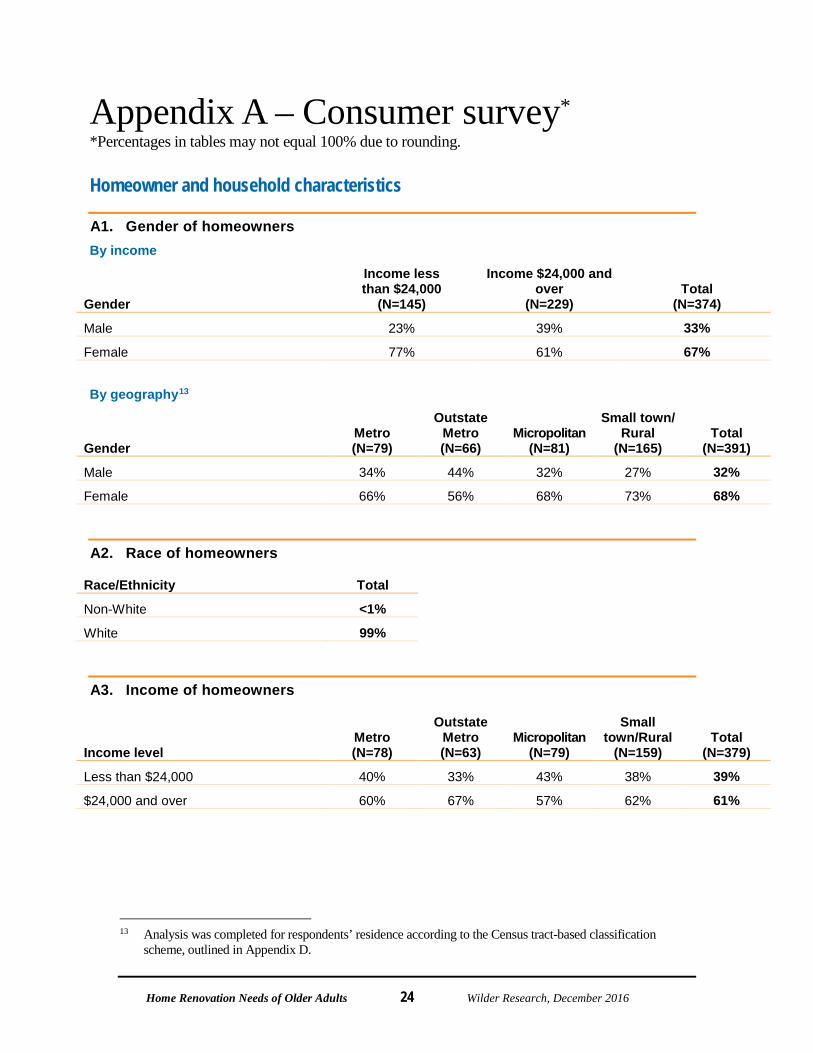
Appendix A – Consumer survey* *Percentages in tables may not equal 100% due to rounding.
Homeowner and household characteristics
A1. Gender of homeowners By income
Gender
Income less than $24,000
(N=145)
Income $24,000 and over
(N=229) Total
(N=374)
Male 23% 39% 33%
Female 77% 61% 67%
By geography13
Gender Metro (N=79)
Outstate Metro (N=66)
Micropolitan (N=81)
Small town/ Rural
(N=165) Total
(N=391)
Male 34% 44% 32% 27% 32%
Female 66% 56% 68% 73% 68%
A2. Race of homeowners
Race/Ethnicity Total
Non-White <1%
White 99%
A3. Income of homeowners
Income level Metro (N=78)
Outstate Metro (N=63)
Micropolitan (N=79)
Small town/Rural
(N=159) Total
(N=379)
Less than $24,000 40% 33% 43% 38% 39%
$24,000 and over 60% 67% 57% 62% 61%
13 Analysis was completed for respondents’ residence according to the Census tract-based classification
scheme, outlined in Appendix D.

Home Renovation Needs of Older Adults 25 Wilder Research, December 2016
A4. Residence of homeowners
Geographic location
Income less than $24,000
(N=147)
Income $24,000 and over
(N=232) Total
(N=379)
Twin Cities 7 county metro 21% 20% 21%
Outstate metro 14% 18% 17%
Micropolitan 23% 19% 21%
Small town/rural 42% 42% 42%
A5. Ages of adults in household By income
Ages of adults in household Income less than
$24,000 (N=148)
Income $24,000 and over
(N=239) Total
(N=387)
At least one person over the age of 85 30% 18% 23%
No one over age 85 70% 82% 78%
Mean 77 years 74 years 75 years
By geography
Ages of adults in household Twin Cities
Metro (N=83)
Outstate Metro (N=68)
Micropolitan (N=85)
Small town/Rural
(N=169) Total
(N=405)
At least one person over the age of 85 25% 32% 26% 17% 23%
No one over age 85 75% 68% 74% 82% 77%
Mean 75.5 years

Home Renovation Needs of Older Adults 26 Wilder Research, December 2016
A6. Number of people in household By income
Number of people in household
Income less than $24,000
(N=146)
Income $24,000 and over
(N=237) Total
(N=383)
1 70% 41% 52%
2 28% 52% 43%
3 1% 5% 3%
4 1% 1% 1%
5 0 1% 1%
By geography
Number of people in household Metro (N=83)
Outstate Metro (N=67)
Micropolitan (N=85)
Small town/Rural
(N=167) Total
(N=402)
1 63% 51% 54% 48% 53%
2 35% 43% 42% 47% 43%
3 1% 5% 2% 4% 3%
4 1% 0% 1% 1% 1%
5 0% 2% 0% 1% 1%

Home Renovation Needs of Older Adults 27 Wilder Research, December 2016
A7. Preference for remaining in home By income
How long you would prefer to stay in your home
Income less than $24,000
(N=96)
Income $24,000 and over
(N=167) Total
(N=263)
I would like to move now 3% 2% 2%
1 to 3 years 7% 8% 8%
4 to 5 years 10% 7% 8%
6 to 10 years 20% 20% 20%
More than 10 years 59% 63% 62%
By geography
How long you would prefer to stay in your home
Metro (N=64)
Outstate Metro (N=37)
Micropolitan (N=56)
Small town/Rural
(N=112) Total
(N=269)
I would like to move now 63% 51% 54% 48% 53%
1 to 3 years 35% 43% 42% 47% 43%
4 to 5 years 1% 5% 2% 4% 3%
6 to 10 years 1% 0% 1% 1% 1%
More than 10 years 0% 2% 0% 1% 1%

Home Renovation Needs of Older Adults 28 Wilder Research, December 2016
Disabilities and assistance needs of homeowners
A8. ADL Status By income
ADL difficulties
Income less than $24,000
(N=148)
Income $24,000 and over
(N=239) Total
(N=387)
Person in household has at least one ADL difficulty 23% 18% 20%
Person in household has no ADL difficulties 77% 82% 80%
By geography
ADL difficulties Metro (N=83)
Outstate Metro (N=68)
Micropolitan (N=85)
Small town/Rural
(N=169) Total
(N=405)
Person in household has at least one ADL difficulty 19% 24% 25% 17% 20%
Person in household has no ADL difficulties 81% 77% 75% 83% 80%
A9. Assistance needs By income
Need help with
Income less than $24,000 (N=146-147)
Income $24,000 and over
(N=238-239) Total
(N=384-386)
Getting in and out of bed or a chair 5% 4% 4%
Going up or down stairs 18% 14% 15%
Getting around inside the home 4% 4% 4%
Going outside the home to shop or visit a doctor’s office 14% 11% 12%
By geography
Need help with Metro (N=82)
Outstate Metro
(N=67-68) Micropolitan
(N=85)
Small town/Rural
(N=167-169)
Total (N=402-
404)
Getting in and out of bed or a chair 4% 4% 7% 4% 5%
Going up or down stairs 10% 21% 18% 16% 16%
Getting around inside the home 5% 4% 7% 3% 5%
Going outside the home to shop or visit a doctor’s office 16% 16% 17% 7% 12%

Home Renovation Needs of Older Adults 29 Wilder Research, December 2016
A10. HCBS Needs By income
Unmet Need for HCBS
Income less than $24,000
(N=148)
Income $24,000 and over
(N=239) Total
(N=387)
Person in household needs at least one service or support that they do not currently receive 47% 31% 37%
Person in household needs no additional services or supports 53% 69% 63%
By geography
Unmet Need for HCBS Metro (N=83)
Outstate Metro (N=68)
Micropolitan (N=85)
Small town/Rural
(N=169) Total
(N=405)
Person in household needs at least one service or support that they do not currently receive 27% 27% 44% 40% 36%
Person in household needs no additional services or supports 74% 74% 57% 60% 64%
A11. Types of HCBS needed – Meals By income
Help with meals brought to home or prepared for you
Income less than $24,000
(N=143)
Income $24,000 and over
(N=236) Total
(N=379)
Get this help 5% 2% 3%
Need this help 2% 2% 2%
Do not need this help 93% 96% 95%
By geography
Help with meals brought to home or prepared for you
Metro (N=80)
Outstate Metro (N=68)
Micropolitan (N=84)
Small town/Rural
(N=165) Total
(N=397)
Get this help 4% 4% 5% 3% 4%
Need this help 3% 0% 4% 2% 2%
Do not need this help 94% 96% 92% 95% 94%

Home Renovation Needs of Older Adults 30 Wilder Research, December 2016
A12. Types of HCBS needed – housekeeping or cleaning By income
Help with light housekeeping or cleaning
Income less than $24,000
(N=144)
Income $24,000 and over
(N=236) Total
(N=380)
Get this help 11% 10% 11%
Need this help 11% 8% 9%
Do not need this help 78% 82% 81%
By geography
Help with light housekeeping or cleaning
Metro (N=80)
Outstate Metro (N=68)
Micropolitan (N=83)
Small town/Rural
(N=167) Total
(N=398)
Get this help 13% 10% 11% 10% 11%
Need this help 4% 6% 16% 10% 9%
Do not need this help 84% 84% 74% 80% 80%
A13. Types of HCBS needed – home repairs or maintenance By income
Help with home repairs or maintenance
Income less than $24,000
(N=142)
Income $24,000 and over
(N=235) Total
(N=377)
Get this help 22% 18% 19%
Need this help 43% 29% 34%
Do not need this help 35% 54% 47%
By geography
Help with home repairs or maintenance
Metro (N=79)
Outstate Metro (N=68)
Micropolitan (N=83)
Small town/Rural
(N=165) Total
(N=395)
Get this help 23% 24% 22% 16% 20%
Need this help 24% 27% 36% 38% 33%
Do not need this help 53% 50% 42% 46% 47%

Home Renovation Needs of Older Adults 31 Wilder Research, December 2016
A14. Types of HCBS needed – bathing, getting dressed, toileting By income
Help with bathing or getting dressed or using the toilet
Income less than $24,000
(N=144)
Income $24,000 and over
(N=238) Total
(N=382)
Get this help 3% 2% 2%
Need this help 3% 1% 2%
Do not need this help 94% 98% 96%
By geography
Help with bathing or getting dressed or using the toilet
Metro (N=81)
Outstate Metro (N=68)
Micropolitan (N=85)
Small town/Rural
(N=166) Total
(N=400)
Get this help 3% 2% 5% 1% 2%
Need this help 4% 3% 1% 1% 2%
Do not need this help 94% 96% 94% 98% 96%
A15. Types of HCBS needed – transportation By income
Help with rides to appointments or errands
Income less than $24,000
(N=145)
Income $24,000 and over
(N=236) Total
(N=381)
Get this help 11% 6% 8%
Need this help 11% 3% 6%
Do not need this help 78% 91% 86%
By geography
Help with bathing or getting dressed or using the toilet
Metro (N=81)
Outstate Metro (N=67)
Micropolitan (N=83)
Small town/Rural
(N=168) Total
(N=399)
Get this help 10% 9% 7% 8% 8%
Need this help 9% 5% 4% 6% 6%
Do not need this help 82% 87% 89% 86% 86%

Home Renovation Needs of Older Adults 32 Wilder Research, December 2016
A16. Types of HCBS needed – home health aide By income
Help with health worker who comes to your home to help with medical needs
Income less than $24,000
(N=144)
Income $24,000 and over
(N=238) Total
(N=382)
Get this help 4% 3% 3%
Need this help 4% 2% 3%
Do not need this help 92% 96% 94%
By geography
Help with health worker who comes to your home to help with medical needs
Metro (N=80)
Outstate Metro (N=67)
Micropolitan (N=85)
Small town/Rural
(N=166) Total
(N=398)
Get this help 3% 0% 7% 3% 3%
Need this help 1% 2% 6% 1% 2%
Do not need this help 96% 99% 87% 96% 95%
A17. Would have to live elsewhere without HCBS By income
Adults would have to live somewhere else if they did not get in-home services or help
Income less than $24,000
(N=144)
Income $24,000 and over
(N=238) Total
(N=382)
Definitely yes 9% 3% 5%
Probably yes 12% 10% 11%
Probably not 15% 15% 15%
Definitely not 5% 3% 4%
NA – no adults in household get in-home help 59% 68% 65%
By geography
Adults would have to live somewhere else if they did not get in-home services or help
Metro (N=82)
Outstate Metro (N=69)
Micropolitan (N=88)
Small town/Rural
(N=170) Total
(N=409)
Definitely yes 5% 6% 7% 5% 6%
Probably yes 10% 13% 13% 9% 11%
Probably not 16% 9% 15% 15% 14%
Definitely not 2% 7% 5% 3% 4%
NA – no adults in household get in-home help 67% 65% 61% 68% 66%

Home Renovation Needs of Older Adults 33 Wilder Research, December 2016
A18. Need for modifications By income
Based on health and mobility and layout of home could continue to live in home for next five years
Income less than $24,000
(N=144)
Income $24,000 and over
(N=234) Total
(N=378)
Yes, with no modifications needed 62% 72% 68%
Yes, with some modifications 35% 26% 30%
No, not even with modifications 3% 2% 2%
By geography
Based on health and mobility and layout of home could continue to live in home for next five years
Metro (N=78)
Outstate Metro (N=66)
Micropolitan (N=83)
Small town/Rural
(N=169) Total
(N=396)
Yes, with no modifications needed 82% 71% 61% 63% 68%
Yes, with some modifications 17% 26% 36% 33% 29%
No, not even with modifications 1% 3% 2% 4% 3%
House characteristics
A19. Room configurations By income
Home has:
Income less than $24,000 (N=146-148)
Income $24,000 and over
(N=235-238) Total
(N=381-386)
More than one story of living space 43% 48% 46%
A toilet on the main floor 94% 95% 95%
A bathtub or shower on the main floor 91% 91% 91%
A bedroom on the main floor 89% 88% 88%
Laundry on the main floor 52% 43% 47%
By geography
Home has: Metro
(N=81-83)
Outstate Metro
(N=66-68) Micropolitan
(N=85)
Small town/Rural (N=167-168)
Total (N=399-404)
More than one story of living space 52% 41% 51% 42% 46%
A toilet on the main floor 93% 99% 91% 97% 95%
A bathtub or shower on the main floor 88% 94% 86% 94% 91%
A bedroom on the main floor 87% 93% 84% 90% 88%
Laundry on the main floor 34% 47% 31% 62% 47%

Home Renovation Needs of Older Adults 34 Wilder Research, December 2016
A20. Steps into house By income
Number of steps to climb to enter home:
Income less than $24,000
(N=145)
Income $24,000 and over
(N=237) Total
(N=382)
Home has an entry ramp 4% 3% 3%
None 10% 17% 14%
One to three steps 56% 54% 55%
Four or more steps 30% 26% 27%
By geography
Number of steps to climb to enter home:
Metro (N=83)
Outstate Metro (N=68)
Micropolitan (N=83)
Small town/Rural
(N=139) Total
(N=347)
Home has an entry ramp 2% 6% 2% 3% 3%
None 17% 15% 17% 11% 14%
One to three steps 57% 59% 49% 57% 56%
Four or more steps 24% 21% 31% 29% 27%

Home Renovation Needs of Older Adults 35 Wilder Research, December 2016
A21. Year house built By income
Year that house was built
Income less than $24,000
(N=124)
Income $24,000 and over
(N=210) Total
(N=334)
Before 1910 11% 7% 9%
1910 to 1929 8% 10% 9%
1930 to 1949 11% 13% 13%
1950 to 1969 36% 29% 31%
1970 to 1989 17% 23% 21%
1990 to 2016 16% 19% 18%
Mean 1956 1960 1958
By geography
Year that house was built Metro (N=77)
Outstate Metro (N=61)
Micropolitan (N=70)
Small town/Rural
(N=139) Total
(N=347)
Before 1910 5% 5% 11% 12% 9%
1910 to 1929 10% 5% 14% 7% 9%
1930 to 1949 14% 5% 14% 13% 12%
1950 to 1969 35% 31% 36% 30% 32%
1970 to 1989 20% 23% 14% 23% 21%
1990 to 2016 16% 31% 10% 17% 18%
Mean 1959 1970 1948 1957 1958

Home Renovation Needs of Older Adults 36 Wilder Research, December 2016
A22. Condition of house By income
Overall physical condition of house
Income less than $24,000
(N=139)
Income $24,000 and over
(N=233) Total
(N=372)
Very good 25% 33% 30%
Good 66% 60% 62%
Poor 9% 6% 8%
Very poor 0% 1% 1%
By geography
Overall physical condition of house Metro (N=77)
Outstate Metro (N=66)
Micropolitan (N=81)
Small town/Rural
(N=163) Total
(N=387)
Very good 36% 32% 25% 29% 30%
Good 60% 62% 64% 63% 62%
Poor 4% 6% 11% 7% 7%
Very poor 0% 0% 0% 1% 1%
A23. Need for high cost improvements By income
Need for high-cost improvements ($3500+ estimate)
Income less than $24,000
(N=148)
Income $24,000 and over
(N=239) Total
(N=387)
Household needs at least one high-cost improvement 57% 51% 53%
Household needs no high-cost improvements 43% 49% 47%
By geography
Need for high-cost improvements ($3500+ estimate)
Metro (N=83)
Outstate Metro (N=68)
Micropolitan (N=85)
Small town/Rural
(N=169) Total
(N=405)
Household needs at least one high-cost improvement 36% 41% 58% 64% 53%
Household needs no high-cost improvements 64% 59% 42% 36% 47%

Home Renovation Needs of Older Adults 37 Wilder Research, December 2016
A24. Need for very high-cost improvement By income
Need for very high-cost improvements ($5000+ estimate)
Income less than $24,000
(N=148)
Income $24,000 and over
(N=239) Total
(N=387)
Household needs at least one very high-cost improvement 47% 33% 38%
Household needs no very high-cost improvements 53% 67% 62%
By geography
Need for very high-cost improvements ($5000+ estimate)
Metro (N=83)
Outstate Metro (N=68)
Micropolitan (N=85)
Small town/Rural
(N=169) Total
(N=405)
Household needs at least one very high-cost improvement 29% 24% 40% 45% 37%
Household needs no very high-cost improvements 71% 77% 60% 55% 63%
A25. Need for safety/accessibility improvements By income
Need for safety/accessibility improvements
Income less than $24,000
(N=148)
Income $24,000 and over
(N=239) Total
(N=387)
Household needs at least one safety/accessibility improvement 45% 42% 43%
Household needs no safety/accessibility improvement 55% 58% 57%
By geography
Need for safety/accessibility improvements
Metro (N=83)
Outstate Metro (N=68)
Micropolitan (N=85)
Small town/Rural
(N=169) Total
(N=405)
Household needs at least one safety/accessibility improvement 35% 38% 42% 50% 44%
Household needs no safety/accessibility improvement 65% 62% 58% 50% 57%

Home Renovation Needs of Older Adults 38 Wilder Research, December 2016
A26. Need for maintenance improvements By income
Need for maintenance improvements
Income less than $24,000
(N=148)
Income $24,000 and over
(N=239) Total
(N=387)
Household needs at least one maintenance improvement 60% 51% 54%
Household needs no maintenance improvement 41% 49% 46%
By geography
Need for maintenance improvements Metro (N=83)
Outstate Metro (N=68)
Micropolitan (N=85)
Small town/Rural
(N=169) Total
(N=405)
Household needs at least one maintenance improvement 43% 43% 54% 63% 54%
Household needs no maintenance improvement 57% 57% 46% 37% 46%
Types of improvements needed
A27. Grab bars or hand rails By income
Grab bars or hand rails
Income less than $24,000
(N=138)
Income $24,000 and over
(N=228) Total
(N=366)
Already have this 42% 36% 39%
Will need this 21% 20% 21%
Do not think we will need this 37% 43% 41%
By geography
Grab bars or hand rails Metro (N=81)
Outstate Metro (N=65)
Micropolitan (N=80)
Small town/Rural
(N=158) Total
(N=384)
Already have this 36% 37% 44% 39% 39%
Will need this 16% 17% 16% 27% 21%
Do not think we will need this 48% 46% 40% 34% 40%

Home Renovation Needs of Older Adults 39 Wilder Research, December 2016
A28. Floor level shower By income
Shower at floor level
Income less than $24,000
(N=137)
Income $24,000 and over
(N=227) Total
(N=364)
Already have this 27% 34% 31%
Will need this 23% 18% 20%
Do not think we will need this 50% 49% 49%
By geography
Shower at floor level Metro (N=79)
Outstate Metro (N=63)
Micropolitan (N=80)
Small town/Rural
(N=159) Total
(N=381)
Already have this 25% 41% 26% 34% 32%
Will need this 11% 11% 25% 26% 21%
Do not think we will need this 63% 48% 49% 40% 48%
A29. Main floor laundry By income
Main floor laundry
Income less than $24,000
(N=138)
Income $24,000 and over
(N=231) Total
(N=369)
Already have this 44% 38% 40%
Will need this 13% 15% 14%
Do not think we will need this 43% 47% 46%
By geography
Main floor laundry Metro (N=78)
Outstate Metro (N=68)
Micropolitan (N=81)
Small town/Rural
(N=159) Total
(N=386)
Already have this 27% 41% 27% 56% 42%
Will need this 5% 12% 24% 15% 14%
Do not think we will need this 68% 47% 49% 29% 44%

Home Renovation Needs of Older Adults 40 Wilder Research, December 2016
A30. Lever door handles By income
Lever door handles
Income less than $24,000
(N=139)
Income $24,000 and over
(N=232) Total
(N=371)
Already have this 28% 37% 33%
Will need this 14% 13% 13%
Do not think we will need this 58% 51% 53%
By geography
Lever door handles Metro (N=80)
Outstate Metro (N=66)
Micropolitan (N=81)
Small town/Rural
(N=160) Total
(N=387)
Already have this 21% 36% 35% 39% 34%
Will need this 11% 15% 12% 13% 13%
Do not think we will need this 68% 49% 53% 48% 53%
A31. Wider doorways By income
Wider doorways
Income less than $24,000
(N=136)
Income $24,000 and over
(N=226) Total
(N=362)
Already have this 21% 25% 24%
Will need this 12% 10% 11%
Do not think we will need this 67% 66% 66%
By geography
Wider doorways Metro (N=78)
Outstate Metro (N=66)
Micropolitan (N=80)
Small town/Rural
(N=155) Total
(N=379)
Already have this 19% 18% 25% 28% 24%
Will need this 5% 11% 10% 13% 10%
Do not think we will need this 76% 71% 65% 59% 66%

Home Renovation Needs of Older Adults 41 Wilder Research, December 2016
A32. Entrance ramp By income
Entrance ramp
Income less than $24,000
(N=135)
Income $24,000 and over
(N=231) Total
(N=366)
Already have this 11% 6% 8%
Will need this 11% 10% 10%
Do not think we will need this 78% 84% 82%
By geography
Entrance ramp Metro (N=79)
Outstate Metro (N=68)
Micropolitan (N=81)
Small town/Rural
(N=155) Total
(N=383)
Already have this 8% 7% 12% 7% 8%
Will need this 5% 7% 16% 12% 10%
Do not think we will need this 87% 85% 72% 82% 82%
A33. Stair railings By income
Stair railings
Income less than $24,000
(N=134)
Income $24,000 and over
(N=227) Total
(N=361)
Already have this 62% 66% 65%
Will need this 9% 7% 8%
Do not think we will need this 29% 27% 28%
By geography
Stair railings Metro (N=75)
Outstate Metro (N=63)
Micropolitan (N=80)
Small town/Rural
(N=160) Total
(N=378)
Already have this 64% 67% 69% 62% 65%
Will need this 4% 6% 6% 10% 7%
Do not think we will need this 32% 27% 25% 28% 28%

Home Renovation Needs of Older Adults 42 Wilder Research, December 2016
A34. Non-slip flooring By income
Non-slip or level flooring
Income less than $24,000
(N=139)
Income $24,000 and over
(N=231) Total
(N=370)
Already have this 46% 58% 54%
Will need this 7% 7% 7%
Do not think we will need this 47% 35% 39%
By geography
Non-slip or level flooring Metro (N=79)
Outstate Metro (N=66)
Micropolitan (N=81)
Small town/Rural
(N=160) Total
(N=386)
Already have this 46% 59% 47% 61% 54%
Will need this 4% 5% 6% 11% 7%
Do not think we will need this 51% 36% 47% 29% 38%
A35. Lower cabinets or counters By income
Lower cabinets or counters for a wheelchair
Income less than $24,000
(N=139)
Income $24,000 and over
(N=229) Total
(N=368)
Already have this 7% 7% 7%
Will need this 6% 4% 5%
Do not think we will need this 87% 89% 88%
By geography
Lower cabinets or counters for a wheelchair
Metro (N=78)
Outstate Metro (N=67)
Micropolitan (N=80)
Small town/Rural
(N=160) Total
(N=385)
Already have this 9% 9% 9% 6% 8%
Will need this 0% 2% 6% 8% 5%
Do not think we will need this 91% 90% 85% 87% 89%

Home Renovation Needs of Older Adults 43 Wilder Research, December 2016
A36. Main floor bathroom By income
Bathroom on the main floor
Income less than $24,000
(N=141)
Income $24,000 and over
(N=234) Total
(N=375)
Already have this 80% 81% 81%
Will need this 4% 4% 4%
Do not think we will need this 16% 15% 16%
By geography
Bathroom on the main floor Metro (N=81)
Outstate Metro (N=68)
Micropolitan (N=81)
Small town/Rural
(N=162) Total
(N=392)
Already have this 75% 88% 78% 83% 81%
Will need this 3% 2% 7% 4% 4%
Do not think we will need this 22% 10% 15% 13% 15%
A37. Elevator By income
Elevator
Income less than $24,000
(N=137)
Income $24,000 and over
(N=231) Total
(N=368)
Already have this 2% 2% 2%
Will need this 1% 2% 2%
Do not think we will need this 98% 96% 97%
By geography
Elevator Metro (N=80)
Outstate Metro (N=65)
Micropolitan (N=81)
Small town/Rural
(N=157) Total
(N=383)
Already have this 4% 0% 1% 1% 2%
Will need this 1% 2% 1% 1% 1%
Do not think we will need this 95% 99% 98% 98% 97%

Home Renovation Needs of Older Adults 44 Wilder Research, December 2016
A38. New water heater By income
New water heater
Income less than $24,000
(N=141)
Income $24,000 and over
(N=234) Total
(N=375)
Already have this 37% 43% 41%
Will need this 32% 24% 27%
Do not think we will need this 31% 34% 33%
By geography
New water heater Metro (N=80)
Outstate Metro (N=67)
Micropolitan (N=83)
Small town/Rural
(N=161) Total
(N=391)
Already have this 38% 28% 40% 45% 40%
Will need this 25% 27% 23% 30% 27%
Do not think we will need this 38% 45% 37% 25% 34%
A39. Windows By income
New windows
Income less than $24,000
(N=142)
Income $24,000 and over
(N=232) Total
(N=374)
Already have this 30% 46% 40%
Will need this 33% 20% 25%
Do not think we will need this 37% 34% 35%
By geography
New windows Metro (N=81)
Outstate Metro (N=66)
Micropolitan (N=83)
Small town/Rural
(N=160) Total
(N=390)
Already have this 36% 38% 39% 45% 41%
Will need this 21% 15% 25% 29% 24%
Do not think we will need this 43% 47% 36% 26% 35%

Home Renovation Needs of Older Adults 45 Wilder Research, December 2016
A40. Roof By income
New roof
Income less than $24,000
(N=142)
Income $24,000 and over
(N=236) Total
(N=378)
Already have this 46% 60% 55%
Will need this 28% 18% 21%
Do not think we will need this 27% 23% 24%
By geography
New roof Metro (N=79)
Outstate Metro (N=68)
Micropolitan (N=85)
Small town/Rural
(N=163) Total
(N=395)
Already have this 53% 57% 55% 57% 56%
Will need this 15% 16% 26% 23% 21%
Do not think we will need this 32% 27% 19% 20% 23%
A41. Central air conditioning By income
New central air conditioner
Income less than $24,000
(N=141)
Income $24,000 and over
(N=233) Total
(N=374)
Already have this 32% 34% 33%
Will need this 17% 22% 20%
Do not think we will need this 51% 44% 47%
By geography
New central air conditioner Metro (N=79)
Outstate Metro (N=67)
Micropolitan (N=84)
Small town/Rural
(N=160) Total
(N=390)
Already have this 32% 31% 37% 34% 34%
Will need this 18% 12% 16% 27% 20%
Do not think we will need this 51% 57% 48% 39% 46%

Home Renovation Needs of Older Adults 46 Wilder Research, December 2016
A42. Furnace or boiler By income
New furnace or boiler
Income less than $24,000
(N=141)
Income $24,000 and over
(N=227) Total
(N=368)
Already have this 45% 42% 44%
Will need this 15% 20% 18%
Do not think we will need this 40% 37% 38%
By geography
New furnace or boiler Metro (N=80)
Outstate Metro (N=66)
Micropolitan (N=81)
Small town/Rural
(N=157) Total
(N=384)
Already have this 36% 36% 46% 49% 44%
Will need this 14% 20% 20% 19% 18%
Do not think we will need this 50% 44% 35% 32% 38%
A43. Other modifications or repairs
Other modifications or repairs needed to live in home for next five years
Total times mentioned
Painting (exterior and general) 4
Insulation 3
Flooring 3
Chimney repair 1
Foundation repair 1
Exterior steps repair 1
Driveway repair 1
Doors 1
Electrical work 1
Stair lift 1
Main floor bedroom 1

Home Renovation Needs of Older Adults 49 Wilder Research, December 2016
Homeowner Survey – Home Modifications and Needs Please fill in the answer or check the response that best matches your opinion. 1. How many people live in your household?
2. What are the ages of each adult (18 and older) in your household?
3. Do you or someone in your household own your home?
1 Yes
2 No 4. How long would you prefer to stay in your current home? (Check one)
1 I would like to move now
2 1 to 3 years
3 4 to 5 years
4 6 to 10 years
5 More than 10 years
6 I am not sure 5. Does your home have…
Yes No
a. More than one-story of living space (not including a basement)? 1 2
b. A toilet on the main floor? 1 2
c. A bathtub or shower on the main floor? 1 2
d. A bedroom on the main floor? 1 2
e. Laundry on the main floor? 1 2 6. How many steps must you climb to enter your home from the outside (for the
door you usually use)?
1 My home has an entry ramp
2 None
3 One to three steps
4 Four or more steps 7. In what year was your home built?
Instrument

Home Renovation Needs of Older Adults 50 Wilder Research, December 2016
8. Please indicate what modifications you have or may need to continue living in your home for the next five years.
For each item, check the box that is closest to your situation.
We already
have this We will
need this
We do not think we will
need this a. Lower cabinets or counters for a
wheelchair 1 2 3
b. Grab bars or hand rails 1 2 3 c. Shower at floor level (that is easy to
walk or roll into) 1 2 3
d. Bathroom (toilet and bathtub or shower) on the main floor
1 2 3
e. Entrance ramp 1 2 3 f. Stair railings 1 2 3 g. Wider doorways for a wheelchair or
walker 1 2 3
h. Main floor laundry 1 2 3 i. Lever door handles that are easy to open 1 2 3 j. Non-slip or level flooring 1 2 3 k. Elevator 1 2 3
9. Please indicate repairs you have made or may need in your home for you to continue living there for the next five years.
For each item, check the box that is closest to your situation.
We already
have this We will
need this
We do not think we will
need this
a. New roof 1 2 3 b. New windows 1 2 3 c. New furnace or boiler 1 2 3 d. New central air conditioner 1 2 3 e. New water heater 1 2 3
10. Are there any other modifications or repairs you will need in your home to continue living there for the next five years? Please explain.
___________________________________________________________

Home Renovation Needs of Older Adults 51 Wilder Research, December 2016
11. How would you characterize the overall physical condition of your home? (Check one)
1 Very good 2 Good 3 Poor 4 Very poor 8 I don’t know 12. Because of a physical condition, does any adult in your household have
problems or need help with: Yes No
a. Getting in and out of bed or a chair? 1 2 b. Going up or down stairs? 1 2 c. Getting around inside the home? 1 2 d. Going outside the home to shop or visit a doctor’s office? 1 2
13. Considering the current health and mobility of the adults in your
household, and the layout of your home, could you continue living in your home for the next five years?
1 Yes, with no modifications needed
2 Yes, with some modifications
3 No, not even with modifications 14. Because of a physical condition, do any adults in your household get help
with any of the following from someone outside the home?
For each item, check the box that is closest to your situation.
We get this help
We need this help
We do not need this
help
a. Meals that are brought to your home or prepared for you
1 2 3
b. Help with light housekeeping or cleaning 1 2 3 c. Home repairs or maintenance 1 2 3 d. Help with bathing or getting dressed or
using the toilet 1 2 3
e. Rides to appointments or errands 1 2 3 f. Health worker (aide, nurse, etc.) who
comes to your home to help with medical needs
1 2 3

Home Renovation Needs of Older Adults 52 Wilder Research, December 2016
15. Would any adults in your household have to live somewhere else if they did not get in-home services or help?
1 Definitely yes
2 Probably yes
3 Probably not
4 Definitely not
9 Does not apply (No adults in my household get in-home help) Finally, we would like a little background information about you.
16. Are you: 1 Male
2 Female 17. How do you identify your race/ethnicity? (Please check all that apply)
1 African American
2 African-born
3 American Indian/Native American
4 Asian or Asian American
5 Hispanic
6 White
7 Other (Please describe: ___________________________) 18. What is your zip code?
Understanding the housing needs of people with different income levels is needed for Minnesota Housing to better plan for services. 19. What is your best guess of your household income last year?
1 Less than $16,000 4 $32,000 to $39,999
2 $16,000 to $ 23,999 5 $40,000 to $47,999
3 $24,000 to $31,999 6 $48,000 or more
Thank you! Please return your completed survey to Wilder Research in the enclosed
self-addressed postage-paid envelope by June 30th.

Home Renovation Needs of Older Adults 53 Wilder Research, December 2016
Appendix B – Cost parameters and assumptions B1. Home improvement cost assumptions
Safety and Accessibility Typical cost Lower bound Upper bound
Lower kitchen cabinets and counters for wheelchair accessibility $5,563 $3,900 $14,000
Install grab bar or hand rail $338 $263 $800
Shower at floor level $3,598 $2,798 $4,698
Bathroom on main floor $11,673 $10,645 $14,673
Entrance ramp $3,875 $3,167 $7,375
Install stair railing $386 $245 $828
Wider doorways for a wheelchair or walker $1,232 $740 $2,878
Main floor laundry $3,675 $2,975 $4,680
Lever door handles $359 $265 $900
Non-slip or level flooring $2,750 $533 $6,975
Elevator or stair lifta $4,833 $4,500 $30,000
Maintenance
New roof $7,250 $5,850 $12,456
New windows $6,803 $4,639 $25,503
New furnace or boiler $4,333 $3,500 $9,167
New central air conditioner $3,113 $2,975 $4,625
New water heater $1,190 $1,160 $2,250
Note. Details of computations are described in the methods section. This list, by necessity, falls short of an exhaustive list of possible home improvement needs. Notable omissions include siding/exterior painting and insulation. a While the consumer survey asked about the need for an elevator, it became clear during interviews with home improvement experts that stair lifts are far more common. As a result, cost estimates for this item reflect stair lifts for the lower bound and typical scenarios, and reflect shaft elevators in the upper bound scenario.

Home Renovation Needs of Older Adults 54 Wilder Research, December 2016
B2. Disaggregated per-household home improvement costs (safety, maintenance)
Typical Lower bound Upper bound
Safety cost $6,989 $5,284 $12,433
Maintenance cost $8,760 $6,887 $22,117
Total cost $15,749 $12,171 $34,551
Note. Details of computations are described in Appendix D.
B3. Additional assumptions for cost computations
Assumptions (used when respondent provided a cost per unit and no overall cost) Typical Lower bound Upper bound
Roof size 25 square 20 square 30 square
Number of doors for knob replacement 4 3 6
Number of doors for doorway widening 2 1 4
Number of stair railings needed 2 1 3
Number of grab bars needed 3 2 4
Number of windows 12 8 30
Note. Additional assumptions include the following: Main floor laundry requires new appliances at cost of $1800. The lower bound end of non-slip flooring only includes estimates of no-skid remedies, while the upper bound only includes flooring replacement (assumed at a conservatively high 1500 square feet). The lower bound end of the "elevator" item only includes estimates for stair lifts (an alternative to an elevator), while the upper bound only includes estimates for a shaft elevator.

Home Renovation Needs of Older Adults 55 Wilder Research, December 2016
Appendix C – Findings from existing data
C1. National Core Indicators Data – Demographics
Age (N=307) Percent
50-59 14%
60-69 21%
70-79 28%
80-89 24%
90+ 13%
Gender (N=307)
Male 32%
Female 68%
Race/Ethnicity (N=241)
American Indian/Alaskan Native 1%
Asian 3%
Black/African American 6%
White 89%
Source. NCI-AD Pilot data for MN, 2014
C2. National Core Indicator Data – Services
Receiving services (N=289) Percent
PCA 52%
Homemaker 71%
Transportation 52%
Meal assistance 64%
Services needed (N=43)
PCA 19%
Homemaker 23%
Transportation 35%
Nutritional assistance 21%
Source. NCI-AD Pilot data for MN, 2014

Home Renovation Needs of Older Adults 56 Wilder Research, December 2016
C3. National Core Indicator Data – Supports for daily living
Needs help with Percent
Basic self-care (N=300) 40%
Everyday activities (N=298) 79%
Would need to live elsewhere without services received (N=273)
Yes 51%
Maybe, not sure 14%
No 35%
Needs different supports to continue living in current place (N=274)
Yes 18%
Maybe, not sure 8%
No 74%
Types of supports needed (N=72)
Help with basic self-care 31%
Help with everyday things 43%
Home modifications 24%
Transportation 29%
Nutritional supports 21%
Financial assistance 33%
May need to move in the next 2 years (N=277) 18%
Source. NCI-AD Pilot data for MN, 2014. Used with permission from MN Board on Aging.

Home Renovation Needs of Older Adults 57 Wilder Research, December 2016
C4. National Core Indicator Data – Home modifications
Home modifications respondent has (N=303) Percent
None 14%
Grab bars 71%
Bathroom modifications 51%
Ramp 13%
Home modifications respondent needs (N=303)
None 74%
Grab bars 6%
Bathroom modifications 4%
Ramp 5%
Respondent is afraid of falling (N=278)
Yes 32%
Maybe, not sure 7%
No 62%
Someone has worked with respondent to reduce risk of falling (N=272)
Yes 40%
Maybe, not sure 3%
No 57%
Source. NCI-AD Pilot data for MN, 2014. Used with permission from MN Board on Aging.
C5. Characteristics of Minnesota OAA Clients
Percent
Persons 60+ with mobility limitations 14.9%
Persons 60+ below poverty 7.5%
Persons 60+ living in rural areas 32.5%
Total population 60+ 20.3%
Source: Profile of State OAA Programs, Minnesota (2014). http://www.agid.acl.gov/StateProfiles/Profile/Pre/?id=25&topic=1&years=2014

Home Renovation Needs of Older Adults 58 Wilder Research, December 2016
C6. Minnesota 2014 Gaps analysis study14 — Lead agency representatives
58% reported there were older adults currently living in their homes who are at risk of having to move into provider-controlled settings; the main needs that must be met to help them remain in their homes are homemaker services, personal care assistance, medication management, and chore services.
77% reported that there is a big need or some need to modify existing housing stock so older adults can continue to reside in current homes/communities.
66% reported that subsidies for low-income people who wish to make home modifications fall short of demand.
47% reported that builders/contractors who are willing to take on environmental accessibility adaptations fall short of demand.
Source. DHS Gaps Analysis Study https://mn.gov/dhs/partners-and-providers/continuing-care/data-measures/gaps-analysis/current-study/
14 The 2013-2014 Minnesota Department of Human Services Gaps Analysis study was completed to assess the
capacity and gaps of the Minnesota services system to support older adults; persons with disabilities; and children, youth or adults living with mental health conditions. The long-term services and supports system includes home and community-based services and a continuum of mental health services and supports.

Home Renovation Needs of Older Adults 59 Wilder Research, December 2016
C7. Medicare enrollees’ status for Activities of Daily Living and Instrumental Activities of Daily Living
Indicator 20 (2009)/22 (2013) 2009 2013
With IADLs or ADLs or in a long-term care facility 41.4% 44%
With IADLs only 12.1% 11.7%
With 1-2 ADLs 17.6% 20%
With 3-4 ADLs 5.1% 5.8%
With 5-6 ADLs 2.7% 2.8%
Indicator 37
With ADLs and receive personal assistance only 6.4% 7.0%
With ADLs and use equipment only 38.4% 35.3%
With ADLs and receive personal assistance and use equipment 23.4% 25.4%
No assistance received 31.9% 32.4%
Source. Older Americans 2016: Key Indicators of Well-Being. http://www.agingstats.gov/docs/LatestReport/OA2016.pdf
C8. Medicare enrollees’ status for Activities of Daily Living and Instrumental Activities of Daily Living
Percent
Independent living difficulty 15%
Self-care difficulty 9%
Ambulatory difficulty 23%
Cognitive difficulty 9%
Vision difficulty 7%
Hearing difficulty 15%
Any disability 36%
Source. Older Americans 2016: Key Indicators of Well-Being. http://www.aoa.gov/Aging_Statistics/Profile/2014/16.aspx

Home Renovation Needs of Older Adults 60 Wilder Research, December 2016
C9. Administration on Aging Housing data for 26.8 million households of older adults in 2013
Percent
Homeowners 81%
Median family income $34,500
Homeowners who spent more than ¼ of income on housing 39%
Median home construction year 1972
Moderate to severe problems with plumbing, heating, electric, kitchen, and/or upkeep 2.7%
Homeowners who own homes, mortgage free 65%
Source. Department of Housing and Urban Development, American Housing Survey, National Tables: 2013 http://www.aoa.gov/Aging_Statistics/Profile/2014/11.aspx
C10. Characteristics of low-income homeowners
Poverty level of homeowners Owner households
Below poverty 23,529 (6%)
Poverty to 30% 22,094 (6%)
30-50% 71,374 (18%)
50-80% 96,555 (24%)
>80% 186,376 (47%)
Total 399,930 (100%)
Source: MN Housing analysis of U.S. Census Bureau, 2012 American Community Survey micro-data from PowerPoint “Minnesota Housing & Serving Older Minnesotans, February 5, 2016.
Age Percent with
disability Percent who moved
in the last year Own home
(owned/mortgage)
65-74 21% 4% 87%
75-84 37% 5% 78%
85+ 67% 10% 57%

Home Renovation Needs of Older Adults 61 Wilder Research, December 2016
C11. Minnesota Board on Aging Title III consumer feedback pilot survey results (2016)
This service [chore/homemaker, home delivered meals, transportation] helps me remain in my current living situation. Total (N=181)
Strongly agree 69%
Moderately agree 20%
Slightly agree 5%
Slightly disagree 2%
Moderately disagree 0%
Strongly disagree 4%
Without this service [chore/homemaker, home delivered meals, transportation] it would be difficult to remain in my home.
Strongly agree 41%
Moderately agree 23%
Slightly agree 13%
Slightly disagree 10%
Moderately disagree 7%
Strongly disagree 7% Note: Pilot results used with permission from Minnesota Board on Aging.

Home Renovation Needs of Older Adults 62 Wilder Research, December 2016
C12. MetLife Market Survey of Long-Term Care Costs: Nursing Home, Assisted Living, Adult Day Services, and Home Care Costs
Home Care Hourly Cost (2012) Home Health Aide Homemaker Services
Low High Average Low High Average
Minnesota $11 $45 $30 $11 $44 $24
Minneapolis/St. Paul $11 $45 $26 $11 $27 $22
Rochester area $24 $44 $32 $20 $44 $28
Rest of state $23 $40 $31 $17 $34 $23
Note. Based on 4 hours per day, 5 days per week. Figures not adjusted for inflation.
Nursing Home Daily Cost (2012) Semi-Private Room Private Room
Low High Average Low High Average
Minnesota $147 $308 $223 $161 $328 $241
Minneapolis/St. Paul $189 $308 $231 $195 $328 $248
Rochester area $147 $241 $200 $161 $255 $216
Rest of state $193 $270 $228 $215 $285 $249
Adult Day Services Daily Cost (2012) Low High Average
Minnesota $37 $117 $71
Minneapolis/St. Paul $70 $117 $82
Rochester area $37 $62 $54
Rest of state $44 $117 $68
Note. Based on 5 days per week
Assisted Living Monthly Base Rate (2012) Low High Average
Minnesota $1,665 $5,232 $2,953
Minneapolis/St. Paul $1,665 $5,232 $3,185
Rochester area $1,791 $3,195 $2,751
Rest of state $2,276 $3,650 $2,744
Source: The 2012 MetLife Market Survey of Nursing Home, Assisted Living, Adult Day Services, and Home Care Costs https://www.metlife.com/assets/cao/mmi/publications/studies/2012/studies/mmi-2012-market-survey-long-term-care-costs.pdf

Home Renovation Needs of Older Adults 63 Wilder Research, December 2016
Appendix D – Data sources and methodological details Homeowner survey
The purpose of the survey was to hear directly from older, low-income homeowners about their perceptions of their current and future needs for home renovations or repairs that would allow them to remain in their homes as long as they wish. The survey also collected information about the age, condition, and layout of their houses; their current use of services and supports; their perception of their need for services and supports in the future; and basic demographic information. The survey was also designed to collect information about geographic variations in the situations and needs of the respondents.
Wilder Research mailed surveys and letters explaining the purpose of the survey to a sample of 1500 homeowners.15 Mailings included a paper survey, a letter with instructions, and a postage-paid, self-addressed envelope to return the survey, along with a one-dollar bill sent as an incentive for participation. Respondents had the option of returning the completed survey in a postage-paid envelope or of calling Wilder Research to complete the survey over the phone. One week following the first mailing, a reminder postcard was sent to the entire sample. Of the original 1500 addresses, there were 1406 eligible cases,16 with 420 completed surveys (413 returned by mail and seven completed over the phone). The final response rate was 30%.
Geographic analysis was completed, based on federal definitions of metropolitan and micropolitan statistical areas, according to the following designations:
Metro: The seven-county metropolitan area (Anoka, Carver, Dakota, Hennepin, Ramsey, Scott, Washington counties)
Outstate metro: Metropolitan statistical areas, not in the seven-county metro area (Benton, Chisago, Clay, Dodge, Houston, Isanti, Olmsted, Polk, Sherburne, St. Louis, Stearns, Wabasha, Wright counties)
Micropolitan: 20 counties surrounding smaller urban centers of at least 10,000 people (Beltrami, Brown, Blue Earth, Cass, Crow Wing, Douglas, Freeborn, Goodhue,
15 The sample was purchased for statewide listed telephone residential records, with targeted criteria for
ages 65 years and over, homeownership, and household income of $30,000 or less. Limitations to this sample include possible under-coverage associated with households that do not have telephone numbers.
16 Not eligible=44, undeliverable=46; refusals=14, returned after data analysis deadline=4

Home Renovation Needs of Older Adults 64 Wilder Research, December 2016
Kandiyohi, Lyon, Martin, McLeod, Mower, Nicollet, Nobles, Otter Tail, Rice, Steele, Wilkin, Winona counties)
Small town/Rural: 46 counties not considered metropolitan or micropolitan (Aitkin, Becker, Big Stone, Carlton, Chippewa, Clearwater, Cook, Cottonwood, Faribault, Fillmore, Grant, Hubbard, Jackson, Kanabec, Kittson, Koochiching, Lac Qui Parle, Lake, Lake of the Woods, Le Sueur, Lincoln, Mahnomen, Marshall, Meeker, Mille Lacs, Morrison, Murray, Norman, Pennington, Pine, Pipestone, Pope, Red Lake, Redwood, Renville, Rock, Roseau, Sibley, Stevens, Swift, Todd, Traverse, Wadena, Waseca, Wantonwan, Yellow Medicine counties)
Complete survey results are located in Appendix A.
Interviews with key experts
Wilder Research conducted interviews with six industry representatives, recommended for their expertise in implementation of and costs associated with home rehabilitation. The purpose of the interviews with key experts was to develop estimates of the approximate typical cost (and range of costs) of the list of 16 home improvements covered in the study (listed in the cost computation methodology section below and in Figure B1 in Appendix B).
The key experts were asked to review a list of basic renovations that homeowners may need and then provide information about the range of costs for completing the work. In particular, they were asked first to describe an example of a low-cost instance of each home improvement task (e.g., a roof replacement for a simple gable roof on a single-story home) and give an approximate cost for the job. Next, they were asked for an example of a high-cost instance of each task (e.g., a roof replacement for an old 3-story Victorian home that requires decking replacement) and asked for an approximate cost of that high-cost example. Finally, they were asked to describe the typical situation that they encounter for each home improvement task, and asked for the approximate cost of that typical job (which was, in most cases, closer to the low-cost than the high-cost scenario). Respondents were also introduced to the study goals and invited to share any additional information that they felt would be relevant to the study.
Literature review
Wilder Research conducted an extensive search of existing literature in the field to gain a better understanding of trends and programs currently doing similar work, and reviewed the relevant sources to pull out key findings and content that could inform this study. Concepts and key words used in this search included:

Home Renovation Needs of Older Adults 65 Wilder Research, December 2016
Age-in-place
Home and community-based services
Long-terms supports and services
Home renovation and rehabilitation
Functional limitations of older adults
Low-income older adults
The complete bibliography of results is located in Appendix E.
Existing data sources
Wilder Research reviewed and analyzed existing public and programmatic data to answer the following questions:
What are the demographic and disability characteristics of low-income older adults in Minnesota?
What Home and Community Based Services are used by older adults in Minnesota? What services do they need?
What supports and modifications do extremely low-income older adults use or need in their homes?
How does the cost of care in less restrictive settings compare to the costs of care in nursing homes or assisted living settings?
How many extremely low-income older adult (age 65+) households are there in Minnesota?

Home Renovation Needs of Older Adults 66 Wilder Research, December 2016
The following data sources were included in the analysis of data:
American Community Survey data and other U.S. Census Bureau data (National and Minnesota)17
Minnesota Statewide Gaps Analysis study data18
Minnesota National Core Indicators pilot study data19
National Older Americans Act and Medicare data from Administration on Aging20
MBA Title-III Consumer Feedback Survey
MetLife Market Survey of Long-Term Care Costs21
These sources were selected based on recommendations from Minnesota Housing staff and other experts, and availability through government agencies.
Complete tables with pertinent data from these sources are located in Appendix C.
Cost computation methodology
The per-household home improvement cost was computed as the sum of the costs of all improvements that homeowners reported would be necessary in their home within the next five years. This computation requires two elements:
1. A list of the improvements that the household said they will need within the next five years. In the consumer survey, respondents were given a list of 16 home improvements and asked to indicate whether they (a) already have this item or have made this improvement, (b) will need this improvement in the next five years, or (c) do not think they will need this improvement in the next five years. Respondents who
17 Data come from the Integrated Public Use Microdata Series of the U.S. Census Bureau’s American
Community Survey. IPUMS microdata are composed of individual records containing information collected on persons and households through the American Community Survey, and weighted to reflect the larger population.
18 Minnesota Department of Human Services, 2013-2014 Gaps Analysis Study. https://mn.gov/dhs/partners-and-providers/continuing-care/data-measures/gaps-analysis/current-study/
19 CI-AD collects and maintains data for states about the impact of publicly-funded services on quality of life and outcomes for older adults served by the Older Americans Act programs. Minnesota participated as a pilot site in 2014.
20 Older Americans 2016: Key Indicators of Well-Being, http://www.agingstats.gov/ and Administration on Aging: AGing Integrated Database (AGID) http://www.agid.acl.gov/
21 The 2012 MetLife Market Survey of Nursing Home, Assisted Living, Adult Day Services, and Home Care Costs https://www.metlife.com/assets/cao/mmi/publications/studies/2012/studies/mmi-2012-market-survey-long-term-care-costs.pdf
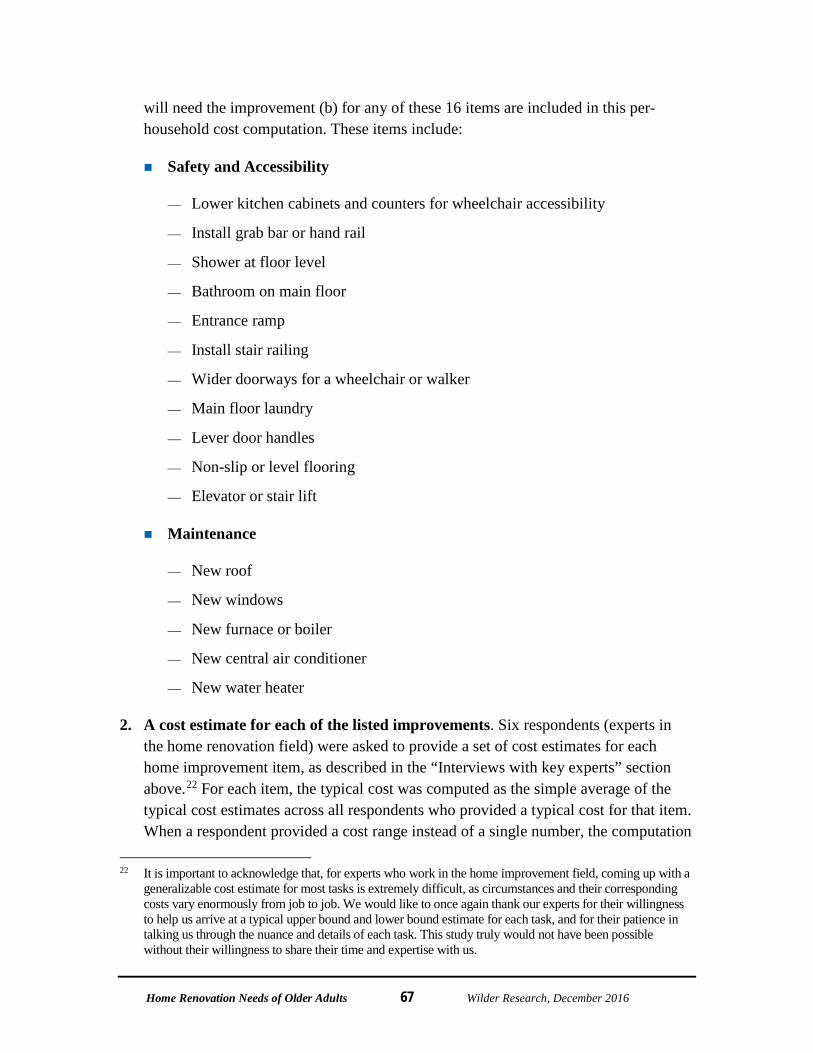
Home Renovation Needs of Older Adults 67 Wilder Research, December 2016
will need the improvement (b) for any of these 16 items are included in this per-household cost computation. These items include:
Safety and Accessibility
Lower kitchen cabinets and counters for wheelchair accessibility
Install grab bar or hand rail
Shower at floor level
Bathroom on main floor
Entrance ramp
Install stair railing
Wider doorways for a wheelchair or walker
Main floor laundry
Lever door handles
Non-slip or level flooring
Elevator or stair lift
Maintenance
New roof
New windows
New furnace or boiler
New central air conditioner
New water heater
2. A cost estimate for each of the listed improvements. Six respondents (experts in the home renovation field) were asked to provide a set of cost estimates for each home improvement item, as described in the “Interviews with key experts” section above.22 For each item, the typical cost was computed as the simple average of the typical cost estimates across all respondents who provided a typical cost for that item. When a respondent provided a cost range instead of a single number, the computation
22 It is important to acknowledge that, for experts who work in the home improvement field, coming up with a
generalizable cost estimate for most tasks is extremely difficult, as circumstances and their corresponding costs vary enormously from job to job. We would like to once again thank our experts for their willingness to help us arrive at a typical upper bound and lower bound estimate for each task, and for their patience in talking us through the nuance and details of each task. This study truly would not have been possible without their willingness to share their time and expertise with us.

Home Renovation Needs of Older Adults 68 Wilder Research, December 2016
was based on the midpoint of the range. The same procedure was applied to compute the upper bound and lower bound estimates.
For some tasks such as window replacement or installation of lever door handles, the task will involve installation of multiple items at once. In these cases, respondents often provided a per-unit cost (e.g., a cost per window opening). To convert these into a total project cost in a consistent way across all respondents, a single set of assumptions was applied to these items. For example, a low-cost window replacement job was assumed to require replacement of eight windows, so if respondents A, B, and C provided low-cost estimates of $400, $500, and $600 per window, the low-cost window replacement would be assumed to cost $4,000 (the average of $3,200, $4,000, and $4,800). The full list of these assumptions is shown in Figure B3 in Appendix B, and the full list of cost estimates for each home improvement task is shown in Figure B1 in Appendix B.
After gathering information on each household’s home improvement needs and the approximate costs of each of the improvements, the total home improvement cost could be computed for each household. This cost was computed as the sum of the costs for all home improvements reported as necessary for that household within the next five years. For example, for a household that indicated that they would need new windows, a shower at floor level, and a main floor laundry, the “typical” cost estimate for that household would be ($6,803 + $3,598 + $3,675 = ) $14,076. Finally, the average per-household cost was computed as the simple average of these individual household cost estimates (excluding households that did not indicate a need for any of the listed improvements). The same methods were applied to compute the upper bound and lower bound estimates.

Home Renovation Needs of Older Adults 69 Wilder Research, December 2016
Income thresholds for “eligible” households
In this study, “eligible households” refers to Minnesota households who own their home, have a household head that is 65 or older, and meet the income requirements for Minnesota Housing’s Rehabilitation Loan Program and Emergency & Accessibility Loan Program. The income thresholds for eligibility, based on household size, are shown below.
D1. Income thresholds for eligibility
Household size Maximum income
1 person $18,100
2 people $20,600
3 people $23,200
4 people $25,800
5 people $27,900
6 people $29,900
7 people $32,000
8 people $34,000

Home Renovation Needs of Older Adults 70 Wilder Research, December 2016
Appendix E – Bibliography Administration on Aging. (2014). A Profile of Older Americans: 2014. Retrieved from
http://www.aoa.acl.gov/aging_statistics/profile/index.aspx
Aging in Place and Universal Design: Making Your Home Accessible, No Matter Your Age or Ability. (2015). Partners for Livable Communities City Leaders Institute on Aging in Place.
Ainsworth, E., & Jonge, D. D. (2011). An Occupational Therapist’s guide to home modification practice. SLACK Incorporated.
Aplin, T., Jonge, D., & Gustafsson, L. (2015). Understanding home modifications impact on clients and their family’s experience of home: A qualitative study. Australian Occupational Therapy Journal, 62(2), 123–131. http://doi.org/10.1111/1440-1630.12156
Baby Boomers and Their Homes. (2014, October 30). Retrieved from http://demandinstitute.org/baby-boomers-and-their-homes/
Begley, J., & Lambie-Hanson, L. (2015). The home maintenance and improvement behaviors of older adults in Boston. Housing Policy Debate, 25(4), 754–781. http://doi.org/10.1080/10511482.2015.1004097
Braubach, M., & Power, A. (2011). Housing conditions and risk: Reporting on a European study of housing quality and risk of accidents for older people. Journal of Housing For the Elderly, 25(3), 288–305. http://doi.org/10.1080/02763893.2011.595615
Brettschneider, C., Luck, T., Fleischer, S., Roling, G., Beutner, K., Luppa, M., & König, H.H. (2015). Cost-utility analysis of a preventive home visit program for older adults in Germany. BMC Health Services Research, 15(1), 1–11.
Carnemolla, P., & Bridge, C. (2013). The potential of a home modification strategy: A universal design approach to existing housing. Assistive Technology Research Series, 35, 259–268.
Center for Home Care Policy & Research, The AdvantAge Initiative. (2008). AdvantAge Initiative Survey | Central Indiana. Retrieved from http://cicoa.org/about-us/our-community/advantage-initiative-survey/

Home Renovation Needs of Older Adults 71 Wilder Research, December 2016
Chase, C. A., Mann, K., Wasek, S., & Arbesman, M. (2012). Systematic review of the effect of home modification and fall prevention programs on falls and the performance of community-dwelling older adults. American Journal of Occupational Therapy, 66(3), 284–291. http://doi.org/10.5014/ajot.2012.005017
Chiatti, C., & Iwarsson, S. (2014). Evaluation of housing adaptation interventions: integrating the economic perspective into occupational therapy practice. Scandinavian Journal of Occupational Therapy, 21(5), 323–333. http://doi.org/10.3109/11038128.2014.900109
CICOA Aging & In-Home Solutions. (2008). Report to the community on older adults in central Indiana from the 2008 Indiana AdvantAge Initiative Survey (p. 36). Retrieved from http://cicoa.org/search/Report+to+the+Community+on+Older+Adults+in+Central+Indiana/
Crews, D. E., & Zavotka, S. (2006). Aging, disability, and frailty: Implications for universal design. Journal of Physiological Anthropology, 25(1), 113–118. http://doi.org/10.2114/jpa2.25.113
Croucher, K., Lowson, K., & Fountain, M. (2012). National evaluation of the handyperson programme - Publications - GOV.UK. University of York, Department for Communities and Local Government. Retrieved from https://www.gov.uk/government/publications/national-evaluation-of-the-handyperson-programme--2
Do, Y. K., & Kim, C.-S. (2013). Home ownership and fall-related outcomes among older adults in South Korea. Geriatrics & Gerontology International, 13(4), 867–873. http://doi.org/10.1111/ggi.12015
Ekstam, L., Carlsson, G., Chiatti, C., Nilsson, M. H., & Malmgren Fänge, A. (2014). A research-based strategy for managing housing adaptations: study protocol for a quasi-experimental trial. BMC Health Services Research, 14, 602. http://doi.org/10.1186/s12913-014-0602-5
Elbert, K. B., & Neufeld, P. S. (2010). Indicators of a successful naturally occurring retirement community: A case study. Journal of Housing For the Elderly, 24(3–4), 322–334. http://doi.org/10.1080/02763893.2010.522440
Engelhardt, G. V., Eriksen, M. D., & Greenhalgh-Stanley, N. (2013). A Profile of housing and health among older Americans (SSRN Scholarly Paper No. ID 2359676). Rochester, NY: Social Science Research Network. Retrieved from http://papers.ssrn.com/abstract=2359676
Home Renovation Needs of Older Adults 72 Wilder Research, December 2016
Fausset, C. B., Kelly, A. J., Rogers, W. A., & Fisk, A. D. (2011). Challenges to aging in place: Understanding home maintenance difficulties. Journal of Housing For the Elderly, 25(2), 125–141. http://doi.org/10.1080/02763893.2011.571105
Fielo, S. B., & Warren, S. A. (2001). Home adaptation: helping older people age in place. Geriatric Nursing (New York, N.Y.), 22(5), 239-247. http://doi.org/10.1067/mgn.2001.119473
Gitlin, L. N. (2015). Environmental adaptations for individuals with functional difficulties and their families in the home and community. International handbook of occupational therapy interventions (2nd ed.). Cham, Switzerland: Springer International Publishing.
Gitlin, L. N., Winter, L., Dennis, M. P., Corcoran, M., Schinfeld, S., & Hauck, W. W. (2006). A randomized trial of a multicomponent home intervention to reduce functional difficulties in older adults. Journal of the American Geriatrics Society, 54(5), 809–816. http://doi.org/10.1111/j.1532-5415.2006.00703.x
Golder, J., Kolodge, A., & Muldoon, T. (2012). Access to home modification resources for healthy aging in place. Older Adult. Retrieved from http://scholarworks.gvsu.edu/ot_older_adult/1
Good Homes for Good Lives - Project Info. (2013). Retrieved from http://repairsandmaintenance.goodhomes.co.nz/project-info/
Good practice: Integration in action – innovation in home adaptations. (2013). Retrieved from https://homeadaptationsconsortium.wordpress.com/good-practice/
Graybill, E. M., McMeekin, P., & Wildman, J. (2014). Can aging in place be cost effective? A systematic review. PLoS ONE, 9(7). http://doi.org/10.1371/journal.pone.0102705
Hammarström, G., & Torres, S. (2012). Variations in subjective well-being when “aging in place:” A matter of acceptance, predictability and control. Journal of Aging Studies, 26(2), 192–203. http://doi.org/10.1016/j.jaging.2011.12.004
Harewood, D. (2006). The effectiveness of low cost home modifications in occupational performance. ProQuest Information and Learning Company. Retrieved from https://books.google.com/books?isbn=0542901188
Harvey, L. A., Mitchell, R. J., Lord, S. R., & Close, J. C. T. (2014). Determinants of uptake of home modifications and exercise to prevent falls in community-dwelling older people. Australian & New Zealand Journal of Public Health, 38(6), 585–590. http://doi.org/10.1111/1753-6405.12243

Home Renovation Needs of Older Adults 73 Wilder Research, December 2016
Herbert, C., & Molinsky, J. H. (2014). Housing America’s older adults: Meeting the needs of an aging population. Joint Center for Housing Studies, Harvard University. Retrieved from http://www.jchs.harvard.edu/research/housing_americas_older_adults
Heywood, F. (2005). Adaptation: Altering the house to restore the home. Housing Studies, 20(4), 531–547. http://doi.org/10.1080/02673030500114409
Home Improvement Assistance. (2015). Retrieved from http://www.eldercare.gov/Eldercare.NET/Public/Resources/Factsheets/Home_Modifications.aspx
Home Modifications. (n.d.a). Administration for Community Living, Administration on Aging. Retrieved from http://www.acl.gov/NewsRoom/Publications/docs/Home_Modification.pdf
Home Modifications. (n.d.b). Retrieved April 5, 2016, from http://www.homemods.org/
Horowitz, B. P., Nochajski, S. M., & Schweitzer, J. A. (2013). Occupational therapy community practice and home assessments: Use of the Home Safety Self-Assessment Tool (HSSAT) to support aging in place. Occupational Therapy In Health Care, 27(3), 216–227.
Hwang, E., Cummings, L., Sixsmith, A., & Sixsmith, J. (2011). Impacts of home modifications on aging-in-place. Journal of Housing For the Elderly, 25(3), 246–257. http://doi.org/10.1080/02763893.2011.595611
Inter-Departmental Review of Housing Adaptations Services: Evidence Base Report. (n.d.). Department for Social Development and Department of Health, Social Services and Public Safety, Northern Ireland.
Iwarsson, S., & Ståhl, A. (2003). Accessibility, usability and universal design—positioning and definition of concepts describing person-environment relationships. Disability and Rehabilitation, 25(2), 57–66. http://doi.org/10.1080/dre.25.2.57.66
Iwarsson, S., Wahl, H. W., Nygren, C., Oswald, F., Sixsmith, A., Sixsmith, J., & Tomsone, S. (2007). Importance of the home environment for healthy aging: Conceptual and methodological background of the European ENABLE-AGE Project. The Gerontologist, 47(1), 78–84. http://doi.org/10.1093/geront/47.1.78
Johansson, K., Josephsson, S., & Lilja, M. (2009). Creating possibilities for action in the presence of environmental barriers in the process of “ageing in place.” Ageing & Society, 29(1), 49–70. http://doi.org/10.1017/S0144686X08007538

Home Renovation Needs of Older Adults 74 Wilder Research, December 2016
Johansson, K., Lilja, M., Park, M., & Josephsson, S. (2010). Balancing the good: A critical discourse analysis of home modification services. Sociology of Health & Illness, 32(4), 563–582. http://doi.org/10.1111/j.1467-9566.2009.01232.x
Johansson, K., Lilja, M., Petersson, I., & Borell, L. (2007). Performance of activities of daily living in a sample of applicants for home modification services. Scandinavian Journal of Occupational Therapy, 14(1), 44–53. http://doi.org/10.1080/11038120601094997
Johnson, R. W. (2015). Housing costs and financial challenges for low-income older adults. Urban Institute. Retrieved from http://www.urban.org/research/publication/housing-costs-and-financial-challenges-low-income-older-adults
Joint Improvement Team, Enjoy Partnership. (2013). Measuring the social return on investment of stage 3 adaptations and very sheltered housing in Scotland. Retrieved from http://www.jitscotland.org.uk/example-of-practice/social-return-on-investment-sroi-on-adaptations-and-very-sheltered-housing-bield-hanover-trust-housing-associations-and-envoy-partnership/
Jutkowitz, E., Gitlin, L. N., Pizzi, L. T., Lee, E., & Dennis, M. P. (2011). Cost effectiveness of a home-based intervention that helps functionally vulnerable older adults age in place at home. Journal of Aging Research, 2012, e680265. http://doi.org/10.1155/2012/680265, 10.1155/2012/680265
Keall, M. D., Pierse, N., Howden-Chapman, P., Cunningham, C., Cunningham, M., Guria, J., & Baker, M. G. (2015). Home modifications to reduce injuries from falls in the home injury prevention intervention (HIPI) study: a cluster-randomised controlled trial. Lancet (London, England), 385(9964), 231–238. http://doi.org/10.1016/S0140-6736(14)61006-0
Kim, H., Ahn, Y. H., Steinhoff, A., & Lee, K. H. (2014). Home modification by older adults and their informal caregivers. Archives of Gerontology and Geriatrics, 59(3), 648–656. http://doi.org/10.1016/j.archger.2014.07.012
Lansley, P., McCreadie, C., Tinker, A., Flanagan, S., Goodacre, K., & Turner-Smith, A. (2004). Adapting the homes of older people: A case study of costs and savings. Building Research & Information, 32(6), 468–483. http://doi.org/10.1080/0961321042000269429

Home Renovation Needs of Older Adults 75 Wilder Research, December 2016
Liebermann, W. K. (2013). Crossing the threshold: Problems and prospects for accessible housing design (Publication of the Joint Center for Housing Studies, Harvard University). Joint Center for Housing Studies Harvard University. Retrieved from http://www.jchs.harvard.edu/research/publications/crossing-threshold-problems-and-prospects-accessible-housing-design
Lord, S. R. (2006). Home environment risk factors for falls in older people and the efficacy of home modifications. Age and Ageing, 35 (Supplement 2), ii55-ii59. http://doi.org/10.1093/ageing/afl088
Mackenzie, L., Curryer, C., & Byles, J. E. (2015). Narratives of home and place: findings from the Housing and Independent Living Study. Ageing & Society, 35(8), 1684–1712. http://doi.org/10.1017/S0144686X14000476
Masnick, G., Will, A., & Baker, K. (2011). Housing turnover by older owners: Implications for home improvement spending as baby boomers age into retirement (Publication of the Joint Center for Housing Studies, Harvard University). Retrieved from http://www.jchs.harvard.edu/research/publications/housing-turnover-older-owners-implications-home-improvement-spending-baby
Maxfield Research, Inc. (2014). An assessment of demand for affordable senior housing in Minnesota. Retrieved from http://www.mnhomelesscoalition.org/report-an-assessment-of-demand-for-affordable-senior-housing-in-minnesota/
MetLife Mature Market Institute. (2012) The 2012 MetLife market survey of nursing home, assisted living,adult day services, and home care costs. Retrieved from https://www.metlife.com/assets/cao/mmi/publications/studies/2012/studies/mmi- 2012-market-survey-long-term-care-costs.pdf
Mustaquim, M. M. (2015). A study of universal design in everyday life of elderly adults. Procedia Computer Science, 67, 57–66. http://doi.org/10.1016/j.procs.2015.09.249
Nikolaus, T., & Bach, M. (2003). Preventing falls in community-dwelling frail older people using a home intervention team (HIT): Results from the randomized falls-HIT Trial. Journal of the American Geriatrics Society, 51(3), 300–305.
Nyman, S. R., & Ballinger, C. (2008). A review to explore how allied health professionals can improve uptake of and adherence to falls prevention interventions. The British Journal of Occupational Therapy, 71(4), 141–145. http://doi.org/10.1177/030802260807100404

Home Renovation Needs of Older Adults 76 Wilder Research, December 2016
Ogg, J., Renault, S., Hillcoat-Nalletamby, S., & Bonvalet, C. (2010). Ageing in place: a French-British comparison of adaptations to home and housing environments. Centre for Innovative Ageing. Retrieved from http://www.pssru.ac.uk/HCOPRnet/docs/mire_summary.pdf
Oswald, F., Wahl, H. W., Schilling, O., Nygren, C., Fänge, A., Sixsmith, A.,& Iwarsson, S. (2007). Relationships between housing and healthy aging in very old age. The Gerontologist, 47(1), 96–107. http://doi.org/10.1093/geront/47.1.96
Petersson, I. (2009). Everyday life and home modification for older adults : Impacts, concepts and instrument development. Institutionen för neurobiologi, vårdvetenskap och samhälle / Department of Neurobiology, Care Sciences and Society. Retrieved from http://openarchive.ki.se/xmlui/handle/10616/37819
Petersson, I., Kottorp, A., Bergström, J., & Lilja, M. (2009). Longitudinal changes in everyday life after home modifications for people aging with disabilities. Scandinavian Journal of Occupational Therapy, 16(2), 78–87. http://doi.org/10.1080/11038120802409747
Petersson, I., Lilja, M., & Borell, L. (2012). To feel safe in everyday life at home – a study of older adults after home modifications. Ageing & Society, 32(5), 791–811.
Petersson, I., Lilja, M., Hammel, J., & Kottorp, A. (2008). Impact of home modification services on ability in everyday life for people ageing with disabilities. Journal of Rehabilitation Medicine, 40(4), 253–260. http://doi.org/10.2340/16501977-0160
Pettersson, C., Löfqvist, C., & Fänge, A. M. (2012). Clients’ experiences of housing adaptations: a longitudinal mixed-methods study. Disability and Rehabilitation, 34(20), 1706–1715. http://doi.org/10.3109/09638288.2012.660596
Pleace, N. (2011). The Costs and benefits of preventative support services for older people. The Centre for Housing Policy, University of York. Retrieved from http://www.gov.scot/Topics/Built-Environment/Housing/access/ROOPH/Publications/cbpssop
Pynoos, J., Caraviello, R., & Cicero, C. (2009). Lifelong housing: The anchor in aging-friendly communities. Generations, 33(2), 26–32.
Pynoos, J., Mayeda, A., & Lee, C. (2003). Home Modification Resource Guide, Fourth Edition. The National Resource Center on Supportive Housing and Home Modification University of Southern California Andrus Gerontology Center.

Home Renovation Needs of Older Adults 77 Wilder Research, December 2016
Pynoos, J., Steinman, B. A., Nguyen, A. Q. D., & Bressette, M. (2012). Assessing and adapting the home environment to reduce falls and meet the changing capacity of older adults. Journal of Housing For the Elderly, 26(1–3), 137–155. http://doi.org/10.1080/02763893.2012.673382
Rantz, M. J., Phillips, L., Aud, M., Popejoy, L., Marek, K. D., Hicks, L. L.,Zaniletti, I.& Miller, S. J. (2011). Evaluation of aging in place model with home care services and registered nurse care coordination in senior housing. Nursing Outlook, 59(1), 37–46. http://doi.org/10.1016/j.outlook.2010.08.004
Renaut, S., Ogg, J., Petite, S., & Chamahian, A. (2015). Home environments and adaptations in the context of ageing. Ageing & Society, 35(6), 1278–1303.
Sakellariou, D. (2015). Home modifications and ways of living well. Medical Anthropology, 34(5), 456–469. http://doi.org/10.1080/01459740.2015.1012614
Salkeld, G., Cumming, R. G., O’Neill, E., Thomas, M., Szonyi, G., & Westbury, C. (2000). The cost effectiveness of a home hazard reduction program to reduce falls among older persons. Australian & New Zealand Journal of Public Health, 24(3), 265.
Salkin, P. (2008). A quiet crisis in America: Meeting the affordable housing needs of the invisible low-income healthy seniors (SSRN Scholarly Paper No. ID 1316471). Rochester, NY: Social Science Research Network. Retrieved from http://papers.ssrn.com/abstract=1316471
Samuel, L. J., Glass, T. A., Thorpe Jr., R. J., Szanton, S. L., & Roth, D. L. (2015). Household and neighborhood conditions partially account for associations between education and physical capacity in the National Health and Aging Trends Study. Social Science & Medicine, 128, 67–75. http://doi.org/10.1016/j.socscimed.2015.01.009
Saville-Smith, K., James, B., & Fraser, R. (2008). Older people’s house performance and their repair and maintenance practices: Analysis from a 2008 National Survey of Older People and Existing Datasets. CRESA. Retrieved from http://repairsandmaintenance.goodhomes.co.nz/resources/downloads/Older%20Peoples%20Combined%20Report%20Final.pdf
Scottish Government, S. A. H. (2012, July 24). The benefits of equipment and adaptations. Retrieved from http://www.gov.scot/Topics/Health/Support-Social-Care/Independent-Living/Equipment-Adaptations/ValueOfEandA

Home Renovation Needs of Older Adults 78 Wilder Research, December 2016
Senior Housing - Home Modification Home Repair Assistance. (n.d.). Retrieved from http://www.programsforelderly.com/index-senior-housing.php#homerepairsandmodificationsforseniors
Sheffield, C., Smith, C. A., & Becker, M. (2013). Evaluation of an agency-based occupational therapy intervention to facilitate aging in place. Gerontologist, 53(6), 907–918.
Smith, R. D., & Widiatmoko, D. (1998). The cost-effectiveness of home assessment and modification to reduce falls in the elderly. Australian and New Zealand Journal of Public Health, 22(4), 436–440.
Smith, S. K., Rayer, S., & Smith, E. A. (2008). Aging and disability: Implications for the housing industry and housing policy in the United States. Journal of the American Planning Association, 74(3), 289–306. http://doi.org/10.1080/01944360802197132
Smith, S. K., Rayer, S., Smith, E., Wang, Z., & Zeng, Y. (2012). Population aging, disability and housing accessibility: Implications for sub-national areas in the United States. Housing Studies, 27(2), 252–266.
Snell, T., Fernandez, J.-L., & Forder, J. (2012). Building a business case for adaptive technologies in England (London School of Economics: PSSRU) | Dementia and Elderly Care News (p. 31). PSSRU at London School of Economics and Political Science. Retrieved from http://www.pssru.ac.uk/archive/pdf/dp2831.pdf
Somerville, B. (2014). Home repair helps homeowners age in place - AARP Foundation. Retrieved from http://www.aarp.org/aarp-foundation/our-work/housing/info-2014/home-repair-keeps-seniors-safe.html
Stark, S., Landsbaum, A., Palmer, J., Somerville, E. K., & Morris, J. C. (2009). Client-centered home modifications improve daily activity performance of older adults. Canadian Journal of Occupational Therapy. Revue Canadienne D’ergotherapie, 76(Spec No), 235–245.
Stoeckel, K. (2011). The role of home environments in residential adjustment decision making in later life. Graduate Doctoral Dissertations. Retrieved from http://scholarworks.umb.edu/doctoral_dissertations/52

Home Renovation Needs of Older Adults 79 Wilder Research, December 2016
Szanton, S. L., Thorpe, R. J., Boyd, C., Tanner, E. K., Leff, B., Agree, E., Lue, Q-L., Allen, J.K., Seplaki, C.L., Weiss, C.O., Guralnik, J.M. & Gitlin, L. N. (2011). Community aging in place, advancing better living for elders: A bio‐behavioral‐environmental intervention to improve function and health‐related quality of life in disabled older adults. Journal of the American Geriatrics Society, 59(12), 2314–2320. http://doi.org/10.1111/j.1532-5415.2011.03698.x
Szanton, S. L., Wolff, J. L., Leff, B., Roberts, L., Thorpe, R. J., Tanner, E. K., Boyd, C.M., Xue, Q-L., Guralnik, J., Bishai, D. & Gitlin, L. N. (2015). Preliminary data from Community Aging in Place, Advancing Better Living for Elders, a patient‐directed, team‐based intervention to improve physical function and decrease nursing home utilization: The first 100 individuals to complete a Centers for Medicare and Medicaid Services innovation project. Journal of the American Geriatrics Society, 63(2), 371–374.
Szanton, S. L., Wolff, J. W., Leff, B., Thorpe, R. J., Tanner, E. K., Boyd, C., Xue, Q., Guralnik, J., Bishai, D. & Gitlin, L. N. (2014). CAPABLE trial: a randomized controlled trial of nurse, occupational therapist and handyman to reduce disability among older adults: rationale and design. Contemporary Clinical Trials, 38(1), 102–112. http://doi.org/10.1016/j.cct.2014.03.005
Tang, F., & Lee, Y. (2010). Home- and community-based services utilization and aging in place. Home Health Care Services Quarterly, 29(3), 138–154. http://doi.org/10.1080/01621424.2010.511518
Tang, F., & Pickard, J. G. (2008). Aging in place or relocation: Perceived awareness of community-based long-term care and services. Journal of Housing For the Elderly, 22(4), 404–422. http://doi.org/10.1080/02763890802458429
Tanner, B., Tilse, C., & Jonge, D. de. (2008). Restoring and sustaining home: The impact of home modifications on the meaning of home for older people. Journal of Housing For the Elderly, 22(3), 195–215. http://doi.org/10.1080/02763890802232048
Tenenbaum, L. (2010). Aging in place 2.0: rethinking solutions to the home care challenge. MetLife. Retrieved from https://www.metlife.com/mmi/research/aging-in-place.html#insights
Thordardottir, B., Chiatti, C., Ekstam, L., & Malmgren Fänge, A. (2015). Heterogeneity of characteristics among housing adaptation clients in Sweden—Relationship to participation and self-rated health. International Journal of Environmental Research and Public Health, 13(1), 91. http://doi.org/10.3390/ijerph13010091

Home Renovation Needs of Older Adults 80 Wilder Research, December 2016
Turner, L., & Heywood, F. (2007). Better outcomes, lower costs: implications for health and social care budgets of investment in housing adaptations, improvements and equipment: a review of the evidence: executive summary. Office for Disability Issues (UK). Retrieved from http://socialwelfare.bl.uk/subject-areas/services-client-groups/adults-disabilities/officefordisabilityissues/better107.aspx
Understanding Aging in Place and Universal Design. (2015). Retrieved from https://www.nahb.org/en/consumers/homeownership/aging-in-place-vs-universal-design.aspx
Unwin, B. K., Andrews, C. M., Andrews, P. M., & Hanson, J. L. (2009). Therapeutic home adaptations for older adults with disabilities. American Family Physician, 80(9), 963–968; hand–out 970.
U.S. Department of Housing and Urban Development. (2013). Community-Centered Solutions for Aging at Home | HUD USER. Evidence Matters, Fall. Retrieved from https://www.huduser.gov/portal/periodicals/em/fall13/highlight3.html
van Hoof, J., M, H. S., van Waarde, H., & M, M. (2010). Environmental interventions and the design of homes for older adults with dementia: An overview. American Journal of Alzheimer’s Disease and Other Dementias, 25(3), 202–232. http://doi.org/10.1177/1533317509358885
Wahl, H. W., Fänge, A., Oswald, F., Gitlin, L. N., & Iwarsson, S. (2009). The home environment and disability-related outcomes in aging individuals: What is the empirical evidence? Gerontologist, 49(3), 355–367.
Where can I get help paying for home repairs or modifications to make my home accessible? (n.d.). Retrieved from https://www.disability.gov/disability-can-get-help-modifying-home-make-accessible/
Will, A. (2015a). Aging in place: Implications for remodeling (Publication of the Joint Center for Housing Studies, Harvard University). Joint Center for Housing Studies Harvard University. Retrieved from http://www.jchs.harvard.edu/research/publications/aging-place-implications-remodeling
Will, A. (2015b). Re-weighting the number of households undertaking home improvements in the 2013 American Housing Survey to correct for shifting data collection periods (Publication of the Joint Center for Housing Studies, Harvard University) (p. 23). Joint Center for Housing Studies Harvard University. Retrieved from http://www.jchs.harvard.edu/research/publications/re-weighting-number-households-undertaking-home-improvements-2013-american

Home Renovation Needs of Older Adults 81 Wilder Research, December 2016
Will, A., & Baker, K. (2013). The role of nonprofit organizations and public programs in promoting home rehabilitation and repair activity (Publication of the Joint Center for Housing Studies, Harvard University). Joint Center for Housing Studies Harvard University. Retrieved from http://jchs.harvard.edu/research/publications/role-nonprofit-organizations-and-public-programs-promoting-home-rehabilitation
Yuen, H. K., & Carter, R. E. (2006). A predictive model for the intention to implement home modifications: A pilot study. Journal of Applied Gerontology, 25(1), 3–16. http://doi.org/10.1177/0733464805280751
Zidén, L., Kreuter, M., & Frändin, K. (2010). Long-term effects of home rehabilitation after hip fracture – 1-year follow-up of functioning, balance confidence, and health-related quality of life in elderly people. Disability and Rehabilitation, 32(1), 18–32. http://doi.org/10.3109/09638280902980910