Embed Size (px)
Citation preview
Plum Consulting, 17-19 Bedford Street, Covent Garden, London, WC2E 9HP
T: +44(20) 7868 5340, www.plumconsulting.co.uk
An assessment of spectrum management policy in India
A final report to the GSMA
David Lewin Val Jervis Chris Davis Ken Pearson
December 2008
© Plum, 2008
Table of Contents
1 Introduction ..................................................................................................................................... 1
2 The current spectrum management policy ..................................................................................... 2
3 The direct consequences of the current policy .............................................................................. 4 3.1 Introduction ............................................................................................................................... 4 3.2 The number of operators in India .............................................................................................. 4 3.3 Spectrum assignment per operator ........................................................................................... 7
3.4 The technical spectrum efficiency of mobile operators in India ................................................ 9
4 An economic assessment of the current spectrum assignment policy ........................................13
4.1 The need to balance dynamic and allocative efficiency ..........................................................13
4.2 How would increased spectrum assignments per operator impact mobile prices in
India?.......................................................................................................................................14 4.3 The impact of Indian spectrum policy on mobile competition .................................................16
4.4 Implications for the development of mobile broadband ..........................................................18
5 Conclusions and recommendations .............................................................................................21 5.1 Conclusions .............................................................................................................................21
5.2 Recommendations ..................................................................................................................22
Annex A Comparison of spectrum efficiency.......................................................................................24
Annex B Deployment of advanced technologies for spectral efficiency in India ..................................28
Annex C Allocative efficiency gains from additional spectrum .............................................................33
Annex D Current spectrum assignments in Delhi ................................................................................37
© Plum, 2008 1
1 Introduction
In an Order dated the 16th of June 2008, the Government of India established a Committee to
recommend a method for the future assignment of cellular mobile spectrum. As part of its terms of
reference, the Committee is required to:
“recommend the method to be followed for the allocation [sic] of spectrum for Access Telecom
Services” and to
“reward Access Service providers for efficient use of spectrum and Penalise them for inefficient
use”
This study, commissioned by the GSMA, is designed to provide input to the Committee. It provides an
independent assessment of the current spectrum policy in India from a public interest perspective. In
particular it considers the impact which the current spectrum assignment policy has on the economic
and social development of India. The study is based upon:
A review of recent relevant presentations by India's GSM and CDMA operators on the issue of
spectrum management
Benchmarks of 2G cellular mobile assignments in India to assess how assignments per operator
and spectrum efficiency in India compare with international norms
An independent assessment of the extent to which Indian operators have introduced spectrum
optimisation technologies
Analysis of how the number of mobile operators per country has changed over the past 10 years.
Chapter 2 provides a brief review of current spectrum policy while Chapter 3 assesses the direct
consequences of this policy. Chapter 4 then provides an assessment of the economic impact of these
consequences, before we draw conclusions and make recommendations to the Committee in
Chapter 5.
© Plum, 2008 2
2 The current spectrum management policy
Under the current spectrum policy in India:
Initial spectrum is bundled with each licence
Newly licensed cellular operators receive an initial assignment of spectrum to enable them to start
operations. GSM licensees receive 2x4.4 MHz and CDMA licensees 2x2.5 MHz
Operators then receive additional spectrum as the number of subscribers grow. This is available
on a first come first serve basis to any entity which complies with the eligibility criteria on
subscriber numbers.
In the initial years the Indian Government followed a case by case approach, which was subsequently
formalized into subscriber linked criteria in 2002. The number of subscribers required to be eligible for
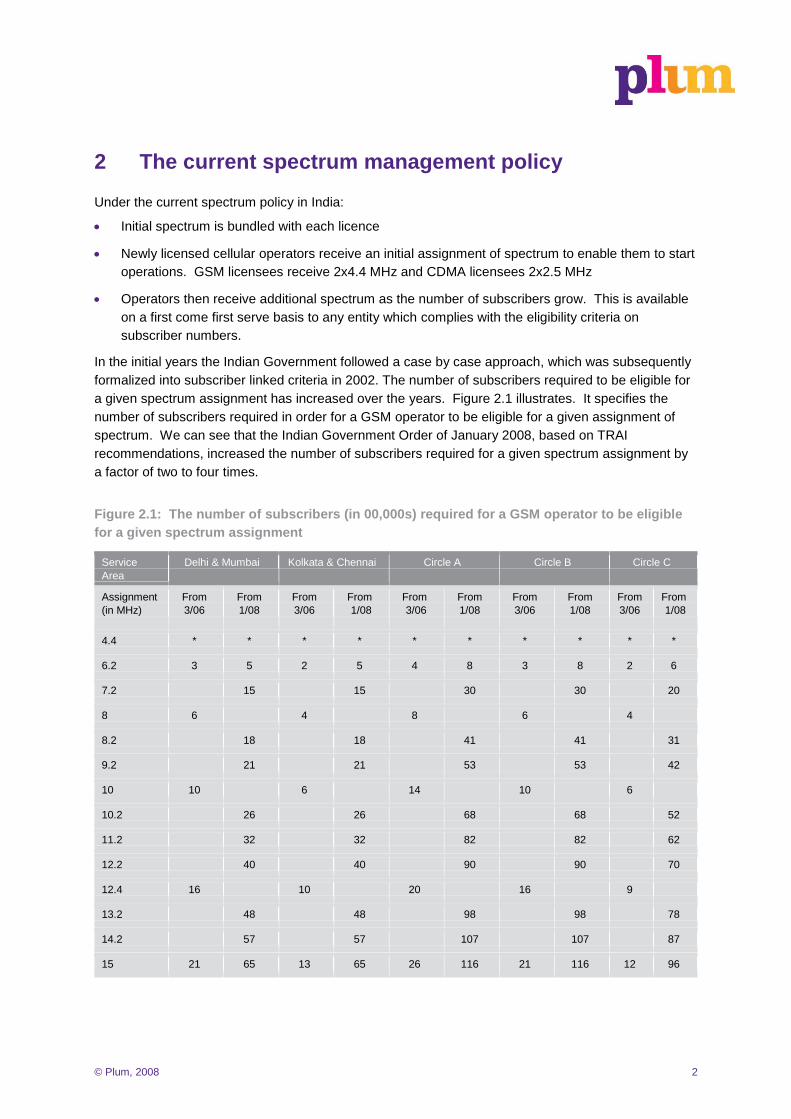
a given spectrum assignment has increased over the years. Figure 2.1 illustrates. It specifies the
number of subscribers required in order for a GSM operator to be eligible for a given assignment of
spectrum. We can see that the Indian Government Order of January 2008, based on TRAI
recommendations, increased the number of subscribers required for a given spectrum assignment by
a factor of two to four times.
Figure 2.1: The number of subscribers (in 00,000s) required for a GSM operator to be eligible
for a given spectrum assignment
Service
Area
Delhi & Mumbai Kolkata & Chennai Circle A Circle B Circle C
Assignment
(in MHz)
From
3/06
From
1/08
From
3/06
From
1/08
From
3/06
From
1/08
From
3/06
From
1/08
From
3/06
From
1/08
4.4 * * * * * * * * * *
6.2 3 5 2 5 4 8 3 8 2 6
7.2 15 15 30 30 20
8 6 4 8 6 4
8.2 18 18 41 41 31
9.2 21 21 53 53 42
10 10 6 14 10 6
10.2 26 26 68 68 52
11.2 32 32 82 82 62
12.2 40 40 90 90 70
12.4 16 10 20 16 9
13.2 48 48 98 98 78
14.2 57 57 107 107 87
15 21 65 13 65 26 116 21 116 12 96
© Plum, 2008 3
This spectrum assignment policy is unusual, if not unique. Elsewhere in the world operators typically
receive the full amount of spectrum in a specified band at the time they are licensed – even though
parts of the spectrum may be unusable until existing users have vacated the allocated spectrum1.
We can find no explicit statement which sets out the reasoning which underlies India's spectrum
management policy. But based upon a review of relevant documents and discussions with operators
we have identified three likely reasons. Such a policy:
Makes it easier for the Government to license new entrants and thus increase the level of
competition in the cellular mobile markets
Helps the spectrum manager deal with problems of spectrum scarcity in India. Most countries
have allocated between 2x90 MHz and 2x110 MHz of 2G spectrum. India has so far allocated
between 2x40 and 2x70 MHz in most circles. This reflects the fact that parts of the 2G spectrum
identified by ITU is still used by the military in India and is only gradually being released. Linking
spectrum assignment to subscriber numbers allows the spectrum manager, at least in theory, to
match spectrum assignment to spectrum availability more easily.
Allows the Government to follow a prescriptive approach towards spectrum utilization by
operators.
We assess the degree to which the objectives which underpin the policy are being met in Chapter 4.
But first we consider the direct consequences of the policy.
1 This applies to the bulk of countries with three to five operators rather than to countries with a duopoly
© Plum, 2008 4
3 The direct consequences of the current policy
3.1 Introduction
The current policy has a number of important consequences. It means that:
India has more operators per circle than other countries. While most countries have assigned
spectrum to three to five operators to compete in a given area, the Indian government has
assigned spectrum to as many as 11 or 12 operators which use a mix of GSM and CDMA
technologies and promised spectrum to an additional 3 or 4
Because of the limited availability of spectrum, mobile operators in India must use assignments
which are around one quarter of the spectrum available to mobile operators elsewhere in the
world
Because of these restricted assignments, mobile operators in India are using their spectrum far
more intensively than operators elsewhere. We estimate that, when measured using the
spectrum utilisation measure of busy hour traffic per square kilometre per MHz in dense urban
areas, Indian operators are extracting around eight times more capacity than operators in the UK,
Hong Kong, or Singapore.
We set out the evidence which has led us to these conclusions in the rest of this chapter.
3.2 The number of operators in India
Figure 3.1 compares the number of cellular operators in the Indian circles with the number in other
countries. There are five categories of operators with claims on 2G spectrum:
Operational GSM operators
GSM operators to whom spectrum has been assigned but who are not yet operational
GSM operators to whom spectrum has been promised
Operational CDMA operators
CDMA operators to whom spectrum has been assigned but who are not yet operational.
In compiling the table we have treated organisations running both a GSM and a CDMA network in the
same circle as separate networks.
© Plum, 2008 5
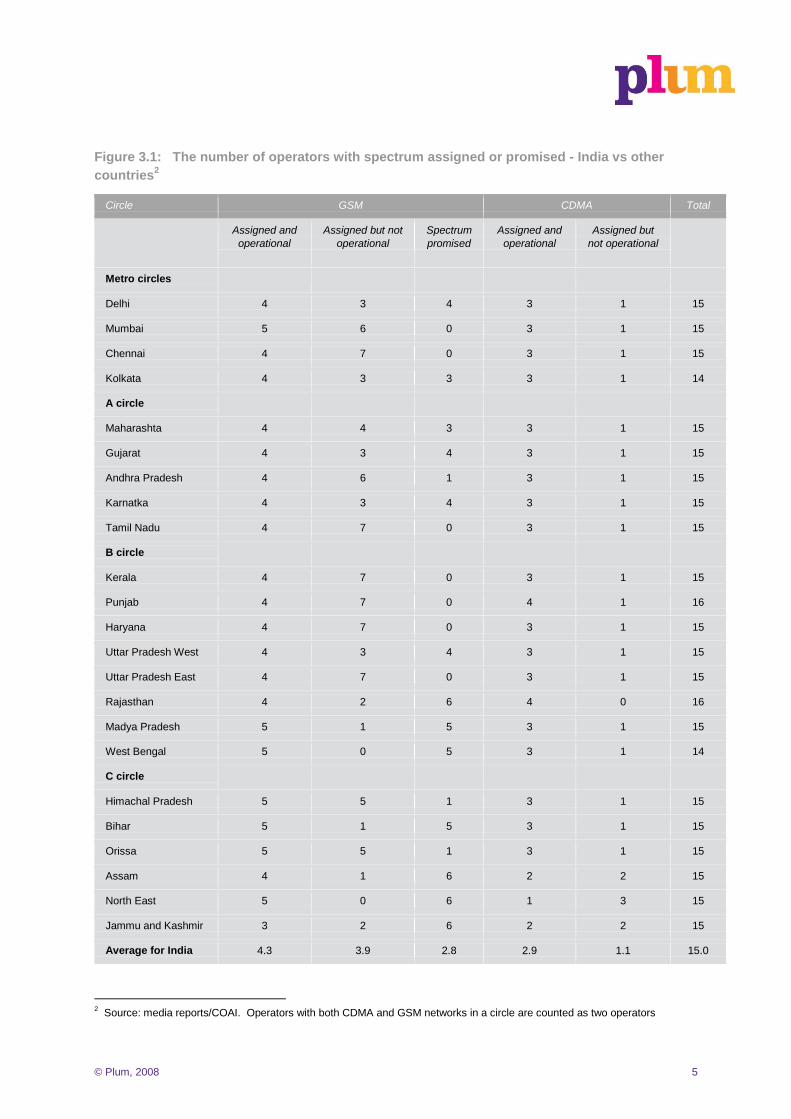
Figure 3.1: The number of operators with spectrum assigned or promised - India vs other
countries2
Circle GSM CDMA Total
Assigned and
operational
Assigned but not
operational
Spectrum
promised
Assigned and
operational
Assigned but
not operational
Metro circles
Delhi 4 3 4 3 1 15
Mumbai 5 6 0 3 1 15
Chennai 4 7 0 3 1 15
Kolkata 4 3 3 3 1 14
A circle
Maharashta 4 4 3 3 1 15
Gujarat 4 3 4 3 1 15
Andhra Pradesh 4 6 1 3 1 15
Karnatka 4 3 4 3 1 15
Tamil Nadu 4 7 0 3 1 15
B circle
Kerala 4 7 0 3 1 15
Punjab 4 7 0 4 1 16
Haryana 4 7 0 3 1 15
Uttar Pradesh West 4 3 4 3 1 15
Uttar Pradesh East 4 7 0 3 1 15
Rajasthan 4 2 6 4 0 16
Madya Pradesh 5 1 5 3 1 15
West Bengal 5 0 5 3 1 14
C circle
Himachal Pradesh 5 5 1 3 1 15
Bihar 5 1 5 3 1 15
Orissa 5 5 1 3 1 15
Assam 4 1 6 2 2 15
North East 5 0 6 1 3 15
Jammu and Kashmir 3 2 6 2 2 15
Average for India 4.3 3.9 2.8 2.9 1.1 15.0
2 Source: media reports/COAI. Operators with both CDMA and GSM networks in a circle are counted as two operators
© Plum, 2008 6
Circle GSM CDMA Total
Assigned and
operational
Assigned but
not operational
Spectrum
promised
Assigned and
operational
Assigned but
not operational
Other countries
HK (1) 5 0 0 0 0 5
Indonesia (2) 5 0 0 0 0 5
Korea 0 0 0 3 0 3
Malaysia 3 0 0 0 0 3
Netherlands (3) 4 0 0 0 0 4
Pakistan 5 0 0 0 0 5
Singapore 3 0 0 0 0 3
UK (4) 4 0 0 0 0 4
Average for other countries 4.0
(1) Excludes one CDMA operator licensed primarily for use by roamers from mainland China
(2) Old NMT 450 licensee excluded
(3) Excludes 29 MHz available for a fourth licensee
(4) Excludes Hutchison 3 which is a 3G only operator
Figure 3.1 shows that:
Spectrum has been assigned to between nine and 16 operators in the various circles of India. In
a typical circle there might be four GSM and three CDMA operators offering service with a further
four operators with spectrum assigned but yet to start operations
In addition spectrum has been promised to a further six operators in some circles. Keeping these
promises will mean that, as new 2G spectrum becomes available, it will go to the new operators
rather than being used to increase the assignment of existing operators
In other countries spectrum is typically assigned to three to five operators only.
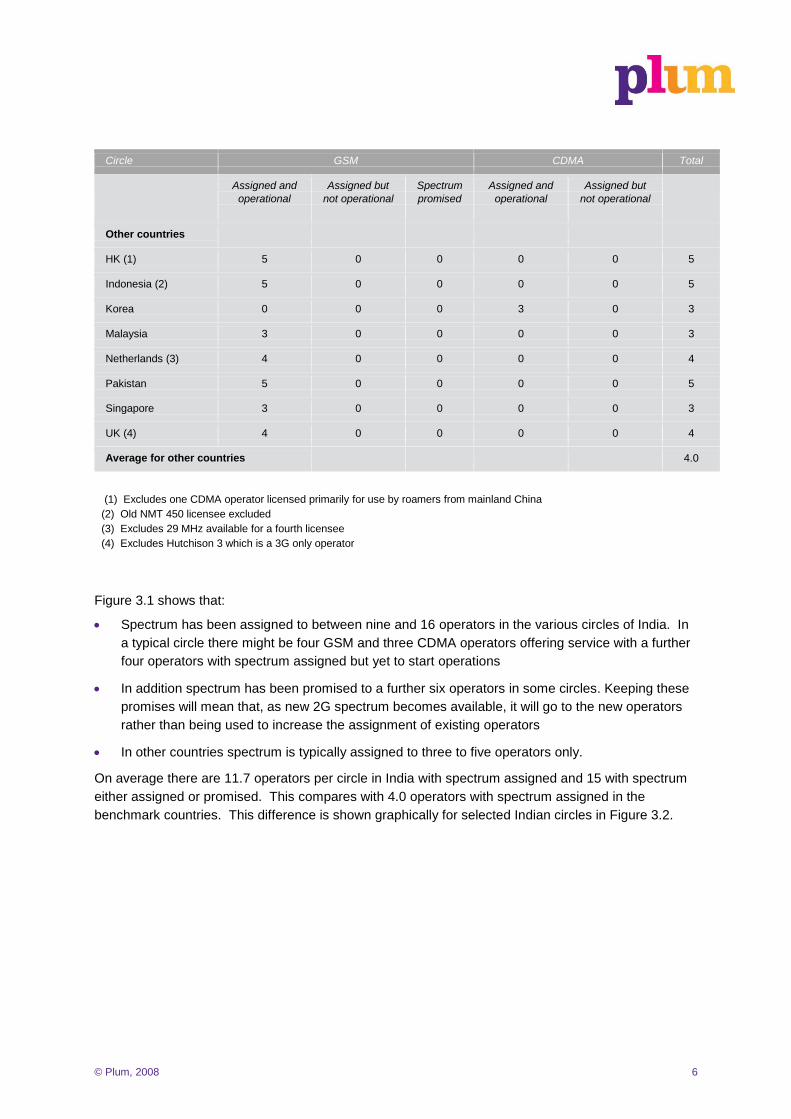
On average there are 11.7 operators per circle in India with spectrum assigned and 15 with spectrum
either assigned or promised. This compares with 4.0 operators with spectrum assigned in the
benchmark countries. This difference is shown graphically for selected Indian circles in Figure 3.2.
© Plum, 2008 7
Figure 3.2: Number of operators - graphical format
0 2 4 6 8 10 12 14 16 18
HK
Indonesia
Korea
Malaysia
Netherlands
Pakistan
Singapore
UK
Delhi
Mumbai
Gujarat
Kolkata
Punjab
West Bengal
Number of cellular operators with spectrum assigned or promised
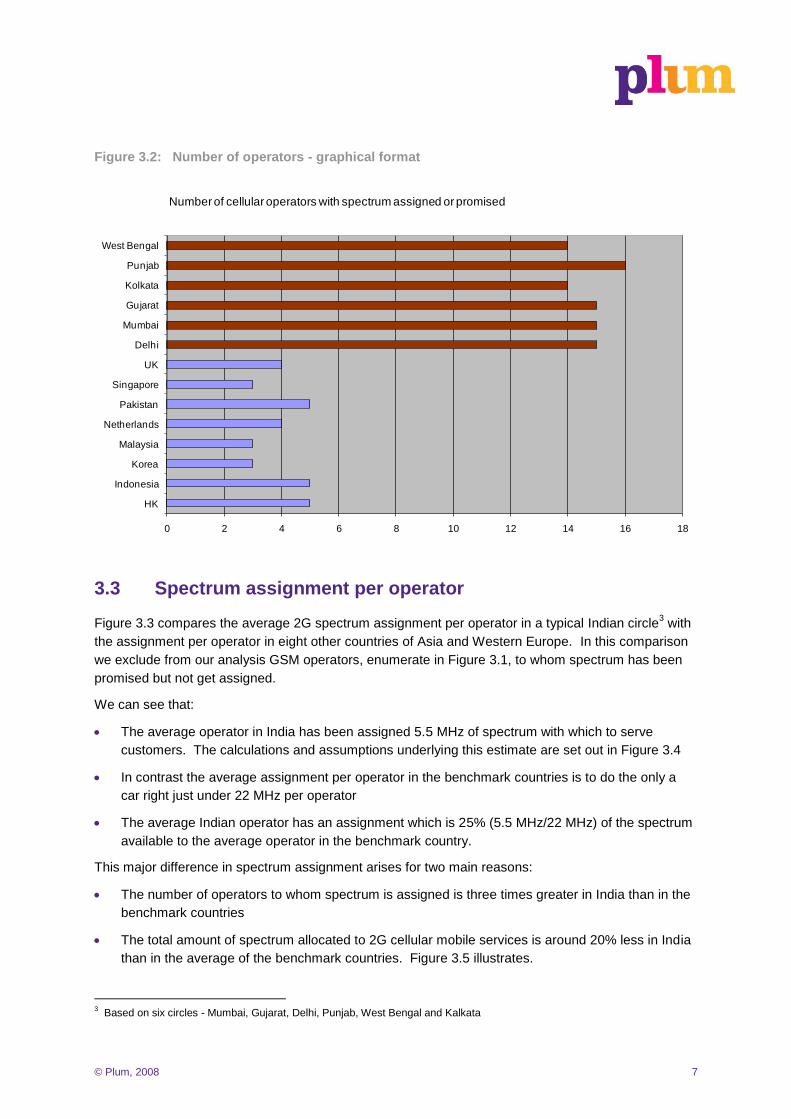
3.3 Spectrum assignment per operator
Figure 3.3 compares the average 2G spectrum assignment per operator in a typical Indian circle3 with
the assignment per operator in eight other countries of Asia and Western Europe. In this comparison
we exclude from our analysis GSM operators, enumerate in Figure 3.1, to whom spectrum has been
promised but not get assigned.
We can see that:
The average operator in India has been assigned 5.5 MHz of spectrum with which to serve
customers. The calculations and assumptions underlying this estimate are set out in Figure 3.4
In contrast the average assignment per operator in the benchmark countries is to do the only a
car right just under 22 MHz per operator
The average Indian operator has an assignment which is 25% (5.5 MHz/22 MHz) of the spectrum
available to the average operator in the benchmark country.
This major difference in spectrum assignment arises for two main reasons:
The number of operators to whom spectrum is assigned is three times greater in India than in the
benchmark countries
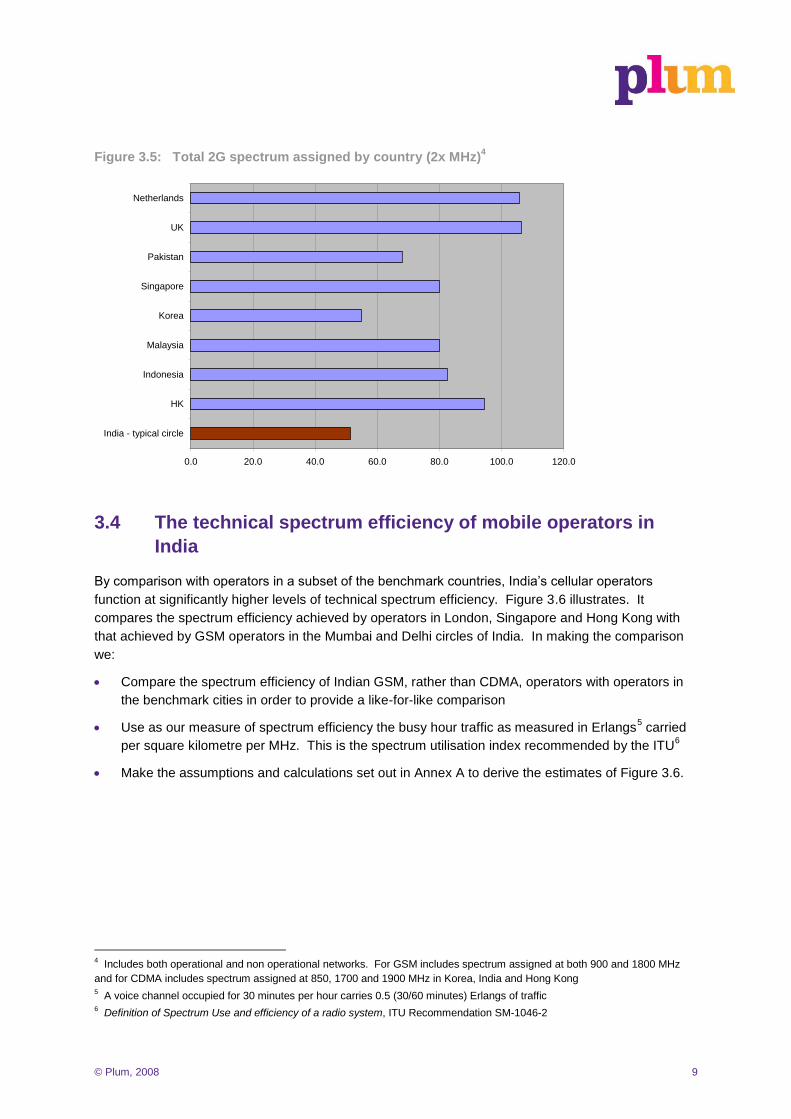
The total amount of spectrum allocated to 2G cellular mobile services is around 20% less in India
than in the average of the benchmark countries. Figure 3.5 illustrates.
3 Based on six circles - Mumbai, Gujarat, Delhi, Punjab, West Bengal and Kalkata
© Plum, 2008 8
Figure 3.3 2G spectrum per operator (2xMHz)
0.0 5.0 10.0 15.0 20.0 25.0 30.0
India - typicalcircle
HK
Indonesia
Malaysia
Korea
Singapore
Pakistan
UK
Netherlands
Figure 3.4: Estimating the spectrum assignments in selected circles (2x MHz)
Circle total total ops MHz/op
Operational Non operational(2) Operational (1) Non operational(3)
Delhi (4) 40.4 13.2 15 2.5 71.1 11 6.5
Gujarat 32.2 13.2 11.25 2.5 59.15 11 5.4
Kolkata 34 13.2 11.25 2.5 60.95 11 5.5
Punjab 31.8 30.8 15 2.5 80.1 16 5.0
Mumbai 46 26.4 15 2.5 89.9 15 6.0
West Bengal 31 0 7.5 2.5 41 9 4.6
total 215.4 96.8 75 15 402.2 73 5.5
(1) Assumes all CDMA operators have same assignment as TTSL
(2) No of non operational GSM operators with spectrum assigned x 4.4 MHz
(2) No of non operational CDMA operators with spectrum assigned x 2.5 MHz
(4) See Annex D for details
Assigned to GSM ops (2xMHz) Assigned to CDMA ops (2xMHz)
© Plum, 2008 9
Figure 3.5: Total 2G spectrum assigned by country (2x MHz)4
0.0 20.0 40.0 60.0 80.0 100.0 120.0
India - typical circle
HK
Indonesia
Malaysia
Korea
Singapore
Pakistan
UK
Netherlands
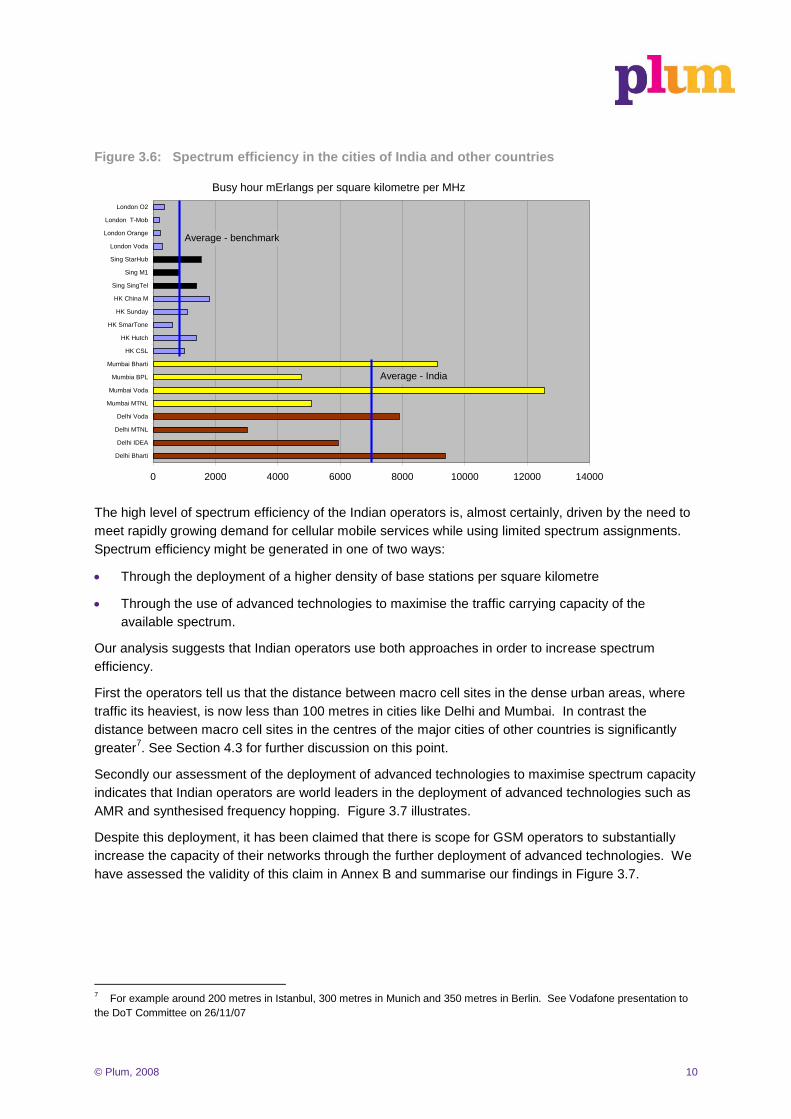
3.4 The technical spectrum efficiency of mobile operators in
India
By comparison with operators in a subset of the benchmark countries, India‟s cellular operators
function at significantly higher levels of technical spectrum efficiency. Figure 3.6 illustrates. It
compares the spectrum efficiency achieved by operators in London, Singapore and Hong Kong with
that achieved by GSM operators in the Mumbai and Delhi circles of India. In making the comparison
we:
Compare the spectrum efficiency of Indian GSM, rather than CDMA, operators with operators in
the benchmark cities in order to provide a like-for-like comparison
Use as our measure of spectrum efficiency the busy hour traffic as measured in Erlangs5 carried
per square kilometre per MHz. This is the spectrum utilisation index recommended by the ITU6
Make the assumptions and calculations set out in Annex A to derive the estimates of Figure 3.6.
4 Includes both operational and non operational networks. For GSM includes spectrum assigned at both 900 and 1800 MHz
and for CDMA includes spectrum assigned at 850, 1700 and 1900 MHz in Korea, India and Hong Kong 5 A voice channel occupied for 30 minutes per hour carries 0.5 (30/60 minutes) Erlangs of traffic
6 Definition of Spectrum Use and efficiency of a radio system, ITU Recommendation SM-1046-2
© Plum, 2008 10
Figure 3.6: Spectrum efficiency in the cities of India and other countries
0 2000 4000 6000 8000 10000 12000 14000
Delhi Bharti
Delhi IDEA
Delhi MTNL
Delhi Voda
Mumbai MTNL
Mumbai Voda
Mumbia BPL
Mumbai Bharti
HK CSL
HK Hutch
HK SmarTone
HK Sunday
HK China M
Sing SingTel
Sing M1
Sing StarHub
London Voda
London Orange
London T-Mob
London O2
Busy hour mErlangs per square kilometre per MHz
Average - benchmark
Average - India
The high level of spectrum efficiency of the Indian operators is, almost certainly, driven by the need to
meet rapidly growing demand for cellular mobile services while using limited spectrum assignments.
Spectrum efficiency might be generated in one of two ways:
Through the deployment of a higher density of base stations per square kilometre
Through the use of advanced technologies to maximise the traffic carrying capacity of the
available spectrum.
Our analysis suggests that Indian operators use both approaches in order to increase spectrum
efficiency.
First the operators tell us that the distance between macro cell sites in the dense urban areas, where
traffic its heaviest, is now less than 100 metres in cities like Delhi and Mumbai. In contrast the
distance between macro cell sites in the centres of the major cities of other countries is significantly
greater7. See Section 4.3 for further discussion on this point.
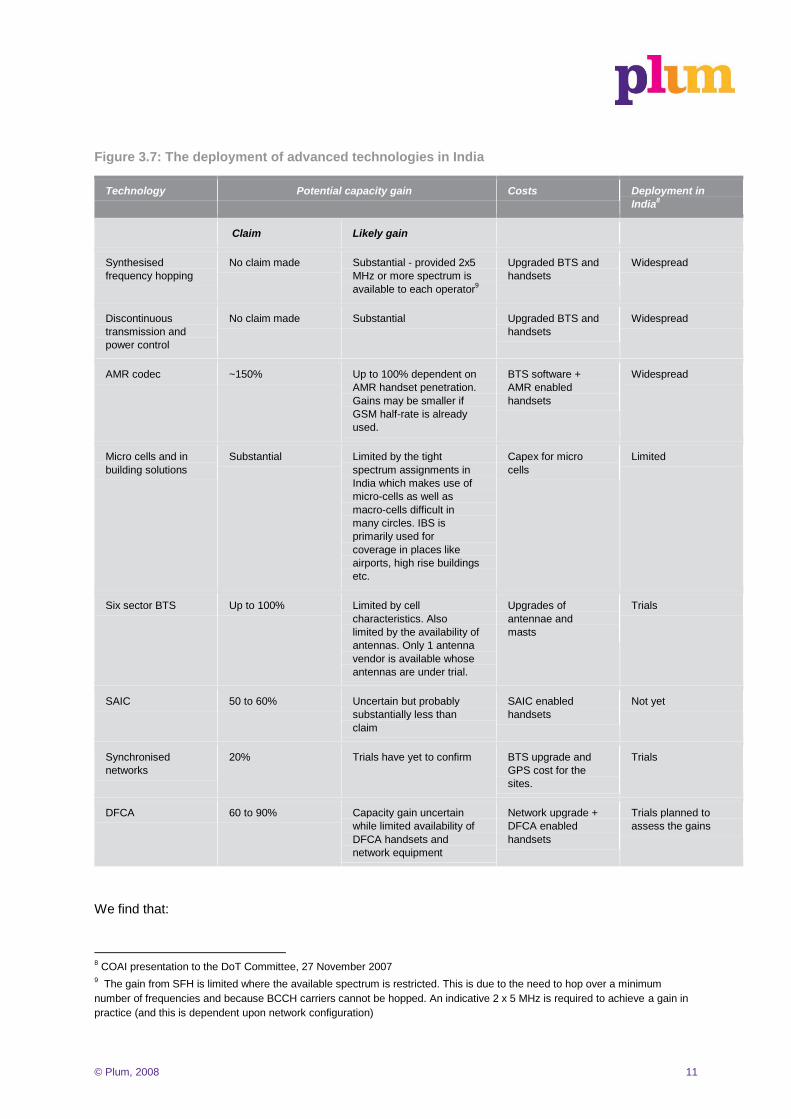
Secondly our assessment of the deployment of advanced technologies to maximise spectrum capacity
indicates that Indian operators are world leaders in the deployment of advanced technologies such as
AMR and synthesised frequency hopping. Figure 3.7 illustrates.
Despite this deployment, it has been claimed that there is scope for GSM operators to substantially
increase the capacity of their networks through the further deployment of advanced technologies. We
have assessed the validity of this claim in Annex B and summarise our findings in Figure 3.7.
7 For example around 200 metres in Istanbul, 300 metres in Munich and 350 metres in Berlin. See Vodafone presentation to
the DoT Committee on 26/11/07
© Plum, 2008 11
Figure 3.7: The deployment of advanced technologies in India
Technology Potential capacity gain Costs Deployment in
India8
Claim Likely gain
Synthesised
frequency hopping
No claim made Substantial - provided 2x5
MHz or more spectrum is
available to each operator9
Upgraded BTS and
handsets
Widespread
Discontinuous
transmission and
power control
No claim made Substantial Upgraded BTS and
handsets
Widespread
AMR codec ~150% Up to 100% dependent on
AMR handset penetration.
Gains may be smaller if
GSM half-rate is already
used.
BTS software +
AMR enabled
handsets
Widespread
Micro cells and in
building solutions
Substantial Limited by the tight
spectrum assignments in
India which makes use of
micro-cells as well as
macro-cells difficult in
many circles. IBS is
primarily used for
coverage in places like
airports, high rise buildings
etc.
Capex for micro
cells
Limited
Six sector BTS Up to 100% Limited by cell
characteristics. Also
limited by the availability of
antennas. Only 1 antenna
vendor is available whose
antennas are under trial.
Upgrades of
antennae and
masts
Trials
SAIC 50 to 60% Uncertain but probably
substantially less than
claim
SAIC enabled
handsets
Not yet
Synchronised
networks
20% Trials have yet to confirm BTS upgrade and
GPS cost for the
sites.
Trials
DFCA 60 to 90% Capacity gain uncertain
while limited availability of
DFCA handsets and
network equipment
Network upgrade +
DFCA enabled
handsets
Trials planned to
assess the gains
We find that:
8 COAI presentation to the DoT Committee, 27 November 2007
9 The gain from SFH is limited where the available spectrum is restricted. This is due to the need to hop over a minimum
number of frequencies and because BCCH carriers cannot be hopped. An indicative 2 x 5 MHz is required to achieve a gain in
practice (and this is dependent upon network configuration)
© Plum, 2008 12
The claims regarding the scale of the capacity increases possible with the use of various
techniques are significantly overstated
In the case of adaptive multi-rate (AMR) codecs this technique is already being deployed on a
widespread basis by GSM operators in India
The claims wrongly assume that the capacity gains from the different techniques are additive.
This is simply not true in a number of cases. For example the gain achievable with DFCA is less
if AMR has already been implemented.
There are substantial costs associated with deploying advanced techniques - both for operators in
terms of network upgrades and for end users in terms of new handsets
It is important to be aware that deployment of some of the techniques, such as AMR HR, leads to
lower quality of service
The focus on spectrum optimisation techniques for 2G networks fails to take into account the fact
that the efforts of the suppliers have now shifted from 2G optimisation to 3G deployment.
Those making these claims seek more intensive deployment of advanced techniques to maximise
technical spectrum efficiency. But a better policy objective, as we argue in Section 4.1, is overall
economic efficiency. From this perspective it only makes sense to deploy advanced technologies
when this is a lower cost way of increasing capacity than adding further base stations. Indeed it is
against the interests of the Indian economy to deploy them if this is not the case.
© Plum, 2008 13
4 An economic assessment of the current spectrum assignment policy
4.1 The need to balance dynamic and allocative efficiency
In developing spectrum policy in India it is important for the Committee on Spectrum Assignment to
maximise economic efficiency in the way scarce spectrum is assigned. This requires the Committee
to balance:
Dynamic efficiency gains which arise through increased competition between cellular operators.
One obvious way to make such gains is to increase the number of operators. We look at how
these gains change as the number of operators increases in Section 4.3
Allocative efficiency in which the overall costs of the industry are minimised. There are two
effects here:
– First each new operator incurs fixed costs in terms of core network and IT systems,
marketing, management and network coverage costs regardless of the scale of its
operations. In particular in areas where cells are coverage limited10
each operator must
deploy the same radio access network, with the same number of cells as its rivals, if it is to
offer competitive coverage. So total costs are lower with fewer operators. Such effects
mean that there are economies of scale in the production of mobile services and, for a given
level of competition and market size, each additional mobile operator raises the unit costs of
the industry
– Secondly the industry's combined radio access network costs rise in areas where the radio
access network is capacity rather than coverage limited, as the number of operators
increases and the amount of spectrum per operator decreases11
. There are two main
reasons:
– The total number of cells required increases as the number of operators grows
– Fragmentation of spectrum assignment has technical effects which reduce the traffic
carrying capacity per MHz. These are discussed in Section 4.2 below.
So far policymakers have focused on maximising dynamic efficiencies by increasing competition. For
example they have, over the past few years, assigned newly released spectrum to new entrants rather
than to existing cellular operators so as to increase competition and make dynamic efficiency gains.
At the same time they have tightened the criteria for assignment of additional spectrum to existing
operators as illustrated in Figure 2.1. This means that existing operators must improve their spectrum
efficiency if they are to handle new subscribers and additional traffic.
Policymakers do not so far appear to have taken any account of the need to maximise allocative
efficiency as well. For example they have not yet considered the impact of restricting spectrum
assignments to the existing operators on the industry's radio access network costs.
10
i.e. the cell never reaches its busy hour capacity but is provided to serve customers wanting high levels of geographic
coverage 11
Assuming a fixed allocation of 2G spectrum in India
© Plum, 2008 14
In effect the current spectrum assignment policy is designed to maximise the technical spectrum
efficiency of the cellular industry rather than to maximise its overall economic efficiency. We believe it
is important for the Committee on Spectrum Assignment to set itself the objective of maximising
overall economic efficiency before developing detailed policies for assigning spectrum.
4.2 How would increased spectrum assignments per operator
impact mobile prices in India?
What would happen to long run costs for cellular mobile services in India if the assignment of
spectrum per operator were increased four fold, with corresponding reductions in the number of
operators. Such changes reflect the difference between the benchmark average of just under 22 MHz
per operator and the Indian average of 5.5 MHz per operator?
First there is an increase in the economies of scale in the deployment of cell sites:
In areas where cells are coverage limited (i.e. the cell never reaches its busy hour capacity but is
provided to serve customers wanting high levels of geographic coverage) each operator must
deploy the same radio access network, with the same number of cells as its rivals, if it is to offer
competitive coverage. So total costs are lower with fewer operators
In areas where a cell is capacity limited more spectrum leads to an increase in busy hour
capacity. So, although the total traffic carried by each operator rises as the number of operators
falls, the number of cell sites required per operator does not increase, and the total number of cell
sites required falls significantly. Given that a substantial part of the cost of deploying a cell site is
not traffic sensitive, the total cost of deploying radio access networks falls as the number of
operators shrinks and the unit costs of carrying traffic falls.
Secondly the increase in spectrum per operator increases the traffic handling capacity of each MHz in
three main ways:
The trunking efficiency of the cell site increases, allowing higher utilisation for a given grade of
service. For example utilisation of a cell with a 15 voice channel capacity can reach 60% before
the probability of a blocked call in the busy hour exceeds 2%. In contrast utilisation of a cell with
50 voice channel capacity can reach 80% for the same grade of service
The first 2.4 MHz of spectrum allocated to GSM must be transmitted at full power in order for the
broadcast control channel (BCCH) to function. This means that the reuse factor12
for the spectrum
is 12 or more. Additional spectrum can be subjected to power control technologies which enables
significantly lower reuse factors. This means that an operator can carry significantly more voice
traffic on the second and subsequent 2.4 MHz assignments of spectrum than on the first 2.4 MHz
As the distance between sites decreases below 1 km13
cell capacity is reduced because of
increased interference. Up to 600 metres from a base station14
signal strength reduces in inverse
proportion to the square of the distance. At greater distances it falls much more rapidly - in
inverse proportion to the fourth power of the distance. This means that when inter-cell distances
12
The reuse factor measures the number of cells which require different frequencies before the spectrum can be reused. The
higher the reuse factor, the lower is the traffic handling capacity of a given assignment of spectrum. 13
Using 900 MHz spectrum 14
With a height of 10 m
© Plum, 2008 15
fall below 1000 metres there is increased interference between cells using the same frequency
and network capacity is reduced. So in India, where inter-cell distances in urban areas are shorter
than in countries with more generous assignments of spectrum per operator, this effect leads to a
loss of capacity per MHz. Conversely capacity per MHz rises as inter-cell distances grow beyond
1000 metres.
The combined effect of these three factors is to substantially increase the traffic carrying capability of
each MHz of spectrum as the assignment becomes more generous. For example Vodafone15
estimates that:
An operator with 2x6 MHz of spectrum can carry six Erlangs of traffic per MHz per sector while
An operator with 2x12 MHz of spectrum can carry nine Erlangs of traffic per MHz per sector.
In other words there is a 50% increase in the traffic carrying capability of each MHz for the operator
with the more generous assignment.
We estimate the net effect of these changes on the cost base of the Indian operators in Annex C. We
assume that:
The cost structure of the Indian operators reflects that reported in the PWC benchmarking study
of Indian operators16
35% of traffic is generated in cells which are capacity rather than coverage limited
65% of capital expenditure and 90% of network operating expenditure are radio access network
related.
Given these assumptions we calculate that increasing spectrum assignment to international norms17
would lower the Indian industry's current cost base by 21% or Rs 117 billion per year (as estimated in
Annex C). This cost reduction provides an estimate of the scale of allocative efficiency losses which
the current spectrum assignment policy generates. It is worth noting that the estimate of Annex C is
conservative in that it excludes the effects of many of the fixed costs per operator18
.
Were the Indian authorities to have pursued a policy of spectrum assignment to international norms, it
is highly likely that this cost reduction would have translated into lower prices rather than be taken as
increased profits, given the highly competitive nature of retail mobile markets. This would, in turn,
have had the following positive effects on the Indian economy:
Lower prices would have increased the level of usage by existing users and so increased
consumer welfare. This is roughly equal to the cost reduction of Rs 117 billion per year calculated
in Annex C
Lower prices would have made mobile services more affordable to lower income groups within
India - so leading to faster take-up of mobile services among the urban poor and the rural
population of India
15
Spectrum policy - International trends, Professor Mike Walker, 19/9/08 16
Indian GSM cellular benchmark study 2007, PWC, 2008 17
With a corresponding decrease in the number of mobile operators 18
For example IT or core network costs
© Plum, 2008 16
The lower prices would have stimulated GDP growth. According to studies by Waverman19
and
Indepen20
such accelerated growth could have a very substantial impact on the rate of growth of
GDP in India. Waverman, for example, found that a 10% increase in mobile penetration would
lead, in a low-income country like India, to an additional 0.6% per annum growth in GDP - net of
any effect of GDP stimulating demand for telecommunications. A 21% decrease in price might, if
we assume a subscriber price elasticity of -0.5, produce a 10% increase in demand and a 0.6%
pa addition to GDP. Currently this is worth Rs 240 billion per year to the Indian economy.
The calculation set out above estimates the likely losses to the Indian economy from pursuing its
current spectrum assignment policy. But how quickly can India reduce its losses by following a policy
which allows industry consolidation in the mobile services sector? Clearly the situation cannot change
overnight. But the mobile market in India is very dynamic. At 27% mobile penetration is a long way
from saturation and mobile broadband is still in its infancy. In these circumstances changing to a more
economically efficient spectrum assignment policy should have substantial and relatively rapid positive
effects.
4.3 The impact of Indian spectrum policy on mobile competition
How effective has the Indian policy, of assigning spectrum to 10 to 12 operators per circle been in
increasing competition in the Indian mobile market?
In general additional operators increase the intensity of competition. But there are good reasons to
believe that the increase diminishes rapidly in the mobile markets as the number of operators
increases beyond three or four. The evidence is as follows:
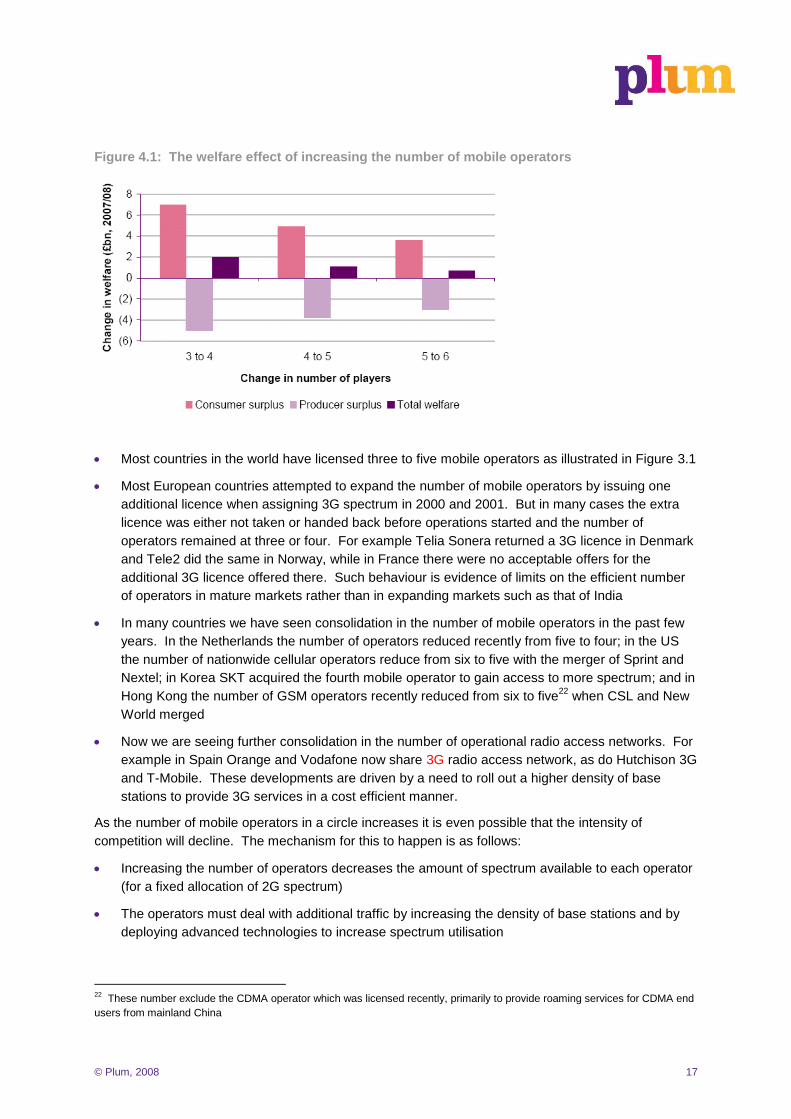
A recent study by Ofcom in the UK21
shows that the likely welfare gain from adding each
additional mobile operator reduces rapidly as the number of operators increases beyond three.
Figure 4.1 illustrates. It shows that the additional welfare gain from each additional operator
halves as the number of operators increases. It is important to note that the calculations of
Figure 4.1 ignore the cost increases, discussed in Section 4.2, which arise if additional operators
lead to less spectrum per operator. We would not expect that the scale of welfare changes
shown in Figure 4.1 would apply in India. But we would expect that the relative gains in welfare
from increasing the number of operators would follow broadly the pattern shown in this figure.
19
The impact of telecommunications on economic growth in developing countries, Waverman, Meschi and Fuss, March 2005,
Vodafone Policy Paper 2 20
The economic impact of mobile services in Latin America, a report for the GSMA, GSM Latin America and AHCIET by
Indepen and Ovum, December 2005 21
Application of spectrum liberalisation and trading to the mobile sector, Ofcom, Annex 10, September 2007. Ofcom built a
model of oligopoly competition in which it calculated welfare gains and losses which resulted from reducing the number of
mobile operators in the UK from the current five to three or four, and from increasing the number of operators by one. It
assumed that market demand and costs were independent of the number of players. In each case a change in the number of
operators generates a change in the Cournot equilibrium within the oligopoly market model. As the number of operators
increases or decreases, so the profit maximising position of each player changes. This then produces changes in the total
producer and consumer surpluses.
© Plum, 2008 17
Figure 4.1: The welfare effect of increasing the number of mobile operators
Most countries in the world have licensed three to five mobile operators as illustrated in Figure 3.1
Most European countries attempted to expand the number of mobile operators by issuing one
additional licence when assigning 3G spectrum in 2000 and 2001. But in many cases the extra
licence was either not taken or handed back before operations started and the number of
operators remained at three or four. For example Telia Sonera returned a 3G licence in Denmark
and Tele2 did the same in Norway, while in France there were no acceptable offers for the
additional 3G licence offered there. Such behaviour is evidence of limits on the efficient number
of operators in mature markets rather than in expanding markets such as that of India
In many countries we have seen consolidation in the number of mobile operators in the past few
years. In the Netherlands the number of operators reduced recently from five to four; in the US
the number of nationwide cellular operators reduce from six to five with the merger of Sprint and
Nextel; in Korea SKT acquired the fourth mobile operator to gain access to more spectrum; and in
Hong Kong the number of GSM operators recently reduced from six to five22
when CSL and New
World merged
Now we are seeing further consolidation in the number of operational radio access networks. For
example in Spain Orange and Vodafone now share 3G radio access network, as do Hutchison 3G
and T-Mobile. These developments are driven by a need to roll out a higher density of base
stations to provide 3G services in a cost efficient manner.
As the number of mobile operators in a circle increases it is even possible that the intensity of
competition will decline. The mechanism for this to happen is as follows:
Increasing the number of operators decreases the amount of spectrum available to each operator
(for a fixed allocation of 2G spectrum)
The operators must deal with additional traffic by increasing the density of base stations and by
deploying advanced technologies to increase spectrum utilisation
22
These number exclude the CDMA operator which was licensed recently, primarily to provide roaming services for CDMA end
users from mainland China
© Plum, 2008 18
There are limits on the extent to which the density of base stations can be increased which is
reached once inter-cell spacing falls below a certain minimum distance. There are two limiting
effects:
– As cells become smaller, the individual buildings and streets have a major impact on the
shape of the cell boundary. Planning for contiguous coverage becomes more difficult
– The precise location of base stations becomes very important. For cells with diameters of
several hundred metres there is a wide range of possible sites which are near optimal. For
cells with diameters of less than this minimum distance there is often only one location where
deployment is effective. If this location is not accessible then there are significant losses in
efficiency
Several network operators have reached this minimum separation distance in the dense urban
areas of the big cities of India
The consequence of reaching this limit is to weaken competition. The most successful operator
reaches the limit first. Its network then suffers from unavoidable congestion in the dense urban
areas and its customers churn to less successful rivals.
In theory the current rules in India, which link spectrum assignment with subscriber numbers, might
deal with this problem. In practice there is an increasing number of operators sharing a (near) fixed
amount of spectrum and such increases in assignments have proved very difficult to make.
So the net effect of this mechanism is to handicap the operator offering the best services and lowest
prices and to reward its weaker rivals. This weakens the competitive process. The incentive for a
mobile operators to strive to outperform its rivals, which is at the heart of the competitive process, is
substantially weakened if a mobile operator knows that its success will lead to an unavoidable
reduction in network performance.
4.4 Implications for the development of mobile broadband
Our analysis so far has focussed on the impact of current spectrum policy on mobile voice services.
But this policy also impacts the likely development of mobile data and broadband services in India.
Effective deployment of mobile broadband and associated data services is likely to be of central
importance to the economic development of India over the next 10 years:
A new generation of mobile phones, like the Apple i-phone, has led to a massive jump in the use
of the Internet from mobile terminals. Some studies23
indicate 50-fold greater use of such
phones for Internet searches than of traditional mobile terminals
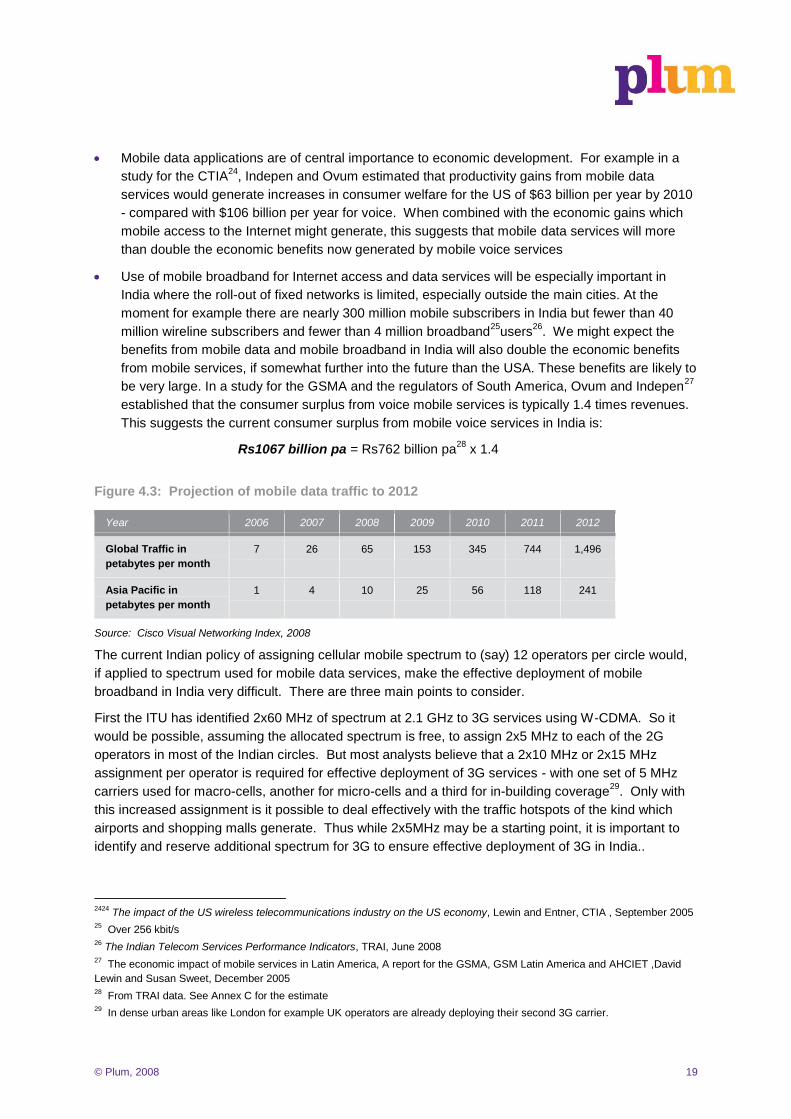
Analysts now project massive growth in the use of mobile broadband services worldwide - initially
through use of high-speed packet access (HSPA) over W-CDMA and subsequently through the
deployment of long term evolution (LTE) technologies using more advanced modulation
techniques. Cisco's projections for worldwide and Asia Pacific growth in mobile data traffic are
shown in Figure 4.3. They suggest that mobile data traffic will more than double in each of the
next five years
23
See for example http://www.macworld.co.uk/ipod-itunes/news/index.cfm?rss&newsid=20446
© Plum, 2008 19
Mobile data applications are of central importance to economic development. For example in a
study for the CTIA24
, Indepen and Ovum estimated that productivity gains from mobile data
services would generate increases in consumer welfare for the US of $63 billion per year by 2010
- compared with $106 billion per year for voice. When combined with the economic gains which
mobile access to the Internet might generate, this suggests that mobile data services will more
than double the economic benefits now generated by mobile voice services
Use of mobile broadband for Internet access and data services will be especially important in
India where the roll-out of fixed networks is limited, especially outside the main cities. At the
moment for example there are nearly 300 million mobile subscribers in India but fewer than 40
million wireline subscribers and fewer than 4 million broadband25
users26
. We might expect the
benefits from mobile data and mobile broadband in India will also double the economic benefits
from mobile services, if somewhat further into the future than the USA. These benefits are likely to
be very large. In a study for the GSMA and the regulators of South America, Ovum and Indepen27
established that the consumer surplus from voice mobile services is typically 1.4 times revenues.
This suggests the current consumer surplus from mobile voice services in India is:
Rs1067 billion pa = Rs762 billion pa28
x 1.4
Figure 4.3: Projection of mobile data traffic to 2012
Year 2006 2007 2008 2009 2010 2011 2012
Global Traffic in
petabytes per month
7 26 65 153 345 744 1,496
Asia Pacific in
petabytes per month
1 4 10 25 56 118 241
Source: Cisco Visual Networking Index, 2008
The current Indian policy of assigning cellular mobile spectrum to (say) 12 operators per circle would,
if applied to spectrum used for mobile data services, make the effective deployment of mobile
broadband in India very difficult. There are three main points to consider.
First the ITU has identified 2x60 MHz of spectrum at 2.1 GHz to 3G services using W-CDMA. So it
would be possible, assuming the allocated spectrum is free, to assign 2x5 MHz to each of the 2G
operators in most of the Indian circles. But most analysts believe that a 2x10 MHz or 2x15 MHz
assignment per operator is required for effective deployment of 3G services - with one set of 5 MHz
carriers used for macro-cells, another for micro-cells and a third for in-building coverage29
. Only with
this increased assignment is it possible to deal effectively with the traffic hotspots of the kind which
airports and shopping malls generate. Thus while 2x5MHz may be a starting point, it is important to
identify and reserve additional spectrum for 3G to ensure effective deployment of 3G in India..
2424
The impact of the US wireless telecommunications industry on the US economy, Lewin and Entner, CTIA , September 2005 25
Over 256 kbit/s 26
The Indian Telecom Services Performance Indicators, TRAI, June 2008 27
The economic impact of mobile services in Latin America, A report for the GSMA, GSM Latin America and AHCIET ,David
Lewin and Susan Sweet, December 2005 28
From TRAI data. See Annex C for the estimate 29
In dense urban areas like London for example UK operators are already deploying their second 3G carrier.
© Plum, 2008 20
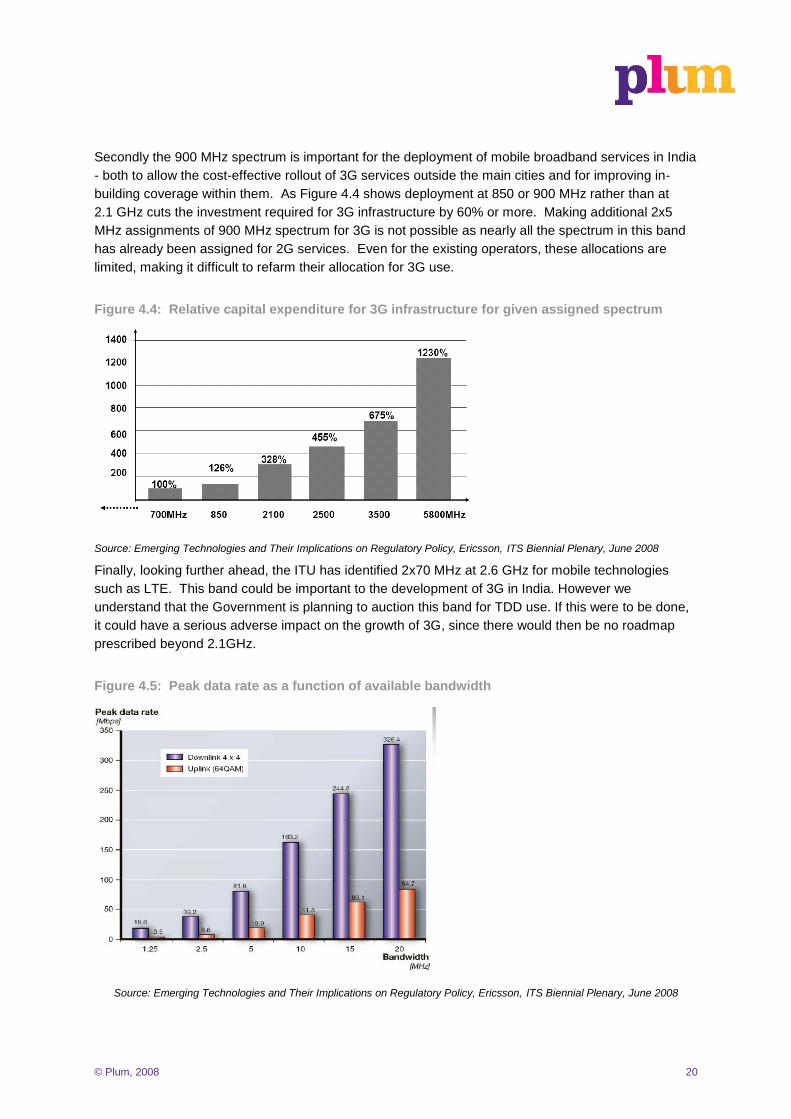
Secondly the 900 MHz spectrum is important for the deployment of mobile broadband services in India
- both to allow the cost-effective rollout of 3G services outside the main cities and for improving in-
building coverage within them. As Figure 4.4 shows deployment at 850 or 900 MHz rather than at
2.1 GHz cuts the investment required for 3G infrastructure by 60% or more. Making additional 2x5
MHz assignments of 900 MHz spectrum for 3G is not possible as nearly all the spectrum in this band
has already been assigned for 2G services. Even for the existing operators, these allocations are
limited, making it difficult to refarm their allocation for 3G use.
Figure 4.4: Relative capital expenditure for 3G infrastructure for given assigned spectrum
Source: Emerging Technologies and Their Implications on Regulatory Policy, Ericsson, ITS Biennial Plenary, June 2008
Finally, looking further ahead, the ITU has identified 2x70 MHz at 2.6 GHz for mobile technologies
such as LTE. This band could be important to the development of 3G in India. However we
understand that the Government is planning to auction this band for TDD use. If this were to be done,
it could have a serious adverse impact on the growth of 3G, since there would then be no roadmap
prescribed beyond 2.1GHz.
Figure 4.5: Peak data rate as a function of available bandwidth
Source: Emerging Technologies and Their Implications on Regulatory Policy, Ericsson, ITS Biennial Plenary, June 2008
© Plum, 2008 21
5 Conclusions and recommendations
5.1 Conclusions
We can summarise the findings of the previous chapters as follows:
1. To date spectrum assignment policy in India has been focused on ensuring that there is sufficient
spectrum available for new entrant mobile operators and on ensuring that the existing operators
maximise technical spectrum efficiency.
2. As a result:
There are three times more mobile operators with spectrum assigned in a typical circle in India
than in other countries
The average Indian operator can use only about one quarter of the spectrum available to mobile
operators elsewhere in the world
When measured in terms of busy hour traffic per square kilometre per MHz in the dense urban
areas, mobile operators in India are generating typically eight times more capacity in their use of
spectrum than operators elsewhere in the world.
3. Policymakers in India have so far ignored the need to balance conflicting requirements for:
Strong competition in the mobile market. This is served, up to a point, by increasing the number
of mobile operators in each circle and
Maximising allocative efficiency by minimising the sum of the fixed costs of the mobile operators
plus the radio access network costs of the industry as a whole. This is served by restricting the
number of operators.
4. Increasing the spectrum per operator four fold to reach international norms, together with a
corresponding consolidation of the industry would reduce industry costs by at least 21%. This would,
almost certainly, lead to lower prices, with consumer welfare benefits in excess of Rs 117 billion per
year under 2008 market conditions30
. Such price cuts would also make mobile services more
affordable to India's rural population and accelerate take-up by new subscribers. This in turn would
generate further economic benefits by stimulating GDP growth.
5. Increasing the number of mobile operators per circle should, in theory, increase competition in the
mobile markets. But the available evidence suggests that, in most countries, the benefits of additional
competition diminish rapidly once the number of operators exceeds four. In addition there are reasons
to believe that the intensity of market competition might even diminish, if and when spectrum
shortages lead to unavoidable congestion in dense urban areas for the most successful operators.
6. Effective deployment of mobile broadband and associated data services is likely to be of central
importance to the economic development of India over the next 10 years. However the current Indian
policy of assigning small quantities of spectrum to multiple operators per circle would, if applied to
spectrum used for mobile data services, make the effective deployment of mobile broadband in India
very difficult. If current spectrum policies and industry structures persist, Indian operators will not be
30
We assume a competitive market here so that the economic surplus generated by the cost reduction flows though to Indian
consumers in the long term
© Plum, 2008 22
able to deliver the same high-speed mobile broadband at the same low unit costs as operators in the
countries which are India's main economic rivals. This could generate very substantial economic
losses for India, running into many hundreds of billions of Rupees pa.
7. The current limited assignments per operator at 900 MHz would cause specific problems for the roll-
out of mobile broadband services in rural India. There is now growing recognition in other parts of the
world that it is important to refarm 900 MHz spectrum for deployment of HSPA and LTE technologies if
mobile broadband is to be deployed in rural areas in a cost-effective way. The fragmentation of
assignment in India presents a significant barrier to such re-farming.
Overall the analysis set out above leads us to one simple conclusion – the spectrum available per
operator is too little and the number of cellular operators too many for an economically
efficient industry in India.
5.2 Recommendations
For the Committee on Spectrum Assignment, and the Government which appointed it, to deal with the
problems listed in Section 5.1 we make the following recommendations. They are based on the
principle that it is for the market to decide on the optimal number of operators rather than for that
number to be decided by government.
Recommendation 1: spectrum assignment rules should be designed with the objective of maximising
the overall economic efficiency of the Indian cellular mobile industry. This requires the Committee to
consider issues of allocative efficiency in the assignment of spectrum as well as the technical
spectrum efficiency of the operators.
Recommendation 2: in developing spectrum assignment rules which meet this new objective, the
Committee should consider the long-term development of the industry. It should develop rules which,
when implemented, will allow the industry to develop economically efficient 3G services as well as 2G
services.
Recommendation 3: no further mobile operators should be licensed. The analysis of Section 5.1
provides strong evidence that the number of operators with spectrum is already too high for economic
efficiency. This recommendation is designed simply to prevent the situation getting worse.
Recommendation 4: as further spectrum becomes available it should be assigned to existing
operators using a market mechanism such as spectrum auctions.
Recommendation 5: the relevant authorities should enable consolidation between cellular operators
using market mechanisms. They might for example allow non-operational operators with assigned
spectrum to sell themselves to existing operational players and to transfer the full spectrum assigned
to them to the buyer without penalty. This would, almost certainly, create politically unpopular windfall
gains for the shareholders of these operators31
. But the economic gains to India from allowing such
trades are likely to be substantially greater.
Recommendation 6: the relevant authorities should remove any barriers to consolidation within the
industry between existing operational players. To ensure an acceptable level of competition in the
markets the authorities might establish a trigger for an enquiry by the Competition Authority if any
acquisition leads to one player holding a market share within a circle of more than (say) 40%.
31
These might be offset through windfall taxes or some kind of claw-back mechanism.
© Plum, 2008 23
Recommendation 7: the relevant authorities should allow and encourage mobile operators to share
radio access network - whether at the level of site sharing, mast sharing or sharing of the entire radio
access network back to the base station controller (or radio network controller in the case of a 3G
network)
© Plum, 2008 24
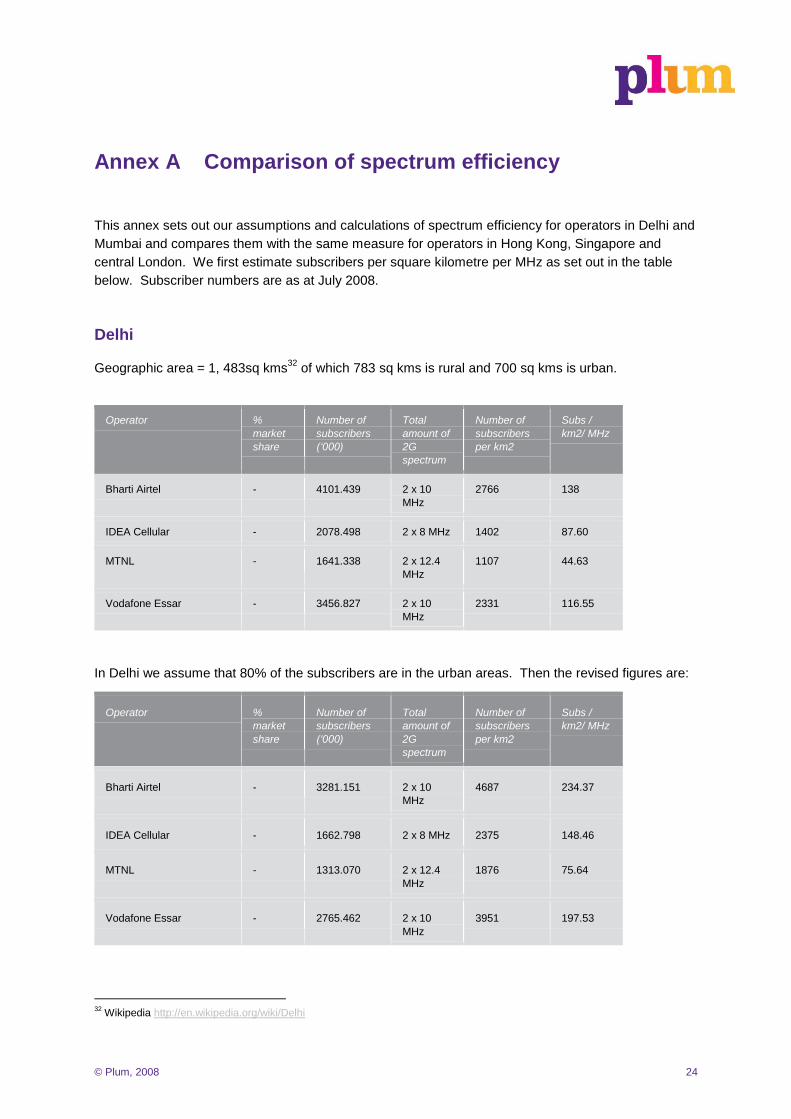
Annex A Comparison of spectrum efficiency
This annex sets out our assumptions and calculations of spectrum efficiency for operators in Delhi and
Mumbai and compares them with the same measure for operators in Hong Kong, Singapore and
central London. We first estimate subscribers per square kilometre per MHz as set out in the table
below. Subscriber numbers are as at July 2008.
Delhi
Geographic area = 1, 483sq kms32
of which 783 sq kms is rural and 700 sq kms is urban.
Operator %
market
share
Number of
subscribers
(„000)
Total
amount of
2G
spectrum
Number of
subscribers
per km2
Subs /
km2/ MHz
Bharti Airtel - 4101.439 2 x 10
MHz
2766 138
IDEA Cellular - 2078.498 2 x 8 MHz 1402 87.60
MTNL - 1641.338 2 x 12.4
MHz
1107 44.63
Vodafone Essar - 3456.827 2 x 10
MHz
2331 116.55
In Delhi we assume that 80% of the subscribers are in the urban areas. Then the revised figures are:
Operator %
market
share
Number of
subscribers
(„000)
Total
amount of
2G
spectrum
Number of
subscribers
per km2
Subs /
km2/ MHz
Bharti Airtel - 3281.151 2 x 10
MHz
4687 234.37
IDEA Cellular - 1662.798 2 x 8 MHz 2375 148.46
MTNL - 1313.070 2 x 12.4
MHz
1876 75.64
Vodafone Essar - 2765.462 2 x 10
MHz
3951 197.53
32
Wikipedia http://en.wikipedia.org/wiki/Delhi
© Plum, 2008 25
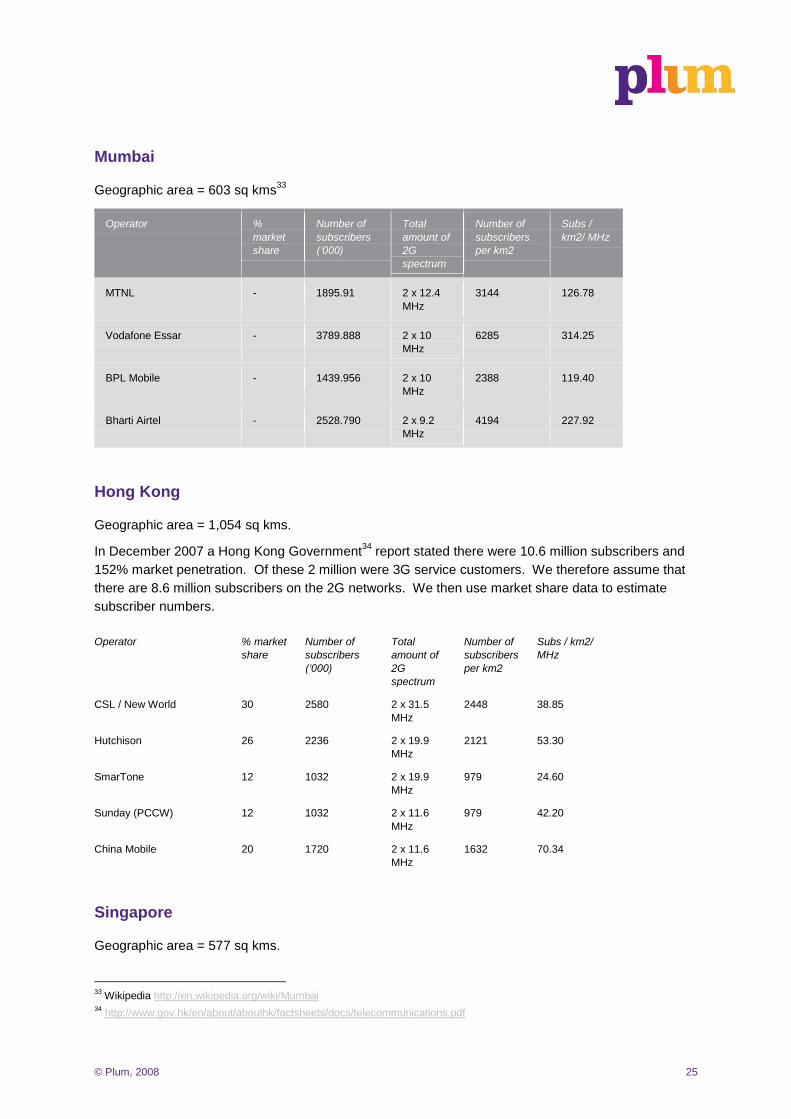
Mumbai
Geographic area = 603 sq kms33
Operator %
market
share
Number of
subscribers
(„000)
Total
amount of
2G
spectrum
Number of
subscribers
per km2
Subs /
km2/ MHz
MTNL - 1895.91 2 x 12.4
MHz
3144 126.78
Vodafone Essar - 3789.888 2 x 10
MHz
6285 314.25
BPL Mobile - 1439.956 2 x 10
MHz
2388 119.40
Bharti Airtel - 2528.790 2 x 9.2
MHz
4194 227.92
Hong Kong
Geographic area = 1,054 sq kms.
In December 2007 a Hong Kong Government34
report stated there were 10.6 million subscribers and
152% market penetration. Of these 2 million were 3G service customers. We therefore assume that
there are 8.6 million subscribers on the 2G networks. We then use market share data to estimate
subscriber numbers.
Operator % market
share
Number of
subscribers
(„000)
Total
amount of
2G
spectrum
Number of
subscribers
per km2
Subs / km2/
MHz
CSL / New World 30 2580 2 x 31.5
MHz
2448 38.85
Hutchison 26 2236 2 x 19.9
MHz
2121 53.30
SmarTone 12 1032 2 x 19.9
MHz
979 24.60
Sunday (PCCW) 12 1032 2 x 11.6
MHz
979 42.20
China Mobile 20 1720 2 x 11.6
MHz
1632 70.34
Singapore
Geographic area = 577 sq kms.
33
Wikipedia http://en.wikipedia.org/wiki/Mumbai 34
http://www.gov.hk/en/about/abouthk/factsheets/docs/telecommunications.pdf
© Plum, 2008 26
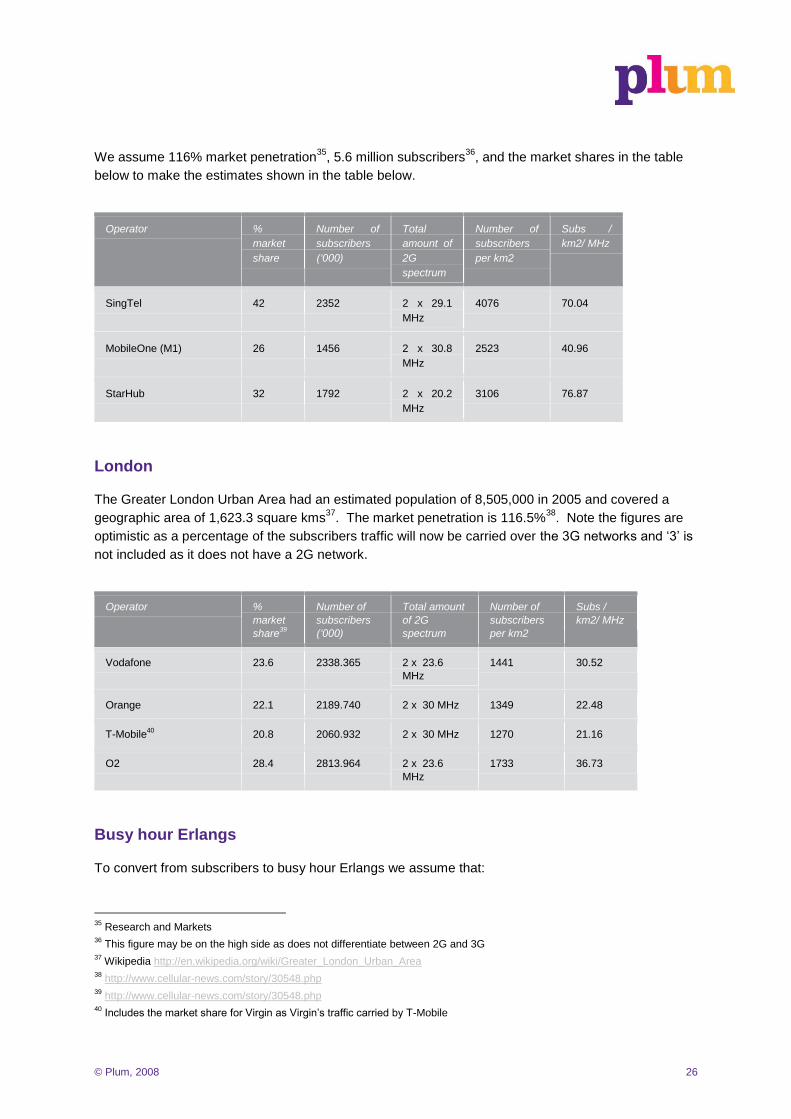
We assume 116% market penetration35
, 5.6 million subscribers36
, and the market shares in the table
below to make the estimates shown in the table below.
Operator %
market
share
Number of
subscribers
(„000)
Total
amount of
2G
spectrum
Number of
subscribers
per km2
Subs /
km2/ MHz
SingTel 42 2352 2 x 29.1
MHz
4076 70.04
MobileOne (M1) 26 1456 2 x 30.8
MHz
2523 40.96
StarHub 32 1792 2 x 20.2
MHz
3106 76.87
London
The Greater London Urban Area had an estimated population of 8,505,000 in 2005 and covered a
geographic area of 1,623.3 square kms37
. The market penetration is 116.5%38
. Note the figures are
optimistic as a percentage of the subscribers traffic will now be carried over the 3G networks and „3‟ is
not included as it does not have a 2G network.
Operator %
market
share39
Number of
subscribers
(„000)
Total amount
of 2G
spectrum
Number of
subscribers
per km2
Subs /
km2/ MHz
Vodafone 23.6 2338.365 2 x 23.6
MHz
1441 30.52
Orange 22.1 2189.740 2 x 30 MHz 1349 22.48
T-Mobile40
20.8 2060.932 2 x 30 MHz 1270 21.16
O2 28.4 2813.964 2 x 23.6
MHz
1733 36.73
Busy hour Erlangs
To convert from subscribers to busy hour Erlangs we assume that:
35
Research and Markets 36
This figure may be on the high side as does not differentiate between 2G and 3G 37
Wikipedia http://en.wikipedia.org/wiki/Greater_London_Urban_Area 38
http://www.cellular-news.com/story/30548.php 39
http://www.cellular-news.com/story/30548.php 40
Includes the market share for Virgin as Virgin‟s traffic carried by T-Mobile
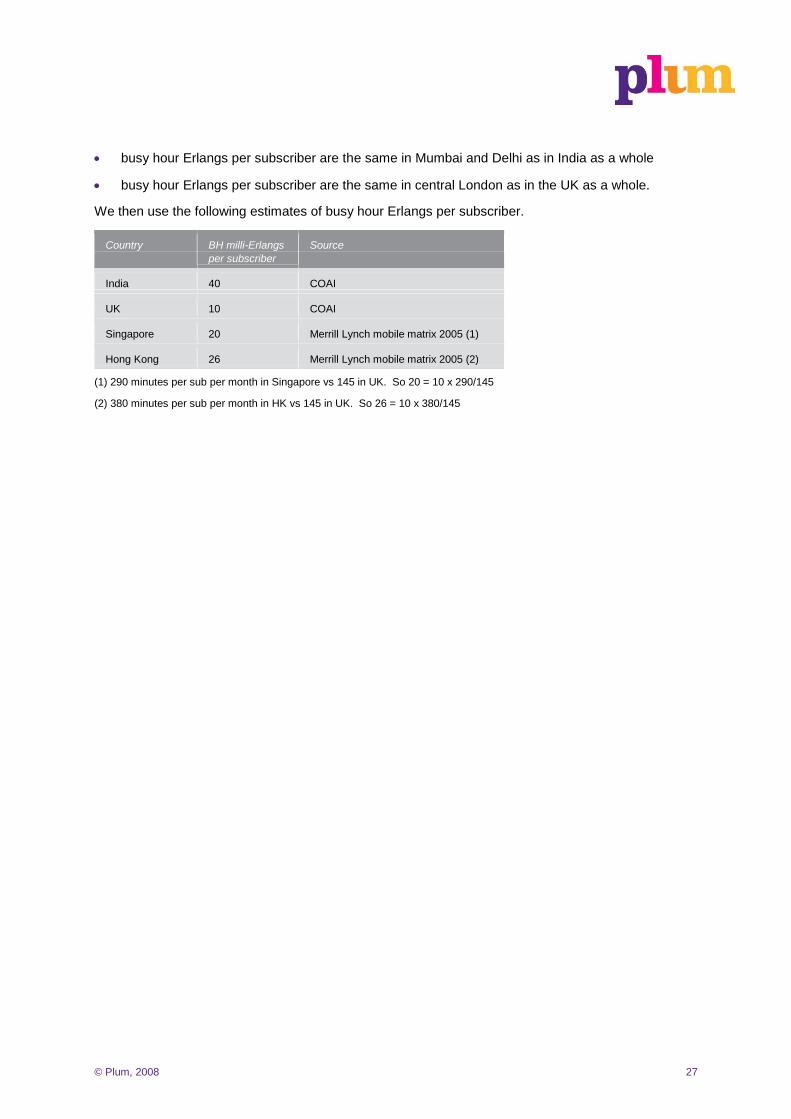
© Plum, 2008 27
busy hour Erlangs per subscriber are the same in Mumbai and Delhi as in India as a whole
busy hour Erlangs per subscriber are the same in central London as in the UK as a whole.
We then use the following estimates of busy hour Erlangs per subscriber.
Country BH milli-Erlangs
per subscriber
Source
India 40 COAI
UK 10 COAI
Singapore 20 Merrill Lynch mobile matrix 2005 (1)
Hong Kong 26 Merrill Lynch mobile matrix 2005 (2)
(1) 290 minutes per sub per month in Singapore vs 145 in UK. So 20 = 10 x 290/145
(2) 380 minutes per sub per month in HK vs 145 in UK. So 26 = 10 x 380/145
© Plum, 2008 28
Annex B Deployment of advanced technologies for spectral efficiency in India
Introduction
Since the first GSM networks were deployed more than 15 years ago the technology has been
continuously enriched and enhanced. Throughout this period several capacity expanding technologies
have been developed including frequency hopping (both base band and synthesised), discontinuous
transmission, and the adoption of micro- and pico-cells. These have provided very significant
increases in network capacity, and the standard continues to be developed with further capacity
enhancing features.
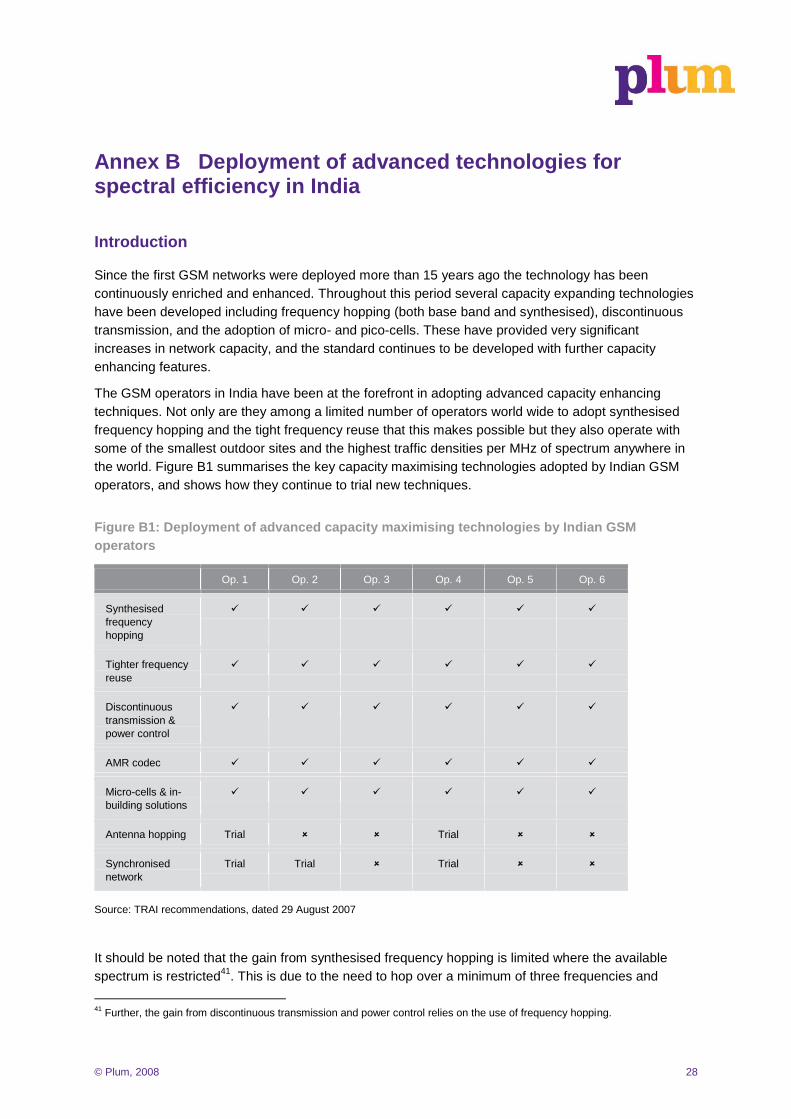
The GSM operators in India have been at the forefront in adopting advanced capacity enhancing
techniques. Not only are they among a limited number of operators world wide to adopt synthesised
frequency hopping and the tight frequency reuse that this makes possible but they also operate with
some of the smallest outdoor sites and the highest traffic densities per MHz of spectrum anywhere in
the world. Figure B1 summarises the key capacity maximising technologies adopted by Indian GSM
operators, and shows how they continue to trial new techniques.
Figure B1: Deployment of advanced capacity maximising technologies by Indian GSM
operators
Op. 1 Op. 2 Op. 3 Op. 4 Op. 5 Op. 6
Synthesised
frequency
hopping
Tighter frequency
reuse
Discontinuous
transmission &
power control
AMR codec
Micro-cells & in-
building solutions
Antenna hopping Trial Trial
Synchronised
network
Trial Trial Trial
Source: TRAI recommendations, dated 29 August 2007
It should be noted that the gain from synthesised frequency hopping is limited where the available
spectrum is restricted41
. This is due to the need to hop over a minimum of three frequencies and
41
Further, the gain from discontinuous transmission and power control relies on the use of frequency hopping.
© Plum, 2008 29
because the BCCH carriers cannot be hopped. An indicative 2 x 5 MHz is required to achieve a gain in
practice (and this is dependent upon network configuration).
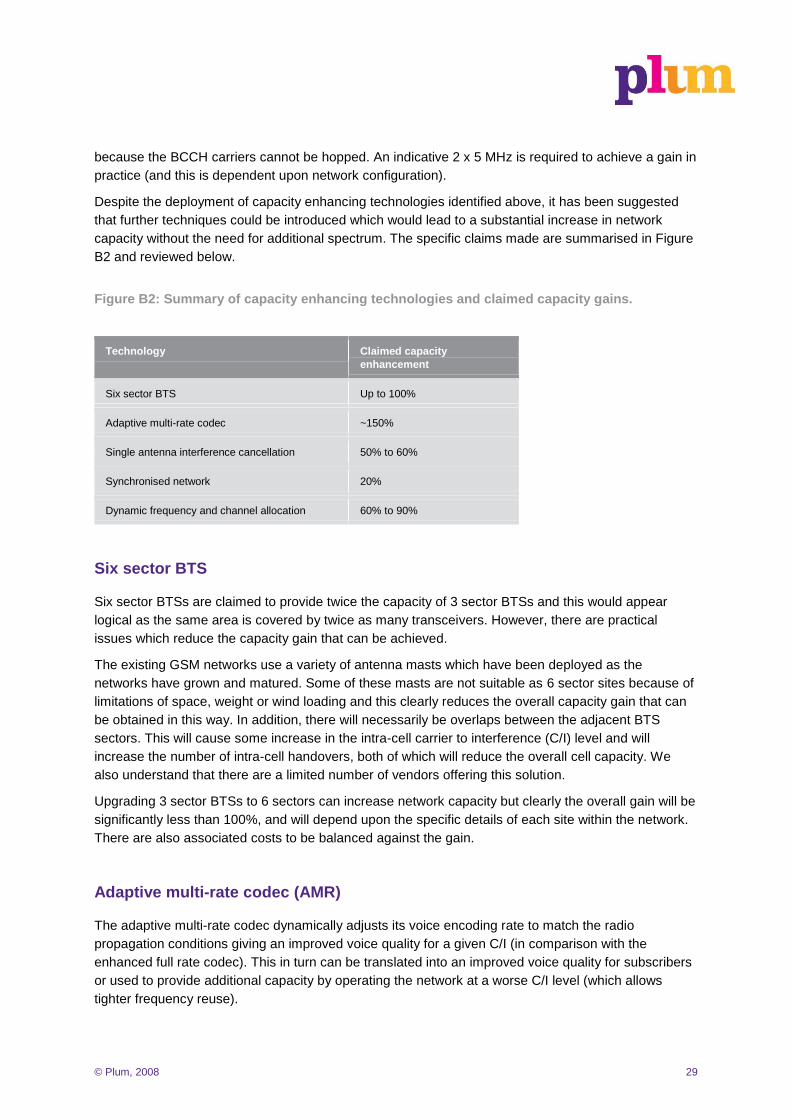
Despite the deployment of capacity enhancing technologies identified above, it has been suggested
that further techniques could be introduced which would lead to a substantial increase in network
capacity without the need for additional spectrum. The specific claims made are summarised in Figure
B2 and reviewed below.
Figure B2: Summary of capacity enhancing technologies and claimed capacity gains.
Technology Claimed capacity
enhancement
Six sector BTS Up to 100%
Adaptive multi-rate codec ~150%
Single antenna interference cancellation 50% to 60%
Synchronised network 20%
Dynamic frequency and channel allocation 60% to 90%
Six sector BTS
Six sector BTSs are claimed to provide twice the capacity of 3 sector BTSs and this would appear
logical as the same area is covered by twice as many transceivers. However, there are practical
issues which reduce the capacity gain that can be achieved.
The existing GSM networks use a variety of antenna masts which have been deployed as the
networks have grown and matured. Some of these masts are not suitable as 6 sector sites because of
limitations of space, weight or wind loading and this clearly reduces the overall capacity gain that can
be obtained in this way. In addition, there will necessarily be overlaps between the adjacent BTS
sectors. This will cause some increase in the intra-cell carrier to interference (C/I) level and will
increase the number of intra-cell handovers, both of which will reduce the overall cell capacity. We
also understand that there are a limited number of vendors offering this solution.
Upgrading 3 sector BTSs to 6 sectors can increase network capacity but clearly the overall gain will be
significantly less than 100%, and will depend upon the specific details of each site within the network.
There are also associated costs to be balanced against the gain.
Adaptive multi-rate codec (AMR)
The adaptive multi-rate codec dynamically adjusts its voice encoding rate to match the radio
propagation conditions giving an improved voice quality for a given C/I (in comparison with the
enhanced full rate codec). This in turn can be translated into an improved voice quality for subscribers
or used to provide additional capacity by operating the network at a worse C/I level (which allows
tighter frequency reuse).
© Plum, 2008 30
If used solely to provide additional capacity AMR can provide significant improvements provided the
penetration of AMR enabled handsets is high. Nokia Siemens give the gain as 100%42
. Several GSM
operators have deployed AMR and we understand that the current penetration of AMR enabled
handsets in India is around 50%. The maximum capacity gain achievable today will therefore be less
than 50% . This will rise as the penetration increases with time, though commercial realities may
demand that the operators use some of the gain to improve call quality across their networks.
AMR requires both BTSs and handsets to be AMR enabled, and there is therefore an associated
deployment cost particularly for legacy networks.
AMR also supports half rate coding. In principle this could provide a doubling of capacity since each
time slot can support two rather than one voice call. However, AMR half rate coding has to operate at
a higher C/I than does AMR full rate coding and this effectively negates the capacity gained. It should
also be noted that the half rate codec is more susceptible to acoustic impairments such as background
noise and this has limited its take up by operators. A recently developed option is to use advanced
network based voice quality enhancement solutions43
to enable both AMR full rate and half rate
codecs to operate satisfactorily at lower C/I levels and thus provide additional capacity. We are not
aware of any deployments at present but this approach may be used to provide increased capacity in
the future.
Single antenna interference cancellation
Single antenna interference cancellation (SAIC) is a technique in which handsets use training
sequences within transmission bursts to map instantaneous RF channel characteristics. The handset
then uses this information to subtract or reduce the interfering signals44
. It can be used either to give
call quality improvements or to allow operation with higher levels of interference which in turn means
tighter frequency reuse and increased capacity. SAIC can be used with synchronised or non-
synchronised networks although the improvements are higher with a synchronised network.
Simulations performed during the standardisation of SAIC showed capacity gains of 50% to 60%
based on a synchronised network and 100% penetration of SAIC enabled handsets. However, trials
conducted by Philips and Cingular45
measured a capacity gain of around 20% and Nortel46
has
suggested that the total gain from SAIC in a synchronised network would be around 25%. We
understand that Ericsson have indicated theoretical gains of 8% to 10% with a 50% penetration of
SAIC handsets and that Nokia have stated that the “benefits are still being ascertained”.
It should also be noted that SAIC only provides capacity gains on the down link. Increasing capacity
on the down link beyond that on the up link does not of course increase the overall network capacity
for voice calls.
42
“WCDMA frequency refarming. A leap forward towards ubiquitous mobile broadband coverage”, Nokia Siemens Networks
brochure, 2008. 43
See http://www.ditechnetworks.com/. 44
Various algorithms can be used, and are proprietary to different vendors. 45
“GSM Gets A Lift From Single-Antenna Interference Cancellation Software”, Electronic Design Online, 19 July 2004. Note that
the measurements were made in pre-commercial network. 46
“GSM spectral efficiency”, Nortel case study, 23 May 2006.
© Plum, 2008 31
The capacity gain possible with SAIC terminals is uncertain with more recent estimates indicating
significantly smaller gains than those claimed by Reliance. In addition, we understand that rather few
GSM handsets are SAIC enabled. We therefore conclude that:
SAIC cannot as yet be relied on as a capacity enhancing technique
Gains that may eventually be achieved cannot today be reliably estimated.
The increase in processing power required in a SAIC handset will also lead to some price penalty, and
may have a negative impact on battery life.
Synchronised network
This technique synchronises the base station transceivers across a network to accurately align the
transmission of time slots. This allows the synthesised frequency hopping process to further reduce
the level of inter-cell interference and enables a tighter reuse of frequencies. Simulations show
capacity gains of 10% to 20%. Vendors, however, have reported that trials have “not been positive”
and it is therefore premature to assume that these gains will be realisable in the real operating
environment.
It is also important to note that synchronisation equipment is required at all base stations and that a
significant cost would therefore be involved in any upgrade. Furthermore, synchronisation typically
relies on GPS signals making synchronised networks vulnerable to US Government decisions.
Dynamic frequency and channel allocation (DFCA)
The concept behind dynamic frequency and channel allocation is that information on path loss and
signal quality is continuously collected across the network. This information is then used to allocate
calls to the frequency and time slot which optimises the C/I both for that call and for the network
overall. This technique will require a fully synchronised network and substantial further changes to the
network as well as upgraded handsets. As with AMR and SAIC a high penetration of appropriately
enabled handsets will be needed to realise the full capacity gains.
The literature on DFCA is limited with capacity gains estimated at between 25% and 50% and no
published results from trials. To the best of our knowledge it is offered by very few suppliers, and in
few handsets. This means that at present DFCA is commercially a high risk option and, with low
handset penetration, one that may take a significant period to realise useful capacity improvements.
Summary
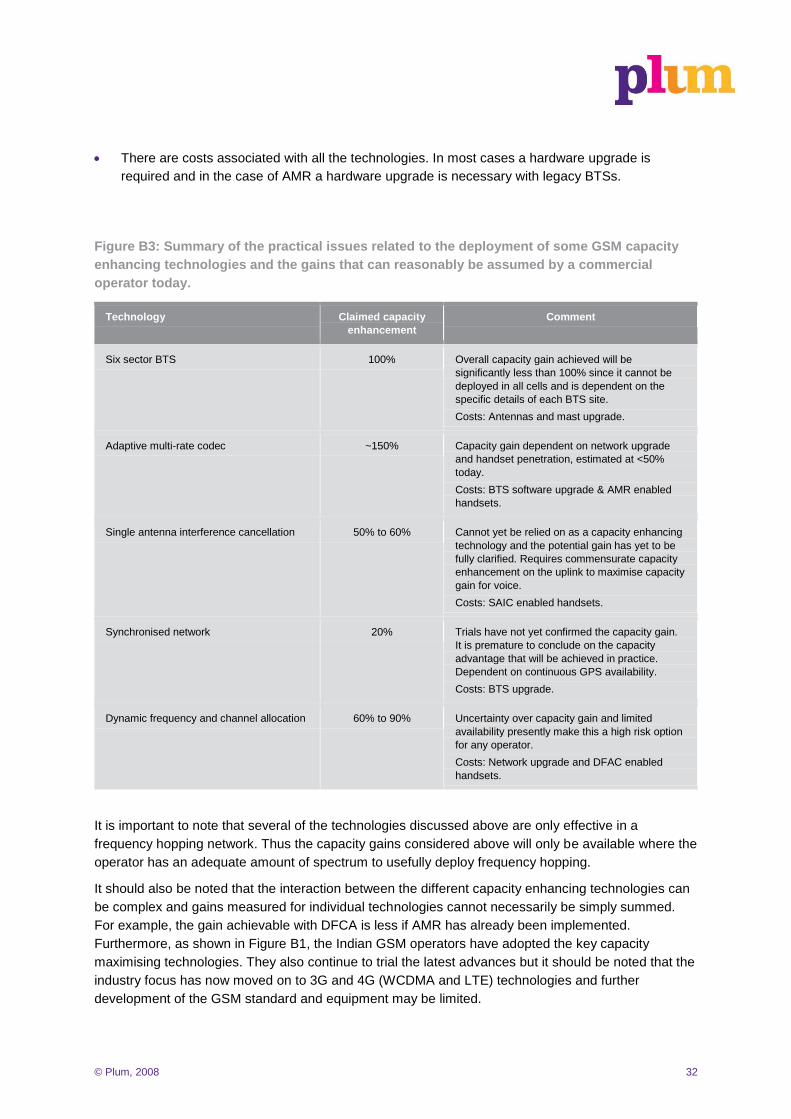
Figure B3 brings together the results of the above review. It shows that:
Practical issues involved in the proving and deployment of new technologies have not been taken
into account in making claims for capacity enhancements.
In all cases the claimed capacity enhancements are either overstated or cannot be fully realised
today. The SAIC and DFAC technologies will take some time to come to maturity.
© Plum, 2008 32
There are costs associated with all the technologies. In most cases a hardware upgrade is
required and in the case of AMR a hardware upgrade is necessary with legacy BTSs.
Figure B3: Summary of the practical issues related to the deployment of some GSM capacity
enhancing technologies and the gains that can reasonably be assumed by a commercial
operator today.
Technology Claimed capacity
enhancement
Comment
Six sector BTS 100% Overall capacity gain achieved will be
significantly less than 100% since it cannot be
deployed in all cells and is dependent on the
specific details of each BTS site.
Costs: Antennas and mast upgrade.
Adaptive multi-rate codec ~150% Capacity gain dependent on network upgrade
and handset penetration, estimated at <50%
today.
Costs: BTS software upgrade & AMR enabled
handsets.
Single antenna interference cancellation 50% to 60% Cannot yet be relied on as a capacity enhancing
technology and the potential gain has yet to be
fully clarified. Requires commensurate capacity
enhancement on the uplink to maximise capacity
gain for voice.
Costs: SAIC enabled handsets.
Synchronised network 20% Trials have not yet confirmed the capacity gain.
It is premature to conclude on the capacity
advantage that will be achieved in practice.
Dependent on continuous GPS availability.
Costs: BTS upgrade.
Dynamic frequency and channel allocation 60% to 90% Uncertainty over capacity gain and limited
availability presently make this a high risk option
for any operator.
Costs: Network upgrade and DFAC enabled
handsets.
It is important to note that several of the technologies discussed above are only effective in a
frequency hopping network. Thus the capacity gains considered above will only be available where the
operator has an adequate amount of spectrum to usefully deploy frequency hopping.
It should also be noted that the interaction between the different capacity enhancing technologies can
be complex and gains measured for individual technologies cannot necessarily be simply summed.
For example, the gain achievable with DFCA is less if AMR has already been implemented.
Furthermore, as shown in Figure B1, the Indian GSM operators have adopted the key capacity
maximising technologies. They also continue to trial the latest advances but it should be noted that the
industry focus has now moved on to 3G and 4G (WCDMA and LTE) technologies and further
development of the GSM standard and equipment may be limited.
© Plum, 2008 33
Annex C Allocative efficiency gains from additional spectrum
This annex estimates the reduction in radio access network costs which would result if:
The spectrum assignment to Indian operators were increased four fold to reflect the difference
between the current average assignment in India of 5.5 MHz per operator and the international
benchmark of 22 MHz per operator and
The number of operators with spectrum assigned were reduced from 12 to 3
There are two main effects (assuming GSM technology). First there is an increase in the economies
of scale in the deployment of cell sites:
In areas where cells are coverage limited (i.e. the cell never reaches its busy hour capacity but is
provided to serve customers wanting high levels of geographic coverage) each operator must
deploy the same radio access network, with the same number of cells as its rivals, if it is to offer
competitive coverage. So total costs are lower with fewer operators
In areas where a cell is capacity limited more spectrum leads to an increase in busy hour
capacity. So, although the total traffic carried by each operator rises as the number of operators
shrinks, the number of cell sites required per operator does not rise, and the total number of cell
sites falls significantly. Given that a substantial part of the cost of deploying a cell site is not traffic
sensitive, the total cost of deploying radio access networks falls as the number of operators grows
and the unit costs of carrying traffic reduces.
Secondly there are gains in the traffic which each MHz of spectrum can carry. These effects are
discussed in Section 4.2. Vodafone has modelled these effects and estimates that halving the
spectrum per operator47
reduces the traffic handling capacity per MHz by 33%. Using extrapolation
from this result we assume in our model that a four-fold reduction in spectrum produces a 40%
reduction in traffic capacity per MHz. This is clearly a conservative assumption when modelling the
likely scale of the changes involved48
.
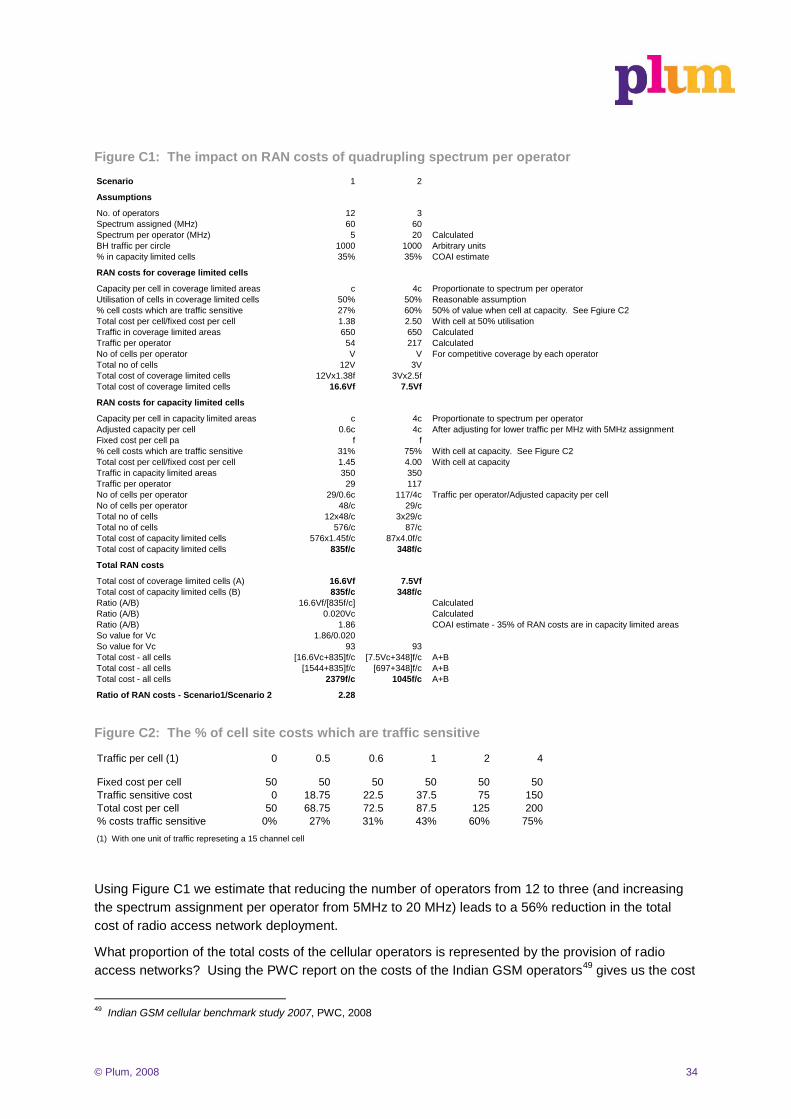
The results of the modelling a set out in Figure C1. The key assumptions are as follows:
35% of traffic is generated in capacity rather than coverage limited cells. This estimate was
provided by GSM operators in India
There is a 50% utilisation of the cells in coverage limited areas in the busy hour
The percentage of the cost of a cell which is traffic sensitive varies with its traffic handling
capacity according to Figure C2. These estimates are based on cost modelling of European
networks. We have no reason to believe that the percentages would differ significantly in India.
47
From 2x12 MHz to 2x6 MHz 48
Vodafone have estimated such a change might lead to a 43.5% reduction in traffic capacity per MHz
© Plum, 2008 34
Figure C1: The impact on RAN costs of quadrupling spectrum per operator
Scenario 1 2
Assumptions
No. of operators 12 3
Spectrum assigned (MHz) 60 60
Spectrum per operator (MHz) 5 20 Calculated
BH traffic per circle 1000 1000 Arbitrary units
% in capacity limited cells 35% 35% COAI estimate
RAN costs for coverage limited cells
Capacity per cell in coverage limited areas c 4c Proportionate to spectrum per operator
Utilisation of cells in coverage limited cells 50% 50% Reasonable assumption
% cell costs which are traffic sensitive 27% 60% 50% of value when cell at capacity. See Fgiure C2
Total cost per cell/fixed cost per cell 1.38 2.50 With cell at 50% utilisation
Traffic in coverage limited areas 650 650 Calculated
Traffic per operator 54 217 Calculated
No of cells per operator V V For competitive coverage by each operator
Total no of cells 12V 3V
Total cost of coverage limited cells 12Vx1.38f 3Vx2.5f
Total cost of coverage limited cells 16.6Vf 7.5Vf
RAN costs for capacity limited cells
Capacity per cell in capacity limited areas c 4c Proportionate to spectrum per operator
Adjusted capacity per cell 0.6c 4c After adjusting for lower traffic per MHz with 5MHz assignment
Fixed cost per cell pa f f
% cell costs which are traffic sensitive 31% 75% With cell at capacity. See Figure C2
Total cost per cell/fixed cost per cell 1.45 4.00 With cell at capacity
Traffic in capacity limited areas 350 350
Traffic per operator 29 117
No of cells per operator 29/0.6c 117/4c Traffic per operator/Adjusted capacity per cell
No of cells per operator 48/c 29/c
Total no of cells 12x48/c 3x29/c
Total no of cells 576/c 87/c
Total cost of capacity limited cells 576x1.45f/c 87x4.0f/c
Total cost of capacity limited cells 835f/c 348f/c
Total RAN costs
Total cost of coverage limited cells (A) 16.6Vf 7.5Vf
Total cost of capacity limited cells (B) 835f/c 348f/c
Ratio (A/B) 16.6Vf/[835f/c] Calculated
Ratio (A/B) 0.020Vc Calculated
Ratio (A/B) 1.86 COAI estimate - 35% of RAN costs are in capacity limited areas
So value for Vc 1.86/0.020
So value for Vc 93 93
Total cost - all cells [16.6Vc+835]f/c [7.5Vc+348]f/c A+B
Total cost - all cells [1544+835]f/c [697+348]f/c A+B
Total cost - all cells 2379f/c 1045f/c A+B
Ratio of RAN costs - Scenario1/Scenario 2 2.28
Figure C2: The % of cell site costs which are traffic sensitive
Traffic per cell (1) 0 0.5 0.6 1 2 4
Fixed cost per cell 50 50 50 50 50 50
Traffic sensitive cost 0 18.75 22.5 37.5 75 150
Total cost per cell 50 68.75 72.5 87.5 125 200
% costs traffic sensitive 0% 27% 31% 43% 60% 75%
(1) With one unit of traffic represeting a 15 channel cell
Using Figure C1 we estimate that reducing the number of operators from 12 to three (and increasing
the spectrum assignment per operator from 5MHz to 20 MHz) leads to a 56% reduction in the total
cost of radio access network deployment.
What proportion of the total costs of the cellular operators is represented by the provision of radio
access networks? Using the PWC report on the costs of the Indian GSM operators49
gives us the cost
49
Indian GSM cellular benchmark study 2007, PWC, 2008
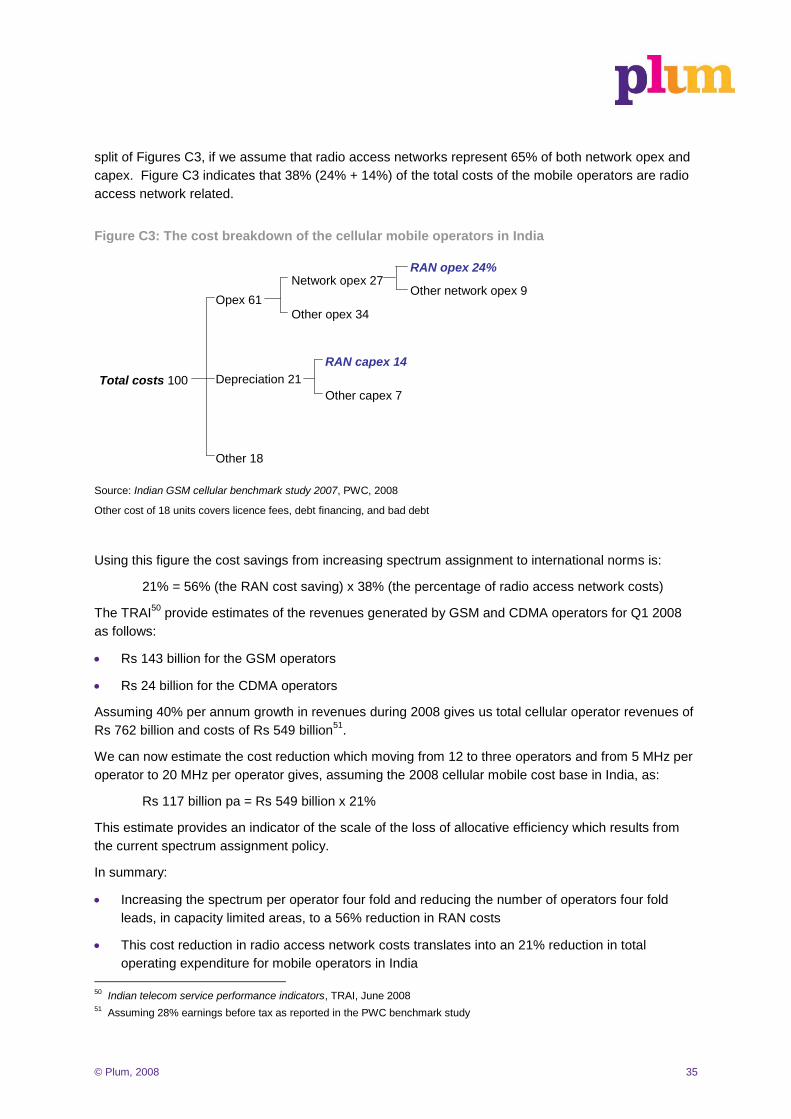
© Plum, 2008 35
split of Figures C3, if we assume that radio access networks represent 65% of both network opex and
capex. Figure C3 indicates that 38% (24% + 14%) of the total costs of the mobile operators are radio
access network related.
Figure C3: The cost breakdown of the cellular mobile operators in India
Total costs 100
Opex 61
Depreciation 21
Other 18
Network opex 27
Other opex 34
RAN capex 14
Other capex 7
RAN opex 24%
Other network opex 9
Source: Indian GSM cellular benchmark study 2007, PWC, 2008
Other cost of 18 units covers licence fees, debt financing, and bad debt
Using this figure the cost savings from increasing spectrum assignment to international norms is:
21% = 56% (the RAN cost saving) x 38% (the percentage of radio access network costs)
The TRAI50
provide estimates of the revenues generated by GSM and CDMA operators for Q1 2008
as follows:
Rs 143 billion for the GSM operators
Rs 24 billion for the CDMA operators
Assuming 40% per annum growth in revenues during 2008 gives us total cellular operator revenues of
Rs 762 billion and costs of Rs 549 billion51
.
We can now estimate the cost reduction which moving from 12 to three operators and from 5 MHz per
operator to 20 MHz per operator gives, assuming the 2008 cellular mobile cost base in India, as:
Rs 117 billion pa = Rs 549 billion x 21%
This estimate provides an indicator of the scale of the loss of allocative efficiency which results from
the current spectrum assignment policy.
In summary:
Increasing the spectrum per operator four fold and reducing the number of operators four fold
leads, in capacity limited areas, to a 56% reduction in RAN costs
This cost reduction in radio access network costs translates into an 21% reduction in total
operating expenditure for mobile operators in India
50
Indian telecom service performance indicators, TRAI, June 2008 51
Assuming 28% earnings before tax as reported in the PWC benchmark study
© Plum, 2008 36
This 21% cost reduction is currently worth Rs 117 billion pa.
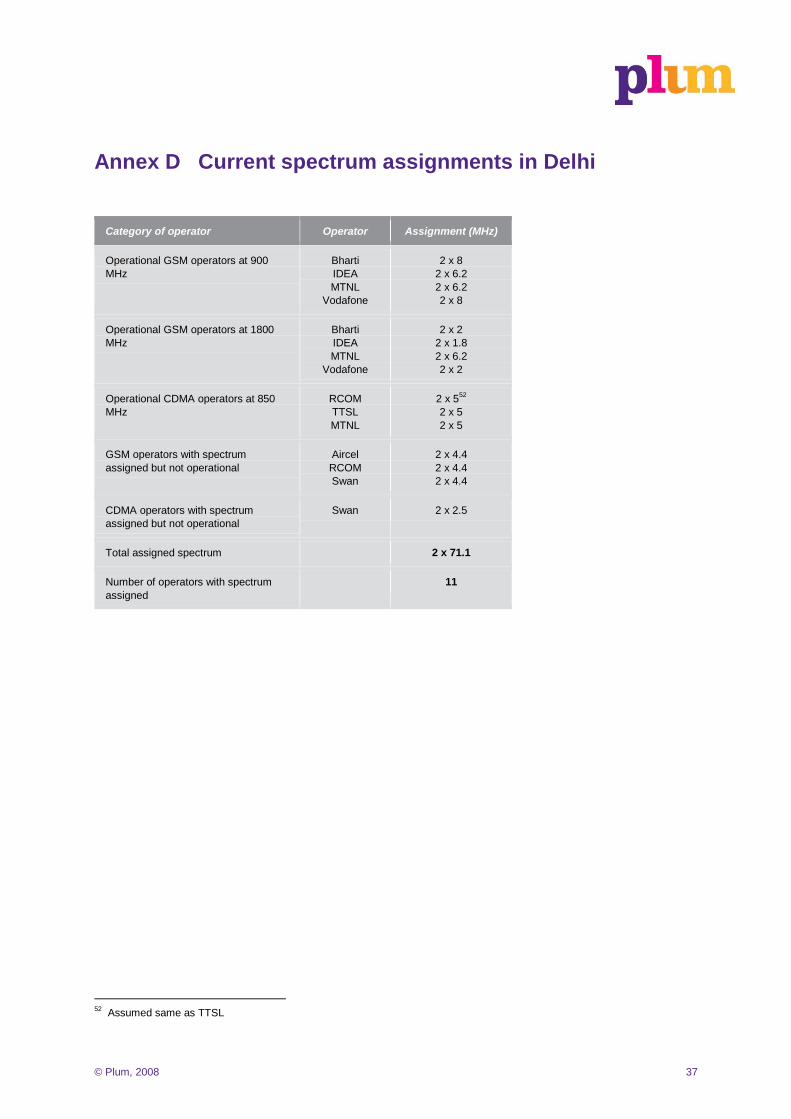
© Plum, 2008 37
Annex D Current spectrum assignments in Delhi
Category of operator Operator Assignment (MHz)
Operational GSM operators at 900
MHz
Bharti
IDEA
MTNL
Vodafone
2 x 8
2 x 6.2
2 x 6.2
2 x 8
Operational GSM operators at 1800
MHz
Bharti
IDEA
MTNL
Vodafone
2 x 2
2 x 1.8
2 x 6.2
2 x 2
Operational CDMA operators at 850
MHz
RCOM
TTSL
MTNL
2 x 552
2 x 5
2 x 5
GSM operators with spectrum
assigned but not operational
Aircel
RCOM
Swan
2 x 4.4
2 x 4.4
2 x 4.4
CDMA operators with spectrum
assigned but not operational
Swan 2 x 2.5
Total assigned spectrum 2 x 71.1
Number of operators with spectrum
assigned
11
52
Assumed same as TTSL