Embed Size (px)
Citation preview
i
AN ASSESSMENT OF THE CAUSES OF NON PERFORMING LOANS IN
TANZANIA COMMERCIAL BANKS:
A CASE OF NMB BANK PLC
BY
Phides Selestine Mchopa
A Dissertation Submitted to School of Business in Partial Fulfillment of the
Requirements for the Award of Master Degree in Business Administration
(MBA - Corporate Management) of Mzumbe University
2013
ii
CERTIFICATION
We, the undersigned, certify that we have read and hereby recommend for acceptance by the Mzumbe
University, a dissertation/thesis entitled an assessment of the causes of non-performing loans in
Tanzania commercial banks; a case of NMB bank PLC, Kenyatta road branch (Mwanza), in
partial/fulfillment of the requirements for award of the degree of Master of Business Administration
of Mzumbe University.
____________________________________
Major Supervisor
____________________________________
Internal Examiner
Accepted for the Board of School of Business
______________________________________________
DEAN, BOARD OF SCHOOL OF BUSINESS

iii
DECLARATION AND COPYRIGHT
I, Phides Selestine Mchopa, declare that this Dissertation is my own original work and that it has not
been presented and will not be presented to any other university for a similar or any other degree
award.
Signature ___________________________
Date________________________________
©
This dissertation is a copyright material protected under the Berne Convention, the Copyright Act 199
and other international and national enactments, in that behalf, on intellectual property. It may not be
reproduced by any means in full or in part, except for short extracts in fair dealings, for research or
private study, critical scholarly review or discourse with an acknowledgement, without the written
permission of Mzumbe University, on behalf of the author.

iv
ACKNOWLEDGEMENT
First of all I would like to express my exceptional thanks to almighty God for energizing me and make me
able to fulfill my academic responsibilities.
The successful of this report is the result of the commitment of many individuals all of whom deserve my
appreciation. So I would like to express my sincerely gratitude to my research supervisor Jasinta Msamula
whose encouragement, tolerance, patience, and full support from the initial to the final stage enabled me
to come up with this report together with Mr. Makoye.
Also I would like to thank my Family, particularly my beloved husband Lucas Mniko, my beloved
children Lulu, Loreen and Lisa, for their courage and support for the whole time since I started my
studies.
v
ABREVIATIONS
BOT – Bank of Tanzania
GDP – Gross Domestic Product
MSE’s – Micro and Small Enterprises
NMB – National Microfinance Bank
SME’s – Small and Medium Enterprises
SPSS – Statistical Package for Social Science research
US – United States
1
ABSTRACT
This study aims at assessing the causes of non-performing loans in Tanzania Commercial banks. The
study specifically aimed at assessing causes of nonperforming loans that related to bank operations
and causes of nonperforming loans that related to customers operations. The research questions
guided this study aim at probing causes of nonperforming loans that directly were related to bank
operations and customer operations respectively.
The study was guided by a survey research methodology whereby findings from the studied sample
were generalized to the entire population. The study sample was 50 respondents comprises of 40 loan
customers and 10 bank officials. Customers were selected by using simple random sampling where
by every tenth customer was included in the sample. Bank officials were selected using convenience
sampling techniques. Data were collected through interview guide and questionnaire.
The study found that causes of nonperforming loans related to customer operations were related to
moral hazards, inadequate business, financial, marketing, entrepreneurship and management skills,
fund diversion and multiple loans. On other hand, causes of nonperforming loans related to banking
operations were related to adverse customer selection problem, poor loan policy, inadequate loan
monitoring and recovery, long queue in banking hall, poor customer services and corruptions of bank
officers.
The study recommends that financial institutions should incorporate training of business,
entrepreneurship, financial management and accounting skills. Financial institution should also
design appropriate loan policy that will reduce credit risks, improve loan monitoring and collection.
2
TABLE OF CONTENTS
CERTIFICATION ........................................................................................................................................... i
DECLARATION AND COPYRIGHT ........................................................................................................... iii
ACKNOWLEDGEMENT; ............................................................................................................................. iv
ABREVIATIONS; ...................................................................................................................................... v ABSTRACT ................................................................................................................................................... 1
CHAPTER ONE ............................................................................................................................................. 7
INTRODUCTION .......................................................................................................................................... 7
1.1 Background of the Problem ................................................................................................................. 9 1.2 Problem Statement ............................................................................................................................. 10 1.3 Objectives of Study ........................................................................................................................... 11 1.3.1 The General Objectives ..................................................................................................................... 11 1.3.2 The specific objectives of the study ................................................................................................... 11 1.3.3 Research Question ............................................................................................................................ 11 1.4 Scope of the Study ............................................................................................................................. 11 1.5 Significance the Study ....................................................................................................................... 12 1.6 Limitations of the Study..................................................................................................................... 12
CHAPTER TWO .......................................................................................................................................... 13
LITERATURE REVIEW .............................................................................................................................. 13
2.1 Theoretical Literature Review .............................................................................................................. 13 2.1.1 The theory of Information Asymmetric in explain cause of non-performing loans ............................. 13 2.1.2 Framework for Monitoring the Development of Non-performing loans ............................................ 13 2.1.3 Relationship of Non-performing loans and Macro Economic conditions ..................................... 14 2.1.4 Relationship between Non performing loans and Eeconomic performance ........................................ 15 2.2 Empirical Literature .......................................................................................................................... 16 2.2.1 Non performing loans and Interest rates as a variable ........................................................................ 16 2.2.2 The relationship between Non performing Loans and Size of the Bank.............................................. 16 2.2.3 The relationship between Non performing Loans and Bank Policy .................................................... 17 2.2.4 The relationship between Non performing loans and Ownership concentration .................................. 17 2.2.5 The relationship of Non-performing loans and Ownership structure ........................................... 18 2.3 Conceptual Framework ........................................................................................................................ 19 2.3.1 Dependent Variable.................................................................................................................... 19 2.3.2 Independent Variable ................................................................................................................. 19 2.3.2 Variable Related to Bank Operations .......................................................................................... 19 2.3.3 Variable Related to Customer Operations ................................................................................... 19 2.4 Research Gap ...................................................................................................................................... 21
CHAPTER THREE ....................................................................................................................................... 22
3
RESEACH METHODOLOGY ..................................................................................................................... 22
3.1 Research Design ................................................................................................................................ 22 3.2 Study Area......................................................................................................................................... 22 3.3 Units of Study.................................................................................................................................... 23 3.4 Population of the Study ...................................................................................................................... 23 3.5 Sampling Frame ................................................................................................................................ 23 3.6 Sample size ....................................................................................................................................... 23 3.7 Sampling technique ........................................................................................................................... 24 3.8 Data Collection Method ..................................................................................................................... 24 3.8.1 Primary Data .................................................................................................................................... 24 3.8.2 Secondary Data ................................................................................................................................. 24 3.8.3 Field Experience ............................................................................................................................... 24 3.9 Research Methods ............................................................................................................................. 25 3.9.1 Quantitative Research Methodology.................................................................................................. 25 3.10 Tools of Data Collection .................................................................................................................... 26 3.11 Measurement and measuring scale ..................................................................................................... 26 3.12 Data Reliability and Validity .............................................................................................................. 26 3.12.1 Test of Reliability ...................................................................................................................... 26 3.12.2 Test of Validity .......................................................................................................................... 26
Data Editing .................................................................................................................................................. 27
Data Processing............................................................................................................................................. 27
CHAPTER 4 ................................................................................................................................................. 28
4.0 FINDINGS PRESENTATION AND ANALYSIS ................................................................................... 28
4.1. DEMOGRAPHIC CHARACTERISTICS OF RESPONDENTS ......................................................... 28 4.1.1 Primary occupation of respondents.................................................................................................... 28
5.0 DISCUSSION OF FINDINGS ................................................................................................................ 39
5.1 Demographic Characteristics of Respondents ....................................................................................... 39 5.1.1 Analysis of the sample ...................................................................................................................... 39 5.1.1.1 Primary Occupation of respondents ................................................................................................ 39 5.1.1.2. Working capacity of respondents .................................................................................................. 40 5.1.1.3 Education level of the respondents ................................................................................................. 40 5.1.1.4 Reasons for starting business.......................................................................................................... 41 5.1.4 Reasons for choosing type of business .............................................................................................. 42 5.1.1.5 Possibility for leaving the current job ............................................................................................. 43 5.1.1.6 Ways of starting business; .............................................................................................................. 44 5.1.1.7 Source of starting business; ............................................................................................................ 45 5.1.1.8 Marital status ................................................................................................................................. 46 5.1.1.9 Sources of credit ............................................................................................................................ 46 5.1.10 Critical business problem; ............................................................................................................... 47 5.1.1.11 Income obtained from business; ................................................................................................... 48 5.1.12 Change in amount of business ......................................................................................................... 48
4
5.2. CAUSES OF NON-PERFORMING LOANS RELATED TO CUSTOMERS OPERATION .................. 50
5.2.1 General business management skills ................................................................................................. 50 5.2.2. Financial Management Skills ........................................................................................................... 50 Figure 5.2.2 financial management skills ................................................................................................... 51 5.2.3 Accounting and book- keeping skills ................................................................................................. 51 5.2.4 Sales and marketing skills ................................................................................................................. 52 4.2.5 Entrepreneurship skills...................................................................................................................... 52 4.2.6. Transport services skills ................................................................................................................... 53
5.3. CAUSES OF NON-PERFORMING LOANS RELATED TO BANK OPERATIONS ............................ 57
SUMMARY, CONCLUSSION AND RECOMENDATION ......................................................................... 58
6.1. SUMMARY ....................................................................................................................................... 58
Financial Management Skills ............................................................................................................. 58
Accounting and book- keeping skills.................................................................................................. 58
Entrepreneurship skills ...................................................................................................................... 59
Transport services skills ..................................................................................................................... 59 6.1.3 Causes of non-performing loans related to Bank Opoperations .......................................................... 59 6.2 Conclusion; ......................................................................................................................................... 59 6.3 Recommendations; .............................................................................................................................. 60
Reference ...................................................................................................................................................... 62
5
LIST OF TABLES
Table 4.1.1 Primary Occupation of Respondent……………………………..……32
Table 4.1.2: Respondents working capacity………………………………………..33
Table 4.1.3 Education level of respondent…………………………………………33
Table 4.1.4 Reasons for starting business…………………………………….……34
Table 4.1.5 Reason for choosing business………………………………………….34
Table 4.1.8 Source of money for starting…………………………………………..36
Table 1.4.9 marital status of respondent……………………………………….…..36
Table 4.1.10 Source of credits for business………………………………….………37
Table 4.1.11 Critical business problem…………………………………………...…37
Table 4.1.12 Amount of income received from Business……………………………38
Table 4.1.13 Change in volume of business………………………………………….38
Table 4.1.14 Customers of business………………………………………………….48
Table 4.2.1 General business management skills….………………………………..39
Table 4.2.2 Financial management skills……………………………….…………...40
Table 4.2.3 Awareness of accounting and book keeping………………….………...40
Table 4.2.4 Sales and marketing skills…………………………………………….....41
Table 4.2.5 Received service of awareness of Entrepreneurship skills……………...41
6
LIST OF FIGURES
Figure 5.1.1 Primary occupation of respondents…………………...……..…43
Figure 5.1.2 working capacity of the respondents…………………….…….43
Figure 5.1.3 Education level of respondents………………………….……..45
Figure 5.1.4 Reasons for starting business……………………………..……46
Figure 5.1.4 Reason for choosing Business………………………….……....46
Figure 5.1.5 Possibility for leaving current business……………………..….48
Figure 5.1.6 Ways of starting business………………………………….…...48
Figure 5.1.7 Sources of starting business………………………………….…49
Figure 5.1.8 Marital status…………………………………………………....50
Figure 5.1.9 Source of credit ………………………………………………….51
Figure 5.1.10 Critical business problems………………………………………..51
Figure 5.1.11 Amount of income obtained from Business……………………...52
Figure 5.1.12 Change in amount of business……………………………………53
Figure 5.2.1 Received general business management skills……………………54
Figure 5.2.2 Financial management skills……………………………………..55
Figure 4.2.3 Awareness of accounting and book keeping……………………...56
Figure 5.2.4 Awareness of sales and marketing skills………………………….57
Figure 5.3.1 Non-performing loans related to bank operation ………………...58
Figure 4.2.6 Transport services skills……………………………………..……58
7
CHAPTER ONE
INTRODUCTION
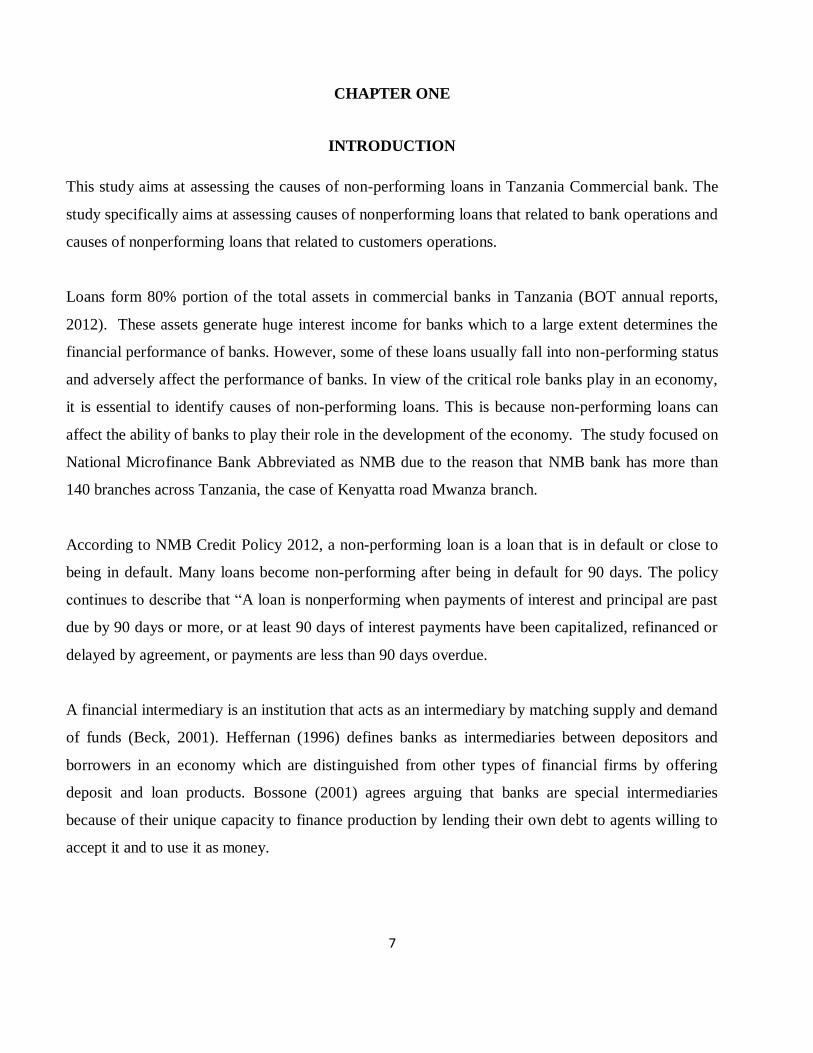
This study aims at assessing the causes of non-performing loans in Tanzania Commercial bank. The
study specifically aims at assessing causes of nonperforming loans that related to bank operations and
causes of nonperforming loans that related to customers operations.
Loans form 80% portion of the total assets in commercial banks in Tanzania (BOT annual reports,
2012). These assets generate huge interest income for banks which to a large extent determines the
financial performance of banks. However, some of these loans usually fall into non-performing status
and adversely affect the performance of banks. In view of the critical role banks play in an economy,
it is essential to identify causes of non-performing loans. This is because non-performing loans can
affect the ability of banks to play their role in the development of the economy. The study focused on
National Microfinance Bank Abbreviated as NMB due to the reason that NMB bank has more than
140 branches across Tanzania, the case of Kenyatta road Mwanza branch.
According to NMB Credit Policy 2012, a non-performing loan is a loan that is in default or close to
being in default. Many loans become non-performing after being in default for 90 days. The policy
continues to describe that “A loan is nonperforming when payments of interest and principal are past
due by 90 days or more, or at least 90 days of interest payments have been capitalized, refinanced or
delayed by agreement, or payments are less than 90 days overdue.
A financial intermediary is an institution that acts as an intermediary by matching supply and demand
of funds (Beck, 2001). Heffernan (1996) defines banks as intermediaries between depositors and
borrowers in an economy which are distinguished from other types of financial firms by offering
deposit and loan products. Bossone (2001) agrees arguing that banks are special intermediaries
because of their unique capacity to finance production by lending their own debt to agents willing to
accept it and to use it as money.
8
Commercial banks are the dominant financial institutions in most economies (Rose, 1997). Greuning
and Bratanovic (2003), argue that commercial banks play a critical role to emerging economies where
most borrowers have no access to capital markets. Well functioning commercial banks accelerate
economic growth, while poorly functioning commercial banks are an impediment to economic
progress and aggravate poverty (Barth et.al, 2001; Khan and Senhadji, 2001) in Richard (2011).
The traditional role of a bank is lending and loans make up the bulk of their assets (Njanike, 2009).
According to the research by Havrilesky and Boorman (1994), interest on loans contributes
significantly to interest income of commercial banks. Reed and Gill (1989) pointed out that
traditionally 85 percent of commercial banks‟ income is contributed by interest on loans. Loans
therefore represent the majority of a bank’s asserts (Saunders and Cornett, 2005). Lending is not an
easy task for banks because it creates a big problem which is called non performing loans (Chhimpa
J, 2002) as cited in (Upal, 2009). Due to the nature of their business, commercial banks expose
themselves to the risks of default from borrowers (Waweru and Kalami, 2009).
According to Alton and Hazen (2001) non performing loans are those loans which are ninety days or
more past due or no longer accruing interest. Hennie (2003) agrees arguing that non performing loans
are those loans which are not generating income. This is further supported by Caprio and Klingebiel
(1996), cited in Fofack (2005), who define non performing loans as those loans which for a relatively
long period of time do not generate income that is, the principal and or interest on these loans have
been left unpaid for at least ninety days. Non- performing loans are also commonly described as loans
in arrears for at least ninety days (Guy, 2011). Therefore in this study, non performing loans are loans
that are ninety or more days delinquent in payments of interest and/or principal (Bexley and
Nenninger, 2012).
The term “bad loans” as described by Basu (1998) in Fofack (2005) is used interchangeably with
non- performing and impaired loans. Berger and De Young, (1997) also consider these types of loans
as “problem loans”. In effect, these would be considered bad or toxic assets on the bank’s books
(Bexley and Nenninger, 2012). These descriptions were used interchangeably during the study.
According to Berger and De Young (1997), non performing loans could be injurious to the financial
performance of banking institutions.
9
According to Kroszner (2002) in Waweru and Kalami (2009), non-performing loans are closely
associated with banking crises. Greenidge and Grosvenor (2010), argue that the magnitude of non-
performing loans is a key element in the initiation and progression of financial and banking crises.
Guy (2011) agrees arguing that non performing loans have been widely used as a measure of asset
quality among lending institutions and are often associated with failures and financial crises in both
the developed and developing world. Reinhart and Rogoff (2010) as cited in Louzis et al (2011) point
out that non- performing loans can be used to mark the onset of a banking crisis. Despite ongoing
efforts to control bank lending activities, non performing loans are still a major concern for both
international and local regulators (Boudriga et al, 2009)
1.1 Background of the Problem
Over the years, there have been an increased number of significant bank problems in both, matured as
well as emerging economies (Brownbridge and Harvey, 1998; Basel, 1999, 2004) cited in Richard
(2011). Bank problems, mostly failures and financial distress have afflicted numerous banks, many of
which have been closed down by regulatory authorities (Brownbridge, 1998). This in turn led to
contraction of activities, decline in output, and imposition of substantial costs on the economy
(Chijoriga, 1997; Brownbridge and Harvey, 1998) cited in Richard (2011). Borio and Lowe (2002)
observed that the cost of banking crises in terms of output loss has been high; typically double digit
percentage of GDP
Studies in other countries show that most of bank failures have been caused by non performing loans
(Brownbridge, 1998). Ahmad (2002), in analyzing the Malaysian financial system, reported a
significant relationship between credit risk and financial crises and concluded that credit risk had
already started to build up before the onset of the 1997 Asian financial crisis, and became more
serious as non performing loans increased. Li (2003) and Fofack (2005) also found this relationship
to be significant. There is evidence that the level of non -performing loans in the US started to
increase substantially in early 2006 in all sectors before the collapse of the sub-prime mortgage
market in August 2007 (Greenidge and Grosvenor, 2010).
10
Nishimura et al (2001) studied the situation in Japan and concluded that some of the loans made to
companies during the bubble era became non- performing when the bubble burst. The findings of
Caprio and Klingebiel (2002) cited in Fofack (2005), show that in Indonesia, non-performing loans
represented about 75% of total loan assets which led to the collapse of over sixty banks in 1997.
While some countries such as Sweden, Norway, Finland, Australia and Spain do not seem to be
exposed to non performing loans (less than 1 percent) other countries such as Egypt, Nigeria,
Philippines, Morocco, Algeria and Tunisia (more than 15 percent) suffer severely from bad loans
(Boudriga et al, 2009).
Palubinskas and Stough (1999) note that the failure of a bank is mainly seen as a result of
mismanagement because of bad lending decisions made with respect to wrong appraisal of credit
status, or the repayment of non-performing credits and excessive focus on giving loans to certain
customers. Goodhart et al (1998) also state that poor credit control, which results in undue credit r isk,
causes bank failure. Chimerine (1998) adds that a bad lending tradition leads to a large portfolio of
unpaid loans. This results in insolvency of banks and reduces funds available for fresh advances,
which eventually causes a financial crisis. Goodhart et al. (1998) add connected lending to the causes
of bank failure. Palubinskas and Stough (1999) note that lack of dependable financial information on
borrowers to help in assessing creditworthiness causes a bank failure.
1.2 Problem Statement
According to the Mid-Year Fiscal Policy Statement (2012) the upward trend in non-performing loans
and recent bank failures in Tanzania is a cause for concern. Despite lessons obtained from the 2008
World financial crisis, banks are still suffering from non performing loans.
The loan-to-deposit ratio of NMB, calculated on the basis of total bank deposits increased from 84.6
percent in May 2012 to 86.2 percent in December 2012 (NMB Loan Report, 2012). According to the
Mid-Year Quarterly SME loan performance Statement presented on the 18th of July, non-performing
loans were 9.9 percent as at 30 June 2012. The report also indicates that non performing loans in
NMB Bank increased from 6 percent on average at end-December 2011 to 8 percent at end-June
2012. This is higher than the prudential threshold of 2 percent stipulated in Basel II (Basel, 2004;
11
ADF, 2012). Non-performing loans could rise further with the ongoing deceleration in economic
activity. This gives a reasonable concern for scholars to assess causes of nonperforming loans in
commercial bank. The study assessed casuses related to both banking and customer operations.the
study area was NMB Kenyatta Road Branch located in Mwanza City Tanzania.
1.3 Objectives of Study
1.3.1 The General Objectives
The general objective of the study is to assess the causes of non-performing loans in Tanzania
commercial banks.
1.3.2 The specific objectives of the study
The specific objectives of the study is
1.3.2.1 To assess the causes of non- performing loans related to banking operations
1.3.2.2 To assess the causes of non- performing loans related to customers operations,
1.3.3 Research Question
The study addressed the following research questions
1.3.3.1 How do bank- related causes contribute to non-performing loans?
1.3.3.2 How do customers-related causes contribute to non-performing loans?
1.4 Scope of the Study
The study focuses on the causes of non-performing loans that related to banking and customers
operation. The study area is NMB Bank Limited; one of Tanzania largest banks in terms of deposit
and branch network. This is premised on the fact that the Bank has been operating long enough to
give the kind of academic insight the study seeks to offer. Besides, the bank lends to almost all the
major sectors of the economy. Again, the nation-wide operation of the bank presents an opportunity
for a national outlook of the issues under the study.
12
1.5 Significancece the Study
The findings of this study added new knowledge to the existing knowledge gap of causes of non-
performing loans related to banking and customer operations. The study is of benefits to Banking
monitoring master plan and indicator information, financial institutions, financial markets, Policy
maker, business community, and the community at large. The study is going to explore and
recommends potential areas that bankers and customers need to put more efforts when utilizing loans
services. On the other hand, policy makers benefited in the sense that, the findings provided informed
suggestion on how credit policy should be improved to accommodate the causes of non-performing
loans related to bank operations and causes of non-performing loans related to customer operations.
With good and sound credit policy and easy implementation of the policies, more individuals,
businesses, and the community at large will be able to access, utilize and benefit from financial
capital service.
1.6 Limitations of the Study
This study was limited by interruption of our respondents by customers especially in collection of
data. This is due to the fact that as we were collecting data in their working place (shops) so data
collection was sometimes interrupted by customers who come to buy products in their shops, so it
takes a very long time to complete a single questionnaire.
But also the study face the limitation of respondents (especially SME’s customers) they afraid
providing cooperation thinking that we were government agency trying to investigate their income for
the aim of deducting high taxes from their business. So, researcher was required to educate them on
the reasons for conducting this study. Also shortage of funds was among limitations.
1.7 Organization of the study;
This study is organized in five chapters. Chapter one presents background introduction, problem
statement, research objectives, research questions and significance of the study
Chapter two review of literature both theoretical and empirical related to cause of non performing
loans in commercial banks, Chapter three presents study methodology, chapter four presents research
findings and lastly chapter five presents discussion, summary and conclusion
13
CHAPTER TWO
LITERATURE REVIEW
2.1 Theoretical Literature Review
2.1.1 The theory of Information Asymmetric in explain cause of non-performing loans
The theory of asymmetric information tells us that it may be difficult to distinguish well from bad
borrowers (Auronen, 2003) in Richard (2011), which may result into adverse selection and moral
hazards problems. The theory explains that in the market, the party that possesses more information
on a specific item to be transacted (in this case the borrower) is in a position to negotiate optimal
terms for the transaction than the other party (in this case, the lender) (Auronen, 2003) in Richard
(2011). The party that knows less about the same specific item to be transacted is therefore in a
position of making either right or wrong decision concerning the transaction. Adverse selection and
moral hazards have led to significant accumulation of non-performing loans in banks (Bester, 1994;
Bofondi and Gobbi, 2003).
2.1.2 Framework for Monitoring the Development of Non-performing loans
In scholar studies, problem loans are often used as an exogenous variable to explain other banking
outcomes such as bank performance, failures, and bank crises. However, some studies investigate
problem loans as an endogenous variable; GDP growth, inflation and interest rates are common
macro-economic factors, while size and lending policy are micro-economic. These variables are by
no means exhaustive, but they provide a useful framework for monitoring the development of non-
performing loans (Guy, 2011).
More recent researches started examining the fragility of the Argentinean Banking system over the
1993-1996 period; they argue that non performing loans are affected by both bank specific factors
and macroeconomic factors. To separate the impact of bank specific and macroeconomic factors, the
14
authors employ survival analysis. Using a dynamic model and a panel dataset covering the period
1985-1997 to investigate the determinants of problem loans of Spanish commercial and saving banks,
Salas and Saurina (2002) reveal that real growth in GDP, rapid credit expansion, bank size, capital
ratio and market power explain variation in non- performing loans. Furthermore, Jimenez and Saurina
(2005) examine the Spanish banking sector from 1984 to 2003; they provide evidence that non
performing loans are determined by GDP growth, high real interest rates and lenient credit terms.
This study attributes the latter to disaster myopia, herd behaviour and agency problems that may
entice bank managers to lend excessively during boom periods (Guy, 2011).
2.1.3 Relationship of Non-performing loans and Macro Economic conditions
Meanwhile, Rajan and Dhal (2003) utilize panel regression analysis to report that favourable
macroeconomic conditions and financial factors such as maturity, cost and terms of credit, banks size,
and credit orientation impact significantly on the non performing loans of commercial banks in India.
Babihuga (2007), in an IMF working paper, explores the relationship between several
macroeconomic variables and financial soundness indicators (capital adequacy, profitability, and
asset quality) based on country aggregate data.
She explained the cross-country heterogeneity by differences in interest rates, inflation, and other
macroeconomic factors. However, the study does not consider the impact of industry specific drivers
of problem loans. Most empirical studies examine the influence of the macroeconomic environment
on non performing loans (Louzis et al, 2011). Rinaldi and Sanchis-Arellano (2006) analyze household
non performing loans for a panel of European countries and provide empirical evidence that
disposable income, unemployment and monetary conditions have a strong impact on non performing
loans.
Berge and Boye (2007) find that problem loans are highly sensitive to the real interest rates and
unemployment for the Nordic banking system over the period 1993–2005. Lawrence (1995) examines
the theoretical literature of life-cycle consumption model and introduces explicitly the probability of
default. This model implies that borrowers with low incomes have higher rates of default due to
increased risk of facing unemployment and being unable to settle their obligation. Additionally, in
equilibrium, banks charge higher interest rates to riskier clients. Rinaldi and Sanchis-Arellano (2006)
15
extend Lawrence’s model by assuming that agents borrow in order to invest in real or financial assets.
They argue that the probability of default depends on current income and the unemployment rate,
which is linked to the uncertainty regarding future income and the lending rates.
Breuer (2006), using Bankscope data, analyses the impact of legal, political, sociological, economic,
and banking institutions on problem bank loans. Nevertheless, her study suffers from a
representativeness bias due to the fact that Bankscope data on non performing loans are only
available for a very limited number of countries and for a few numbers of banks. Other studies
focusing on the macroeconomic determinants of non-performing loans include Cifter et al. (2009),
Nkusu (2011) and Segoviano et al. (2006).
2.1.4 Relationship between Non performing loans and Eeconomic performance
Carey (1998) argues that “the state of the economy is the single most important systematic factor
influencing diversified debt portfolio loss rates” (Carey, 1998, p. 1382). Quagliarello (2007) finds
that the business cycle affects non performing loans for a large panel of Italian banks over the period
1985–2002. Furthermore, Cifter et al. (2009) provides empirical evidence for a lagged impact of
industrial production on the number of non performing loans in the Turkish financial system over the
period 2001–2007.
Salas and Saurina (2002) estimate a significant negative contemporaneous effect of GDP growth on
non performing loans and infer the quick transmission of macroeconomic developments to the ability
of economic agents to service their loans (Bangia et al., 2002; Carey, 2002). Nkusu (2011)
investigating the macroeconomic determinants of loan defaults through panel regressions and panel
vector autoregressive models. The author suggests that hike in interest rates result in deterioration of
borrower’s repayment capacity and hence, cause of increase in non-performing loans.
There is significant empirical evidence to suggest that local economic conditions explain to some
extent, the variation in non-performing loans experienced by banks (Keeton and Morris, 1987; Sinkey
and Greenwalt, 1991; Salas and Saurina, 2002; Rajan and Dhal, 2003) as cited in (Greenidge and
Grosvenor, 2010) Research conducted in the Caribbean includes that of Khemraj and Pasha (2009),
16
who examined the determinants of non-performing loans in Guyana. The empirical results revealed
that with the exception of the inflation rate and bank size, all other factors have a significant
relationship with the non performing loan ratio (Greenidge and Grosvenor, 2010).
2.2 Empirical Literature
2.2.1 Non performing loans and Interest rates as a variable
Causes and treatment of non-performing loans were studied in detail by Bloem and Gorter (2001).
They agreed that “bad loans” may considerably rise due to abrupt changes in interest rates. They
discussed various international standards and practices on recognizing, valuing and subsequent
treatment of non-performing loans to address the issue from view point of controlling, management
and reduction measures.
A study conducted by Espinoza and Prasad (2010) focused on macroeconomic and bank specific
factors influencing non-performing loans and their effects in GCC Banking System. After a
comprehensive analysis, they found that higher interest rates increase non performing loans but the
relationship was not statistically significant.
2.2.2 The relationship between Non performing Loans and Size of the Bank
Salas and Saurina (2002) find a negative relation between bank size and non performing loans and
argue that bigger size allows for more diversification opportunities. Hu et al. (2004) and Rajan and
Dhal (2003) report similar empirical evidence
Another strand of literature has focused on the degree of loan concentration in various sectors, and
proposes that vulnerabilities within sectors of high loan concentration tend to exacerbate the non
performing ratio (Herring and Wachter, 1999) as cited in (Guy, 2011). However, Stiroh (2004) does
not find evidence of benefits from diversification in the form of reduced risk, for the US banking
system, since non-interest income growth was highly correlated with net interest income during the
1990s.
17
2.2.3 The relationship between Non performing Loans and Bank Policy
The moral hazard of too-big-to-fail banks represents another channel relating bank-specific features
with non performing loans (Louzis et al, 2011). A policy concern is that too-big-to-fail banks may
resort to excessive risk taking since market discipline is not imposed by its creditors who expect
government protection in case of a bank‟s failure (Stern and Feldman, 2004). Consequently, large
banks may increase their leverage too much and extend loans to lower quality borrowers (Louzis et
al, 2011). Boyd and Gertler (1994) argue that in the 1980s the tendency of US large banks towards
riskier portfolios was encouraged by the US government’s too-big-to-fail policy. On the other hand,
Ennis and Malek (2005) examine US banks‟ performance across size classes over the period 1983–
2003 and conclude that the evidence for the too-big-to-fail distortions is in no way definite. Hu et al
(2006) also show that bank size is negatively related to non performing loans.
In a seminal study, Berle and Means (1933) in Louzis et al. (2011) argue that dispersed ownership of
corporate equity may lead to a poorer performance of the firm as the incentive of shareholders to
monitor the management weakens. An opposing view is that an efficient capital market imposes
discipline on firm’s management and therefore dispersed ownership should not have an effect on
firm’s performance (Fama, 1980) as cited in (Louzis et al., 2011). A strand in the empirical literature
tests these contrasting views using loan quality as an indicator of riskiness but evidence is
inconclusive (Louzis et al, 2011).
2.2.4 The relationship between Non performing loans and Ownership concentration
Iannotta et al. (2007) find a link between higher ownership concentrations and loan quality using a
sample of 181 large banks over the period 1999–2004, thus lending support to the Berle and Means
view. On the other hand, Laeven and Levine (2009) employ data on 279 banks and find a positive
association between greater cash flow rights of a large owner and risk taking. Furthermore, Shehzad
et al. (2010) present empirical evidence, from a data set comprising 500 banks from 2005 to 2007,
18
that ownership proxied by three levels of shareholding (10%, 20% and 50%) has a positive impact on
the non performing loans ratio when the level of ownership concentration is defined at 10% but a
negative impact when the level of level of ownership concentration is defined at 50%.
Therefore they suggest that sharing of control may have adverse effects on the quality of loans
extended up to a level, but in cases of a strong controlling owner, bank’s management becomes more
efficient leading to lower non performing loans. Azofra and Santamaria (2011) find that high levels
of ownership concentration benefit both the bank’s profitability and efficiency for a sample of
Spanish commercial banks.
2.2.5 The relationship of Non-performing loans and Ownership structure
Empirically, Novaes and Werlang (1995) report lower performance for state controlled banks in
Brazil and Argentina due to high proportion of problem loans given to government. Micco et al.
(2004), analyze 50,000 financial institutions with different ownership types covering 119 countries.
They conclude that non performing loans tend to be higher for banks with state ownership than for
other groups. Hu et al. (2004) use a panel of Taiwanese banks and find a positive correlation between
capital share owned by the state and the level of non- performing loans. Garcia-Marco and Robles-
Fernandez (2007) investigate the relationship between risk taking and ownership structure. They
document that commercial banks (mainly private owned) are more exposed to risk than deposit banks
(mainly state owned). More recently Hu et al (2006) analysed the relationship between non
performing loans and ownership structure of commercial banks in Taiwan with a panel dataset
covering the period 1996-1999. The study shows that banks with higher government ownership
recorded lower non-performing loans. Using a pseudo panel-based model for several Sub-Saharan
African countries, Fofack (2005) finds evidence that economic growth, real exchange rate
appreciation, the real interest rate, net interest margins, and inter-bank loans are significant
determinants of non-performing loans in these countries. The author attributes the strong association
between the macroeconomic factors and non-performing loans to the undiversified nature of some
African economies.
19
2.3 Conceptual Framework
2.3.1 Dependent Variable
Dependent variable that guides this research is non-performing loans. Non-performing loans depends
on numerous of variables that can be grouped mainly into bank operations variables and customer
operations variables.
2.3.2 Independent Variable
Independent variables are grouped into banking operations variables and customer operations variable
2.3.2 Variable Related to Bank Operations
Variables that related to bank operations are credit policy, credit appraisal, competition, queue, and
under or over financing
2.3.3 Variable Related to Customer Operations
Variable those are related to customer operations are moral hazards, inadequate business, financial,
marketing, entrepreneurship and management skills, fund diversion and multiple loans
20
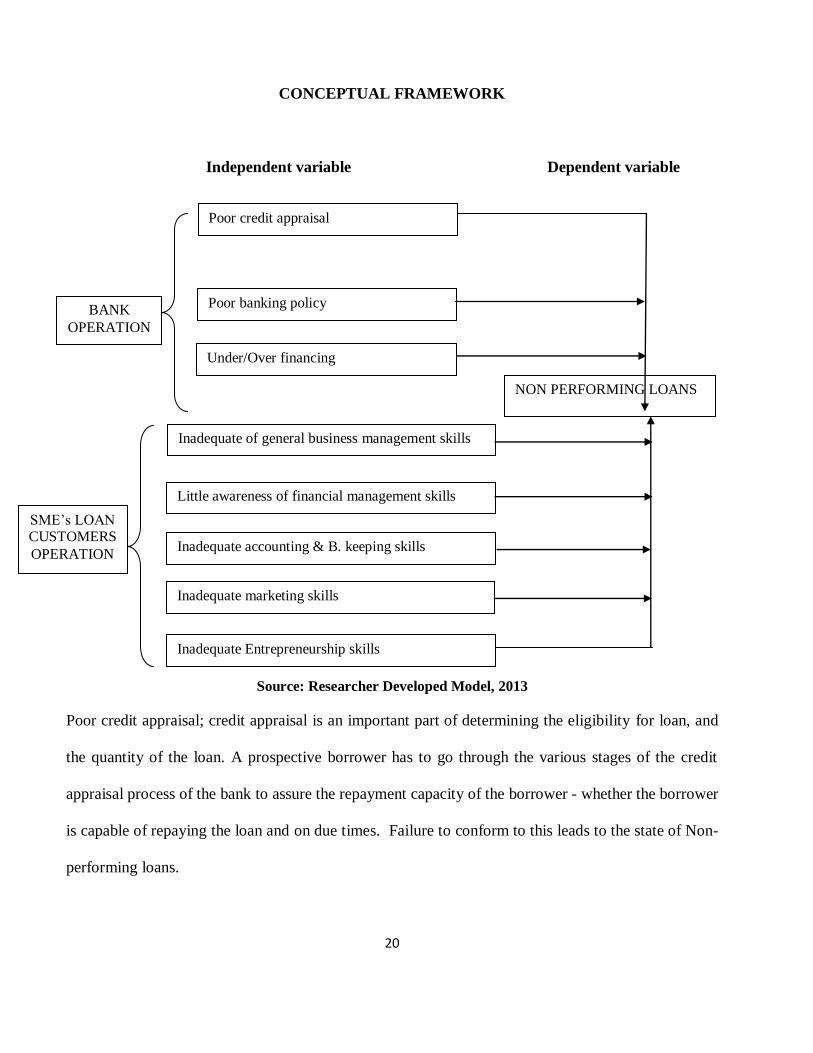
CONCEPTUAL FRAMEWORK
Independent variable Dependent variable
Source: Researcher Developed Model, 2013
Poor credit appraisal; credit appraisal is an important part of determining the eligibility for loan, and
the quantity of the loan. A prospective borrower has to go through the various stages of the credit
appraisal process of the bank to assure the repayment capacity of the borrower - whether the borrower
is capable of repaying the loan and on due times. Failure to conform to this leads to the state of Non-
performing loans.
Poor credit appraisal
Poor banking policy
Under/Over financing
Inadequate marketing skills
Inadequate Entrepreneurship skills
Inadequate accounting & B. keeping skills
Little awareness of financial management skills
Inadequate of general business management skills
NON PERFORMING LOANS
BANK
OPERATION
SME’s LOAN CUSTOMERS
OPERATION
21
Competition from other credit institution also leads to non-performing loans. SMEs loan customers
tend to have more than one loan from different financial institutions which make it hard for them to
make loan repayment timely, so this lead to non-performing loans.
Long banking queue in banking hall; this discourages SMEs loan customers in repaying their loans,
due to the reason that they are required to spend long time in banking queue something which
demoralizes customers and eventually non-performing loans.
Poor banking policy; other banking policy does not assure loan repayment by the SME’s loan
customers, so these kinds of policies lead to Non-performing loans due to the fact that banking
policies especially credit policies when they are not conducive.
On the other hand, business skills like financial management skills, Accounting and Book-keeping
skills, marketing skills and entrepreneurship skills are very important in business operation, so
inadequacy skills affect loan repayments leading to non-performing loans.
2.4 Research Gap
From the above empirical studies, authors attribute association factors and non performing loans to
the undiversified nature of African economies. While it might true to Tanzanian commercial banks,
this research study grouped non-performing loans factors into two groups; factors related to bank
operations and factors relating to customers operations. The aim is to enable each group to come with
strategies to reduce non performing loans in Tanzania commercial banks.
22
CHAPTER THREE
RESEACH METHODOLOGY
3.1 Research Design
The study adopted the use of a descriptive case research design. The case study approach was
preferred by the researcher due to time constrain and also on the availability and reliability of data
from the NMB Plc Kenyatta Road – Mwanza. Also the researcher works within the banking sector
thus it was easier to collect data from the respondents. This descriptive case research was aimed at
getting detailed information regarding the Causes of nonperforming loans to Tanzania Commercial
Banks. A descriptive study is concerned with finding out the what, where and how of a phenomenon
(Ngechu, 2004). Descriptive research design was chosen because it enabled the researcher to infer the
findings to a larger population with high level of accuracy. The focus of the study was both
quantitative and qualitative in order to gain a better understanding and more insightful interpretation
of the results. According to Coopers and Schindler (2004) descriptive studies are more formalized
and typically structured with investigative questions.
3.2 Study Area
The study was conducted at NMB Bank PLC, Kenyatta road branch, Mwanza City Tanzania.
Kenyatta Raoad Branch was the first Branch of National Microfinance Loan to lend to SMEs
Customers since 2000. This has brought enough experience to Bank officer and large base of
experienced SMEs borrowers. In 2012 he branch recorded high Non performing loan of 21%
compared to other NMB branches offering the same product
23
3.3 Units of Study
The units of study of study were Bank officers and SMEs Loan customers.
3.4 Population of the Study
The individual study population was drawn from NMB Kenyatta road records. According to NMB
Kenyatta road records of March 2013, SMEs customers were 400. The branch has 6 Loan officers, 1
branch manager and 1 commercial manager and 2 officers from MNB court brokers
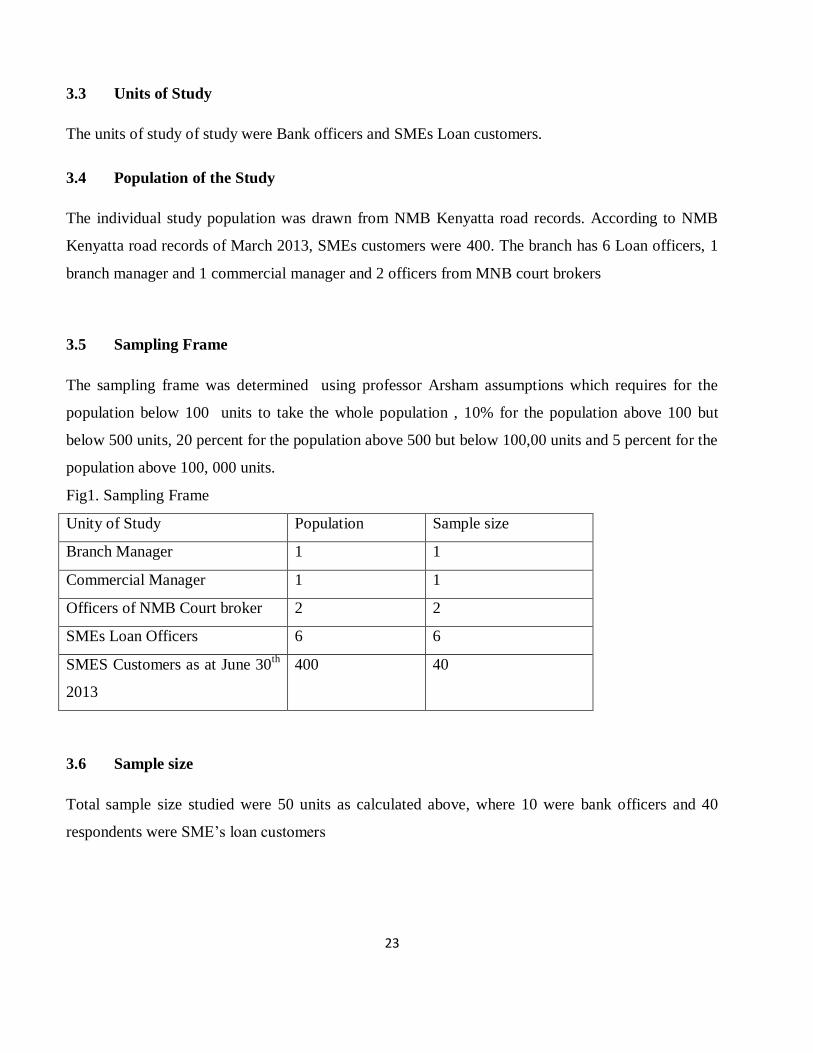
3.5 Sampling Frame
The sampling frame was determined using professor Arsham assumptions which requires for the
population below 100 units to take the whole population , 10% for the population above 100 but
below 500 units, 20 percent for the population above 500 but below 100,00 units and 5 percent for the
population above 100, 000 units.
Fig1. Sampling Frame
Unity of Study Population Sample size
Branch Manager 1 1
Commercial Manager 1 1
Officers of NMB Court broker 2 2
SMEs Loan Officers 6 6
SMES Customers as at June 30th
2013
400 40
3.6 Sample size
Total sample size studied were 50 units as calculated above, where 10 were bank officers and 40
respondents were SME’s loan customers
24
3.7 Sampling technique
The study employed random sampling where every participant had a chance to be included in the
sample, where in the total number of 400 SME’s loan customers, 40 respondents were picked
randomly by using the random number table.
3.8 Data Collection Method
3.8.1 Primary Data
Primary data were obtained using interview schedules and questionnaire. The researcher conducted
face to face interviews with Branch Managers, Commercial managers, SMEs loan officers and SMEs
customers. Interviews with bank staff explored financial institutional framework, policy and
experience of credit administration and performance trends. Causes of nonperforming loans related to
bank was established. The SMEs questionnaire included structured questions from which the
interviewer noted down respondents’ responses that best matched their views or experiences, giving
inference on causes of nonperforming loans related to customers of SMES loans. The use of
questionnaire to extract perception is rationalized by public role as intended ultimate SMEs loans
3.8.2 Secondary Data
Secondary data were collected from NMB published annual and quarterly reports, financial markets,
businesses and governments annual reports, Bank of Tanzania performance reports, Poverty related
reports, National Surveys, SMEs customers credit files and other literature.
3.8.3 Field Experience
Field data were collected from 15th June 2013 to 29
th June 2013. The researcher approached NMB
PLC staffs and SME’s Loan customers to collect data from them. Participants from NMB Plc include;
commercial manager, SME’s loan officer, ME loan officer, Customer service officer, and bank teller.
Also, the researcher chose randomly 40 SME’s loans customers from Liberty Street, City Center-
Mwanza. On 15th
June 2013, the questionnaires were given to all key informants and were collected
back after five days.
25
Assisted by two trained researchers, data were managed to be collected from SME’s Loans customers
from 21st to 29
th June 2013. Data were collected from 40 SME’s loans customers in Liberty Street.
SME’s loans customers provided a very good cooperation during the interview and were relaxing
when responding to questions. But some of them were worried that perhaps the government agency
was trying to spy on their income, so as to pay high tax. But we tried to explain that the purpose of
research that it was mainly for academic purpose.
3.9 Research Methods
This study is a quantitative one. The aim was to quantify the cause relationship of nonperforming
loans in commercial bank related to banking and customer operations.
3.9.1 Quantitative Research Methodology
To obtain information about causes of nonperforming loans related to banks and customers,
quantitative approach was used, because most causes are well documented by banks. The studies rank
them and identify which cause contributes most and which cause contributes least.
Since the focus was on causes of nonperforming loans, it was scientific to start with the survey where
a large amount of general information was gathered towards the different causes. But, the outcomes
resulting from the survey was not taken as valid immediately. By use of in-depth interviews possible
remarkable errors was investigated as well as additional information that can contribute to the validity
of statistical outcomes.
Because the survey as well as the in-depth interviews contained with help of individuals, businesses
and government agencies another method was needed. This method was a field experiment; focus
groups were established. These focus groups specifically addressed causes of nonperforming loans
from bank and customers perspectives
This sequential design was dominated by quantitative method that aimed at assessing the factors
causing non-performing loans. The field study complements and deepened the survey results
followed by an experiment to check for the results for both steps (Flick 2007, 95)
26
And for the case of Research design, this study descriptive technique was employed.
3.10 Tools of Data Collection
Data was collected through interview schedules and questionnaire. The interview schedules contained
a set of questions, which were filled by enumerators. The researcher enumerated the answers by
cross-examination in order to find out the truth. During enumeration the researcher explained the
aims and objects of the study and also removed difficulties which respondents failed to understand.
3.11 Measurement and measuring scale
The study employed nominal and ordinal scales. Numbers were assigned to category of respondents
and questions. For instance male were assigned no. 1 and female no. 2. Causes were ranked in order.
Arbitrary scales measuring method were developed in order to demonstrate causes of nonperforming
loans
3.12 Data Reliability and Validity
3.12.1 Test of Reliability
In order to ensure reliability of interview guide, the study standardized the measurement for all
categories of respondents. This enabled to reduce external source of variation such as boredom,
fatigue and biases. Designing measurement directions that had no variation from one group to group
and broadening the sample of items tested reliability.
3.12.2 Test of Validity
The study tested internal validity of the interview guide ability to measure causal relationship of
nonperforming loans. In order to be confident with the instrument, the researcher administered the
instrument to focus group discussion in order to test the adequacy and coverage of the causes of
nonperforming loans. Participants agreed in principle for items to include in the interview guide to
adequately covering causes of nonperforming loans under study. Using panel of staffs who are
27
responsible issue and approve loans (loans officer) form NMB Kenyatta road who judged how well
the instrument meets the standard,
More over the instrument was tested to see if it was in conformity with predicted correlation with
other theoretical propositions. This brought confident for the instrument to produce intended results
3.12.3 Data analysis
In data analysis the following was employed
Data Editing
Data editing was employed during the point filling the questionnaire, also further editing of primary
data was done in the stage of sorting and analysis. Thus, in both the stages, the researcher reviewed
the reasons lead to non-performing loans in Tanzania commercial banks.
Data Processing
The researcher also processed data at the process of answering the research questions, whereby
percentages and frequency distribution were used to process data.
28
CHAPTER FOUR
FINDINGS PRESENTATION AND ANALYSIS
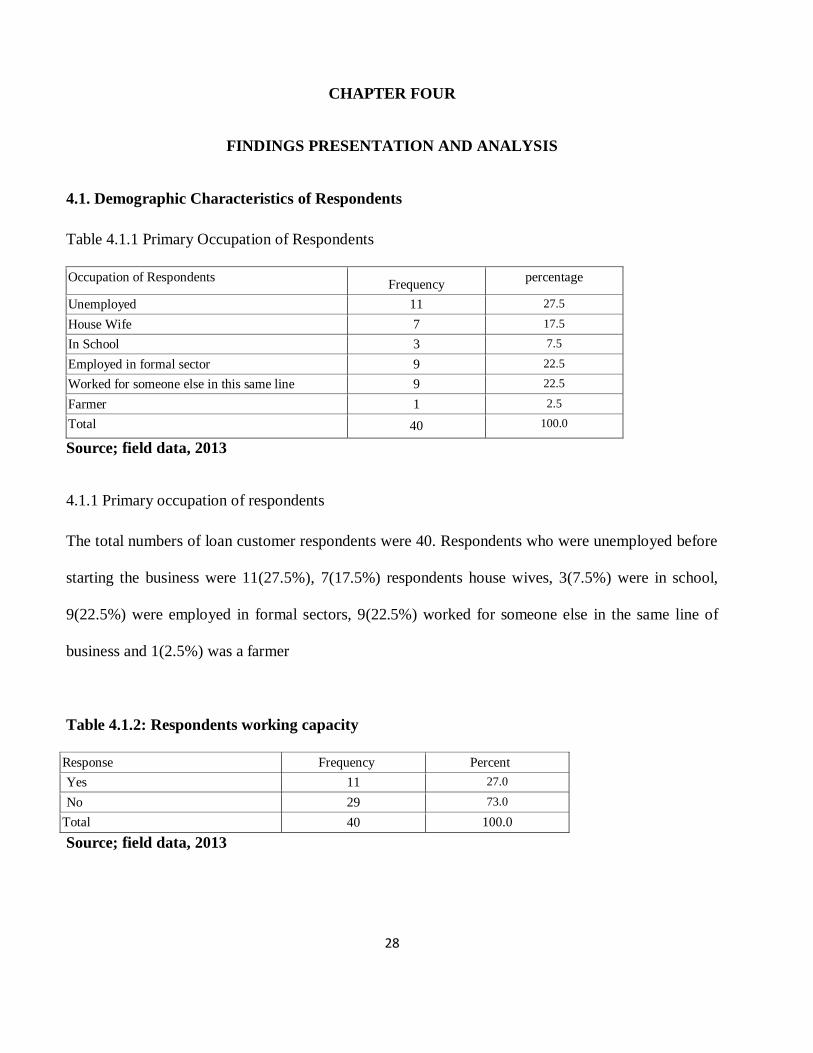
4.1. Demographic Characteristics of Respondents
Table 4.1.1 Primary Occupation of Respondents
Occupation of Respondents Frequency
percentage
Unemployed 11 27.5
House Wife 7 17.5
In School 3 7.5
Employed in formal sector 9 22.5
Worked for someone else in this same line 9 22.5
Farmer 1 2.5
Total 40 100.0
Source; field data, 2013
4.1.1 Primary occupation of respondents
The total numbers of loan customer respondents were 40. Respondents who were unemployed before
starting the business were 11(27.5%), 7(17.5%) respondents house wives, 3(7.5%) were in school,
9(22.5%) were employed in formal sectors, 9(22.5%) worked for someone else in the same line of
business and 1(2.5%) was a farmer
Table 4.1.2: Respondents working capacity
Response Frequency Percent
Yes 11 27.0
No 29 73.0
Total 40 100.0
Source; field data, 2013
29
4.1.2 Respondents working capacity
Respondents were asked to if there were still working in the same capacity as before they started
business. The response rate was 11(27%) continued to work in the same capacity while 29(73%) they
do not work in the same capacity as before.
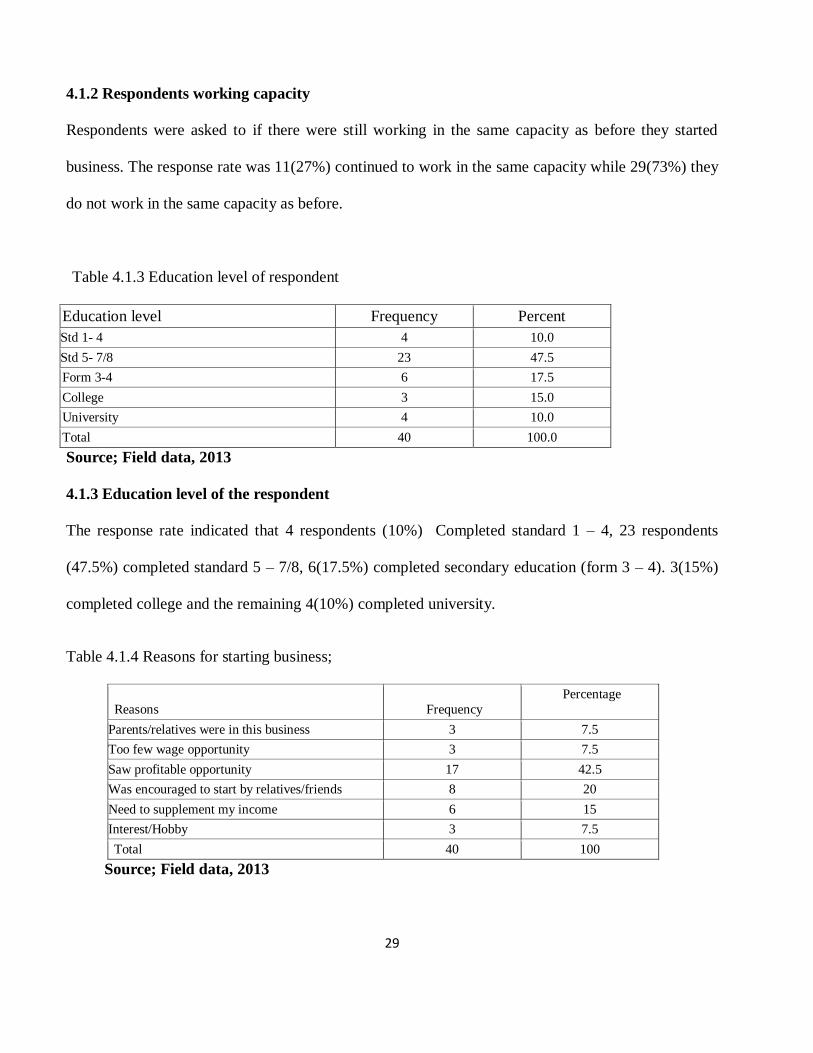
Table 4.1.3 Education level of respondent
Education level Frequency Percent
Std 1- 4 4 10.0
Std 5- 7/8 23 47.5
Form 3-4 6 17.5
College 3 15.0
University 4 10.0
Total 40 100.0
Source; Field data, 2013
4.1.3 Education level of the respondent
The response rate indicated that 4 respondents (10%) Completed standard 1 – 4, 23 respondents
(47.5%) completed standard 5 – 7/8, 6(17.5%) completed secondary education (form 3 – 4). 3(15%)
completed college and the remaining 4(10%) completed university.
Table 4.1.4 Reasons for starting business;
Reasons Frequency
Percentage
Parents/relatives were in this business 3 7.5
Too few wage opportunity 3 7.5
Saw profitable opportunity 17 42.5
Was encouraged to start by relatives/friends 8 20
Need to supplement my income 6 15
Interest/Hobby 3 7.5
Total 40 100
Source; Field data, 2013
30
4.1.4 Reasons for starting business
The response rate indicates that 3(7.5%) started new business because their parents/relatives were in
business.3 (7.5%) due to few wage opportunities. 17(42.5%) choose to start business because they
saw that it is profitable opportunity to them, 8(20%) said that they started business because they were
encouraged to start business by their friends/ Relatives.6 (15%) due to the need to supplement their
income, 3(7.5%) start businesses because of interests/Hobby.
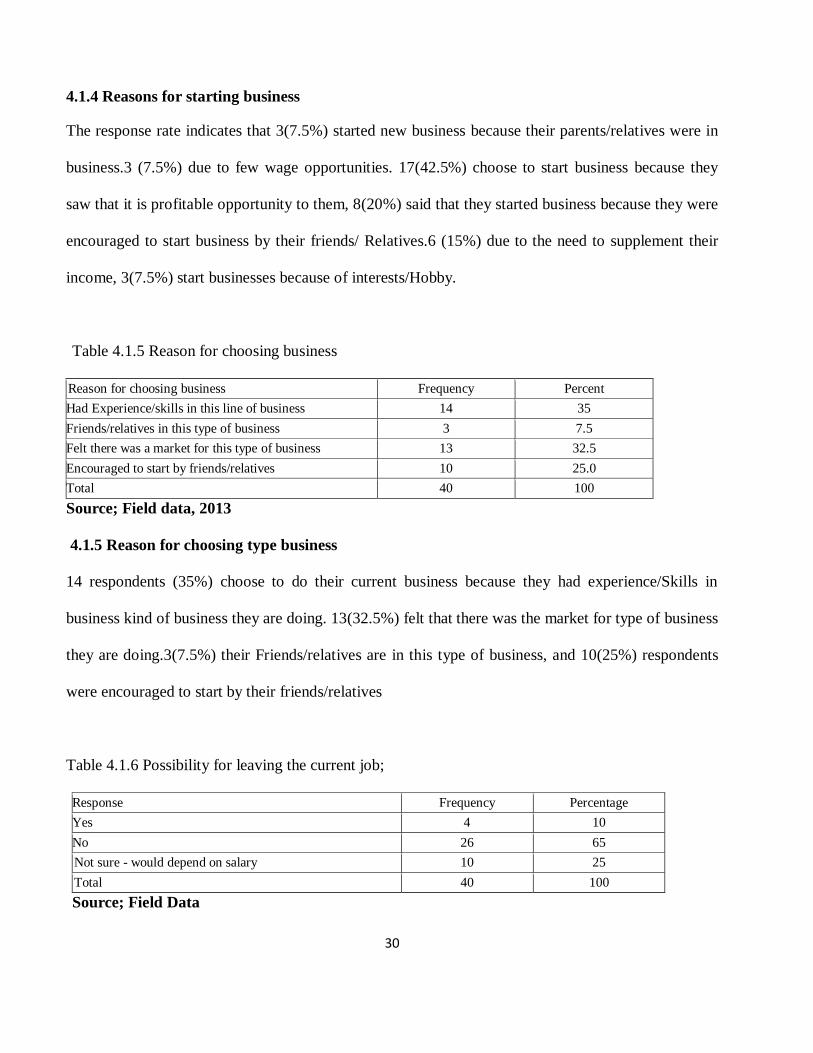
Table 4.1.5 Reason for choosing business
Reason for choosing business Frequency Percent
Had Experience/skills in this line of business 14 35
Friends/relatives in this type of business 3 7.5
Felt there was a market for this type of business 13 32.5
Encouraged to start by friends/relatives 10 25.0
Total 40 100
Source; Field data, 2013
4.1.5 Reason for choosing type business
14 respondents (35%) choose to do their current business because they had experience/Skills in
business kind of business they are doing. 13(32.5%) felt that there was the market for type of business
they are doing.3(7.5%) their Friends/relatives are in this type of business, and 10(25%) respondents
were encouraged to start by their friends/relatives
Table 4.1.6 Possibility for leaving the current job;
Response Frequency Percentage
Yes 4 10
No 26 65
Not sure - would depend on salary 10 25
Total 40 100
Source; Field Data
31
4.1.6 Possibility of leaving business for Paid job;
Findings show that 26(65%) respondents said it is impossible for them to leave their business for a
paid job 4(10%) said it is possible for them to leave their business for paid job, 10(25%) said it would
depend on salary.
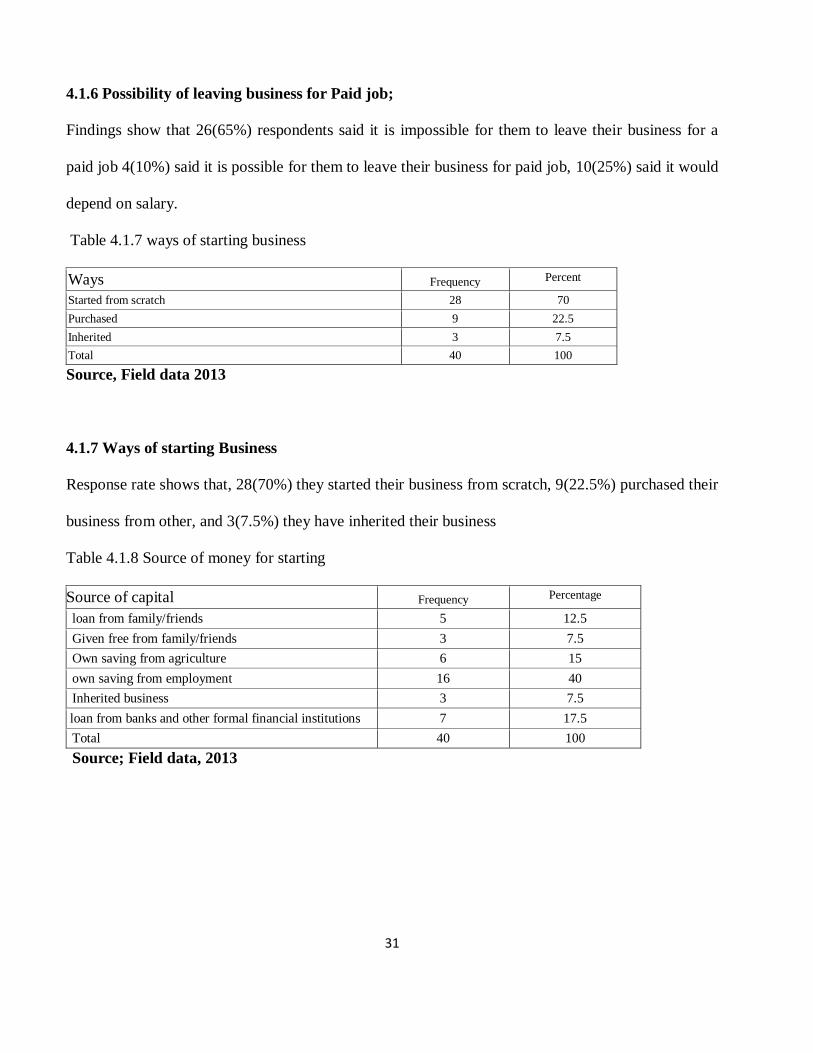
Table 4.1.7 ways of starting business
Ways Frequency Percent
Started from scratch 28 70
Purchased 9 22.5
Inherited 3 7.5
Total 40 100
Source, Field data 2013
4.1.7 Ways of starting Business
Response rate shows that, 28(70%) they started their business from scratch, 9(22.5%) purchased their
business from other, and 3(7.5%) they have inherited their business
Table 4.1.8 Source of money for starting
Source of capital Frequency Percentage
loan from family/friends 5 12.5
Given free from family/friends 3 7.5
Own saving from agriculture 6 15
own saving from employment 16 40
Inherited business 3 7.5
loan from banks and other formal financial institutions 7 17.5
Total 40 100
Source; Field data, 2013
32
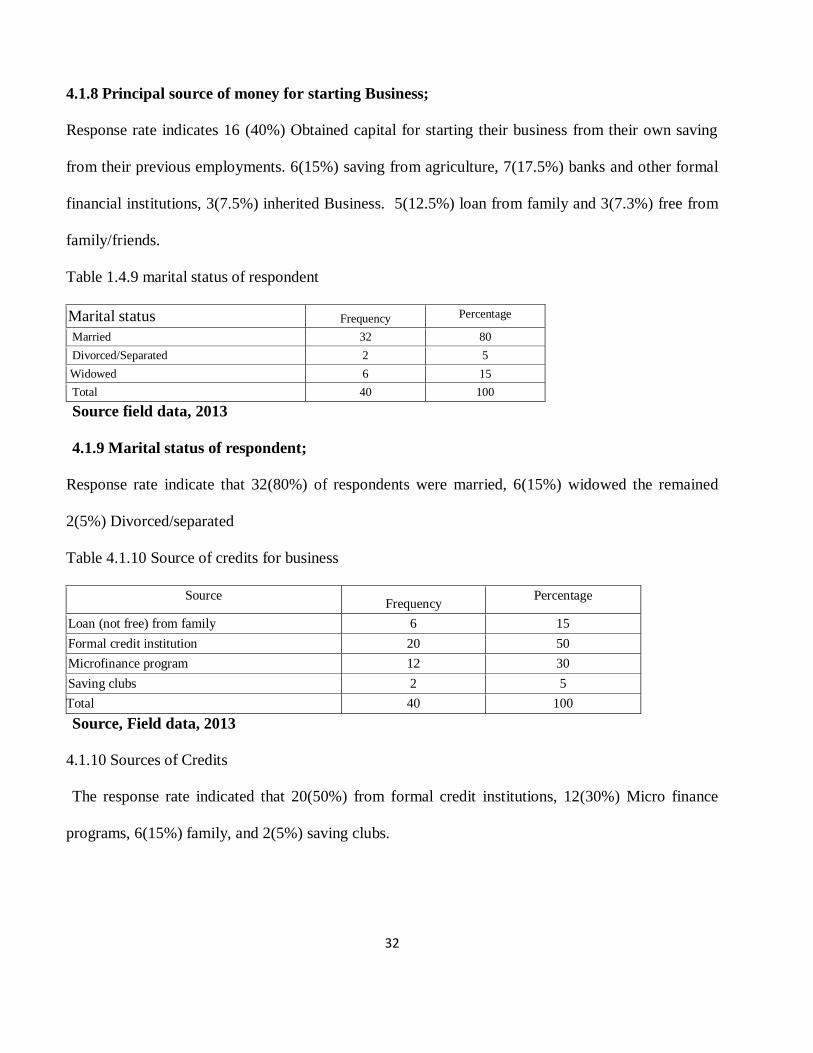
4.1.8 Principal source of money for starting Business;
Response rate indicates 16 (40%) Obtained capital for starting their business from their own saving
from their previous employments. 6(15%) saving from agriculture, 7(17.5%) banks and other formal
financial institutions, 3(7.5%) inherited Business. 5(12.5%) loan from family and 3(7.3%) free from
family/friends.
Table 1.4.9 marital status of respondent
Marital status Frequency Percentage
Married 32 80
Divorced/Separated 2 5
Widowed 6 15
Total 40 100
Source field data, 2013
4.1.9 Marital status of respondent;
Response rate indicate that 32(80%) of respondents were married, 6(15%) widowed the remained
2(5%) Divorced/separated
Table 4.1.10 Source of credits for business
Source Frequency
Percentage
Loan (not free) from family 6 15
Formal credit institution 20 50
Microfinance program 12 30
Saving clubs 2 5
Total 40 100
Source, Field data, 2013
4.1.10 Sources of Credits
The response rate indicated that 20(50%) from formal credit institutions, 12(30%) Micro finance
programs, 6(15%) family, and 2(5%) saving clubs.
33
Table 4.1.11 Critical business problem
Business problems Frequency Percentage
High competition from other business 10 25
High costs of inputs 2 5
Insufficient working capital 19 47.5
Lack/poor market for products 1 2.5
Lack of skilled workers 4 10
Harassment from authorities 4 10
Total 40 100
Source; field data, 2013
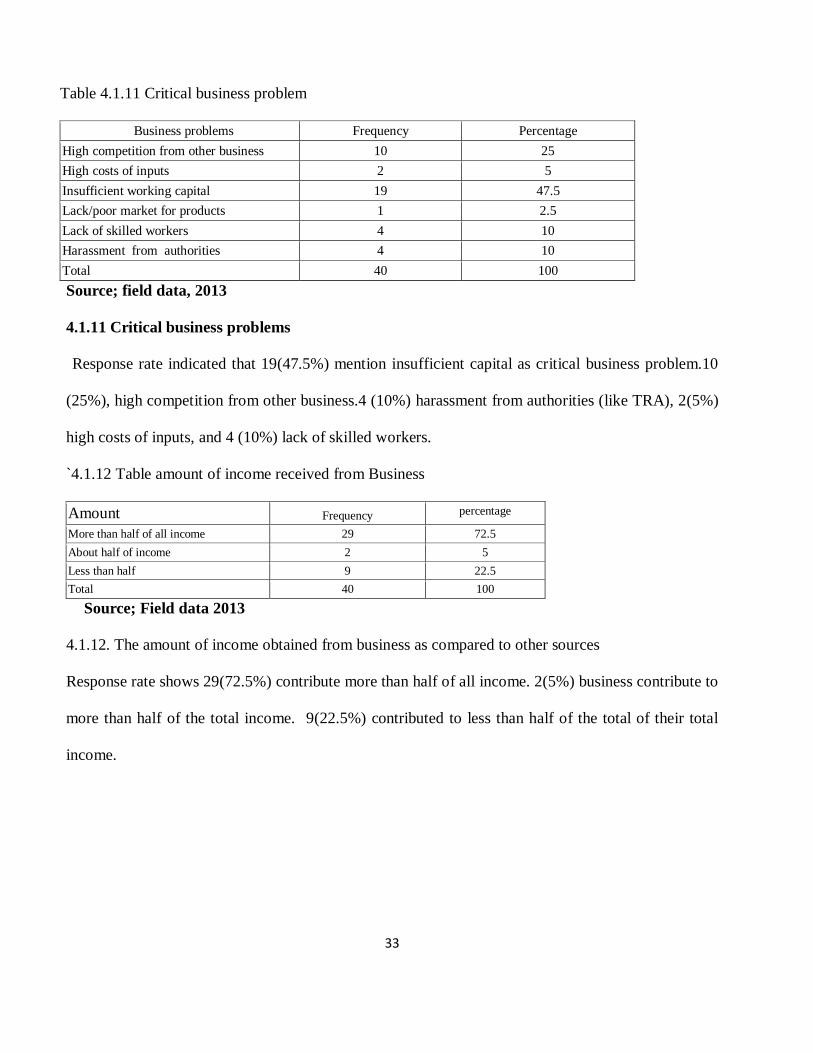
4.1.11 Critical business problems
Response rate indicated that 19(47.5%) mention insufficient capital as critical business problem.10
(25%), high competition from other business.4 (10%) harassment from authorities (like TRA), 2(5%)
high costs of inputs, and 4 (10%) lack of skilled workers.
`4.1.12 Table amount of income received from Business
Amount Frequency percentage
More than half of all income 29 72.5
About half of income 2 5
Less than half 9 22.5
Total 40 100
Source; Field data 2013
4.1.12. The amount of income obtained from business as compared to other sources
Response rate shows 29(72.5%) contribute more than half of all income. 2(5%) business contribute to
more than half of the total income. 9(22.5%) contributed to less than half of the total of their total
income.
34
Table 4.1.13 change in volume of business
Changes Frequency Percentage
Large increase 4 10
Small increase 19 47.5
No change 9 22.5
Small decrease 8 20
Total 40 100
Source; Field data, 2013
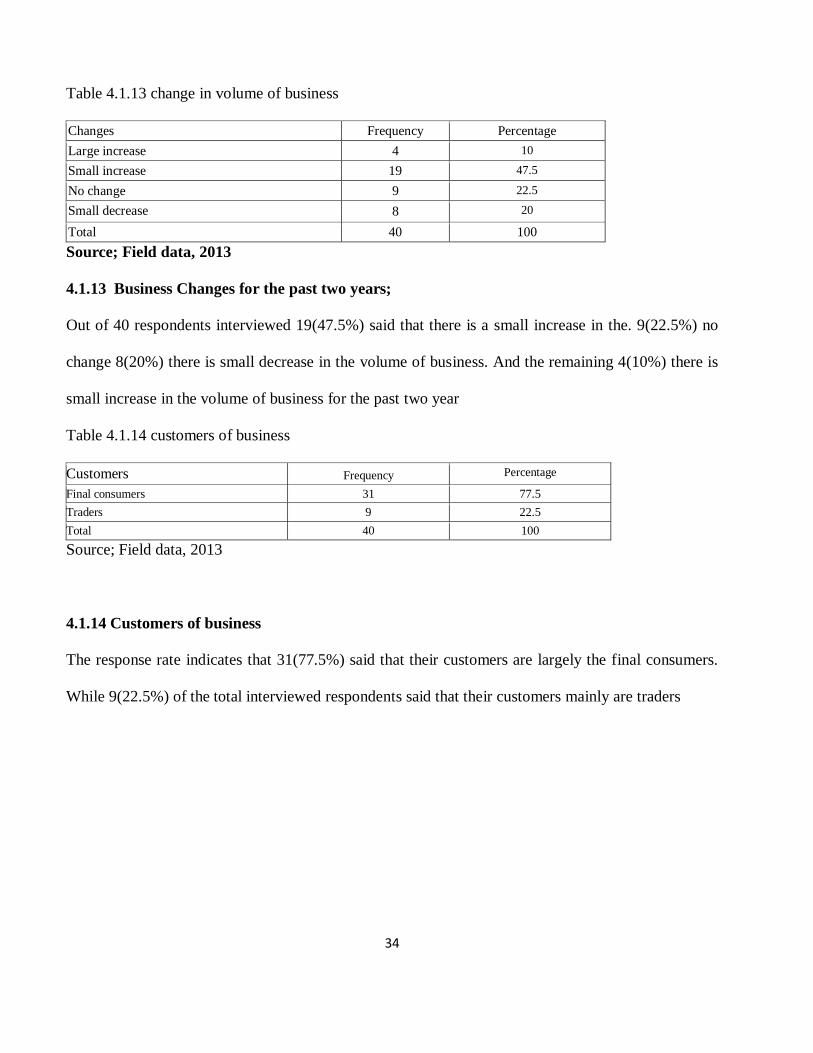
4.1.13 Business Changes for the past two years;
Out of 40 respondents interviewed 19(47.5%) said that there is a small increase in the. 9(22.5%) no
change 8(20%) there is small decrease in the volume of business. And the remaining 4(10%) there is
small increase in the volume of business for the past two year
Table 4.1.14 customers of business
Customers Frequency Percentage
Final consumers 31 77.5
Traders 9 22.5
Total 40 100
Source; Field data, 2013
4.1.14 Customers of business
The response rate indicates that 31(77.5%) said that their customers are largely the final consumers.
While 9(22.5%) of the total interviewed respondents said that their customers mainly are traders
35
4.2. CAUSE OF NON-PERFORMING LOANS RELATED TO CUSTOMERS OPERATION
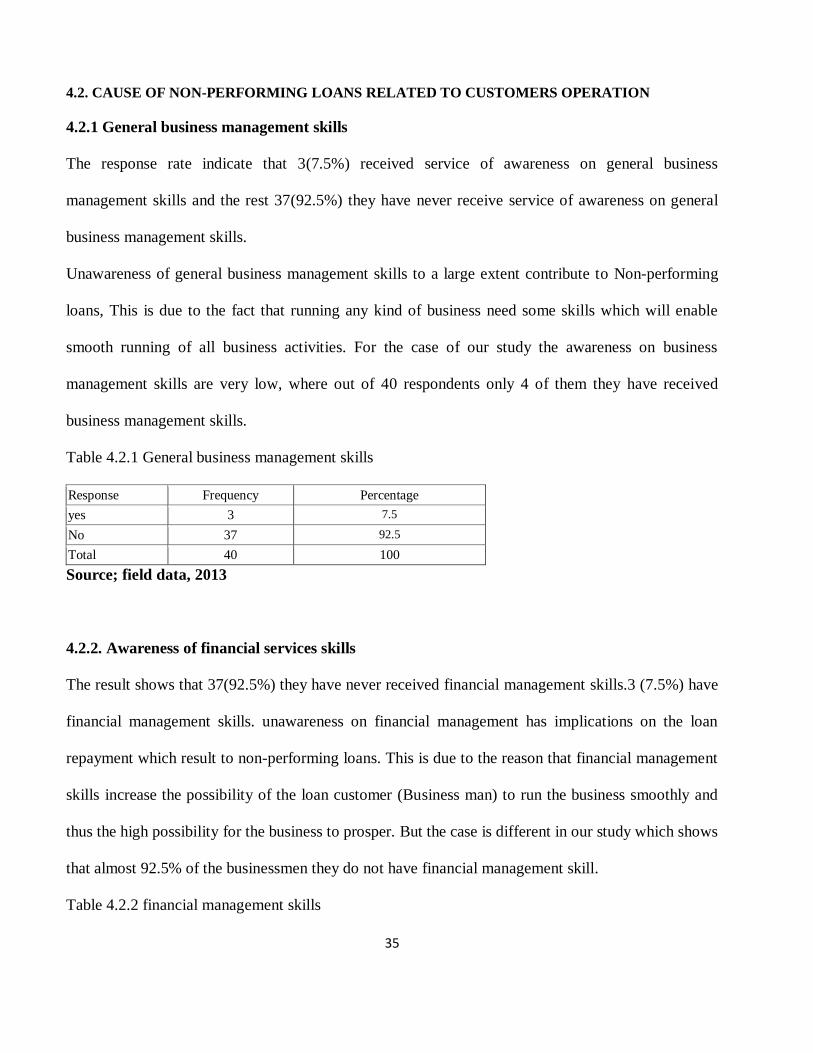
4.2.1 General business management skills
The response rate indicate that 3(7.5%) received service of awareness on general business
management skills and the rest 37(92.5%) they have never receive service of awareness on general
business management skills.
Unawareness of general business management skills to a large extent contribute to Non-performing
loans, This is due to the fact that running any kind of business need some skills which will enable
smooth running of all business activities. For the case of our study the awareness on business
management skills are very low, where out of 40 respondents only 4 of them they have received
business management skills.
Table 4.2.1 General business management skills
Response Frequency Percentage
yes 3 7.5
No 37 92.5
Total 40 100
Source; field data, 2013
4.2.2. Awareness of financial services skills
The result shows that 37(92.5%) they have never received financial management skills.3 (7.5%) have
financial management skills. unawareness on financial management has implications on the loan
repayment which result to non-performing loans. This is due to the reason that financial management
skills increase the possibility of the loan customer (Business man) to run the business smoothly and
thus the high possibility for the business to prosper. But the case is different in our study which shows
that almost 92.5% of the businessmen they do not have financial management skill.
Table 4.2.2 financial management skills
36
Response Frequency Percentage
Yes 3 7.5
No 37 92.5
Total 40 100
Source; field data, 2013
Table 4.2.3 Awareness of accounting and book keeping
Response Frequency percentage
Yes 6 15
No 34 85
Total 40 100
Source; Field data, 2013
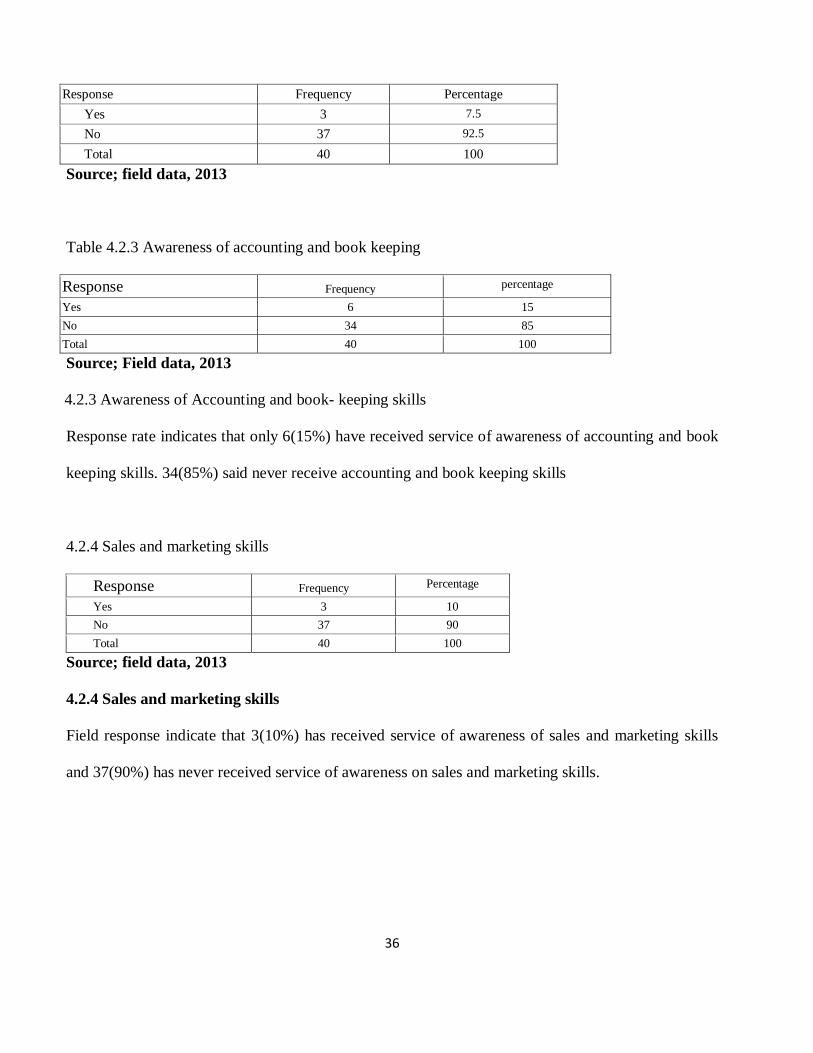
4.2.3 Awareness of Accounting and book- keeping skills
Response rate indicates that only 6(15%) have received service of awareness of accounting and book
keeping skills. 34(85%) said never receive accounting and book keeping skills
4.2.4 Sales and marketing skills
Response Frequency Percentage
Yes 3 10
No 37 90
Total 40 100
Source; field data, 2013
4.2.4 Sales and marketing skills
Field response indicate that 3(10%) has received service of awareness of sales and marketing skills
and 37(90%) has never received service of awareness on sales and marketing skills.
37
4.2.5 Entrepreneurship skills
Table 4.2.5 Received service of awareness of Entrepreneurship skills;
Response Frequency Percentage
Yes 8 20
No 32 80
Total 40 100
Source; field data, 2013
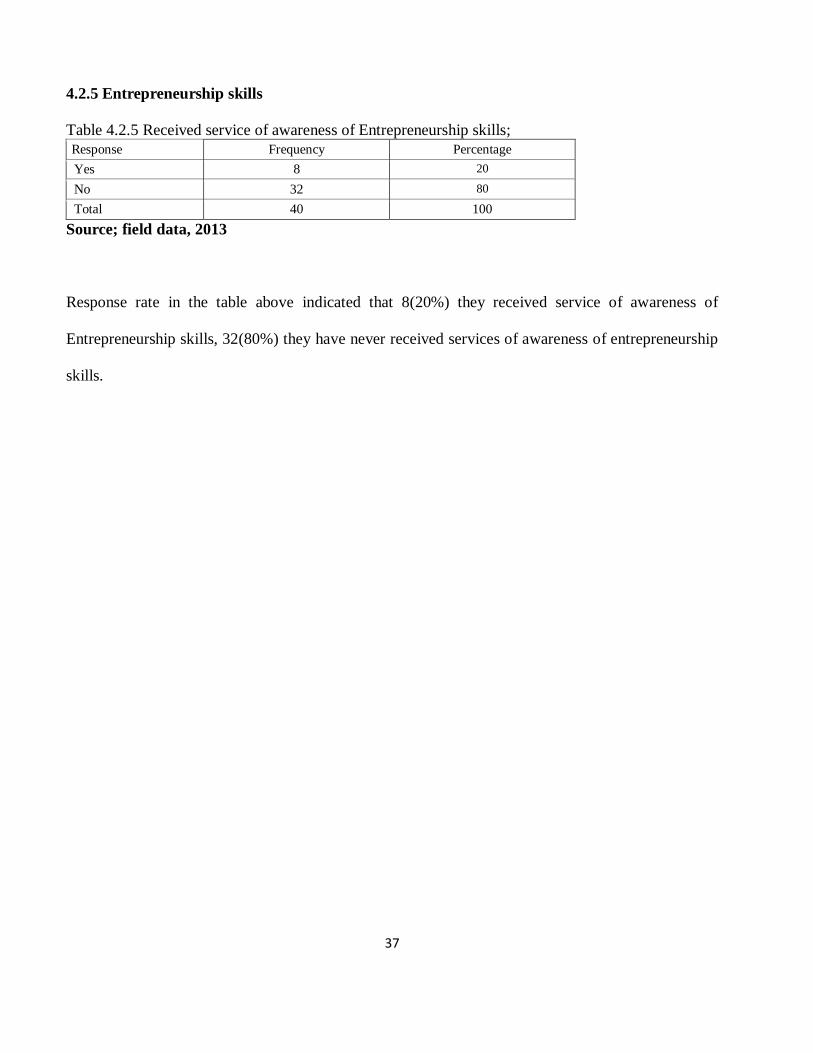
Response rate in the table above indicated that 8(20%) they received service of awareness of
Entrepreneurship skills, 32(80%) they have never received services of awareness of entrepreneurship
skills.
38
4.2.4 CAUSES OF NON-PERFORMING LOANS RELATED TO BANK OPERATIONS
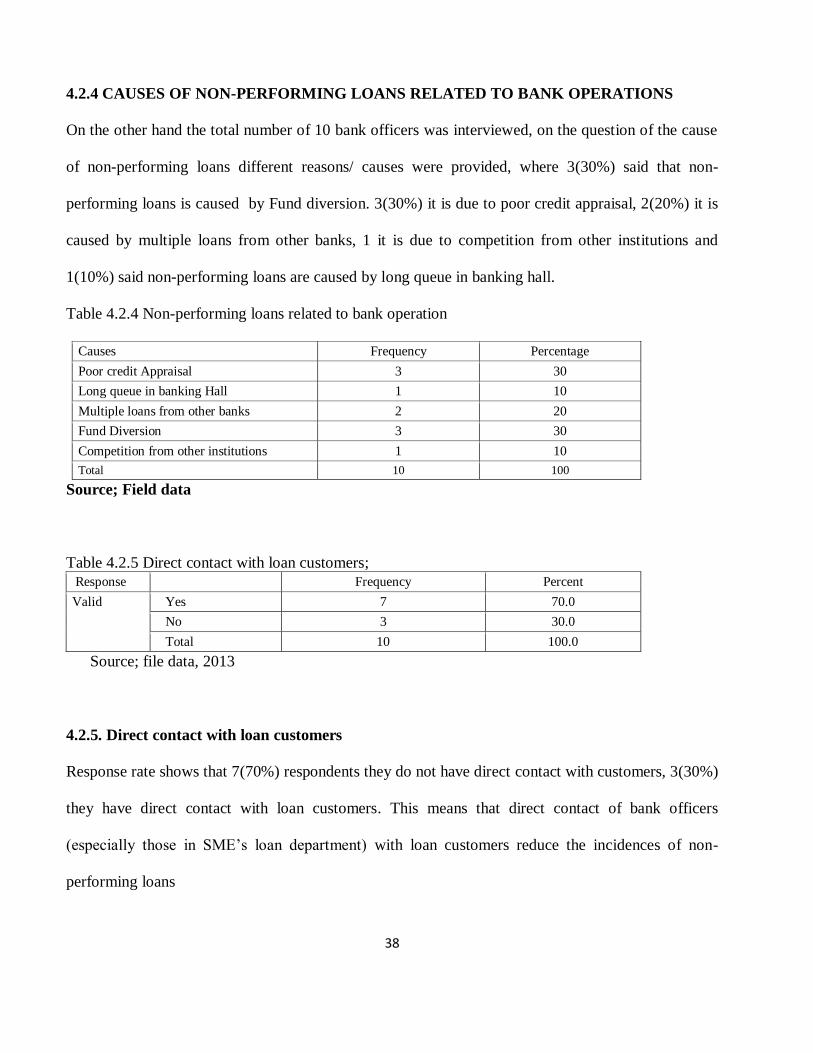
On the other hand the total number of 10 bank officers was interviewed, on the question of the cause
of non-performing loans different reasons/ causes were provided, where 3(30%) said that non-
performing loans is caused by Fund diversion. 3(30%) it is due to poor credit appraisal, 2(20%) it is
caused by multiple loans from other banks, 1 it is due to competition from other institutions and
1(10%) said non-performing loans are caused by long queue in banking hall.
Table 4.2.4 Non-performing loans related to bank operation
Causes Frequency Percentage
Poor credit Appraisal 3 30
Long queue in banking Hall 1 10
Multiple loans from other banks 2 20
Fund Diversion 3 30
Competition from other institutions 1 10
Total 10 100
Source; Field data
Table 4.2.5 Direct contact with loan customers;
Response Frequency Percent
Valid Yes 7 70.0
No 3 30.0
Total 10 100.0
Source; file data, 2013
4.2.5. Direct contact with loan customers
Response rate shows that 7(70%) respondents they do not have direct contact with customers, 3(30%)
they have direct contact with loan customers. This means that direct contact of bank officers
(especially those in SME’s loan department) with loan customers reduce the incidences of non-
performing loans
39
CHAPTER FIVE
5.0 DISCUSSION OF FINDINGS
This chapter gives the analysis and the discussion of findings of the Causes of non-performing related
to Bank and customers operations
5.1 Demographic Characteristics of Respondents
5.1.1 Analysis of the sample
The sample was made up of 50 respondents where by 10 were the key informants who were bank
officers and 40 SME’s Loan customers (Business men
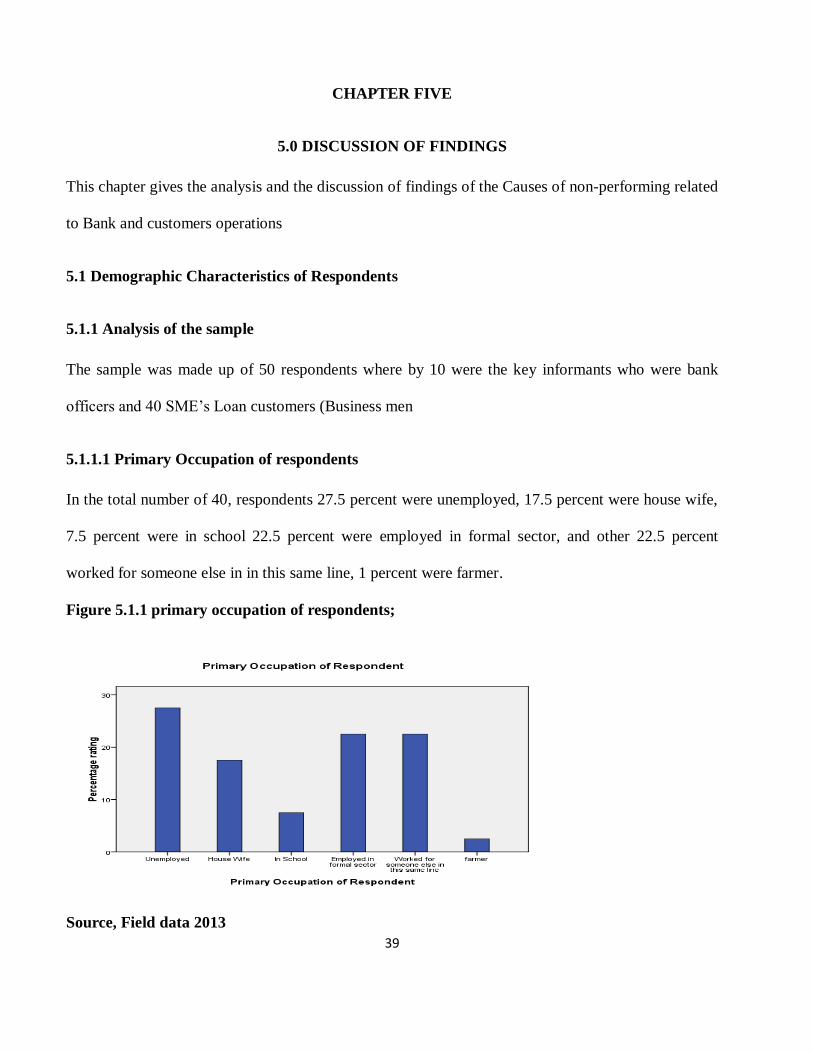
5.1.1.1 Primary Occupation of respondents
In the total number of 40, respondents 27.5 percent were unemployed, 17.5 percent were house wife,
7.5 percent were in school 22.5 percent were employed in formal sector, and other 22.5 percent
worked for someone else in in this same line, 1 percent were farmer.
Figure 5.1.1 primary occupation of respondents;
Source, Field data 2013
40
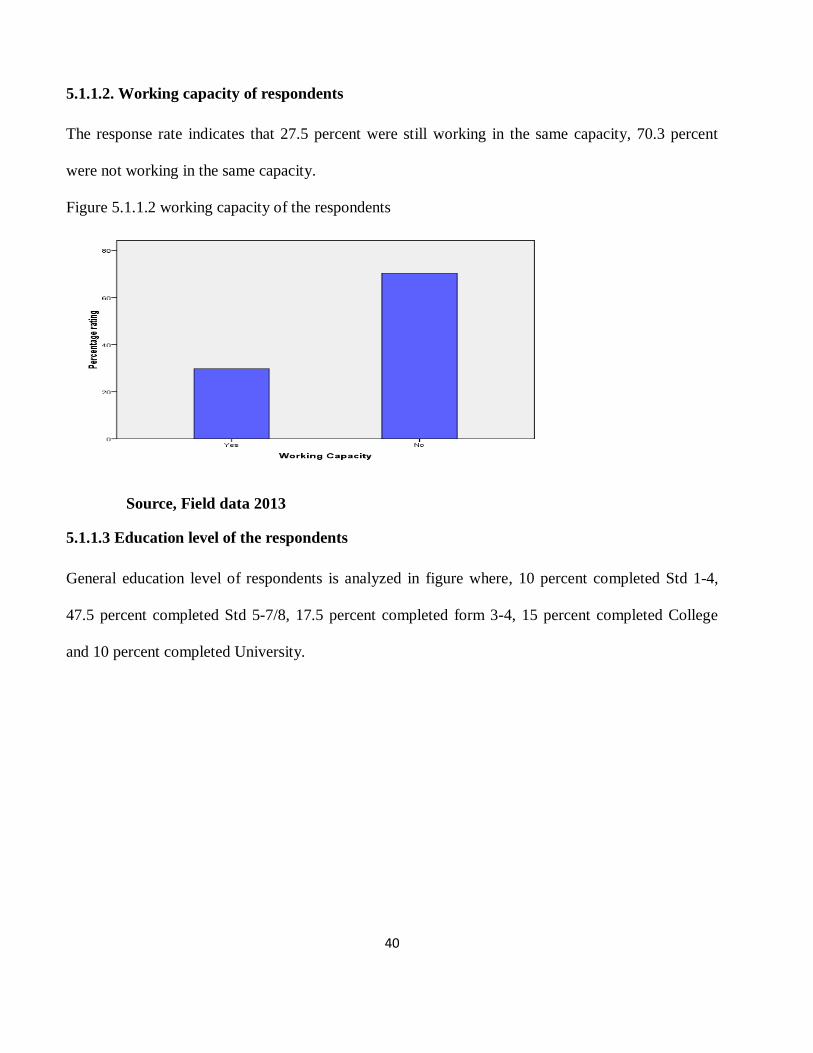
5.1.1.2. Working capacity of respondents
The response rate indicates that 27.5 percent were still working in the same capacity, 70.3 percent
were not working in the same capacity.
Figure 5.1.1.2 working capacity of the respondents
Source, Field data 2013
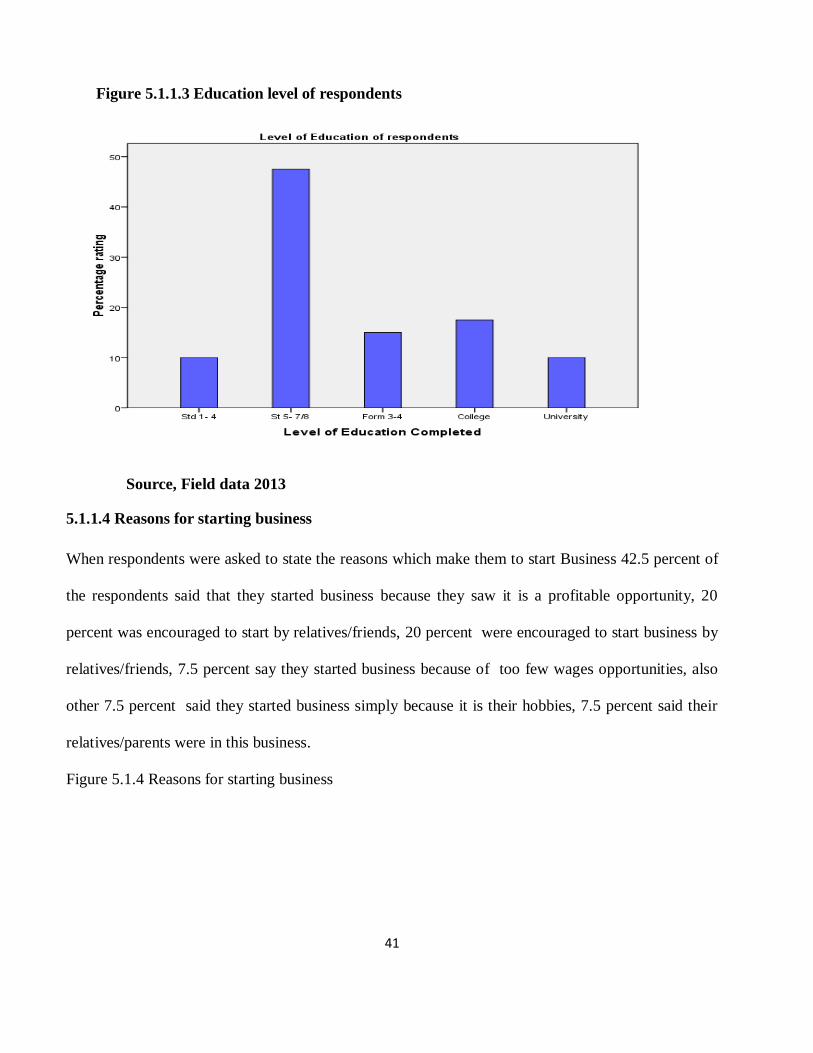
5.1.1.3 Education level of the respondents
General education level of respondents is analyzed in figure where, 10 percent completed Std 1-4,
47.5 percent completed Std 5-7/8, 17.5 percent completed form 3-4, 15 percent completed College
and 10 percent completed University.
41
Figure 5.1.1.3 Education level of respondents
Source, Field data 2013
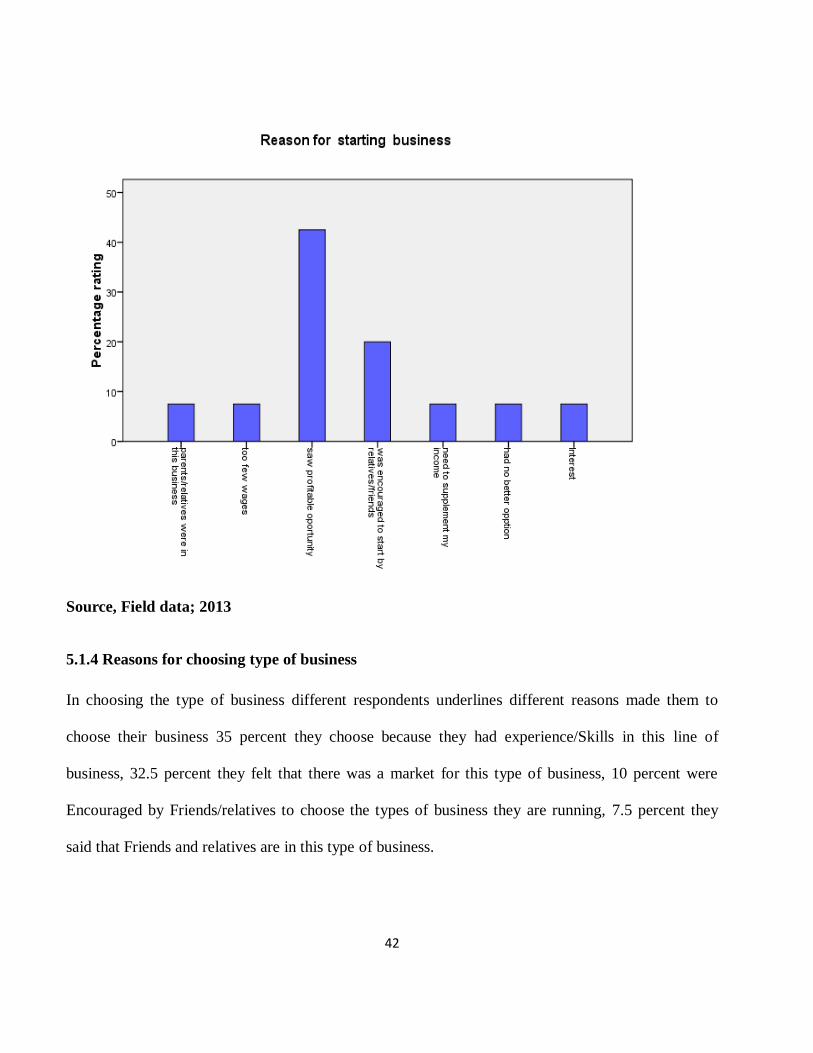
5.1.1.4 Reasons for starting business
When respondents were asked to state the reasons which make them to start Business 42.5 percent of
the respondents said that they started business because they saw it is a profitable opportunity, 20
percent was encouraged to start by relatives/friends, 20 percent were encouraged to start business by
relatives/friends, 7.5 percent say they started business because of too few wages opportunities, also
other 7.5 percent said they started business simply because it is their hobbies, 7.5 percent said their
relatives/parents were in this business.
Figure 5.1.4 Reasons for starting business
42
Source, Field data; 2013
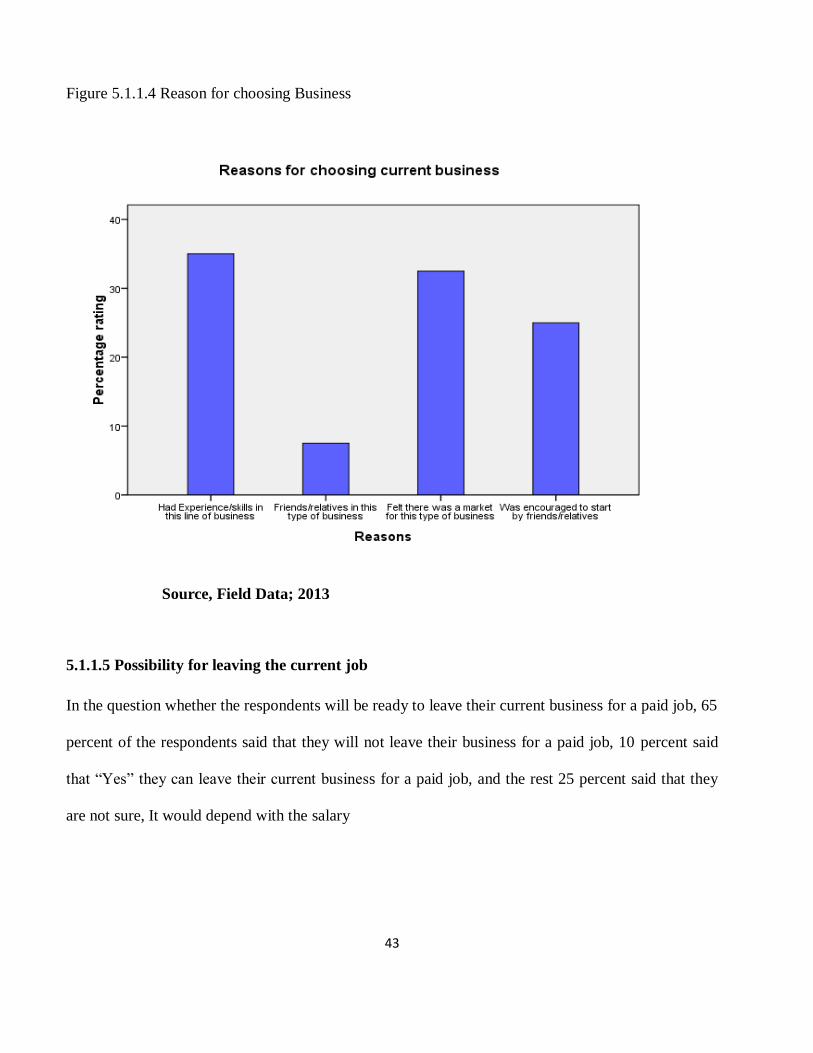
5.1.4 Reasons for choosing type of business
In choosing the type of business different respondents underlines different reasons made them to
choose their business 35 percent they choose because they had experience/Skills in this line of
business, 32.5 percent they felt that there was a market for this type of business, 10 percent were
Encouraged by Friends/relatives to choose the types of business they are running, 7.5 percent they
said that Friends and relatives are in this type of business.
43
Figure 5.1.1.4 Reason for choosing Business
Source, Field Data; 2013
5.1.1.5 Possibility for leaving the current job
In the question whether the respondents will be ready to leave their current business for a paid job, 65
percent of the respondents said that they will not leave their business for a paid job, 10 percent said
that “Yes” they can leave their current business for a paid job, and the rest 25 percent said that they
are not sure, It would depend with the salary
44
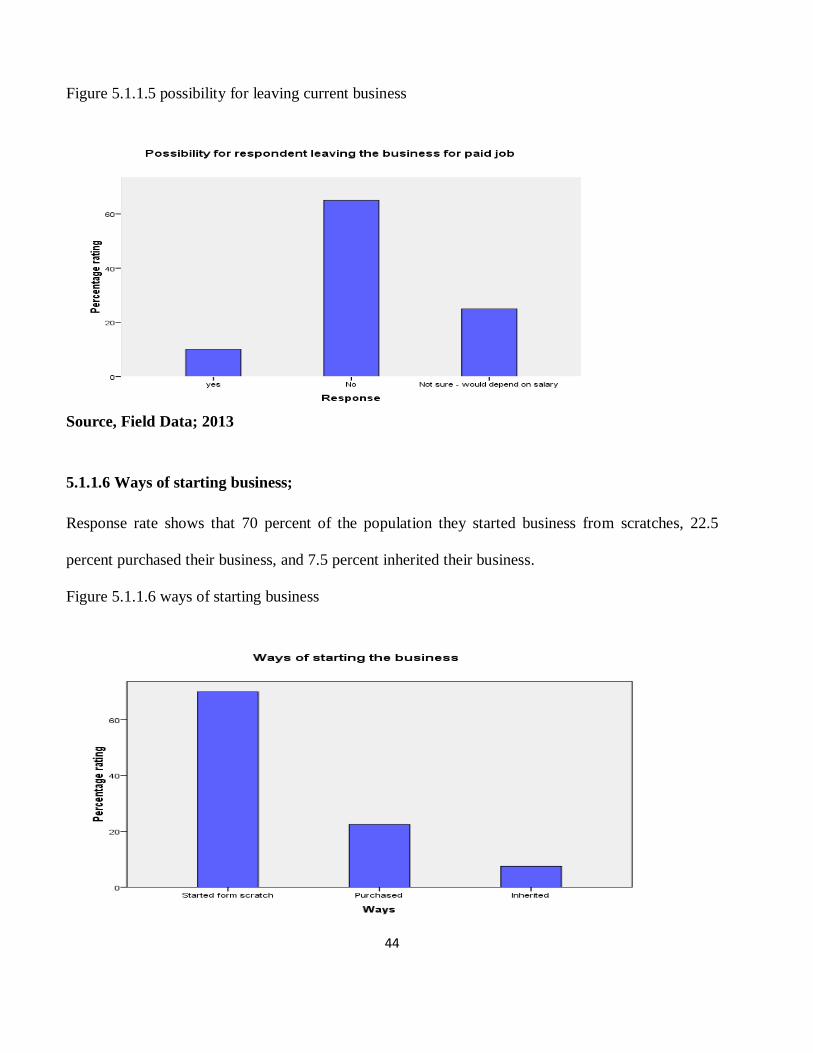
Figure 5.1.1.5 possibility for leaving current business
Source, Field Data; 2013
5.1.1.6 Ways of starting business;
Response rate shows that 70 percent of the population they started business from scratches, 22.5
percent purchased their business, and 7.5 percent inherited their business.
Figure 5.1.1.6 ways of starting business
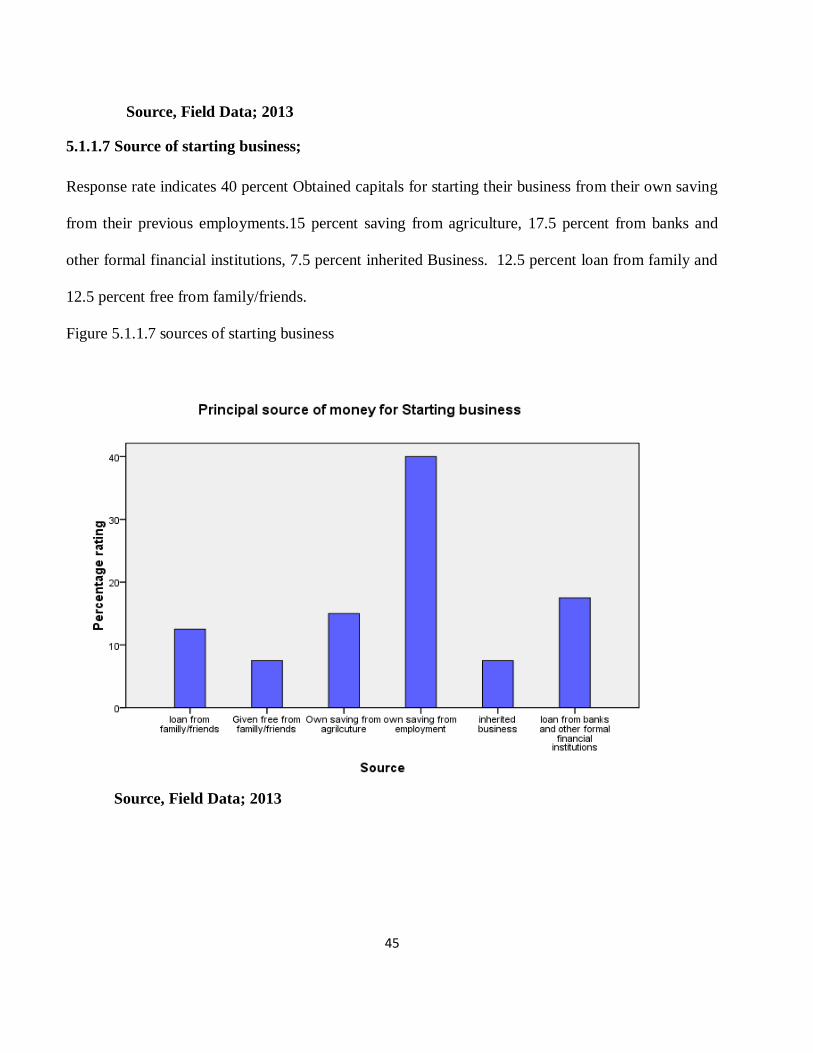
45
Source, Field Data; 2013
5.1.1.7 Source of starting business;
Response rate indicates 40 percent Obtained capitals for starting their business from their own saving
from their previous employments.15 percent saving from agriculture, 17.5 percent from banks and
other formal financial institutions, 7.5 percent inherited Business. 12.5 percent loan from family and
12.5 percent free from family/friends.
Figure 5.1.1.7 sources of starting business
Source, Field Data; 2013
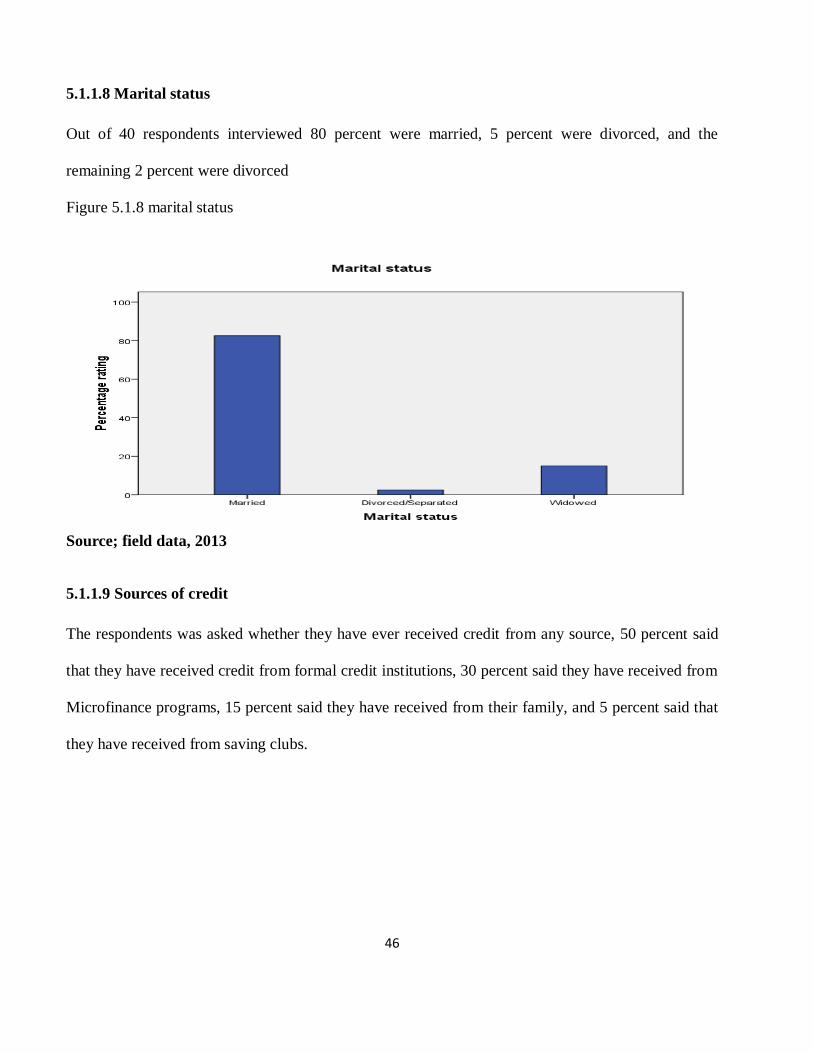
46
5.1.1.8 Marital status
Out of 40 respondents interviewed 80 percent were married, 5 percent were divorced, and the
remaining 2 percent were divorced
Figure 5.1.8 marital status
Source; field data, 2013
5.1.1.9 Sources of credit
The respondents was asked whether they have ever received credit from any source, 50 percent said
that they have received credit from formal credit institutions, 30 percent said they have received from
Microfinance programs, 15 percent said they have received from their family, and 5 percent said that
they have received from saving clubs.
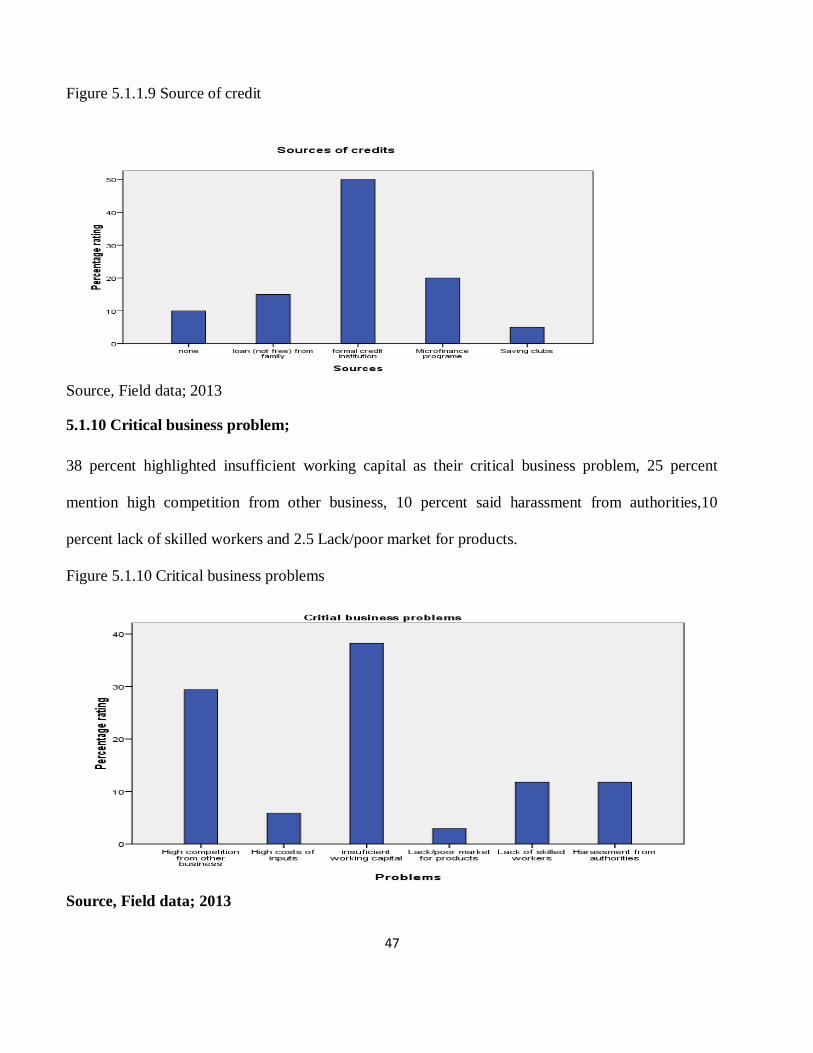
47
Figure 5.1.1.9 Source of credit
Source, Field data; 2013
5.1.10 Critical business problem;
38 percent highlighted insufficient working capital as their critical business problem, 25 percent
mention high competition from other business, 10 percent said harassment from authorities,10
percent lack of skilled workers and 2.5 Lack/poor market for products.
Figure 5.1.10 Critical business problems
Source, Field data; 2013
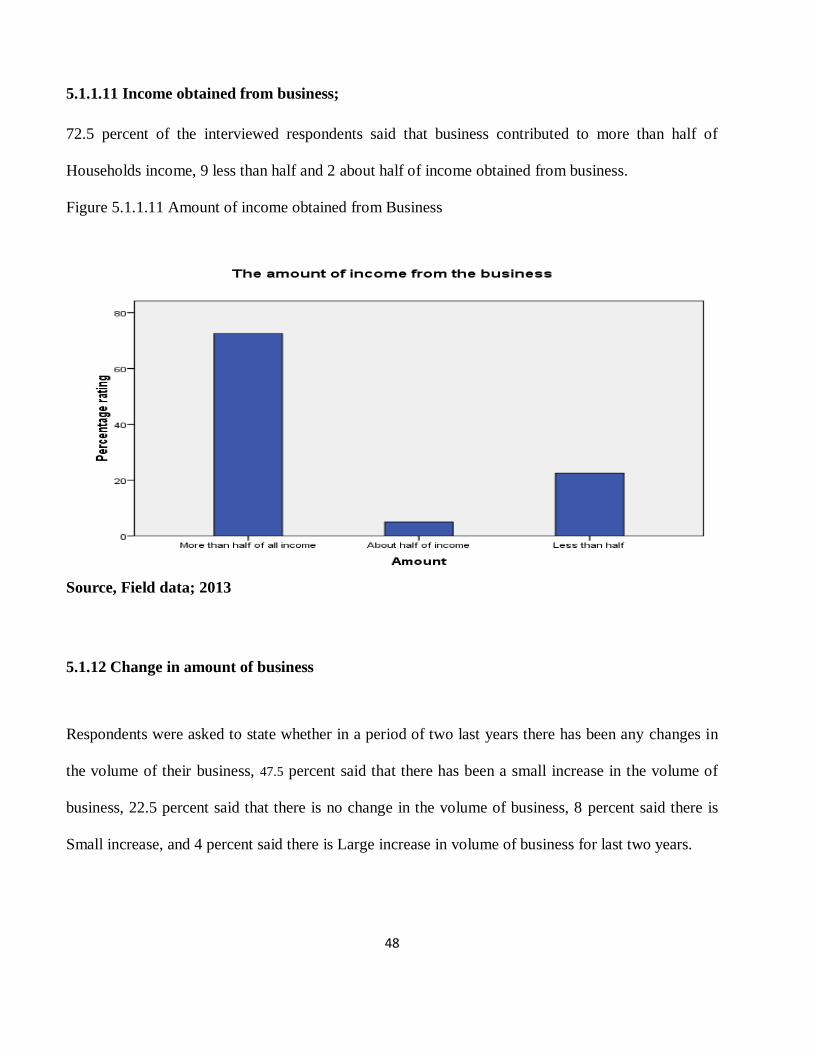
48
5.1.1.11 Income obtained from business;
72.5 percent of the interviewed respondents said that business contributed to more than half of
Households income, 9 less than half and 2 about half of income obtained from business.
Figure 5.1.1.11 Amount of income obtained from Business
Source, Field data; 2013
5.1.12 Change in amount of business
Respondents were asked to state whether in a period of two last years there has been any changes in
the volume of their business, 47.5 percent said that there has been a small increase in the volume of
business, 22.5 percent said that there is no change in the volume of business, 8 percent said there is
Small increase, and 4 percent said there is Large increase in volume of business for last two years.
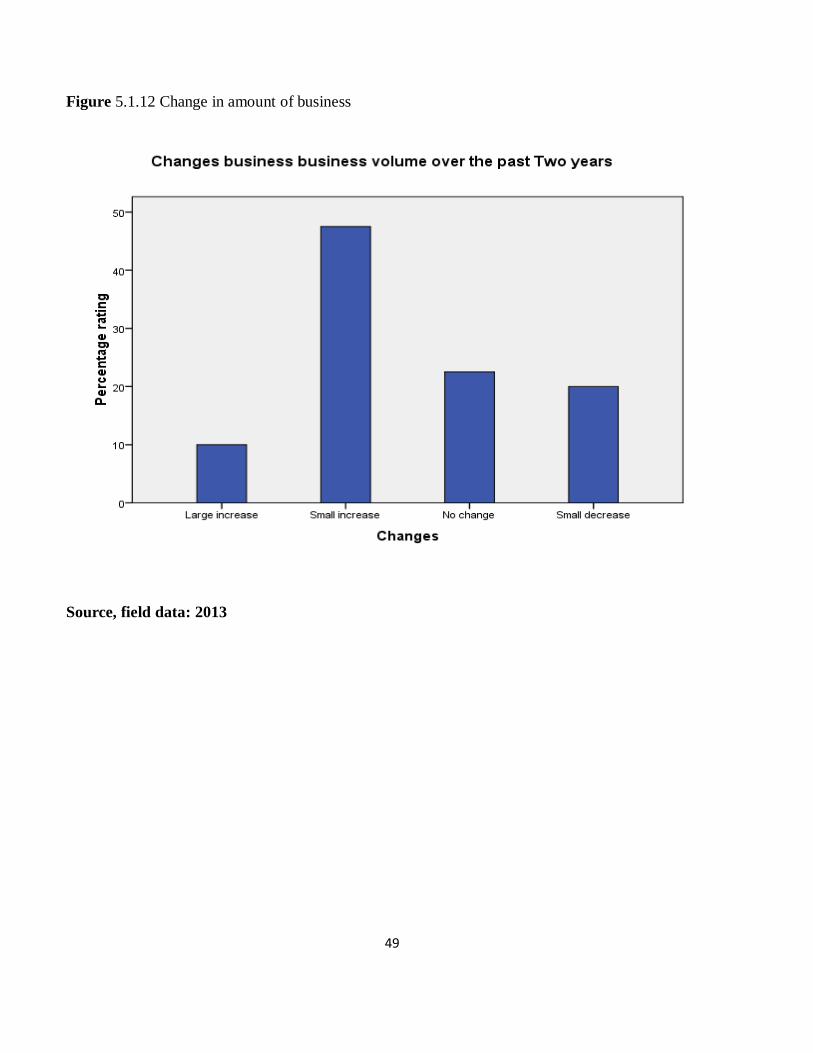
49
Figure 5.1.12 Change in amount of business
Source, field data: 2013
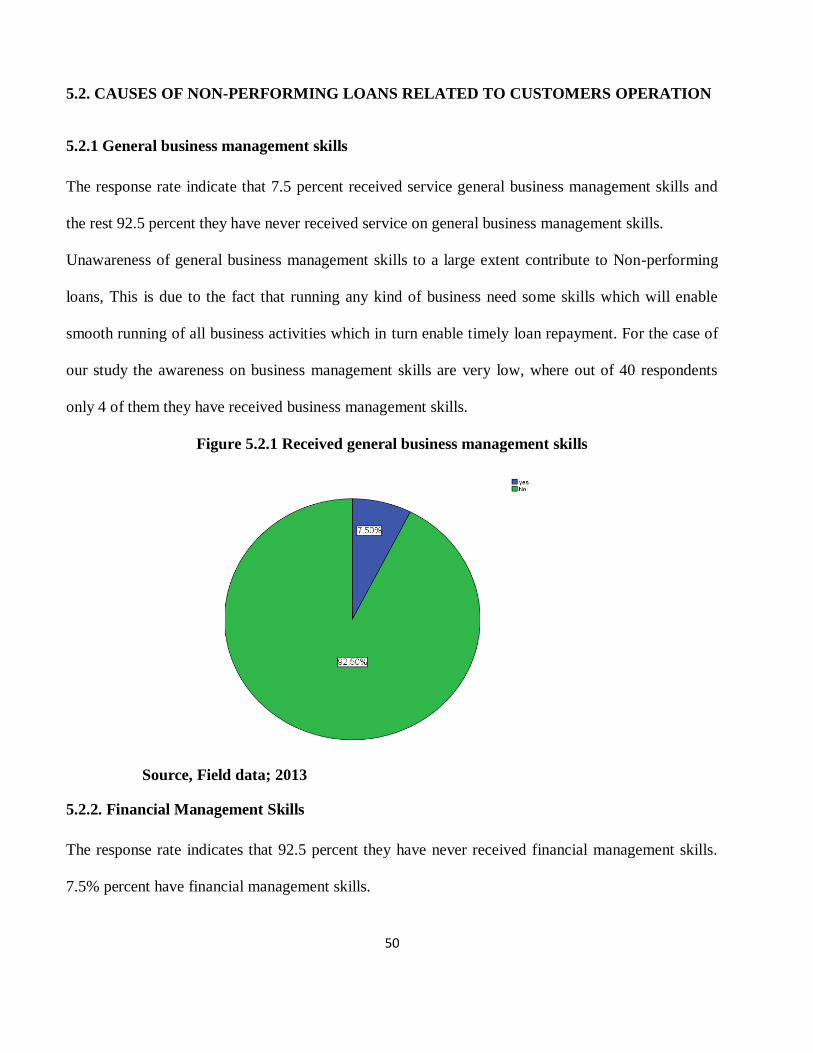
50
5.2. CAUSES OF NON-PERFORMING LOANS RELATED TO CUSTOMERS OPERATION
5.2.1 General business management skills
The response rate indicate that 7.5 percent received service general business management skills and
the rest 92.5 percent they have never received service on general business management skills.
Unawareness of general business management skills to a large extent contribute to Non-performing
loans, This is due to the fact that running any kind of business need some skills which will enable
smooth running of all business activities which in turn enable timely loan repayment. For the case of
our study the awareness on business management skills are very low, where out of 40 respondents
only 4 of them they have received business management skills.
Figure 5.2.1 Received general business management skills
Source, Field data; 2013
5.2.2. Financial Management Skills
The response rate indicates that 92.5 percent they have never received financial management skills.
7.5% percent have financial management skills.
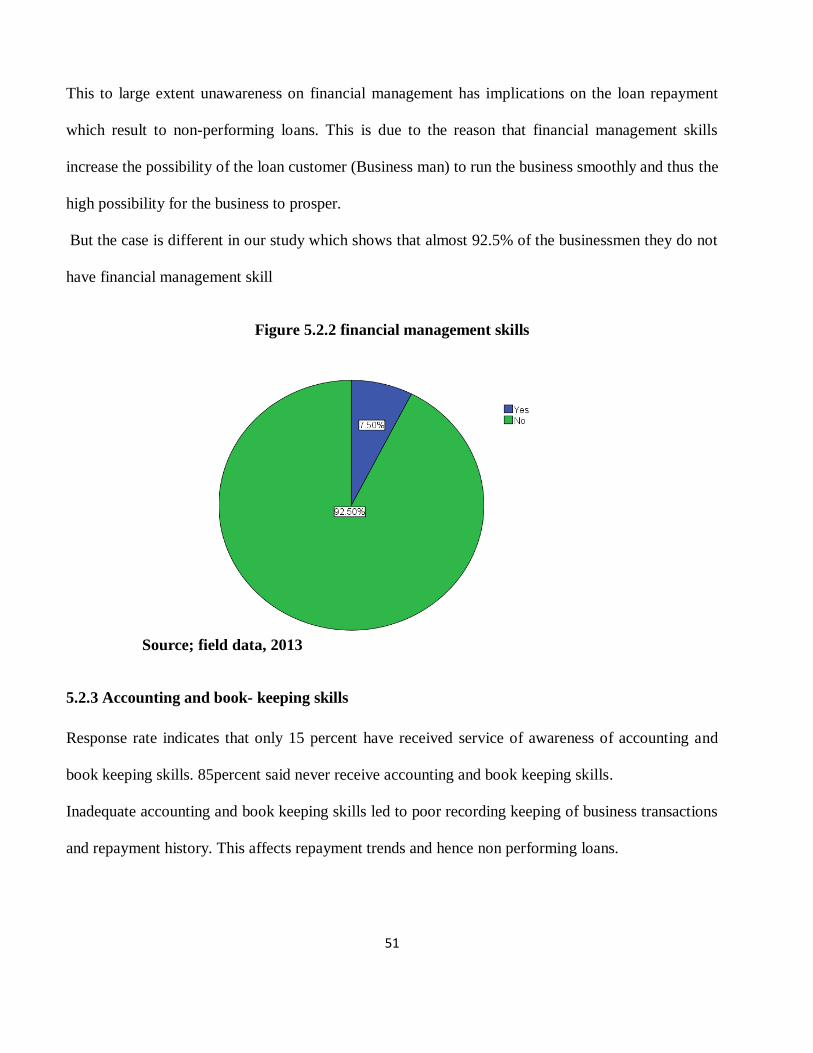
51
This to large extent unawareness on financial management has implications on the loan repayment
which result to non-performing loans. This is due to the reason that financial management skills
increase the possibility of the loan customer (Business man) to run the business smoothly and thus the
high possibility for the business to prosper.
But the case is different in our study which shows that almost 92.5% of the businessmen they do not
have financial management skill
Figure 5.2.2 financial management skills
Source; field data, 2013
5.2.3 Accounting and book- keeping skills
Response rate indicates that only 15 percent have received service of awareness of accounting and
book keeping skills. 85percent said never receive accounting and book keeping skills.
Inadequate accounting and book keeping skills led to poor recording keeping of business transactions
and repayment history. This affects repayment trends and hence non performing loans.
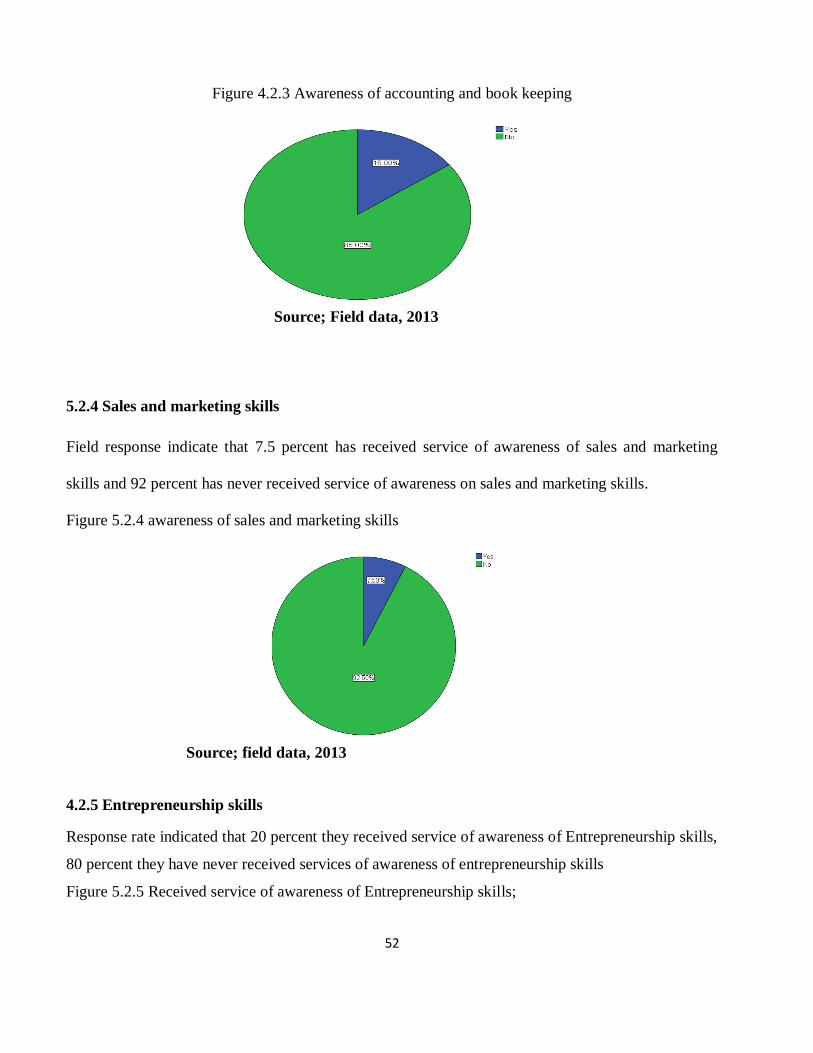
52
Figure 4.2.3 Awareness of accounting and book keeping
Source; Field data, 2013
5.2.4 Sales and marketing skills
Field response indicate that 7.5 percent has received service of awareness of sales and marketing
skills and 92 percent has never received service of awareness on sales and marketing skills.
Figure 5.2.4 awareness of sales and marketing skills
Source; field data, 2013
4.2.5 Entrepreneurship skills
Response rate indicated that 20 percent they received service of awareness of Entrepreneurship skills,
80 percent they have never received services of awareness of entrepreneurship skills
Figure 5.2.5 Received service of awareness of Entrepreneurship skills;
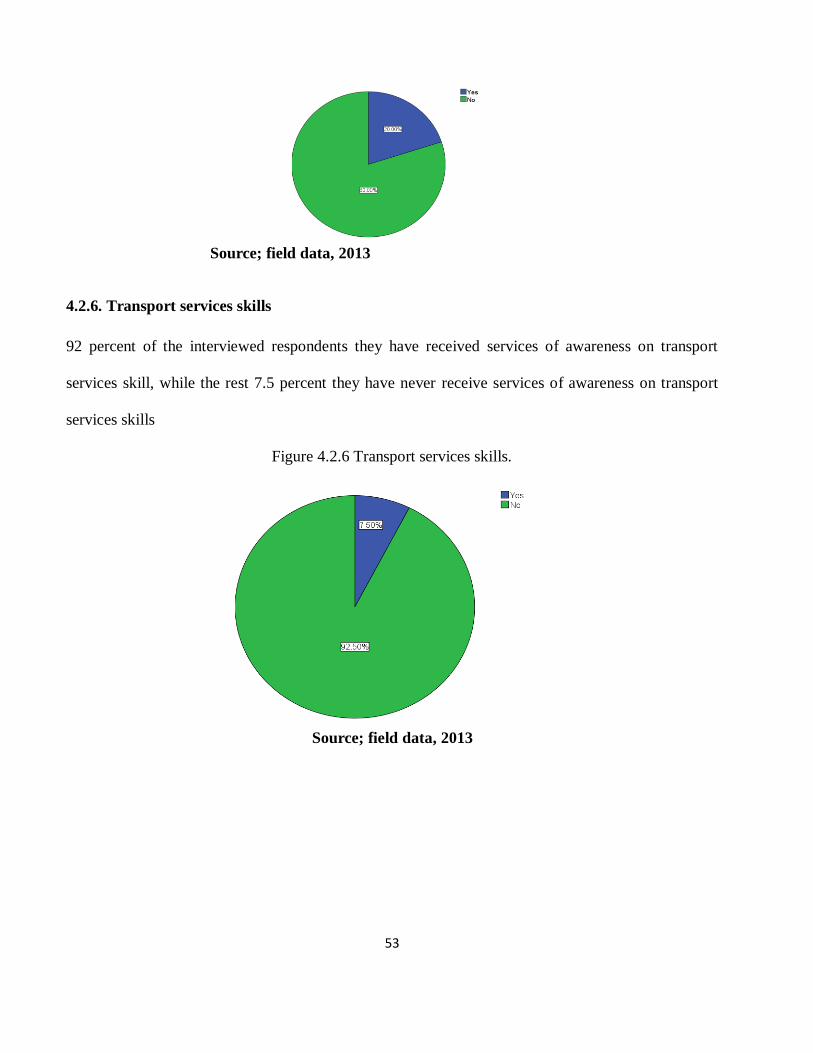
53
Source; field data, 2013
4.2.6. Transport services skills
92 percent of the interviewed respondents they have received services of awareness on transport
services skill, while the rest 7.5 percent they have never receive services of awareness on transport
services skills
Figure 4.2.6 Transport services skills.
Source; field data, 2013
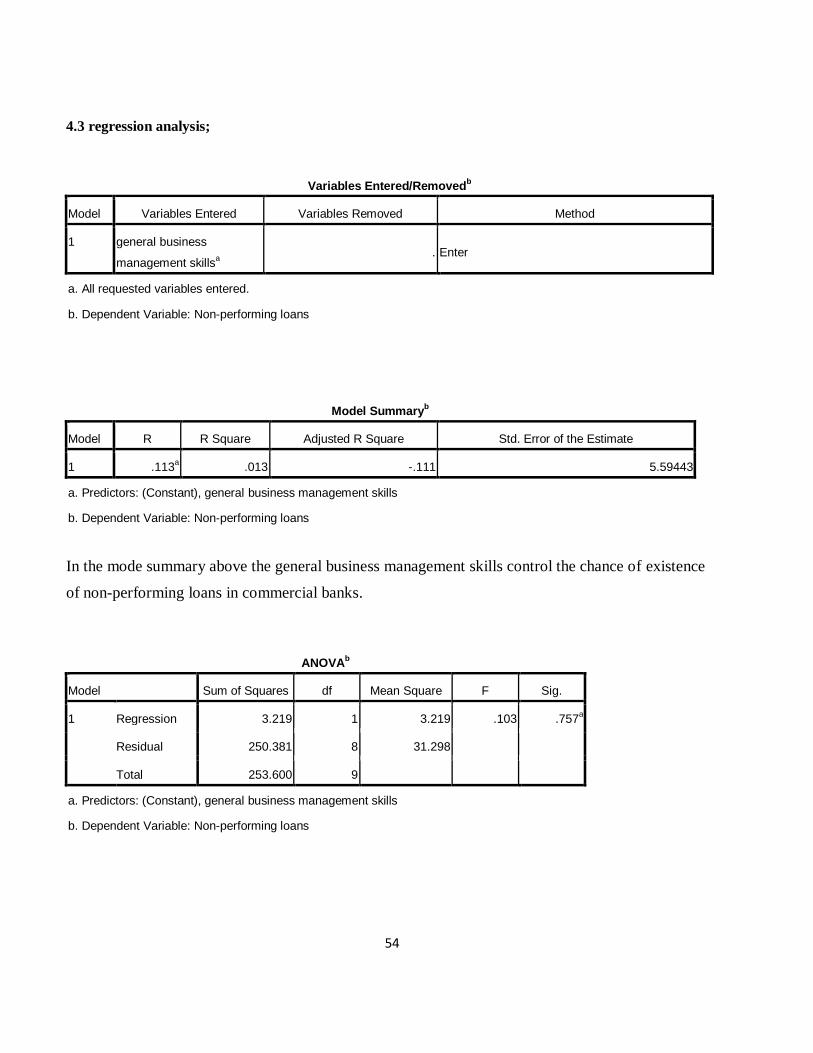
54
4.3 regression analysis;
Variables Entered/Removedb
Model Variables Entered Variables Removed Method
1 general business
management skillsa
. Enter
a. All requested variables entered.
b. Dependent Variable: Non-performing loans
Model Summaryb
Model R R Square Adjusted R Square Std. Error of the Estimate
1 .113a .013 -.111 5.59443
a. Predictors: (Constant), general business management skills
b. Dependent Variable: Non-performing loans
In the mode summary above the general business management skills control the chance of existence
of non-performing loans in commercial banks.
ANOVAb
Model Sum of Squares df Mean Square F Sig.
1 Regression 3.219 1 3.219 .103 .757a
Residual 250.381 8 31.298
Total 253.600 9
a. Predictors: (Constant), general business management skills
b. Dependent Variable: Non-performing loans
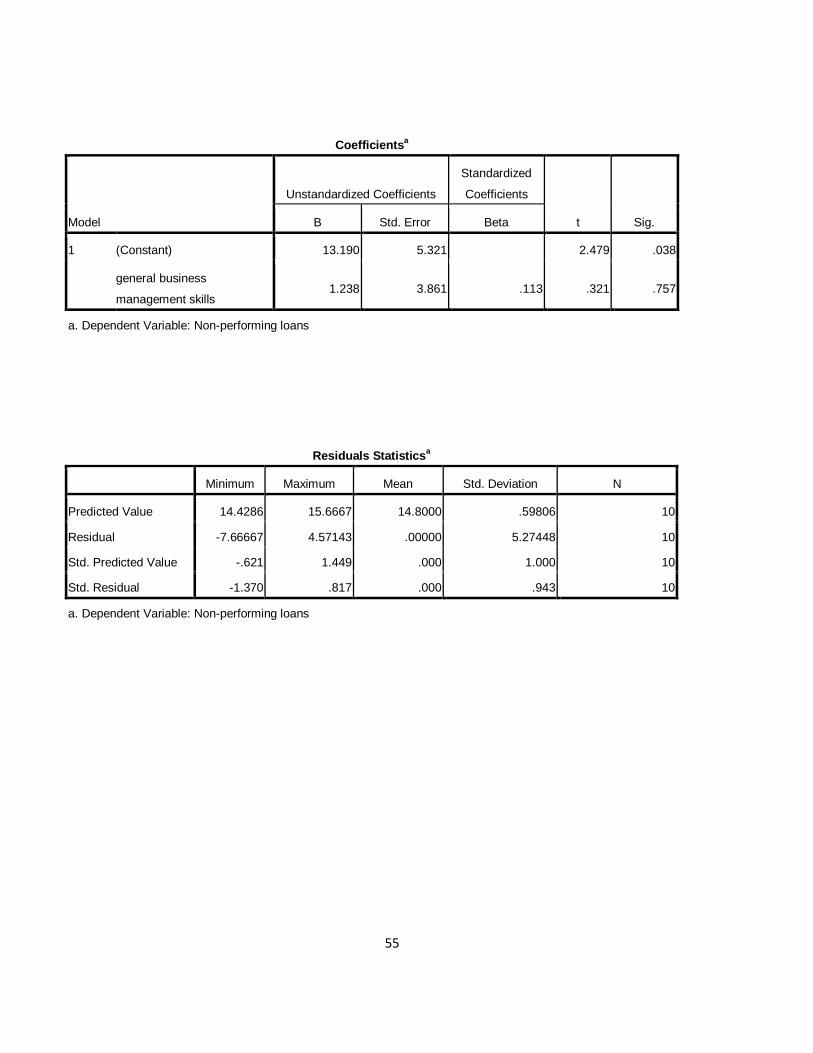
55
Coefficientsa
Model
Unstandardized Coefficients
Standardized
Coefficients
t Sig. B Std. Error Beta
1 (Constant) 13.190 5.321 2.479 .038
general business
management skills 1.238 3.861 .113 .321 .757
a. Dependent Variable: Non-performing loans
Residuals Statisticsa
Minimum Maximum Mean Std. Deviation N
Predicted Value 14.4286 15.6667 14.8000 .59806 10
Residual -7.66667 4.57143 .00000 5.27448 10
Std. Predicted Value -.621 1.449 .000 1.000 10
Std. Residual -1.370 .817 .000 .943 10
a. Dependent Variable: Non-performing loans
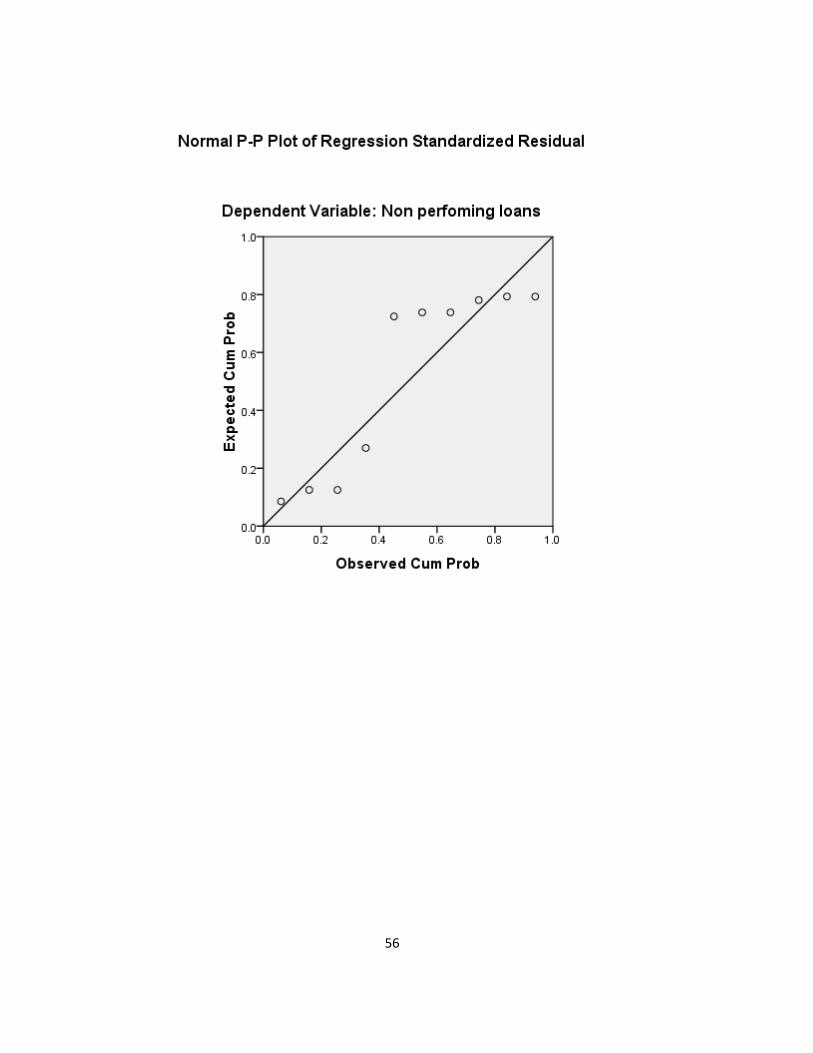
56
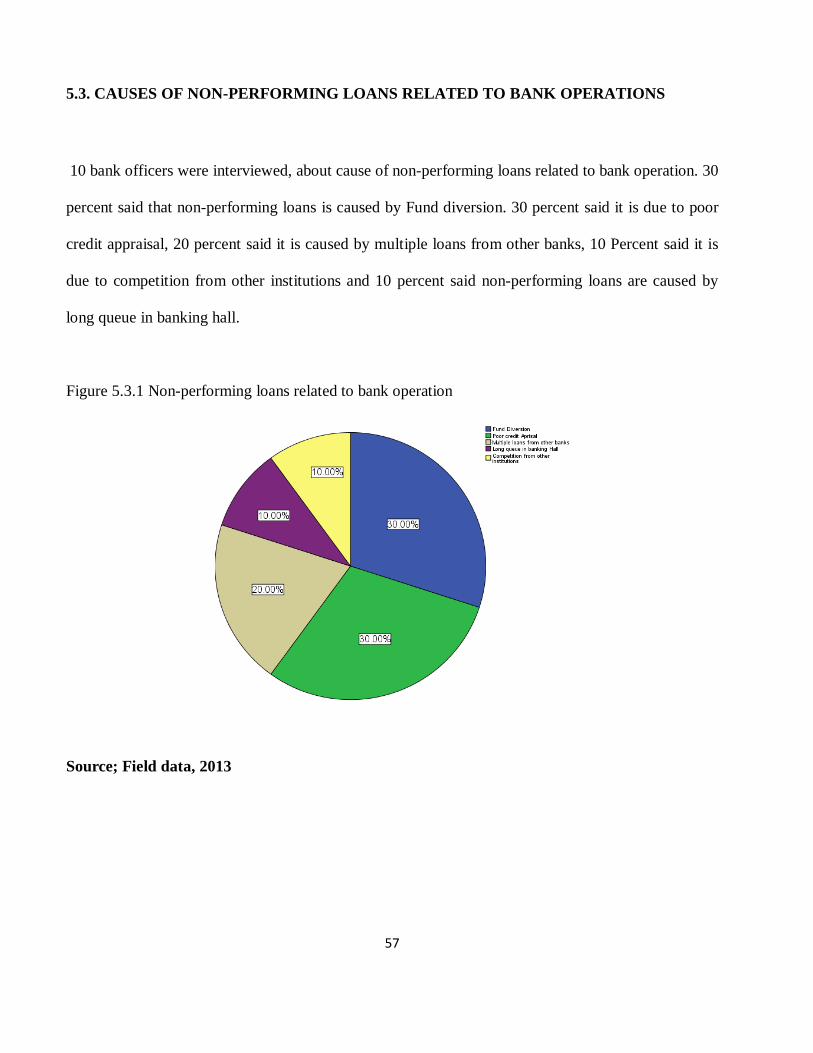
57
5.3. CAUSES OF NON-PERFORMING LOANS RELATED TO BANK OPERATIONS
10 bank officers were interviewed, about cause of non-performing loans related to bank operation. 30
percent said that non-performing loans is caused by Fund diversion. 30 percent said it is due to poor
credit appraisal, 20 percent said it is caused by multiple loans from other banks, 10 Percent said it is
due to competition from other institutions and 10 percent said non-performing loans are caused by
long queue in banking hall.
Figure 5.3.1 Non-performing loans related to bank operation
Source; Field data, 2013
58
CHAPTER SIX
SUMMARY, CONCLUSSION AND RECOMENDATION
6.1. SUMMARY
The objective of this study was to assess the causes of nonperforming loans related to bank and
customer operations
The study found the following
6.1.2 Causes of Non-Performing Loans Related to Customer Operations
General business management skills
The response rate indicate that 7.5 percent had received training in general business management
skills and the rest 92.5 percent they have never received training on general business management
skills
Financial Management Skills
The response rate indicated that 92.5 percent had never received training in financial management
skills. 7.5% percent had received training in financial management skills.
Accounting and book- keeping skills
Response rate indicated that only 15 percent had received training of accounting and book keeping
skills. 85percent did never receive accounting and book keeping skills.
Sales and marketing skills
Field response indicated that 7.5 percent had received training of sales and marketing skills and 92
percent had never received service of awareness on sales and marketing skills.
59
Entrepreneurship skills
Response rate indicated that 20 percent they received service of awareness of Entrepreneurship skills,
80 percent they have never received services of awareness of entrepreneurship skills.
Transport services skills
92 percent respondents had received training on transport services skill, while the rest 8 percent had
never received training on transport services skills
6.1.3 Causes of non-performing loans related to Bank Opoperations
The response rate for 10 bank officers interviewed about cause of non-performing loans related to
bank operation were 30 percent Fund diversion, 30 percent poor credit appraisal, 20 percent frauds
from bank officers, 10 Percent competition from other institutions and 10 percent long queue in
banking hall.
6.2 Conclusion;
Loans form 80% portion of the total assets in commercial banks in Tanzania (BOT annual reports,
2012). These assets generate huge interest income for banks which to a large extent determines the
financial performance of banks. However, some of these loans usually fall into non-performing status
and adversely affect the performance of banks. This is because non-performing loans can affect the
ability of banks to play their role in the development of the economy
Findings indicated that non-performing loans in commercial Banks are caused by both factors related
to bank operations and factors related to customers operations. Factors related to bank operation
60
identified were poor credit appraisal, poor credit policy, frauds from bank officials, competition from
other financial institutions and long queue in banking halls.
Factors related to customers operations identified are inadequate general business management skills,
inadequate of financial services skills, and inadequate accounting and book keeping skills
6.3 Recommendations;
The study, based on the findings mentioned above recommends the following in order to mitigate
causes of nonperforming loans
Causes of nonperforming loans related to Bank Operation
Bank should have adequate and reliable information about clients, good credit policy, conduct
appropriate credit appraisal, and train their customers on business, management, financial,
entrepreneurships and book keeping skills.
Causes of nonperforming loans related to Customer Operation
For the case of non-performing loans related to customers operations loan customers should be
trained on different business skills like the General business management skills, financial services
skills, and Accounting and book keeping skills. These will facilitate smoothly operations of business
activities on their side.
Area of further studies;
The study recommends further studies to:
The relationship between business management skills and nonperforming loans:
In this case the researcher should investigate clearly on how business management skills can lead to
non performing loans, which is how far does business management skills influence the performing
loans.

61
The relationship between credit policy and non-performing loans:
In this case, further researchers should show deeply how non-performing loans can be caused by
credit policy as long as it is through the credit policies of the bank which govern the credit issues.
Effects of nonperforming loans on bank performance
A clear assessment of the effects of non-performing loans to bank performance should be researched
by the further researchers.
The contribution of nonperforming loans on financial crisis
In this case the researcher should assess the contribution of non-performing loans to the financial
crisis
Risk management of nonperforming loans;
Further research should be conducted on how non-performing loans as a risk should be managed.
62
REFERENCE
Alton R. G and Hazen J. H (2001), “As Economy Flounders, Do We See A Rise in Problem Loans?”
Federal Reserve Bank of St. Louis.
Auronen L (2003), Asymmetric Information: Theory and Applications. Paper presented in the
Seminar of Strategy and International Business as Helsinki University of Technology, May 21st
2003.
Azofra V, Santamaria M (2011), Ownership, control and pyramids in Spanish commercial banks,
Journal of Banking and Finance 35, 1464–1476. Babihuga R (2007), Macroeconomic and Financial
soundness indicators: An empirical investigation‟, IMF working paper, no.115, 2007.
Bank risk of failure and the too-big-to-fail policy. Federal Reserve Bank of Richmond Economic
Quarterly (91/2), 21–44.
Barth J. R, Caprio G Jr and Levine R (2004). Bank Regulation and Supervision: What Works Best?
Journal of Financial Intermediation, 13, 205-248.
Beck H (2001), Banking is essential or not, the future of financial intermediation in the age of the
Internet, Netnomics 3, 7-22.
Bercoff J. J, Julian di G and Grimard F (2002), “Argentinean Banks, Credit Growth and the Tequila
Crisis: A Duration Analysis
Borio C and Lowe P (2002), Assessing the Risk of Banking Crisis, BIS Quarterly Review, 43 – 54.
Caprio G Jr and Klingebiel D (1996), Bank Insolvency: Bad Luck, Bad Policy or Bad Banking,
Annual World Bank Conference on Development Economics. Carey M (1998).
Cavaye A (1996). Case Study Research: A Multi-Faceted Research Approach for Information
Systems. Information systems Journal,6: 227–242.
63
Chimerine L (1998), The Economic and Financial Crisis in Asia. [Online] Available:
http://www.econstrat.org/lcimfas.htm (June 25 2013).
Credit risk in private debt portfolios. Journal of Finance 53, 1363–1387 Carey M (2002). A guide to
choosing absolute bank capital requirements. Journal of Banking and Finance 26, 929–951
DeYoung, R., & Rice, T. (2004). How do banks make money? The Fallacies of Fee Income.
Economic Perspectives Journal, 28 (4), 34-51. Ennis H and Malek H (2005),
Espinoza R and Prasad A (2010), Non-performing loans in the GCC banking system and their
macroeconomic effects, IMF Working Paper, WP/10/224.
Fofack H (2005), Non-Performing Loans in Sub-Saharan Africa: Causal Analysis and
Macroeconomic Implications, World Bank Policy Research Working Paper No. WP 3769.
Heffernan S (1996). Modern banking in theory and practice. John Wiley and Sons, Chichester.
Hennie V. G (2003), Analyzing and Managing Banking Risk: A Framework for Assessing Corporate
Governance and Financial Risk, 2nd Edition, Washington DC: World Bank Publications.
Hu J, Yang L, Yung-Ho C (2004) .Ownership and non-performing loans: evidence from Taiwan‟s
banks. Developing Economies Journal, 42(3), 405–420.
Interdisciplinary Journal Of Contemporary Research In Business Copy Right © 2012 Institute Of
Interdisciplinary Business Research 4 7 3 November 2012 Vol 4, No 7
Lawrence E (1995). Default and the life cycle model. Journal of Money, Credit and Banking 27, 939–
954.
64
Lawrence E (1995). Default and the life cycle model. Journal of Money, Credit and Banking 27, 939–
954.
Louzis D. P, Vouldis A. T, and Metaxas V. L (2011). Macroeconomic and bank-specific determinants
of non-performing loans in Greece: A comparative study of mortgage, business and consumer loan
portfolios. Journal of Banking & Finance,36(4), 1012-1027.
Louzis D. P, Vouldis A. T, and Metaxas V. L (2011). Macroeconomic and bank-specific determinants
of non-performing loans in Greece: A comparative study of mortgage, business and consumer loan
portfolios. Journal of Banking & Finance, 36(4), 1012-1027.
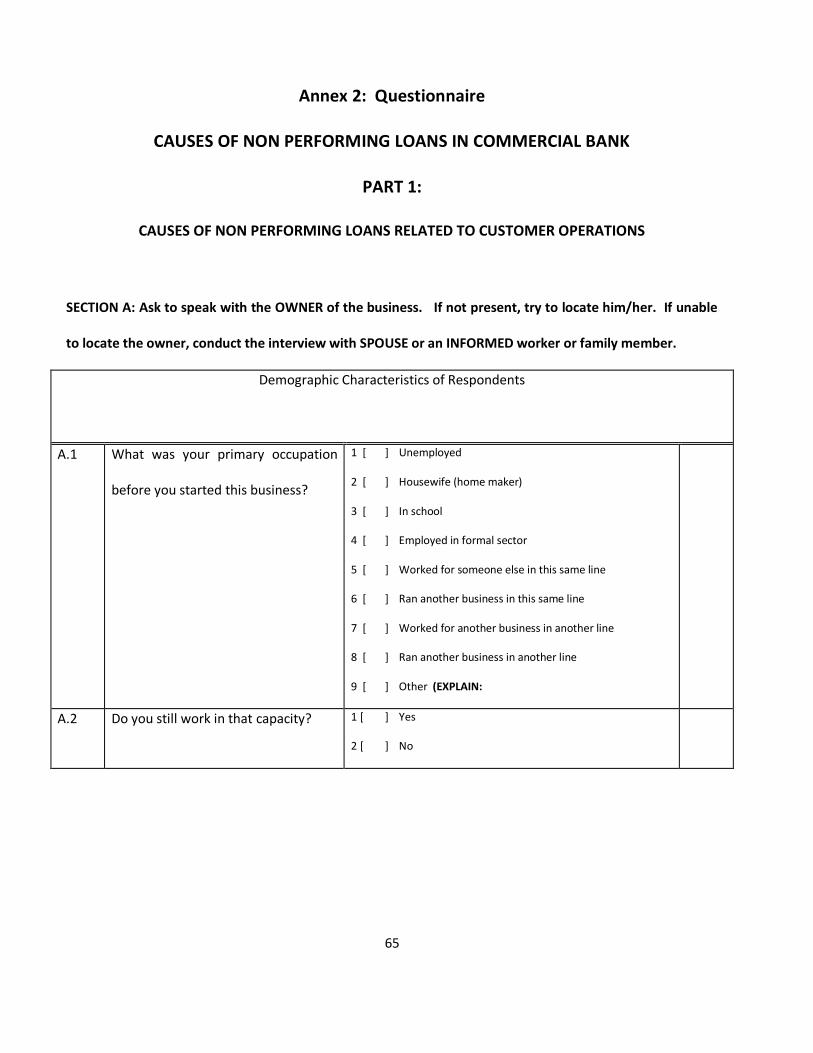
65
Annex 2: Questionnaire
CAUSES OF NON PERFORMING LOANS IN COMMERCIAL BANK
PART 1:
CAUSES OF NON PERFORMING LOANS RELATED TO CUSTOMER OPERATIONS
SECTION A: Ask to speak with the OWNER of the business. If not present, try to locate him/her. If unable
to locate the owner, conduct the interview with SPOUSE or an INFORMED worker or family member.
Demographic Characteristics of Respondents
A.1 What was your primary occupation
before you started this business?
1 [ ] Unemployed
2 [ ] Housewife (home maker)
3 [ ] In school
4 [ ] Employed in formal sector
5 [ ] Worked for someone else in this same line
6 [ ] Ran another business in this same line
7 [ ] Worked for another business in another line
8 [ ] Ran another business in another line
9 [ ] Other (EXPLAIN:
A.2 Do you still work in that capacity? 1 [ ] Yes
2 [ ] No
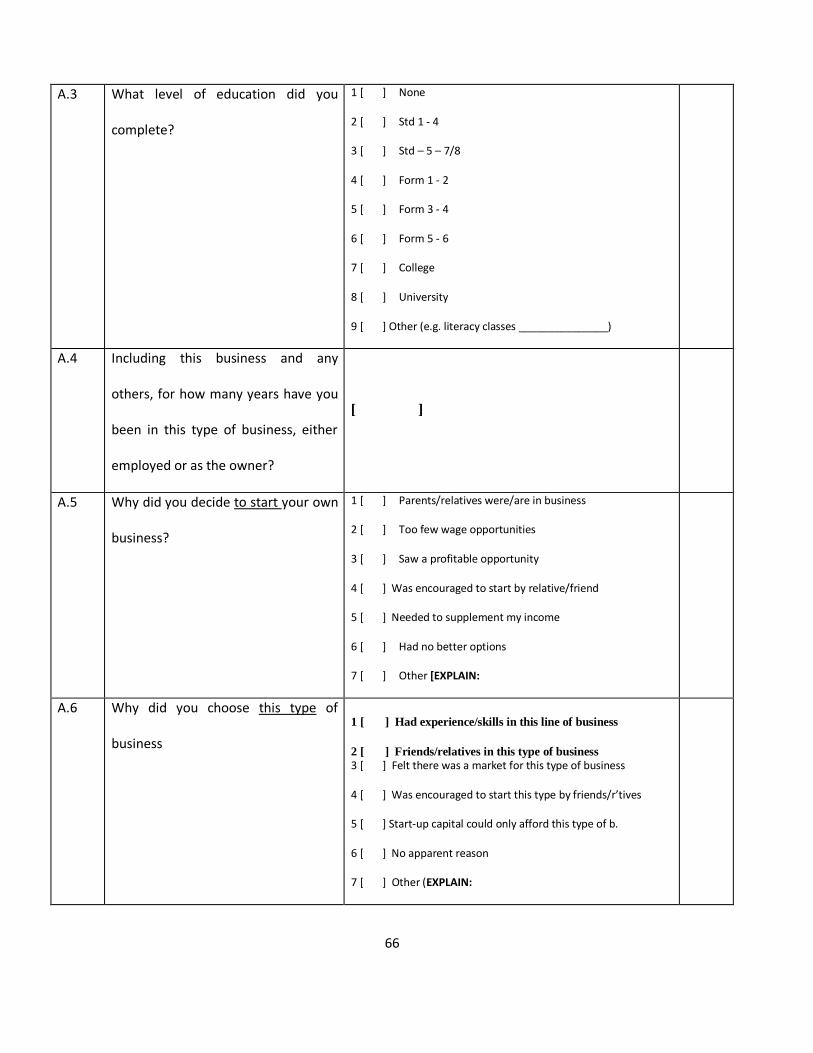
66
A.3 What level of education did you
complete?
1 [ ] None
2 [ ] Std 1 - 4
3 [ ] Std – 5 – 7/8
4 [ ] Form 1 - 2
5 [ ] Form 3 - 4
6 [ ] Form 5 - 6
7 [ ] College
8 [ ] University
9 [ ] Other (e.g. literacy classes _______________)
A.4 Including this business and any
others, for how many years have you
been in this type of business, either
employed or as the owner?
[ ]
A.5 Why did you decide to start your own
business?
1 [ ] Parents/relatives were/are in business
2 [ ] Too few wage opportunities
3 [ ] Saw a profitable opportunity
4 [ ] Was encouraged to start by relative/friend
5 [ ] Needed to supplement my income
6 [ ] Had no better options
7 [ ] Other [EXPLAIN:
A.6 Why did you choose this type of
business
1 [ ] Had experience/skills in this line of business
2 [ ] Friends/relatives in this type of business
3 [ ] Felt there was a market for this type of business
4 [ ] Was encouraged to start this type by friends/r’tives
5 [ ] Start-up capital could only afford this type of b.
6 [ ] No apparent reason
7 [ ] Other (EXPLAIN:
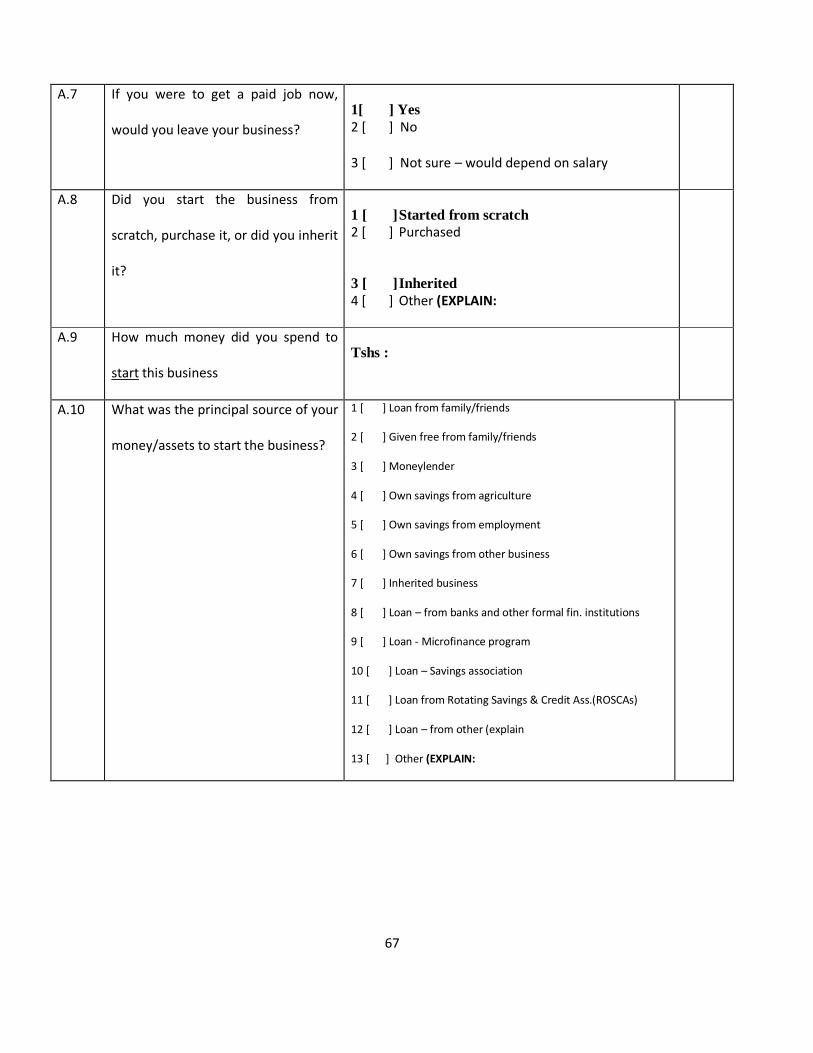
67
A.7 If you were to get a paid job now,
would you leave your business?
1[ ] Yes
2 [ ] No
3 [ ] Not sure – would depend on salary
A.8 Did you start the business from
scratch, purchase it, or did you inherit
it?
1 [ ] Started from scratch
2 [ ] Purchased
3 [ ] Inherited
4 [ ] Other (EXPLAIN:
A.9 How much money did you spend to
start this business
Tshs :
A.10 What was the principal source of your
money/assets to start the business?
1 [ ] Loan from family/friends
2 [ ] Given free from family/friends
3 [ ] Moneylender
4 [ ] Own savings from agriculture
5 [ ] Own savings from employment
6 [ ] Own savings from other business
7 [ ] Inherited business
8 [ ] Loan – from banks and other formal fin. institutions
9 [ ] Loan - Microfinance program
10 [ ] Loan – Savings association
11 [ ] Loan from Rotating Savings & Credit Ass.(ROSCAs)
12 [ ] Loan – from other (explain
13 [ ] Other (EXPLAIN:

68
A.11 Have you received credit for your
business from any of the following?
Consider all types of credit – family,
moneylenders, rotating credit
societies, banks, etc.
1 [ ]None
2 [ ] Loan (not free) from family/friends
3 [ ] Moneylender
4 [ ] Formal credit institution
5 [ ] Microfinance program
6 [ ] Supplier credit
7 [ ] Savings clubs
8 [ ] Other (EXPLAIN:
A.12 Thinking about all the sources of cash
income for your household (including
farming, employment, and any other
income), how much of your
household’s income comes from this
particular business?
1 [ ] More than half of all income
2 [ ] About half of income
3 [ ] Less than half of income
4 [ ] Don’t know
A.13 When were you born? Year ____________________-
A.14 What is your current marital status 1 [ ] Single – never married
2 [ ] Married
3 [ ] Divorced/separated
4 [ ] Widowed
A.15 How many dependents are you
responsible for?
[ ]
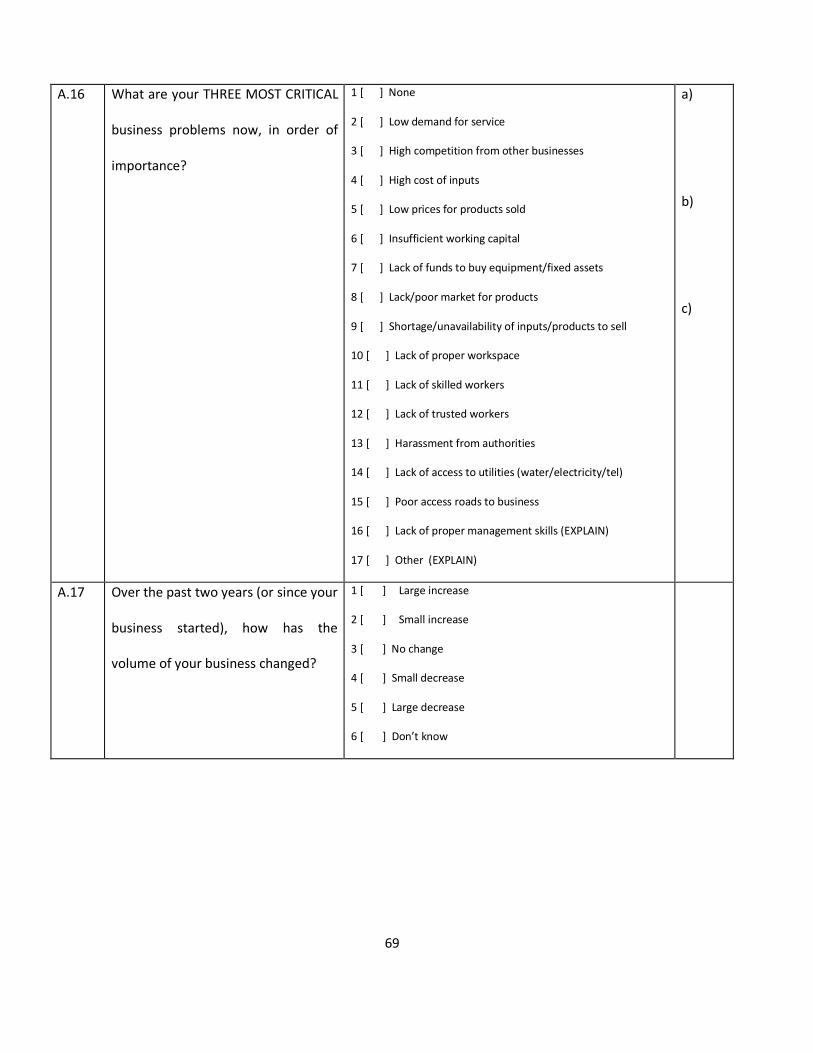
69
A.16 What are your THREE MOST CRITICAL
business problems now, in order of
importance?
1 [ ] None
2 [ ] Low demand for service
3 [ ] High competition from other businesses
4 [ ] High cost of inputs
5 [ ] Low prices for products sold
6 [ ] Insufficient working capital
7 [ ] Lack of funds to buy equipment/fixed assets
8 [ ] Lack/poor market for products
9 [ ] Shortage/unavailability of inputs/products to sell
10 [ ] Lack of proper workspace
11 [ ] Lack of skilled workers
12 [ ] Lack of trusted workers
13 [ ] Harassment from authorities
14 [ ] Lack of access to utilities (water/electricity/tel)
15 [ ] Poor access roads to business
16 [ ] Lack of proper management skills (EXPLAIN)
17 [ ] Other (EXPLAIN)
a)
b)
c)
A.17 Over the past two years (or since your
business started), how has the
volume of your business changed?
1 [ ] Large increase
2 [ ] Small increase
3 [ ] No change
4 [ ] Small decrease
5 [ ] Large decrease
6 [ ] Don’t know
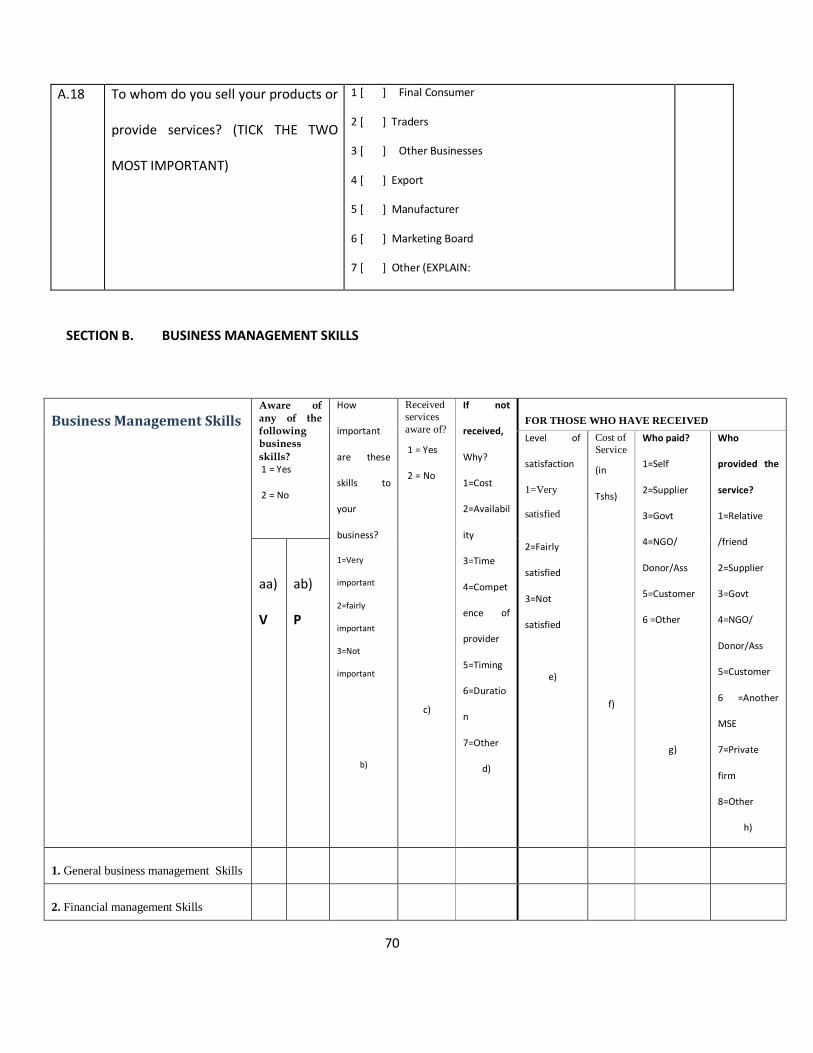
70
A.18 To whom do you sell your products or
provide services? (TICK THE TWO
MOST IMPORTANT)
1 [ ] Final Consumer
2 [ ] Traders
3 [ ] Other Businesses
4 [ ] Export
5 [ ] Manufacturer
6 [ ] Marketing Board
7 [ ] Other (EXPLAIN:
SECTION B. BUSINESS MANAGEMENT SKILLS
Business Management Skills Aware of any of the following business
skills? 1 = Yes
2 = No
How
important
are these
skills to
your
business?
1=Very
important
2=fairly
important
3=Not
important
b)
Received
services
aware of?
1 = Yes
2 = No
c)
If not
received,
Why?
1=Cost
2=Availabil
ity
3=Time
4=Compet
ence of
provider
5=Timing
6=Duratio
n
7=Other
d)
FOR THOSE WHO HAVE RECEIVED
Level of
satisfaction
1=Very
satisfied
2=Fairly
satisfied
3=Not
satisfied
e)
Cost of
Service
(in
Tshs)
f)
Who paid?
1=Self
2=Supplier
3=Govt
4=NGO/
Donor/Ass
5=Customer
6 =Other
g)
Who
provided the
service?
1=Relative
/friend
2=Supplier
3=Govt
4=NGO/
Donor/Ass
5=Customer
6 =Another
MSE
7=Private
firm
8=Other
h)
aa)
V
ab)
P
1. General business management Skills
2. Financial management Skills

71
3. Sales &marketing Skills
4. Entrepreneurship Skills
5. New technologies mgt skills
6. B’ness counselling/advisory skills
7. Sales and market promotion skills
8. Market information skills
9. Financial services skills
10. Transport services skills
11. Accounting/B. keeping services
skills
12. Communication services skills
13. Secretarial services
14. Advisory services on legal matters
skills
15. Advisory services in taxation skills
16. Others skills (EXPLAIN)

72
C.02 If you had the opportunity, what
THREE SKILLS would you consider
most IMPORTANT for you to access
in relation to your business?
1 [ ] Training in business management - general
2 [ ] Training in financial management
3 [ ] Training in sales and marketing
4 [ ] Entrepreneurship training
5 [ ] Training in new technologies
6 [ ] Business counselling and advisory services
7 [ ] sales and marketing promotion
8 [ ] Market information
9 [ ] Financial services
10[ ] Transport services
11[ ] Accounting/ book-keeping services
12[ ] Communication services
13[ ] Secretarial services
14[ ] Advisory services on legal matters
15[ ] Advisory services in taxation
16[ ] Others (EXPLAIN)
C.03 From whom do you purchase your
Equipment
1 [ ] Manufacture
2 [ ] Wholesaler
3 [ ] Retailers
4 [ ] Other MSEs
5 [ ] Other (EXPLAIN)
C.04 Does any of your input suppliers
provide:
1 [ ] Business training
2 [ ] Advisory services
3 [ ] Other services (EXPLAIN ______________)
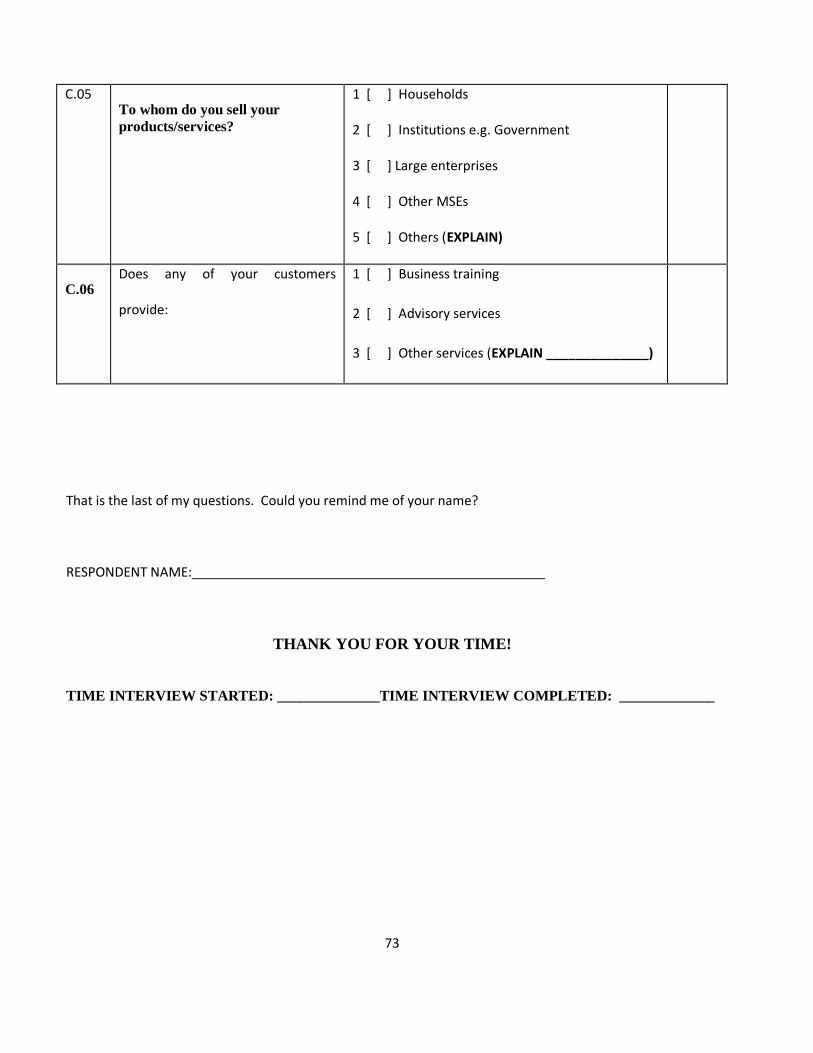
73
C.05 To whom do you sell your
products/services?
1 [ ] Households
2 [ ] Institutions e.g. Government
3 [ ] Large enterprises
4 [ ] Other MSEs
5 [ ] Others (EXPLAIN)
C.06 Does any of your customers
provide:
1 [ ] Business training
2 [ ] Advisory services
3 [ ] Other services (EXPLAIN ______________)
That is the last of my questions. Could you remind me of your name?
RESPONDENT NAME:
THANK YOU FOR YOUR TIME!
TIME INTERVIEW STARTED: ______________TIME INTERVIEW COMPLETED: _____________
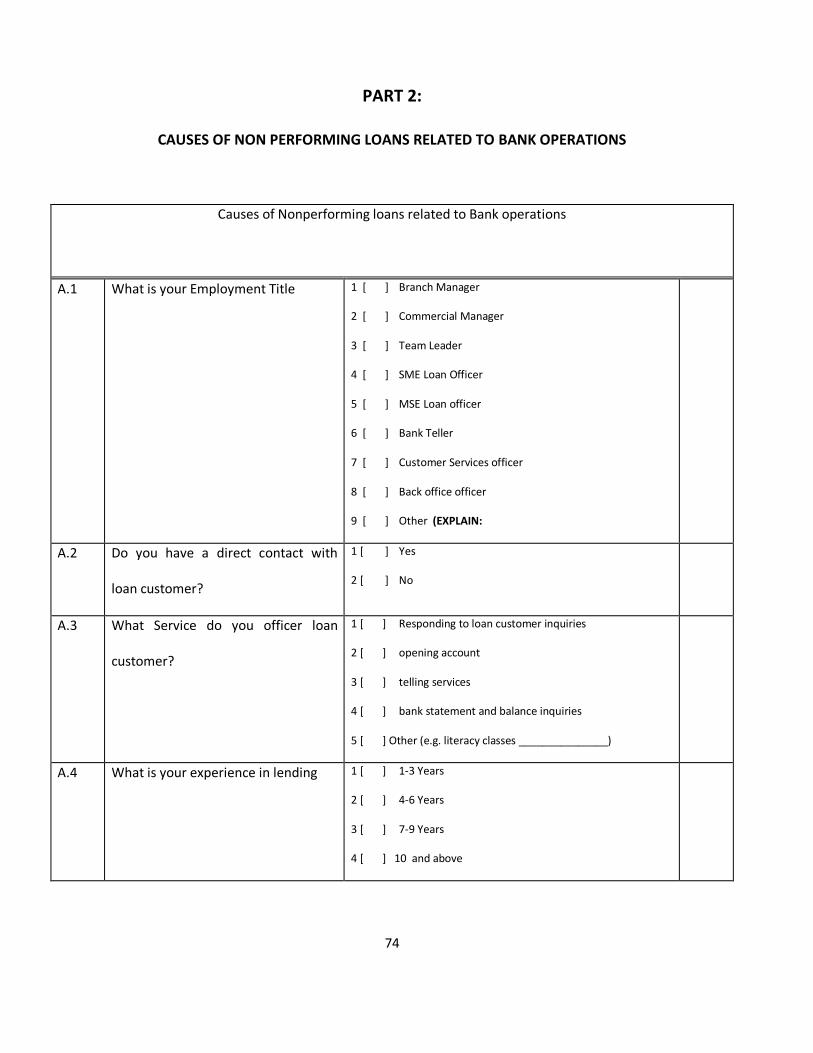
74
PART 2:
CAUSES OF NON PERFORMING LOANS RELATED TO BANK OPERATIONS
Causes of Nonperforming loans related to Bank operations
A.1 What is your Employment Title
1 [ ] Branch Manager
2 [ ] Commercial Manager
3 [ ] Team Leader
4 [ ] SME Loan Officer
5 [ ] MSE Loan officer
6 [ ] Bank Teller
7 [ ] Customer Services officer
8 [ ] Back office officer
9 [ ] Other (EXPLAIN:
A.2 Do you have a direct contact with
loan customer?
1 [ ] Yes
2 [ ] No
A.3 What Service do you officer loan
customer?
1 [ ] Responding to loan customer inquiries
2 [ ] opening account
3 [ ] telling services
4 [ ] bank statement and balance inquiries
5 [ ] Other (e.g. literacy classes _______________)
A.4 What is your experience in lending 1 [ ] 1-3 Years
2 [ ] 4-6 Years
3 [ ] 7-9 Years
4 [ ] 10 and above
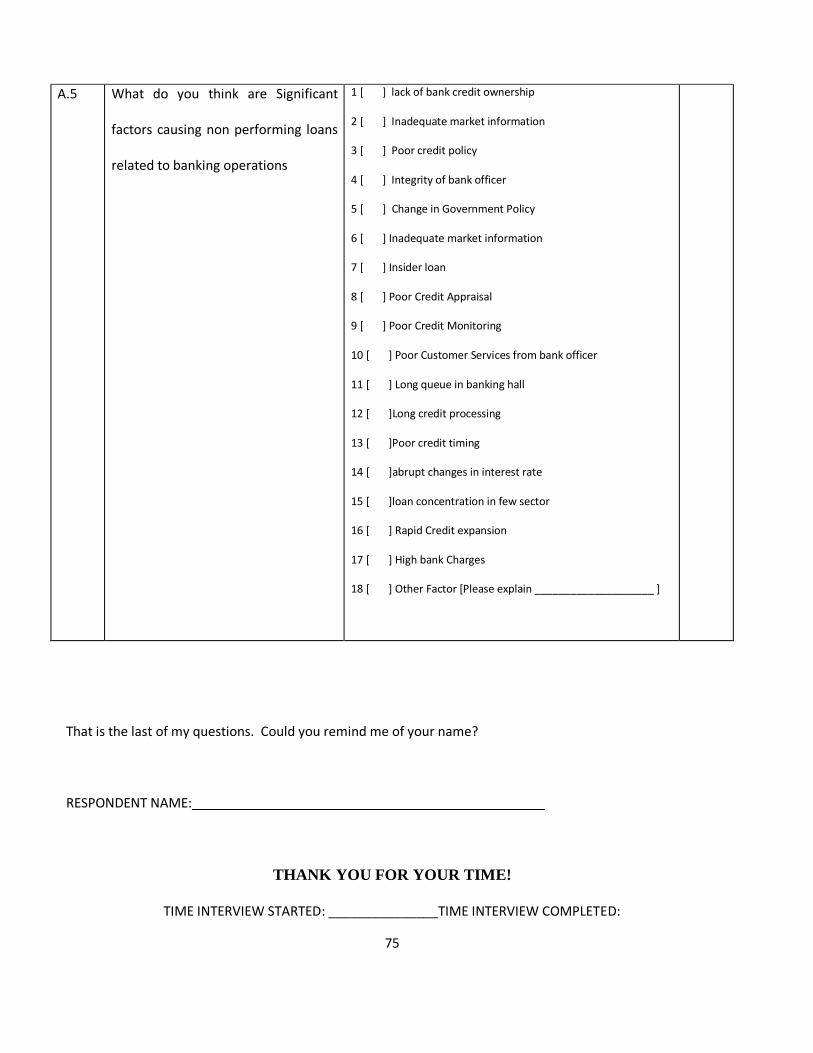
75
A.5 What do you think are Significant
factors causing non performing loans
related to banking operations
1 [ ] lack of bank credit ownership
2 [ ] Inadequate market information
3 [ ] Poor credit policy
4 [ ] Integrity of bank officer
5 [ ] Change in Government Policy
6 [ ] Inadequate market information
7 [ ] Insider loan
8 [ ] Poor Credit Appraisal
9 [ ] Poor Credit Monitoring
10 [ ] Poor Customer Services from bank officer
11 [ ] Long queue in banking hall
12 [ ]Long credit processing
13 [ ]Poor credit timing
14 [ ]abrupt changes in interest rate
15 [ ]loan concentration in few sector
16 [ ] Rapid Credit expansion
17 [ ] High bank Charges
18 [ ] Other Factor [Please explain ____________________ ]
That is the last of my questions. Could you remind me of your name?
RESPONDENT NAME:
THANK YOU FOR YOUR TIME!
TIME INTERVIEW STARTED: _______________TIME INTERVIEW COMPLETED: