Embed Size (px)
Citation preview
AN ASSESSMENT OF THE FACTORS
AFFECTING CONTRACT FARMING:
THE CASE OF SUGARCANE PRODUCTION
IN MIGORI COUNTY, KENYA
PATRICE LUMUMBA KOKEYO
A THESIS SUBMITTED IN PARTIAL FULFILMENT OF THE REQUIREMENTS
FOR THE AWARD OF A MASTER OF SCIENCE DEGREE IN AGRICULTURAL
AND APPLIED ECONOMICS OF THE UNIVERSITY OF NAIROBI
NOVEMBER, 2013

2
DECLARATION
I, PATRICE LUMUMBA KOKEYO, DO HERE DECLARE THAT THIS Thesis is
my original work and has not been submitted for a Degree in any other University.
Signature……………………………………. Date……………………………………
This thesis has been submitted for examination with our approval as University
Supervisors
Signed
................................................................ ........................................
PROF. STEPHEN. G. MBOGOH Date
.............................................................. ..........................................
DR. F. MUGIVANE Date

3
DEDICATION
This research is dedicated to my late mother (Naomi); my father (Joshua); my
children (Fred, Juliet, Mudge, and Lynne); and my spouse (Monica Lumumba).

4
ACKNOWLEDGEMENTS
First and foremost, I am grateful to the Almighty God for His gift of wisdom,
knowledge and life to pursue my studies.
Special thanks go to my university supervisors, Professor Mbogoh, Dr.
Mugivane and Dr Irungu, for their guidance, inspiration, patience, mentoring and
leadership to make this thesis a success. To Dr. Rose Nyikal, thank you for your
facilitation, understanding and encouragement in accomplishing my research
work. I am grateful to the African Economic Research Consortium (AERC) for
their partial financial assistance towards my studies. Special appreciation also
goes to my employer, the Ministry of Agriculture, for awarding me study leave to
enable me accomplish my studies. In particular, I would like to thank Grace Agili,
the Director, Agricultural Information Resource Centre, for processing my study
leave.
It may not be possible to enumerate all the people who assisted me during the
development of this thesis. However, I would like to thank some of them by name
and others in general terms. The first category of people I would like to express
my sincere gratitude to are the sugarcane farmers who allowed me to ply into
their private lives while gathering socio-economic data about their farming
enterprises. The second category of people I would like to thank is the District
and Location officials who gave me unreserved cooperation as I collected my
data. I am grateful to the SONY Sugar Company employees for availing
information about the contract farmers under their jurisdiction.
At the University of Nairobi, I would like to thank the staff, lecturers and
students in the Department of Agricultural Economics for the encouragement I
received from them.
Finally, I would like to appreciate the encouragement I received from my
spouse, Monica, and children, Fred, Juliet, Mudge and Lynne throughout the
study period.
5
TABLE OF CONTENTS
CONTENT PAGE
DECLARATION ..................................................................................................... 2
DEDICATION ......................................................................................................... 3
ACKNOWLEDGEMENTS ...................................................................................... 4
TABLE OF CONTENTS ......................................................................................... 5
LIST OF FIGURES ................................................................................................ 7
LIST OF TABLES .................................................................................................. 8
ACRONYMS .......................................................................................................... 9
ABSTRACT .......................................................................................................... 11
CHAPTER ONE: INTRODUCTION...................................................................... 12
1.1 Background ............................................................................................ 12
1.2 The sugar industry in Kenya ................................................................... 14
1.3 The Problem Statement .......................................................................... 17
1.4 Objectives of the Study ........................................................................... 21
1.5 Hypotheses tested .................................................................................. 21
1.6 Justification of the Study ......................................................................... 22
CHAPTER TWO: LITERATURE REVIEW ........................................................... 24
2.1 Introduction ............................................................................................. 24
2.2 Theories of contract farming and associated costs ................................. 25
2.3 Agricultural contracts in Africa ................................................................ 27
2.4 Agricultural contracts in Kenya ............................................................... 29
2.5 Overall remarks on agricultural contracts ............................................... 32
2.6 Measuring SONY contract participation/non participation decision......... 32
2.7 Application of Models in the Current Study ............................................. 34
CHAPTER THREE: METHODOLOGY ................................................................ 35
3.1 The Study Area ....................................................................................... 35
3.2 Theoretical Framework and empirical specification ................................ 37
3.3 Analytical Framework ............................................................................. 40
3.4 Data sources and sampling procedure ................................................... 42

6
CHAPTER FOUR: RESULTS AND DISCUSSION .............................................. 44
4.1 Results on the characterization of the SONY contract scheme .............. 44
4.2 Socio-economic characteristics of sugarcane growers ........................... 50
4.3 Results of comparing key socio-economic characteristics of contract and
non-contract farmers ........................................................................................ 67
CHAPTER FIVE: SUMMARY, CONCLUSION AND RECOMMENDATIONS ...... 75
5.1 Summary of the Findings and Conclusion .............................................. 75
5.2 Recommendation .................................................................................... 78
REFERENCES .................................................................................................... 80
APPENDICES ...................................................................................................... 88

7
LIST OF FIGURES
Figure 1.1 The location of sugar companies and research stations in Kenya ...... 16
Figure 1.2 Diagram of alternative and existing production and marketing
channels for sugarcane/sugar in Migori District ................................................... 19
Figure 3.1 Geographical boundaries of Migori County ......................................... 36
Figure 4.1 Sugarcane marketing channels .......................................................... 62
Figure 4.2 Sugarcane harvesters ......................................................................... 63
Figure 4.3 Farmer perceptions on weight loss of sugarcane outside mill ............ 65
Figure 4.4 Farmer mode of payment for sugarcane ............................................. 65
Figure 4.5 Response on sugarcane productivity compared to other farm
enterprises ........................................................................................................... 66

8
LIST OF TABLES
Table 1.1. Comparative cost of sugar production in COMESA and selected East
African countries .................................................................................................. 15
Table 4.1. Gender of respondents (farmers) ........................................................ 51
Table 4.2. Marital status of respondents (farmers) .............................................. 51
Table 4.3. Age of the respondents ....................................................................... 51
Table 4.4. Years the respondents have lived on the farm .................................... 52
Table 4.5 Total area of the farm (hectares) ......................................................... 52
Table 4.6. Land ownership ................................................................................... 53
Table 4.7. Features of landowner’s house ........................................................... 53
Table 4.8. Age and number of dependants living in the household by gender..... 54
Table 4.9. Education level of household head (female and male) ...................... 55
Table 4.10. Sugarcane production labour distribution by gender ......................... 56
Table 4.11 Field soil sampling and testing for fertility ......................................... 57
Table 4.12. Fertilizer application and whether ..................................................... 57
Table 4.13 Livestock ownership .......................................................................... 58
Table 4.14. Sources of financing farm operations ............................................... 58
Table 4.15. Income from sugarcane ................................................................... 59
Table 4.16. Off-farm income ............................................................................... 59
Table 4.17. Willingness to take risks ................................................................... 60
Table 4.18. Channels of information Communication on agriculture .................... 60
Table 4.19. Source of information on sugarcane production ................................ 61
Table 4.20. Whether technical training had been offered by SONY Sugar
Company ............................................................................................................. 62
Table 4.21. Planting to harvest period (plant crop) .............................................. 64
Table 4.22. Farm to factory duration (hrs) ............................................................ 64
Table 4.23. Interest in expansion of sugarcane production ................................. 66
Table 4.24. Reason for non-interest in expansion of sugarcane production ....... 66
Table 4.25. Farmer’s perception on income status in the last 5 years ................. 67
Table 4.26 Characteristics of SONY contract and non-contract farmers............. 69
Table 4.27. Probit model of participation in SONY contract scheme .................. 71

9
ACRONYMS
COMESA Common Market for Eastern and Southern Africa
FAO Food and Agriculture Organization
FGDs Focus Group Discussions
GOK Government of Kenya
HCDA Horticultural Crops Development Authority
IAD Institutional Analyses and Development
IDS Institute of Development Studies
ILRI International Livestock Research Institute.
KESGA Kenya Sugarcane Growers Association
KESMA Kenya Sugar Millers Association
KESREF Kenya Sugar Research Foundation
KIPPRA The Kenya Institute for Public Policy Research and Analyses
KISs Key Informant Surveys
KSB Kenya Sugar Board
LSD Least Significant Difference
MASIP Malawi Agricultural Sector Investment Program
NEMA National Environmental Management Authority
NEPAD The New Partnership for Africa’s Development
NIE New Institutional Economics
NTEX Non-traditional exports
ODI Overseas Development Institute
OIs Out grower Institutions
PRSP Poverty Reduction Strategy Paper

10
SAT Sugar Arbitration Tribunal
SONY South Nyanza Sugar Company
SPSS Statistical Package for the Social Sciences
SPC Sugar Parliamentary Committee
TCE Transaction Costs Economics
TCH Ton cane per hactare
UNDP United Nations Development Program

11
ABSTRACT
This study is an empirical analysis of the factors that influence participation in a
contract farming scheme and the impact of contract participation on sugarcane farm
households. The study characterizes the nature of the contract scheme. Through a
probit model and participatory methodologies the study identifies the factors that
influence participation in the contract farming scheme and analyses the impact of
participation on farm household welfare. The study relies on cross-sectional data from
115 contract and 69 noncontract sugarcane growers collected through a household
survey, from 30 farmers through focus group discussions and key informant surveys.
The study shows that the contracted sugarcane growers were not necessarily better-
off than non-contracted farmers from welfare perspective. The contracted sugarcane
farmers were experiencing a number of problems including higher cost of
administering the contract, than those for the non-contract growers. The study also
found that the non-contract growers had more land under food crops than contract
farmers whose land was mainly contracted for sugarcane growing. Hence the non-
contract farmers appeared more food secure. The study concludes that the main
factors influencing farmer participation in sugarcane contracts are:- (i) farm distance
to the company sector office (ii) ownership of assets and access to external farm
support (iii) risk-averseness (iv) farm household size, and (vi) education of the
household head. The contracted farmers also claimed that they experienced high
levels of sugarcane post-harvest losses because weighing of their produce was being
done at the sugarcane company factory reception area rather than at the farm gate.
The study thus recommends the following: (i) reviewing of contract terms and
conditions with the objective of reducing contract administration costs; (ii)
incorporating soil sampling and testing costs in the production credit extended to
farmers; (iii) providing periodic sugarcane technical training to farmers; (iv) weighing
of the sugarcane at the farm gate; and (v) payment of sugarcane delivery based on
quality (sucrose content).
This study also recommends that the contracted farmers be encouraged to allocate
part of their land to production of food crops to enhance food security.

12
CHAPTER ONE
INTRODUCTION
1.1 Background
According to Bijman (2008), contract farming in agriculture between agro food
processing industries and producers has become an important phenomenon
worldwide, especially for perishable commodities. The rise of contract farming has
been due to the need to strengthen vertical coordination between producers and
agribusiness firms. The continuous increase in the importance of contract farming
has largely been due to the changing global environment, where competition,
consumer demands, technology, government policies and agricultural systems
have been taking the centre stage.
For a long time in many sub-Saharan African countries, there has been no
tradition of written farming contracts. Instead, traditional informal agreements
were commonly used and are still respected (Fafchamps, 2004). Application of
formal contract farming has now become an option for many African countries as
a method of enhancing commercial farming. African smallholder agriculture is
characterized by many problems, such as low productivity, natural resource
degradation and inadequate basic services for farming. Although contract farming
has proved successful in many African countries by enhancing existing income
levels, it may not necessarily be a solution for many market failures in agriculture
(Warning and Hoo, 2000).
In Kenya, both marketing and production contracts as a form of vertical integration
are found in livestock and crop production. Livestock contracts can be found in
the pig, egg and broiler markets. In crop production, contract farming is common
in the horticultural sub-sector and also in the field crops sub-sector, such as for
sugarcane, tobacco, tea, and cotton production. More than 230,000 households in
Kenya were involved in the contract production of tea, sugar, oilseeds, tobacco
and horticultural commodities by mid- 1980s (Kuntoro and Yoshiharu, 2003). It is
estimated that by mid-2000s, 1.2 million out of 3 to 4 million farming households
in Kenya were contract farmers in the coffee, tea, dairy cattle, barley (for
brewing), vegetable, sugar and corn sectors (Peltzer, 2006).

13
Generally, the sugarcane sub-sector contributes tremendously to the Kenyan
economy through employment creation. It is also an important source of income
and livelihood for many smallholder farmers in Kenya. Sugarcane farming, for a
long time, has been a dominant feature in the socio-economic lives of over 4
million Kenyans in the South Western part of Kenya (SONY Sugar Company,
2009). Indeed, if the schemes worked efficiently, the farmers would be cushioned
against risks and uncertainties related to variations in yield, price fluctuation and
unreliable markets. However, the sugar and sugarcane contract schemes have
faced increasing production and marketing constraints that seem to be raising the
cost of sugar production in Kenya compared to other neighbours like Sudan and
COMESA countries (Kegode, 2005). This raises concern on sustainability of
sugarcane contract schemes in Kenya in their current form.
Contract farming is particularly important in sugarcane production in Kenya. The
growers are subjected to contractual arrangements that specify the sugarcane
area to be cultivated and the growing conditions. The farmers are under obligation
to deliver the sugarcane to the miller when the cane is mature. The miller, on the
other hand, provides all the inputs (land preparation, fertilizers, and chemicals)
and any other required expansion loans which are deducted from the sugarcane
proceeds. The miller provides an assurance that it will procure all the sugarcane
from contracted out-growers. The miller also determines when to harvest, but
subcontracts harvesting and transportation to independent companies. However,
there is a tendency for the farmers to try and sell their cane to other millers when
the crop is ready for harvesting.
Sugarcane contracts are attractive in the sugar industry because of the
investment, production and other attributes (asset specificity) which require
specific arrangements to facilitate production. Asset specificity refers to
investments specifically made for a particular enterprise and whose value is
substantially lower outside the particular relationship (Bijman, 2008). In the sugar
industry, asset specificity arises because of the milling plants that process the
sugarcane and the transport facilities which have limited alternative uses.

14
Furthermore, due to the techno-economic characteristics of the sugar supply
chain, specific contract arrangements between the growers and the processing
firms to ensure efficient coordination from planting to harvesting and subsequent
delivery of the sugarcane to the factory are important. This is necessary because
of the relatively high perishability nature of the crop.
In Migori County of Kenya, sugarcane is mainly grown under contract between
farmers and South Nyanza (SONY) Sugar Company. SONY Sugar Company was
incorporated by the Kenyan Government in 1976 and commissioned in 1979 with
the objective of generating economic, social and financial gains for the local
community and the country through the manufacture of mill white sugar for local
consumption (SONY Sugar Company, 2009).
To maintain a continuous supply of raw material (sugarcane) of good quality, the
SONY Sugar Company has established its own nucleus estate. However, the
nucleus estate is unable to satisfy the factory sugarcane requirements. Therefore,
the factory expects to supplement its cane requirements through contracted out-
grower farmer schemes. This is the arrangement that is referred to as contract
farming.
1.2 The sugar industry in Kenya The development of the sugar industry in Kenya is said to be linked to the history
of Asian agricultural settlement in the country. The Asians (then referred to as
“coolies”) came to build the Kenya–Uganda railway line at the invitation of the
British government, but later began to engage in retail trade and commercial
agriculture (Wanyande, 2001). The most successful Asian agricultural settlement
was at Kibos, Nyanza Province. They started the first sugar production scheme in
1922 on a commercial basis by establishing Miwani Sugar Mills (Kegode, 2005).
The second Asian sugar mill was established in 1927 by Associated Sugar
Company Limited at Ramisi in Coast Province and was managed by the
Madhvani Group International of India. Before Kenya secured political
independence in 1963, the two mills were managed and owned exclusively by
private Asian companies up to the mid-1960s. In an effort to achieve self-
sufficiency in sugar production, the Government of Kenya has since 1963

15
continued to expand sugar production through investment in sugarcane growing
schemes and factories (see Figure 1.1). Thus, the Government established
Muhoroni Sugar Factory in 1966, Chemelil in 1968, Mumias in 1973, Nzoia in
1978 and SONY in 1979 (Kegode, 2005). Currently, there are a number of
proposed investments in the sugar sector which include the Tana River Sugar
Company, Kamkuywa Sugar Mill, and Butali (Busia) Sugar Mill.
By mid 1990s, the Government started liberalizing trade, thus exposing the local
producers to competition from sugar imports. Kenyan sugar is uncompetitive in
the world market because the country is a high cost producer, even relative to
other African countries. For example, Sudan, Egypt, Swaziland, Zambia, Malawi,
Uganda and Tanzania are low cost producers (producing sugar at between US $
180-340 per ton, compared to Kenya’s figure at US $ 415-500 per ton) as shown
in Table 1.1. Thus, liberalization process over the last one and a half decades has
exposed the sugar sub-sector to a major threat with regard to its survival without
any safeguard measures.
Table 1.1. Comparative cost of sugar production in COMESA and selected East African countries
Country Cost USD/ton Ksh/ton Exch. Rate [27.4.2013]
Kenya 415-500 34,735.50-41,850.00 1USD = 83.70
Sudan 250-340 20,925.00-28458.00 1USD = 83.70
Egypt 250-300 20,925.00-25,110.00 1USD = 83.70
Swaziland 250-300 20,925.00-25,110.00 1USD = 83.70
Zambia 230-260 19,251.00-21,762.00 1USD = 83.70
Malawi 200-230 16,740.00-19,251.00 1USD = 83.70
Tanzania 180-190 15,066.00-15,903.00 1USD = 83.70
Uganda 140-180 11,718.00-15,066.00 1USD = 83.70
Source: (Kenya Sugar Board, 2009)

16
Figure 1.1 The location of sugar companies and research stations in Kenya
Source: (European Commission , 2007)
Figure 1.1 shows the location of sugar companies and research stations in
Kenya, while Table 1.1 shows the comparative cost of sugar production in
COMESA and selected East African countries.
Table 1.1 shows that Kenya is under the category of high cost producers, thus
making them very attractive destinations for global sugar exports. The
neighbouring countries like Tanzania and Uganda do import sugar that finds its
way into Kenya through informal cross border trade, thus posing unfair

17
competition to the local producers (Kenya Sugar Board, 2009). Furthermore,
sugar transhipment from the world market, including COMESA and SADC
countries such as Malawi, Zambia and Swaziland, which are low cost producers,
poses a major threat to the survival of the Kenyan sugar sub-sector. There have
been some periods when due to sugar imports, the domestic sugar prices have
been lower than the production costs, thus forcing factories to accumulate unsold
sugar stocks, rather than dispose them at a loss (Tyler, 2007).
The zero tariff tax regime operated by the COMESA that allows free movement
of sugar by member states does not make it any better for Kenya as a country.
However, Kenya is enjoying a temporary reprieve through a COMESA safeguard
measure that has been granted to allow Kenya build its competitive advantage
until 2014 when it will be lifted. To restructure the sugar sub-sector by February
2014 when the COMESA safeguard expires and for the industry to reposition
itself competitively, concerted efforts have been made through the key oversight
institutions in the sugar industry in Kenya, such as the Kenya Sugar Board (KSB),
the Kenya Sugar Research Foundation (KESREF), the Sugar Parliamentary
Committee (SPC), the Kenya Sugar Millers Association (KESMA), the Sugar
Arbitration Tribunal (SAT) and the Out-grower Institutions (OIs). However, the
outcome has not been very encouraging so far.
1.3 The Problem Statement
South Nyanza (SONY) Sugar Company as an agribusiness firm initiated a
sugarcane contract farming scheme (with out-grower farmers’ scheme) in Migori
District in 1976. The objective was to improve the livelihood of smallholder
farmers in the greater Migori District (GOK Report, 2009). SONY Sugar Company
is the second largest public sugar producing company in Kenya, supplying 15% of
all the sugar in the country. The company is only second to Mumias Sugar
Company that supplies 53% of all the sugar produced in the country. However,
there is a concern that participation by smallholder sugarcane farmers in the
SONY Sugar Company contract scheme has been declining, while the non-
contract farming has been on the rise over the last ten years prior to the study.
The company has therefore experienced production shortfalls, with sugarcane
delivery to the factory by contracted farmers declining from 603,646 tonnes of

18
sugarcane (tc) in 1998/99 to 464,754tc in 2011/12 against a target of 651,600tc;
while the non-contract farming has been on the rise from 45,133tc to 81,338tc
over the same period.
The continuous production shortfalls would hurt the sugar industry in Kenya; since
the country is already a net importer of sugar to meet the domestic consumption
(see Appendix.11). Furthermore, Kenya has been surviving because of
successfully negotiating for an extension of COMESA sugar imports safeguard.
However, the safeguard measures will be coming to an end in February 2014, by
which time the industry is expected to have restructured and become globally
competitive (see Appendix.9).
There are two types of sugarcane production and marketing channels for SONY
sugarcane farmers. The formal system where SONY contracted growers produce
sugarcane and market through the SONY Sugar Company channels, and the
informal system where the non-contracted sugarcane is produced and marketed
either to the spot market (jaggery processors) or to the miller through middlemen
or the producers themselves. Figure 1.2 shows the production and marketing
channels for sugarcane farmers in Migori County. The continuous lines indicate
the direction of flow of sugarcane from the growers to the millers and sugar from
the millers to the final consumers in the formal existing production and marketing
system. The broken lines indicate the direction of flow of sugarcane from growers
to the millers and sugar from the millers to the final consumers in the informal
production and marketing system. In the formal marketing system, the sugarcane
is grown by the SONY Sugar Contract scheme farmers who sell the produce to
the company for processing. The company then processes the produce into sugar
which is then either stored in the company warehouses or sold to wholesalers and
retailers. Some traders may be buying from the factory and wholesalers and
selling to neighbouring countries (Informal Cross Border Trade). However, Kenya
is not self-sufficient in sugar production and some sugar is officially imported to
bridge the consumption deficit of about 200,000 tons per year (see Appendix.11).
The retailers pass the commodity to the ultimate consumers.

19
Contracted sugarcane farmers are not expected to deal in the informal marketing
system. However, there is some non-compliance and some SONY contracted
sugarcane is sold to other white sugar millers and Jaggery processors directly or
Figure 1.2 Diagram of alternative and existing production and marketing channels for sugarcane/sugar in Migori District
Sugarcane Producer (Farmer)
SONY contracted
cane 85%
Non contracted
cane 15%
Broker
Factory Stores SONY
Sugar
Company
Other white
sugar millers
Jaggery Millers
Wholesalers
Brokers
Cross
Border
Activitie
s
Retailers
(Supermarkets
, retail Shops,
food stores,
institutions
Farmers
markets,
Food stores
Food
Proc
essor
s
Conventional marketing channels (SONY Sugar Contract Scheme) Alternative marketing channels
T – transaction cost points
Source: Author’s compilation
through brokers. Some non-contracted cane is also sold to the SONY Sugar
Company, other white sugar millers and Jaggery millers, either directly or through
Consumers

20
brokers. The white sugar millers then sell the processed sugar to wholesalers and
retailers who subsequently pass it on to consumers. On the other hand, Jaggery
millers sell the brown sugar in the farmers’ markets, food stores and to food
processors, either directly or through brokers who in turn pass it on to the
consumers.
Several studies have been carried out on contract farming in crop and livestock
production. Past studies on contract farming have been carried out on costs of
production and how they affect the performance of agribusiness firms in
horticultural export crops e.g. mangoes, passion fruits, potatoes, and poultry value
chains (Strohm and Hoeffler, 2006). They generally indicate that contract farming
is an important and successful mechanism in accomplishing several tasks, such
as delivering products as demanded by export markets and high-end domestic
markets. Contractual arrangements assure producers certainty of market outlet,
provision of essential productive inputs, transport facilities and extension services
(Warning and Hoo, 2000). The agribusiness processing firms also provide credit
to producers since the crops that they purchase are costly to produce per hectare
than the traditional crops. The cash crops usually require a large, strict, intensive
and specific input regimes including labour, which may not be met by smallholder
family resources alone (Key and Runsten, 1999). However, some problems have
also been associated with formal contracts. Issues which remain questionable on
contract farming refer mainly to disadvantages to the farmers that are embedded
in the contractual arrangements, e.g., farmers’ loss of autonomy, increased
production risks, and increased market power for the agribusiness firms, thus
leading to reduced producer income (Kirsten and Sartorius, 2002).
However, on the side of smallholder producers, most studies do not point out
much on socio-economic issues that affect the performance of sugarcane contract
farmers. This study adds to the growing body of knowledge by incorporating
participatory and related methods in the evaluation of the factors that influence
contract participation and the impact of contract farming on farm households. The
study focuses on the performance of the SONY Sugar Company sugarcane
contract farming.

21
The study was motivated by the desire to evaluate the perception that SONY
Sugar contract farming was profitable and thus able to attract or maintain
participation in the current economic challenges. The case study evaluated the
factors that influence participation in SONY contract scheme and the impact of
participation on farm households. Available literature indicates that no studies
focusing on the evaluation of farmers’ participation in sugarcane contract farming
and the impact of contract farming on farm households have been carried out in
Migori County.
Given the contradicting views that contract farming can be both beneficial and
disadvantageous at the same time, the extent to which smallholder sugarcane
farmer’s welfare is improved by participating in a contract farming scheme thus
remains debatable. The study sought to contribute to that debate.
1.4 Objectives of the Study
1.4.1 Overall objective
The overall objective was to evaluate the factors that influence participation in a
contract farming scheme and the impact of contract participation on sugarcane
farm households, using Migori County as a case study.
1.4.2 Specific objectives
The specific objectives were:-
(i) To characterise SONY Sugar Company contract farming scheme.
(ii) To identify and evaluate the factors that influence participation in SONY
contract farming scheme.
(iii) To assess the impact of SONY contract farming on the farming
households.
1.5 Hypotheses tested The following hypotheses were examined and tested:
(i) H1: Household and institutional characteristics have no significant
influence on participation in the SONY Sugarcane contract farming
scheme.

22
(ii) H2: There is no significant difference in household and agricultural assets
between contract and non-contract farming households.
It is thus hypothesised that household and institutional characteristics influence
the farmer’s probability of participation or non-participation in the SONY Sugar
contract scheme. It is also hypothesised that contract farming affects farming
households’ welfare.
1.6 Justification of the Study
Contract farming is a significant feature of the sugar industry in Kenya. Therefore,
understanding the factors that influence contract sugarcane production is
important.
Sugarcane contract farming is seen as a means of promoting sugar development
in Kenya. However, the Kenya Government’s effort to promote the development
of the sugar industry through contract farming in the sugarcane producing zones
has not been successful. The area under sugarcane production has not increased
to expected levels that would meet the consumption demand. The poor
performance of the sugar industry has been manifested in persistent production
shortfalls since 1993 and sugar imports in Kenya still represent a fairly significant
proportion of domestic consumption (see Appendix.11). Foreign exchange on
sugar imports could be saved, if the country produced enough sugar to meet
domestic demand and even have surplus for export.
The SONY Sugar Company contributes 15% of the sugar produced in Kenya and
is only second to Mumias Sugar Company that contributes 53% (GOK, 2007).
The performance of the company therefore has a significant impact on the sugar
industry in Kenya. However, the company has been experiencing production
shortfalls, with sugarcane delivery to the factory by contracted farmers generally
declining between 1998/99 and 2011/12 (see Appendix.3). Understanding the
factors that influence participation in sugarcane contract farming is expected to
shed some light on the causes of this declining trend in sugarcane deliveries to
the SONY Sugar Company by the contracted sugarcane producers. The results
are expected to be useful to policy makers when deciding on how to formulate
23
appropriate policy interventions that can promote the establishment of strong and
viable contract farming schemes. They can also help the farmers and industry
players to make participation decisions from an informed point of view.

24
CHAPTER TWO
LITERATURE REVIEW
2.1 Introduction
Contract farming has been defined as an “agreement between farmers and
agribusiness firms for the production and supply of agricultural produce under
forward agreements, frequently at predetermined prices” (Eaton and Shepherd,
2001). Contract farming has also been described as a way of sharing risks
between producers and agro-processing firms as a condition to avoid market
failure (Hardaker, Huirne, Anderson, and Lien, 2007). Contract farming is thus an
institutional arrangement that is expected to minimize transaction costs (Dorward,
2001; Kirsten and Sartorius, 2002; Da Silva, 2005).
Recent literature on Transaction Cost Economics (TCE) has helped to understand
the advantages of contracting and integration over the more traditional spot
markets and commodity brokers (Sykuta, Klein, and Harvey, 2007). Transaction
costs are incurred whenever goods and services are transferred (by means of
technology) between individual entities or groups through contracts. Transaction
Costs Economics helps in understanding how to minimize these costs. TCE can
be applied to explain contractual practices in both formal and informal marketing
arrangements in virtually all agricultural commodities.
Transaction Costs Economics (TCE) is an offshoot of the New Institutional
Economics (NIE) and Economics of Organization literature. New Institutional
Economics was first stated by Coase (1937) in his article titled “The Nature of the
Firm” where he suggested that market exchange is not costless and may involve
costs, such as information search, bargaining and signing of contracts. He
outlined the importance of transaction costs, explaining that firms emerge to
economize on transaction costs of market exchange. Many agro-processing firms
use vertical integration to avoid pitfalls of transaction costs, such as poor quality,
highly priced produce, farm supplies not readily available, and fluctuating yields
and quality.

25
Agricultural enterprises are typically risky businesses, and farmers engage in
contract farming to share and cope with risks more effectively (Hardaker, Huirne,
Anderson, and Lien, 2007). Contractual arrangements facilitate distribution of
risks between agro-processing firms and farmers. The agro-processing firms bear
the risks associated with marketing while the farmers bear the risks of production,
depending on the preconditions of the contractual arrangement. The farmers
commit themselves to produce and sell a specified amount of commodity, while
the agro-processing firm commits itself to buy at an agreed price. The result is a
steady flow of raw materials at predetermined prices for the agribusiness firms,
thus facilitating optimal plant capacity utilization.
2.2 Theories of contract farming and associated costs
Available literature, as reviewed later on, shows that the costs of contract
participation by agribusiness firms and smallholder farmers can be explained
through governance costs, transaction costs, incomplete contract and principal–
agent/incentive contract theories. These concepts are explained hereafter.
2.2.1. The governance costs/transaction costs concepts
Governance structures have been defined as mechanisms mainly for settling ex
post (i.e., after contract agreement) disputes. The theory predicts that forward
looking agents adopt the governance structures that are best suited to handle the
transaction(s) they carry between them (Williamson, 1996). Hendrikse (2003)
defines a governance structure to mean the set of rules by which an exchange is
administered. Contractual relations are therefore embedded in governance
structures (Foss and Klein, 2008). Governance structures can be seen as a
continuum ranging from spot market to hierarchy (or vertical integration) in which
contracts are a typical hybrid governance structure (Menard, 2004).
Whereas the governance costs rise with complex and hierarchical governance
structures, TCE explains how economic actors choose from a set of feasible
institutional alternatives and governance structures that safeguard their
transactions at the lowest costs (Bijman, 2008). Governance costs include both
transformation and pure transaction costs. Governance costs therefore refer to all

26
costs incurred during a transaction in a specific contractual arrangement, and they
vary across different arrangements.
Transaction costs have been defined in several ways. However this study adopts
the widely accepted definition that classifies transaction costs into observable and
unobservable costs (De Silva and Ratnadiwakara, 2008). Observable transaction
costs are visible when an economic exchange takes place. They include tangible
costs like transport, handling, packaging, storage, spoilage, etc. Unobservable
transaction costs include intangible or fixed transaction costs like the cost of
information search, bargaining, screening, monitoring, coordination, and
enforcement of contracts. According to Kirsten and Vink (2005), transaction costs
can also be described as “costs of running an economic system”. They are costs
other than the money price that are incurred in trading or exchanging goods and
services. On the other hand, transformation costs are costs of transforming inputs
(e.g. labour, capital, land and / or raw materials) into outputs.
TCE provides literature that explains the importance of choice of contracts
between market participants. Transaction costs can determine the ease or
difficulty with which contracts are made. Therefore, TCE helps in understanding
the efforts made by organizations to minimize transaction costs. Issues which
arise are incomplete contracts or “hold-up” problem, the “principal – agent
problem”, and the adverse selection problem. The concepts are described below.
2.2.2. The Incomplete Contracts Concept
Studies on contract theory show how economic actors often engage in contractual
agreements generally often with asymmetric information. Many economists agree
that actual contracts are or appear quite incomplete, being vague or silent on
important variables. However, there is no clear definition of what really constitutes
an incomplete contract (Schmitz, 2001). The incomplete contracts problem refers
to the design of contracts when important variables, such as quality of traded
goods, cannot be observed or verified by a court of law effectively, thus making
them “incomplete contracts” (Foss and Klein, 2008). Wilkinson (2005) argues that
although contracts are an important method of conducting business, they are
essentially incomplete due to the problem of bounded rationality (i.e., it is

27
impossible to foresee every future contingency) of the contracting parties and
uncertainty about the future states of nature. This implies that SONY sugar
company as an agribusiness firm may have excellent knowledge of markets than
smallholders and thus may benefit more from the contract.
2.2.3. The principal–agent, incentive contracts concept and agency
theory of exchange
The incentive contracts concept refers to a situation where a principal that is not
able to observe an agent’s action can induce the agent to take the right action by
designing an incentive scheme. This may induce the agent to work hard at
maximizing whatever the principal wants maximized (Omar, 2002). It also refers
to the problem of the principal motivating an agent to take a particular course of
action which is not observable. Contract farming can also be considered a
“Principal – Agent” problem because the buyer (the principal) and the farmer (the
agent) cooperate to produce a crop (Warning and Hoo, 2000). The Agency theory
of exchange on the other hand, is based on the idea that a farmer, being an
agent, may acquire private benefits in exchange for not “holding up” a trading
partner and this improves the latter’s incentive for transaction specific
investments. A “hold up” problem exists where two parties (such as a farmer and
a manufacturer) may be able to work most efficiently by cooperating, but refrain
from doing so due to concerns that they may give the other party increased
bargaining power, and thereby reduce their own profits. Therefore, contract
farming should thrive well when incentives for both the principal [SONY Sugar
Company] and the agent [the Out-grower farmer] exist.
2.3 Agricultural contracts in Africa
According to Eaton and Shepherd (2001), agreements usually in the form of a
written contract or verbal understanding, cover responsibilities and obligations for
each party, the manner of enforcing the agreement, and the remedial measures to
be undertaken if the contract breaks down. Different contractual arrangements
exist for various agricultural commodities in Africa. Contract farming is emerging
as an important linkage between smallholder farmers and markets by providing
services, such as knowledge of potential markets, technical advice on grades and

28
standards, and credit to acquire the necessary equipment and production inputs
to increase farmer income (Mwape, Abaru, and Place, 2005). For example, a
study in Uganda indicated that hot pepper farmers engaged in contract farming in
Mukono District, obtained relatively higher incomes than their counterparts who
were not involved in contract farming (Nalyongo and Abaru, 2004). Well managed
contract farming offers a potential solution to some of the development problems
of the agricultural sector in Africa.
Contracting can act as an institution to overcome barriers of entry to agribusiness
industry by smallholder farmers, but certain measures need to be undertaken to
ensure contract enforcement and to reduce transaction costs (Sartorius, Kirsten,
and Masuku, 2003). Despite the many benefits in contractual marketing
arrangements, often some contractual problems (such as high default on
contracts by both sides) arise. Farmers at times avoid meeting their contractual
obligations through side-selling to competing buyers and defaulting on
repayments of their loans, and this is particularly common in cotton and
horticultural production (Mwape, Abaru, and Place, 2005). Other cases of default
are when farmers fail to conform to agreed-upon quality standards and/or
quantities of produce, or when they make deliveries that did not follow the
recommended practices. On the other hand, contractors default when they fail to
pay the agreed price and/or buy less than the agreed quantity. Other contractual
problems include exploitation of farmers noted particularly where the farmers are
not well organized and have no alternative buyers or cannot easily change the
crop, such as sugarcane or tree crops (Mwape, Abaru, and Place, 2005).
Exploitation includes unilaterally changing the agreed standards, or giving the
products lower grades so as to pay less, overpricing of inputs, including transport,
and over-charging interest.
The major challenge for the agribusinesses and producers that results in higher
transaction costs is enforceability due to weak contractual laws (Jaleta,
Gabremedhin, and Hoekstra, 2009). Where there are laws that protect the
agribusinesses and farmers, the former are usually reluctant to resolve disputes
through the courts because it may be costly. Sometimes, cases take too long to
be administered through the courts. In such cases, the arbitration of contract

29
farming disputes becomes difficult and agribusiness firms are likely to exclude
potential investors in contract farming. The principal disadvantage associated with
contract farming in developing countries is the high level of transaction costs,
because supply arrangements involve large numbers of small scale farmers that
are spatially dispersed, thus requiring high levels of inputs and support (Kirsten
and Sartorius, 2002).
It is important that farming contracts, whether written or oral, comply with the
minimal legal requirements that apply in a particular country, taking into account
the prevailing practices and societal attitudes towards contract obligations
(Likulunga, 2005). Studies in Africa indicate that contractual problems are
increasingly being experienced, for example in Zambia; weaknesses of contract
enforceability when the contract is breached are common for most commodities
due to the long litigation process (Likulunga, 2005). In Malawi, contractual
problems caused by weak regulatory and legislative environment have resulted in
high levels of default (such as side-selling of contracted tobacco to intermediate
buyers), poverty, and food insecurity (MASIP Secretariat Report, 2005).
In Ethiopia, diversionary sales (side-sale of output) particularly for food crops,
also due to non-existent or weak contract enforcement mechanisms resulting in
higher transaction costs of trade, have been reported (Jaleta, Gabremedhin, and
Hoekstra, 2009). In South Africa, a majority of commodities appears to be
procured by some form of production or marketing contract. For instance,
according to Sartorius and Kirsten (2006), 100% of the supply of tobacco,
sugarcane, cotton, timber, meat, poultry and eggs in South Africa is secured by
some form of contracting, while, 78.5% of all fruit and vegetables processed are
procured by some form of contracting. However, contractual constraints are still
experienced even in South Africa, thus compromising price, yield and quality of
produce (Sartorius and Kirsten, 2006).
2.4 Agricultural contracts in Kenya
Contract arrangements in Kenya have been widely used in the horticultural
industry, smallholder tea, tobacco, sugarcane, and dairy industries. The
Horticultural Crop Development Authority (HCDA) has facilitated private sector

30
development through a broad range of institutional and marketing arrangements.
The arrangements include wide use of contract farming in which traders provide
funding, price information and overall marketing services to farmers (Jaleta,
Gabremedhin, and Hoekstra, 2009).
Govereh, Jayne, and Nyoro (1999) found evidence of positive spill over from out-
grower arrangements among sugarcane farmers in Bungoma/Kakamega Districts.
The study found that household participation in out-grower schemes was
positively correlated to farmers’ access to inputs on credit. This had a significant
positive effect on food crop productivity.
Sautier, Vermeulen, Fok, and Bienabe, (2006) describe the Kenya export-oriented
horticulture (fruits, vegetables, flowers) based on contract farming a “success
story”. Furthermore, diversification towards horticultural production in Kenya has
resulted into the steady growth of the export market (English, Jaffee, and Okello,
2004; Minot and Ngigi, 2004).
Tschirley, Ayieko, Muendo, and Weber (2004) study the competitiveness of
Kenya’s domestic horticultural production and marketing system. They note that
the effectiveness of contracts varies under different market settings and different
market agents, and that the mere presence of contracts does not assure the
sustainability of the trade relationship. They also note that as an institutional
mechanism, contract farming requires a continuous adjustment process,
according to the characteristics of the agents and the exogenous conditions they
are facing. Non-price aspects of contracts, such as the frequency of transactions,
promissory of back payment, input supply and technical assistance, have positive
production efficiency and enhance sustainability of cooperation. Tschirley, Ayieko,
Muendo, and Weber (2004) recommend that public policies and equity schemes
must play a role in order for contract farming to become a suitable institution with
positive results in terms of equity, efficiency and sustainability.
Gioe (2006) indicate that the well developed and dynamic private sector in Kenya
has profitably marketed a wide range of horticultural products to diverse
international markets through contract farming. The study notes that the minimal

31
government intervention has facilitated the sectoral growth through infrastructure
development, incentives and support services, even though the sector still faces
many challenges, such as expensive and difficult transportation, expensive
telecommunication and insufficient supply of electricity. The challenges also
include stringent phytosanitary requirements in the export market and other public
and private standards that are increasingly pushing small rural farmers out of the
horticultural value chain.
Crawford, Jayne, and Kelly (2006) examine out-grower or cooperative programs
with interlinked input–credit-output market transactions and give examples of
coffee cooperatives and sugarcane out-grower schemes in Kenya under this
model. The study found that interlinked market transactions can improve
coordination and reduce risks, just as an effective state-led input-credit market
system can. The observation is supported by studies carried out by Govereh and
Jayne (2003) as well as Jayne, Yamano, and Nyoro, (2004). However, the
sustainability of the system requires that the out-grower company represents
farmers and their interests. In cases where the sugarcane out-grower companies
have vested interest, other than the farmers, management and operating costs
structures can become uncompetitive and erode the incentives for farmers to
remain in the scheme. The out-grower schemes work better with high value crops
because (a) profitability is more apparent to farmers and (b) enough income is
generated to cover costs of inefficiency and still leave enough surpluses to ensure
that farmers get a reasonable return.
Strohm and Hoeffler, (2006) reviews existing literature and current activities
concerning contract farming in five value chains in Kenya i.e. French beans,
mangoes, passion fruits, potatoes and poultry. The report finds that product type,
geographical location, access to infrastructure, socio-economic factors play a key
role in influencing the performance of contract farming arrangements.
In other competing countries like South Africa, sugarcane cultivation is highly
mechanized from planting to harvesting, loading and crushing. Inadequate
mechanization of some operations in Kenya contributes to wastage and efficiency
losses. Nyoro, Wanzala, and Awuor (2001) concluded that the future of

32
sugarcane production in Kenya lies in the reduction of sugar processing costs,
which can be achieved by investing in appropriate technologies that are available
to other competitors, such as Sudan.
2.5 Overall remarks on agricultural contracts
The above review shows that most of the studies have been on transformation
costs, i.e., costs of transforming inputs (e.g. labour, capital, land and/or raw
materials) into outputs. There have been some evaluations of transaction costs in
contract marketing of export horticultural produce. However, the experience
based on studies of high value horticultural export crops cannot be generalized
for the SONY Sugarcane farmers.
The contract farming scheme can be modelled as a principle-agent game in which
the principle say SONY Sugar Company works with the agent say a grower to
produce say sugarcane. The company (SONY) chooses the smallholders with
whom to contract and sets the terms of the contract, while the growers choose
whether to participate. The combination of both choices will define the selection
process for the farming contract. The benefits, whether in terms of improved
welfare for the participants will depend on the contract terms and the socio-
economic characteristics of the growers (Warning and Hoo, 2000). This is what
motivated the researcher to evaluate whether the relationship between SONY
Sugar Company through the contract scheme improves the welfare of the
smallholder farmers and the factors that would constrain farmers from either
remaining or exiting from the scheme.
2.6 Measuring SONY contract participation/non participation decision
The econometric analysis of participation decision was modelled based on
random utility theory. Choice data generated using Stated Choice Methods (SCM)
were analysed using a Random Utility and maximization model (Adamowicz,
Boxall, Williams, and Louviere, 1998). The term Stated Choice Methods refers to
a flexible approach to collecting preference data based on choices and rankings,
whether full or partial from subjects in hypothetical situations (Adamowicz,
Louviere, and Swait, 1998). The decision context and product descriptions are the

33
stimuli, and the individual’s decision (which may be a choice, a ranking, or a
quantity) is the elicited response. In this case, the objective was to face the farmer
as a decision-maker with the choice of whether to contract sugarcane farming
with SONY Sugar Company or not. The study applied the Random Utility model
which has the following advantages (Adamowicz, Louviere, and Swait, 1998):- (i)
control of the stimuli is in the researchers’ hand, as opposed to the low level of
control afforded by observing the real market place; (ii) control of the design
matrix yields greater statistical efficiency and eliminates collinearity (unless
explicitly built into the design); (iii) more robust models are obtained because
wider attribute ranges can be applied than are found in real markets; (iv)
introduction and/or removal of attributes are straight forward, which is difficult to
accomplish in real markets.
Random utility theory was first proposed by Thurstone (1927) as the basis of
models in which consumer judgements and decision making among pairs of
offerings can be explained. Thurstone (1927) argued that consumers try to
choose the offerings they like best, subject to constraints (e.g., income, time) just
as in standard economic theory. The argument was that different probabilistic
choice models can be derived by making different assumptions about the
distribution errors (random component) e.g. a bivariate normal distribution, which
yields the binary probit model. However, consumers may not choose what seems
to the researchers to be the most preferred alternative. Therefore, choice can be
explained by proposing a random element as a component of the consumer’s
utility function (Adamowicz, Louviere, and Swait, 1998), which can be explained
as follows:
Ui = Vi + i,...............................................................................Equation 2.1
where Ui is the unobservable, true utility offering i; Vi is the systematic (i.e. known)
component of utility; and i is the random component. The justification for the
random component is that the researcher may omit variables or commit
measurement errors, which may not attract the particular decision of the
consumer. This random component allows the researcher to make probabilistic
statements about consumer’s behaviour. Therefore, the probability that a

34
consumer will choose the i-th offering from some set of competing offerings, say
C, can be modelled as follows:-
P(i│C) = Pr[Ui > Uj] = Pr[(Vi + i) > (Vj + j)], j C ............. Equation 2.2
2.7 Application of Models in the Current Study
This study evaluated the factors that influence participation in SONY contract
farming scheme and its impact on farm households. A probit analysis and
statistical analysis of data collected through participatory research procedures
were employed in this study.

35
CHAPTER THREE
METHODOLOGY
3.1 The Study Area
This study was undertaken in Migori County which is located in the South
Western part of Kenya. The county consists of seven constituencies, namely
Kuria East, Kuria West, Migori, Nyatike, Uriri, Awendo and Rongo (see Figure
3.1). The County borders Homa Bay and Kisii Counties to the North; Narok
County to the East. It shares the Southern boundaries with Narok County and the
Republic of Tanzania. On the Western boundaries are Homa Bay Counties and
Lake Victoria. The county covers an area of 2,597km2 of which 475km2 are
composed of Lake Victoria.
The climate is of mild equatorial type, modified by relief, altitude and proximity to
Lake Victoria. The altitude ranges from 1,135m at the shores of Lake Victoria to
1700 m (PRSP Report, 2004). The County experiences bimodal rainfall pattern
ranging from 700 mm to 2,200 mm per annum (PRSP Report, 2004). The long
rains commence in February/March and continue up to June. The short rains start
in July/August and end in November. Maximum temperature range between 26o C
and 31 o C, while minimum temperature range 14 o C to 16 o C. The soils range
from deep red clay loam soils to black cotton soils towards the lake. Therefore the
climate and soils are favourable for the cultivation of sugarcane, which is the main
industrial crop. Other major crops are tobacco, cotton, maize, and beans (PRSP
Report, 2004). The land tenure is mainly freehold and each landowner can be
granted a freehold title deed in respect of their land parcels.
According to the national census 2009, the population of the County stands at
1,028,579 persons (KNBS, 2010). The population density is 353 per Km2 and
43% of the population live below the poverty line. The strengths of Migori County
include natural resources such as gold and water (Kuja and Migori rivers). The
main economic activities include agriculture, fishing, manufacturing and mining.

36
Figure 3.1 Geographical boundaries of Migori County
Source: (CRA, 2010)

37
The immigration has contributed to the rising population trend which is attributed
to the good agricultural soils; employment opportunities, e.g., the SONY Sugar
Company Factory; the vibrant fishing industry; cross-border trade; and heavy land
pressure in the neighbouring districts (PRSP Report, 2004).
Specifically, the study concentrated on the South Nyanza Sugarcane belt where
the SONY Sugar Company operates a contract scheme. The scheme is
categorized into seven sectors (1-7) depending on the distance to the factory and
is managed through sector offices. However, the study only concentrated on
Migori County covering sectors 1-4 where the SONY sugar company mainly
operates.
3.2 Theoretical Framework and empirical specification
The theoretical framework for analysing contract farming was based on random
utility theory. The probit model was employed to analyse the probability of
participating in the SONY contract scheme and the effects on household and
agricultural assets.
The nature of sugarcane contract farming in Migori County can be understood
within the framework as elaborated in Williamson (1991), which describes
different types of contractual forms. These contractual forms range from spot
markets through bilateral contracts to vertical integration with hybrid and
hierarchical forms of governance. Williamson (1996) further argues that if
economies of scale and scope were held constant, the producers and traders
would not only behave in an economically rational manner, but that they would
also embrace cost-minimizing contract governance structures. The contractual
form with the lowest governance costs (or with the highest ‘transaction margin’ of
revenue over governance costs), would be preferred (Fundira, 2003). In this
study, the farmers are faced with the choice of a governance structure which
maximizes their utility. In other words, the farmers are faced with the choice of
whether to enter into contract farming with SONY Sugar Company or not
depending on whether this arrangement maximizes their utility.

38
Assuming that the farmers are risk-neutral in deciding whether to contract or not,
and following Faltermeier and Abdulai (2009), the farmers would compare the
utility derived from participation in SONY Contract scheme, denoted as
U*(Cagainst the utility derived from non-contract participation, denoted as
U*(NC Participation then takes place if U*(CU*(NCThe utility derived from
participation can be said to be related to a set of explanatory variables (Z) as
follows:
Uj* zi + i , ...........................................................Equation 3.1
where is a vector of parameters, while the error term with mean 0 and
variancetakes care of the measurement errors and unobserved factors. The
variables Z are the factors influencing participation in the contract scheme.
Participation or non-participation in the scheme is observable but the utility
derived is not observable. This is represented by Dj = 1, if the farmer participates
in the scheme and 0 otherwise i.e. Dj= 1 if U*(CU*(NCand Dj= 0 if
U*(C≤U*(NCrespectively.
The probability of participation in the scheme is then represented as follows:-
Prob (D=1) = Dj= 1 if Uj*(CUj*(NC
= Pr(i > - Izi ) = 1- F(- Izi ) ......................Equation 3.2
for the jth farm household where F represents the cumulative distribution function
for . To link the participation decision, it is assumed that farmers are risk-neutral
and that they will go for a governance structure which yields higher utility i.e. the
farmer will participate in contract farming if D*j = U*j(CU*j(NC
Modelling the probability of participation and the impact of participation on
household wealth
A probit model was used to estimate the probability of participation. From
equation 2.1, the utility derived from participation (U*i) was not observable. Only
the choice of participation or non participation in the scheme was observable, and
this can be represented by a latent variable D*j. The index function to estimate
participation in contract farming, assuming a risk-neutral farmer, can be
expressed as follows:-

39
D*j =Xj + j (j= scheme participation, non scheme participation)
Where Dj = 1 if U*j > 0 and Dj = 0 if U*j ≤ 0....................Equation 3.3
D*j is a latent variable which denotes the difference in utility between participating
in contract farming U*(Cand the utility from not participating U*(NCThe farmer
will participate in contract farming if D*j = U*j (CU*j (NCThe term Xj
provides an estimate of the difference in utility from participating in contract
farming U*j (CU*j (NC using the household characteristics, Xj are the
independent variables which explain the participation decision, is a vector of
parameters to be estimated , and j is the error term with ~ N (0,).
Thus the relationship between participation choice and household wealth (Yi) can
be analyzed through the reduced form specifications 3.3 and 3.4:
Yi = XI + i ,.......................................................................Equation 3.4
Where Yi denotes the household wealth, XI is a vector of explanatory variables
consisting of household characteristics and participation choice, is the error
term with ~ N (0, ). From equation 3.3 and 3.4, the core equation to estimate
the impact of participation in the contract scheme on household wealth (Yi) can
thus be specified such that:
Υi = βΧi + δDi + ui.................................................................Equation 3.5
Di = 1 if D*i > 0 otherwise D*
i = 0
where,
Υi is the indicator of welfare (household and farm assets); Χi the factors assumed
to influence household wealth; Di a dummy for participation or non participation
(Di =1 for participation in the SONY contract scheme and 0 otherwise); β and δ
are coefficients; and Ui the error term.
Model Specification
The probit model used to estimate participation in the SONY contract scheme was
based on the assumptions of equation 2.2 and was specified as follows:-

40
Pr (ci =1│zi) = Ф (βzi)......................................................Equation 3.6
Where Ф denotes the normal distribution, ci indicates participation in the SONY
Sugar Company contract farming scheme, zi is a vector of exogenous
determinants of participation, and β is a vector of coefficient estimates for the zi.
The dependent variable was estimated to evaluate the factors which influence
participation in the SONY Sugar contract farming scheme, which was a dummy
variable equal to 1 if a farmer is contracted with SONY and equal to 0 otherwise.
The regressors were household and institutional characteristics that influence
participation: Gender = dummy variable equal to 1 if a farmer is male, 0
otherwise; Age = age of the household head (years); Risk perception =
willingness to take risks, 1 if willing to take risks, and 0 otherwise; Production
finance = dummy variable equals to 1 if received production finance from a
financial institution in 5 yrs prior to the study, and 0 otherwise; Farm records =
dummy variable equals to 1 if the farmer keeps farm records, and 0 otherwise;
Household size = Number of persons in the household; Farm inputs = dummy
variable equals to 1 if the farmer has received external farm input support, and 0
otherwise; Education = Number of years of schooling of the farmer; Agricultural
assets = Value of agricultural assets owned by the farmer based on purchase
price (Ksh) and straight-line depreciation assumption; House value = Estimated
value of the farmers house based on floor space and construction materials of the
house (Ksh); Farm size = Total farm size of the farmer (ha); and Sector office =
distance between the farmers house and the SONY sugar company sector office
(km) . The results of the probit model estimates are presented in Table 4.27.
3.3 Analytical Framework
The 2nd and 3rd objectives of determining the factors associated with participation
and the effect of participation on household welfare was analysed in three stages.
First, by describing the characteristics of all sugarcane farmers through
descriptive statistics, then comparing key demographic and personal
characteristics of contract and non-contract farmers, and finally analysing the
impact of participation in the SONY contract scheme on welfare through Farmer

41
Group Discussions (FGDs), Key Informant Surveys (KISs) and other participatory
research methods. The details are explained hereafter.
3.3.1. Description of household characteristics of the sugarcane farmers
Data analyses by use of SPSS computer package generated descriptive statistics
for socio-economic characteristics of sugarcane farmers in Migori District,
including means and variances. Descriptive statistics was obtained from a
household survey for both contract and non-contract farmers. The two samples
were pooled due to the small sample sizes, on the assumption that each
explanatory variable for both groups is the same. This was carried out to identify
key variables to compare contract and non-contract farmers. The results are
presented in section 4.2.
3.3.2. Comparing key household characteristics of contract and non-
contract farmers
This analysis addressed the objective of evaluating whether contract farmers
benefit more in terms of household and agricultural assets than non-contract
farmers. A paired sample t-test was used to compare the values of key
demographic profiles and personal characteristics of contracted and non-
contracted sugarcane growers. The SPSS 17.0 software generated the statistics
to enable comparison of the contract and non-contract farmers.
3.3.3. Econometric analysis of participation
This analysis addressed the objective of assessing the impact of participation in
SONY contract farming on household wealth as an indicator of welfare. From the
results of t-test in Table 4.26, the wealth of contract farmers was found to be
significantly higher than that of non-contract farmers. However, the fact that the
growers could still gain improved household and agricultural assets even if they
did not participate in the contract scheme had to be accounted for. As highlighted
elsewhere, a probit model was used to estimate participation in the SONY
contract scheme (seeTable 4.27). Household characteristics were included in the
model to control for observable differences between contracted and non-
contracted farmers, such as differences in farm size, education, and age. The

42
welfare benefits of participation were evaluated through FGDs, KISs, and other
participatory research methodologies.
3.4 Data sources and sampling procedure
3.4.1 Data sources
The study involved parties to the SONY sugarcane contract scheme, i.e.
smallholder sugarcane farmers and agribusiness firms, including SONY Sugar
Company. Primary data was collected using participatory methods and a survey
carried out by the author (see Appendix.10).
The participatory research methodologies applied were the semi-structured
Interviews to collect data from key informants (i.e. Key Informant Surveys, KISs)
in the sugar industry, i.e. scientists, SONY Sugar Company, and other sugar
manufacturers (see Appendix.3, Appendix.5 and Appendix.6). The focus group
discussions (FGDs) were employed to collect data from farmers (see Appendix.7
and Appendix.8). The farmers interviewed were from Awendo, Uriri and Rongo
Districts of Migori County where the SONY Sugar Company mainly operates a
contract scheme.
Secondary Data (see Appendix.1) was collected to supplement the information
collected through field survey. The secondary data was obtained from
organizations involved in sugarcane input supply, produce marketing, government
and private sector support organizations, such as Kenya Sugar Research
Foundation (KESREF), Kenya Sugar Board (KSB), and Kenya Sugarcane
Growers Association (KESGA) (see Appendix.1)
Data on farmer variables included socio-economic characteristics, sugarcane
production, transportation and marketing. Data was also collected from SONY
Sugar Company contract agreement (see Appendix.4), and from SONY Sugar
Company employees and their agents (see Appendix.3). Such data consisted of
organization and support structure of the contract scheme, features of the
contracts, problems encountered in operating the contract farmers’ schemes, and
sustainability of the contract schemes. The data collected from support
organizations (KSB, KESGA, and KESREF) were on the nature and extent of

43
support activities and challenges encountered during the support of contract
schemes.
3.4.2 Sampling procedure
A stratified sampling procedure was used to collect socio-economic cross-
sectional data through a household survey. A preliminary census was carried out
to record all smallholder sugarcane producers in the SONY Sugar belt. From the
scheme, 115 eligible contracted farmers were randomly selected from the list of
24,559 smallholder farmer participants who were registered by the SONY Sugar
Company. The list was provided by planning officers from SONY Sugar Company.
Another sample of 69 non-contracted sugarcane farmers was also randomly
selected from a list of 4,613 provided by the village elders. Thus the total sample
size was 184 farmers.
Data was collected from the respondents in two phases. In the first phase, cross-
sectional data on socio-economic profiles of all the 184 farmers was collected. In
the second phase, a representative sample of 30 sugarcane growers was drawn
from the 184 farmers for focus group discussions and in-depth interviews (see
Appendix.7 and Appendix.8). The purpose was to obtain detailed data on the
nature of contractual arrangement, registration, sugarcane production, incentives,
transaction costs and marketing costs. Data on the benefits of and problems in
input procurement and marketing of the produce were also obtained.

44
CHAPTER FOUR
RESULTS AND DISCUSSION
4.1 Introduction
This chapter begins by presenting the results of the nature of SONY contract
scheme based on secondary data, farmer focus group discussions and face-to-
face interviews with the SONY Sugar Company employees (see Appendix.1 to
Appendix.11). Then it presents the descriptive statistics of combined SONY
contract and non-contract farmers, based on the farm survey carried out by the
author. This survey was carried out to identify key variables to be used in
comparing SONY Contract and Non-contract farmers. The results of the
comparison of key variables of SONY Sugar Company contract and non-contract
farmers using a t-test are then presented (see Table 4.26). Finally, the results of
the econometric analysis of the determinants of participation in SONY Contract
scheme and the impact of participation on household wealth are presented (see
Table 4.27).
4.2 Results on the characterization of the SONY contract scheme
Key industry players: The sugarcane millers involved were SONY Sugar
Company (a government parastatal), Kibos Sugar Company, Kitere sugar mills
and individual sugar millers who crushed sugarcane for jaggery processing.
However, only the SONY Sugar Company operates a farming contract scheme
covering the production, purchasing and marketing of the produce on behalf of
the sugarcane growers. The company provides production inputs on credit to the
contracted farmers and then recovers the loans from the proceeds after harvest.
The contractor’s role also involves the final processing of sugarcane and selling of
the final products to the consumers, either locally or abroad. On the other hand,
the sugarcane farmers comprise of contracted and non-contracted growers. They
are key industry players because they produce the sugarcane crop and sell it to
the processing companies. By the end of financial year 2011/2012, there were
about 29,552 SONY sugar company contracted growers and 5,173 non-
contracted farmers who delivered sugarcane to the factory [464,754 tons and
81,338 tons respectively] (see Appendix.3).
45
The rules governing the sugarcane production and exchange processes were
found to have been set out in the Sugar Act by the government. The growers
have formed Kenya Sugarcane Growers Association (KESGA) to champion their
rights, particularly on the pricing issues. The Sugar Parliamentary Committee, the
Sugar Arbitration Tribunal, and the Kenya Sugar Board are the government
oversight bodies that play a key role in providing regulations that govern
sugarcane production, processing and marketing.
Institutions and their attributes: The contractual arrangements identified in the
sugarcane exchange processes were of formal and informal types. The formal
contractual arrangements were: (a) between the SONY Sugar Company, and the
farmers, (b) between the government and the SONY Sugar Company, and (c)
between the government and the farmers. The formal contractual arrangements
between the SONY Sugar Company and the sugarcane farmers were described
in a contract document signed between the growers and the company (see
Appendix.4). The findings from the analysis of the SONY Sugar Company
contract scheme are presented hereafter.
The SONY Sugar Company/Farmer Agreement [The contract]: The SONY
sugar company contract scheme was found to be a 5 year or 3 sugarcane harvest
agreement, in which the company committed itself to purchase sugarcane from
the farmers, while the farmers committed themselves to grow the sugarcane for
the purposes of selling to the company. The more salient features of the SONY
Sugar Company contract with out-growers and some emerging issues are
highlighted hereafter.
First, the agreement is a 5 year contract covering one plant and two ratoon crop
harvests for which the growers could withdraw by giving the company a two year
written notice. However, the company was entitled to recover all debts arising
from the contractual arrangement before the grower could be discharged from the
agreement. Sugarcane matures in less than 2 years and by withdrawing the
farmer would be disadvantaged since another crop would be due for harvest.
Credit for sugarcane development was extended to the growers by the company.

46
However, according to the contract agreement, the company was entitled to
suspend the provision if at any point the company suspected that the sales
proceeds from the next sugarcane harvest of the out-grower would be insufficient
to reimburse the company.
Sugarcane growing like all other agricultural production exhibits high risks and
uncertainties which the company ought to cover under an insurance scheme on
behalf of the growers. However, the company does not have such a scheme.
During focus group discussions, the farmers indicated that they were bearing all
the transaction costs and risks arising mainly from sugarcane cut but not
transported due to bad roads, spillage during transportation, and losses due to
breakdown of transport machinery or accidents. Furthermore, if the crop was
rejected at the buying point, usually at the reception of the factory gate, for
whatever reason, the company was entitled to return the sugarcane at the Out-
growers expense. The contract document specifies that the company determines
the criteria to reject or accept the sugarcane from the Out-growers of any
sugarcane which has been burnt, is of lower quality (purity below 83%), has been
harvested by persons other than the company or its agents, has varietal
difference from high quality seedcane supplied by the company, and has not been
delivered to the company on the due date. The responsibility of running the
factory operations belongs to the Company. However, the farmers have to bear
any risks in case the factory operations are suspended because of weather
conditions or because of maintenance, replacement or repair of its equipment and
machinery. The company is only required to give one week notice of intention to
stop operating and two weeks’ notice of intention to start routine milling
operations.
The cane agreement specifies that the sugarcane should be weighed on arrival at
the buying point, which is at the reception of the factory gate or any other place
designated at the discretion of the company. However, the government
recommends that the sugarcane be weighed at the farm or close to the farms, but
this is not being adhered to (KLR, 2001).

47
The Law provides for the sugarcane farmers to form Out-grower institutions to
take care of the farmer’s interest and coordinate production of sugarcane through
collective action (KLR, 2001). Collective action is the voluntary action taken by a
group to achieve common interest and the members can act directly on their own
or through an organization (IFPRI, 2004). Through collective action, reliable
linkages are formed between the farmers and the Company which have a
potentially high impact on household welfare (Ouma, Jagwe, Obare, and Abele,
2009). To this end, the farmers in Migori County formed SONY Out-growers
Company (SOC). However, the Company collapsed due to mismanagement, thus
potentially increasing the farmer’s transaction costs, individual risks and
weakening their position in negotiating processes to protect their interests.
The agreement recognizes the role of government as a regulator and allows for
the termination of the SONY Sugar Company Contract in the event that the
government imposes conditions or decrees that are inconsistent with the terms of
the contract. In that case, the parties to the contract would be required to modify
the agreement terms, as may be recommended by a government appointed
agency or court of Law.
By this contract, the growers are also required to take responsibility for all
equipment, machinery, staff and labour for operations performed by the Company
on their plots and the company is the sole judge to determine the operational
costs to charge the growers. In the event that the growers are unable to carry out
land preparation, plant and maintain the sugarcane crop in the contracted plot
and as required, the company has the option of carrying out all or any operation
which the company considers necessary and then deduct the costs of the extra
operations from the payment made for the Out-growers’ sugarcane harvest. The
company also extends production credit and solely determines the credit interest
rate to be charged. The credit interest is deducted from the Out-growers first cane
harvest.
From focus group discussions, it was indicated that the price for the value of the
Out-grower’s sugarcane would be officially fixed by the government. According to
the agreement, the value of the Out-grower’s sugarcane is also supposed to be

48
paid within 30 days of cane delivery to the factory. However, the law requires that
payment for sugarcane delivered should be effected within fourteen days of
delivery of the cane and that any delivery thereafter, attracts an interest at the
rate of twelve per cent per annum (GOK, 2011).
It is the responsibility of the Out-growers to maintain sugarcane plots to ensure
satisfactory yield of sugarcane. On the other hand, the company is supposed to
supply all goods and services specified in the agreement at a fee. The fee
charged is at the discretion of the company. A penalty fee for salvaging the crop
(i.e. compulsory weeding) is charged where the Out-growers fails to carry out the
weeding, and this is deducted from the value of the Out-growers produce, after
notifying the defaulter by hand delivery or through a registered mail within 7 days
of such notice. The company also has the discretion of charging the cost of any
other administrative and overheads from work, goods and services rendered to
the contracted Out-growers, but this is not predetermined or fixed in the
agreement to enable the growers to know the costs. Again, the company is only
required to notify the Out-growers at least 7 days before the proposed charges
are due to take effect.
The area the Out-growers commit for sugarcane production is predetermined and
it is upon the contracted farmers to clear such areas for planting within 6 months
from the date of signing the contract. The grower is also obliged to plant the high
quality seed cane which is delivered at the plot or near the plot, depending on
access conditions (roads). During focus group discussions, the farmers said that
at times the cane is delivered far away from the plot, and the farmers have to
incur extra transaction costs to deliver the cane to their plots.
According to the agreement, the Out-growers are not supposed to dispose of
contracted sugarcane to any other person without consent from the company, but
defaulting farmers occasionally sell their sugarcane to the syndicate groups or for
jaggery processing. As such, the company is under constant threat from the
farmers and other competitors.

49
The Out-growers or their representatives are supposed to witness the condition of
the sugarcane at the time of delivery and obtain the net weight of the cane
delivered and accepted by the company. The company employees interviewed
indicated that more often the growers try to avoid transaction costs associated
with witnessing the condition at their own risk and end up complaining of faulty
weighing and weighing machines later.
It is the discretion of the company to determine when to harvest, load and
transport sugarcane to the factory and also the cost of operations to deduct from
the sugarcane payment. Due to the threat of “poaching” by jaggery processors,
the syndicate traders and other milling plants, and especially when there is a
shortage of sugarcane, there is a tendency for the company to harvest underage
sugarcane. The farmers perceive this as a loss since underage sugarcane weighs
much lower than mature cane.
The company cultivates and harvests the sugarcane in blocks. Therefore a field
not harvested in time may hinder access to other plots. According to the contract
document the company may cut any portion of cane where the Out-grower fails to
harvest the sugarcane at the company appointed time, to provide access to other
Out-grower’s plots and not be liable to any loss or damage. The Out-growers bear
the costs.
When the land is under contract, the grower is not allowed to assign the land to
any other activity without the consent of the company. This implies that once the
Out-growers commit their land for contracting, it may not be possible to diversify
through intercropping with other crops without the company’s consent. During
focus group discussions the farmers were of the opinion that they should be
allowed to intercrop with low canopy crops while the sugarcane canopy was still
low to maximize on their land by harvesting a second crop.
Dispute resolution in the agreement is to be made through a single arbiter
appointed by the Chairman of the Law Society of Kenya in accordance with the
provisions of the Arbitration Act Chapter 49 of the Laws of Kenya. However,
enforcement of these laws has not been easy due to the side-selling (“poaching”)

50
problem. The contractual arrangements rely more upon threat of termination of
the contract and court action than verification by a third party. As such, trust still
plays an important role to ensure success of the contractual relationship.
Fafchamps and Minten (1999) conclude that trust based relationships can be a
dominant contract enforcement mechanism.
Activities and their attributes analysis: The input and product markets were
linked in the provision of inputs in an arrangement expected to guarantee credit
repayment for SONY Sugar Company. These “inter-locking” exchanges
minimised enforcement costs and were scale neutral in the sense that all farmers,
regardless of their status, had equal access to the required inputs, as long as they
were registered as contracted farmers. The inputs were supplied by the company
on loan to guarantee yield and quality. Arguably, economies of scale were
achieved in the purchase of inputs in bulk by the sugar company, which were then
distributed to farmers.
Post harvest handling and exchange processes: The contracted farmers were
registered according to zones. This was done to achieve joint operations where
all equipments are moved to one zone to facilitate cultivation, harvesting, loading
and transportation to the factory to reduce transaction costs. After harvesting, the
company provides specialized sugarcane transport facilities to avoid spillage and
sugarcane losses. The special transportation trucks for sugarcane delivery
require considerably high investment. The company transports the sugarcane as
part of the services provided to farmers at a cost.
The study found that the contracted sugarcane farmers were experiencing a
number of problems including high transaction costs arising from poor contract
terms and conditions. They coped with some of these problems by “side-selling”
their sugarcane to SONY Sugar Company competitors.
4.3 Socio-economic characteristics of sugarcane growers
The results from the household survey on socio-economic characteristics of
sugarcane growers in the study area are presented and discussed below.

51
Table 4.1 presents results on the gender of the respondents and shows that the
majority were males (79.8%); the rest were females.
Table 4.1. Gender of respondents (farmers)
Frequency Percent
Male 146 79.8
Female 37 20.2
Total 183 100.0
Source: Author’s compilation
Table 4.2 presents the marital status of the respondents. With regard to the
marital status of the respondents, the majority (85.2%) were married, while 10.4%
were single, and 3.8% were either divorced or widowed.
Table 4.2. Marital status of respondents (farmers)
Frequency Percent
Single 19 10.4
Married 156 85.2
Divorce 1 0.5
widow(er) 6 3.3
Missing 1 0.5
Total 183 100.0
Source: Author’s compilation
Table 4.3 presents the age of the respondents. The table shows that 21.7 % of
Table 4.3. Age of the respondents
Frequency Percent
≤30yrs 40 21.7
31-40yrs 60 32.6
41-50yrs 51 27.7
51-60 10 5.4
≥60yrs 21 11.4
Missing 2 1.1
Total 184 100.0
Source: Author’s compilation

52
the respondents were of age 30 and below, 32.6% were between 31 and 40 years
of age, 27.7% were aged between 41 and 50 years, 5.4% were aged between 51
and 60 years, and 11.4% were of age 60 and above. About 1.1% did not respond.
Therefore, the majority of the respondents were above 30 years old. Generally,
the majority of the interviewed farmers (87.4%) were in the productive age of
below 60 years of age.
Table 4.4 presents the number of years that the respondents had lived on their
farms and shows that the majority of the respondents (89.1%) had lived in their
area for more than 20 years, with 6% for 11 to 20 years. About 2.7% had lived in
the area for less than 10 years and 2.2% did not respond to this question.
Therefore, the majority of the respondents knew the place well and could give
reliable information as sought by the study.
Table 4.4. Years the respondents have lived on the farm
Frequency Percent
>20 years 164 89.1
11 - 20 years 11 6.0
<10 years 5 2.7
Missing 4 2.2
Total 184 100.0
Source: Author’s compilation
Table 4.5 presents the total area of land cultivated by the respondents and shows
Table 4.5 Total area of the farm (hectares)
Frequency Percent
0.1 to 5 127 69
5.1 to 10 41 22.3
10.1 to 15 5 2.7
15.1 to 20 2 1.1
Above 20 7 3.8
Missing 2 1.1
Total 184 100
Source: Author’s compilation

53
that 69% of the respondents’ land ranged from 0.1 to 5 hectares, while 22.3% was
between 5.1 and 10 hectares. About 2.7% and 1.1% was between 10.1 and 15
hectares and 15.1 to 20 hectares respectively and 3.8% was above 20 hectares.
Therefore, the farmers had enough land to cultivate sugarcane.
Table 4.6 presents the results on the ownership of land cultivated by the
respondent. It shows that 67.9% of the respondents were the owners of the land,
30.4% were children of the owner of the land, and 1.1% of the respondents were
tenants while 0.5% did not give their response to the query.
Table 4.6. Land ownership
Frequency Percent
Owner 125 67.9
child of the owner 56 30.4
Tenants 2 1.1
Missing 1 0.5
Total 184 100.0
Source: Author’s compilation
Table 4.7 presents the features of the respondents’ house and shows that the
majority of the respondents (80.4%) were staying in semi permanent houses, with
17.9% staying in permanent houses. About 1.6% did not respond.
Table 4.7. Features of landowner’s house
Frequency Percent
Permanent 33 17.9
semi permanent 148 80.4
Missing 3 1.6
Total 184 100.0
Source: Author’s compilation
Table 4.8 presents the age and number of dependants living in the household
based on gender. On the basis of the gender and the number of dependants
living in the household who were less than 15 years old: (i) 52.2% had 1 to 3
dependants who were males, (ii) 29.9% did not have dependants who were

54
males, (iii) 13% had 4 to 6 male dependants, (iv) 4.9% had more than 6 male
dependants, (v) 53.7% had 1 to 3 female dependants, (vi) 28.8% had none, (vii)
13.1% had 4 to 6 females, and finally 4.4% had more than 6 females aged below
15 years living in the household.
On the basis of the gender and the number of dependants living in the household
who were between 15-64 years old: (i) 51.1% had 1 to 3 dependants who were
males, (ii) 34.8% did not have dependants who were males, (iii) 8.1% had 4 to 6
male dependants, (iv) 6% had more than 6 male dependants, (v) 69% had 1 to 3
female dependants, (vi) 21.7% had none, (vii) 7.1% had 4 to 6 females, and finally
2.2% had more than 6 females aged between 15-64 years living in the household.
Table 4.8. Age and number of dependants living in the household by gender
Age
Male Female Male Female Female Male
<15yrs <15yrs 15-64yrs 15-64 yrs > 65yrs > 65yrs
No. Freq. % Freq. % Freq. % Freq. % Freq % Freq %
None 55 29.9 53 28.8 64 34.8 40 21.7 176 95.7 177 96.2
1 to 3 96 52.2 99 53.7 94 51.1 127 69 8 4.3 7 3.8
4 to 6 24 13 24 13.1 15 8.1 13 7.1 0 0 0 0
> 6 9 4.9 8 4.4 11 6 4 2.2 0 0 0 0
Total 184 100 184 100 184 100 184 100 184 100 184 100
Source: Author’s compilation
On the basis of the gender and the number of dependants above the age of 65
years who were living in the household, the table shows that 4.3% of the
respondents had 1 to 3 female dependants living in the household, 3.8% had 1 to
3 male dependants living in the household, while none had more than 3
dependants who were over 65 years old living in the household. 95.7% and
96.2% had no female and male dependants aged over 65 years respectively.
Table 4.9 presents the education level of the male and female household heads.
From the results, most of the female household heads (49.5%) had their highest
level of education as “standard 8 and below” while 22.8% of the female household

55
heads had their education level as “Form 1-4”. The results also show that 15.2%
could not read or write and 8.7% did not respond. About 3.8% had “college
education and above”.
For the male Household Heads, the results in Table 4.9 shows that most of them
(38%) had “Standard 8 and below” level of education, and 23.4% had their
highest level of education as “Form 1-4”. About 17.4% of them could not read and
write, while 11.4% had attended colleges and other institutions of higher learning.
About 8.7% female headed 4.9 male headed households did not respond to that
question. From the above results, it can be argued that the illiteracy rates were
higher in female headed households than in male headed households.
Table 4.9. Education level of household head (female and male)
Female Male
Frequency Percent Frequency Percent
Cannot read and write 28 15.2 32 17.4
Std 8 and below 91 49.5 70 38.0
Form 1-4 42 22.8 43 23.4
Form 5-6 0 0 9 4.9
College and above 7 3.8 21 11.4
Missing 16 8.7 9 4.9
Total 184 100.0 184 100.0
Source: Author’s compilation
Table 4.10 presents the sugarcane production labour distribution by gender and
shows that cultivation was equally done by both men and women (46.7%), while
about half (50.1%) of the respondents stated that cultivation was mainly done by
men. The respondents who stated that this job was mainly done by women were
1.6% while 1.6% did not respond. Cultivation was being done mainly by oxen
plough, which was labour demanding and thus was dominated by men, as found
during focus group discussions.
On planting of sugarcane, the majority of the respondents (51.2%) stated that this
was done equally by both men and women, 44% stated that this was mainly done

56
by men, and 3.2% stated that it was done by women while 1.6% did not respond
to the question. This shows that planting of sugarcane was mainly done by both
men and women, but dominated by men.
Fertilizer application was done by both men and women equally, as shown by the
majority of the respondents (57.1%), while 39.1% of the respondents stated that
this was mainly done by men, and 2.2% stated that this was mainly done by
women. It can therefore be stated that men and women were equally involved in
fertilizer application.
Table 4.10 shows that weeding was equally done by both men and women (63%)
while 34.3% stated that this was mainly a men’s job, with 1.1% stating that it was
mainly a women’s job. This shows that weeding was equally done by men and
women. Weeding of sugarcane was done by women using a hoe, while the men
more often carried out the weeding by oxen, as found out during focus group
discussions.
Table 4.10. Sugarcane production labour distribution by gender
A B C D E F
Men only 50.1 44 39.1 34.3 64.1 22.2
Men and women 46.7 51.2 57.1 63 28.3 12
Women only 1.6 3.2 2.2 1.1 3.8 1.6
Not done 0 0 0 0 0 61.7
Missing 1.6 1.6 1.6 1.6 3.8 2.5
Total 100 100 100 100 100 100
Key:
A= Cultivation
B= Planting sugarcane
C= Fertilizer application
D= Weeding
E= Harvesting
F= Book keeping
Source: Author’s compilation
Harvesting was stated to be a men’s only job by 64.1% of the respondents, but
28.3% said that this is done equally by men and women. About 3.8% were of the
opinion that this was a women’s only job and 3.8% did not respond to the query.

57
The farmers indicated during focus group discussions that cane harvesting was
mainly a men’s activity because it was labour intensive.
Results in Table 4.10 show that book keeping was practised by only 35.8% of the
respondents, while the majority of the respondents (61.7%) did not do any book
keeping. However, it was found that book keeping records were mainly limited to
cane delivery records and no tangible book keeping records were undertaken by
the farmers.
Table 4.11 presents the percentage of respondents that carried out field soil
sampling and shows that the majority of the respondents (90.2%) stated that there
was no field soil sampling carried out, while 5.4% stated that there had been
some field soil sampling. About 4.3% did not respond to this question. During
focus group discussions, the farmers indicated that the few who carried out soil
sampling sought the services from the Ministry of Agriculture extension officers.
Without soil sampling and analysis it would be difficult to assess the right types of
fertilizers to be applied in sugarcane production.
Table 4.11 Field soil sampling and testing for fertility
Frequency Percent
Yes 10 5.4
No 166 90.2
Missing 8 4.3
Total 184 100.0
Source: Author’s compilation
Table 4.12 presents the results on whether fertilizer application was based on soil
sampling and tests.
Table 4.12. Fertilizer application and whether based on soil sample tests
Frequency Percent
Yes 13 7.1
No 158 85.9
Missing 13 7.1
Total 184 100.0
Source: Author’s compilation

58
Table 4.12 shows that the majority of the respondents (85.9%) did not base their
fertilizer application on the testing of soil samples. Only about 7.1% of the
respondents based the application of fertilizers on soil sampling and tests.
Table 4.13 presents the livestock ownership of the respondents and shows that
the majority of the respondents (51.6%) kept livestock, while 41.3% did not keep
livestock. The farmers indicated that the livestock they kept were mainly oxen for
land cultivation, sheep, goats and local chicken.
Table 4.13 Livestock ownership
Frequency Percent
Own livestock 95 51.6
Does not own livestock 76 41.3
Missing 13 7.1
Total 184 100.0
Source: Author’s compilation
Table 4.14 presents results on the sources of financing of farm operations of the
respondents. The table shows that 47.8% of the respondents used their own
savings, 12.5% used funds borrowed from the family members and 10.9% used
proceeds from a business.
Table 4.14. Sources of financing farm operations
Frequency Percent
Savings 88 47.8
Government grant 2 1.1
Sales of assets 12 6.5
Sales of a business 20 10.9
Pensions 4 2.2
Personal borrowing from the family 23 12.5
Informal money lender 12 6.5
Insurance policy 2 1.1
Missing 20 10.9
Total 184 100.0
Source: Author’s compilation

59
Further, 6.5% of the respondents used proceeds from the sale of assets while
6.5% used funds borrowed from informal money lenders. About 2.2% used
Pensions as the source of finances. Equal percentages of 1.1% were for those
who used Government grants and Insurance policies respectively. About 10.9% of
the respondents did not respond to the question.
Table 4.15 presents the respondents’ average annual income from sugarcane.
The table shows that about half (47.3%) of the respondents earned an average
annual income of Ksh. 20,000 shillings and below; 25.5% earned between Ksh.
21,000-100,00 while only about 14.1% earned an average annual income above
Ksh. 100,000 shillings from sugarcane.
Table 4.15. Income from sugarcane
Frequency Percent
20,000 and below 87 47.3
21,000 – 100,000 47 25.5
above 100,000 26 14.1
Missing 24 13.0
Total 184 100.0
Source: Author’s compilation
Table 4.16 presents whether the respondents had off-farm income or not. The
table shows that majority (79.9%) had no off-farm income, while 15.8% had some
off-farm income. The remaining 4.3% did not respond to the question. This
implies that the majority of the respondents relied on income from the farm.
Table 4.16. Off-farm income
Frequency Percent
Has off-farm income 29 15.8
Has no off-farm income 147 79.9
Missing 7 4.3
Total 184 100.0
Source: Author’s compilation

60
Table 4.17 presents the sugarcane farmer’s attitude towards taking risks. The
study found that 53.3% of the farmers were willing to take risks in farming, 30.4%
were not willing to take risks, and 13% were indifferent. About 3.3% did not
respond to the question.
Table 4.17. Willingness to take risks
Frequency Percent
Willing 98 53.3
Indifferent 24 13.0
Not Willing 56 30.4
No response 6 3.3
Total 184 100.0
Source: Author’s compilation Table 4.18 presents the respondents’ channels of information communication on
agriculture and shows that the majority (51.1%) of the respondents received
agricultural information through the village meetings, while 27.1% received it
through the radio channel, 5.4 % through the press and 2.2% through the internet.
About 5.4% did not respond to the question.
Table 4.18. Channels of information Communication on agriculture
Frequency Percent
Village Meetings 94 51.1
Radio Channels 50 27.1
Television Channels 16 8.7
The Press 10 5.4
Internet 4 2.2
Non Response 10 5.4
Total 184 100.0
Source: Author’s compilation
Further analysis of the sources of agricultural information showed that SONY
Sugar Company, locally elected leaders, agricultural input supply firms family

61
members, government agencies, non-governmental organizations (NGOs) and
other cane growers were important sources of information (See Table 4.19).
Table 4.19. Source of information on sugarcane production
Frequency Percent
SONY Sugar Company 51 27.7
Locally Elected Leaders 34 18.5
Agricultural Input Supply Firms 31 16.8
Family members 22 12.0
Government Agencies 1 0.5
NGOs 1 0.5
Other Cane Growers 1 0.5
Non Response 43 23.5
Total 184 100.0
Source: Author’s compilation
Table 4.19 shows that those who regarded SONY Sugar Company as the most
important source of information on sugarcane production were 27.7%, while
18.5% regarded elected leaders to be the most important source of information on
sugarcane production and 16.8% regarded agricultural input supply firms as the
most important source of information on sugarcane production. The rest regarded
family members (12%), government Agencies (0.5%), NGOs (0.5%), and other
sugarcane growers (0.5%) as the their most important source of information on
sugarcane production. This reveals that the farmers receive information on
sugarcane production mostly from the contracting company, followed by locally
elected leaders and agricultural input supply firms.
Table 4.20 presents results on whether the respondent had received any
specialized technical training from SONY Sugar Company. The majority (70.7%)
had not received any and only 15.8% of the interviewed respondents had been
offered some specialized technical training by SONY Sugar Company.

62
Figure 4.1 presents the sugarcane marketing channels during the last 5 years
preceding the study and shows that the sugarcane is marketed mostly through
the contractor, i.e. SONY Sugar Company, Syndicate traders (where traders from
outside the district have formed an association to engage in buying sugarcane
Table 4.20. Whether technical training had been offered by SONY Sugar Company
Frequency Percent
Had Technical training from SONY Sugar Company 29 15.8
No Technical training from SONY Sugar Company 130 70.7
Non response 25 13.6
Total 184 100.0
Source: Author’s compilation
and selling to factories outside the district, most commonly to Kibos Sugar
Factory), brokers who buy contracted and non-contracted sugarcane and sell to
SONY Sugar Company, and finally through the spot market, where traders buy
sugarcane for jaggery processing.
From the study findings, over 50% of the farmers marketed their sugarcane
harvest through SONY Sugar Company. However, it was noted that the
percentage of the growers marketing their sugarcane directly to SONY Sugar
Company has been declining from 68.4% in 2006-2007 to 50% in 2010-11,
Figure 4.1 Sugarcane marketing channels
cane sold 010-
11
cane sold 09-10 cane sold 08-09 cane sold 07-08 cane sold 06-07
12.5% 16.4% 16.5%
10.2% 7.0%
18.8% 20.0% 19.6% 22.0% 22.8% 18.8%
7.3% 2.1% 0.0% 1.8%
50.0%
56.4% 61.9%
67.8% 68.4%
spot market middlemen syndicate contractor

63
whereas that for those who marketed through the syndicate traders generally rose
from 1.8% to 18.8% during the same period. The spot market trading rose from
7.0% in 2006-2007 to 12.5% in 2010-2011. The middlemen more or less
maintained their percentage, averaging about 20.6%.
From the focus group discussions, the farmers indicated that they would sell their
contracted sugarcane to syndicate traders whenever the contractor delayed in
harvesting their produce. The same is true for the spot market where the farmers
found a ready outlet for their produce when needed. However, it was also noted
that even the middlemen would buy sugarcane from the contracted farmers at a
lower price and then deliver and sell it to the contractor, whenever there was a
delay in harvesting.
Figure 4.2 presents the results on harvester of the respondent’s sugarcane and
shows that 38.6% of the respondents were offered harvesting services by the
contractor, i.e. the SONY Sugar Company. The figure also shows that 19.6% was
harvested by middlemen, while 14.7% and 12% were harvested by the syndicate
traders and self respectively. About 15.2% of the respondents did not answer the
question. The results show that the SONY Sugar Company still constitutes the
greatest harvester of the farmer’s sugarcane.
Figure 4.2 Sugarcane harvesters
The recommended duration for the plant crop before it is harvested is 24 months
or less. Table 4.21 presents the actual duration taken for the sugarcane (plant
0
5
10
15
20
25
30
35
40
self syndicate contractor middlemen Missing
12% 14.7%
38.6%
19.6% 15.2%

64
crop) to be harvested. The respondents who had their sugarcane harvested by
SONY Sugar Company in 24 months or less were 57.1%, while 39.7% was
harvested in above 24 months. About 1.1% of the respondents could not
remember how long it took before their sugarcane was harvested and 4% of the
respondents did not answer the question.
Table 4.21. Planting to harvest period (plant crop)
Months Frequency Percent
24 or less 105 57.1
>24 73 39.7
Unknown 2 1.1
Non response 4 2.2
Total 184 100.0
Source: Author’s compilation
The shorter the duration (hours) of the time taken to deliver the sugarcane to the
factory after harvesting the better. Table 4.22 presents the duration (hours) taken
after harvest for the produce to reach the factory and shows that 52.7% of the
respondents’ sugarcane took less than 24 hours between the farm and the
factory, while 34.2% of the respondents said that it took between 24 and 60 hrs,
and 0.5% said it took more than 60 hours. About 12.5% did not know how long it
took.
Table 4.22. Farm to factory duration (hrs)
Hrs Frequency Percent
<24 97 52.7
24-60 63 34.2
Over 60 1 0.5
Unknown 23 12.5
Total 184 100.0
Source: Author’s compilation
Quite a substantial amount of sugarcane was lost by the farmers due to weight
loss between the farm and the factory. Figure 4.3 presents the level of loss of
sugarcane weight after harvest as perceived by the respondents. About 44.6% of

65
the respondents were of the opinion that the loss of sugarcane weight outside the
mill was significant, while 27.2% considered the loss insignificant. About 6% had
not noted any loss of sugarcane as a result of being outside the mill, while 22.3%
did not answer the question.
Figure 4.3 Farmer perceptions on weight loss of sugarcane outside mill Figure 4.4 presents the mode of payment for sugarcane delivered by the farmers.
According to Figure 4.4, 54.3% were paid through cheque, 37.5% were paid in
cash, while 8.2% of respondents treated this as confidential and thus did not
respond to the question.
Figure 4.4 Farmer mode of payment for sugarcane
Table 4.23 presents the percentage of growers interested in expanding their
sugarcane production. Table 4.23 shows that 57.1% were interested in expanding
their sugarcane production while 38% were not interested in expanding their
sugarcane production. Only 4.9% of the respondents were reluctant to answer
this question.
44.6%
27.2%
6%
22.3%
significant
little
non
Missing
37.5%
54.3%
8.2%
Cash
Cheque
Missing

66
Table 4.23. Interest in expansion of sugarcane production
Frequency Percent
Interested in sugarcane expansion 105 57.1
Not interested in sugarcane production 70 38
Missing 9 4.9
Total 184 100.0
Source: Author’s compilation
Table 4.24 presents the reason for not being interested in expanding sugarcane
production. Table 4.24 shows that 25% were not interested in expanding
sugarcane production due to land shortage, while 6.5% indicated that the
marketing problem was their reason of having no interest in expanding sugarcane
production. About 1.9% of the respondents indicated that the labour problem was
their major reason of losing interest in expanding sugarcane production.
Table 4.24. Reason for non-interest in expansion of sugarcane production
Frequency Percent
Land shortage 46 25.0
Labour problem 3 1.9
Marketing problems 12 6.5
Not profitable 10 5.4
Not sure 113 61.4
Total 184 100.0
Source: Author’s compilation Figure 4.5 presents the farmers’ perception on sugarcane productivity compared
to other farm enterprises. The majority (62%) were of the opinion that sugarcane
Figure 4.5 Response on sugarcane productivity compared to other farm enterprises
0
20
40
60
80
Yes No Non response
62%
34.2%
3.8%

67
was more productive than any other farming enterprise in the area, while 34.2%
were of the opinion that sugarcane was not. About 3.8% did not answer this
question.
Table 4.25 presents the respondents’ perception on income status in the last 5
years prior to the study. Table 4.25 shows that 43.5% of the respondents felt that
their income had remained more or less the same compared to 5 years prior to
the study, while 29.3% felt that their income was better, and 20.1% felt that their
income was worse.
Table 4.25. Farmer’s perception on income status in the last 5 years
Frequency Percent
Farm income has become better 54 29.3
Farm income has become worse 37 20.1
Farm income has remained the same 80 43.5
Non response 13 7.1
Total 184 100.0
Source: Author’s compilation
4.4 Results of comparing key socio-economic characteristics of contract and non-contract farmers
In this subsection, we test the first hypothesis (H1), which states that household
and institutional characteristics have no significant influence on participation in the
SONY Sugarcane contract farming scheme. We also test the second hypothesis
(H2), which states that there is no significant difference in household and
agricultural assets between contract and non-contract farmers.
4.3.1 Comparison of characteristics of Contract and Non-Contract
farmers
In the first stage, the study analysed whether participation in the SONY contract
scheme has a positive impact on the household welfare of the growers by
comparing the mean of characteristics of contract farmers and non-contract
farmers using a t-test. A subset of five welfare indicators and twelve other socio-
economic characteristics were retained from the preceding descriptive statistics

68
as presented above for subsequent analysis to compare characteristics of
participants in SONY contract scheme and non-participants. The welfare
indicators were landholding (total farm area), value of agricultural assets, value of
the respondent’s house, duration of hunger season, sugarcane household
income, and per cent average annual turnover contributed by sugarcane. Table
4.26 presents a comparison of the mean values of key demographic profiles and
personal characteristics of contracted and non-contracted sugarcane growers for
the variables retained for the analysis and the result of a t-test of the differences
between the variables. The results show that participants in SONY Contract
scheme and non-participants differed significantly along four of the five welfare
indicators that had been retained for subsequent analysis. From the results, the
growers who participated in the SONY contract scheme had a significantly higher
landholdings (p=0.022), higher value of their houses (p=0.021), higher percentage
of annual turnover contributed by sugarcane (p=0.027), and higher income
(p=0.024). Surprisingly, the contracted growers had a significantly higher duration
of hunger period than the non-contracted farmers.
From focus group discussions and in-depth interviews the farmers indicated that
the sugarcane income came once in about 2 years, which they were not able to
save for food until the next harvest and payment. Since their land was occupied
with sugarcane, the long term contract agreement constrained them from
diversifying into other food crops. Therefore, participating farmers are better off
and statistically significant on the proxy indicators for welfare, except for the
duration of the periods of hunger.
The Company sector office plays an important role in recruiting farmers and
therefore the closer the farm to the Company sector office, the higher the chances
of being contracted by SONY Sugar Company. The average distance of farms
from the SONY Sugar Company sector office was 6.0 km. The average distance
for non-contract farmers was 7.4 Km and the average distance for contract
farmers was 5.2 km., significant at 0.1 % (p= 0.001). Other significant differences
were also noted between contracted and non contracted sugarcane growers at
5%, 1% and 0.01 % levels as shown in Table 4.26. Contracted growers had a
significantly larger household size (p= 0.011), more dependant males in the active

69
age category of 15-65 years (p=0.008), more land under other enterprises by
145% (p=0.050), and more experience in agriculture (p= 0.020). However,
contracted growers had a significantly longer time schedule before payments are
received than non-contracted growers (p=0.001).
Table 4.26 Characteristics of SONY contract and non-contract farmers
Variable
Non-contract Farmers (n=69)
SONY Contract Farmers (n=115)
All farmers (N=184
) t-Stat. Sign
Farmer characteristics
Age of household head(years) 42 38 0.17 0.108 40
Farm distance from Company
sector office (km)
7.4 5.2 4.022 0.001*** 6.0
Size of household (total no.) 6.1 7.9 -2.556 0.011* 7.3
Number of dependant living in
household (females 15- 65 yrs)
1.4
1.9
-1.707
0.090
1.7
Number of dependant living in
household (males 15- 65 yrs)
1.3
2.0
- 2.699
0.008**
1.8
Land, agriculture and production management information
Experience in agriculture(yrs) 3.3 6.0 -2.351 0.020* 5.1
Sugarcane area cultivated (ha) 1.6 2.3 -1.563 0.120 2.1
Land area other enterprises (ha) 0.1 0.3 -1.975 0.050* 0.2
Land assigned to sugarcane in
2010/2011(ha)
0.3
0.5
-0.606
0.546
0.4
Land assigned to sugarcane 5
yrs ago (ha)
1.8
2.5
-1.595
0.113
2.3
Land assigned to sugarcane 10
yrs ago (ha)
0.6
0.7
-0.419
0.675
0.6

70
Household welfare and financial characteristics
Landholding (Total area of farm
in ha)
3.3 4.8 -2.302 0.022* 4.3
Value of agricultural assets
(Ksh)a
2146
2622
-1.234
0.173
2384
Value of house (Ksh) 21652 32934 -2.201 0.021* 27304
Duration of hungry seasonb 3.270 3.621 4.230 0.001*** 3.4
Sugarcane Income (Ksh) 203739.8 298751.0 -0.877 0.012* 244368
Amount spent on sugarcane
agricultural inputs (fertilizer)
10165.2
14476.1
-1.313
0.191
13162
% average annual turnover
contributed by sugarcane
50.0
61.5
-2.238
0.027*
57.9
Payment schedule by miller(no.
of weeks) 2.0 4.3 -6.774 0.001*** 3.6
*Significant at 5%, **Significant at 1%, ***Significant at 0.1%
(a) Based on purchase price and straight-line depreciation assumption
(b) Based on period when one or more household member unwillingly eats less than
three meals a day due to lack of food.
Source: Author’s compilation
4.3.2 Econometric analysis of participation
The differences between the farmers participating in the SONY contract and
those non-participating were considered important when evaluating whether
participation in the contract is correlated with household wealth as a welfare
variable. This section presents the estimation results for the choice between
participation in the SONY contract scheme and non-participation in Table 4.27.
The probit model estimates as presented in Table 4.27 shows the probability that
a given household will participate in the SONY contract farming scheme given the
various attributes, i.e. the explanatory variables in the model. Ten attributes from
the probit model were found to be significant, corroborating the descriptive

71
analysis. The description of the significant explanatory variables with expected
signs and unit of measurement are as follows:-
Risks: The respondents who were highly likely to take risks in farming (p=0.02)
were 62% less likely to participate in the SONY contract scheme. The converse is
true that risk-averse farmers were highly likely to participate in contract farming.
Table 4.27. Probit model of participation in SONY contract scheme
Parameter Est. S. E. Sig. Dependent variable: Contract participation dummy
Gender 0.28 0.37 0.45
Age of household head (years) - 0.06 0.14 0.68
Willingness to take risks -0.62 0.26 0.02*
Production finance from financial institution -1.77 0.77 0.02*
Farm record keeping - 0.50 0.50 0.32
Household size (person) 0.13 0.05 0.01**
External farm input support -1.06 0.21 0.001***
Education of household head (years) -1.47 0.55 0.01**
Value of agricultural assets (Ksh)a -1.91 0.51 0.001***
Value of house (Ksh) -0.63 0.27 0.02**
Total farm area (ha) 0.09 0.05 0.05*
Sector office (km) -0.11 0.06 0.04*
Intercept 15.0 3.1 0.001***
N= 184 % correct predictions = 97% P-value>F 0.001 Predicted Total
0 1
Actual 0 66 3 69 1 3 112 115
No. of observations 69 115 184
*Significant at 5%, **Significant at 1%, *** Significant at 0.1%. (a) Based on purchase price and straight-line depreciation assumption
Source: Authors compilation

72
The variable was hypothesised to have a negative impact on the probability of
participating in the contract scheme. This is supported by literature: one of the
main reasons why farmers engage in contract farming is to cope effectively with
risks associated with agricultural enterprises (Hardaker, Huirne, Anderson, and
Lien, 2007). Contract farming is viewed as a means of hedging against risks, and
risk-averse farmers would tend to participate in marketing arrangements that
reduce risks, such as futures markets (Wainaina, Okello, and Nzuma, 2012).
Indicators of welfare: Contrary to expectation, all the indicators of welfare
showed a significant negative relationship with participation. The expectation was
that the greater the indicators of the value of the welfare such as agricultural
equipment, the greater the probability that the farmer participates in the contract
scheme. However, the respondents who had a higher value of agricultural assets
(p=0.001), had a higher house value (p=0.02), received more external farm input
support (p=0.001), and received more production finance support (p=0.02) were
less likely to participate in SONY Contract farming. This implies that with more
resources, the SONY contract credit becomes less attractive, and the farmers
opted for alternative sources, rather than contract to receive credit. This is
supported by literature that, farmers with more indicators of welfare have higher
credit rating and thus attract higher loans to increase their productivity (Warning
and Key, 2002). During focus group discussions, the farmers’ perception was that
the SONY credit terms were expensive. Fertilizer was singled out as the most
affected. The fertilizers were provided on credit for the contract farmers, but only
for those who chose to ask for them. The data provided by the SONY employees
indicated that fertilizer usage was declining from a high of 24,141 bags of DAP
and 12,313 bags of UREA in 1995/1996 period to 4,632 bags of DAP and 4,795
bags of UREA in 2010/11 period. This was against the Company target for
2010/11 period of 22,703 bags of DAP and 31,374 bags of UREA (see
Appendix.3 subsection 2). This factor could be the reason for the declining
sugarcane output over the same period, from 129.9 tch yield in 1996/97 period to
73.86 tch yield in 2011/2012 (see Appendix.3 subsection 4). This proposition is
supported by the fact that inadequate application of fertilizer (below 60kg P2O5 ha-

73
1 and 100kg N ha-1 for plant crop and 120kg N ha-1 for ratoon crops) lowers
sugarcane yield and thus sugarcane productivity (KESREF, 2013).
Land size: An increase in one hectare of land was likely to raise participation in
contract farming by 9%. As expected, land is a very important determinant in
recruiting farmers to participate in the scheme, and there is a minimum set
acreage for one to be recruited into the farming scheme. Therefore, smaller farms
are likely to be excluded. Furthermore, the literature shows that larger farms tend
to benefit more from the contract in terms of credit disbursement (Chang, Chen,
Chin, and Tseng, 2006).
Distance: As expected, distance to the sector office was an important
determinant of participation in the SONY contract scheme. The local company
sector office plays a crucial role in searching and selecting framers to join the
contract scheme. For every additional kilometre of distance to the sector office,
the probability of the respondents participating in the SONY contract scheme
(p=0.04) was likely to decline by 11%. This suggests that the growers were
sensitive to transaction costs. This is supported by the literature which shows that
reduced transaction costs increase the likelihood of farmers to participate in
markets (Ouma, Jagwe, Obare, and Abele, 2009).
Household size: As expected, family size increase by an additional member
(p=0.01) was likely to increase the probability of the growers participating in the
contract scheme by 13%. Sugarcane cultivation in Kenya is a labour intensive
enterprise. Strict guidelines on the weeding regimes for sugarcane cultivation
must be followed. The high labour demand is particularly required during planting,
weeding and harvesting. Thus availability of on-farm family labour would highly
determine the probability of participation in the contract scheme. Larger
households would be more likely to receive a contract. The study finding is
supported by other studies on contract farming where labour intensive cultivation
is required (Warning and Key, 2002).
Education of household head: This study found that the Household Heads
(p=0.01), who received more education were 147% less likely to participate in the

74
contract scheme. In this study, the variable had been hypothesized to have a
positive impact on the probability of participating in the contract scheme. This was
supported by literature which indicates that education facilitates skills acquisition
which enables households to have access to non-farm income, thus lowering the
probability of participating in markets (Ouma, Jagwe, Obare, and Abele, 2009).
The expectation was that more educated farmers are likely to be better endowed
with resources from alternative sources of income and therefore are less likely to
participate in the contract scheme for the purposes of obtaining credit.
The study thus concludes that the factors that significantly influence participation
in sugarcane contract farming with participation in contract farming as the
dependant variable (see Table 4.27) are:- (i) Household size, (ii) external farm
input support, (iii) education of the Household head, (iv) value of agricultural
assets, (v) value of the household heads house, (vi) total area of the land farmed,
and (vii) the distance of the farm from the sector office. Based on the findings
from participatory research techniques (PRTs), the study also established that
those who participated in contract farming were not necessarily better off than
non-participants. This finding is also supported by econometric modelling where
the coefficient of “welfare indicators” was found to be negative.

75
CHAPTER FIVE
SUMMARY, CONCLUSION AND RECOMMENDATIONS
This chapter first summarizes the findings of characterising SONY Sugar
company contract scheme, then the findings of the factors associated with
participation in SONY contract farming scheme and finally the findings of the
impact of contract farming on household wealth. At the end of the chapter the
study makes recommendations.
5.1 Summary of the Findings and Conclusion
The study sought to characterize the nature of SONY Sugar Company contract
scheme. The study found that the SONY contracted sugarcane farmers
experienced a number of problems, including high transaction costs arising from
poor contract terms and conditions. The farmers coped with some of these
problems by “side-selling” their sugarcane to SONY Sugar Company competitors.
Although the study did not go further to measure the actual transaction costs
involved, it did shed some light on the nature and forms of transaction costs
involved.
On the issue of socio-economic characteristics of the respondents, the majority
were in the productive age of 30 years and above (77.1%) and had lived in the
SONY Scheme area for more than 20 years (89.1%). Therefore, it can be
concluded from the demographic profile that the respondents were mature, had
lived in the area long enough to be able to make rational decisions about
sugarcane farming, and provide dependable information. Although sugarcane
production was supposed to have improved the standard of living of the growers,
the majority (80.4%) were still living in semi-permanent houses. Furthermore, the
education level was found to be quite low, with 38% of the male Household
Heads and 49.5% of the female Household Heads having attained their highest
level of education as standard 8 and below.
On the production factors, 90.2% of the growers were not carrying out any field
soil sampling and testing for fertility, while 85.9% were not applying the
recommended amount of fertilizer based on field soil sampling and testing for
76
fertility. Furthermore, during focus group discussions with 30 farmers, the growers
stated that they used to be given fertilizers and credit uniformly, but over the
years, fertilizer was only issued as demanded by the farmers. Due to the high
cost, the growers either do not demand for the fertilizers from the miller or
demand lower quantities then apply lower than the recommended rates (see
Appendix.3). Inadequate application of fertilizer (below 60kg P2O5 ha-1 and 100kg
N ha-1 for plant crop and 120kg N ha-1 for ratoon crops) lowers sugarcane yield
and thus sugarcane production (KESREF, 2013). Other findings were on farm
record keeping where the majority (61.7%) were not keeping farm records. Farm
record keeping is an important tool in proper farm management.
The study also found that the majority (70.7%) had not been offered any technical
training by SONY Sugar Company, yet they needed it. On how the farmers
received agricultural information, village meetings (51.1%) still remained the most
important channel to convey agricultural information. Therefore, it can be
concluded that the farmers do not receive adequate knowledge about modern
farming methods to increase their production.
On post-harvest handling and marketing, the study found that the percentage of
growers channelling their produce directly to the miller had been declining from
68.4% in 2006-2007 to 50% in 2010-11. Whereas sugarcane marketing through
the syndicate traders had generally been rising from 1.8% to 18.8% and spot
market trading had been rising from 7% in 2006-2007 to 12.5 % in 2010-2011.
However, an average of 20.6% of the growers marketed their produce through
middlemen during the period. On weight loss outside the mill, 44.6% of the
growers considered sugarcane weight loss outside the mill to be quite significant.
About 63.6% of the farmers considered their income to have remained either the
same or decreased in the last 5 years prior to the study. The rise in marketing
through syndicate traders, spot market trading and middlemen was due to the
opening up of other more lucrative marketing channels. During informal
interviews, it was found that the syndicate traders were ferrying the sugarcane to
Kibos for milling, more than 170Km from the SONY Sugar zone.
77
On annual average earnings from sugarcane, nearly a half (47.3%) earned Ksh
20,000 and below annually, while only 14.1% earned an average income of over
Ksh. 100,000 annually. With regard to the farmer’s perception on income status in
the last 5 years prior to the study the majority (72.8%) considered their income to
have either remained the same or increased due to sugarcane farming. This
implies that the majority of the farmers still consider sugarcane farming as a
worthwhile enterprise.
On comparative analyses of contract and non-contract sugarcane farmers, the
analyses revealed that contract farmers had more total farm land (by 47%), more
land under other enterprises (by 147%), higher household size (by 29%), higher
percentage average sugarcane annual turnover (by 23%), and more experience
in agriculture (by 86%). Contracted sugarcane farms were closer to the SONY
Sugar Company sector office than non contracted farms and had longer payment
schedule than non-contracted sugarcane farms. However, the contracted growers
faced a longer duration of hungry season than their non-contracted growers. The
contracted farmers indicated that the income came once in about 2 years, which
they were not able to save for food until the next sugarcane harvest and payment.
This was unlike their non-contracted growers who had more land under food
crops to supply the family needs. This is a significant feature from food security
perspective.
On the factors influencing grower’s participation in the contract scheme, the study
found that the company sector office played a crucial role in recruiting growers to
participate in the contract scheme. However, growers who were better endowed
with owning agricultural assets, better housing, had external sources of farm
inputs and production finance support opted not to contract with the company for
the purposes of obtaining credit. The study found that the credit terms were less
attractive and preferred not to contract with SONY Sugar Company for the
purposes of obtaining credit where farmers had better options. The other factors
influencing farmer participation in the sugarcane contract scheme were:- (i) risk
averse farmers who were likely to participate in contract farming due to risks
associated with farming, (ii) farmers with large farms who were likely to be
recruited into the scheme by the company, (iii) larger Households due to

78
availability of on-farm family labour for sugarcane cultivation, and (iv) more
educated Household Heads were less likely to participate because they had
access to non-farm income.
Participatory research methods revealed that contracted farmers were not
necessarily better-off than non-contracted farmers from the welfare perspectives.
The contracted farmers claimed that they experienced higher post-harvest
sugarcane losses because weighing was done at the reception area of the sugar
company factory (rather than at the farm gate).
In conclusion, it is observed that the contracted growers were experiencing a
number of problems, including higher transaction costs which eroded their profit
gains. Some of the problems were in-built in the SONY contract terms and
conditions. Furthermore, the sugarcane contract scheme in its current form was
not lucrative enough to encourage farmers to participate in the scheme. The
contract terms and conditions can be addressed by the government and the
contracting companies to encourage contract participation and increase the area
under contract sugarcane production. It was also found that the long term contract
on sugarcane supply agreement constrained the growers from diversifying into
food crops. Therefore, the contracted farmers faced a longer season of hunger
than their non-contracted growers.
5.2 Recommendation Given the potential benefits of functional and well-structured contract farming
schemes, and to encourage the farmers to remain in the contract scheme and
also encourage others to join the scheme, the farmers’ concerns on high cost of
administering the contract need to be addressed. This would increase the delivery
of sugarcane to the factory by Out-growers and increase sugar production by the
SONY Sugar Company. Policies and strategies to encourage contract
participation and expand the area under sugarcane, while making sugarcane
production more competitive, should include the following:- (i) provide better
lending terms for farm inputs provided on credit to farmers particularly, fertilizers
to encourage application and use; (ii) incorporate soil sampling and testing costs
in the production credit extended to the farmers; (ii) providing periodic sugarcane

79
technical training to increase production; (iii) weighing of the sugarcane at the
farm gate, to prevent postharvest loses; (iv) review contract terms and conditions
with the objective of making them attractive; and (v) pay sugarcane delivery
based on quality (sucrose content) as recommended in the sugar act.
The study also recommends that, in future, research could be undertaken to
evaluate the transaction cost points which this study was not able to accomplish
due to limitations of time and funding.

80
REFERENCES
Adamowicz, W., Boxall, P., Williams, M., and Louviere, J. (1998). Stated
Preference Approaches for Measuring Passive Use Values: Choice Experiments
and Contingent Valuation. American Journal of Agricultural Economics , 80 (1):
64-75.
Adamowicz, W., Louviere, J., and Swait, J. (1998). Introduction to Attribute-Based
Stated Choice Methods. Report to NOAA Resource Valuation Branch, Damage
Asessment Centre. National Oceanic and Atmospheric Administration, US
Department of Commerce, Silver Spring, MD.
Bijman, J. (2008). Contract Farming in Developing Countries: An Overview.
Working Paper. Retrieved March 17, 2009, from www.mst.wur.nl
Chang, C.-C., Chen, C.-C., Chin, M.-C., and Tseng, W.-C. (2006). Is Contract
Farming more Profitable and Efficient than Non-Contract Farming: A Survey
Study of Rice Farms In Taiwan. A paper presented at the American Agricultural
Economics Association Annual Meeting held on July 23-26, 2006. Long Beach,
California.
Coase, R. H. (1937). The Nature of the Firm. Econometrica N.S. , 386-405.
CRA. (2010, November). Kenya County Fact Sheets. Retrieved April 6, 2013,
from Commission on Revenue Allocation web site: http://www.crakenya.org
Crawford, E., Jayne, T., and Kelly, V. (2006). Alternative Approaches for
Promoting Fertilizer Use in Africa. Agriculture and Rural Development. Retrieved
October 18, 2009, from www-wds.worldbank.org/external/default/WDSContent -
2007-12-16
Da Silva, C. (2005). The Growing Role of Contract Farming in Agri-Food Systems
Development: Drivers Theory and Practice. Agricultural Management, Marketing
and Finance. Rome: F.A.O.
De Silva, H., and Ratnadiwakara, D. (2008). Using ICT to Reduce Costs In
Agriculture Through Better Communication: A case-study from Sri Lanka.

81
Retrieved July 12, 2009, from www.lirneasia.net/wp-
content/uploads/2008/.../transactioncosts.pdf.
Dorward, A. (2001). The Effects of Transaction Costs, Power and Risk on
Contractual Arrangements: A Conceptual Framework For Quantitative Analysis.
Journal Of Agricultural Economics 52(2) , 59-74.
Eaton, C., and Shepherd, A. W. (2001). Contract Farming: Partnership for
Growth. Agricultural Services Bulletin, No. 145. Rome: Food and Agriculture
Organization
English, P., Jaffee, S., and Okello, J. (2004). Exporting out of Africa: The Kenya
Horticulture Success Story. A Paper presented at the conference. Scaling Up
poverty Reduction: A Global Learning Process. Shangai.
European Commission. (2007). Annual Action Programme covering the
Programming Document for the Annual Action Programme for Kenya 2007 under
the AMSP. Memorandum to the Commission.
Fafchamps, M. (2004). Market Institutions and Sub-Saharan Africa: Theory and
Evidence. Massachusetts: MIT Press, Cambridge.
Fafchamps, M., and Minten, B. (1999). Property Rights in a Flea Market
Economy. MSSD Discussion Paper No. 27. March 1999. Washington DC:
International Food Policy Research Institute.
Faltermeier, L., and Abdulai, A. (2009). The Impact of Water Conservation and
Intensification technologies: Empirical Evidence for Rice Farmers in Ghana.
Agricultural Economics (40), 365-379.
FAO. (2013, April 6). FAO: Statistics. Retrieved April 6, 2013, from FAO website:
http:/www.fao.org
Foss, N. J., and Klein, P. G. (2008). Organizational Governance. The Handbook
of Rational Choice Social Research. New York: Russel Stage Foundation.
Fundira, T. (2003). A Transaction Cost Analysis of the Fruit Supply Chain in
South Africa: A Case Study Approach. Msc Thesis. University of Stellenbosch.

82
Gioe, M. (2006). Can Horticultural Production Help African Small-holders to
escape Dependence on Export of Tropical Agricultural commodities? Crossroads.
ISSN 1825-7208 Vol. 6 No 2.
GOK. (2007). National Adaptation Strategy for the Sugar Industry of Kenya.
Nairobi, Kenya: Government of the Republic of Kenya.
GOK Report. (2009). State Corporations. Retrieved October 9, 2009, from Kenya
government website: www.kenya.go.ke
GOK. (2011, April 4). Sugar (Amendment) Bill, 2011. Retrieved April 6, 2013,
from http:/www.kenyalaw.org
Govereh, J., and Jayne, T. (2003). Cash Cropping and Food Crop Productivity:
Synergies or Trade-Offs? Agricultural Economics (28) , 39-50.
Govereh, J., Jayne, T., and Nyoro, J. (1999). Small-holder Commercialization,
Interlinked Markets and Food Crop Productivity: Cross-country Evidence in
Eastern and Southern Africa. The Department of Agricultural Economics and the
Department of Economics. Michigan State University (MSU).
Hardaker, J., Huirne, R., Anderson, J., and Lien, G. (2007). Coping with Risk in
Agriculture (2nd Edition ed.). CABI Publishing.
Hendrikse, G. (2003). Economics and Management of Organizations:
Coordination, Motivation and Strategy. Maidenhead. Berkshire: McGraw-Hill
Education.
IFPRI. (2004, February). Focus 11. (R. Meinzen-Dick, and M. D. Gregorio,
Editors) Retrieved April 29, 2013, from International Food Policy Research
Institute: http://www.ifpri.org
Jaffee, S., and Morton, J. (Eds.). (1995). Marketing Africa's High-Value Foods:
Comparative Experiences of an Emergent Private Sector. Dubuque, Iowa, USA:
Kendall/Hunt Publishing.
Jagwe, J. N. (2011). The Impact of Transaction Costs on the Participation of
Smallholder Farmers and Intermediaries in the Banana Markets of Burundi,

83
Democratic Republic of Congo and Rwanda. Doctor of Philosophy Thesis report.,
University of Pretoria, Department of Agricultural Economics, Extension and Rural
Development, Pretoria, South Africa.
Jaleta, M., Gabremedhin, B., and Hoekstra, D. (2009). Small-holder
Commercialization: Processes, Determinants and Impact. Improving Productivity
and Market Success (IPMS-Ethiopia) of Ethiopian Farmers. Improving Market
Opportunities. Discussion Paper No. 18. Ethiopia: ILRI.
Jayne, T., Yamano, T., and Nyoro, J. (2004). Interlinked Credit and Farm
Intensification: Evidence from Kenya . Agricultural Economics 31(2-3) , 209-218.
Kegode, P. (2005). Economic Governance Reform in the Sugar Sub-sector.
Paper submitted to Centre for Governance and Development. Kenya. Retrieved
October 11, 2009, from www.cgd.or.ke/documents/Sugar%20Report
Kenya Sugar Board. (2009). Kenya Sugar Industry Strategic Plan, 2010-2014,
Enhancing Industry Competitiveness. Nairobi: Kenya Sugar Board.
Kenya Sugar Board. (2008). Year Book of Sugar Statistics. Nairobi: Kenya Sugar
Board.
KESREF. (2013). KESREF. Retrieved May 5, 2013, from kesref website:
www.kesref.org/technologies
Key, N., and Runsten, D. (1999). Contract Farming, Smallholders, and Rural
Development in Latin America: The Organization of Agroprocessing Firms and
the Scale of Outgrower Production. World Development , Vol. 27 (No 2), 381-401.
Kirsten, J., and Sartorius, K. (2002). Linking Agribusiness and Small-scale
Farmers in Developing Countries: Is There a New Role for Contract Farming.
Development of Southern Africa (Vol. 19). Routledge, part of the Taylor and
Francis Group.
Kirsten, J., and Vink, N. (2005). The Economics of Institutions: Theory and
Applications to African Agriculture. University Of Pretoria.
84
KLR. (2001). Laws of Kenya. Sugar Act No. 10 of 2001. Nairobi, Kenya: National
Council for Law Reporting.
KNBS. (2010, August 28). Kenya 2009 Population and Housing Census
Highlights . Retrieved April 6, 2013, from Kenya National Bureau of Statistics:
http://www.knbs.or.ke
Kuntoro, B., and Yoshiharu, S. (2003). Existence, Types and Opportunities of
Contract Farming in East Java. Laboratory of Economics of Agricultural Marketing
(Vol. 88). Bull. Fac. Saga University.
Likulunga, M. L. (2005). The Status of Contract Farming and Contractual
Arrangements in Zambian Agriculture and Agribusiness. A Report Prepared for
FARNPAN. University of Zambia.
MASIP Secretariat Report. (2005). National Contract Farming Workshop held at
Malawi Institute of Management (MIM) on 15th November, 2005. Ministry of
Agriculture, Government of Malawi.
Masuku, M., and Kirsten, J. (2004). The Role of Trust in Contract Enforcement:
An Analysis of Small-holder Farmers and Sugar Millers in Swaziland. In: Kirsten J
and N. Vink (eds). The Economics of Institutions: Theory and Applications to
African Agriculture. University of Pretoria.
Menard, C. (2004). The Economics of Hybrid Organizations. Journal of
Institutional and Theoretical Economics , 160: 345-376.
Minot, N., and Ngigi, M. (2004). Are Horticulture Exports a Replicable Success
Story? Evidence from Kenya and Cote d’Ivoire. EPTD Discussion Paper No. 120.
MTID Discussion Paper No. 73. Washington DC: IFPRI.
Mwape, F., Abaru, M., and Place, F. (2005). A Programme of The African Union.
Contract Farming. Expanding Agribusiness Links with Small-holder Farmers in
Africa. The Concept. Conference preparation report, Nov., 21-25, 2005. Entebbe,
Uganda: NEPAD.
Nalyongo, W., and Abaru, M. B. (2004). Savings and Credit in Mukono and Kumi
District. The RELMA Experience. RELMA working Paper. RELMA.

85
Nyoro, J., Wanzala, M., and Awuor, T. (2001). Increasing Kenya’s Agricultural
Competitiveness: Farm Level Issues. Tegemeo working paper No.4. Kenya:
Tegemeo Institute of Agricultural Policy and Development,Egerton University.
Omar, A. (2002). The NIE Approach to Economic Development. An Analytic
Primer. Forum Series On the Role of Institutions in Promoting Growth. Retrieved
November 18, 2008, from USAID:
www.usaid.gov/our_work/economic_growth_and_trade/eg/forum_series/nie-
approach.pdf
Ouma, E., Jagwe, J., Obare, G. A., and Abele, S. (2009). Determinants of
Smallholder Farmers’ Participation in Banana Markets in Central Africa: The Role
of Transaction Costs. Agricultural Economics , 41 (2010) 111–122.
Peltzer, R. (2006). Contract Farming- A Way of Fighting Rural Poverty in Sub-
Saharan Africa. A Paper Presented During a Workshop on “Out-growers – A Key
to the Development of Rural Areas in Sub-Saharan Africa and to Poverty
Reduction.DEG/DIE Workshop on August 18, 2006. (German Development
Institute. Cologne.) Retrieved October 18, 2009, from www.die-
gdi.de/.../Outgrowers_sub-saharan-african_rural_areas.pdf
PRSP Report. (2004). Poverty Reduction Strategy Paper Covering the Period
2001-2004. District Consultative Forum Report. Migori District. Ministry of Finance
and Planning, Kenya.
Sartorius, K., and Kirsten, J. (2006). Contracts and Contract Farming as Potential
Mechanisms to Improve Market Access for Black Farmers in South Africa. School
of Accountancy, University of the Witwatersrand. Johannesburg. Department of
Agricultural Economics, Extension and Rural Development, University of Pretoria.
Pretoria.
Sartorius, K., Kirsten, J., and Masuku, M. (2003). A New Institutional Economic
Analysis of Small-scale Farmer Contracts and Relations in the Sugar Supply
Chains of South Africa and Swaziland. IAMA Symposium, 21-24 June. Cancun,
Mexico.

86
Sautier, D., Vermeulen, H., Fok, M., and Bienabe, E. (2006). Case Studies of
Agri-processing and Contract Agriculture in Africa. Rimisp-Latin American Centre
for Rural Development. Preparation of the World Development Report 2008
“Agriculture for Development”. Retrieved October 18, 2009, from
www.rimisp.org/getdoc.php?docid=6597
Schmitz, P. (2001). The Hold-Up Problem and Incomplete Contracts: A Survey Of
Recent Topics In Contract Theory. Bulletin Of Economic Research Vol. 53, No.1 .
SONY Sugar Company. (2009). SONY Sugar Company Profile. Awendo, Kenya:
SONY Sugar Company.
Strohm, K., and Hoeffler, H. (2006). COntract Farming in Kenya: Theory,
Evidence from Selected Value Chains, and Implications for Development
Cooperation. Nairobi: Ministry of Agriculture and GTZ.
Sykuta, M., Klein, P., and Harvey, S. (2007). Markets, Contracts or Integration?
The adoption, Diffusion and Evolution of Organizational Form. Working Paper No.
2007-01 April 2007. Retrieved January 12, 2009, from University of Missouri:
http://cori.missouri.educ/wps
Thurstone, L. L. (1927). A Law of Comparative Judgement. Psychological
Review, 4:273-286.
Tschirley, D., Ayieko, M., Muendo, K., and Weber, M. (2004). Improving Kenya’s
Domestic Horticultural Marketing System: Current Competitiveness, Forces of
Change, and Challenges for the Future. Paper Presented at the World Bank
Video Training Conference: Developing Horticulture Supply Chains for Growth
and Poverty Reduction in Sub-Saharan Africa. December 6-8. Washington D.C.
Tyler, G. (2007). The African Sugar Industry-A frustrated Success Story. All-Africa
Review of Experiences with Commercial Agriculture. Background Paper for the
Competitive Commercial Agriculture in Sub-Saharan Africa (CCAA) Study. World
Bank/FAO.
Wainaina, P. W., Okello, J. J., and Nzuma, J. (2012). Impact of Contract Farming
on Smallholder Poultry Farmers’ Income in Kenya. International Association of

87
Agricultural Economists (IAAE) Triennial Conference, 18-24 August, 2012. Foz do
Iguaçu, Brazil,.
Wanyande, P. (2001). Management Politics in Kenya’s Sugar Industry: Towards
an Effective Framework. African Journal of Political Science (2001) , 6 (1), 123-
140.
Warning, M., and Hoo, W. (2000). The Impact of Contract Farming on Income
Distribution: Theory and Evidence. Paper Prepared for Presentation at the
Western Economics Association International Annual Meeting, June 30, 2000.
Warning, M., and Key, N. (2002). An Equilibrium Analysis of the Arachide de
Bouche Program in Senegal. World Development , 30 (2), 255-263.
Wilkinson, N. (2005). Managerial Economics: A Problem - Solving Approach.
Cambridge University Press.
Williamson, O. E. (1991). Comparative Economic Organization: The Analysis of
Discrete Structural Alternatives. Administrative Science Quarterly, 36:2.
Williamson, O. E. (1996). The Mechanisms of Governance. Oxford: Oxford
University Press.

88
APPENDICES
Appendix.1: List of documents consulted
1. Received from Divisional Agricultural Offices
Migori = PRA reports
Uriri = PRA reports
Awendo = PRA reports
Rongo = PRA reports
2. Received from KSB
Yearbook of Sugar Statistics 2010, 100 pages
Kenya Sugar Industry Strategy Plan 2010-2014: Enhancing Industry
Competitiveness, 74 pages
Kenya Sugar Board Strategic Plan, 2009-2014, 61 pages
The Kenya Sugar Industry Value Chain Analysis: Analysis of the
production and marketing costs for sugarcane and sugar related products.
Draft Report May 2010. 82 pages.
3. Received from KESREF
A newsletter of the Kenya Sugar Research Foundation: KESREF Digest;
o Vol. 4 Issue 1; July-September, 2009
o Vol. 5 Issue 2 - 2011
o Vol. 5 Issue 3, March 2011
o Vol. 5 Issue 4 June 2011
Kenya Sugar Research Foundation (KESREF) Report 104 pages
4. Received from MENR/ NEMA
District Environment Action Plan (DEAP) 2009-2013.
DEAP 2009-2013, Kuria, 60 pages
DEAP 2009-2013, Migori, 53 pages.

89
Appendix.2: 10 year sugarcane hactarage, and production
Year Area Harvested (ha) Production (tons)
2011 64091 5338560
2010 68738 5709590
2009 65774 5610700
2008 54465 5112000
2007 59201 5204210
2006 54621 4932840
2005 56537 4800820
2004 54191 4661000
2003 50468 4204060
2002 54010 4501360
2001 47794 3550790
2000 57243 3941520
1999 51833 4415780
1998 50111 4661360
1997 56000 4450000
1996 57000 4650000
1995 56145 4550000
1994 57392 3800000
1993 51943 4370000
Source: (FAO, 2013)
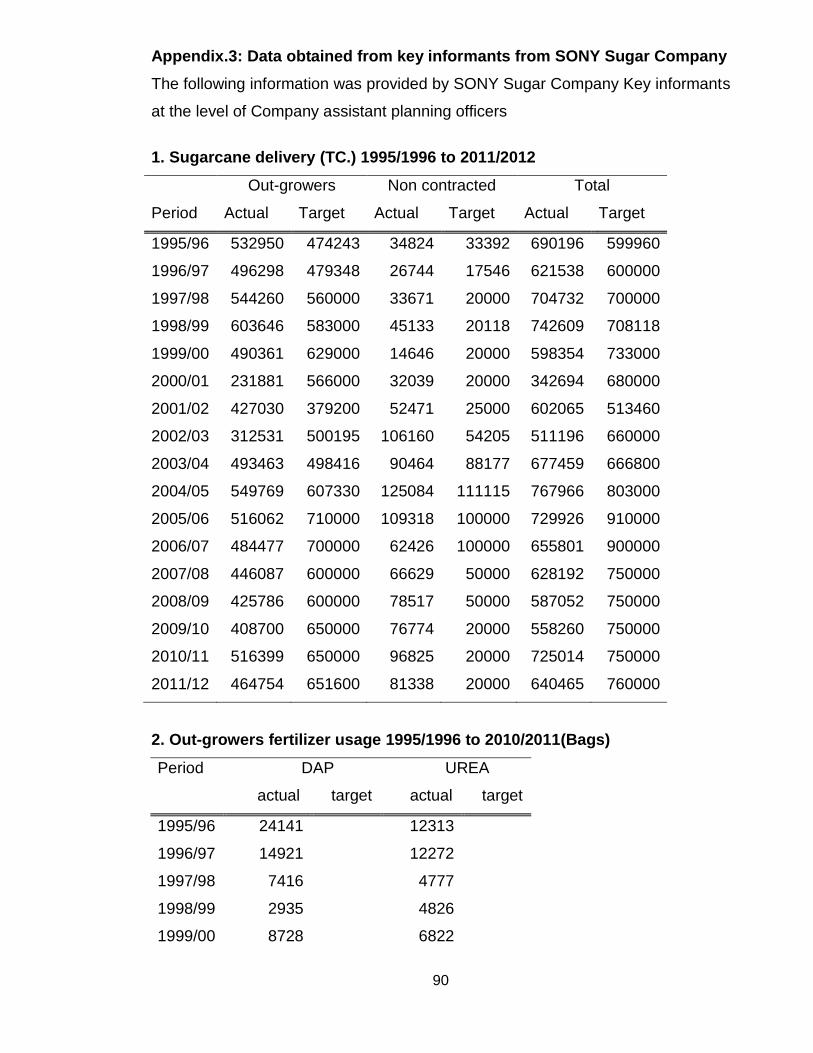
90
Appendix.3: Data obtained from key informants from SONY Sugar Company
The following information was provided by SONY Sugar Company Key informants
at the level of Company assistant planning officers
1. Sugarcane delivery (TC.) 1995/1996 to 2011/2012
Out-growers Non contracted Total
Period Actual Target Actual Target Actual Target
1995/96 532950 474243 34824 33392 690196 599960
1996/97 496298 479348 26744 17546 621538 600000
1997/98 544260 560000 33671 20000 704732 700000
1998/99 603646 583000 45133 20118 742609 708118
1999/00 490361 629000 14646 20000 598354 733000
2000/01 231881 566000 32039 20000 342694 680000
2001/02 427030 379200 52471 25000 602065 513460
2002/03 312531 500195 106160 54205 511196 660000
2003/04 493463 498416 90464 88177 677459 666800
2004/05 549769 607330 125084 111115 767966 803000
2005/06 516062 710000 109318 100000 729926 910000
2006/07 484477 700000 62426 100000 655801 900000
2007/08 446087 600000 66629 50000 628192 750000
2008/09 425786 600000 78517 50000 587052 750000
2009/10 408700 650000 76774 20000 558260 750000
2010/11 516399 650000 96825 20000 725014 750000
2011/12 464754 651600 81338 20000 640465 760000
2. Out-growers fertilizer usage 1995/1996 to 2010/2011(Bags)
Period DAP UREA
actual target actual target
1995/96 24141
12313
1996/97 14921
12272
1997/98 7416
4777
1998/99 2935
4826
1999/00 8728
6822
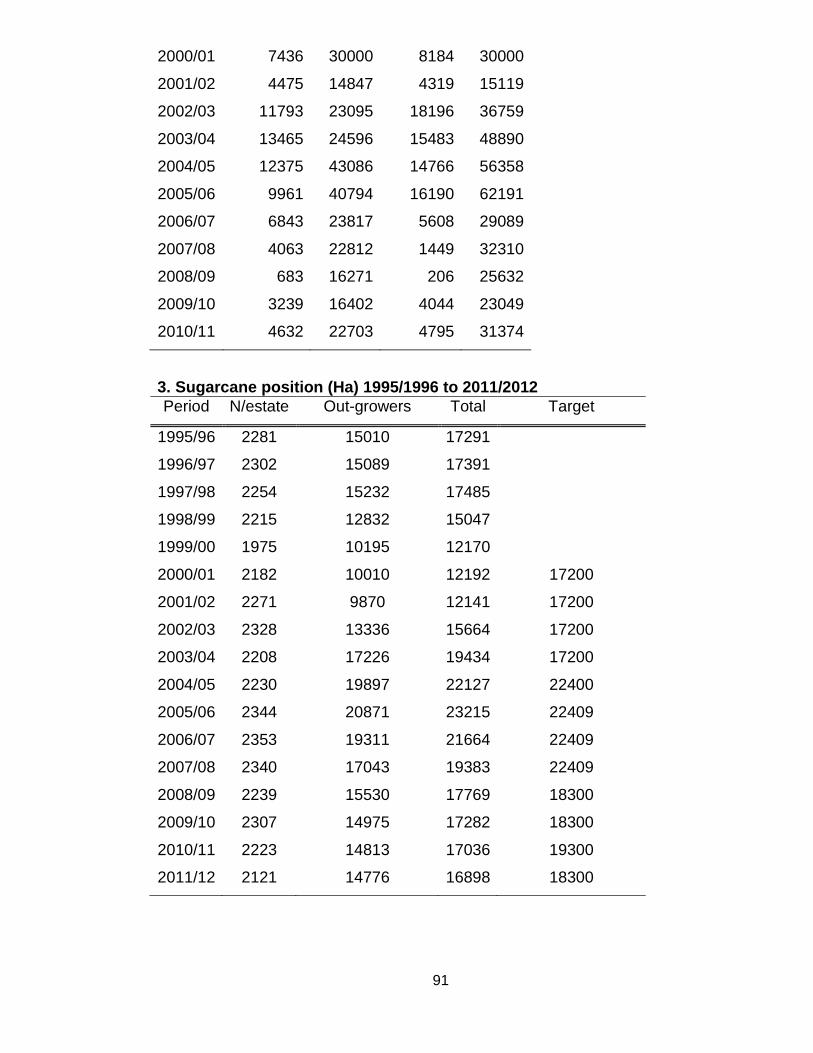
91
2000/01 7436 30000 8184 30000
2001/02 4475 14847 4319 15119
2002/03 11793 23095 18196 36759
2003/04 13465 24596 15483 48890
2004/05 12375 43086 14766 56358
2005/06 9961 40794 16190 62191
2006/07 6843 23817 5608 29089
2007/08 4063 22812 1449 32310
2008/09 683 16271 206 25632
2009/10 3239 16402 4044 23049
2010/11 4632 22703 4795 31374
3. Sugarcane position (Ha) 1995/1996 to 2011/2012
Period N/estate Out-growers Total Target
1995/96 2281 15010 17291
1996/97 2302 15089 17391
1997/98 2254 15232 17485
1998/99 2215 12832 15047
1999/00 1975 10195 12170
2000/01 2182 10010 12192 17200
2001/02 2271 9870 12141 17200
2002/03 2328 13336 15664 17200
2003/04 2208 17226 19434 17200
2004/05 2230 19897 22127 22400
2005/06 2344 20871 23215 22409
2006/07 2353 19311 21664 22409
2007/08 2340 17043 19383 22409
2008/09 2239 15530 17769 18300
2009/10 2307 14975 17282 18300
2010/11 2223 14813 17036 19300
2011/12 2121 14776 16898 18300

92
4. Out-growers sugarcane productivities yields (tch)
Period Harvested Productivity
Ha Yields (tch)
1995/96 4769 106.5
1996/97 3547 129.9
1997/98 4645 114.6
1998/99 5394 110.1
1999/00 5392 88.9
2000/01 4587 47.8
2001/02 5360 76.5
2002/03 5534 56.2
2003/04 6662 73.5
2004/05 6129 82.5
2005/06 4761 93.8
2006/07 4983 94.7
2007/08 4361 93.7
2008/09 4900 86.9
2009/10 4813 84.3
2010/11 85.8
2011/12 73.86
5. Services offered to farmers
1. Land development operations (Surveying, ploughing, harrowing,
furrowing, and seedcane supply)
2. Fertilizer supply for both plant crop and ratoon crop (DAP and UREA)
3. Supply of herbicides for chemical weeding
6. Districts served by SONY Sugar Company
1. Rongo District 5. Migori District
2. Gucha District 6. Ndhiwa District
3. Transmara District 7. Kuria District
4. Uriri District
Nb.8% lost to poaching

93
Appendix.4: Generic SONY Sugar Company Out-growers Cane Agreement

94

95

96
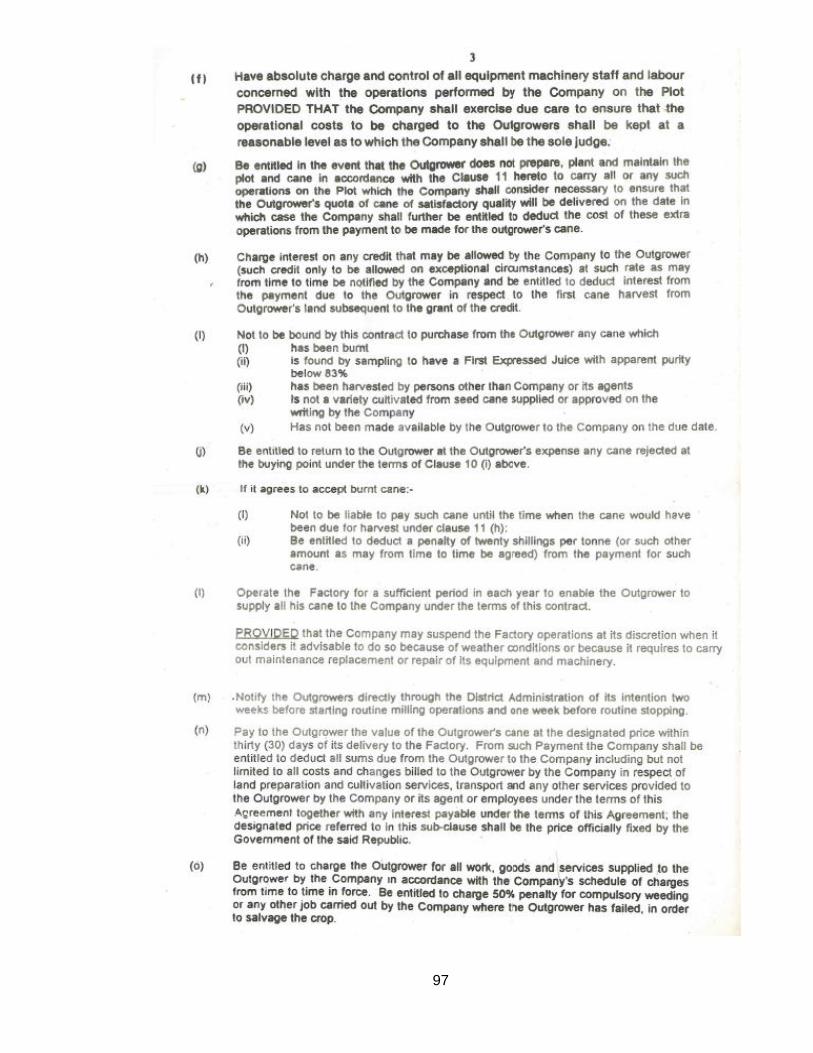
97

98
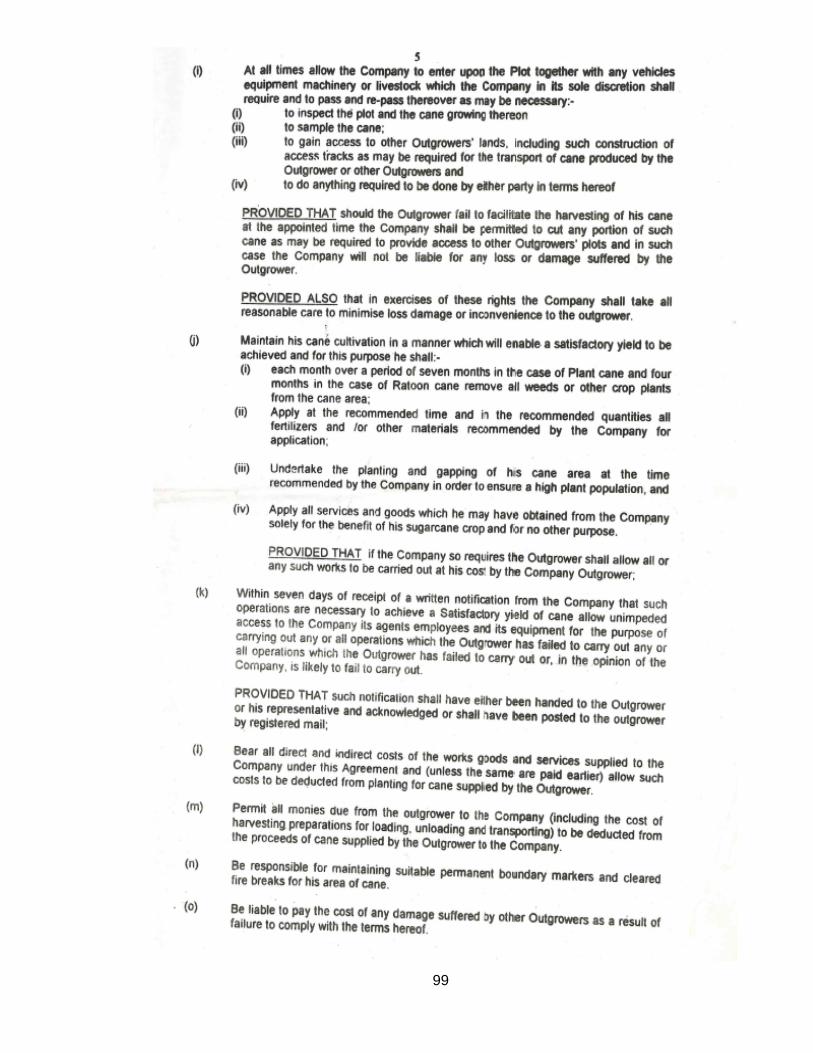
99

100
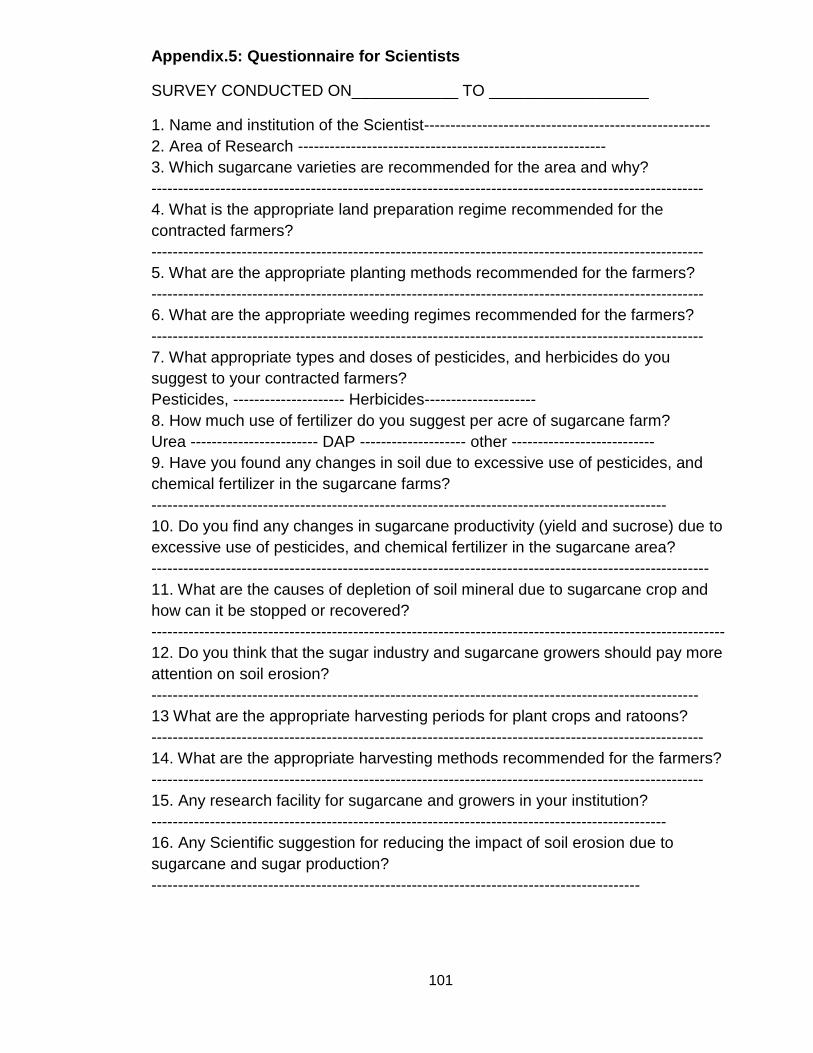
101
Appendix.5: Questionnaire for Scientists
SURVEY CONDUCTED ON____________ TO __________________
1. Name and institution of the Scientist------------------------------------------------------
2. Area of Research ----------------------------------------------------------
3. Which sugarcane varieties are recommended for the area and why?
--------------------------------------------------------------------------------------------------------
4. What is the appropriate land preparation regime recommended for the
contracted farmers?
--------------------------------------------------------------------------------------------------------
5. What are the appropriate planting methods recommended for the farmers?
--------------------------------------------------------------------------------------------------------
6. What are the appropriate weeding regimes recommended for the farmers?
--------------------------------------------------------------------------------------------------------
7. What appropriate types and doses of pesticides, and herbicides do you
suggest to your contracted farmers?
Pesticides, --------------------- Herbicides---------------------
8. How much use of fertilizer do you suggest per acre of sugarcane farm?
Urea ------------------------ DAP -------------------- other ---------------------------
9. Have you found any changes in soil due to excessive use of pesticides, and
chemical fertilizer in the sugarcane farms?
-------------------------------------------------------------------------------------------------
10. Do you find any changes in sugarcane productivity (yield and sucrose) due to
excessive use of pesticides, and chemical fertilizer in the sugarcane area?
---------------------------------------------------------------------------------------------------------
11. What are the causes of depletion of soil mineral due to sugarcane crop and
how can it be stopped or recovered?
------------------------------------------------------------------------------------------------------------
12. Do you think that the sugar industry and sugarcane growers should pay more
attention on soil erosion?
-------------------------------------------------------------------------------------------------------
13 What are the appropriate harvesting periods for plant crops and ratoons?
--------------------------------------------------------------------------------------------------------
14. What are the appropriate harvesting methods recommended for the farmers?
--------------------------------------------------------------------------------------------------------
15. Any research facility for sugarcane and growers in your institution?
-------------------------------------------------------------------------------------------------
16. Any Scientific suggestion for reducing the impact of soil erosion due to
sugarcane and sugar production?
--------------------------------------------------------------------------------------------

102
Appendix.6: Questionnaire for sugar manufacturers Survey conducted on __________ to_____
1. Name and Location or address of the Mill.
2. How much is your sugarcane crushing capacity? --------------------------
3. Size of farm owned by the mill? -----------------------------------------------------
4. Number of Labour employed by mill? (Permanent ------, seasonal -----------)
5. Level of Skill of the labour unskilled ----- semi-skilled ----- skilled ----------
6. What is the average wage rate of labour in your sugar mill for? :
Unskilled -------- semiskilled --------- skilled ----------?
7. Do you have a social security system?
Health --------, education ---------, insurance ----------------, transport ----------
8. Do you follow labour laws? -----------------------------------------------------------
9. Do you provide training facilities to laborers --- or farmers ----------
10. Do you provide credit to farmers? -------------------------------------------------
11. Do you have a contract with growers for the purchase of sugarcane? -----
12. Do you pay quality premium to growers? Yes OR No if yes how much?
13. Are you satisfied with the use of Cess funds for the improvement of access
roads?----------------------------------------------------------------
14. How much sale of byproducts contributes in the overall income of the mill? ---
15. What safety measures have you taken to avoid environment effects of waste
water, smoke and burning of sugar wastage? Hazards? -----------------
17. What is the payment schedule to growers? --------------------------------
18. How much is the average cost of per ton sugar production? Ksh/ton -----
19. What is the mill gate price of per ton sugar? -----------------------------------
20. How much is the profitability margin in per ton sugar sale in domestic market.
21. What you would suggest to minimize the cost of production to remain
competitive in the international markets? ---------------------------------------------
22. Are you aware about the Sugar Arbitration Board and its role?-------------
23. The COMESA safeguards will be coming to an end in February 2013? What
do you foresee as the impact of sugar influx on the sugar industry in Kenya
24. Are you enjoying any production or export subsidy provided by the
government to be competitive in the international market?
If yes in what form and how much ----------------------------------------------------
If not would you demand and in what form and how much? -----------------------
25. What effective tariff protection or non tariff measures would you suggest
restricting sugar dumping in the country at the beginning of 2014 when the
COMESA safeguards expire? ------------------------------------------------
26. How much surplus sugar y can you export each year. -------------------------
27. In which markets do you think your exports are competitive?
1. .................. 2. ................... 3. .................... 4. ..................... 5. .....................
28. Which countries' are Kenya’s major competitors to different markets?
1. .................. 2. ................... 3. .................... 4. ..................... 5. .....................
29. What type of export subsidies are they enjoying from their governments?

103
Appendix.7 Focus group discussion guide
To be used by enumerators
Thank you for agreeing to participate in this activity. We are very interested to
hear your valuable opinion on how the sugarcane industry is performing in Migori
District. We are here to learn from you. As part of a team that is conducting
research for the community needs assessment and your contribution is important
and will contribute to the community
Introduction
The purpose of this study is to learn how the farmers view sugarcane farming and
how satisfied they are with the income that they receive from sugarcane. The aim
is to learn how the government and SONY sugar company can improve the
sugarcane income to increase farmer participation in the SONY contract scheme
in Migori County. The information provided is strictly confidential and whatever
you say in the focus group will not be associated with your name or family. Fellow
participants will also be requested to respect each other’s confidentiality. No
individual name or family name will be attached to the focus group that will be
able to identify you and the record sheets will be destroyed as soon as they have
been analyzed. You may decide not to answer any question or withdraw from the
group discussions at any time without any consequences. Any queries during the
focus group discussions or later can be referred to the facilitator or the team
leader whose name and phone number are indicated below
Please tick the boxes on page 2 and sign to show that you accept to participate in
the focus group discussions voluntarily.
Please check one box
SONY Sugar Company contracted farmers Non-contracted farmers
Date of Focus Group:______________________________
Location of Focus Group:___________________________
Name of Facilitator:________________________________
Consent
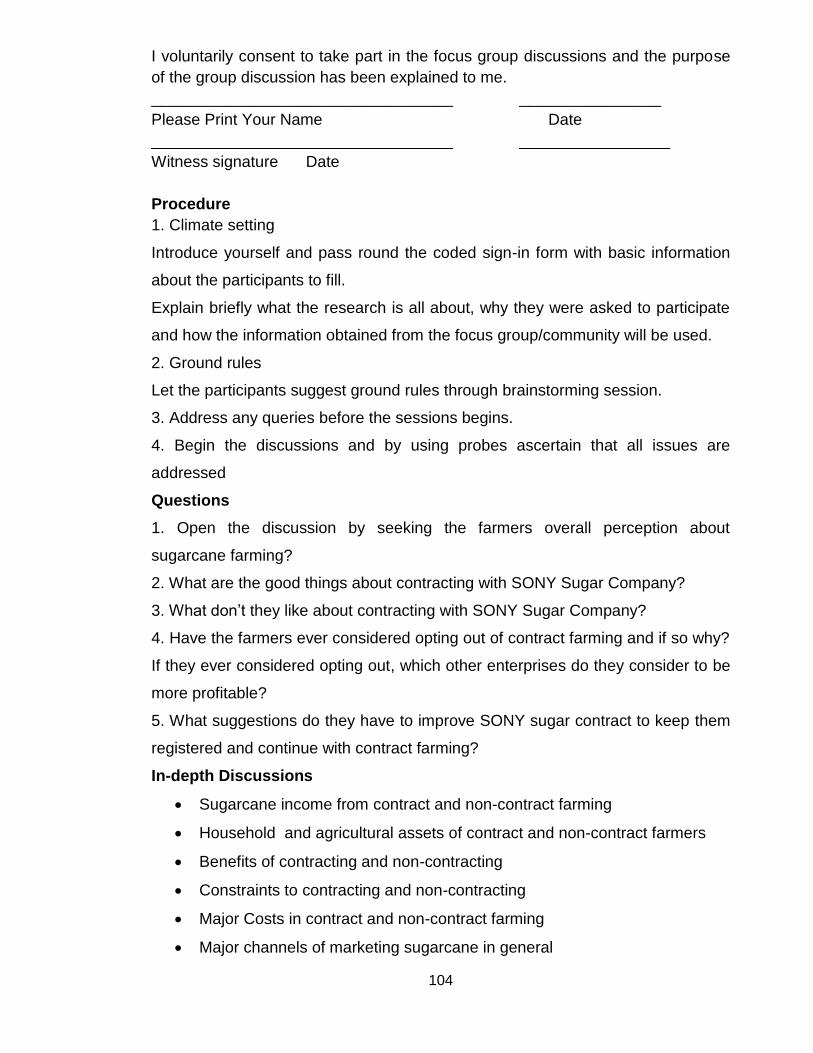
104
I voluntarily consent to take part in the focus group discussions and the purpose
of the group discussion has been explained to me.
__________________________________ ________________
Please Print Your Name Date
__________________________________ _________________
Witness signature Date
Procedure
1. Climate setting
Introduce yourself and pass round the coded sign-in form with basic information
about the participants to fill.
Explain briefly what the research is all about, why they were asked to participate
and how the information obtained from the focus group/community will be used.
2. Ground rules
Let the participants suggest ground rules through brainstorming session.
3. Address any queries before the sessions begins.
4. Begin the discussions and by using probes ascertain that all issues are
addressed
Questions
1. Open the discussion by seeking the farmers overall perception about
sugarcane farming?
2. What are the good things about contracting with SONY Sugar Company?
3. What don’t they like about contracting with SONY Sugar Company?
4. Have the farmers ever considered opting out of contract farming and if so why?
If they ever considered opting out, which other enterprises do they consider to be
more profitable?
5. What suggestions do they have to improve SONY sugar contract to keep them
registered and continue with contract farming?
In-depth Discussions
Sugarcane income from contract and non-contract farming
Household and agricultural assets of contract and non-contract farmers
Benefits of contracting and non-contracting
Constraints to contracting and non-contracting
Major Costs in contract and non-contract farming
Major channels of marketing sugarcane in general

105
labour requirements in contract farming and non-contract farming
Availability of sugarcane extension services for contract farming and non-
contract farming
Availability of company employees when required to solve farmer problems
and supervision
Harvesting duration contract and non contract
Standard of living contract and non-contract
housing
agricultural assets
Food security contract and non-contract
Education for children contract and non-contract
nature of contractual arrangement, registration,
Sugarcane production, incentives, transaction costs and marketing costs.
Data on the benefits and problems in input procurement and marketing of
the produce
Thank you for participating and sharing your views and opinions with us.
END

106
Appendix.8: Summary of the outcome of Focus Group Discussions
1. Benefits and Advantages of contracting with SONY Sugar Company
Inputs provided by the contracting company on credit
Roads maintained by the company
Assured market for the produce
Advance on sugarcane for school fees, or emergencies
Services offered to farmers
1. Land development operations (Survey, ploughing, harrowing, furrowing)
2.seedcane supply
3. Fertilizer supply for both plant crop and ratoon crop (DAP and UREA)
4. Supply of herbicides for chemical weeding
5. Harvesting
6. Transport (input supplied and sugarcane harvested)
2. Production and Marketing constraints of contracting with SONY Sugar
Company
Biased contract terms which are favourable to the agribusiness firm
High interest rates charged on production inputs provided on credit
High cost of fertilizers above market rates due to high interest rates
charged
High company rates for services – land preparation and harvesting
Fraudulent charges for undelivered support services such as extension
services
Inadequate extension services and training
Delayed sugarcane harvest beyond 24 months
Faulty weighing an weighing machines
Harvested sugarcane left on the ground not transported due to bad
weather and impassable roads
Burnt sugarcane by arsonist or through accidental means transported to
the factory and rejected on grounds of deteriorated quality
Poor quantity and quality of seedcane supplied to the farmers through
credit
Low sugarcane yielding varieties

107
Fraudulent filling of job completion certificates and thus inaccurate
sugarcane harvest records
Sugarcane loss due to breakdown of harvesting machinery during
transportation,
Poor quality of harvesting by sub contractors (cutting high above ground
level)
High sugarcane loss due to spillage during loading, and transportation
Theft of sugarcane stacks left overnight due to lack of collection during the
day
Poor land preparation methods by the contractors i.e. farming up and
down instead of along the contour.
High transportation costs
Lack of farmer representation at high decision making bodies of the
organization. The Out-growers Company collapsed due to
mismanagement
Erroneous deduction from the sugarcane proceeds
Lack of credit facilities for farm development
Poor seedcane delivery method = left far from the plot

108
Appendix.9: Conditions for granting Kenya a four year COMESA safeguard
to February 2012
The extension was granted subject to certain conditions, including:-
1 Rising sugar import quota in tandem with a declining tariff as follows: -
2008/09 = 220,000 tons quota (100% tariff rate); 2009/10 = 260,000
tons quota (70% tariff rate); 2010-2014/11 = 300,000 tons quota (40%
tariff rate); 2011/12 = 340,000 tons quota (10% tariff rate); and then 1st
March, 2012 open market.
2 The Government adopts a privatization plan within the first 12 months
and takes verifiable steps to privatize the remaining publicly owned
factories by 2011
3 The industry to implement cane payment system based on sucrose
content instead of weight
4 The Government adopts an energy policy aimed at promoting co-
generation and other forms of bio-fuel production that will contribute to
making the industry more competitive
5 Kenya Sugar Board (KSB) to increase funding for research on high
yielding and early maturing varieties and spearhead its dissemination by
farmers
6 The Government to increase funding for road infrastructure
7 The Government to submit twice yearly performance reports to the
COMESA Council on all measures, activities and improvements on the
sugar sector’s competitiveness.
NB1 Sugar prices in Kenya need to drop by at least 39% to be in line with
COMESA levels. Such a price drop in less than 3 years is drastic and requires
major cost reduction strategies for the industry.
NB2 The COMESA safeguard measures have since been extended to February,
2014.
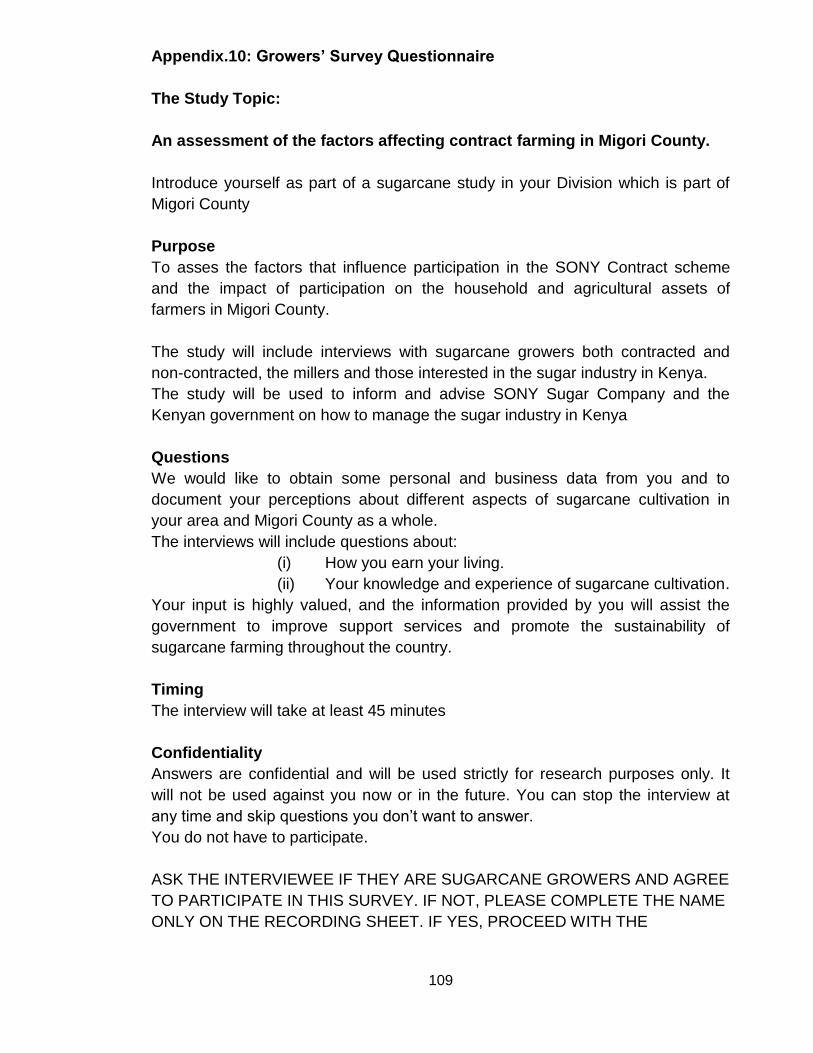
109
Appendix.10: Growers’ Survey Questionnaire
The Study Topic:
An assessment of the factors affecting contract farming in Migori County.
Introduce yourself as part of a sugarcane study in your Division which is part of
Migori County
Purpose
To asses the factors that influence participation in the SONY Contract scheme
and the impact of participation on the household and agricultural assets of
farmers in Migori County.
The study will include interviews with sugarcane growers both contracted and
non-contracted, the millers and those interested in the sugar industry in Kenya.
The study will be used to inform and advise SONY Sugar Company and the
Kenyan government on how to manage the sugar industry in Kenya
Questions
We would like to obtain some personal and business data from you and to
document your perceptions about different aspects of sugarcane cultivation in
your area and Migori County as a whole.
The interviews will include questions about:
(i) How you earn your living.
(ii) Your knowledge and experience of sugarcane cultivation.
Your input is highly valued, and the information provided by you will assist the
government to improve support services and promote the sustainability of
sugarcane farming throughout the country.
Timing
The interview will take at least 45 minutes
Confidentiality
Answers are confidential and will be used strictly for research purposes only. It
will not be used against you now or in the future. You can stop the interview at
any time and skip questions you don’t want to answer.
You do not have to participate.
ASK THE INTERVIEWEE IF THEY ARE SUGARCANE GROWERS AND AGREE
TO PARTICIPATE IN THIS SURVEY. IF NOT, PLEASE COMPLETE THE NAME
ONLY ON THE RECORDING SHEET. IF YES, PROCEED WITH THE

110
INTERVIEW AND REMEMBER TO RECORD THE INFORMATION BELOW,
BEFORE CONTINUING WITH THE QUESTIONNAIRE.
Interview number_____ Date________ Interviewer:____________
Division__________________________ Location____________
Sector___________________________
Name of Sector Head_______________
Distance from sector
head office______Km
Village_____________
Name of Village Elder___________
Distance from village elders
farm_____Km
Start Time___________________ End Time_____________
Would you like a copy of the summary report of the survey results? YES NO
WHERE REQUIRED PLEASE TICK THE MOST APPROPRIATE ANSWER
SECTION A: FARMER AND FARM CHARACTERISTICS
1.Name of respondent?________________________ Gender Male Female
2. Marital Status Single Married Divorced Widow(er)
4. What is your age (years)? ______
3. What do you do on the property?
Owner Husband or wife
Child of the owner Leaseholder Employee
Relative Other(specify)__
4. How long have you lived in this area?
> 20yrs <20 yrs <10 yrs
5. How do you characterize your house? Permanent Semi Permanent
6. What is the house built from (owner of the farm)?
Masonry wood Mud
7. What is the size of your household size (Total)? _____________
8. Number of dependents living in the household?
Females < 15yrs Females 15-65yrs Female>65
Males < 15yrs Males 15-65yrs Male>65
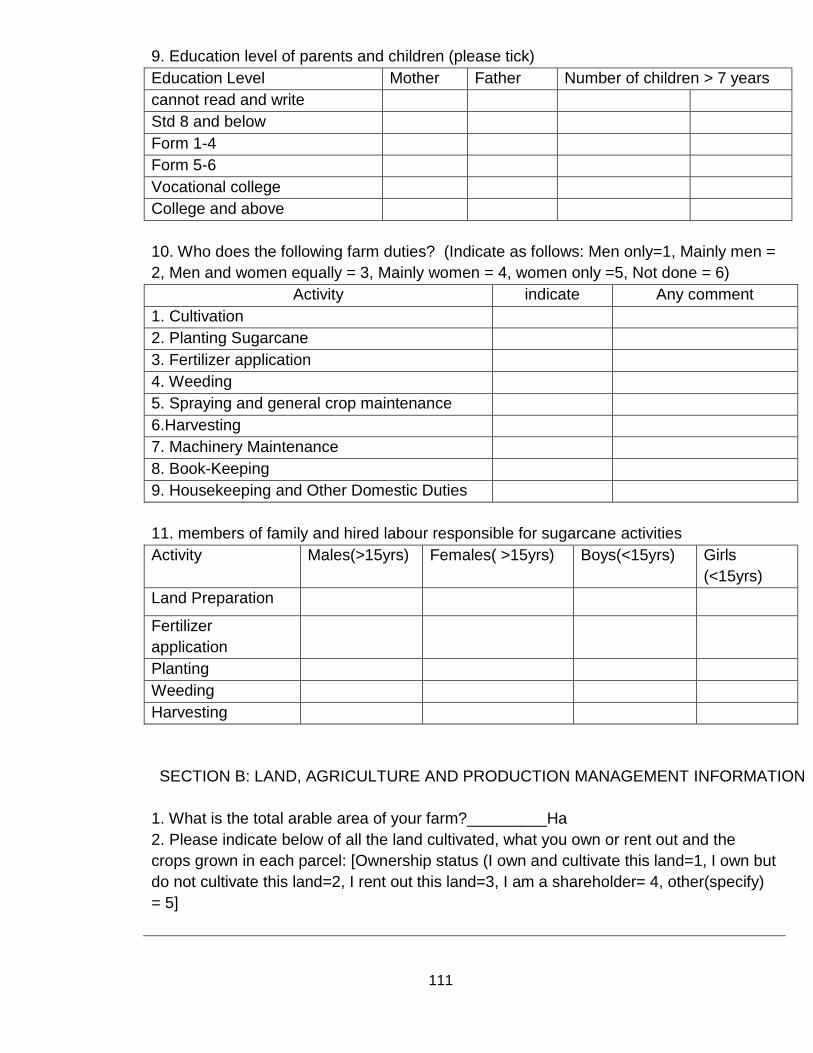
111
9. Education level of parents and children (please tick)
Education Level Mother Father Number of children > 7 years
cannot read and write
Std 8 and below
Form 1-4
Form 5-6
Vocational college
College and above
10. Who does the following farm duties? (Indicate as follows: Men only=1, Mainly men =
2, Men and women equally = 3, Mainly women = 4, women only =5, Not done = 6)
Activity indicate Any comment
1. Cultivation
2. Planting Sugarcane
3. Fertilizer application
4. Weeding
5. Spraying and general crop maintenance
6.Harvesting
7. Machinery Maintenance
8. Book-Keeping
9. Housekeeping and Other Domestic Duties
11. members of family and hired labour responsible for sugarcane activities
Activity Males(>15yrs) Females( >15yrs) Boys(<15yrs) Girls
(<15yrs)
Land Preparation
Fertilizer
application
Planting
Weeding
Harvesting
SECTION B: LAND, AGRICULTURE AND PRODUCTION MANAGEMENT INFORMATION
1. What is the total arable area of your farm?_________Ha
2. Please indicate below of all the land cultivated, what you own or rent out and the
crops grown in each parcel: [Ownership status (I own and cultivate this land=1, I own but
do not cultivate this land=2, I rent out this land=3, I am a shareholder= 4, other(specify)
= 5]

112
Parcel Ha Ownership
status(No)
Crops Grown
Total
3. What is the total land assigned to sugarcane only currently ________Ha
4. What was the total land area assigned to sugarcane only (5) years ago?
______Ha
5. What was the estimated yield from this area (area in 4 above)? _____Tons
6. What was the total Land area assigned to sugarcane (10) years ago?
______Ha
7. What was the estimated yield from this area (area in 6 above)? _____Tons
8. Do you apply long-term pre-emergent herbicides? YES NO
9. Have you ever undertaken a soil sample in your field?
YES NO
10. If yes in 9 above, When?___________(year)
11. Based on soil sample recommendations, do you apply the full recommended amount
Of fertilizer/lime to each field? YES NO
12. If No in 11 above, why? _______________________________________________
13. How many hectares of sugarcane replanting have you done annually in the last 5
years?
Year Area
replanted(ha)
Varieties Did you use certified seed cane OR seed cane
with a history of hot water treatment and disease
inspections?
Yes No
2006/07
2007/08
2008/09
2009/10
2010/11
14. Why did you replant with these varieties?______________________________

113
15. Do you Keep farm records of any kind? YES NO
16. What type of production record keeping system do you use?
Type Yes No Type Yes No
Non Own manual system
No formal system External consultant
Own computerized system (e.g. Excel) Other (please specify)
________________
Other specialized computerized system
(e.g. CanePro, Plan-a-head, etc)
17. What type of financial record keeping (book-keeping) system do you use?
Type Yes No Type Yes No
Non Own manual system
No formal system Other External consultant
Own computerized system (e.g.
Pastel, Plan-a-head)
Other (please specify)
18. Do you own any Livestock? YES NO
19. If yes what do you keep them for?
Livestock Product or
Service
For
Subsistence
For
selling
Other
(specify)
Cows
Bulls
Poultry
Goats
Sheep
Any other(specify)________
20. Please indicate the agricultural implements owned below:
(e.g. hoe, panga, sprayer, oxen plough, etc.)
Agricultural Implement Estimated value (Ksh)
SECTION C: FARM INCOME, EXPENDITURE, AND SAVINGS INFORMATION
1.Has any financial institution provided you with production finance in the last 5 yrs
YES NO

114
2. If yes which financial institutions and rank the quality of service
(Please rank the quality of service provided by this institution as 1 = very poor, 2 = poor,
3= good, 4 = excellent)
Financial institution Farm operation financed Quality of service
3. How can this institution improve their service? ________________________________
_____________________________________________________________________
4. Indicate whether you have received any of these forms of farm support and if so
when you received them:
Source Amount
(Ksh)
Year(s)
received
Government grant
Inputs from Department of Agriculture(fertilizer; chemicals)
Inputs from SONY Sugar Co.
Inputs from any other milling company(specify company)__
Inputs from Church organization(specify church)__________
Any other(specify)__________________________________
General Comments
5. What are your sources of contribution towards financing farm operations?
Source Amount(Ksh) Comments if any
Savings
Government grant (specify which grant)
Sale of assets
Sale of a business
Pension
Retrenchment package
Personal borrowing from family members
Loan against insurance policy as collateral
Informal money lender
Insurance policy
Other (please specify)
6. How much time (hours) do you allocate on average to farming activities each day?
______

115
7. Please indicate income from your major farm enterprises below
Crop output /ha per
season
Amount consumed Amount sold Unit price
Sugarcane
Maize
Beans
Cassava
ground nuts
Sweet potatoes
Vegetables
other crops(specify)
Livestock output Amount consumed Amount sold Unit price
Dairy
Poultry
Goats
Sheep
Any other_______
8. Please indicate your average annual gross farm income (turnover) for the last 5years__
9. Please indicate the amount spent on agricultural inputs in sugarcane production in
2011 (Ksh)
Herbicides Fertilizer
Pesticides
10. What percent (%) of average annual turnover does sugarcane contribute? _______
11. What is your average household living expenses (e.g. groceries, medical expenses,
clothing, electricity, water, rates, school fees, etc) each month? Ksh_______________
12. Do you have any off-farm income? YES NO
13. If yes in (11), what are the sources of this off-farm income? [Please rank 1 for the most
important source of income and 2,3,4,5 for the proceeding successive income sources.
Source of Income Rank specify (what type) who in the household
decide on the income
Sale of crops
Sale of animal and their
products
Sale of labour

116
Own business
petty trading
Contracting
other (please specify)
14. If Yes in (12), what is your average annual gross off-farm income (Ksh)?(please tick)
1-25,000 25,000-500,000 500,000-1,000,000 1,000,000-1,500,000 Over
1.500,000
15. Do any of your dependents (e.g. spouse or children) have off-farm income?
YES NO
16. If Yes in (15), what is the average annual off-farm income from your dependents
(Ksh)?
1-25,000 25,000-500,000 500,000-1,000,000 1,000,000-1,500,000 Over
1.500,000
SECTION D: SUGARCANE FARMERS ATTITUDE TOWARDS RISK
1. Please indicate your willingness to take risks relative to other farmers in your area.
Much less willing Slightly less willing Similar Slightly more willing Much more
willing
2. Please indicate the risk management strategies that you commonly use:
Strategy Yes No strategy Yes No
Enterprise diversification Livestock insurance
Off-farm investment Other (please specify)
Crop insurance
Fire insurance
Keep cash reserves
3. Would you sell your farm to reduce your losses in a financial and/or agronomic crisis?
YES NO
Why? _____________________________________________
4. What would you do to cope with an unanticipated drop in annual gross farm income?

117
D. EXTENSION SERVICE
1. How do you learn about agricultural information? Please rank the 5 most important
channels 1,2,3,4 etc.
Channel YES/ NO Rank Comments if any
1. Television channels
2. Local radio channels
3. National radio channels
4. Local press
5. National press
6. Internet
7. Posters and Brochures
8. Village meetings
Other (specify)
2. What are your most important sources of information on sugarcane production and
rate the usefulness(rate as 1= most useful up to 10 least useful
Source of information YES/
NO
RANK Comments if Any
Radio programmes
TV programmes
Family
The local cane growers office
Government Agency
Company extension service
Milling company
NGO
Other Cane Growers
Milling Company Representatives
Locally Elected Leaders
Agricultural Supply Firms
Others(Specify)________________
3. Have you received any agricultural extension/training during the last 5 years?
YES NO
4. On which farm enterprises did you receive agricultural extension/training in (3) above?
Enterprise YES/NO Year Type of Training
Sugarcane
Livestock production
Staple crops( maize, rice cassava,

118
Protein crops(e.g. beans, groundnuts
Vegetables
Any other(specify)______________
5. If you have received training on sugarcane production in (6) above please describe the
source, and quality of training. ( indicate the quality of advice provided as 1 =very
poor,2= poor,3= good,4 = excellent)
Year Source Training Quality Any comments
6. Have you used the suggestion given?
YES NO
7. If your answer is yes, what are the changes made after suggestions?
1.__________________________________________________________________
2.__________________________________________________________________
3.__________________________________________________________________
8. What benefits did you get as a result of your participation in the training in (5) above?
Benefit YES/NO Comments if any
Improved Income
Education
9. Is the mill contractor providing any specialized technical or financial training or
guidance on farm management practices in sugarcane production?
YES NO
10. If yes in (9) above please indicate the training
_________________________________________________________________
11. Do you consider yourself experienced in these disciplines
Discipline YES NO Period (Years) Comments if any
Agriculture
Finance
Management
Other (specify)__________

119
12. How many permanent staff do you have? _____________
13. What percentage (%) of your permanent staff has attended a training course in
their area of operation/responsibility? _________
E. MARKET APPROACH
1. Where did you market your sugarcane harvest in the last 5 years?
( please indicate below as 1=Contractor, 2= Middlemen, 3=spot market(jaggery
processor), 4=Syndicate, 5= Other(specify)
Year Ha Tons Contracted Non-
contracted
Where to (no.
above)
Specify(name)
2010/11
2009/10
2008/09
2007/08
2006/07
2. If contracted in (1) above how far (Km) is your farm to the miller? ______________Km
3. If contracted in (1) above what is the period of Agreement(years)__________
4. How many tons of sugarcane did you harvest last?
________Tons________Ha____Year
5. Who harvests your cane? (Tick)
Self Syndicate Contractor Middlemen
Other (please specify)______________
6. How often do you check the quality of harvesting, specifically base cutting, topping
height and the level of extraneous matter?
Daily Every second day Leave it to the supervisor or contractor
7. Is your cane burnt/trashed at harvest? YES NO
8. If contracted, what is the average planting to harvest period (months) for plant crop for
your cane in the last 5years?
<24 24-30 31-37 38-44 44-50 >51 Unknown

120
9. If contracted, what is the average planting to harvest period (months) for ratoon crop for
your cane in the last 5 years?
<18 18-22 23-26 27-30 31-34 >34 Unknown
10. If contracted, what is the average time (hrs) required for marketing (harvest to factory
gate delay) for cane harvested on your farm?
<24 24-36 37-48 49-60 >60 Unknown
11. How much is the loss of sugarcane weight due to stay outside the mill?
significant little Non
12. What is the payment schedule by the miller? No of days______________
13. what is the mode of payment cash Cheque
14. Marketing attributes with the buyer(indicate YES or NO)
Attribute Contract Non-
contract
Comments
(%?)
Price fixed with the buyer at planting
Quantity demanded fixed with buyer at planting
Grading required by buyer
Payment by cash immediately after delivery
Payment by cheque 2 weeks after delivery
Free to deliver produce when ready/available
Delivery scheduled by buyer/contractor
Produce sold at farm gate
Produce transported to the factory/milling plant
Investment needed to
enter market
No investment
Minimal investment
Significant investment
15. Are you interested in expanding your sugarcane production?
YES NO
16. If Yes, up to what extent _______Ha. Reason________________________________
17. If No what are your reasons? (Please rank 1,2,3,4 etc)
Reasons Rank Comments if Any
Land shortage for sugarcane
Labour problem
I prefer other crops
121
Marketing problem
Not profitable
Other specify______________
18. Does the road network affect accessibility of produce to the market?
YES NO
19. If Yes for which produce?
Produce Very Much Much Not At All
20. What other marketing problems do you face and how can they be removed?
Marketing problem How they can be removed
F. PERCEPTIONS AND EXPECTATIONS
1. What are the main reasons for growing sugarcane? ______________________________
________________________________________________________________________
2. What should be the role of government to enhance the productivity of sugarcane in your
area? ____________________________________________________________________
3. Do you think sugarcane production is more productive than any other farming enterprise in
your area?
YES NO
4. If No which other crops could be more profitable than sugarcane (in order of
priority if more than one)
1.__________________________________________________________________
2.__________________________________________________________________
3.__________________________________________________________________
4. __________________________________________________________________
5. How is your income status or standard of living when compared to 5 years ago?
Better Worse The Same
6. What is the reason for this?______________________________________

122
7. Farmer attitude towards issues affecting growers at the local or community level
Issue Very
positive
positive negative very
negative
No
impact
Cane contract arrangement
Cane planting
Cane cultivation
Farm input provision
Weeding arrangement
Harvesting duration
Harvesting arrangement
Transport arrangement
Payment system
The mill processing capacity
other(specify)____________
8. What happened to your sugarcane production (yield) in the last 5 years?
Increased decreased did not change
9. Why did sugarcane production increase? (please tick as much as relevant)
Reason Comments if any
Contract terms got better
The quality of seeds got better
Usage of chemical fertilizers and pesticides have
increased
I bought agricultural equipments
My management style got better after training
Other, please specify______________________
10. Why did your sugarcane production decrease? (please tick as much as relevant)
Reason Comments if any
Decreasing soil fertility
Lack of agricultural equipments
Not using enough fertilizer/pesticide
Lack of labour
High cost of inputs thus using less
Unfavorable climatic conditions
Lack of credit for farm operations
Other, please specify________________________

123
11. What are the solutions you are taking to solve the problems?
Constraint Solutions
12. What are the major constraints of sugarcane production in the area in general?
(Please rank * 1 = most serious constraint: highest number in the list: the least
constraint=10)
Constraint type Give explanation Rank in order*
Information shortages/inadequate training
Contractor unreliability
poor soils
low rainfall(drought)
lack of fertilizer
high cost of inputs
lack of seed
crop insect pest and diseases
lack of credit
lack of equipment
delayed cane harvesting
market problem
low price of produce
faulty grading by buyer
provision of inputs at higher rate
delay in inputs delivery
cheating by agency
poor quality inputs
lack of government control
delay in procurement of produce
lack of government control
delayed payment for produce
Longer hungry season due to sugarcane
Low payment rate by contractor
poor service delivery by firms
scarcity of labour during peak periods
Other ( specify)
*For hungry season indicate duration(months) _________________

124
13. Please respond to this statement: —’Annual profits from sugarcane farming are low
relative to the land value“.
Strongly Agree Agree Uncertain Disagree Strongly Disagree Other
(specify)
14. Please respond to this statement: —The long-term sugarcane supply agreement
constrains you from diversifying into other farm enterprises“.
Strongly Agree Agree Uncertain Disagree Strongly Disagree
15. How do you consider yourself?
Comment if any
Very poor
Poor
Lower middle income level
Middle income level
Higher middle income level
Rich
Very Rich
16. Please comment below on any other aspects of the SONY Sugar out grower
scheme and/or your experience with any of the industry role players that concern you:
_________________________________________________________
Signature (principal decision-maker)_____________________________Date:______
Thank you very much for your valuable participation. Your confidential contribution is
greatly appreciated.
If you have any further questions about this survey, please contact:
Mr. Lumumba Kokeyo,
University of Nairobi,
Department of Agricultural Economics
Kabete Campus,
Private Bag
Nairobi.
Cell: 0725 228 398; E-mail:[email protected] or [email protected]

125
Appendix.11: Sugar production, consumption, imports and exports trends
Source: (Kenya Sugar Board, 2009)