Embed Size (px)
Citation preview

AN ASSESSMENT OF THE FORCES ACTING UPON A CENTRIFUGAL IMPELLER
USING FULL LOAD, FULL PRESSURE HYDROCARBON TESTING
by Cyril Borer
Senior Development Engineer
James Sorokes Supervisor of Aerodynamics
Dresser-Rand
Olean, New York
Thomas McMahon Mobil Technology Company
Paulsboro, New Jersey
and Edward Abraham
Supervisor of Solid Mechanics
Dresser-Rand
Olean, New York
Cyril J. Borer is a Senior Development Engineer for Dresser-Rand in Olean, New York. His responsibilities include the mechanical design of turbocompressors and team leadership of single stage testing. He has previously held staff engineering positions in test and in gas turbine design during his 22 years at Dresser-Rand.
Mr. Borer received a Master of Engineering degree from Cornell University (1970), followed by a
mechanical engineering assignment to the U.S. Army nuclear test facility at Aberdeen, Maryland. He is an ASME member and has coauthored a paper for the Process Compressor Subcommittee of ICCAMC on the "Influence of the Reynolds Number on the Performance of Centrifugal Compressors."
T homas McMahon is currently employed with Mobil Technology Company, a part of Mobil Oil Corporation. He works out of the Dallas, Texas office in the Surface Engineering Onshore Group. Mr. McMahon has worked for Mobil for 15 years in the field of acoustics, solving flow induced and noise problems. He previously worked for Consolidated Edison of New York in the area of noise control.
Mr. McMahon has a Bachelor in Engineering (Chemical) degree from Manhattan College (1974). He is a member of ASME and the Institute of Noise Control Engineering.
20 years.
James M. Sorokes has been Supervisor of Aerodynamics with Dresser-Rand in Olean, New York, since 1984. His primary job functions include the development, design, and analysis of all rotating and stationary aerodynamic components of centrifugal compressors. Recently, his group's responsibilities were expanded to include turbine aerodynamics along with turbine and compressor performance-related issues. He has been with Dresser-Rand for more than
Mr. Sorokes received a B.S. degree from St. Bonaventure University ( 1976). He is a member of AJAA, ASME, and the ASME Turbomachinery Committee. He has authored or coauthored numerous technical papers and holds two U.S. patents.
ll1
ABSTRACT
Although turbocompressors have been designed, built, and used in increasingly stringent conditions for more than 80 years, the turbomachinery industry, like all comparable industries, can only design and manufacture its products within the realm of existing knowledge and foreseeable operating, engineering, and scientific parameters.
As end users of turbocompressors continue to implement ever more complex and demanding assortments of processes and process variables into their operations (i.e., equipment efficiencies, higher pressures, and the like), previously unseen combinations of factors can create new and unpredictable forces and effects on equipment. These unpredictable forces may, at different times, cause destructive results in the end user's facility, such as in piping, valves, gauges, tanks, etc. It is possible for these forces, which may only exist under the unique circumstances present at the end user's site, occasionally to manifest themselves in the centrifugal compressor rotor. When this occurs, the rotors may exhibit such phenomena as rotordynamic excitation, less than anticipated

112 PROCEEDINGS OF THE 26TH TURBOMACHINERY SYMPOSIUM
aerothermal performance, or even a physical failure of a rotor or other component.
When this unfortunate circumstance occurs, turbocompressor OEMs dedicated to both customer satisfaction and continued expansion of knowledge and technical responsiveness, will investigate (typically in cooperation with the end user) to determine, if possible, the full range of dynamics that may be occurring during process operation at the end user's site, so that the turbomachines can, if possible, be made to withstand the unforeseen forces. These efforts typically involve some combination of analytical studies and research testing; analytical work to provide a sound computational model, and testing to provide the data necessary to calibrate or bound the models.
The test program and results described herein represent an OEMs and end user's efforts to identify the cause of repeated impeller failures in an offshore gas reinjection compressor. A machine identical to the field units was fully instrumented with aerodynamic and mechanical instrumentation (including radial and axial vibration probes, dynamic and static straingauges, dynamic pressure transducers, and other interstage pressure and temperature instrumentation). The compressor was then tested at full load and full pressure on hydrocarbon gas at the OEMs facility. Descriptions of the instrumentation and test procedure are provided.
Concurrently, analytical efforts were undertaken to help understand the aerodynamic forces that may be contributing to the failures. Results from both the testing and the computational studies are presented along with the conclusions derived from both efforts.
INTRODUCTION
One of the most demanding applications for a centrifugal compressor is gas reinjection. The high operating pressures, often in excess of 5000 psia discharge, and wide flow range requirements subject compressor components (rotating or stationary) to aeromechanical forces far beyond those experienced in lower pressure applications. Many reinjection facilities are located in remote sites; such as Alaska's North Slope and offshore platforms in the North Sea, off the coast of Africa, or in the Gulf of Mexico. Consequently, reliability is of utmost importance. Therefore, when developing a compressor for reinjection service, it is imperative to understand the forces acting upon the turbomachine to ensure that it can withstand the severe loads without frequent overhauls, or worse, component failures.
Sophisticated stress and aerodynamic analyses are performed in an effort to predict or account for the aeromechanical forces acting on the compressor internals. The accuracy and validity of these analyses depend heavily on application of proper boundary conditions or loads. If erroneous boundary conditions are applied, the analyses may fail to detect critical forces acting upon components. This is particularly true for abnormal, 'off-the-map' operating conditions where analytical predictions of loads are difficult, if not impossible. These undetected forces, if substantial, could lead to rotordynamic problems, structural concerns, or, in extreme cases, may cause component failures.
Despite years of work by turbomachinery vendors and researchers, knowledge of the forces acting upon a centrifugal rotor is incomplete. OEMs still encounter unexpected difficulties that arise as a consequence of this lack of understanding. The extensive test program described herein grew out of a desire to understand the phenomena that contributed to one such problem. The facility discussed consists of four compressor trains. Each train is driven by a GE LM2500 with a DR-61 power turbine.
There are five sections included. The first, written by the end user, presents background on the compressor application, the operating requirements, and the events leading up to the inhouse testing. The second section provides a general overview of the inhouse test program and a detailed discussion of the instrumenta-
tion employed. The third section addresses the aerodynamic results obtained; from analytical work done prior to the testing and from the testing itself. The fourth section describes the information obtained from the static and dynamic straingauges mounted on the rotating impellers. Finally, conclusions from the testing and analytical work are presented.
BACKGROUND
Installation Description
The installation is a high pressure reinjection facility used to reinject gas evolved from stabilizing the produced crude/condensate. The facility consists of four compressor trains (two low pressure trains and two high pressure trains). Each train is driven by a power turbine site rated at 26,400 bhp at 5500 rpm. At operating conditions with both trains running, the actual pressure needed at the compressor common injection header is slightly less than design at approximately 5200 psia.
The low pressure trains consist of two compressor bodies with three sections of compression. The high pressure trains also contain two compressor bodies but include a speed increasing gear to run at 10,750 rpm. The problems investigated by the test program occurred in the second compressor body of the high pressure train.
Suction for the two high pressure trains is provided through a common header by the discharge of the low pressure compressor trains and from the OSO inlet separator at 1400 psia. The gas flows through two sections of compression with cooling after the fourth compression section and discharges into a common header from the fifth section discharge at a design pressure 5530 psia. The compressor discharge header connects to a piping system that transports the gas to the riser platform where it is distributed to the injection wells.
The fifth section compressor is a six stage back-to-hack design with an internal crossover, i.e., no intercooling between sections. To illustrate the back-to-hack concept, a cutaway view of a 10 stage compressor is given in Figure 1. In the design pictured, flow enters the main inlet, passes through five centrifugal stages, and is collected in a volute. It then passes through the crossover (at the bottom of the figure), the second section inlet, through five more centrifugal stages before being collected in a volute and exiting the final discharge.
Figure 1. Back-to-Back Compressor-Conceptual Schematic.
During operations, it is possible that either the low pressure or high pressure train can trip. When a low pressure train trips off, the other three machines attempt to make up the flowrate and pressure difference. The result is a reduced flowrate with the high pressure machines making up more head at reduced volume. However, when a high pressure machine trips off, the other high pressure

AN ASSESSMENT OF THE FORCES ACTING UPON A CENTRIFUGAL IMPELLER
USING FULL LOAD, FULL PRESSURE HYDROCARBON TESTING 113
machine is forced to compress more gas, since both low pressure machines and the inlet separator remain online. In addition, the system resistance is reduced due to the lower discharge flowrate caused by having only one compressor online. Given the driver capabilities, there is sufficient available power to operate the compressor in the overload region of the performance map. From an operational standpoint, this is acceptable. The reservoir will accept as much gas injection as the compressors can deliver at the correct pressure and the more gas that can be injected, the longer the life and productivity of the reservoir.
Failure Chronology
Within a few hours after bringing the compressors online at full load, one of the trains shut down due to excessively high vibrations in the high pressure compressor. Upon opening the machine, inspection discovered a catastrophic impeller failure in the third stage. The inner portion of the disk had separated from the remainder of the impeller as shown in Figure 2. Initial theories focused on surge as the most likely cause for the failure as:
• The failure appeared to be the result of a severe axial force (commonly experienced during surge).
• There had been some uncertainties in the setup of the antisurge system.
Believing the key to preventing the failures was better control of the process, a replacement rotor was installed and the unit was put back into operation. However, shortly after the failure in the first train, an identical failure occurred in the second train. There were no suspected surge excursions on the second unit as the control system for this train had been established correctly.
Figure 2. Photograph of Failed Impeller.
Having experienced two failures and having ruled out surge as the likely cause, analytical investigations began that focused on possible resonance conditions from interferences with stationary vanes upstream or downstream of the third stage impeller. Interference diagrams did show possible crossings of impeller natural frequencies with both the 16 diffuser return channel vanes upstream from the impeller and the six division wall support vanes downstream. In order to elitninate these interferences, the number of return channel vanes was changed from 16 to 17 and the number of division wall support vanes was changed from six to 12. At this point, the third stage impeller design was not changed. These fixes were implemented only to have another third stage failure after less than 20 hours at full load.
Having experienced three nearly identical impeller failures in the same physical environment (albeit in two different compressors and small changes in upstream and downstream stationary geometries), it was evident that the existing impeller design was incapable of withstanding the forces acting upon it.
Accordingly, a new, more robust impeller was developed. Since the exciting mechanism remained a mystery, there was no means to assess the new design's ability to tolerate the field conditions. Lacking any more proven approach, the existing configuration was modified to achieve a substantial change in impeller natural frequency. All wall and blade thicknesses were increased and the number of blades in the impeller was reduced from 15 to 13. This more robust design was later shown analytically (based on an assumed dynamic load) to have both a significant increase in natural frequencies and a significant decrease in stress in the critical location.
The new robust impeller design was placed in field operation and ran successfully for nearly two years. After 17,000 hours, a catastrophic failure occurred that was nearly identical to those of the earlier, less robust impellers. This marked the fourth failure of a third stage impeller on two 'identical' compressors and the fifth failure overall. (Previous to the redesigned third stage impeller failure, the sixth (last) stage had failed after about 12,000 hours of operation. However, no repeat failures of sixth stage impellers have occurred on either compressor.)
Metallurgical analyses of the original and redesigned third stage impellers were performed by the OEM and by an outside consultant. These ,analyses indicated that cracks on the original design initiated simultaneously at all 15 blade noses at the juncture of the slot weld to the blade. The cracks started at nucleations of about eight tnils. Both parties judged that the indications served as nucleators to the cracks but were not the cause of the cracks. The external consultant judged that the weld profile was very good and that all welds were acceptable. Typically, three or four initiation sites were found on both sides of each blade (suction and pressure sides) very close to the nose. The failures were definitively categorized as fatigue. They were not environmentally assisted; all chemical and physical properties being within specification. The redesigned impeller showed cracks initiating at eight of 13 blades. These were at the slot weld to disc juncture, about 0.5 in to 1.0 in from the leading edge on the suction side only. Like the original impeller, the cracks started at indications with typically three or four initiation sites at each of the eight blades.
Extensive analytical investigations were conducted in an attempt to understand the cause of the failures. Initially, these were focused on whether the impellers could have failed as a result of normal ( 'on-the-map') operation. Excessive stress, fatigue, and resonance were all elitninated as possible causes during normal operation. Analytical investigations of 'off-the-map' causes are continuing. However, the definition of 'off-the map' dynamic loads has been extremely difficult. One fact remained clear. Though the thicker walls of the redesigned third stage impeller allowed the impeller to withstand the exciting forces longer, the unknown stimuli still caused the wheel to fail.
Since the unknown forcing function prevented a successful identification of the failure mechanism analytically, and since an impeller failure every two years is clearly not an acceptable situation, an extensive test program was initiated in an attempt to identify the forces causing the failures.
TEST PROGRAM
Objective
The objective of the shop test program was to identify and eliminate the mechanism(s) causing failure. Resonance arising from an acoustic source or phenomena generated at stall conditions was considered to be prime candidates for cause of failure.
Conditions
The test program was designed to approximate very closely the site operating conditions for direct correlation of shop test results to the site (Table 1). The test gas was obtained by online,tnixing of pipeline gas with propane. This gas provided the opportunity to conduct a PTC-10 [14] Class I performance test.

114 PROCEEDINGS OF THE 26TH TURBOMACHINERY SYMPOSIUM
Table 1. Compressor Design Point Operating Conditions.
Site Shop
Inlet Pressure, PSIA 2618 2618 Inlet Temperature, °F 105 105 Inlet Capacity, ACFM 744 742 Molecular Weight 21.85 21.73 Isentropic Exponent 1.167 1.166 Avg. Compressibility Factor .878 .727
Discharge Pressure, PSIA 5530 5530 Discharge Temperature, °F 192.2 192.7 RPM 10236 10299
BHP 11081 11293
Test Configuration
A duplicate compressor was assembled and outfitted with unique instrumentation for test. The rotor for this machine was configured with a third stage impeller of the original design. This compressor was installed in a closed loop system on the hydrocarbon test bed at the test facility (Figure 3) . The compressor was driven through a speed increasing gear by a steam turbine. An auxiliary boost compressor was -employed to maintain inlet pressure.
Figure 3. Photograph of Compressor-Shop Test Setup.
Instrumentation
To meet the test objective, the compressor had to be instrumented to identify the aerodynamic and mechanical forces within the machine. Knowledge of the hydraulic performance of the compressor was also required to synchronize amplitude and frequency of the dynamic data with location of the compressor on its operating map.
Instrumentation was concentrated in the area of the third stage, since impellers of the original design demonstrated the most
pronounced and replicated failures. Instruments were also installed throughout the machine, as conditions leading to the failures may arise upstream (or downstream) of the problem stage (Figure 4).
DP•DYNAMIC PRESSURE DISCHARGE TP•TOTAL PRESSURE & TEMPERATURE DP
�¥:�t����csfm�N r--------t..cr.:..P _______ _ PS•STA TIC PRESSURE
DP DP DP
Figure 4. Compressor Cross Section Showing Instrumentation Location.
To access hydraulic performance, total temperature and pressure measurements were made at each stage of compression, in addition to the inlet and discharge of the compressor. Flow was measured with an orifice run located upstream of the compressor inlet. Gas specific gravity was continually monitored and frequent gas samples were acquired for analysis.
Dynamic pressure probes were employed to detect transient phenomena such as pressure pulsation that might be contributing to the failures. Dynamic straingauges were applied to impellers to measure the influence of any phenomena on them. Static pressure taps were located at the inlet and discharge of the third stage to map the pressure field surrounding that impeller.
Dynamic pressure was measured by high impedance transducers coupled with dual mode charge amplifiers. Nine of these transducers were located internally and five external to the compressor body. A bulkhead connector specially configured for use was employed to seal the internal transducer leads at case exit locations. Transducer location and quantity were:
• Internal, behind impeller disc, quantity of two (Figure 5)
• Internal, diffuser wall, quantity of three (Figure 5)
• Internal, return bend, one each for stage one, two, four, and five (Figure 5)
• External, crossover channel, quantity of three
• External, inlet and discharge spool piece, one each
Dynamic straingauges were applied to stage two, three, four, and six impellers during the different phases of testing (Figure 4). Gauges were applied to external (to the primary flowpath) disc and cover surfaces and on the impeller blade leading edge as close as possible to the failure site. Lead wires entered the shaft through a tight clearance plug inserted into a radial hole, which intersected with a central 3/4 in bore (Figure 5). These lead wires terminated at junctions bonded to the outer diameter of this bore at the nondrive end of the shaft. From these junctions, a short section of Teflon®
insulated multistrand lead was joined to a final section of Kapton®
insulated single strand lead. The Teflon® lead was required for flexibilW during assembly and strain relief during operation. The Kapton insulated wire was used for its compatibility with the compression seal at exit to atmosphere. This seal was contained within the slip ring drive hub, which was bolted to the compressor

AN ASSESSMENT OF THE FORCES ACTING UPON A CENTRIFUGAL IMPELLER
USING FULL LOAD, FULL PRESSURE HYDROCARBON TESTING 115
STRAIN GAGE LEAD
Figure 5. Location of Dynamic Pressure Transducers.
shaft end. A 60 ring mechanical slip-ring coupled to this hub by means of a hollow flexible drive shaft was employed to convert the rotating straingauge signal to a stationary output (Figure 6). Signal conditioning was accomplished by using a constructed dynamic stress console consisting of 30 channels of isolated potentiometric straingauge bridge completion.
Figure 6. Slip Ring Schematic.
Shaft displacement was monitored by an industry standard proximity probe and monitor system. Two radial probes were
located at each journal bearing and one axial probe was located at the thrust disc.
Signal monitoring was accomplished by use of 14 channels of analog oscilloscope and three channels of FFT spectrum analyzer. All dynamic data were recorded on FM tape recorders. Hydraulic performance data were logged at approximately 20 sec intervals by a digital data acquisition system.
Static pressure taps were located at six points around the circumference at each of:
• The inlet
• Near the impeller exit
• Near the diffuser exit
of the third stage impeller (Figure 7) . Steel tubing sealed by a compression gland was used to conduct the static pressures to a bank of 18 pressure transmitters.
Figure 7. Location of Static Pressure Taps.
Test Operation
STATIC PRESSURE TAPS
THIRD STAGE IMPELLER
The compressor was operated on and outside of its projected flow map (Figure 8). Discharge pressures as high as 6250 psia were achieved during testing at 10,750 rpm. The compressor was intentionally put into stall at four different speeds (data points four, six, seven, and eight) to investigate stall as a failure cause. The machine was also operated extensively at very high flowrates, including a 20 hour endurance run to assess the effects of operation in deep overload.
ANALYTICAL EFFORTS (AERODYNAMICS)
In an attempt analytically to determine the forcing functions acting on the third stage impeller, two independent computational fluid dynamic (CFD) studies were performed. It was felt these studies might identify some adverse flow or pressure fields that could explain the failures, or possibly provide an excitation mechanism, that may be exciting the impeller natural frequencies. The first investigation concentrated on possible contributions of

116 PROCEEDINGS OF THE 26TH TURBOMACHINERY SYMPOSIUM
HEAD
Minimum Flow Line \ Test Points -.f
•
FLOW
Maximum Flow Line
Figure 8. Compressor Peiformance Map Showing Test Points.
the diffuser and volute geometries, while the second focused on the behavior of the impeller at various flow conditions.
CFD Results-Diffuser/Volute Analyses
The CFD results for the diffuser and volute analyses proved to be extremely interesting as they showed that a nonuniform pressure field was being created around the circumference of the machine. This finding is consistent with those of Flathers and Bache [ 1], which clearly showed that flow within the volute and around its "tongue" or "cutwater" was causing a nonuniform static pressure field, and that this field would cause an unbalanced force at the exit of the impeller. These CFD analyses also showed that as the flowrate was increased from near surge to overload, the magnitude of the pressure variation increased. For illustration, the results provided in Figure 9 are the pressure field in the volute when the stages are running near surge. The "near surge" analyses indicate that the pressure varies by approximately 400 psi. In Figure 10 the overload condition, the M>, has increased to in excess of 900 psi. Clearly, the nonuniformity is more severe in overload than at surge.
STATIC PRESSURE DISTRIBUTION NEAR SURGE
Figure 9. Diffuser/Volute Pressure Distribution at Near Surge Operation-CFD Result.
STATIC PRESSURE DISTRIBUTION NEAR OVERLOAD
Figure 10. Diffuser/Volute Pressure Distribution at Overload Operation-CFD Result.
Also of significant interest, the CFD results suggest that the direction of the net force acting upon the impeller would rotate relative to the volute tongue as the flowrate increased from near surge to overload. Note the location of the minimum vs maximum static pressure in the contour plots given in Figures 9 (near surge) and 10 (overload). The direction of the net force has rotated relative to the volute tongue.
The pressure non uniformity by itself may not be sufficient cause for concern but when coupled with the results obtained in the impeller analyses, it may shed further light on a possible excitation force.
CFD Results-Impeller Analyses
In an attempt to understand how varying flowrate could influence the flowfield within the third stage impeller, a matrix of CFD runs were performed using the Dawes code, BTOB3D. In the study, the impeller was analyzed at flowrates from 50 percent to 2 10 percent of the BEP mass flow. The intent of the study was to determine if any abnormalities were occurring in the flowfield that might contribute to an excitation force or initiator for the impeller failures.
Results for flowrates at or below the BEP mass flow were, for the most part, uninteresting and, therefore, will not be discussed. However, at progressively higher flowrates and the associated increase in negative incidence on the impeller leading edge, a notable trend began to emerge. At near 160 percent to 170 percent of BEP flow, the flow begins to separate from the pressure surface of the impeller blading, as illustrated in the streakline plot given in Figure 11. The stagnation point (maximum static pressure) had moved to the suction surface side of the leading edge (concave side of blade). There was also a region of depressed static pressure on the pressure side of the blade (convex side) caused by the separation bubble (Figure 12). In short, the difference in static pressure level was increasing. Further increases in flowrate yielded even higher M>s between the suction and pressure surfaces. In short, the force across the blade leading edge intensified substantially with increased incidence.
The general trend in pressure differential suction surface to pressure surface is shown in Figure 13. Note the exponential increase in the pressure ratio for flowrates above 180 percent of BEP flow. Should the impeller be operating at high negative incidence and elevated inlet pressures, the pressure load across the blade leading edges could become extreme. For example, in reviewing the case of the impeller operating at 185 percent BEP flow with an inlet pressure of 3000 psi, the pressure variation across the leading edge would be in excess of 1200 psia!

AN ASSESSMENT OF THE FORCES ACTING UPON A CENTRIFUGAL IMPELLER
USING FULL LOAD, FULL PRESSURE HYDROCARBON TESTING 117
Figure 11. Streakline Plot of Impeller Flowfield-Overload Operation.
Figure 12. Impeller Pressure Contour Map-Overload Operation.
4.5
4
(i) 3.5
S: 3 a.. -2.5
i 2
a:- 1.5
1
0.5
0.4 0.6 0.8
I I I
/ ---v
-f..--�
1 1.2 1.4 1.6 1.8 2 2.2
Flow ratio (Q/Qd)
Figure I 3. Variation of Leading Edge Pressure Differential with Flow.
A CFD Compromise
There was one significant compromise in the impeller CFD analyses. Because of limitations in the version of the Dawes code used for this study, air was used as the compressed media rather than the field or test gas. Clearly, the gas characteristics of air vs a hydrocarbon mixture will have an effect on the pressure profiles calculated by the code. However, while this may alter the magnitude of the pressure load, it will not affect the general aerodynamic trends observed in the results; that high negative
incidence will lead to separation from the blade pressure surface, causing a high M> across the leading edge. Still, to refine the pressure profiles and gain a better understanding of their magnitudes, further CFD runs using the correct gas mixtures will be completed using a computerized analysis code. Unfortunately, these results were not available at the time of this publication.
Impeller/Volute Interaction
The analyses presented were for the impeller and diffuser/volute acting independently. In the real world, these components are not independent but, instead, are strongly affected by one another. The flow within a centrifugal impeller is strongly influenced by the downstream pressure field, i.e., the impeller must discharge against this pressure field. Similarly, the flow within the diffuser and volute depend heavily on the flowfield exiting the impeller.
In the case of the third and sixth stage, the impeller discharges against a nonuniform field caused by the volute. This fact is suggested by the CFD work and confmned by the static pressure taps located at the diffuser and impeller exit (Figure 14).
Impeller Exit & Diffuser Exit
3340 ,-------------X"--7 /'"-r----, � 3320
................................................................................................................. ................................................... ..
� r-- ····--···· ---··· -.. --................................ �---·A .......... .. (/) 3300 ___________
_ ___ ,__ ---- .. · -· · -· ....,.,.
£ 3280 � � 326
Q +···········6A
·········-A: - -
.. · ·-- - -- - - - -- - -------- --- -- -- -- --- ---j
h3 3240 + . ....... ""x..7"""'"""" ?<:::< ... , ................................................................................ _
______
_ , ____ , __ ... .. .. -... 1
3220 �--r-�r---r---r---����
0 50 100 150 200 250
Circumferential Angle
I 6 Imp Exit x Diff Exit I
300 350
Figure 14. Static Pressure Gradient-Impeller and Diffuser ExitOverload Operation.
Of even more importance, the impeller inlet pressure distribution showed evidence of the nonuniforrnity. The taps in the inlet guidevane upstream of the third stage impeller clearly showed a pressure variation around the circumference of the machine (Figure 15). Clearly, the nonuniform field is enveloping the impeller. (This should not be too surprising. If a compressor discharges into a downstream vessel whose pressure fluctuates in time, the compressor inlet conditions will adjust in reaction to the change in downstream pressure. Similarly, the individual flow passages within the impeller will react to a nonuniform downstream pressure. The variation in the individual passages then influences the inlet pressure field upstream of the impeller.)
3200 3180
� 3160· iiJ 3140 � 3120 !l: 3100 (.) 3080 113060 Ci5 3040
3020 3000
0
Impeller Inlet
• • ...
I"'
50 100 150 200 250 300 350 400 Circumferential Angle
Figure 15. Static Pressure Gradient-Impeller Inlet-Overload Operation.
118 PROCEEDINGS OF THE 26TH TURBOMACHINERY SYMPOSIUM
It follows then that as the impeller rotates within this field, the leading edge of each blade passes through the nonuniform field once per revolution. The result will be fluctuations in the velocities, Mach numbers, flow angles, pressure profiles, etc., within the various passages. Recalling the impeller CFD analyses, which suggest a large leading edge M' caused by the high negative incidence, and coupling that with fluctuating inlet conditions caused by the volute, it is not difficult to hypothesize a fairly high dynamic pressure load near the impeller failure location.
DATA ANALYSIS
AERODYNAMIC OBSERVATIONS
The installation of the dynamic pressure probes provided a unique opportunity to observe the changing dynamics within the machine at the extremes of the operating map. Of keenest interest was any evidence of pressure pulsations or fluctuations that could provide an excitation force that would prompt the failures. Any pressure pulsations and their associated frequencies were closely monitored throughout the testing. Further, the dynamic straingauges and vibration probes being used to monitor mechanical response (rotordynamic and stress), would provide tremendous insight into the sensitivity of the rotor to the aerodynamic phenomena.
Pressure Pulsations
A review of the data obtained from the dynamic pressure probes yielded some interesting observations. There was a clear response at 15X the compressor running speed in all probes in the third stage. Somewhat surprising, the highest response was in the dynamic pressure probes mounted in the recess behind the impeller hub (Figure 16). In addition, the response was highest when the compressor was running toward the overload end of the performance map and decreased as the flow was reduced toward surge/stall.
ImpeDer Recess Start=O.OHz Span=3.20Khz Lines= 801
Spectral Map Channel I r ISX
10,-----.-------,------�----��------, I I I I ... Mag -----------t-----------r----------1-----------t- ---------
Peak ----------+----------+----------i-----------t- ---------. I I I I psl ----------�----------+----------�-----------�- ---------0 .!. •. I I J I
0 Lin Hz 3.2k
Diffuser Inlet Start=O.OHz Span=3 .20Khz Lines = 801
Spectral Map Channel2 ISX 10 .-------�-------�r------r,------,1--r----,
I I I I
Mag -----------t-----------:------------t-----------t-- --------1 I I I Peak -----------1-----------+-----------j-----------t-- --------' I I I
psi -----------t----------+----------�-----------+-0 I I I I
0 Lin Hz
Diffuser Exit
3.2k
Start=O.OHz Span=3.20Khz Lines= 801
Spectral Map Channel 3 /ISX 10,------.-------,------�-----.--r----,
Mag -----------�---------+----------�-----------i- -/--------
1 I I I Peak -----------�----------+-----------1-----------t-� --------
ps� -�r-.�---+---------+---------+---------ii --------o Lin Hz 3.2k
Figure 16. Spectra from Dynamic Pressure Probes-Impeller Recess, Diffuser Entrance, Diffuser Exit.
The third stage impeller does have 15 blades, so it wm hypothesized that the pressure pulsations were a consequence o1 the normal wakes shed by impellers. Classic jet/wake theory suggests that the wakes should be larger at low flows. That is, blade wakes, which are the accumulation of secondary flow within an impeller, are always larger at low flowrates and smaller at high. However, at higher flowrates, the throughflow velocity exiting the impeller would be greater. The higher velocity results in a larget dynamic pressure and, therefore, a higher differential between the total pressure in the main flow and static pressure in the blade wakes. In short, the higher pulsation amplitudes in overload are simply a reflection of a higher total to static pressure ratio.
ROTATING STALL
Also of great interest were any pressure instabilities detected, as the compressor was moved toward surge. In short, the test program afforded a rare opportunity to directly ascertain the effects of rotating stall (or the like) in a high pressure gas reinjection compressor operating at near field conditions. Of course, the level of instrumentation installed in the subject compressor far exceeded the amount normally available at a field installation.
Much has been written about rotating stall and many researchers have studied the aeromechanical. influences of such phenomena. However, all of these studies have either been performed on low pressure test vehicles or, in rare cases, have been conducted on high pressure machines with very limited instrumentation. Since the tested compressor was heavily instrumented and run at conditions duplicating those at the end user site, invaluable knowledge was obtained regarding the response of the machine to flow instabilities. In fact, the compressor was purposefully put into a rotating stall mode on at least five different occasions at speeds of 105 percent, 100 percent, 90 percent, and 80 percent of design. When forcing the compressor into stall at 105 percent speed, the final discharge pressure exceeded 6200 psia, some 700+ psia above the maximum attainable discharge pressure in the field.
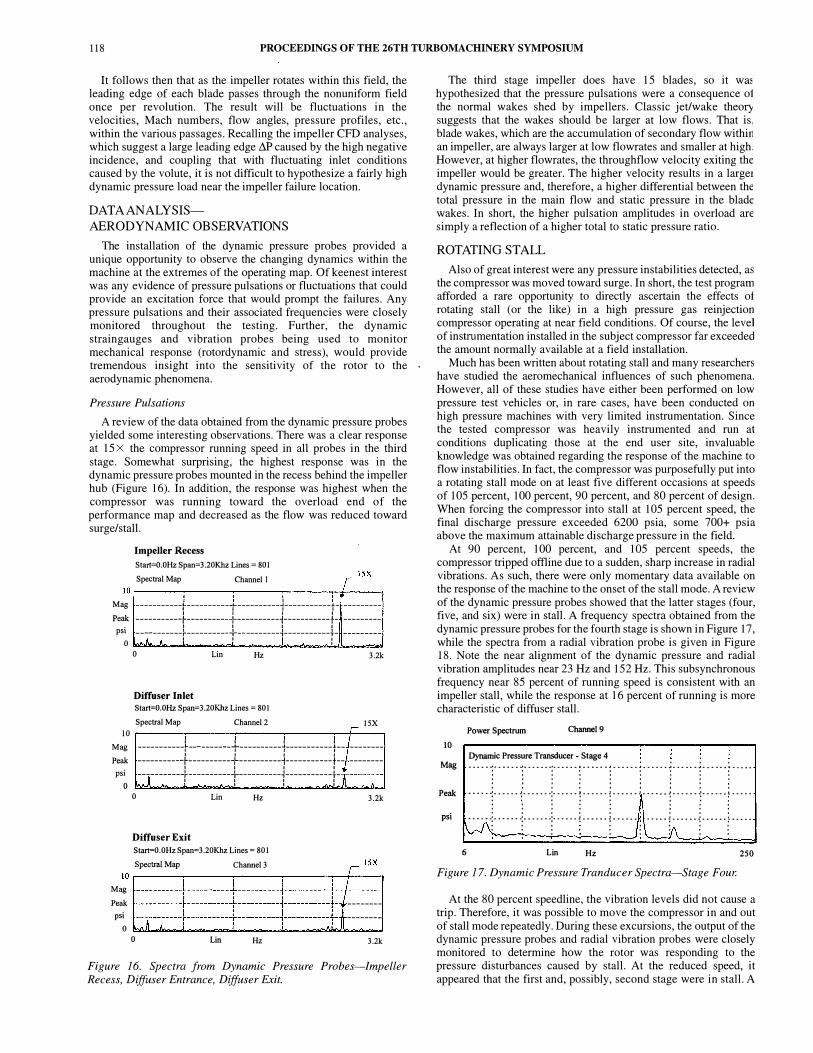
At 90 percent, 100 percent, and 105 percent speeds, the compressor tripped offline due to a sudden, sharp increase in radial vibrations. As such, there were only momentary data available on the response of the machine to the onset of the stall mode. A review of the dynamic pressure probes showed that the latter stages (four, five, and six) were in stall. A frequency spectra obtained from the dynamic pressure probes for the fourth stage is shown in Figure 17, while the spectra from a radial vibration probe is given in Figure 18. Note the near alignment of the dynamic pressure and radial vibration amplitudes near 23 Hz and 152 Hz. This subsynchronous frequency near 85 percent of running speed is consistent with an impeller stall, while the response at 16 percent of running is more characteristic of diffuser stall.
10
Mag
Peak
psi
6
Power Spectrum Channel9
Dynamic Pressure Transducer - Stage 4 . . . � . .. ......... .. .... .. .. ... .. .. .. .. .. -·- .. .. .... .. . .. .... .. .... ' .. .. .. .. .. .. .... .. .. .. .. .. "' .. .. .. .. .. .. � .. .. .. .. .. .. ' .. .... .. ..
. . . . . . . . . 0 0 0 I 0 I I 0 0 0 I 0 I 0 0 0 0 0 0 I I 0 I 0 0 0 I 0 0 I I I I 0 0
............ :·······:·······:······:······:······J- ......... :·······:······:····· 0 0 0 I I 0 I 0 0 0 I I 0 I I 0 0 0 0 0 0 I I
.......... ·:· .......... ·:· .. .. .. .. .. -:- .......... � .. ........ .. � .... .. .... .. : .......... � ........... � ........... ; .. .. .. .. .. I 0 I I I I 0 0 0 0 I 0 I I 0 0
0 0 0 0 I 0
Lin Hz 250 Figure 17. Dynamic Pressure Tranducer Spectra-Stage Four.
At the 80 percent speedline, the vibration levels did not cause a trip. Therefore, it was possible to move the compressor in and out of stall mode repeatedly. During these excursions, the output of the dynamic pressure probes and radial vibration probes ·were closely monitored to determine how the rotor was responding to the pressure disturbances caused by stall. At the reduced speed, it appeared that the first and, possibly, second stage were in stall. A

AN ASSESSMENT OF THE FORCES ACTING UPON A CENTRIFUGAL IMPELLER
USING FULL LOAD, FULL PRESSURE HYDROCARBON TESTING 119
Mag
Peak
mil
6
Power Spectrum
Radial Vibration Probe
Channel6
0 • • ' • •
. . . . . .. . . . . . � . . . . . . ' . . . . . . "' · . . . . . " . . . . . . . . . . . . . . . . . . 0 I I I 0 I ' . . . . . . . . . . . . . .
· · · · · � · - · · · - � · · · · · · · · · · · - � · · · · · - � · - · · · · � · - · · · I 0 I 0 I o I 0 I I I 0 0 I I 0 0 I t I
. . . . . � ...... �-.... � . . . . . � ...... { ...... ; . . . . . 0 o 0 I 0 0
: .X J: 1\. : : Lin Hz 250
Figure 18. Radial Vibration Probe Spectra.
waterfall plot from the first stage diffuser dynamic pressure probe is shown in Figure 19, while the corresponding radial vibration is given in Figure 20. The spectra show frequencies that are consistent with both diffuser and impeller stall. As in the higher speed runs, it is possible that both the impeller and diffuser move into stall simultaneously, or that the time between onset of impeller and onset of diffuser stall is so short that it was not discernible, given the response time of the probes and monitoring equipment.
Power Spectnun Channel6 so
Dynamic Pressure Transducer
0
Figure 19. Waterfall Diagram-Dynamic Pressure Tranducer Stage One.
Power Spectrum Channel6 so
Radial Vibration Probe
0 Lin Hz Skew -20 deg 2SO Figure 20. Waterfall Diagram-Radial Vibration Probe.
Though the radial vibration probes indicated a substantial force acting upon the rotor, the dynamic straingauges did not show a significant increase in activity in the impellers during the repeated stall excursions at 80 percent speed.
STRESS/DYNAMIC STRAIN RESULTS
Dynamic strains (mean to peak) were measured during the test. Nine locations on the third stage were monitored. These included three tangential gauges and three radial gauges on the disc backside, and three axial gauges at blade leading edges (suction side) close to the failure initiation location. These strains were converted to stress by multiplying by the modulus of elasticity (Poison's effect ignored). Stresses were tabulated for select points covering the full range of flow conditions (Figure 8).
In general, stresses increase as operation is moved from surge to overload. A plot of the dynamic stress in ksi on the blade leading edge vs test point location is illustrated in Figure 2 1. Dynamic stresses at overload are about four times those near the surge for the third stage impeller. Dynamic stresses on the sixth stage impeller in overload are only 1.4 times those near surge. Therefore, the sixth stage impeller does not appear to experience the dramatic increase in stress in moving from surge to overload as does the third stage impeller. The only exception to the increase in stress when moving toward overload is a slight decrease in stress (average of six percent) when moving from the site system resistance line to areas further into overload. Dynamic stresses are a function of pressure variation and they do appear to increase proportionally to the square of the speed. This is expected when considering that head is proportional to the square of the speed.
� I!! "
m ..
2.80 2.50 2.40 2.30 2.20 2.10 2.00
0 ... I .. � c-1-- 0 1�SJIMI;IUna
-....._ 0 !OO'll.s,-dUna N· • • 100'11oSP"dll,.·TmttllniO.Ia 1-1'--- "' A &O%SPMC1Une
� !'-. ::;...,. l r'--. '\. 2.11 "
1.90 1.80 1.70 1.80 1.50 1.40
1h 0 -.:.; 155• d\1.75 r-._
........ 1\ -.....__ '\. 118.1
!'-.. ""· 11.7 1\ \ "'.1 1 .26 u· ,,,. 1.30 1.20
300.00 400.00 500.00 800.00 700.00 800.00 900.00 1000.00 1100.00 1200.00 ACFM
Figure 21. Pressure Ratio vs ACFM-Test Points Labeled with Dynamic Strain in ksi.
The highest stresses consistently occurred at the site system resistance line at 10,750 rpm. At this point, the third stage axial blade stresses averaged 18.6 ksi and disc backside radial stresses averaged 6.7 ksi (these are mean to peak stresses). Backside tangential stresses were much lower at about 0.5 ksi.
On the overload side of the map, third stage dynamic stresses were 1.0 to 2.0 times higher than corresponding sixth stage stresses. Disc backside radial stresses were 1.5 to 2.0 times higher and disc backside tangential stresses were 1.0 to 1.5 times higher. There did not appear to be a consistent pattern to the change in these ratios from point to point. On the surge side, the sixth stage backside stresses were actually slightly higher than the corresponding third stage stresses.
On the third stage impeller, the axial blade dynamic stresses were an average of 2.8 times as high as the disc backside radial stresses. This ratio did not change significantly as operation was moved from point to point.
Third stage dynamic stresses increased by a factor of 2. 1 to 2.6 during the transient from near surge to overload.

120 PROCEEDINGS OF THE 26TH TURBOMACHINERY SYMPOSIUM
The peak third stage stresses, during a trip due to surge, occurred about 0.8 seconds after the trip. By this time the compressor speed had slowed down to about 8960 rpm. Third stage axial blade dynamic stresses increased from 5.7 ksi to 14.1 ksi. Note that surge dynamic stresses after the trip approached overload dynamic stresses, albeit for a very short time. Sixth stage dynamic stresses were actually lower after the trip (they continually decrease with time).
Straingauge data were also obtained for the back side of the second and fourth stage impellers in an initial hydrocarbon test. Predominate response was still 1 X for these nonvolute stages. Disc backside radial dynamic strain ranges were compared for the four instrumented impellers. It was found that the third stage was the highest, followed by the sixth stage, the fourth stage, and finally, the second stage radial strain range was the lowest. The ratios of the sixth, fourth, and second stage radial dynamic strain ranges to the third stage were approximately 0.6, 0.25, and 0.20, respectively. Note that no failures have occurred on the second or fourth stages and only one has occurred on the sixth stage. Further evaluation of these data along with analytical results continues.
No evidence of impeller resonance was found either on the surge side of the map, during normal operation, or in overload. The predominate straingauge response was always 1 X the run speed, which equates to 17 1 Hz at 100 percent speed and 179 Hz at 105 percent speed. This is much lower than the impeller's first natural frequency, which was just over 500 Hz. In addition, no significant impeller response was found at 12X, 15X, or 17X corresponding to possible excitations from the division wall support vanes, the number of impeller blades, or the upstream return channel vanes, respectively.
Static stress results from static straingauge measurement in the radial and axial directions are plotted in Figure 22. They increased with the square of the speed as expected. However, they were about twice as high as the steady state stresses calculated using finite element analysis (FEA). The reason for this is being investigated through further review of the steady state pressures imposed on the FEA model and by conducting an instrumented push test on the third stage impeller. This will aid in correlating straingauge results to FEA results for a known load.
80
70
80
j 50 .lS .s 40 = � 30 u; "
"
.'! 20 "'
10 "'"'" ,.r'
-10 0
/ v
'.r'' ......
• (Thousands)
Speed in RPM
/ y·
J
r--fA"
Figure 22. Variation in Static Stresses with Speed.
/ R-
"' .r
,.
� T
10 12
After collecting data at all points, an 18-hour endurance test was conducted, while the compressor was at maximum flow (established by the loop resistance) at 10,750 rpm. This represents 11.6 million cycles at a 1 X response. Subsequent to the endurance test, a magnetic particle inspection of the third stage impeller was conducted. No cracks were found.
These data are currently being used, together with an extensive analytical effort, to explain the cause of the failure and to aid in the definition of safe operational areas. This will prevent future failures.
CONCLUSIONS
A tremendous amount of knowledge was gleaned from this test program regarding the aeromechanical forces acting upon the impellers in a high pressure, gas reinjection compressor operating at near field conditions. In addition, valuable lessons were learned regarding the use of atypical instrumentation and its associated hardware (i.e., slip rings, dynamic straingauges, and dynamic pressure probes) in assessing these forces. Substantial engineering effort was expended simply in determining how to properly locate and fasten these instruments. The procedures developed will serve as a guide for installation of similar instrumentation for future test programs.
Conclusions drawn from the obtained data and the associated analytical studies are:
• Significantly higher stresses in overload make operation in deep overload a prime suspect for the cause of the failure. These 1 X stresses are caused by the interaction of the impeller with a nonuniform pressure field caused by the volute.
• High negative incidence caused by operation in extreme overload can cause high pressure load on impeller leading edges. If combined with the surrounding nonuniform pressure field caused by the volute, the result is a fluctuating pressure load on the impeller blade leading edges with a frequency of once per revolution (IX).
• Test results showed that the leading edge of the third stage impeller was indeed a highly stressed area and that the third stage impeller, in general, was more highly stressed than the other stages. The testing also demonstrated that overload dynamic stresses are much higher than those on the surge side of the map. Repeated excursions into stall/surge did not show any substantial increases in dynamic strain despite a sharp increase in rotor vibrations. In short, stall (or the like) does not appear to be a contributor to the failures.
• The endurance run eliminated resonance as a possible cause. Since the test impeller survived an 18-hour overload endurance test, at least two failure theories remain. The first theory is that the overload stresses did cause the failures. In this case, it can be assumed that if it were possible to conduct the endurance test for a longer time frame, the third stage impeller would have failed. The second theory is that the test still does not completely duplicate field conditions or that other forces, not seen in the test, may be acting on the impeller. These forces may be experienced as sporadic 'high stress events' that are yet to be defined.
• The investigative efforts confirmed the value of computational fluid dynamics (CFD) analyses in helping to understand the aerodynamic forces generated within the centrifugal stage.
In conclusion, though the testing failed to identify the root cause of the impeller failures; it did provide valuable insight into the forces acting on centrifugal impellers in high pressure applications. Further tests will be conducted that should ultimately lead to the true source of the problems. The information derived from these test programs will be used to develop more reliable and accurate analytical methods in efforts to preclude recurrence of these problems in future machines operating under similar conditions.
NOMENCLATURE
ACFM = Actual cubic feet per minute
BEP Best efficiency point
bhp = Brake horsepower
DP Dynamic pressure probe
ID Inside diameter
ksi = Thousand pounds force per square inch
OD = Outside diameter

AN ASSESSMENT OF THE FORCES ACTING UPON A CENTRIFUGAL IMPELLER
USING FULL LOAD, FULL PRESSURE HYDROCARBON TESTING 121
P(ps) '
= Static pressure along pressure surface of impeller blade
P(ss) = Static pressure along suction surface of impeller blade
Pd Discharge pressure
Ps = Suction pressure
PS = Static pressure
Q Flow in ACFM
Qd = Design flow in ACFM
Q/N = Flow coefficient (flow in ACFM/speed in rpm)
rom = Rotations per minute
SG Dynamic straingauge
ST = Static straingauge
TP = Combination total pressure and temperature probe
nX = "n" times compressor operating speed (i .e., 1 X = one times, 15X = 15 times)
M' = Pressure differential
REFERENCES
l . "Compressors and Exhausters," ASME Power Test Code 10, 1965 (reaffirmed 1979), ANSI PTC lO (1974).
2. Flathers, M. B . and Bache, G. E., "Aerodynamically Induced Radial Forces in a Centrifugal Gas Compressor-Part 2: Computational Investigation," ASME Paper Number 96-GT-352 ( 1996).
BffiLIOGRAPHY
Casey, M.V. and Marty, F., "Centrifugal CompressorsPerformance At Design and Off-Design," Proceedings of the Institute of Refrigeration, London, ( 1986).
Cumpsty, N. A., Compressor Aerodynamics, Essex, England: Longman Scientific & Technical ( 1989).
Frigne, P. and Van Den Braembussche, R., "Distinction Between Different Types of Impeller and Diffuser Rotating Stall in a Centrifugal Compressor with Vaneless Diffuser," ASME Paper Number 83-GT-61 ( 1983).
Gelin, A., Pugnet, J., Bolusset, D., and Friez, P., "Experience in Full Load Testing Natural Gas Centrifugal Compressors for Rotordynamics Improvements," ASME Paper Number 96-GT-378 ( 1996).
Jansen, W., "Rotating Stall in a Radial Vaneless Diffuser," ASME Paper Number 64-FE-6 ( 1964).
Japikse, D., Advanced Experimental Techniques in TurbomachineryPrincipal Lecture Series Number 1, (PLS-1), Concepts ETI ( 1986).
Japikse, D., Centrifugal Compressor Design and Performance, Concepts ETI Lecture Notes, Twelfth Edition ( 1990).
Kammer, N. and Rautenberg, M., "A Distinction B etween Different Types of Stall in Centrifugal Compressor Stage," ASME Paper Number 85-GT- 123 ( 1985).
Senoo, Y. and Kinoshita, Y., "Limits of Rotating Stall and Stall in Vaneless Diffuser of Centrifugal Compressors," ASME Paper Number 78-GT-19 ( 1978).
Shepherd, D. G., Principles of Turbomachinery, New York, New York: Macmillan Publishing Co., Inc. ( 1956).
Sorokes, J . M., "A CFD Assessment of Entrance Area Distributions in a Centrifugal Compressor Vaneless Diffuser," ASME Paper Number 94-GT-90 ( 1994).
Sorokes, J . M., Kuzdzal, M. J., Sandberg, M. R., and Colby, G. M., "Recent Experiences in Full Load Full Pressure Shop Testing of a High Pressure Gas Injection Centrifugal Compressor," Proceedings of the Twenty-third Turbomachinery Symposium, Turbomachinery Laboratory, Texas A&M University, College Station, Texas, pp. 3- 18 ( 1994).
ACKNOWLEDGEMENTS
The authors acknowledge Jay Koch, Ed Thierman, Jim Shufelt, and Joel Johnson for their assistance in generating the figures used in this paper. The authors also thank: Dennis Alexander (formerly of Mobil); Andy Gruss of Measurement Technologies, Ltd . ; and the dedicated members of the Dresser-Rand test department and development lab for their extensive contributions during the test program. Finally, the authors thank Mobil and Dresser-Rand for allowing publication of this document.

122 PROCEEDINGS OF THE 26TH TURBOMACIDNERY SYMPOSIUM