Embed Size (px)
Citation preview
RE S E AR C H RE P O R T
An Assessment of the Local Initiatives
Support Corporation’s Financial
Opportunity Centers Nathan Dietz Erwin de Leon Saunji Fyffe Daniel Kuehn
Marcus Gaddy Juan Collazos
September 2016
C E N T E R O N N O N P R O F I T S A N D P H I L A N T H R O P Y
AB O U T T H E U R BA N I N S T I T U TE
The nonprofit Urban Institute is dedicated to elevating the debate on social and economic policy. For nearly five
decades, Urban scholars have conducted research and offered evidence-based solutions that improve lives and
strengthen communities across a rapidly urbanizing world. Their objective research helps expand opportunities for
all, reduce hardship among the most vulnerable, and strengthen the effectiveness of the public sector.
AB O U T L OC AL IN I TI A TI VE S S U P P O R T C O R P O RA T I ON ( L IS C )
LISC’s vision is that every low-income community has the right to thrive. LISC equips struggling communities with
the capital, program strategy, and know-how to become places where people can thrive. Working with local leaders
we invest in housing, health, education, public safety, and employment – all basic needs that must be tackled at
once so that progress in one is not undermined by neglect in another. With 30+ years of expertise, we bring
together key local players to take on pressing challenges and incubate new solutions. Our tool kit is extensive. It
includes loans, grants, equity investments and on the ground experience in some of America’s neediest
neighborhoods. The result: we help create good places to live, work, do business and raise children.
This material is based on work supported by the Corporation for National and Community Service under Grant ID
Number 13NDHNY001. Opinions or points of views expressed in this document are those of the authors and do
not necessarily reflect the official position of or a position that is endorsed by the Corporation or the AmeriCorps
program.
Copyright © January 2016. Urban Institute. Permission is granted for reproduction of this file, with attribution to the
Urban Institute. Cover image from photo credit here.
Copyright © September 2016. Urban Institute. Permission is granted for reproduction of this file, with attribution to
the Urban Institute. Cover image from Shutterstock.
Contents Acknowledgments v
Executive Summary vi
Introduction 1
Overview of the Financial Opportunity Centers (FOC) Model 4
Origins of the Program Model 4
Literature Review 5
Data Sources 8
Interviews and Qualitative Analysis 8
Administrative Data from ETO 9
Site-Level Data on FOC Costs 10
Data Collection Strategy 10
Limitations 12
The Local Initiatives Support Corporation (LISC) AmeriCorps Program 14
Findings from the Qualitative Inquiry 15
LISC FOC Target Population and Client Recruitment 16
LISC FOC Services and Program Models 17
LISC FOC Data Collection and Management 18
Contributions of LISC FOC AmeriCorps Members 20
Conclusion 20
Impact Analysis 22
Impact Analysis and Propensity Score Matching 23
Overview of Propensity Score Matching 23
Selection of Comparison Groups 27
Sample Selection 30
Interpretation of Impact Estimates 31
Employment and Wages 32
Descriptive Statistics: Employment – Placement into Unsubsidized Jobs 32
SIPP Comparison Group Employment and Wage Impact Estimates 33
Employment and Wage Impacts – “Treatment versus Treatment-Plus” Comparisons 36
Credit Outcomes 39
Descriptive Statistics 39
Credit Bureau Comparison Group FICO Score Impact Estimates 40
Credit Score Impacts 41
Net Income 45
Net Worth 46
Descriptive Statistics 46
Net Worth Impacts 47
Summary of Impacts by Analysis Sample 50
Costs of Providing FOC Services 54
Calculation of FOC Unit Costs 55
The Costs of FOC Services: A Multivariate Client-Level Analysis 60
Data and Model Specification 61
Regression Results 65
Comparing the Costs and Benefits of FOC Services Received by Clients 70
Literature Review 74
Cost-Benefit Analysis of Program Participation 75
Wage Changes for the Jobless 75
Change in Net Income from Obtaining Employment 79
Effects of Providing a Full Bundle of FOC Services to All Jobless Clients 82
Wage Differentials for Jobless FOC Clients 83
Employment-Related Net Income Differences for Jobless FOC Clients 84
Changes in Net Worth for Jobless FOC Clients 85
Conclusions and Recommendations 88
Appendix A. Interview Protocol 93
Appendix B. Template for Cost Data Collection 96
Appendix C. Regression Results for Cost Analysis 97
Appendix D. Balancing Statistics for Propensity Score Matching 100
Notes 109
Statement of Independence 114
A C K N O W L E D G M E N T S V
Acknowledgments This report was funded by the Local Initiatives Support Corporation and is based on work supported by
the Corporation for National and Community Service under Grant ID Number 13NDHNY001. We are
grateful to them and to all our funders, who make it possible for Urban to advance its mission.
The views expressed are those of the authors and should not be attributed to the Urban Institute,
its trustees, or its funders. Funders do not determine research findings or the insights and
recommendations of Urban experts. Further information on the Urban Institute’s funding principles is
available at www.urban.org/support.
V I E X E C U T I V E S U M M A R Y
Executive Summary In September 2014, the Local Initiatives Support Corporation (LISC) contracted with the Urban
Institute to conduct an assessment of financial and employment counseling services carried out by
LISC-supported AmeriCorps members. The study was conducted to satisfy a requirement by the
Corporation for National and Community Service (CNCS) that all AmeriCorps grantees receiving at
least $500,000 in funding must undergo an independent third-party evaluation of its program
operations. The Urban Institute was selected in September 2014 to conduct an assessment of LISC’s
network of Financial Opportunity Centers (FOCs) and the benefits they provide.
FOCs are employment/career and personal financial service centers that help low-to-moderate
income individuals achieve financial stability through changes in financial behavior that lead to
increased income, improved credit, and asset-building. The FOC program model features integrated
delivery of three main services: employment counseling, financial coaching, and income support
counseling. The motivation behind “bundling” these three services is to deliver benefits to clients that
are greater than what they could achieve with any of the individual services. A recently published
report by LISC1 shows that FOC clients who receive the full bundle of services tend to be more likely to
experience positive economic outcomes, or to experience larger improvements in their financial well-
being.
This assessment is not intended to serve as an evaluation of the entire FOC program model, nor is it
an attempt to isolate the impact of AmeriCorps’ contribution to LISC’s FOC programming. Rather, the
goal of the assessment is to assess the effects of the services provided by the team at each AmeriCorps
site – including the AmeriCorps members as well as permanent staff – that delivers FOC services to
clients. The study addresses two main research questions:
1. Do the services provided by LISC AmeriCorps members placed in Financial Opportunity
Centers help produce positive benefits to the clients they serve relative to those who do not
receive services?
2. What does it cost to supply these services relative to any public sector cost savings that accrue
due to reduced public program participation?
The analysis in this report relies heavily on client-level data that FOC site staff members enter into
LISC’s customized Efforts to Outcomes (ETO) data system. The team used propensity score matching
(PSM) to produce estimates of the impact of receiving FOC services. The PSM technique forms
comparison groups that are similar to FOC clients, in order to control for other factors that might be
E X E C U T I V E S U M M A R Y V I I
responsible for the short-term changes observed in the data. Data for the comparison groups come
from two external sources of nationally representative data: the Survey of Income and Program
Participation (SIPP), a longitudinal dataset that includes monthly information on labor market activities,
and a nationally representative longitudinal sample of depersonalized data on more than 5 million
individual consumers obtained from a nationally recognized data provider, one of the three major credit
bureaus.
The use of external data permits estimation of the impacts of receiving any FOC services at all,
compared to those who receive no service. The impact analysis that used SIPP respondents as a
comparison group focused on four outcomes: wage changes and the probability of gaining employment,
each estimated for the entire client population and, separately, for jobless clients only. The results show
that employment counseling alone, employment and financial coaching, and the full bundle of FOC
services all have consistently positive impacts on clients.
For three of the four outcomes (wage changes for all clients and jobless clients and changes in
the probability of finding a job, for jobless clients only), receiving both employment and
financial coaching instead of employment counseling alone is associated with improvements for
employment and wage outcomes.
Employment counseling alone has its strongest effect on the wage and employment outcomes
of clients who did not have a job at baseline.
Receiving employment counseling and income support counseling is not associated with
greater wage and employment benefits from FOC services, compared to the SIPP baseline.
A second set of impact analyses use “treatment versus treatment-plus” comparisons to estimate the
impact of providing additional services to FOC clients who are already receiving partial bundles of
service. For the treatment versus treatment-plus analyses, both the treatment and comparison groups
are formed from client data from ETO. The PSM matching process is strengthened by the fact that the
members of both groups share a basic motivation to seek FOC services to improve their financial
situations. Key results from the treatment versus treatment-plus analysis of the four employment-
related outcomes include the following:
For three of the four outcomes, receiving both employment counseling and financial coaching is
associated with the improvement of employment and wage outcomes relative to employment
counseling alone.
V I I I E X E C U T I V E S U M M A R Y
Receiving the full bundle of services is associated with different impacts on employment and
wages depending on which mix of services serves as the comparison group. Relative to
employment counseling alone, the full bundle of services is not associated with any change in
employment and wage outcomes, except that it has a negative association with wages in the full
sample).
When the full bundle of services is compared to receiving employment and financial counseling,
moving to the full bundle is associated with positive employment and wage outcomes in all four
analyses.
The full bundle of services is associated with higher employment probability relative to receipt
of employment counseling and income support counseling for the full sample and lower
employment probability for jobless clients, but is not associated with any change in wages.
The addition of income support counseling to employment counseling is not associated with
improved employment and wage outcomes; in fact, the estimated impact of this additional
service is associated with negative results for three of the four outcomes. However, the
addition of income support counseling to both employment counseling and financial coaching is
associated with positive results for all four outcomes.
The final set of impact analyses focuses on estimating the effect of FOC services on outcomes
related to net worth and credit outcomes. Most of these analyses use the treatment versus treatment-
plus comparisons to obtain impact estimates. The credit bureau database contains data on credit scores,
but does not permit estimates of the impact of FOC services on credit score acquisition. The credit
bureau analyses indicate that FOC services had no effect on credit scores, relative to changes observed
for the comparison group; the estimated treatment effects are all small and statistically insignificant.
For the other outcomes – value of the credit score for all FOC clients, and for clients without credit
scores at intake; change in the credit score for all clients; and the probability of obtaining a credit score,
for all clients and for clients who were unscored at baseline – the estimated impacts of FOC services are
generally negative.
Receiving additional FOC services (as opposed to fewer FOC services) is associated with a
lower probability of possessing a FICO score, especially for clients who did not have a FICO
score at baseline.
Adding employment counseling to clients who are already receiving financial coaching is
associated with lower values for three of the credit outcomes: value of the credit score for all
E X E C U T I V E S U M M A R Y I X
clients, value of the credit score for clients with no score at baseline, and the probability of
having a FICO score for clients with no score at baseline.
Adding income support counseling to financial coaching is associated with a reduction in three
of the credit outcomes: change in the credit score for all clients, the credit score for clients with
no score at baseline, and the probability of having a FICO score for clients with no score at
baseline. However, it is associated with an increased FICO score for all clients.
The SIPP cannot be used to calculate measures of net income and net worth that are comparable to
the way these outcomes are calculated in the ETO system. Thus, only the treatment versus treatment-
plus comparisons are possible. However, because the PSM method did not produce reliable matches for
net income, the impact estimates were not presented for this outcome. The results for four net-worth
outcomes – change in net worth for all clients, change in net worth for clients with negative net worth at
baseline, change in net worth for clients who were jobless at baseline, and probability of a change from
negative to positive net worth – were broadly positive, and none of the estimated impacts of FOC
services were negative and statistically significant.
Adding income support counseling to financial coaching is associated with increases in three of
the four net worth outcomes: change in net worth over the full sample, change in net worth for
clients who were jobless at baseline, and net worth for clients with negative net worth at
baseline.
Adding employment counseling and income support counseling to financial coaching is also
associated with increases in three of the four net worth outcomes: change in net worth over the
full sample, the probability of a change from negative to positive net worth for clients with
negative net worth at baseline, and change in net worth for clients who were jobless at baseline.
To address the second research question, the project team combined the impact estimates for
economic outcomes with cost data collected directly from the FOC sites in order to compare the
benefits of FOC services to the costs of providing those services. Twelve of the AmeriCorps sites
responded with full or partial cost data, but six sites provided complete, detailed data on program costs
and on FOC costs in particular. The cost data were used to create unit costs of FOC services (FOC costs
per minute of service received) for each type of service for each of the six sites. The estimated costs per
minute of service vary somewhat across the type of service provided, with income support counseling
costing less per minute than the other two services at most sites. The aggregate cost per minute
estimates –which are based on a weighted average of the cost-per-minute estimates for the three FOC
services – vary considerably across sites, ranging from $1.44 to $7.61.
X E X E C U T I V E S U M M A R Y
These unit costs were used to compute the dependent variable for a multivariate client-level
analysis of the total cost of service received by clients. The results of this multivariate analysis suggest
that the amount of resources that sites devote to clients depends on the characteristics of the client, the
mix of FOC services they receive (which are likely influenced by the client’s circumstances), and site-
specific characteristics that are not directly measured. The program-mix variables appear to have the
largest impact on client costs, controlling for other factors; the impact of these variables reflects the
fact that “high-needs” clients tend to receive a more comprehensive bundle of services. The site-specific
variables are also statistically significant, even controlling for program mix and client characteristics.
These differences are generally unrelated to the differences in client costs per minute, or to the average
amount of service each client receives. Finally, the demographic variables appear to have statistically
significant effects on client costs, even after controlling for program mix and site impacts.
Due to data limitations, the analysis that addresses cost-benefit comparisons focuses on the
employment-related and financial benefits that clients receive. For many FOC clients, data on public-
sector income supports are missing in the ETO system and are not consistently updated after intake,
even for clients who receive income support counseling. The analysis was constrained in other ways by
data limitations. Because of sample-size limitations, the analysis is limited to clients who are jobless
when they started receiving FOC services; PSM matches these clients to comparison group members
who are also jobless. The analysis focuses on short-term impacts because of the need to focus on recent
clients who received services during the 2013-2014 program year, and the lack of longer-term outcome
data for the treatment and comparison groups. Finally, only certain benefits could be quantified, which
results in an underestimation of the cost-effectiveness of the program. Thus, the analysis focuses on the
estimated short-term economic benefits to clients who are jobless when entering the program, and
compares these benefits to the costs of FOC services received.
The benefit-cost comparisons focus on wages, employment (specifically, net income from
employment), and net worth, which are all key economic outcomes tracked by LISC to measure the
impact of FOC services. According to the results, FOC services deliver short-term wage-differential
benefits to jobless clients that, by themselves, narrowly exceed the costs of delivering the services,
compared to the estimated outcomes for a matched comparison group of SIPP respondents who were
jobless at baseline. The short-term impact on net income resulting from increased probability of
employment is estimated to be smaller, based on a comparison of outcomes for jobless FOC clients and
a SIPP comparison group.
The analysis concludes with benefit-cost comparisons based on the “treatment versus treatment-
plus” impact estimates for FOC clients who are jobless at intake. The impact estimates used in this
E X E C U T I V E S U M M A R Y X I
section are generally of higher quality than the estimates based on a comparison group selected from
SIPP respondents, since both the treatment and comparison group members have sought FOC services.
Although LISC’s FOC sites encourage their clients to choose the bundle of services that meet their own
needs, and are intentional about not mandating the “full bundle” for all clients, the treatment versus
treatment-plus comparisons illustrate what happens if clients received all three FOC services rather
than the partial bundles they actually received. The results indicate that the short-term benefits of the
full bundle for certain jobless clients might actually exceed the costs of providing these additional
services. The results also show that clients receiving financial coaching would probably experience a
substantial short-term increase in their net worth from receiving all three FOC services, relative to the
costs of providing these additional services.

Introduction The Local Initiatives Support Corporation (LISC) has received a three-year direct grant from the
Corporation for National and Community Service (CNCS) to operate an AmeriCorps program focused
on two of CNCS’ strategic areas: economic opportunity and capacity building. In one intervention used
by LISC’s AmeriCorps program, AmeriCorps members provide additional services to organizations
within LISC’s existing network of Financial Opportunity Centers (FOCs). In the FOC network,
community-based organizations offer low-to-moderate income individuals an integrated “bundle” of
three main services: employment counseling, financial coaching, and income support counseling. The
motivation behind “bundling” these three services is to deliver benefits to clients that are greater than
what they could achieve with any of the individual services, and to provide a multi-faceted approach to
income and wealth building.2 LISC has operated FOC services for over ten years, and the AmeriCorps
grant has provided critical support for the network’s activities, permitting the organizations to tailor
their programs to meet the specific needs of their clients and the communities they serve.
LISC’s AmeriCorps program uses national service as an opportunity to expose young people,
women and people of color to the community development field while helping to build the capacity of
sponsoring organizations. In the most recent grant period (2013-2016), LISC’s AmeriCorps grant
supported between 140 and 160 AmeriCorps members, who served at over 200 unique nonprofit
organizations nationwide. Of these placements, about 20 percent of the AmeriCorps members carry
out activities that generally fall under the rubric of employment counseling, although several are
involved with financial counseling (including tax preparation) services. The specific program activities
carried out by members vary widely, and include computer literacy, employment skills training,
employment counseling, and job development. In the 2013-2014 grant year, AmeriCorps employment
counselors served some 3,400 clients, of whom 550 are known to have gained employment during their
term of service.
CNCS requires all grantees receiving at least $500,000 in AmeriCorps funding to undergo an
independent third-party evaluation of its program operations. In September 2014, LISC selected the
Urban Institute to conduct an assessment of their FOC programming, which is the largest part of the
portfolio. The assessment focuses on two specific research questions:
1. Do the services provided by LISC AmeriCorps members placed in Financial Opportunity
Centers help produce positive benefits to the clients they serve relative to those who do not
receive services?
A N A S S E S S M E N T O F L I S C ’ S F I N A N C I A L O P P O R T U N I T Y C E N T E R S 2
2. What does it cost to supply these services relative to any public sector cost savings that accrue
due to reduced public program participation?
These research questions were proposed by LISC, which has determined that the study should
focus on the effects that FOC services, which are provided by organizations where AmeriCorps
members serve, have on the clients who receive these services. The intent of the study is not to isolate
the effects of the services provided by AmeriCorps members, but rather to characterize the effects of
the service provided by all staff who provide FOC services at AmeriCorps sites. The LISC AmeriCorps
sites that offer FOC services receive financial support from a number of sources, and most of the sites
administer other programs in addition to providing FOC services. The goal of the study is to assess the
effects of the services provided by the team at each AmeriCorps site – including the AmeriCorps
members and permanent staff – that delivers FOC services to clients.
The study relies on data collected from a number of sources. All FOCs hosting AmeriCorps
members use Social Solutions’ Efforts to Outcomes (ETO) client tracking software, which is a template
customized by LISC to meet the specific needs of the program, to capture receipt of services and record
outcomes. Major elements tracked include income, expenses, net worth, credit scores, employment
status, budget development and implementation, and detailed information about the type and quantity
of the services clients receive, including whether these services are bundled. Because LISC staff
members update the ETO data frequently after clients receive services, the database contains
information about changes in key economic outcomes that serve as the primary dependent variables for
the impact analysis.
To address the first research question, we performed an impact analysis that compares the changes
in economic outcomes experienced by FOC clients with changes observed for members of a comparison
group. The impact analysis uses data from two external sources to form comparison groups: the Survey
of Income and Program Participation (SIPP), a nationally representative panel dataset that includes
monthly information on labor market activities, and a nationally representative database maintained by
the credit bureau that contains credit scores for over five million Americans. This analysis yields
information about the differences in economic outcomes experienced by FOC clients at AmeriCorps
sites and other comparable adults who do not receive services. The impact analysis also includes results
from a “treatment versus treatment-plus” comparison, which studies the marginal effects of different
mixes of FOC service among clients at AmeriCorps sites. A series of interviews with staff from nine of
the 18 AmeriCorps FOC sites yielded information about how the sites administer the programs and
about the contributions made by AmeriCorps members. Finally, to address the second research
question, the study team collected detailed data on program costs from AmeriCorps sites that offered
3 A N A S S E S S M E N T O F L I S C ’ S F I N A N C I A L O P P O R T U N I T Y C E N T E R S
FOC services in program year 2013-2014. By combining these cost estimates with the results from the
impact analysis, we can directly compare the costs of providing FOC services with the benefits
experienced by clients who receive various mixes of services.
The report is organized as follows: The next section provides a more detailed overview of the FOC
model as it has generally been implemented, as well as a brief review of the literature that describes the
effectiveness of the intervention. After outlining the methodology and approach used to address the
two primary research questions, we describe the way that LISC’s AmeriCorps sites administer the FOC
model, and the contributions made by AmeriCorps members. Next, to address the first research
question, we present an analysis of the impact of FOC services on three key economic outcomes, using
data from the SIPP and credit data comparison groups. To address the second research question, we
first describe the methodology used to collect and process data on the costs of providing FOC services,
and present results from a multivariate regression model, where the dependent variable is the cost of
providing services to individual clients. Finally, we offer direct comparisons of the costs and benefits of
FOC services received by clients.
A N A S S E S S M E N T O F L I S C ’ S F I N A N C I A L O P P O R T U N I T Y C E N T E R S 4
Overview of the Financial
Opportunity Centers (FOC) Model For over ten years, LISC (Local Initiatives Support Corporation) has been at the forefront of a national
movement to promote an integrated service delivery model around family income and wealth building
for low income community residents in urban and rural settings. After starting with four centers in
Chicago, LISC has opened over 75 new FOC sites across the country over the last five years. LISC has
used support from the private sector, as well as from CNCS programs AmeriCorps and the Social
Innovation Fund (SIF), to expand their FOC model. This section contains a brief overview and history of
the FOC program model and the networks that have encouraged its adoption across the nation.
Origins of the Program Model
FOCs are modeled after The Annie E. Casey Foundation’s Center for Working Families (CWF) model,
which is based on the premise that low-income individuals and their families face a variety of obstacles
in trying to achieve financial stability. The CWF approach involves making resources more accessible to
individuals and families by offering coordinated services in a single, convenient location. These key
services include workforce/career, income support, and financial services. Workforce/career services
promote stable employment and advancement opportunities; income support services facilitate access
to public benefits; and financial services encourage asset building.3 A 2010 study shows that
coordinating, or “bundling,” these services makes it three to four times more likely that clients
experience a “major economic outcome” compared to a more piecemeal approach to service delivery.4
After nurturing several sites and seeing the potential of CWF, the Casey Foundation promoted the
approach though its own grantmaking and partnerships with other philanthropies and nonprofits. One
early collaborator was LISC in Chicago, which demonstrated how intermediary organizations could use
the concept. In 2003, 14 LISC-affiliated agencies adopted the CWF approach; with support from the
John D. and Catherine T. MacArthur Foundation, LISC took the concept to community-based
organizations across the city.5
The success of the FOC model in Chicago led the Casey Foundation to provide a grant to expand
the work with LISC in two additional cities, Detroit and Indianapolis. In 2006, the Casey and MacArthur
foundations cohosted a national conference to promote the CWF approach to service delivery that
5 A N A S S E S S M E N T O F L I S C ’ S F I N A N C I A L O P P O R T U N I T Y C E N T E R S
integrates financial coaching, employment services, and access to income support. In recent years,
however, LISC’s sites have been christened Financial Opportunity Centers. Although the FOC sites
have generally retained the basic features of the original CWF model, they have adopted LISC
innovations such as an increased emphasis on financial coaching, credit-building and peer networking.6
In the meantime, other national organizations have worked to promote the CWF integrated-
services approach. In 2013, a core group of national foundations and nonprofits formed the Working
Families Success Network, made up of national, state and local foundations, businesses and nonprofit
organizations interested in promoting effective practices identified by early FOC adopters like LISC.7
The network serves as a resource for sites implementing an integrated approach and “provides a
blueprint for a new way of offering support services to help lower-income people get work and improve
their financial security.”8 This blueprint includes the three core and bundled services of financial
coaching and education, employment, and improved access to public benefits. The network also has a
shared approach to assessment, identifying 11 common participant outcomes in the areas of
employment, training, and career services; financial coaching and asset building; income supports; and
bundling of services and program delivery.9 There are about 115 sites in more than 30 cities that offer
FOC services, of which more than half are affiliated with LISC.10
In 2010, LISC received an inaugural grant from CNCS’ Social Innovation Fund (SIF), which has
enabled them to expand the scope of their FOC model to additional sites. According to a 2012 report by
Walker and Huff,11
beginning in 2011, LISC received a total of $8.4 million in first- and second-round
grants under the SIF to help expand the reach of the centers – from 23 sites in five cities to 47sites by
mid-2012.12
In 2011 alone, the centers helped more than 3,600 people find employment, 3,100 obtain
public benefits, 3,600 increase their earnings, and 6,300 establish budgets to help them reach their
financial goals.13
Although several of the FOC sites receive support both from LISC’s SIF grant and from
LISC’s AmeriCorps grant, this study will focus specifically on the sites where AmeriCorps members
serve.
Literature Review
The FOC model has grown substantially in popularity in recent years, thanks to an enterprising group of
founders and national social service networks that recognize the value of integrating financial coaching,
employment counseling and income support counseling. Integrated service delivery has been called a
“supervitamin”14
that helps local governments operate more effective social service programs.
A N A S S E S S M E N T O F L I S C ’ S F I N A N C I A L O P P O R T U N I T Y C E N T E R S 6
However, despite its great promise, the model has not been widely adopted, in part because many
organizations face barriers to the integration of financial services with employment counseling..
Moreover, little rigorous evidence exists of the effectiveness of programs that offer employment
services, income support counseling, and financial coaching in a coordinated bundle. This section
contains a brief overview of the literature on financial coaching and integrated service delivery and the
evidence base for the program model’s effectiveness.
LISC itself has taken the initiative to assess the effectiveness of its FOC model by conducting
independent third-party evaluations. Like AmeriCorps, the SIF also requires its grantees to undergo
evaluations of their primary program interventions. LISC has contracted with the Economic Mobility
Corporation to conducting its required evaluation of SIF’s FOC program. The interim results from the
Economic Mobility evaluation are based on a quasi-experimental analysis of data collected from FOC
clients and a comparison group selected from Chicago neighborhoods surrounding the study sites. The
report describes the characteristics of the FOC participants and programs, examines whether the sites
engaged individuals in the intended services, and assesses the program’s impact on participants’ credit
scores and credit usage one year after program entry. The final report, which is scheduled for
publication in early 2016, will assess whether the FOC program helped participants obtain jobs,
increase their net income, access mainstream forms of credit, and build their net worth two years after
program entry, compared to those receiving services from Chicago Workforce One centers.15
The Economic Mobility report describes how the FOC’s bundle of services helps to strengthen
financial well-being in two steps: “The first step of the program is to help participants achieve positive
net income by removing barriers to employment, obtaining public benefits, and reducing expenses. The
next step is to engage participants in credit-building activities; that is, making regular payments on
existing or newly obtained loans or credit cards.”16
Evidence from existing versions of the integrated
service delivery model suggests that simply focusing on employment services is not enough to improve
the financial status of low-income program participants. As a brief report by the Corporation for
Enterprise Development (CFED)17
notes, programs that add financial coaching to employment services
are better able to their clients get and retain jobs, increase their hours worked, and earn higher wages.
The financial coaching element seems to provide more lasting impact for program participants, whereas
the benefits of workforce development programs are often transitory.18
Financial coaching programs, differ from financial literacy programs and financial counseling
programs, both in the duration and intensity of the program, and because the curriculum tends to be led
by the client rather than the coach. Financial literacy programs are designed to teach participants about
recommended financial practices and how to interact with the financial system, while financial
7 A N A S S E S S M E N T O F L I S C ’ S F I N A N C I A L O P P O R T U N I T Y C E N T E R S
counseling programs aim to solve the participant’s most immediate and pressing problems. In contrast,
financial coaching uses regular one-on-one sessions with a coach to help the client chart a course that
leads to increased long-term financial well-being. The financial coaching model avoids the problems
associated with financial education and counseling programs, such as the lack of access to financial
institutions and services, which may prevent low-income participants from applying the lessons they
have learned, and the lack of follow-up meetings to keep them on the right track.19
By focusing on the
specific needs of clients, the coach helps them place higher priority on paying down debts, building
credit and savings, and acquiring longer-term assets.
Integrating employment and financial coaching service delivery is especially important because the
evidence that financial coaching alone provides significant benefits is mixed. A recently published
report called “An Evaluation of the Impacts and Implementation Approaches of Financial Coaching
Programs,” conducted by the Urban Institute20
for the Consumer Financial Protection Bureau, provides
much-needed rigorous evaluation evidence that measures the effectiveness of financial coaching. The
study uses an experimental design to produce causal evidence of the impacts of services received at two
sites. While the results differed across the two sites, the study generally concluded that coaching had
significant positive impacts on economic outcomes such as money management, paying down debt,
saving, and perceptions of financial well-being.
The Urban Institute’s report “suggests that a well-implemented coaching program with engaged
clients can produce important improvements in certain financial outcomes.” While the study does not
focus specifically on the FOC model, the report does describe some of the challenges of implementing
the model.21
The authors note that even when an organization succeeds in creating a program that
offers a bundle of services, they often have trouble convincing clients to take advantage of these
opportunities. For instance, according to a report recently published by LISC, only 33 percent of recent
FOC clients received all three of the FOC services (employment counseling, financial coaching, and
income supports counseling).22
Moreover, despite the appeal of the integrated-services model, many
organizations struggle to implement it, particularly when their main programmatic focus is providing
employment services. Many organizations struggle to find additional funding for services that are seen
as add-ons to the workforce development model, or to find support for continued follow-up with their
clients.23
While the prevalence of integrated service delivery – and the FOC model in particular –
continues to increase, the evidence base that describes the impact of these programs has also grown,
though more slowly.
A N A S S E S S M E N T O F L I S C ’ S F I N A N C I A L O P P O R T U N I T Y C E N T E R S 8
Data Sources The analysis in this report uses three types of data collected by, or from, LISC sites: client-level data that
site staff members enter into LISC’s ETO data system; interview data collected through telephone and
in-person interviews with site staff; and cost data that study team members collected from the sites.
While these later sections of the report contain more details about how the data were used for analysis,
this section describes the sources of the data, how they were collected, and how their limitations have
influenced the design and execution of the study.
Interviews and Qualitative Analysis
To learn how the FOC model is implemented by LISC sites and gain a deeper understanding of the
factors and dynamics that can influence program operations and outcomes, this study included a
qualitative research phase. Data were collected from a sample of nine LISC FOCs via four in-person and
five telephone interviews. To facilitate our understanding a purposive sampling24
approach was used to
select LISC FOCs to participate in the qualitative phase of the study. Purposive sampling allowed the
widest range of experiences because the sample FOCs reflects variation in organizational
characteristics such as size, type, location and sources of supplemental funding.
The study’s qualitative phase was structured around the following research question: Do the services
provided by LISC AmeriCorps members placed in Financial Opportunity Centers help produce positive benefits
to the clients they serve relative to those who do not receive services? Although not all clients receive
services from AmeriCorps members, the members are part of the team that helps to deliver FOC
services to clients. The qualitative data collected from interviews with site staff and AmeriCorps
members focus on site administration and operations, and in particular, the role and function of the
AmeriCorps member or members. The interviewees discussed topics such as how sites recruit clients,
deliver services, update and clean data collected from clients at intake, and use AmeriCorps members to
assist in service delivery.
Data collection consisted of semi-structured interviews with LISC FOC staff with direct knowledge
of or involvement in implementing and administering the FOC model at their respective organizations.
Data were collected over a four month period between May and August 2015. Interviews used open-
ended questions and lasted between 45 and 90 minutes. With the permission of the respondents, all
interviews were digitally recorded and transcribed. It is important to acknowledge the possibility that
9 A N A S S E S S M E N T O F L I S C ’ S F I N A N C I A L O P P O R T U N I T Y C E N T E R S
respondents may tailor their responses to present a positive image of themselves and their
organizations by calling attention to certain details and events and lessened the importance of or
omitted others. To help forestall this possibility, each respondent was ensured privacy and the
confidentiality of any information obtained during the interview.
The interview protocol, found in Appendix A, included questions intended to explore client and
organizational characteristics; the ways programs recruit and enroll clients; FOC implementation
models; client data management practices and strategies; and the roles and responsibilities of the
AmeriCorps members. Each interview was coded according to the key themes that emerged from the
interviews.
Administrative Data from ETO
In April 2015, LISC published one of the few studies that focuses on the specific benefits of the
integrated service delivery model.25
The study uses 34 months’ worth of program data collected from
39,491 clients in 62 FOCs in 15 cities or labor markets, and shows that clients who receive the full
bundle of FOC services were much more likely than clients who receive only one or two services to
obtain employment, stay at their jobs, increase their net income and net worth, and obtain credit scores.
The primary data source for this study, and also for the LISC study published earlier this year, was
data collected by LISC sites through the custom-designed Efforts to Outcomes (ETO) data system. FOC
counselors collect a wide array of information from their clients: they collect demographic information
on the client and his or her household at entry, help the client fill out a detailed budget showing income
and expenses, fill out balance sheets that summarize the client’s assets and debts, track job placement
and wages, and help clients first acquire and then increase their credit scores. They update this
information regularly for the duration of the client’s participation in the program. The data used to
conduct the cost analysis comes from clients who received services between October 2013 and March
2015. The impact analysis relies on data from the previous program year (2012-2013) to match the time
period for which SIPP data are available for the comparison group.
The ETO system records information about when (or if) each client started receiving each of the
three FOC services, and also records the time spent with each coach during each counseling session.
Because most clients do not receive the full bundle of FOC services – employment counseling (EC),
financial coaching (FC), and income support counseling (ISC) – information about the “program mix” of
services received by clients plays a central role in much of the analysis. For instance, the type of service
A N A S S E S S M E N T O F L I S C ’ S F I N A N C I A L O P P O R T U N I T Y C E N T E R S 1 0
a client receives determines which outcomes are available for analysis: updated data on employment,
wages earned and job retention are only available for clients who receive employment counseling, while
financial outcomes such as net income and net worth are collected only for clients who receive financial
coaching. The ETO database also contains missing data for minutes of service received by clients who
are known to have received at least some counseling or coaching. Clients with missing data on minutes
of service received are excluded from the impact analysis, but this approach would understate, in all
likelihood, the costs of providing FOC services. Thus, in the cost analysis, clients with missing data for
minutes of service received are assigned small values, which are based on recent ETO data for clients
with minutes of service recorded: 20 minutes if they made an in-person visit to meet with a counselor or
coach, and 10 minutes if there is no such record of an in-person meeting.
Site-Level Data on FOC Costs
For this study, the project team worked with FOC sites receiving AmeriCorps members to collect
detailed data on the costs of providing FOC services and of operating other programs. In all, six of the
eighteen sites that offered FOC services reported relatively complete cost data for program year 2013-
2014, the most recent year for which complete cost data were available. The cost data reported by
these sites were generally consistent with budget data reported by sites that receive funding from
LISC’s Social Innovation Fund grant to offer FOC services. The data reported by the sites were
combined with ETO data on service received by clients to calculate the unit costs of FOC services: site-
specific estimates of the cost of providing a minute of employment counseling, financial coaching, and
income support counseling. We use these unit costs to develop a multivariate model of the amount that
sites spend to deliver services to individual clients, and to perform cost-benefit comparisons that
compare the costs of supplying services to clients with the estimated benefits, based on the results of
the impact analysis.
Data Collection Strategy
The project team used program cost data, provided by LISC site partners and administrative data from
the LISC program office between July and September 2015, to create the statistics used in this analysis.
In July, the project team and the LISC program office requested program cost data for program year
2013/2014 from all of the AmeriCorps-sponsored FOC sites. The team designed a standardized
spreadsheet for budget information, including salaries and benefits, direct costs, and overhead costs for
1 1 A N A S S E S S M E N T O F L I S C ’ S F I N A N C I A L O P P O R T U N I T Y C E N T E R S
site staff (see Appendix B). The spreadsheet was designed to be as user-friendly as possible to facilitate
submission of data. Instructions were embedded in the spreadsheet, and LISC hosted a webinar during
which an Urban researcher went over the spreadsheet to answer questions about the spreadsheet and
the cost study itself. The project team, with the assistance of the LISC program office, made multiple
attempts to collect data from sites that did not respond or supplied insufficient data. In all, 12 sites
submitted data templates with complete or partial cost data.
The data collection template asks site staff, specifically program managers or other managers who
are familiar with their organization’s operation and finances, to separate costs into four broad
categories: direct service salaries and benefits, administrative salaries and benefits, direct costs, and
overhead.
Direct service salaries and benefits covers the costs of the frontline personnel that deliver FOC
services (i.e., employment coaches, income support coaches, and financial coaches), program
managers, and other assorted staff, such as job developers.26
Administrative salaries and benefits includes the executive director or program manager and
administrative and data personnel.
Direct costs includes travel, materials and supplies, rent/mortgage, utilities, and other expenses
directly related to delivering programs and services.
Overhead includes travel, materials and supplies, rent/mortgage, utilities, and other expenses
directly related to managing programs and services.
The sites were asked to fill in dollar amounts for each line item as well as the percentage of the
dollar amount used to cover FOC service delivery.
The spreadsheet is designed to yield information about the overall resources of each site, and about
how much it costs each site to operate its FOC program. The FOC costs, which are key to our analysis,
are not available from any other source. For instance, the AmeriCorps budgets maintained by the
program office only contain funds provided by the AmeriCorps grant that are available to each site, and
do not consider non-AmeriCorps resources that the sites use to fund their programs. The data collected
for this project thus represent the best available estimates of the costs of providing FOC services.
A N A S S E S S M E N T O F L I S C ’ S F I N A N C I A L O P P O R T U N I T Y C E N T E R S 1 2
Limitations
The cost data collected for this project have their limitations. The primary limitation is that the data are
self-reported, and have not been validated against actual financial records or budgets, which were not
available to Urban researchers. While it is likely that the data may contain errors when compared to
financial records, they are used as reported in this analysis, in large part due to the expected source of
the data: managers who have a grasp of their organization’s finances and operations. Urban and LISC
explicitly asked to have the standardized spreadsheet for budget information filled out by program
and/or financial managers. Moreover, Urban worked with LISC in confirming that the data submitted
was consistent with what LISC knows about the sites: the study team compared salaries and benefits for
FOC coaches with budgets reported by sites who are also SIF grantees, and found that the data
submitted by the AmeriCorps sites were comparable. The potential for inconsistencies with actual
financial records does need to be kept in mind, however, when using the data to identify possible
explanations for variations in site-level FOC costs. In addition to being self-reported, the sites did not
always report data uniformly which can be attributed to different institutional contexts and
understanding of resource allocation. Some sites provided estimates for line items that did not readily
correspond to their organizational structures and budgets (e.g., personnel and overhead costs covered
by in-kind support and space agreements with other institutions).
Six sites with complete data were used for the cost analysis, while the other six sites were removed
from the analysis. Data from the excluded sites exhibited a number of issues. One site did not report
information on an executive director or other executive staff for its administrative costs; one site did
not report minutes devoted to each FOC service, eliminating comparison by cost-per-minute of service;
and another site had missing data for one or more line items under direct costs, overhead, and
administrative costs. Three sites had incomplete data on direct personnel costs which, if included,
would have demanded some imputation.
The team investigated possible estimation methods to fill in missing data elements, rather than
limiting the sample to only the six sites that submitted complete cost data. While missing data for direct
personnel compensation can be replaced by estimates after making relatively straightforward
assumptions, estimating missing costs for administrative compensation is much more challenging. It is
possible to use the average compensation across all sites to estimate the pay of various roles, but there
are no values that reflect how administrative personnel spend their time, which means that the
proportion of compensation devoted to the FOC is undefined. It is unreasonable to assume that
administrative expenditures would be completely devoted to FOC programming, particularly for sites
1 3 A N A S S E S S M E N T O F L I S C ’ S F I N A N C I A L O P P O R T U N I T Y C E N T E R S
that are administering other types of services. Further, using an average or any other set value would
make all missing values the same, which would complicate comparisons of FOC cost data across sites.
Estimating missing data for direct costs is also difficult without additional knowledge about the site
and its program operations. For example, when a site does not list any training expenses, it is uncertain
whether that reflects not having training costs or whether training costs were simply omitted. Further,
the amount that is spent on direct costs and how much of those costs are devoted to the FOC reflect
program characteristics that are unknown (e.g., how many employees were trained and how many
trainings pertained to the FOC).
Finally, missing data for overhead costs are extremely difficult to estimate with the available
information. Operational characteristics appear within overhead costs, with some sites effectively
having no mortgage or rent. For example, one site owned its building and rolled up all of its overhead
expenses under “other overhead costs,” choosing to omit the other values. Other sites reported the
total costs for a line item in the overhead category, but not the percentage devoted to FOC
programming. For instance, one site that estimated its in-kind rent value did not specify how much
could be attributed to the FOC. Estimating missing data for multi-purpose sites, and sites that operate
under in-kind space agreements, requires assumptions about the proportion of overhead costs to the
FOC that are very difficult to justify. For these reasons, the cost analysis only includes data from the six
sites that reported complete cost data.
A N A S S E S S M E N T O F L I S C ’ S F I N A N C I A L O P P O R T U N I T Y C E N T E R S 1 4
The Local Initiatives Support
Corporation (LISC) AmeriCorps
Program LISC has received support from an AmeriCorps national direct grant for over twenty years, and its
AmeriCorps sites have delivered FOC services for more than ten years. In recent years, LISC’s
AmeriCorps program has devoted a larger share of its resources to the FOC model. In program year 16
(2009-2010), 20 AmeriCorps members participated in FOC services, but three years later (program
year 2011-2012) that number had more than doubled, to 52. LISC’s AmeriCorps sites deliver all three of
the primary FOC services – financial coaching, employment counseling, and income support coaching –
and have recently begun delivering services in computer literacy. As noted earlier, LISC provides
programming that fits into two CNCS strategic focus areas – Economic Opportunity and Capacity
Building. Furthermore, LISC has opted into six CNCS standardized performance measures in the
Economic Opportunity focus area. The program reports on outputs and outcomes for each of three
activities: financial counseling, employment skills training, and job placement and referral.
The LISC FOC sites that host AmeriCorps members are located throughout the country, with a
concentration in Chicago, but vary in the way they administer the FOC model. We recognize that
variance in external and internal organizational characteristics could impact a FOC’s effectiveness and
outcomes. Therefore, we conducted a qualitative analysis to learn how the FOC model is implemented
by LISC FOC grantees and gain a deeper understanding of the factors and dynamics that may influence
program outcomes. The project team identified key issues to be addressed through semi-structured
interviews. This section highlights the findings from the qualitative inquiry and presents discussion
points made by the LISC FOC respondents. For this analysis, we focused on factors that would affect
the way that AmeriCorps-funded FOC sites provided services that benefited clients. While, as noted
previously, this study is not designed to isolate the impact of the contributions of AmeriCorps members
to client outcomes, much of the focus was on the roles and responsibilities of AmeriCorps member(s).
1 5 A N A S S E S S M E N T O F L I S C ’ S F I N A N C I A L O P P O R T U N I T Y C E N T E R S
Findings from the Qualitative Inquiry
The organizations selected for this phase of the study share commonalities in terms of their programs
and services. However, there is some diversity across the group in that the organizations reflect various
sizes and types. These differences in organizational characteristics could help explain a FOC’s
effectiveness and outcomes.
FOCs typically are housed in community-based organizations that provide workforce development
programs and services. While all of the organizations that participated in the qualitative inquiry provide
employment and financial coaching services, some nonprofits also provide traditional programming that
includes housing, adult education (e.g., GED preparation), and youth services. All of the organizations in
the interview sample have been operating longer than 15 years and most were already offering some of
the same services in the FOC model prior to become a LISC affiliate.
A nonprofit organization’s financial capacity can have some bearing on its success. Financial
resources are critical to organizations because they determine an organization’s ability to allocate
additional resources needed to fulfill the mission and support programmatic operations. There is no
formal agreement in the literature as to what constitutes a small, medium or large nonprofit. However,
financial data for the community based organizations in this study suggest that these organizations tend
to be medium and large entities. While financial capacity is not necessarily an indicator of organizational
effectiveness and efficiency, studies show that the larger the organization and the more financial
capacity it has, the more likely it is to have more advanced capacity and resources to invest in achieving
programmatic outcomes. Although FOCs receive funding through LISC to support the administration of
FOC services, this funding is typically not the community-based organization’s primary revenue source.
The use of other types of primary or supplemental funding to support the delivery of employment and
financial education services may have an influence on the client outcomes. For example, private funds
may offer an organization more flexibility to provide more intensive services than public funds.
The FOCs that participated in this study have total program budgets ranging from $175,000 up to
$1 million. Based on the data collected in the interviews, it is unclear what funding sources are included
in the total budget amounts. One respondent shared that their FOC is fully integrated with their
Workforce Investment Act (WIA) activities. As a result, their LISC FOC funding is paired with
government money to support and carry out FOC programmatic operations. It should be noted that the
use of WIA funding does shape the demographics of their client population and the structure of their
programs, which could ultimately affect their client outcomes. In contrast, another respondent shared
A N A S S E S S M E N T O F L I S C ’ S F I N A N C I A L O P P O R T U N I T Y C E N T E R S 1 6
that their FOC receives matching funds from a private donor which doubles the amount of resources
they direct toward FOC work.
LISC FOC Target Population and Client Recruitment
The FOCs generally target and serve clients with similar demographics and employment and financial
characteristics. Many FOC clients are “high-needs,” or hard-to-employ, individuals who are likely to
have one or more of the following characteristics:
homelessness
criminal record
little to no technical skills
high school education or less
unstable employment history or limited work experience
undocumented immigration status
limited English proficiency
FOCs mostly serve clients from the local neighborhoods and communities. It should be noted that
FOCs that partner with other programs or government entities may receive client referrals from
surrounding communities. The community-based organizations that implement the LISC FOCs typically
are located in low income communities to make it easier for individuals to access their services. All but
one FOC stated that ‘word of mouth’ is the most common way they recruit clients. Overall, respondents
indicated that FOCs do minimal recruiting, “A lot of times they hear [about] us from church or another
organization, but I would say the single greatest referral source is word of mouth.” One theme that emerged
from the data is that FOCs, given their client caseload, often do not have the staff or capacity to invest
in robust outreach or marketing efforts. In some cases, the AmeriCorps member is asked to assist with
outreach and recruiting activities. As one AmeriCorps member described,
Sometimes you get them [clients] off the street. To be honest, some guys, when I’m out
recruiting, some guys, you just see something inside of them. I tell them to come into my office;
I’ll help them out… I go out on [name of street], I go into stores, give out flyers, and talk to a few
people.
1 7 A N A S S E S S M E N T O F L I S C ’ S F I N A N C I A L O P P O R T U N I T Y C E N T E R S
This reliance on “word of mouth” tactics and the lack of capacity to develop stronger outreach
efforts limits distribution of program information to individuals or groups in the community that could
benefit from FOC services.
LISC FOC Services and Program Models
The interview data suggests that the FOCs broadly follow two program operating models. The most
common operating model involves clients meeting with a financial coach before they are introduced to
other services (e.g., job readiness training, career coaching, employment assistance, or income support
counseling). Respondents explained that their FOC prefers this model because clients are seeking
assistance finding employment and usually are not interested in financial coaching services. So, to help
ensure client participation and retention, the respondents that follow this approach stressed that their
programs make every effort to schedule client meetings with the financial coach on the same day the
client either walks in, goes through the intake process, or participates in an orientation session.
The other operating model requires clients to complete a series of four to five meetings of which
three of these meetings must be held with financial, employment and income support coaches. Some of
the FOCs prescribe the order of the meetings while others allow the clients to select the order
according to their level of interest or need. Under this model clients seem more likely to receive the full
bundle of services – employment, financial and income support counseling – since it is often required.
Depending on the FOC’s client population, certain types of service delivery may be more effective
than others. During the interviews respondents described a mix of one-on-one and group service
delivery methods. For instance, the collection and review of a client’s personal financial information as
well as the financial coaching generally occurs one-on-one with clients, however some programs also
offer small group sessions to stress the importance of financial literacy and explain their available
services. FOCs also differed in how they provided employment services to clients. Some FOCs prefer
one-on-one coaching to meet individual client needs, such as job search assistance, while others provide
job readiness workshops that teach resume writing and interviewing skills. However, in most cases
FOCs offer a combination of both approaches.
Technical skills are important because they can provide FOC clients an avenue to career and
financial success. To this end, the majority of the respondents (78 percent) indicated that their FOC
directly provides services to enhance the technical skills and competencies of their clients. One
respondent explained that they have a partnership with a nonprofit that provides free computer
A N A S S E S S M E N T O F L I S C ’ S F I N A N C I A L O P P O R T U N I T Y C E N T E R S 1 8
training, and so they refer their clients to this nonprofit for training. Only one FOC stated that they do
not offer computer literacy training.
Because clients generally have little to no technical skills, FOCs administer assessments so that
they can provide computer training or one-on-one coaching that meets each client’s skill level. The
assessment data also help the FOCs track a client’s progress and improvement. The length and format
of computer and digital literacy training vary across FOCs. Training topics may include computer basics,
Microsoft Office (Word and Excel), job search and application techniques, and how to use social media.
Program dosage and duration also can influence whether a FOC achieves positive outcomes.
Essentially, clients that receive more intense services for longer periods of time are more likely to
change behaviors and achieve positive outcomes.27
According to the interview data, dosage and
duration depend on individual client characteristics and needs as most respondents explained that their
clients may re-enroll or seek services multiple times and for as long as the client deems necessary. Thus,
the dosage and duration of services varies across FOCs and most do not formally exit clients from their
program. After the initial client orientation or coaching meeting, the FOCs varied in the amount of
contact they have with clients over time and the client typically decides when s/he no longer needs
services. A few interviewees mentioned that clients tend to stay connected to the program in that they
repeatedly return for services, particularly financial counseling, if they experience a change in
circumstances (e.g., obtained or lost their job, increased wages, changes in family circumstance, etc.).
LISC FOC Data Collection and Management
All of the FOCs use Efforts to Outcomes (ETO) software, custom-designed for LISC, to collect and store
client data. FOC staff members rely on a combination of data to serve clients and measure outcomes.
The most important and frequently collected data were those related to case management (such as
documenting the services clients receive), financial information (such as credit and income history), and
employment data (such as technical skills assessments, employment history or job readiness). LISC
requires FOCs to collect certain client financial information (such as income, expenses, debts, credit
rating, assets and spending habits) so that FOC staff can adequately counsel clients and assess the
extent clients are changing their behaviors and making progress during and after receiving FOC
services. The frequency in which FOCs collect and review data varies across respondents.
Several FOCs shared challenges maintaining the quality of their data. Essentially, without accurate
and timely information, the data collected become less effective in helping FOCs improve the quality of
1 9 A N A S S E S S M E N T O F L I S C ’ S F I N A N C I A L O P P O R T U N I T Y C E N T E R S
the programs and client outcomes. This is especially challenging when multiple people are collecting and
entering data in ETO. Most of the FOCs responded that multiple staff members enter client data into
ETO. For example, the staff member that conducts intake or orientation may enter the initial data on
clients. Plus, as clients receive services the case data is updated by each staff member (e.g., financial
coach, employment coach, income support coach). Some respondents remarked that while it would be
easier to have one person assigned to enter and manage data; their programs do not have the staff
capacity to support this type of position. The AmeriCorps member was mentioned as an ideal person for
this type of task. However, because data management tasks fall outside the scope of an AmeriCorps
member’s responsibilities, this prevents FOCs from assigning this work to them. As one respondent
shared:
AmeriCorps could be more enriching by providing someone who can help us with intakes and
data entry. If I could funnel the data through one person, who would enter a lot of it, I think that
would clear a lot of those issues. However, we have been very strictly told that AmeriCorps
members can only work within certain parameters, one of which not serving as any sort of data
management person.
To help avoid such inconsistencies, most FOCs have taken steps to manage the systematic flow and
entry of correct and timely data on a continuing basis by assigning specific program staff responsibility
for making sure data is accurate. In most cases the person assigned this task is the program director (or
comparable position title), but some sites have a program evaluation staff member that reviews and
cleans client data. Monthly reviews were commonly mentioned by respondents, but one FOC shared
that they recently moved from monthly to weekly reviews to enable them to make timely changes to
their program or respond to client needs more efficiently.
The respondents also expressed challenges collecting follow-up data on clients once clients feel
they no longer need to seek the services of the FOC. Two commonly cited reasons were difficulty
getting in touch with clients and lack of staff time and organizational resources to conduct follow-up
efforts. Although FOCs can obtain client credit records for up to five years, FOCs generally track clients
for up to one year after services are rendered. Two programs indicated that they track clients up to two
years after they receive services. FOCs expressed difficulty getting clients to respond to the FOC’s calls
and emails or simply getting in touch with clients as their phone numbers tend to change regularly. As
two respondents shared:
We don’t [follow up] as much as we’d like to. We do invite them back when we have events... We
have done some surveys, but again, we don’t have the resources to do that.
To be honest with you we have lots of issues contacting people after they’ve found jobs because
they’ve gotten what they wanted.
A N A S S E S S M E N T O F L I S C ’ S F I N A N C I A L O P P O R T U N I T Y C E N T E R S 2 0
Contributions of LISC FOC AmeriCorps Members
FOCs typically have one LISC AmeriCorps member assigned to their program. Eight FOCs (roughly 89
percent) stated that LISC AmeriCorps members assist with their program’s efforts to provide clients
with technical skills, or that the member is involved with supporting clients in their efforts to obtain
employment. While the AmeriCorps member tends to play a role in only one of these areas, there are
some cases in which the services overlap, so the AmeriCorps member does both. AmeriCorps members
that play a role in helping clients acquire technical skills may be tasked with conducting computer and
digital literacy assessments, facilitating small groups or classes, or providing individual assistance to
clients needing help navigating employer websites, completing online applications, and using email or
other technological tools. AmeriCorps members assigned to assist clients with obtaining employment
are likely to conduct job readiness workshops, career coaching, and job placement services. According
to one respondent,
They [AmeriCorps members] act as a resource to the folks coming into our resource center,
especially with computers. Many of the clients don’t have much computer knowledge. The
AmeriCorps member helps them look for jobs. They guide them and help them navigate through
the employers’ website.
AmeriCorps members are less likely to provide financial coaching than any other service. A
respondent commented that AmeriCorps members generally do not have the skills to provide quality
financial coaching or counseling and are better suited to conduct computer or job readiness training.
Only one FOC stated that the LISC AmeriCorps member provides financial coaching because this
particular site does not offer technical skills training. The respondent added that the AmeriCorps
member provides one-on-one financial coaching based on a client’s credit, employment and financial
situation and that the member does work closely with the program’s employment coach.
Conclusion
Overall, the interview data reveal nuanced differences across FOCs. While these differences may seem
minor, they could help explain why some programs achieve more positive client outcomes than others.
Some common themes that emerged from the interview data include the following:
The community-based organizations that operate FOC programs in this study tend to be
medium to large size. According to the research, these organizations are less likely to struggle
and have greater capacity to secure resources.
2 1 A N A S S E S S M E N T O F L I S C ’ S F I N A N C I A L O P P O R T U N I T Y C E N T E R S
The FOC models reflect a client-driven approach. A consistent theme throughout the interview
data is that FOC clients define the goals they wish to prioritize and work with FOC staff to
obtain services that meet their needs for as long as they desire. Hence, the amount of contact
FOCs have with clients varied. The client driven approach described in the interviews suggests
FOCs are designed to be less restrictive and burdensome on clients. Yet, the dosage and
duration of services could influence the extent to which clients change behaviors and achieve
positive outcomes.
Respondents expressed challenges with data collection and quality. Most FOCs have multiple
staff entering information, which can increase the likelihood of inconsistencies and challenges
to ensuring data quality. Moreover, collecting client follow-up data can be difficult as many
FOCs do not have staff resources they can dedicate to tracking down former clients.
During this study period, AmeriCorps members were most likely to assist with FOC efforts to
provide clients with technical skills or support clients in their efforts to obtain employment.
A N A S S E S S M E N T O F L I S C ’ S F I N A N C I A L O P P O R T U N I T Y C E N T E R S 2 2
Impact Analysis This section summarizes our estimates of the impact of FOC services on client outcomes. Employment
and wage impacts are presented first, followed by credit impacts, net income and finally, net worth
impacts. The employment and wage outcomes considered here are whether or not an individual is
employed in an unsubsidized job, and their hourly wage at that job. Credit outcomes include an
individual’s credit (FICO) score if they have one, and whether or not the individual has a FICO score. Net
income outcomes originally included an individual’s net income and the probability of moving from
negative to positive net income. However, the net income analyses are excluded from this report
because these analyses did not pass standard diagnostic tests used to assess the validity of the estimate
(more details are provided below). Finally, the net worth outcomes measured include an individual’s net
worth and the probability of moving from negative to positive net worth. A wide variety of impact
estimates are provided in this report. Each impact estimate is reported with its corresponding
treatment and comparison groups, and their respective sample sizes before matching.28
The analyses utilize two very different comparison groups to estimate the impact of FOC services.
Individuals in the Survey of Income and Program Participation (SIPP) and the credit bureau databases
are used as comparison groups to assess the total impact of FOC services on FOC clients. In addition to
the SIPP and credit bureau databases, FOC clients are compared to other FOC clients to evaluate the
benefit of incremental increases in FOC services. For this reason, the results from the SIPP and credit
data comparison groups are not directly comparable to any of the analyses using FOC clients as
comparison cases. The differences between these analyses are discussed in more detail below and are
regularly noted throughout the report. This section will lead with a discussion of the propensity score
matching (PSM) method, which is followed by the results.
Broadly speaking, FOC services tend to be associated with improved employment and wage
outcomes relative to individuals that are receiving no FOC services, but have no impact on credit
outcomes relative to individuals that are receiving no FOC services. When FOC clients receiving
multiple services are compared to FOC clients receiving fewer services (to determine the effect of
adding additional services), the results are more mixed. For example, adding financial coaching to
employment counseling is consistently associated with an improvement in employment and wage
outcomes, although this is not true of the addition of income support to employment counseling. This
suggests that while FOC services are associated with client improvements overall, some service mixes
may be more advantageous than others.
2 3 A N A S S E S S M E N T O F L I S C ’ S F I N A N C I A L O P P O R T U N I T Y C E N T E R S
When FOC clients are compared to other FOC clients on credit outcomes, the incremental addition
of FOC services is consistently associated with weaker credit outcomes. One possible explanation for
this result is that most of the benefit of FOC services for credit outcomes is provided by financial
coaching, which is not assessed in the comparison of FOC clients to other FOC clients, since credit
outcomes are only captured for clients who receive financial coaching. The results could also reflect
that individuals receiving only financial coaching may be better off financially than other groups in a
way that is not accounted for in the model. The analyses of the impact of incremental additions of FOC
services on net worth show broadly positive results: the addition of new FOC services is associated with
improved net worth.
Impact Analysis and Propensity Score Matching
The impact analysis performed for this study addresses the first research question: whether clients who
receive FOC services are more likely to experience positive outcomes, or derive more economic
benefits, than others who do not receive these services. Propensity score matching (PSM) is used to
form comparison groups that are similar to FOC clients, to control for other factors that might be
responsible for the short-term changes observed in the data. Comparison groups drawn from other
data sources – namely, the SIPP and a database of credit outcomes provided by the credit bureau –
permit the estimation of the impacts of receiving FOC services, which directly address the research
question. A second set of impact estimates, also calculated using propensity score matching, illustrate
the impact of providing additional services to FOC clients who are already receiving partial bundles of
service.
Overview of Propensity Score Matching
A simple comparison of outcomes is insufficient for understanding the impact of FOC services because
clients receiving the services of interest may fundamentally differ from those that do not. In that case, it
is impossible to attribute differences in outcomes solely to FOC services because other differences in
client characteristics are likely responsible for at least some of the differences in client outcomes. The
selection process determining which FOC services are received by which clients must be accounted for
in an estimate of the impact of FOC services in order to avoid selection bias that may distort the results.
Selection shapes the population of FOC clients in at least two ways. First, FOC sites have administrative
processes that determine how to allocate services to clients with different characteristics. Second, FOC
A N A S S E S S M E N T O F L I S C ’ S F I N A N C I A L O P P O R T U N I T Y C E N T E R S 2 4
clients themselves self-select into different services (sometimes in anticipation of the administrative
processes set in place by the FOC sites).
To isolate the impact of FOC services on client outcomes, clients receiving a service must be
compared to other individuals who are similar in all respects except for their receipt of the service being
analyzed. Sometimes this is done by randomly assigning services to clients and observing differences in
the outcomes they experience. Random assignment is not feasible for this analysis, but it is not the only
option available. A popular alternative to random assignment is propensity score matching (PSM). PSM
is a statistical procedure that constructs a comparison group to look like the treatment group on
observable characteristics and therefore mimic random assignment. The PSM procedure consists of
two stages. In the first stage the probability of receiving treatment is modeled as a function of a variety
of observable characteristics. This is presented in Equation (1), below, where T is a binary variable
indicating treatment status, X is a vector of control variables (listed in more detail in table 1 below), and
ε is an error term:
1. T = βX + ε
Using this model, each comparison case is assigned a predicted probability of treatment (called a
propensity score). Comparison cases that closely resemble treatment cases are assigned a high
predicted probability, while those that do not resemble treatment cases are assigned a low predicted
probability. Treatment cases are then matched to comparison cases that have the smallest difference in
propensity score (i.e., the comparison case that minimizes the treatment case propensity score minus
the comparison case propensity score). Since these matched cases have similar predicted probabilities
of receiving treatment, comparing their outcomes to estimate a treatment effect is statistically
comparable to a random assignment study design (where treatment and control cases have an identical
probability of receiving treatment). It is possible for a single comparison case to match to several
treatment cases. In this situation, the comparison case would be assigned a higher weight in the
estimation of the treatment effect (two, three, or more) than a comparison case that only matched to
one treatment case and would therefore have a weight of one. In the second stage, the treatment effect
is estimated in a regression framework using this new weighted “matched” comparison group:
2. Y = α1T + α2X + α3Z + u,
where Y is the outcome variable, Z is a vector of variables not used in the estimation of the
propensity score,29
and u is an error term. The treatment effect that is reported in all subsequent tables
is the marginal effect of T on Y, or the parameter α1 from the second stage model. α1 can be interpreted
as the effects of treatment net of the effects of any differences in the matching variables. Each cell in
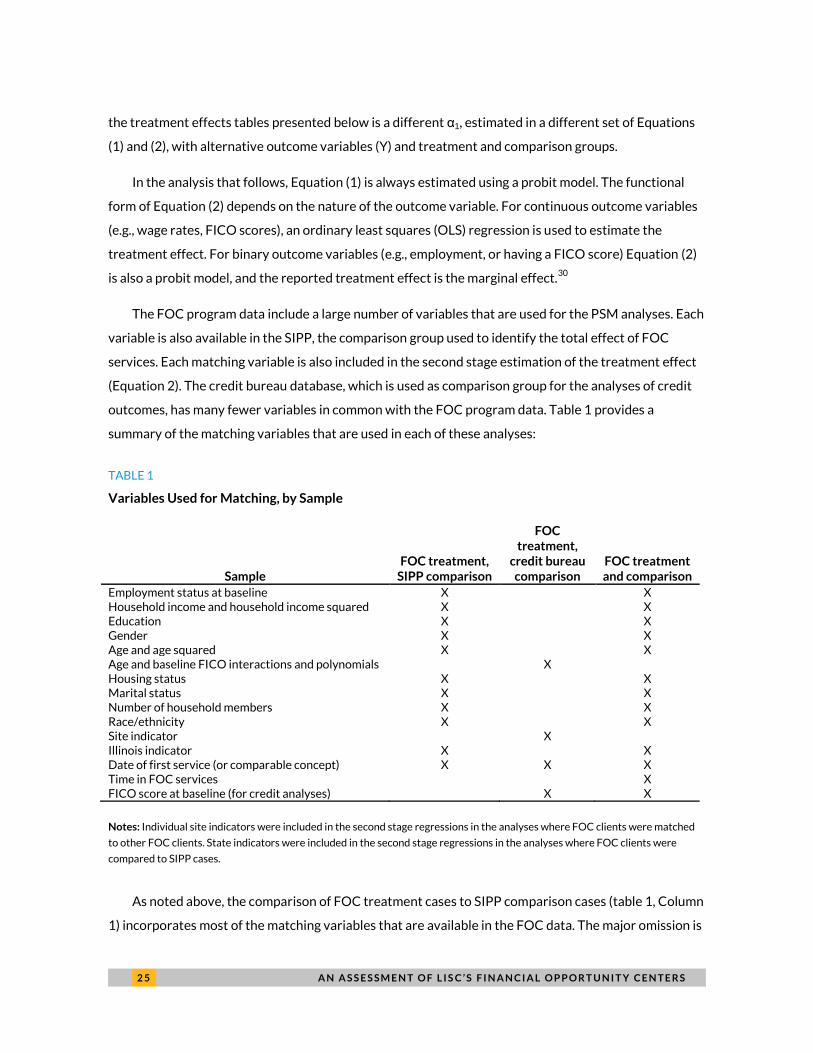
2 5 A N A S S E S S M E N T O F L I S C ’ S F I N A N C I A L O P P O R T U N I T Y C E N T E R S
the treatment effects tables presented below is a different α1, estimated in a different set of Equations
(1) and (2), with alternative outcome variables (Y) and treatment and comparison groups.
In the analysis that follows, Equation (1) is always estimated using a probit model. The functional
form of Equation (2) depends on the nature of the outcome variable. For continuous outcome variables
(e.g., wage rates, FICO scores), an ordinary least squares (OLS) regression is used to estimate the
treatment effect. For binary outcome variables (e.g., employment, or having a FICO score) Equation (2)
is also a probit model, and the reported treatment effect is the marginal effect.30
The FOC program data include a large number of variables that are used for the PSM analyses. Each
variable is also available in the SIPP, the comparison group used to identify the total effect of FOC
services. Each matching variable is also included in the second stage estimation of the treatment effect
(Equation 2). The credit bureau database, which is used as comparison group for the analyses of credit
outcomes, has many fewer variables in common with the FOC program data. Table 1 provides a
summary of the matching variables that are used in each of these analyses:
TABLE 1
Variables Used for Matching, by Sample
Sample FOC treatment,
SIPP comparison
FOC treatment,
credit bureau comparison
FOC treatment and comparison
Employment status at baseline X X Household income and household income squared X X Education X X Gender X X Age and age squared X X Age and baseline FICO interactions and polynomials X Housing status X X Marital status X X Number of household members X X Race/ethnicity X X Site indicator X Illinois indicator X X Date of first service (or comparable concept) X X X Time in FOC services X FICO score at baseline (for credit analyses) X X
Notes: Individual site indicators were included in the second stage regressions in the analyses where FOC clients were matched
to other FOC clients. State indicators were included in the second stage regressions in the analyses where FOC clients were
compared to SIPP cases.
As noted above, the comparison of FOC treatment cases to SIPP comparison cases (table 1, Column
1) incorporates most of the matching variables that are available in the FOC data. The major omission is
A N A S S E S S M E N T O F L I S C ’ S F I N A N C I A L O P P O R T U N I T Y C E N T E R S 2 6
the FICO score, which is not available in the SIPP, and the time in FOC services, which does not have a
comparable concept in the SIPP. In addition to a variety of demographic indicators that are available in
both the FOC data and the SIPP data, one of the most important matching variables is household
income, which helps to ensure that treatment and comparison cases have comparable resources at their
disposal and a similar basic need for FOC services. Matching on geographic variables is important for
guaranteeing that matched cases are facing similar labor market conditions and public policies. Ideally,
each case would be matched on a state or even a site-level geographic indicator. However, small sample
sizes for some sites and states introduced collinearity and caused convergence problems for the model.
As an alternative, an indicator for whether the client’s site was in Illinois was used as a matching
variable for both the SIPP comparison and the comparison of FOC clients to other FOC clients. As noted
in both note 28 above and the note to table 1, individual site indicators were added to the second stage
regression estimation of the treatment effect, despite the fact that they could not be used as matching
variables.
Unlike the SIPP comparison group and the comparison to other FOC clients, few of the matching
variables are available in the credit bureau database. Only age, ZIP code (which is used to determine
whether a credit bureau comparison case is in the same neighborhood as an FOC site) and baseline
FICO scores are available for matching variables for the credit bureau comparison. To establish the best
match given this limited information, we include a number of interactions and higher order polynomials
of age and baseline FICO score to obtain a stronger match on the joint distribution of those variables.
Outcomes are measured in FOC program data at the last service date, and therefore are not
measured at a consistent time for all clients. To ensure that outcomes are measured at comparable
intervals for the treatment and comparison cases, time in FOC services31
is included as a matching
variable. Time in FOC services is obviously not a variable that exists in either the SIPP or the credit
bureau datasets. Nevertheless, outcomes in these longitudinal datasets must be measured at a point of
time that is comparable to the point in time that it is measured for the matched FOC treatment cases.
The process for selecting the point at which SIPP and credit bureau outcomes are measured is discussed
in more detail in the next section (“Selection of Comparison Groups”), but it involves using the measure
of the outcome variable in the same month as the date of last service for the SIPP or the same twelve-
month interval as the date of last service for the credit bureau dataset.
PSM relies on the assumption that all characteristics relevant to the probability of receiving
treatment are observed and included in the model. If this assumption does not hold true then the
estimated treatment effects may be biased by selection on unobservable characteristics. A critical
choice in any PSM analysis is therefore to select an appropriate comparison group that is quite similar
2 7 A N A S S E S S M E N T O F L I S C ’ S F I N A N C I A L O P P O R T U N I T Y C E N T E R S
to the treatment group on both observable and unobservable characteristics even before the matching
procedure. This analysis uses three different comparison groups, each with its own strengths and
weaknesses. These comparison groups are discussed in the next section.
Selection of Comparison Groups
In PSM analyses the selection of an appropriate data source for the comparison group is critical for
generating valid impact estimates. Heckman, Ichimura, and Todd (1997) and Heckman, Ichimura, Smith
and Todd (1996, 1998) demonstrate that three requirements are essential for ensuring high quality
results in PSM analyses, all of which relate either to the selection of the comparison group or the data
sources available for the comparison group:
First, they require a rich set of matching variables that are related to the probability of
receiving treatment that are available for both the treatment and the comparison group;
Second, they highlight the importance of using comparison cases that are operating in the same
local labor markets as the treatment cases; and
Third, they require that all outcome data be measured with the same data source.32
An important comparison group used in this analysis, which satisfies all three of these conditions, is
the population of other FOC clients not receiving the treatment service under investigation. For
example, to estimate the impact of financial coaching on the probability of employment, clients
receiving both employment and financial coaching are compared to clients receiving only employment
counseling. The outcome differences between these two groups can be attributed to financial coaching,
which the treatment group receives but the comparison group does not. Using FOC clients as
comparison cases is particularly attractive because these individuals have all selected into FOC
services, and therefore should be relatively comparable on a wide variety of unobserved characteristics
as well.
Unfortunately, not all impact estimates of interest can be estimated using other FOC clients as a
comparison group. The FOC program data only collects client outcomes if clients are enrolled in
particular services. For example, information on a client’s employment status and wage rate are only
collected for clients enrolled in employment counseling services. This precludes using FOC clients as
comparison cases to estimate the effect of employment counseling on employment outcomes (or the
A N A S S E S S M E N T O F L I S C ’ S F I N A N C I A L O P P O R T U N I T Y C E N T E R S 2 8
effect of financial coaching on financial outcomes that are only collected for clients receiving financial
coaching). Arguably, these are among the most interesting impacts to estimate.
Instead of using FOC clients as the comparison group, we use data from two other data sources to
provide alternative comparison groups. For the labor market outcomes (employment and wages), we
use cases from the SIPP as an alternative comparison group. The SIPP is a nationally representative
panel dataset that includes monthly information on labor market activities. It includes particularly high
quality data on low income respondents. For credit score outcomes we used individuals in the credit
bureau database as an alternative comparison group. The credit bureau database is a nationally
representative, annual panel of over five million Americans with credit scores. While the SIPP has many
of the same variables as the FOC program data, the credit bureau database has very few variables to
match treatment and comparison cases (only age, prior credit scores, and geographic location
information). This means that low-income people cannot be isolated in the matching process for the
credit bureau analyses. In general, the analysis relies on the assumption that individuals living in the
same low-income neighborhoods with similar ages and FICO scores are likely to have comparable
incomes.
Neither of these alternatives provide as strong of a comparison group as the FOC clients
themselves. In the case of the SIPP, outcomes are not collected via the same data sources and
comparison cases can only be identified as living in the same state as treatment cases, not the same local
labor market. The credit bureau database does have a similar source of outcome data (Vantage credit
scores) and it includes detailed geographic information to ensure that comparison cases are drawn from
the same local labor market, but it does not have a rich collection of matching variables. Nevertheless,
these alternative comparison groups offer additional benchmarks for thinking about the impact of FOC
services, and they provide the only comparison group available to estimate the impact of certain basic
treatments.
Because this analysis only uses outcome data that is measured at the last service date, it is
therefore not measured at a consistent point in time for all FOC clients. In the models using other FOC
clients as the comparison group, this is handled by using time in services as a matching variable. Neither
of the alternative comparison groups receives any services, so time in services cannot be used in the
PSM analyses for the alternative comparison group. However, because both of the alternative
comparison groups come from a longitudinal dataset, the outcomes in these analyses are measured for
the comparison cases at the same point after their start date as their assigned treatment case. As an
example, if an FOC client receives services for eight months, their outcome is measured in the eighth
month after entering FOC services. This treatment case is paired with a specific comparison case in the
2 9 A N A S S E S S M E N T O F L I S C ’ S F I N A N C I A L O P P O R T U N I T Y C E N T E R S
SIPP or credit bureau dataset in the PSM analysis. Although the longitudinal nature of the comparison
case dataset allows us to measure outcomes at a number of points, we select the comparison case
outcomes that are measured at approximately the same time as the treatment case outcomes.
This comparison case identification process is summarized in table 2, below, which presents two
fictitious FOC client cases and two fictitious SIPP client cases. Employment and wage measurements for
FOC clients are only collected irregularly and only used at baseline and as an outcome, measured at the
date of the last service (identified as B, and O, respectively, in table 2). Employment and wages are
measured monthly in the SIPP so a single unique individual in the SIPP can be matched to many
different FOC clients with different baseline and outcome dates. The month used as the baseline month
for a SIPP case is determined by the month that offers the strongest match in the PSM analysis
(highlighted in yellow in table 2). After this matching process, the SIPP comparison case outcome date is
identified by selecting the same month as the matched FOC client outcome date (highlighted in orange).
In the example presented in table 2 a number of employment and wage measurements are available for
the fictitious cases SIPP-1 and SIPP-2. However, SIPP-1 is matched to FOC-1 and only the 10/2012
measure is used as the SIPP-1 baseline date and only the 2/2013 measure is used as the SIPP-1
outcome date. Similarly, case SIPP-2 is matched to FOC-2 and only the 12/2012 measure for SIPP-2 is
used as the baseline measure, and only the 5/2013 measure is used as the outcome measure. This
procedure ensures that only the most appropriate SIPP dates are used in the estimation of the
treatment effect.
TABLE 2
SIPP Baseline and Outcome date selection
10/2012 11/2012 12/2012 1/2013 2/2013 3/2013 4/2013 5/2013
FOC-1 B O FOC-2 B O SIPP-1 X X X X X X X X SIPP-2 X X X X X X X X
Note: B = Baseline date for FOC client; O = Outcome date for FOC client; X = Data available in SIPP; Yellow highlight = Baseline
date for SIPP case; Outcome date selected for SIPP case after match.
Unlike the SIPP, the credit bureau database is only an annual panel. To ensure that FICO score
outcomes are measured at approximately the same time for treatment and comparison cases, we
restrict the treatment sample in these analyses to FOC clients that receive services for either
approximately one year (between eight and sixteen months) or approximately two years (between
twenty and twenty-eight months).
A N A S S E S S M E N T O F L I S C ’ S F I N A N C I A L O P P O R T U N I T Y C E N T E R S 3 0
Sample Selection
In addition to the identification of an appropriate comparison group, other analytic decisions are made
that further refine both the treatment and comparison groups. A large number of cases in the FOC
program data (and some cases in the SIPP and credit bureau data) have missing information on
matching and outcome variables. Normally we may be interested in imputing these missing values, but
in this case missing information is highly correlated (i.e., if one variable is missing most matching
variables are missing) and in most cases basic demographic data that would be used in an imputation is
missing. These factors make imputation (and non-response analysis) infeasible. Cases with missing
information are therefore excluded from the analysis. This means that the treatment effects reported
below are only relevant to clients that do not have missing information in the program data. Insofar as
these are not representative of all FOC clients, the treatment effect estimates cannot be generalized to
those clients.
We also exclude cases who receive a month or less of FOC services. This choice is made because we
are unable to estimate the PSM model if clients only receive services for a month or less. Service dates
associated with outcome measures are only measured in monthly intervals (e.g., “January, 2013” rather
than “January 12th
, 2013”) in order to protect client confidentiality, so we are unable to determine
whether a client receiving their first service on the first day of a month and their last service on the
thirty-first day of the same month only attended one day of FOC services or several weeks of services.
Without knowing the day a client received services we cannot differentiate outcomes from baseline
characteristics for these clients. When clients receive more than a month of FOC services, we can
differentiate between outcome and baseline measures and conduct the PSM analysis.
As additional sample restrictions are imposed (for example, having a negative net income at
baseline, or having a job at baseline) some of the treatment and comparison sample sizes get quite small.
This limits our ability to make inferences from the sample, both because the estimate of the treatment
effect is less precise and because the relatively narrow sample might not generalize to a broader
population. A few models could not be estimated because the sample size was sufficiently small. The
imprecision of the estimates should be reflected in the estimated standard errors, and therefore the
statistical significance of the treatment effect. Nevertheless, the reader should interpret estimates
based on small samples with caution. There is no clear boundary for an acceptable sample size and the
total sample size in a PSM analysis is of course the sum of the treatment and comparison samples rather
than the sample size of either the treatment or the comparison group. Nevertheless, a conservative
approach would be to disregard instances where either the treatment or the comparison group has less
than fifty cases. These instances are noted in the text.
3 1 A N A S S E S S M E N T O F L I S C ’ S F I N A N C I A L O P P O R T U N I T Y C E N T E R S
Interpretation of Impact Estimates
The interpretation of the impact estimates presented in this section depends on the comparison group
that is being used in any particular analysis. Estimates of the total effect of FOC services are only
provided in the PSM analyses where FOC clients are compared to SIPP cases (for employment or wage
outcomes) or credit bureau cases (for credit outcomes). These comparison groups receive no FOC
services and therefore provide an estimate of the full impact of the program. Generally, these impacts
are positive for the comparison to SIPP cases, suggesting that FOC services are associated with
improved employment and wage outcomes for clients. However, they are not significant for the
analyses of credit outcomes using the credit bureau comparison group.
Many of the analyses in this section are instead derived from a comparison of two groups of FOC
clients with different mixes of FOC services. These impact estimates show the effects of providing
additional services to existing FOC clients. A negative treatment effect estimated in the models that use
FOC clients as a comparison group therefore does not imply that FOC services as a whole hurt clients.
This is because the treatment contrast between the treatment and comparison group (that is, the
services the treatment group receives minus the services the comparison group receives) does not
encompass all FOC services received by the treatment group. A negative – or positive – result in these
analyses only implies a negative or positive incremental change in an outcome relative to an alternative
FOC service mix. These results should therefore be relied on only to think about the consequences of
adjusting the FOC service mix from the current services received by FOC clients, and not to assess the
impact of FOC services as a whole.
Each comparison group has its own strengths and weaknesses, discussed in more detail above.
Keeping these strengths and weaknesses in mind, each analysis should only be used to answer the
specific research question it was designed to answer. The results will be presented in the following
order: Employment and wage outcomes will be reported first. Within these results, the treatment
effects estimated from the comparison to the SIPP data will be reported first, as these results speak to
the total impact of FOC services. Comparisons between FOC clients receiving different types of FOC
services will follow. After the employment and wage outcomes, results will be presented for credit
outcomes. As in the case of the SIPP comparison, the results of the comparison with the credit bureau
data will lead the credit outcome discussion, followed by the comparison of FOC clients to other FOC
clients. These will be followed by the net worth analyses. The net income analyses are discussed briefly,
but the estimated treatment effects are not presented because the comparison groups were poor
matches for the treatment groups.
A N A S S E S S M E N T O F L I S C ’ S F I N A N C I A L O P P O R T U N I T Y C E N T E R S 3 2
Appendix D contains the results of balancing tests conducted to determine the equivalence of the
treatment and comparison groups that were created by the propensity score matching process. All the
group pairs in the analyses reported here were reasonably well balanced after matching, with the
exception of the groups in the net income analysis. Balancing tests indicate that the samples in the net
income treatment effect tables were poorly matched, raising doubts about the validity of the treatment
effects. As a result, these impact estimates are excluded because we consider them to be unreliable.
Employment and Wages
Descriptive Statistics: Employment – Placement into Unsubsidized Jobs
To provide the relevant context for the employment and wage impacts, descriptive statistics on these
outcomes are provided in table 3 for each treatment and comparison group analyzed in this section.
These descriptive statistics are provided for the analysis samples (the relevant samples for the
treatment effects presented subsequently), and therefore exclude cases with missing data or who are
outside of the study period.
Although there are some differences across different program mixes in table 3, the FOC clients all
have relatively comparable employment and wage rate outcomes. Generally speaking, FOC clients
receiving employment and financial coaching have the lowest employment rates and clients receiving
employment and income support counseling have the lowest wage rates. The SIPP comparison sample
has a much lower employment rate (and therefore a lower wage rate) than the FOC clients. Non-
employment is also more persistent for the SIPP comparison cases, as only 5.2 percent without a job at
baseline had a job as an outcome. FOC clients without a job at baseline, in contrast, had much higher
employment rates; these employment rates are comparable to the employment rates of the full sample
since most FOC clients had no job at baseline. This is likely due to the fact that FOC clients are more
likely to be job seekers by definition than SIPP respondents (who are much less likely to have sought out
services like the ones offered by FOCs). These descriptive differences between the samples highlight
the point made earlier that the SIPP is not as strong of a comparison group for FOC clients as other FOC
clients with a different program mix.
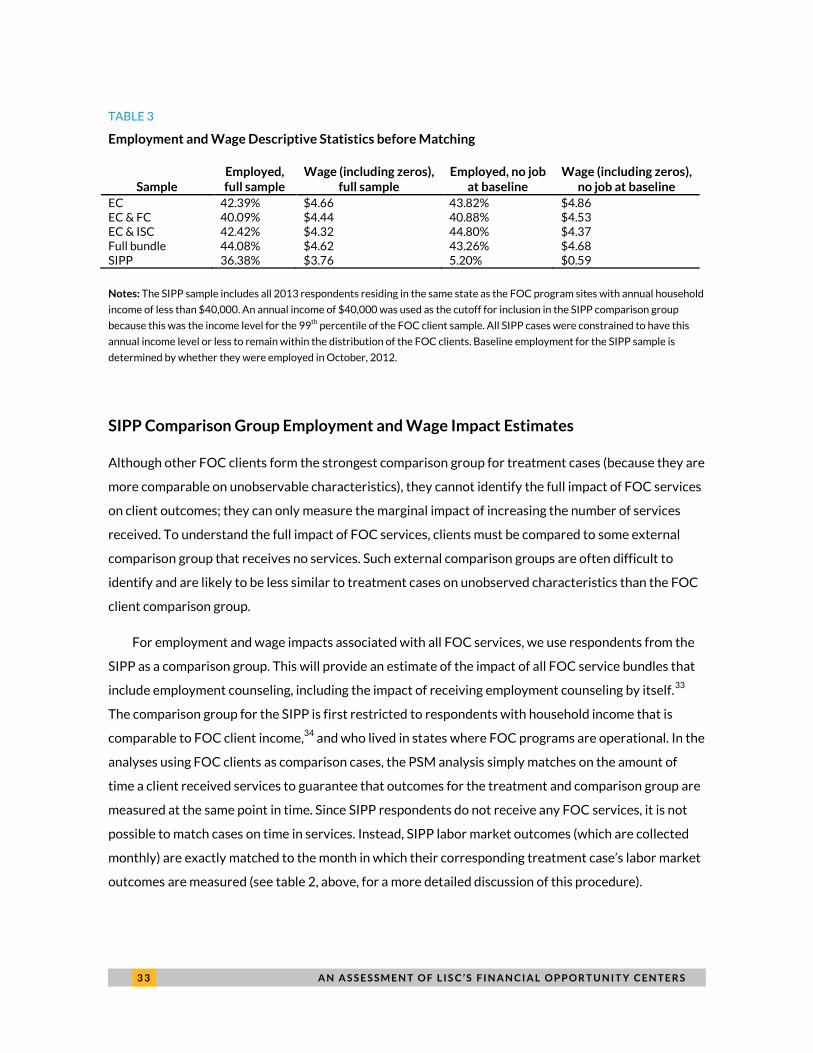
3 3 A N A S S E S S M E N T O F L I S C ’ S F I N A N C I A L O P P O R T U N I T Y C E N T E R S
TABLE 3
Employment and Wage Descriptive Statistics before Matching
Sample Employed, full sample
Wage (including zeros), full sample
Employed, no job at baseline
Wage (including zeros), no job at baseline
EC 42.39% $4.66 43.82% $4.86 EC & FC 40.09% $4.44 40.88% $4.53 EC & ISC 42.42% $4.32 44.80% $4.37 Full bundle 44.08% $4.62 43.26% $4.68 SIPP 36.38% $3.76 5.20% $0.59
Notes: The SIPP sample includes all 2013 respondents residing in the same state as the FOC program sites with annual household
income of less than $40,000. An annual income of $40,000 was used as the cutoff for inclusion in the SIPP comparison group
because this was the income level for the 99th percentile of the FOC client sample. All SIPP cases were constrained to have this
annual income level or less to remain within the distribution of the FOC clients. Baseline employment for the SIPP sample is
determined by whether they were employed in October, 2012.
SIPP Comparison Group Employment and Wage Impact Estimates
Although other FOC clients form the strongest comparison group for treatment cases (because they are
more comparable on unobservable characteristics), they cannot identify the full impact of FOC services
on client outcomes; they can only measure the marginal impact of increasing the number of services
received. To understand the full impact of FOC services, clients must be compared to some external
comparison group that receives no services. Such external comparison groups are often difficult to
identify and are likely to be less similar to treatment cases on unobserved characteristics than the FOC
client comparison group.
For employment and wage impacts associated with all FOC services, we use respondents from the
SIPP as a comparison group. This will provide an estimate of the impact of all FOC service bundles that
include employment counseling, including the impact of receiving employment counseling by itself.33
The comparison group for the SIPP is first restricted to respondents with household income that is
comparable to FOC client income,34
and who lived in states where FOC programs are operational. In the
analyses using FOC clients as comparison cases, the PSM analysis simply matches on the amount of
time a client received services to guarantee that outcomes for the treatment and comparison group are
measured at the same point in time. Since SIPP respondents do not receive any FOC services, it is not
possible to match cases on time in services. Instead, SIPP labor market outcomes (which are collected
monthly) are exactly matched to the month in which their corresponding treatment case’s labor market
outcomes are measured (see table 2, above, for a more detailed discussion of this procedure).
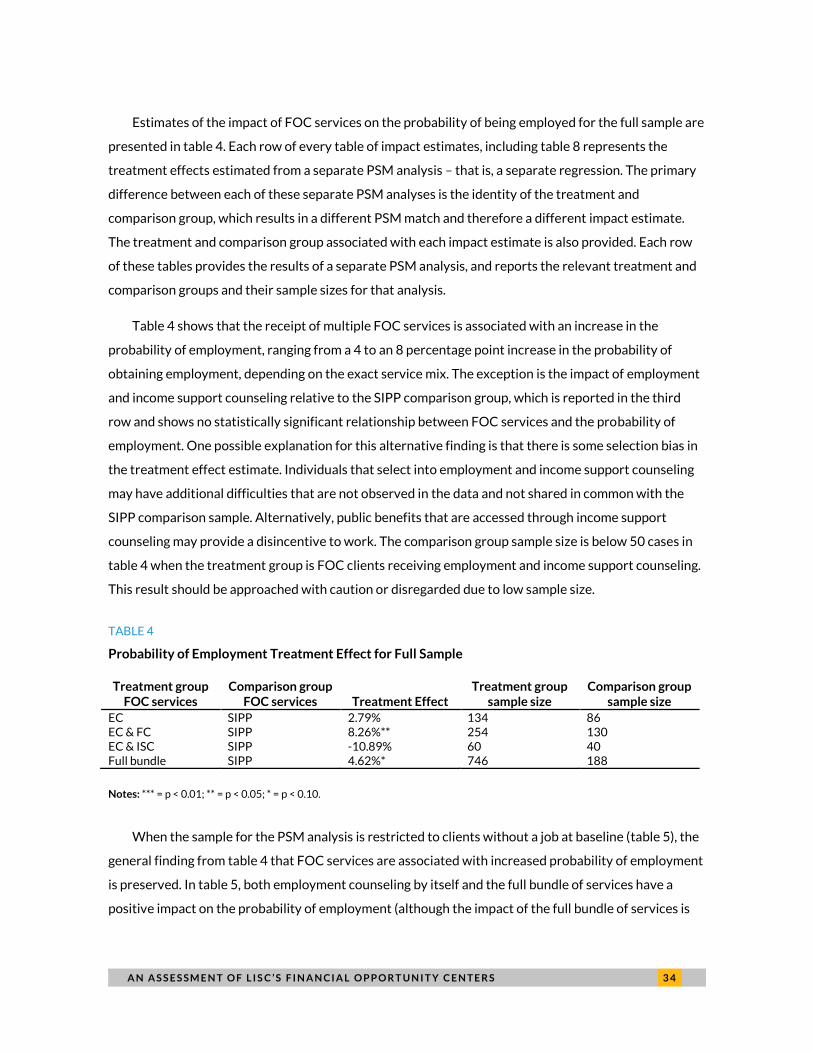
A N A S S E S S M E N T O F L I S C ’ S F I N A N C I A L O P P O R T U N I T Y C E N T E R S 3 4
Estimates of the impact of FOC services on the probability of being employed for the full sample are
presented in table 4. Each row of every table of impact estimates, including table 8 represents the
treatment effects estimated from a separate PSM analysis – that is, a separate regression. The primary
difference between each of these separate PSM analyses is the identity of the treatment and
comparison group, which results in a different PSM match and therefore a different impact estimate.
The treatment and comparison group associated with each impact estimate is also provided. Each row
of these tables provides the results of a separate PSM analysis, and reports the relevant treatment and
comparison groups and their sample sizes for that analysis.
Table 4 shows that the receipt of multiple FOC services is associated with an increase in the
probability of employment, ranging from a 4 to an 8 percentage point increase in the probability of
obtaining employment, depending on the exact service mix. The exception is the impact of employment
and income support counseling relative to the SIPP comparison group, which is reported in the third
row and shows no statistically significant relationship between FOC services and the probability of
employment. One possible explanation for this alternative finding is that there is some selection bias in
the treatment effect estimate. Individuals that select into employment and income support counseling
may have additional difficulties that are not observed in the data and not shared in common with the
SIPP comparison sample. Alternatively, public benefits that are accessed through income support
counseling may provide a disincentive to work. The comparison group sample size is below 50 cases in
table 4 when the treatment group is FOC clients receiving employment and income support counseling.
This result should be approached with caution or disregarded due to low sample size.
TABLE 4
Probability of Employment Treatment Effect for Full Sample
Treatment group FOC services
Comparison group FOC services Treatment Effect
Treatment group sample size
Comparison group sample size
EC SIPP 2.79% 134 86 EC & FC SIPP 8.26%** 254 130 EC & ISC SIPP -10.89% 60 40 Full bundle SIPP 4.62%* 746 188
Notes: *** = p < 0.01; ** = p < 0.05; * = p < 0.10.
When the sample for the PSM analysis is restricted to clients without a job at baseline (table 5), the
general finding from table 4 that FOC services are associated with increased probability of employment
is preserved. In table 5, both employment counseling by itself and the full bundle of services have a
positive impact on the probability of employment (although the impact of the full bundle of services is
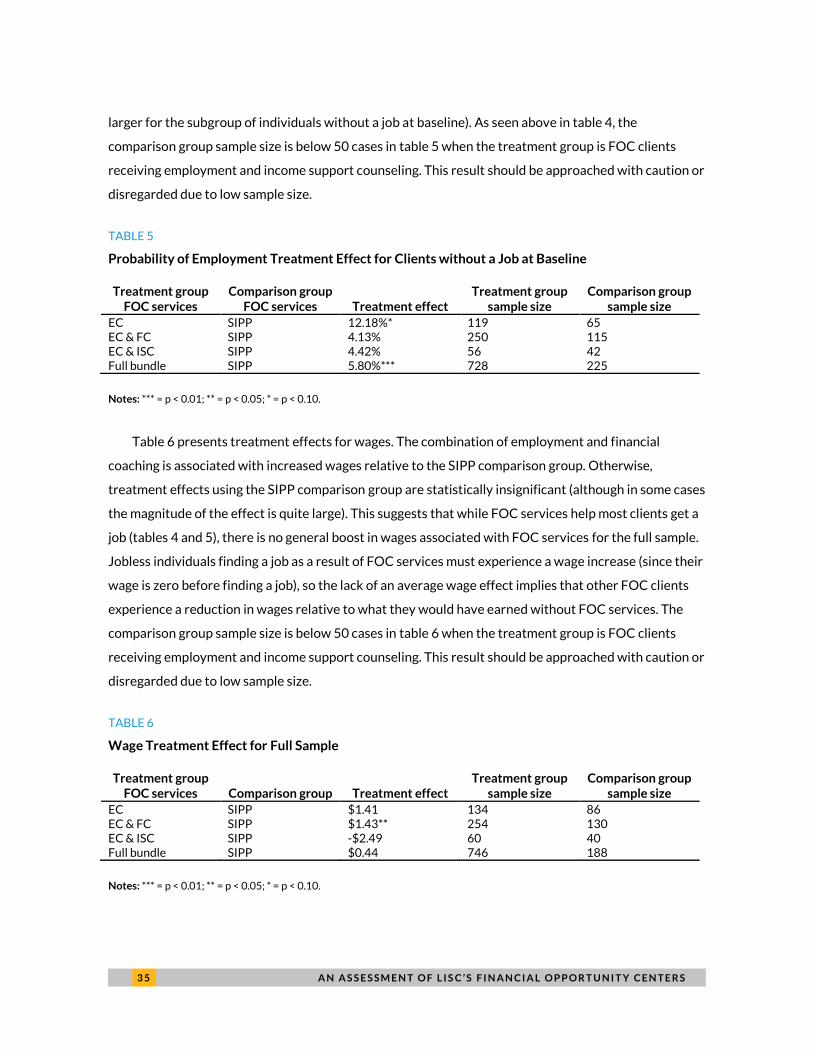
3 5 A N A S S E S S M E N T O F L I S C ’ S F I N A N C I A L O P P O R T U N I T Y C E N T E R S
larger for the subgroup of individuals without a job at baseline). As seen above in table 4, the
comparison group sample size is below 50 cases in table 5 when the treatment group is FOC clients
receiving employment and income support counseling. This result should be approached with caution or
disregarded due to low sample size.
TABLE 5
Probability of Employment Treatment Effect for Clients without a Job at Baseline
Treatment group FOC services
Comparison group FOC services Treatment effect
Treatment group sample size
Comparison group sample size
EC SIPP 12.18%* 119 65 EC & FC SIPP 4.13% 250 115 EC & ISC SIPP 4.42% 56 42 Full bundle SIPP 5.80%*** 728 225
Notes: *** = p < 0.01; ** = p < 0.05; * = p < 0.10.
Table 6 presents treatment effects for wages. The combination of employment and financial
coaching is associated with increased wages relative to the SIPP comparison group. Otherwise,
treatment effects using the SIPP comparison group are statistically insignificant (although in some cases
the magnitude of the effect is quite large). This suggests that while FOC services help most clients get a
job (tables 4 and 5), there is no general boost in wages associated with FOC services for the full sample.
Jobless individuals finding a job as a result of FOC services must experience a wage increase (since their
wage is zero before finding a job), so the lack of an average wage effect implies that other FOC clients
experience a reduction in wages relative to what they would have earned without FOC services. The
comparison group sample size is below 50 cases in table 6 when the treatment group is FOC clients
receiving employment and income support counseling. This result should be approached with caution or
disregarded due to low sample size.
TABLE 6
Wage Treatment Effect for Full Sample
Treatment group FOC services Comparison group Treatment effect
Treatment group sample size
Comparison group sample size
EC SIPP $1.41 134 86 EC & FC SIPP $1.43** 254 130 EC & ISC SIPP -$2.49 60 40 Full bundle SIPP $0.44 746 188
Notes: *** = p < 0.01; ** = p < 0.05; * = p < 0.10.
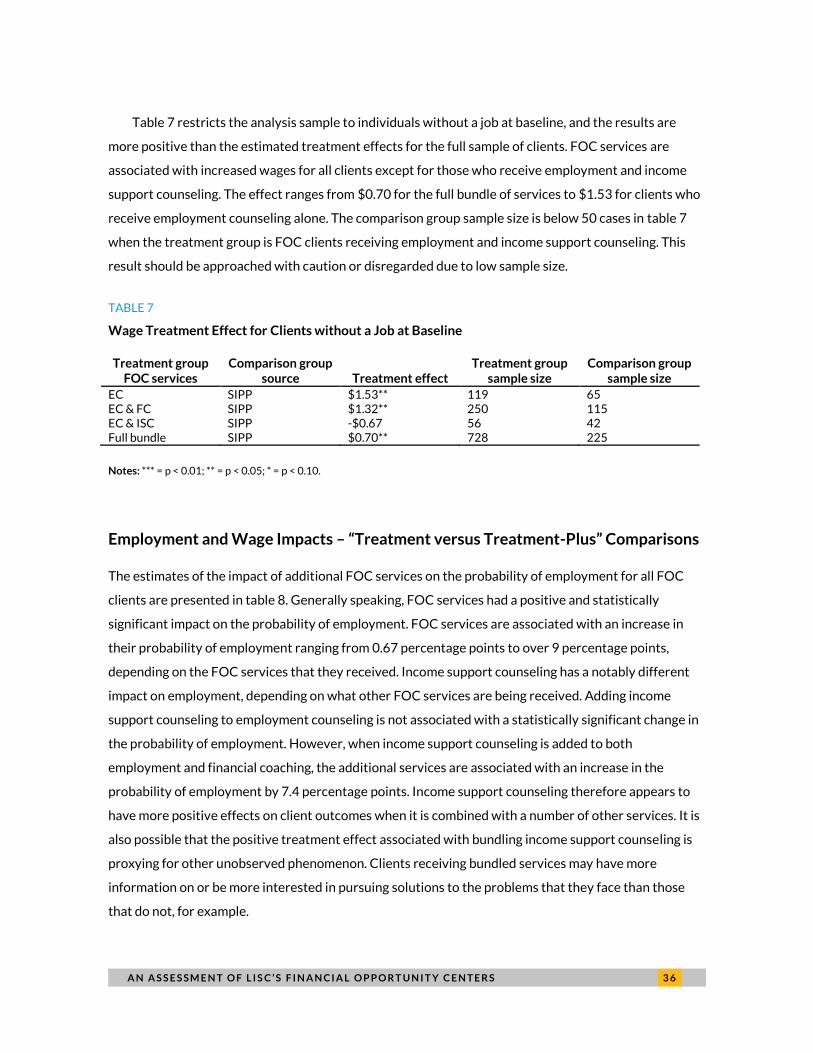
A N A S S E S S M E N T O F L I S C ’ S F I N A N C I A L O P P O R T U N I T Y C E N T E R S 3 6
Table 7 restricts the analysis sample to individuals without a job at baseline, and the results are
more positive than the estimated treatment effects for the full sample of clients. FOC services are
associated with increased wages for all clients except for those who receive employment and income
support counseling. The effect ranges from $0.70 for the full bundle of services to $1.53 for clients who
receive employment counseling alone. The comparison group sample size is below 50 cases in table 7
when the treatment group is FOC clients receiving employment and income support counseling. This
result should be approached with caution or disregarded due to low sample size.
TABLE 7
Wage Treatment Effect for Clients without a Job at Baseline
Treatment group FOC services
Comparison group source Treatment effect
Treatment group sample size
Comparison group sample size
EC SIPP $1.53** 119 65 EC & FC SIPP $1.32** 250 115 EC & ISC SIPP -$0.67 56 42 Full bundle SIPP $0.70** 728 225
Notes: *** = p < 0.01; ** = p < 0.05; * = p < 0.10.
Employment and Wage Impacts – “Treatment versus Treatment-Plus” Comparisons
The estimates of the impact of additional FOC services on the probability of employment for all FOC
clients are presented in table 8. Generally speaking, FOC services had a positive and statistically
significant impact on the probability of employment. FOC services are associated with an increase in
their probability of employment ranging from 0.67 percentage points to over 9 percentage points,
depending on the FOC services that they received. Income support counseling has a notably different
impact on employment, depending on what other FOC services are being received. Adding income
support counseling to employment counseling is not associated with a statistically significant change in
the probability of employment. However, when income support counseling is added to both
employment and financial coaching, the additional services are associated with an increase in the
probability of employment by 7.4 percentage points. Income support counseling therefore appears to
have more positive effects on client outcomes when it is combined with a number of other services. It is
also possible that the positive treatment effect associated with bundling income support counseling is
proxying for other unobserved phenomenon. Clients receiving bundled services may have more
information on or be more interested in pursuing solutions to the problems that they face than those
that do not, for example.
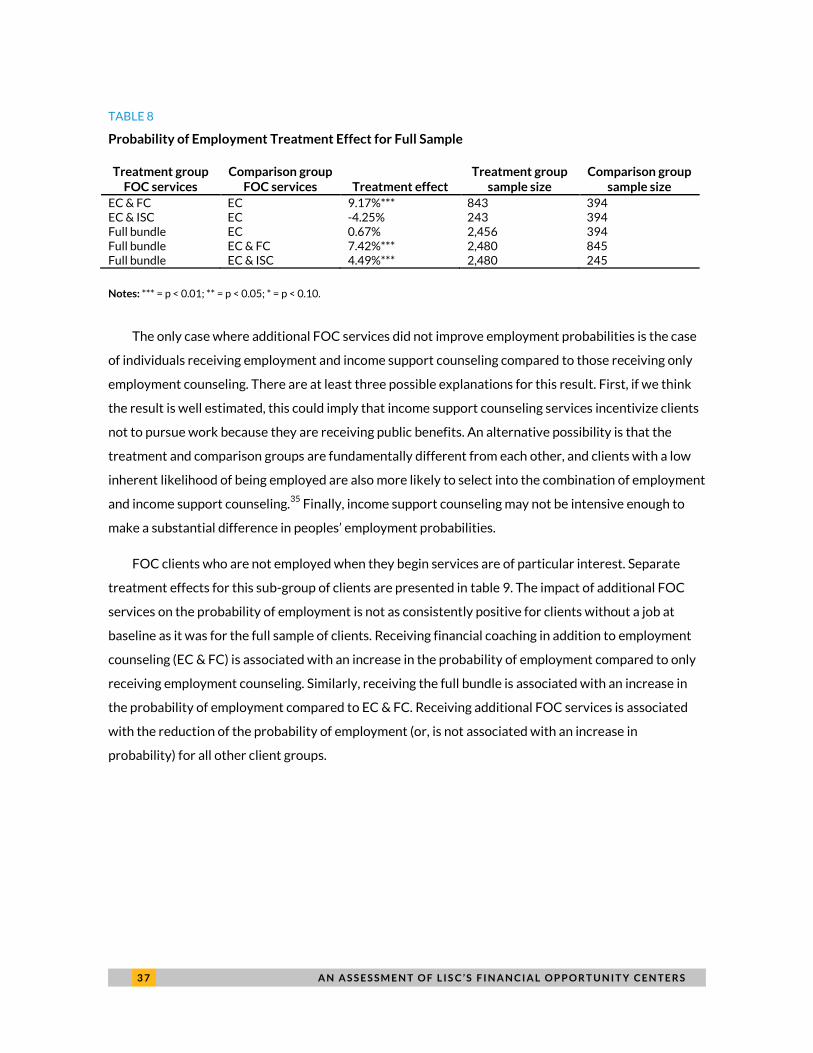
3 7 A N A S S E S S M E N T O F L I S C ’ S F I N A N C I A L O P P O R T U N I T Y C E N T E R S
TABLE 8
Probability of Employment Treatment Effect for Full Sample
Treatment group FOC services
Comparison group FOC services Treatment effect
Treatment group sample size
Comparison group sample size
EC & FC EC 9.17%*** 843 394 EC & ISC EC -4.25% 243 394 Full bundle EC 0.67% 2,456 394 Full bundle EC & FC 7.42%*** 2,480 845 Full bundle EC & ISC 4.49%*** 2,480 245
Notes: *** = p < 0.01; ** = p < 0.05; * = p < 0.10.
The only case where additional FOC services did not improve employment probabilities is the case
of individuals receiving employment and income support counseling compared to those receiving only
employment counseling. There are at least three possible explanations for this result. First, if we think
the result is well estimated, this could imply that income support counseling services incentivize clients
not to pursue work because they are receiving public benefits. An alternative possibility is that the
treatment and comparison groups are fundamentally different from each other, and clients with a low
inherent likelihood of being employed are also more likely to select into the combination of employment
and income support counseling.35
Finally, income support counseling may not be intensive enough to
make a substantial difference in peoples’ employment probabilities.
FOC clients who are not employed when they begin services are of particular interest. Separate
treatment effects for this sub-group of clients are presented in table 9. The impact of additional FOC
services on the probability of employment is not as consistently positive for clients without a job at
baseline as it was for the full sample of clients. Receiving financial coaching in addition to employment
counseling (EC & FC) is associated with an increase in the probability of employment compared to only
receiving employment counseling. Similarly, receiving the full bundle is associated with an increase in
the probability of employment compared to EC & FC. Receiving additional FOC services is associated
with the reduction of the probability of employment (or, is not associated with an increase in
probability) for all other client groups.
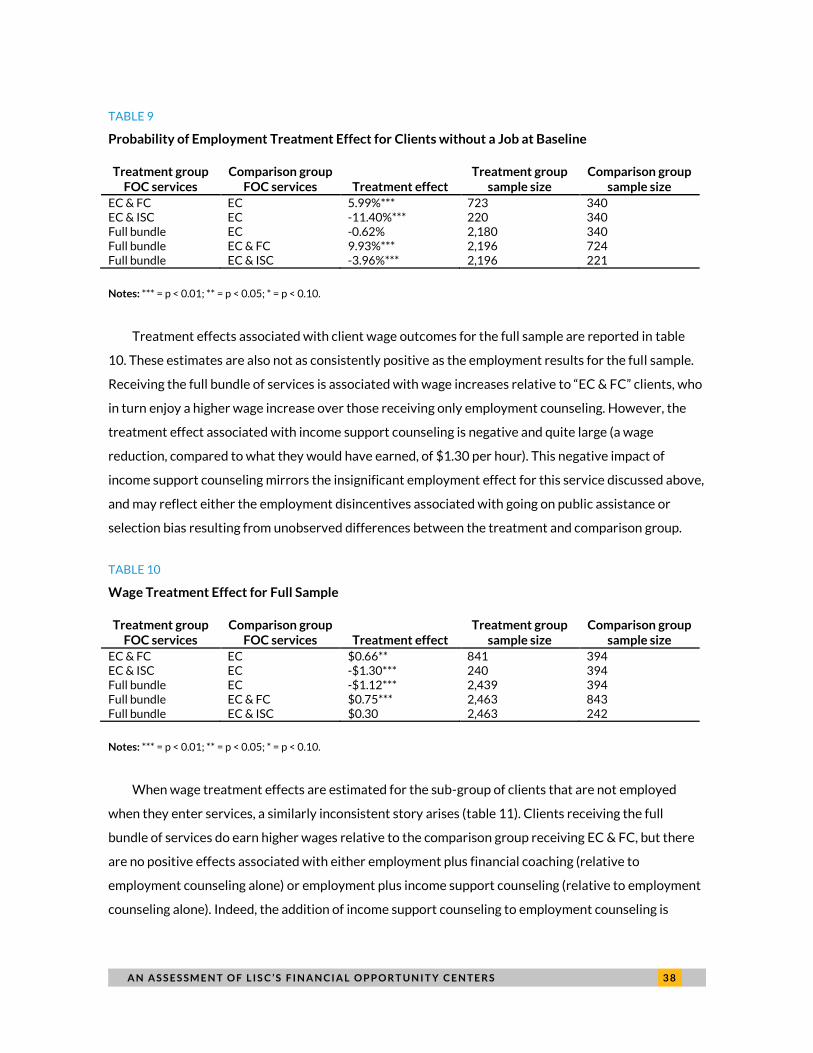
A N A S S E S S M E N T O F L I S C ’ S F I N A N C I A L O P P O R T U N I T Y C E N T E R S 3 8
TABLE 9
Probability of Employment Treatment Effect for Clients without a Job at Baseline
Treatment group FOC services
Comparison group FOC services Treatment effect
Treatment group sample size
Comparison group sample size
EC & FC EC 5.99%*** 723 340 EC & ISC EC -11.40%*** 220 340 Full bundle EC -0.62% 2,180 340 Full bundle EC & FC 9.93%*** 2,196 724 Full bundle EC & ISC -3.96%*** 2,196 221
Notes: *** = p < 0.01; ** = p < 0.05; * = p < 0.10.
Treatment effects associated with client wage outcomes for the full sample are reported in table
10. These estimates are also not as consistently positive as the employment results for the full sample.
Receiving the full bundle of services is associated with wage increases relative to “EC & FC” clients, who
in turn enjoy a higher wage increase over those receiving only employment counseling. However, the
treatment effect associated with income support counseling is negative and quite large (a wage
reduction, compared to what they would have earned, of $1.30 per hour). This negative impact of
income support counseling mirrors the insignificant employment effect for this service discussed above,
and may reflect either the employment disincentives associated with going on public assistance or
selection bias resulting from unobserved differences between the treatment and comparison group.
TABLE 10
Wage Treatment Effect for Full Sample
Treatment group FOC services
Comparison group FOC services Treatment effect
Treatment group sample size
Comparison group sample size
EC & FC EC $0.66** 841 394 EC & ISC EC -$1.30*** 240 394 Full bundle EC -$1.12*** 2,439 394 Full bundle EC & FC $0.75*** 2,463 843 Full bundle EC & ISC $0.30 2,463 242
Notes: *** = p < 0.01; ** = p < 0.05; * = p < 0.10.
When wage treatment effects are estimated for the sub-group of clients that are not employed
when they enter services, a similarly inconsistent story arises (table 11). Clients receiving the full
bundle of services do earn higher wages relative to the comparison group receiving EC & FC, but there
are no positive effects associated with either employment plus financial coaching (relative to
employment counseling alone) or employment plus income support counseling (relative to employment
counseling alone). Indeed, the addition of income support counseling to employment counseling is
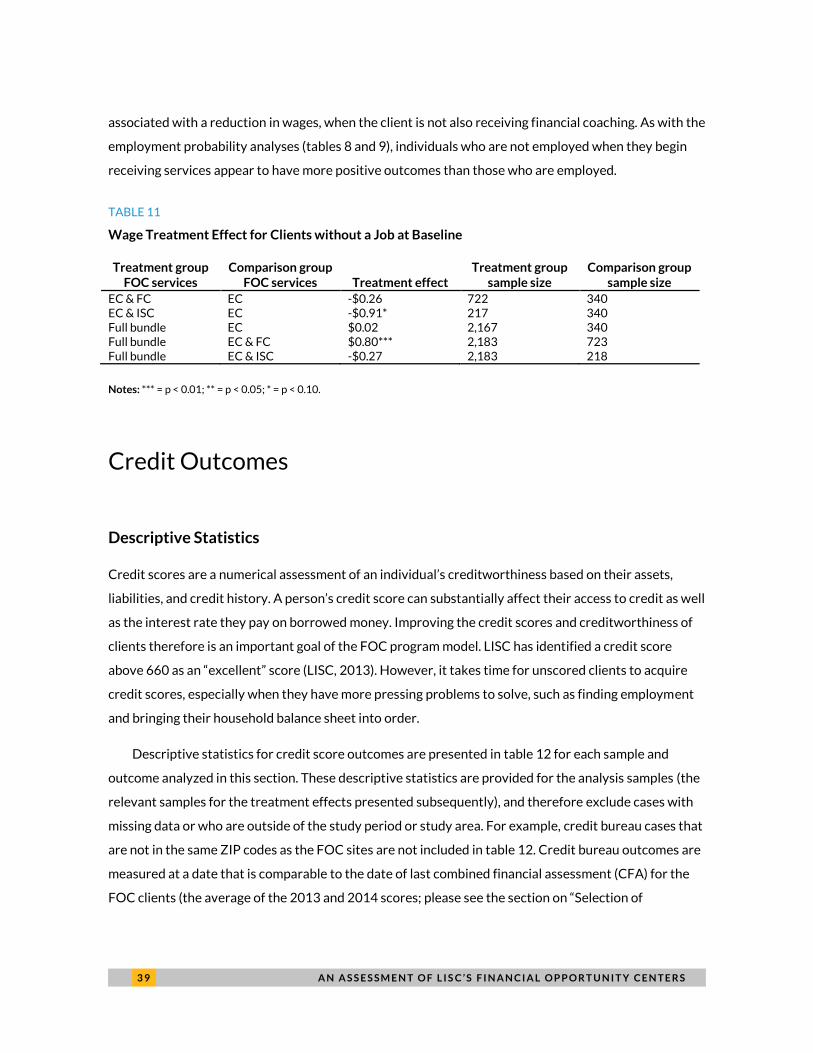
3 9 A N A S S E S S M E N T O F L I S C ’ S F I N A N C I A L O P P O R T U N I T Y C E N T E R S
associated with a reduction in wages, when the client is not also receiving financial coaching. As with the
employment probability analyses (tables 8 and 9), individuals who are not employed when they begin
receiving services appear to have more positive outcomes than those who are employed.
TABLE 11
Wage Treatment Effect for Clients without a Job at Baseline
Treatment group FOC services
Comparison group FOC services Treatment effect
Treatment group sample size
Comparison group sample size
EC & FC EC -$0.26 722 340 EC & ISC EC -$0.91* 217 340 Full bundle EC $0.02 2,167 340 Full bundle EC & FC $0.80*** 2,183 723 Full bundle EC & ISC -$0.27 2,183 218
Notes: *** = p < 0.01; ** = p < 0.05; * = p < 0.10.
Credit Outcomes
Descriptive Statistics
Credit scores are a numerical assessment of an individual’s creditworthiness based on their assets,
liabilities, and credit history. A person’s credit score can substantially affect their access to credit as well
as the interest rate they pay on borrowed money. Improving the credit scores and creditworthiness of
clients therefore is an important goal of the FOC program model. LISC has identified a credit score
above 660 as an “excellent” score (LISC, 2013). However, it takes time for unscored clients to acquire
credit scores, especially when they have more pressing problems to solve, such as finding employment
and bringing their household balance sheet into order.
Descriptive statistics for credit score outcomes are presented in table 12 for each sample and
outcome analyzed in this section. These descriptive statistics are provided for the analysis samples (the
relevant samples for the treatment effects presented subsequently), and therefore exclude cases with
missing data or who are outside of the study period or study area. For example, credit bureau cases that
are not in the same ZIP codes as the FOC sites are not included in table 12. Credit bureau outcomes are
measured at a date that is comparable to the date of last combined financial assessment (CFA) for the
FOC clients (the average of the 2013 and 2014 scores; please see the section on “Selection of
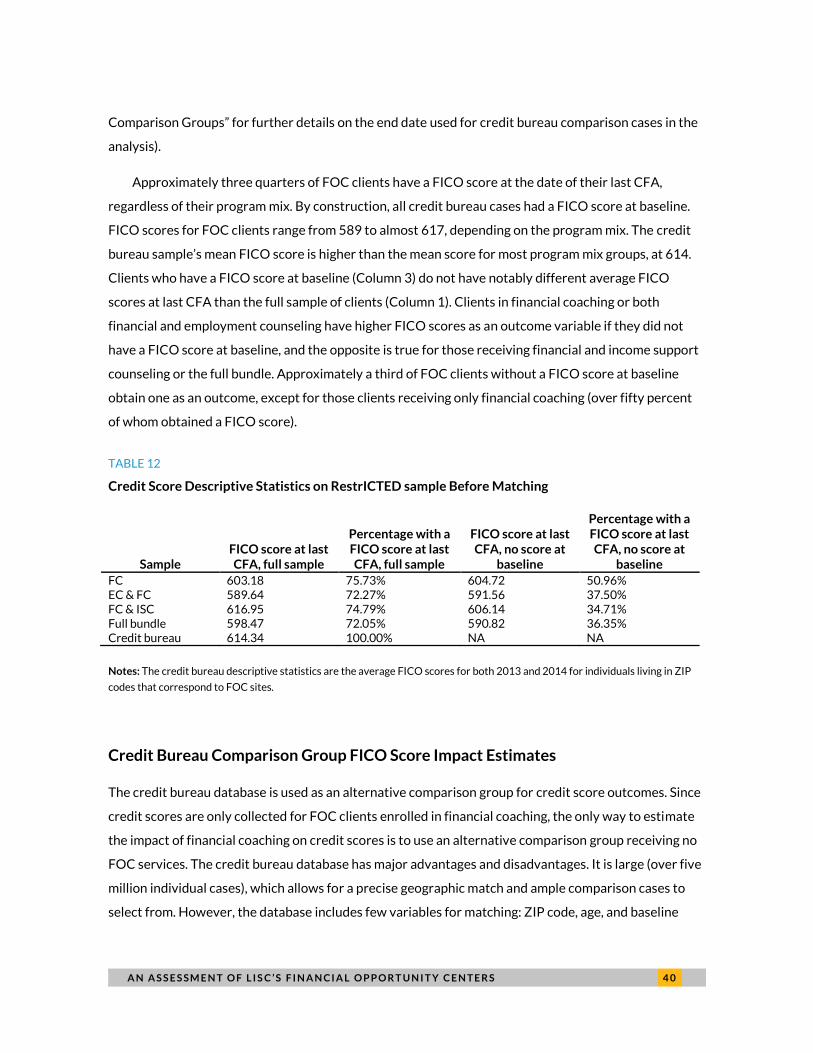
A N A S S E S S M E N T O F L I S C ’ S F I N A N C I A L O P P O R T U N I T Y C E N T E R S 4 0
Comparison Groups” for further details on the end date used for credit bureau comparison cases in the
analysis).
Approximately three quarters of FOC clients have a FICO score at the date of their last CFA,
regardless of their program mix. By construction, all credit bureau cases had a FICO score at baseline.
FICO scores for FOC clients range from 589 to almost 617, depending on the program mix. The credit
bureau sample’s mean FICO score is higher than the mean score for most program mix groups, at 614.
Clients who have a FICO score at baseline (Column 3) do not have notably different average FICO
scores at last CFA than the full sample of clients (Column 1). Clients in financial coaching or both
financial and employment counseling have higher FICO scores as an outcome variable if they did not
have a FICO score at baseline, and the opposite is true for those receiving financial and income support
counseling or the full bundle. Approximately a third of FOC clients without a FICO score at baseline
obtain one as an outcome, except for those clients receiving only financial coaching (over fifty percent
of whom obtained a FICO score).
TABLE 12
Credit Score Descriptive Statistics on RestrICTED sample Before Matching
Sample FICO score at last CFA, full sample
Percentage with a FICO score at last CFA, full sample
FICO score at last CFA, no score at
baseline
Percentage with a FICO score at last CFA, no score at
baseline
FC 603.18 75.73% 604.72 50.96% EC & FC 589.64 72.27% 591.56 37.50% FC & ISC 616.95 74.79% 606.14 34.71% Full bundle 598.47 72.05% 590.82 36.35% Credit bureau 614.34 100.00% NA NA
Notes: The credit bureau descriptive statistics are the average FICO scores for both 2013 and 2014 for individuals living in ZIP
codes that correspond to FOC sites.
Credit Bureau Comparison Group FICO Score Impact Estimates
The credit bureau database is used as an alternative comparison group for credit score outcomes. Since
credit scores are only collected for FOC clients enrolled in financial coaching, the only way to estimate
the impact of financial coaching on credit scores is to use an alternative comparison group receiving no
FOC services. The credit bureau database has major advantages and disadvantages. It is large (over five
million individual cases), which allows for a precise geographic match and ample comparison cases to
select from. However, the database includes few variables for matching: ZIP code, age, and baseline
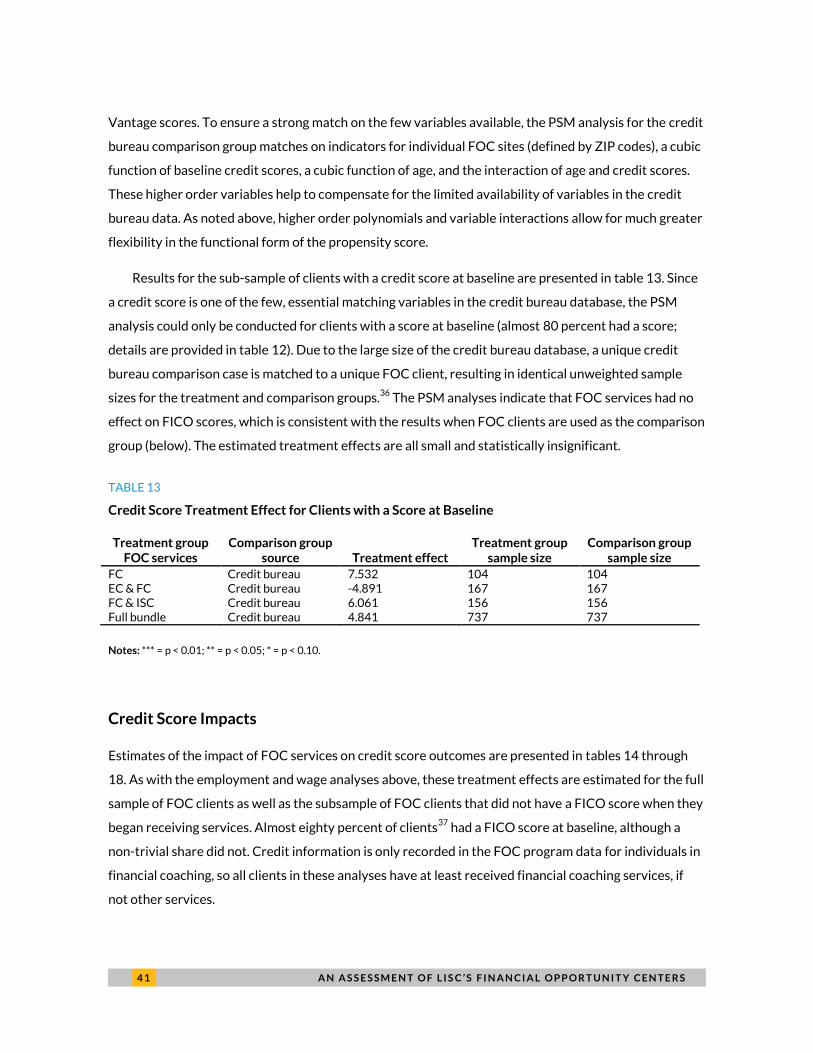
4 1 A N A S S E S S M E N T O F L I S C ’ S F I N A N C I A L O P P O R T U N I T Y C E N T E R S
Vantage scores. To ensure a strong match on the few variables available, the PSM analysis for the credit
bureau comparison group matches on indicators for individual FOC sites (defined by ZIP codes), a cubic
function of baseline credit scores, a cubic function of age, and the interaction of age and credit scores.
These higher order variables help to compensate for the limited availability of variables in the credit
bureau data. As noted above, higher order polynomials and variable interactions allow for much greater
flexibility in the functional form of the propensity score.
Results for the sub-sample of clients with a credit score at baseline are presented in table 13. Since
a credit score is one of the few, essential matching variables in the credit bureau database, the PSM
analysis could only be conducted for clients with a score at baseline (almost 80 percent had a score;
details are provided in table 12). Due to the large size of the credit bureau database, a unique credit
bureau comparison case is matched to a unique FOC client, resulting in identical unweighted sample
sizes for the treatment and comparison groups.36
The PSM analyses indicate that FOC services had no
effect on FICO scores, which is consistent with the results when FOC clients are used as the comparison
group (below). The estimated treatment effects are all small and statistically insignificant.
TABLE 13
Credit Score Treatment Effect for Clients with a Score at Baseline
Treatment group FOC services
Comparison group source Treatment effect
Treatment group sample size
Comparison group sample size
FC Credit bureau 7.532 104 104 EC & FC Credit bureau -4.891 167 167 FC & ISC Credit bureau 6.061 156 156 Full bundle Credit bureau 4.841 737 737
Notes: *** = p < 0.01; ** = p < 0.05; * = p < 0.10.
Credit Score Impacts
Estimates of the impact of FOC services on credit score outcomes are presented in tables 14 through
18. As with the employment and wage analyses above, these treatment effects are estimated for the full
sample of FOC clients as well as the subsample of FOC clients that did not have a FICO score when they
began receiving services. Almost eighty percent of clients37
had a FICO score at baseline, although a
non-trivial share did not. Credit information is only recorded in the FOC program data for individuals in
financial coaching, so all clients in these analyses have at least received financial coaching services, if
not other services.
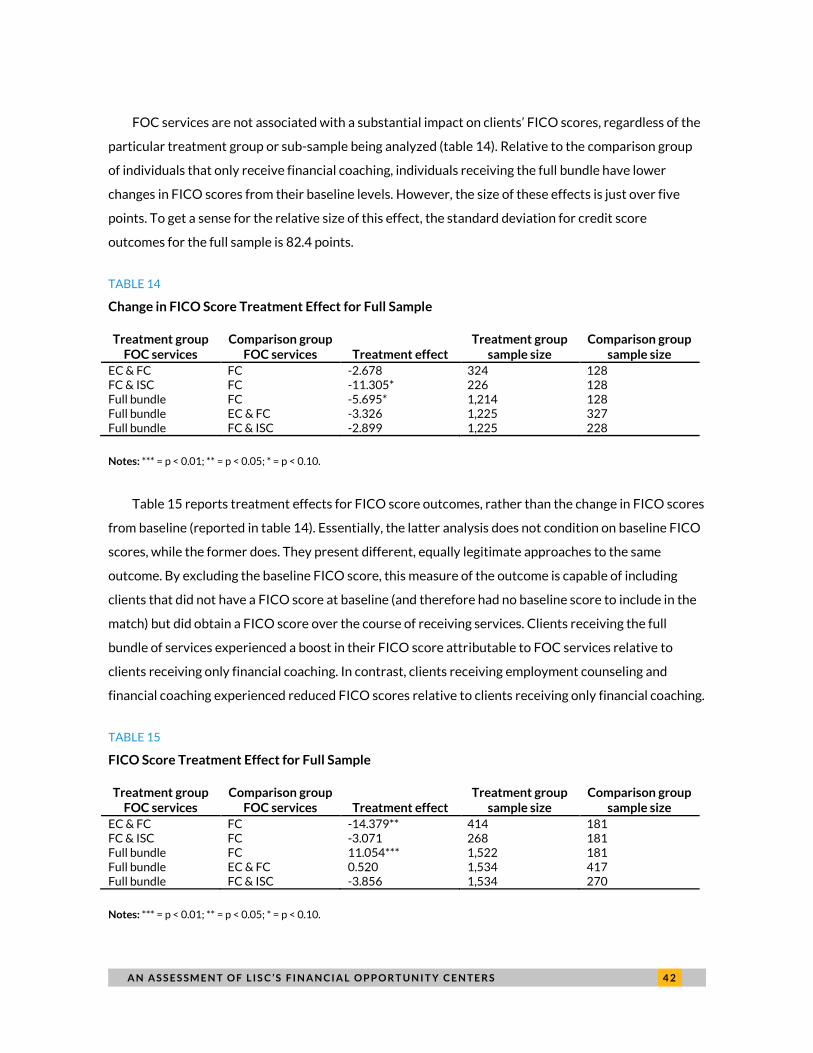
A N A S S E S S M E N T O F L I S C ’ S F I N A N C I A L O P P O R T U N I T Y C E N T E R S 4 2
FOC services are not associated with a substantial impact on clients’ FICO scores, regardless of the
particular treatment group or sub-sample being analyzed (table 14). Relative to the comparison group
of individuals that only receive financial coaching, individuals receiving the full bundle have lower
changes in FICO scores from their baseline levels. However, the size of these effects is just over five
points. To get a sense for the relative size of this effect, the standard deviation for credit score
outcomes for the full sample is 82.4 points.
TABLE 14
Change in FICO Score Treatment Effect for Full Sample
Treatment group FOC services
Comparison group FOC services Treatment effect
Treatment group sample size
Comparison group sample size
EC & FC FC -2.678 324 128 FC & ISC FC -11.305* 226 128 Full bundle FC -5.695* 1,214 128 Full bundle EC & FC -3.326 1,225 327 Full bundle FC & ISC -2.899 1,225 228
Notes: *** = p < 0.01; ** = p < 0.05; * = p < 0.10.
Table 15 reports treatment effects for FICO score outcomes, rather than the change in FICO scores
from baseline (reported in table 14). Essentially, the latter analysis does not condition on baseline FICO
scores, while the former does. They present different, equally legitimate approaches to the same
outcome. By excluding the baseline FICO score, this measure of the outcome is capable of including
clients that did not have a FICO score at baseline (and therefore had no baseline score to include in the
match) but did obtain a FICO score over the course of receiving services. Clients receiving the full
bundle of services experienced a boost in their FICO score attributable to FOC services relative to
clients receiving only financial coaching. In contrast, clients receiving employment counseling and
financial coaching experienced reduced FICO scores relative to clients receiving only financial coaching.
TABLE 15
FICO Score Treatment Effect for Full Sample
Treatment group FOC services
Comparison group FOC services Treatment effect
Treatment group sample size
Comparison group sample size
EC & FC FC -14.379** 414 181 FC & ISC FC -3.071 268 181 Full bundle FC 11.054*** 1,522 181 Full bundle EC & FC 0.520 1,534 417 Full bundle FC & ISC -3.856 1,534 270
Notes: *** = p < 0.01; ** = p < 0.05; * = p < 0.10.
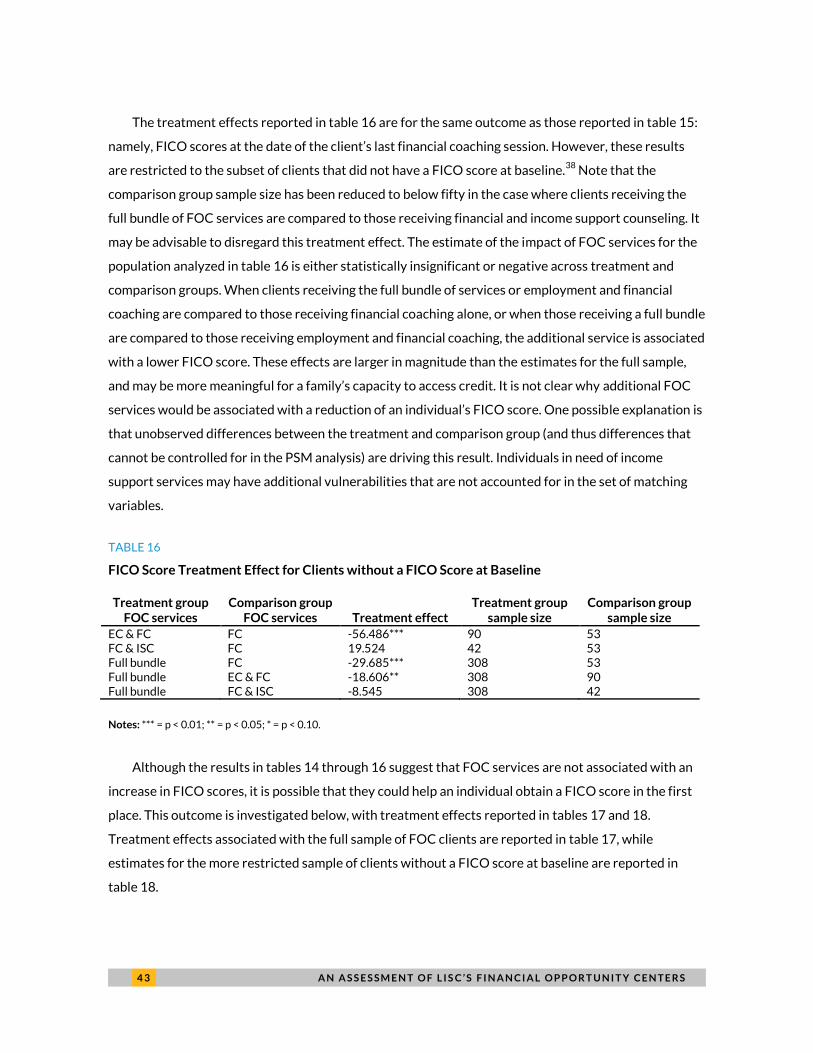
4 3 A N A S S E S S M E N T O F L I S C ’ S F I N A N C I A L O P P O R T U N I T Y C E N T E R S
The treatment effects reported in table 16 are for the same outcome as those reported in table 15:
namely, FICO scores at the date of the client’s last financial coaching session. However, these results
are restricted to the subset of clients that did not have a FICO score at baseline.38
Note that the
comparison group sample size has been reduced to below fifty in the case where clients receiving the
full bundle of FOC services are compared to those receiving financial and income support counseling. It
may be advisable to disregard this treatment effect. The estimate of the impact of FOC services for the
population analyzed in table 16 is either statistically insignificant or negative across treatment and
comparison groups. When clients receiving the full bundle of services or employment and financial
coaching are compared to those receiving financial coaching alone, or when those receiving a full bundle
are compared to those receiving employment and financial coaching, the additional service is associated
with a lower FICO score. These effects are larger in magnitude than the estimates for the full sample,
and may be more meaningful for a family’s capacity to access credit. It is not clear why additional FOC
services would be associated with a reduction of an individual’s FICO score. One possible explanation is
that unobserved differences between the treatment and comparison group (and thus differences that
cannot be controlled for in the PSM analysis) are driving this result. Individuals in need of income
support services may have additional vulnerabilities that are not accounted for in the set of matching
variables.
TABLE 16
FICO Score Treatment Effect for Clients without a FICO Score at Baseline
Treatment group FOC services
Comparison group FOC services Treatment effect
Treatment group sample size
Comparison group sample size
EC & FC FC -56.486*** 90 53 FC & ISC FC 19.524 42 53 Full bundle FC -29.685*** 308 53 Full bundle EC & FC -18.606** 308 90 Full bundle FC & ISC -8.545 308 42
Notes: *** = p < 0.01; ** = p < 0.05; * = p < 0.10.
Although the results in tables 14 through 16 suggest that FOC services are not associated with an
increase in FICO scores, it is possible that they could help an individual obtain a FICO score in the first
place. This outcome is investigated below, with treatment effects reported in tables 17 and 18.
Treatment effects associated with the full sample of FOC clients are reported in table 17, while
estimates for the more restricted sample of clients without a FICO score at baseline are reported in
table 18.
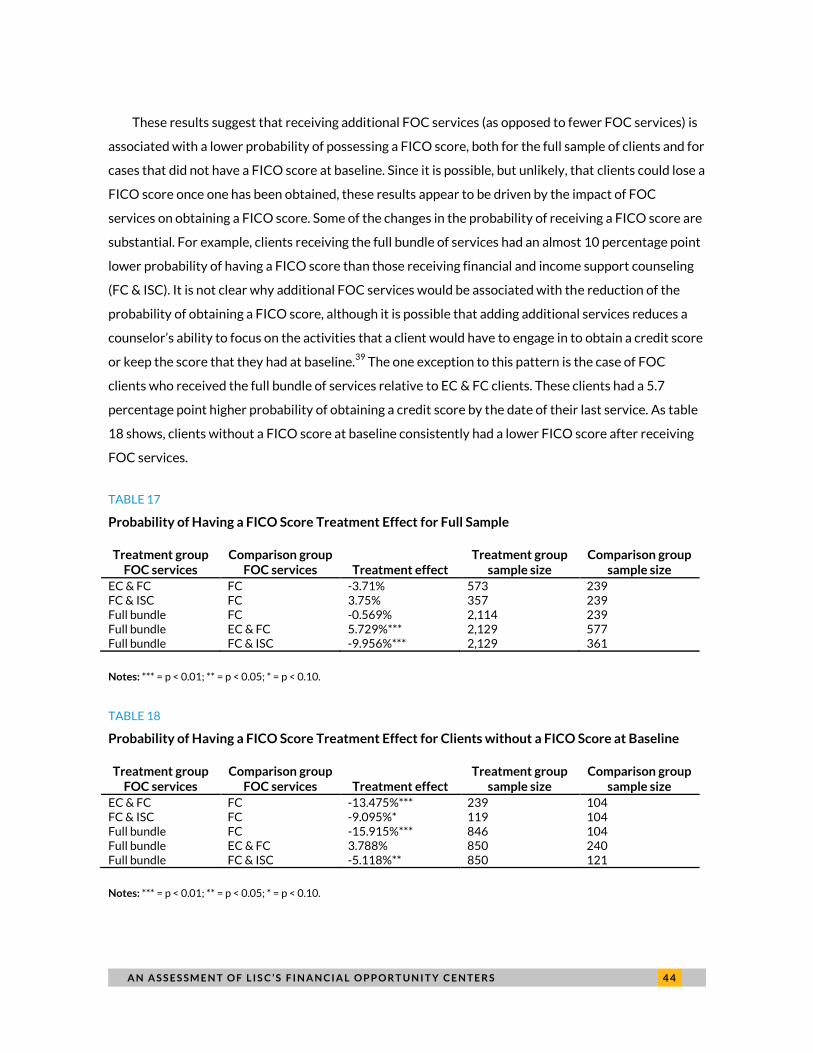
A N A S S E S S M E N T O F L I S C ’ S F I N A N C I A L O P P O R T U N I T Y C E N T E R S 4 4
These results suggest that receiving additional FOC services (as opposed to fewer FOC services) is
associated with a lower probability of possessing a FICO score, both for the full sample of clients and for
cases that did not have a FICO score at baseline. Since it is possible, but unlikely, that clients could lose a
FICO score once one has been obtained, these results appear to be driven by the impact of FOC
services on obtaining a FICO score. Some of the changes in the probability of receiving a FICO score are
substantial. For example, clients receiving the full bundle of services had an almost 10 percentage point
lower probability of having a FICO score than those receiving financial and income support counseling
(FC & ISC). It is not clear why additional FOC services would be associated with the reduction of the
probability of obtaining a FICO score, although it is possible that adding additional services reduces a
counselor’s ability to focus on the activities that a client would have to engage in to obtain a credit score
or keep the score that they had at baseline.39
The one exception to this pattern is the case of FOC
clients who received the full bundle of services relative to EC & FC clients. These clients had a 5.7
percentage point higher probability of obtaining a credit score by the date of their last service. As table
18 shows, clients without a FICO score at baseline consistently had a lower FICO score after receiving
FOC services.
TABLE 17
Probability of Having a FICO Score Treatment Effect for Full Sample
Treatment group FOC services
Comparison group FOC services Treatment effect
Treatment group sample size
Comparison group sample size
EC & FC FC -3.71% 573 239 FC & ISC FC 3.75% 357 239 Full bundle FC -0.569% 2,114 239 Full bundle EC & FC 5.729%*** 2,129 577 Full bundle FC & ISC -9.956%*** 2,129 361
Notes: *** = p < 0.01; ** = p < 0.05; * = p < 0.10.
TABLE 18
Probability of Having a FICO Score Treatment Effect for Clients without a FICO Score at Baseline
Treatment group FOC services
Comparison group FOC services Treatment effect
Treatment group sample size
Comparison group sample size
EC & FC FC -13.475%*** 239 104 FC & ISC FC -9.095%* 119 104 Full bundle FC -15.915%*** 846 104 Full bundle EC & FC 3.788% 850 240 Full bundle FC & ISC -5.118%** 850 121
Notes: *** = p < 0.01; ** = p < 0.05; * = p < 0.10.
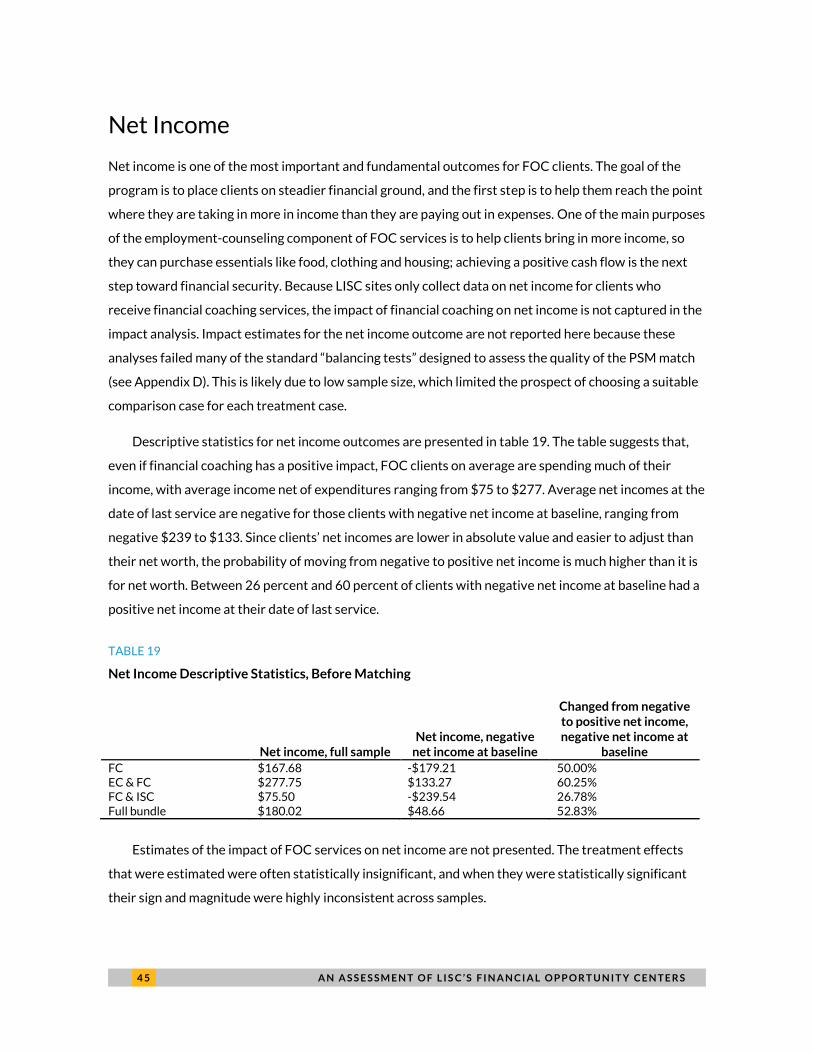
4 5 A N A S S E S S M E N T O F L I S C ’ S F I N A N C I A L O P P O R T U N I T Y C E N T E R S
Net Income
Net income is one of the most important and fundamental outcomes for FOC clients. The goal of the
program is to place clients on steadier financial ground, and the first step is to help them reach the point
where they are taking in more in income than they are paying out in expenses. One of the main purposes
of the employment-counseling component of FOC services is to help clients bring in more income, so
they can purchase essentials like food, clothing and housing; achieving a positive cash flow is the next
step toward financial security. Because LISC sites only collect data on net income for clients who
receive financial coaching services, the impact of financial coaching on net income is not captured in the
impact analysis. Impact estimates for the net income outcome are not reported here because these
analyses failed many of the standard “balancing tests” designed to assess the quality of the PSM match
(see Appendix D). This is likely due to low sample size, which limited the prospect of choosing a suitable
comparison case for each treatment case.
Descriptive statistics for net income outcomes are presented in table 19. The table suggests that,
even if financial coaching has a positive impact, FOC clients on average are spending much of their
income, with average income net of expenditures ranging from $75 to $277. Average net incomes at the
date of last service are negative for those clients with negative net income at baseline, ranging from
negative $239 to $133. Since clients’ net incomes are lower in absolute value and easier to adjust than
their net worth, the probability of moving from negative to positive net income is much higher than it is
for net worth. Between 26 percent and 60 percent of clients with negative net income at baseline had a
positive net income at their date of last service.
TABLE 19
Net Income Descriptive Statistics, Before Matching
Net income, full sample Net income, negative
net income at baseline
Changed from negative to positive net income, negative net income at
baseline
FC $167.68 -$179.21 50.00% EC & FC $277.75 $133.27 60.25% FC & ISC $75.50 -$239.54 26.78% Full bundle $180.02 $48.66 52.83%
Estimates of the impact of FOC services on net income are not presented. The treatment effects
that were estimated were often statistically insignificant, and when they were statistically significant
their sign and magnitude were highly inconsistent across samples.
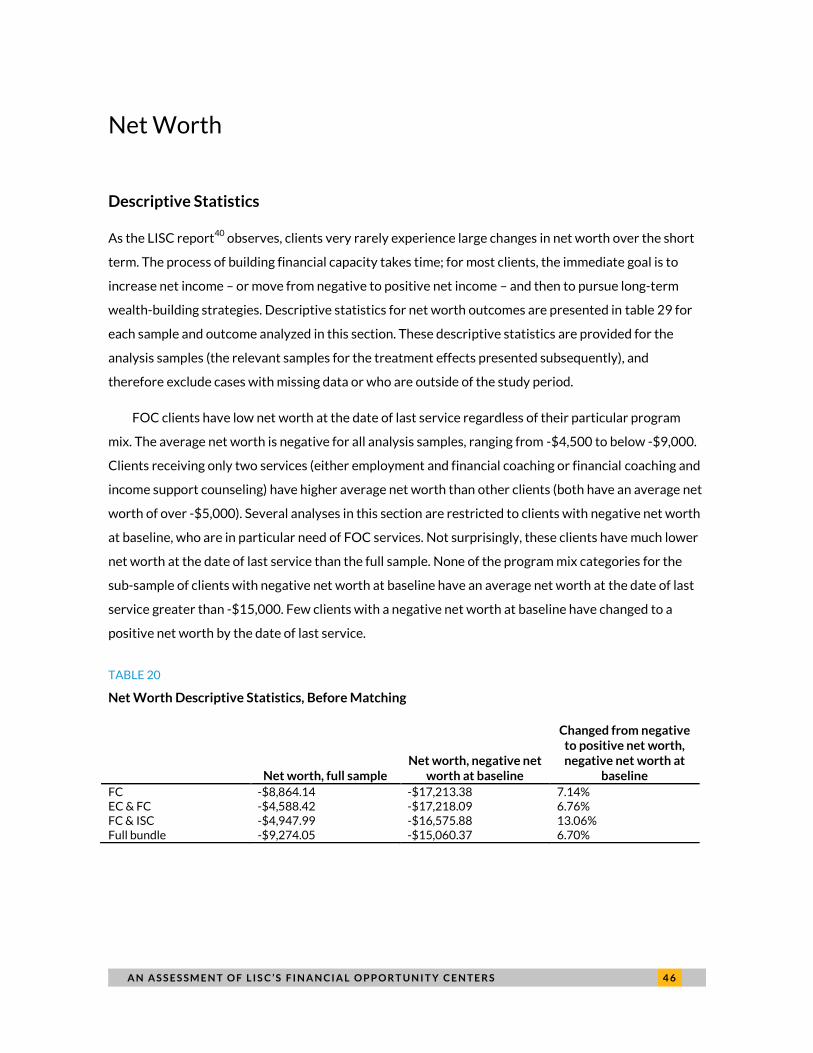
A N A S S E S S M E N T O F L I S C ’ S F I N A N C I A L O P P O R T U N I T Y C E N T E R S 4 6
Net Worth
Descriptive Statistics
As the LISC report40
observes, clients very rarely experience large changes in net worth over the short
term. The process of building financial capacity takes time; for most clients, the immediate goal is to
increase net income – or move from negative to positive net income – and then to pursue long-term
wealth-building strategies. Descriptive statistics for net worth outcomes are presented in table 29 for
each sample and outcome analyzed in this section. These descriptive statistics are provided for the
analysis samples (the relevant samples for the treatment effects presented subsequently), and
therefore exclude cases with missing data or who are outside of the study period.
FOC clients have low net worth at the date of last service regardless of their particular program
mix. The average net worth is negative for all analysis samples, ranging from -$4,500 to below -$9,000.
Clients receiving only two services (either employment and financial coaching or financial coaching and
income support counseling) have higher average net worth than other clients (both have an average net
worth of over -$5,000). Several analyses in this section are restricted to clients with negative net worth
at baseline, who are in particular need of FOC services. Not surprisingly, these clients have much lower
net worth at the date of last service than the full sample. None of the program mix categories for the
sub-sample of clients with negative net worth at baseline have an average net worth at the date of last
service greater than -$15,000. Few clients with a negative net worth at baseline have changed to a
positive net worth by the date of last service.
TABLE 20
Net Worth Descriptive Statistics, Before Matching
Net worth, full sample Net worth, negative net
worth at baseline
Changed from negative to positive net worth, negative net worth at
baseline
FC -$8,864.14 -$17,213.38 7.14% EC & FC -$4,588.42 -$17,218.09 6.76% FC & ISC -$4,947.99 -$16,575.88 13.06% Full bundle -$9,274.05 -$15,060.37 6.70%
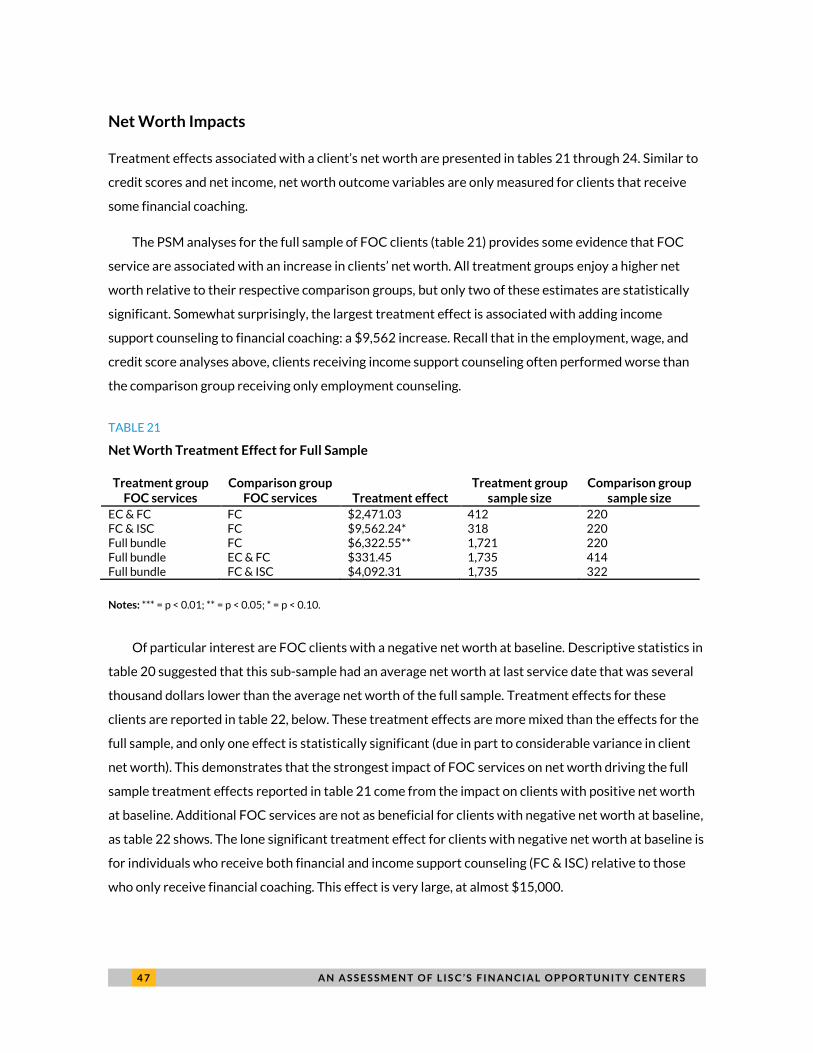
4 7 A N A S S E S S M E N T O F L I S C ’ S F I N A N C I A L O P P O R T U N I T Y C E N T E R S
Net Worth Impacts
Treatment effects associated with a client’s net worth are presented in tables 21 through 24. Similar to
credit scores and net income, net worth outcome variables are only measured for clients that receive
some financial coaching.
The PSM analyses for the full sample of FOC clients (table 21) provides some evidence that FOC
service are associated with an increase in clients’ net worth. All treatment groups enjoy a higher net
worth relative to their respective comparison groups, but only two of these estimates are statistically
significant. Somewhat surprisingly, the largest treatment effect is associated with adding income
support counseling to financial coaching: a $9,562 increase. Recall that in the employment, wage, and
credit score analyses above, clients receiving income support counseling often performed worse than
the comparison group receiving only employment counseling.
TABLE 21
Net Worth Treatment Effect for Full Sample
Treatment group FOC services
Comparison group FOC services Treatment effect
Treatment group sample size
Comparison group sample size
EC & FC FC $2,471.03 412 220 FC & ISC FC $9,562.24* 318 220 Full bundle FC $6,322.55** 1,721 220 Full bundle EC & FC $331.45 1,735 414 Full bundle FC & ISC $4,092.31 1,735 322
Notes: *** = p < 0.01; ** = p < 0.05; * = p < 0.10.
Of particular interest are FOC clients with a negative net worth at baseline. Descriptive statistics in
table 20 suggested that this sub-sample had an average net worth at last service date that was several
thousand dollars lower than the average net worth of the full sample. Treatment effects for these
clients are reported in table 22, below. These treatment effects are more mixed than the effects for the
full sample, and only one effect is statistically significant (due in part to considerable variance in client
net worth). This demonstrates that the strongest impact of FOC services on net worth driving the full
sample treatment effects reported in table 21 come from the impact on clients with positive net worth
at baseline. Additional FOC services are not as beneficial for clients with negative net worth at baseline,
as table 22 shows. The lone significant treatment effect for clients with negative net worth at baseline is
for individuals who receive both financial and income support counseling (FC & ISC) relative to those
who only receive financial coaching. This effect is very large, at almost $15,000.
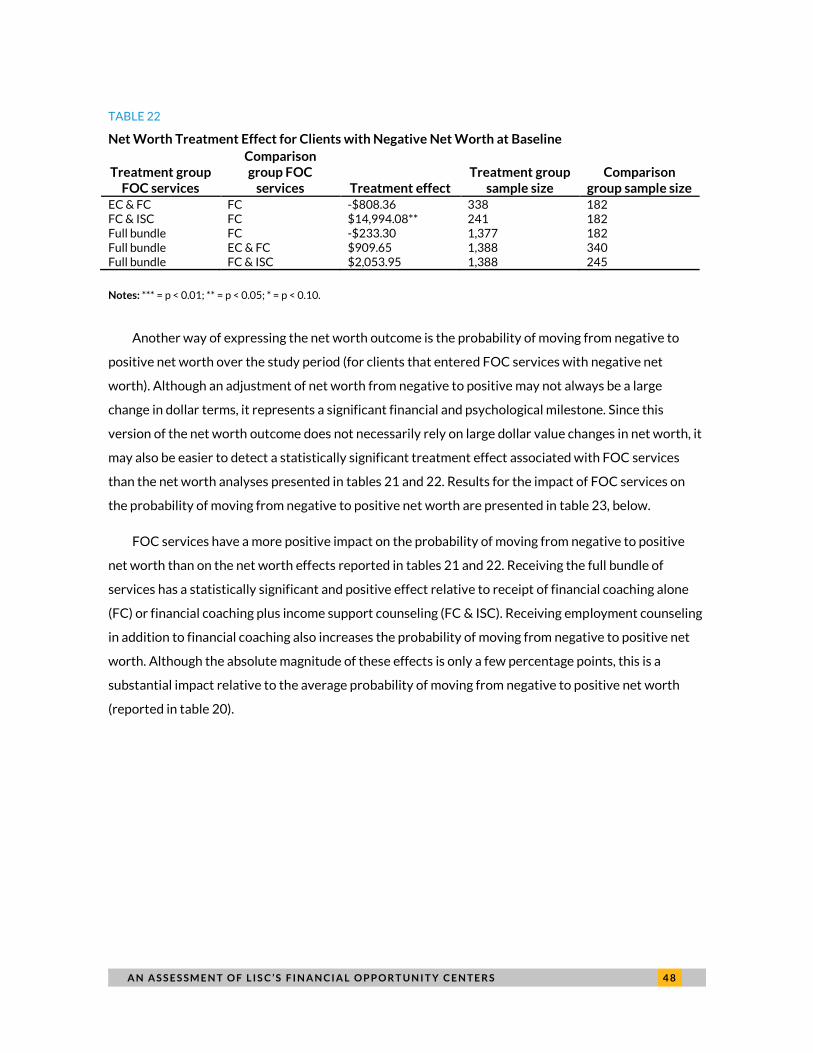
A N A S S E S S M E N T O F L I S C ’ S F I N A N C I A L O P P O R T U N I T Y C E N T E R S 4 8
TABLE 22
Net Worth Treatment Effect for Clients with Negative Net Worth at Baseline
Treatment group FOC services
Comparison group FOC
services Treatment effect Treatment group
sample size Comparison
group sample size EC & FC FC -$808.36 338 182 FC & ISC FC $14,994.08** 241 182 Full bundle FC -$233.30 1,377 182 Full bundle EC & FC $909.65 1,388 340 Full bundle FC & ISC $2,053.95 1,388 245
Notes: *** = p < 0.01; ** = p < 0.05; * = p < 0.10.
Another way of expressing the net worth outcome is the probability of moving from negative to
positive net worth over the study period (for clients that entered FOC services with negative net
worth). Although an adjustment of net worth from negative to positive may not always be a large
change in dollar terms, it represents a significant financial and psychological milestone. Since this
version of the net worth outcome does not necessarily rely on large dollar value changes in net worth, it
may also be easier to detect a statistically significant treatment effect associated with FOC services
than the net worth analyses presented in tables 21 and 22. Results for the impact of FOC services on
the probability of moving from negative to positive net worth are presented in table 23, below.
FOC services have a more positive impact on the probability of moving from negative to positive
net worth than on the net worth effects reported in tables 21 and 22. Receiving the full bundle of
services has a statistically significant and positive effect relative to receipt of financial coaching alone
(FC) or financial coaching plus income support counseling (FC & ISC). Receiving employment counseling
in addition to financial coaching also increases the probability of moving from negative to positive net
worth. Although the absolute magnitude of these effects is only a few percentage points, this is a
substantial impact relative to the average probability of moving from negative to positive net worth
(reported in table 20).
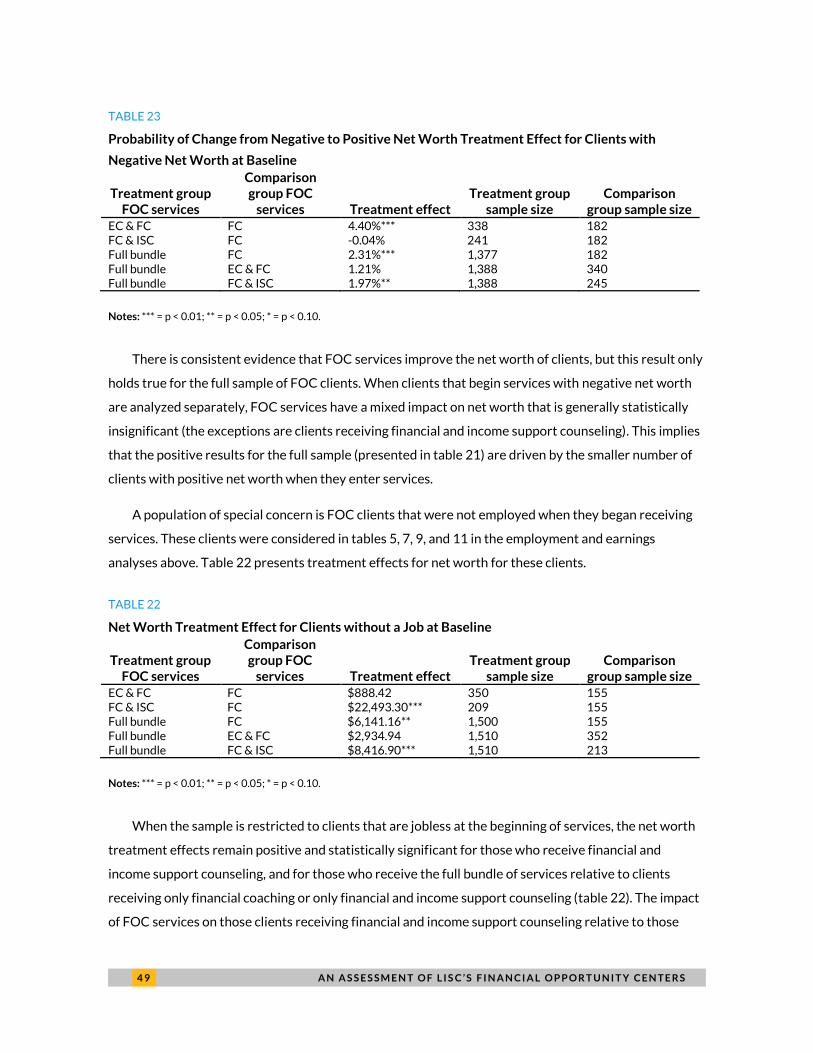
4 9 A N A S S E S S M E N T O F L I S C ’ S F I N A N C I A L O P P O R T U N I T Y C E N T E R S
TABLE 23
Probability of Change from Negative to Positive Net Worth Treatment Effect for Clients with
Negative Net Worth at Baseline
Treatment group FOC services
Comparison group FOC
services Treatment effect Treatment group
sample size Comparison
group sample size EC & FC FC 4.40%*** 338 182 FC & ISC FC -0.04% 241 182 Full bundle FC 2.31%*** 1,377 182 Full bundle EC & FC 1.21% 1,388 340 Full bundle FC & ISC 1.97%** 1,388 245
Notes: *** = p < 0.01; ** = p < 0.05; * = p < 0.10.
There is consistent evidence that FOC services improve the net worth of clients, but this result only
holds true for the full sample of FOC clients. When clients that begin services with negative net worth
are analyzed separately, FOC services have a mixed impact on net worth that is generally statistically
insignificant (the exceptions are clients receiving financial and income support counseling). This implies
that the positive results for the full sample (presented in table 21) are driven by the smaller number of
clients with positive net worth when they enter services.
A population of special concern is FOC clients that were not employed when they began receiving
services. These clients were considered in tables 5, 7, 9, and 11 in the employment and earnings
analyses above. Table 22 presents treatment effects for net worth for these clients.
TABLE 22
Net Worth Treatment Effect for Clients without a Job at Baseline
Treatment group FOC services
Comparison group FOC
services Treatment effect Treatment group
sample size Comparison
group sample size EC & FC FC $888.42 350 155 FC & ISC FC $22,493.30*** 209 155 Full bundle FC $6,141.16** 1,500 155 Full bundle EC & FC $2,934.94 1,510 352 Full bundle FC & ISC $8,416.90*** 1,510 213
Notes: *** = p < 0.01; ** = p < 0.05; * = p < 0.10.
When the sample is restricted to clients that are jobless at the beginning of services, the net worth
treatment effects remain positive and statistically significant for those who receive financial and
income support counseling, and for those who receive the full bundle of services relative to clients
receiving only financial coaching or only financial and income support counseling (table 22). The impact
of FOC services on those clients receiving financial and income support counseling relative to those
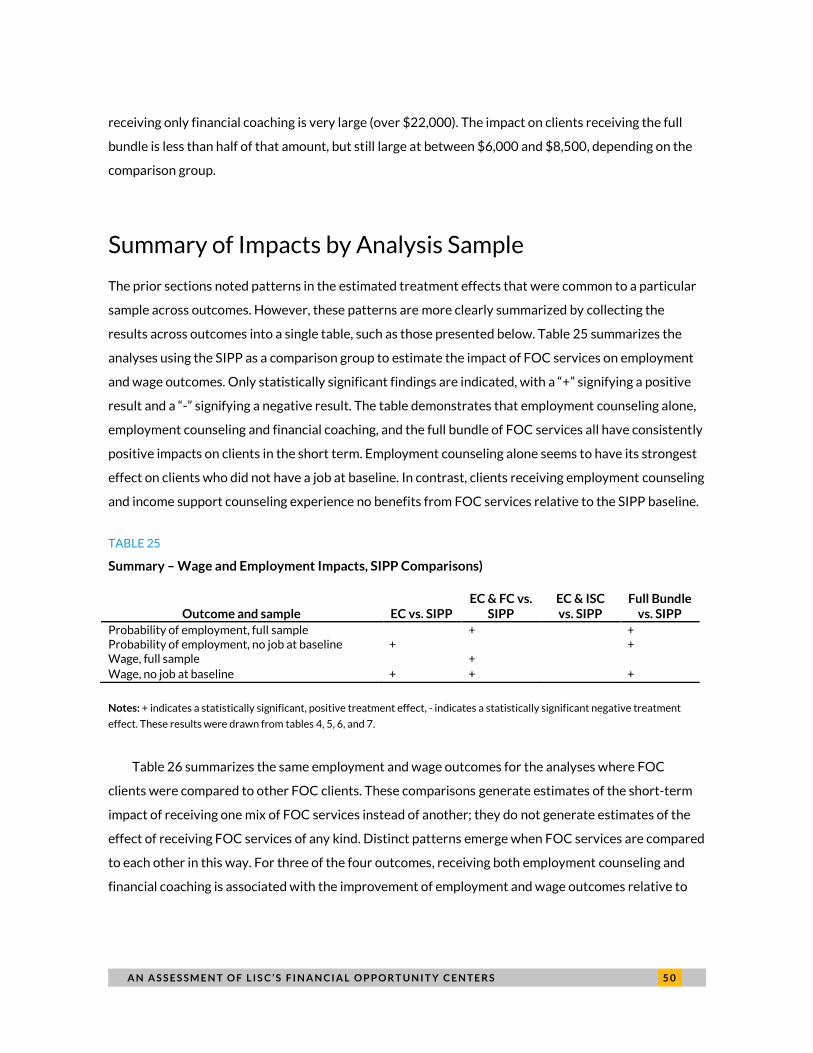
A N A S S E S S M E N T O F L I S C ’ S F I N A N C I A L O P P O R T U N I T Y C E N T E R S 5 0
receiving only financial coaching is very large (over $22,000). The impact on clients receiving the full
bundle is less than half of that amount, but still large at between $6,000 and $8,500, depending on the
comparison group.
Summary of Impacts by Analysis Sample
The prior sections noted patterns in the estimated treatment effects that were common to a particular
sample across outcomes. However, these patterns are more clearly summarized by collecting the
results across outcomes into a single table, such as those presented below. Table 25 summarizes the
analyses using the SIPP as a comparison group to estimate the impact of FOC services on employment
and wage outcomes. Only statistically significant findings are indicated, with a “+” signifying a positive
result and a “-” signifying a negative result. The table demonstrates that employment counseling alone,
employment counseling and financial coaching, and the full bundle of FOC services all have consistently
positive impacts on clients in the short term. Employment counseling alone seems to have its strongest
effect on clients who did not have a job at baseline. In contrast, clients receiving employment counseling
and income support counseling experience no benefits from FOC services relative to the SIPP baseline.
TABLE 25
Summary – Wage and Employment Impacts, SIPP Comparisons)
Outcome and sample EC vs. SIPP EC & FC vs.
SIPP EC & ISC vs. SIPP
Full Bundle vs. SIPP
Probability of employment, full sample + + Probability of employment, no job at baseline + + Wage, full sample +
Wage, no job at baseline + + +
Notes: + indicates a statistically significant, positive treatment effect, - indicates a statistically significant negative treatment
effect. These results were drawn from tables 4, 5, 6, and 7.
Table 26 summarizes the same employment and wage outcomes for the analyses where FOC
clients were compared to other FOC clients. These comparisons generate estimates of the short-term
impact of receiving one mix of FOC services instead of another; they do not generate estimates of the
effect of receiving FOC services of any kind. Distinct patterns emerge when FOC services are compared
to each other in this way. For three of the four outcomes, receiving both employment counseling and
financial coaching is associated with the improvement of employment and wage outcomes relative to
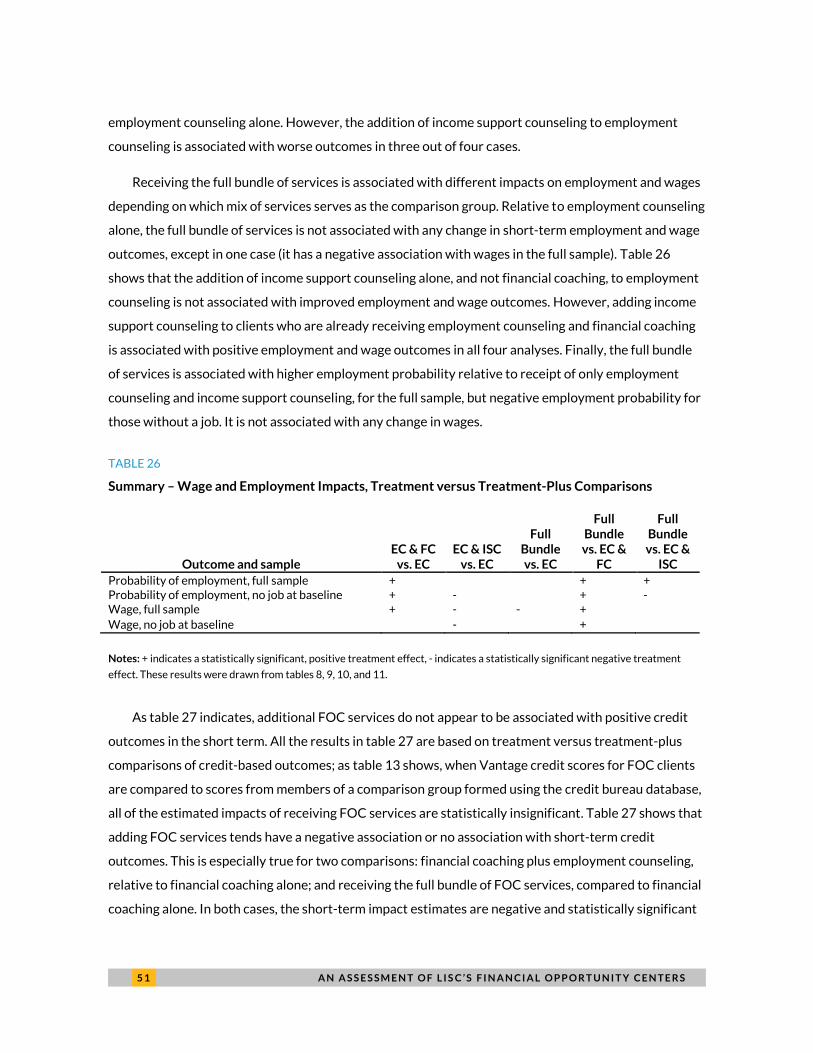
5 1 A N A S S E S S M E N T O F L I S C ’ S F I N A N C I A L O P P O R T U N I T Y C E N T E R S
employment counseling alone. However, the addition of income support counseling to employment
counseling is associated with worse outcomes in three out of four cases.
Receiving the full bundle of services is associated with different impacts on employment and wages
depending on which mix of services serves as the comparison group. Relative to employment counseling
alone, the full bundle of services is not associated with any change in short-term employment and wage
outcomes, except in one case (it has a negative association with wages in the full sample). Table 26
shows that the addition of income support counseling alone, and not financial coaching, to employment
counseling is not associated with improved employment and wage outcomes. However, adding income
support counseling to clients who are already receiving employment counseling and financial coaching
is associated with positive employment and wage outcomes in all four analyses. Finally, the full bundle
of services is associated with higher employment probability relative to receipt of only employment
counseling and income support counseling, for the full sample, but negative employment probability for
those without a job. It is not associated with any change in wages.
TABLE 26
Summary – Wage and Employment Impacts, Treatment versus Treatment-Plus Comparisons
Outcome and sample EC & FC
vs. EC EC & ISC
vs. EC
Full Bundle vs. EC
Full Bundle vs. EC &
FC
Full Bundle vs. EC &
ISC
Probability of employment, full sample + + + Probability of employment, no job at baseline + - + - Wage, full sample + - - +
Wage, no job at baseline - +
Notes: + indicates a statistically significant, positive treatment effect, - indicates a statistically significant negative treatment
effect. These results were drawn from tables 8, 9, 10, and 11.
As table 27 indicates, additional FOC services do not appear to be associated with positive credit
outcomes in the short term. All the results in table 27 are based on treatment versus treatment-plus
comparisons of credit-based outcomes; as table 13 shows, when Vantage credit scores for FOC clients
are compared to scores from members of a comparison group formed using the credit bureau database,
all of the estimated impacts of receiving FOC services are statistically insignificant. Table 27 shows that
adding FOC services tends have a negative association or no association with short-term credit
outcomes. This is especially true for two comparisons: financial coaching plus employment counseling,
relative to financial coaching alone; and receiving the full bundle of FOC services, compared to financial
coaching alone. In both cases, the short-term impact estimates are negative and statistically significant
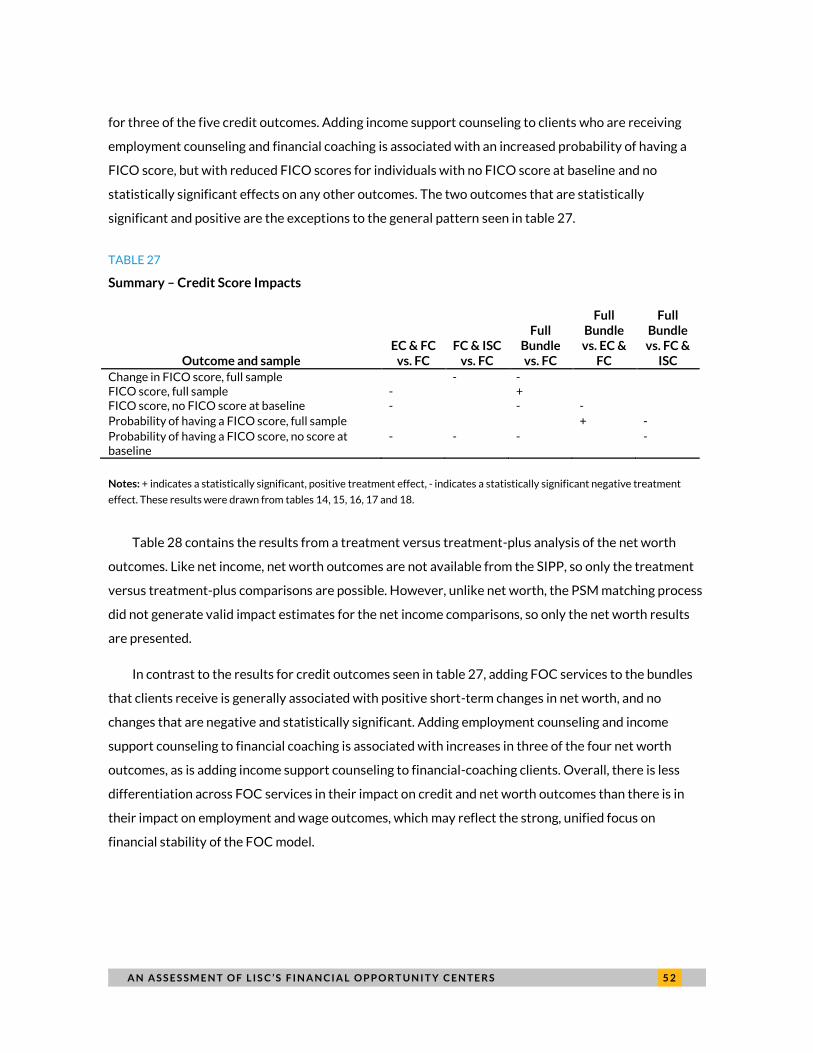
A N A S S E S S M E N T O F L I S C ’ S F I N A N C I A L O P P O R T U N I T Y C E N T E R S 5 2
for three of the five credit outcomes. Adding income support counseling to clients who are receiving
employment counseling and financial coaching is associated with an increased probability of having a
FICO score, but with reduced FICO scores for individuals with no FICO score at baseline and no
statistically significant effects on any other outcomes. The two outcomes that are statistically
significant and positive are the exceptions to the general pattern seen in table 27.
TABLE 27
Summary – Credit Score Impacts
Outcome and sample EC & FC
vs. FC FC & ISC
vs. FC
Full Bundle vs. FC
Full Bundle vs. EC &
FC
Full Bundle vs. FC &
ISC
Change in FICO score, full sample - - FICO score, full sample - + FICO score, no FICO score at baseline - - -
Probability of having a FICO score, full sample + -
Probability of having a FICO score, no score at baseline
- - - -
Notes: + indicates a statistically significant, positive treatment effect, - indicates a statistically significant negative treatment
effect. These results were drawn from tables 14, 15, 16, 17 and 18.
Table 28 contains the results from a treatment versus treatment-plus analysis of the net worth
outcomes. Like net income, net worth outcomes are not available from the SIPP, so only the treatment
versus treatment-plus comparisons are possible. However, unlike net worth, the PSM matching process
did not generate valid impact estimates for the net income comparisons, so only the net worth results
are presented.
In contrast to the results for credit outcomes seen in table 27, adding FOC services to the bundles
that clients receive is generally associated with positive short-term changes in net worth, and no
changes that are negative and statistically significant. Adding employment counseling and income
support counseling to financial coaching is associated with increases in three of the four net worth
outcomes, as is adding income support counseling to financial-coaching clients. Overall, there is less
differentiation across FOC services in their impact on credit and net worth outcomes than there is in
their impact on employment and wage outcomes, which may reflect the strong, unified focus on
financial stability of the FOC model.
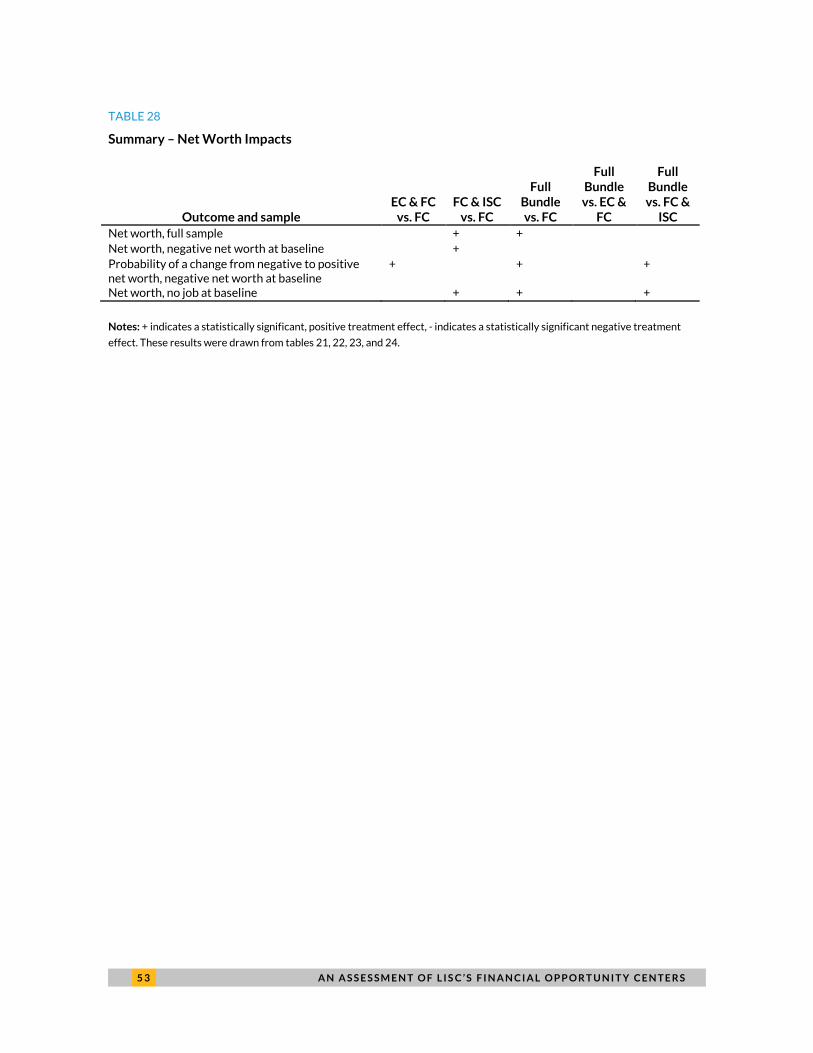
5 3 A N A S S E S S M E N T O F L I S C ’ S F I N A N C I A L O P P O R T U N I T Y C E N T E R S
TABLE 28
Summary – Net Worth Impacts
Outcome and sample EC & FC
vs. FC FC & ISC
vs. FC
Full Bundle vs. FC
Full Bundle vs. EC &
FC
Full Bundle vs. FC &
ISC
Net worth, full sample + +
Net worth, negative net worth at baseline +
Probability of a change from negative to positive net worth, negative net worth at baseline
+ + +
Net worth, no job at baseline + + +
Notes: + indicates a statistically significant, positive treatment effect, - indicates a statistically significant negative treatment
effect. These results were drawn from tables 21, 22, 23, and 24.
A N A S S E S S M E N T O F L I S C ’ S F I N A N C I A L O P P O R T U N I T Y C E N T E R S 5 4
Costs of Providing FOC Services Many studies of integrated service delivery programs contain data that illustrates the benefits to clients
receiving the services, but comparatively few provide data on the costs of providing these services.
However, the United Way, in association with Bank of America, produced a report41
on the network of
Financial Stability One Stop Centers that analyzes cost data collected from the Centers. The United
Way report contains a table reflecting the average cost per client for nine Centers. This table shows a
pronounced split along the Centers: four spend more than $1000 per client on average, while the
remaining five spend less than $500. The authors note: “While not indicative of efficiency or
effectiveness by itself, this measure can provide a common view of diverse operating models. When
used internally, it can also serve as a benchmark for sustainability.”
The second of the two main research questions that motivate this study asks how the benefits of
FOC services compares to the costs of providing services to clients. To estimate the costs of providing
services to clients, we need to make assumptions about how to treat the data in the budget templates
submitted by the AmeriCorps sites (see Appendix A). As described above, six sites submitted relatively
complete cost data; the costs of providing each type of FOC service are based on the total amount
recorded for salaries and benefits for the FOC coaches. The amount spent on other administrative and
support staff, as well as non-staff administrative and overhead costs, is allocated to each FOC service in
the same proportion as FOC staff costs: thus, if the sites devotes 30 percent of its total salaries and
benefits for FOC coaches to the income support counseling coaches, 30 percent of the other costs are
assumed to be devoted to income support counseling. These cost estimates are totaled for each service
and used to create a cost per FTE (full-time equivalency) for each service for each site, based on the
amount of time the FOC coaches devote to providing FOC services. This cost is divided by the total
amount of service provided to all clients during program year 2013-2014, for each service, and adjusted
so that the estimates of the total amount spent match the total FOC costs reported for each site.
In later sections of the report, these cost-per-minute estimates will be used to examine client-level
differences in program costs, and will also be used in the cost-benefit comparisons in the final section of
the report, which address the second of the study’s two main research questions. The results show that
the estimated costs per minute of service vary somewhat across the type of service provided, with
income support counseling costing less per minute than the other two services. The cost per minute
estimates vary considerably across sites, but the cost per client estimates are generally lower – and in
some cases, considerably lower – than the estimates published in the United Way report cited above.
5 5 A N A S S E S S M E N T O F L I S C ’ S F I N A N C I A L O P P O R T U N I T Y C E N T E R S
Calculation of FOC Unit Costs
As described above, the estimation of site-level costs per minute of service requires some assumptions
about how to allocate the budget entries in the budget templates submitted by the six sites that
provided relatively complete data on FOC program costs. Table 29 below contains the detailed budget
data submitted by the six sites42
that provided relatively complete cost data. In order to produce the
cost estimates we need – cost per minute estimates for each site in the study and each of the three
types of FOC services – we begin with the total amount the sites spent on benefits and salaries for
people who provide FOC services. The top panels of table 29 contain the direct service costs for the
FOC coaches (including staff members, listed by position title under “Salaries and Benefits – Direct
Service” on the site budgets, who were not identified as FOC coaches, but who provided FOC services)
at each site.
Because five of the six sites also receive funding from the Social Innovation Fund (SIF), the project
team was able to compare the direct service costs in table 29 with those found on the SIF budgets. The
full-time equivalency (FTE) estimates are based on the percent of staff time devoted to FOC services, as
estimated by the sites. The SIF budgets also require the sites to note how much time each staff member
spends on SIF-funded FOC services; these FOC percentages on our budget templates were generally
consistent with the percentages found on the SIF budgets.
Next, we use the direct service costs devoted to each FOC service to estimate the amount of FOC
administrative and overhead costs (including the salaries and benefits of staff members who do not
provide direct service) to allocate to each service. We use the percentage of direct costs devoted to
each FOC service (employment counseling, financial coaching, and income support counseling) to
estimate the proportion of administrative salaries and benefits, overhead costs, and direct
administrative costs that should be allocated to each FOC service. This creates a “weighted” labor rate
per FTE for staff members who provide each type of service, as seen in the bottom panels of table 29.
For some sites, the salaries and benefits for staff members listed under “Other Direct Service Staff”
constitute a relatively large proportion of the “Direct Service Costs” category,43
and the FOC
programming accounts for a large share of administrative and overhead costs. When these costs are
allocated across each of the three FOC service categories, the FOC costs increase, which accounts for
much of the observed differences across sites in unit costs.
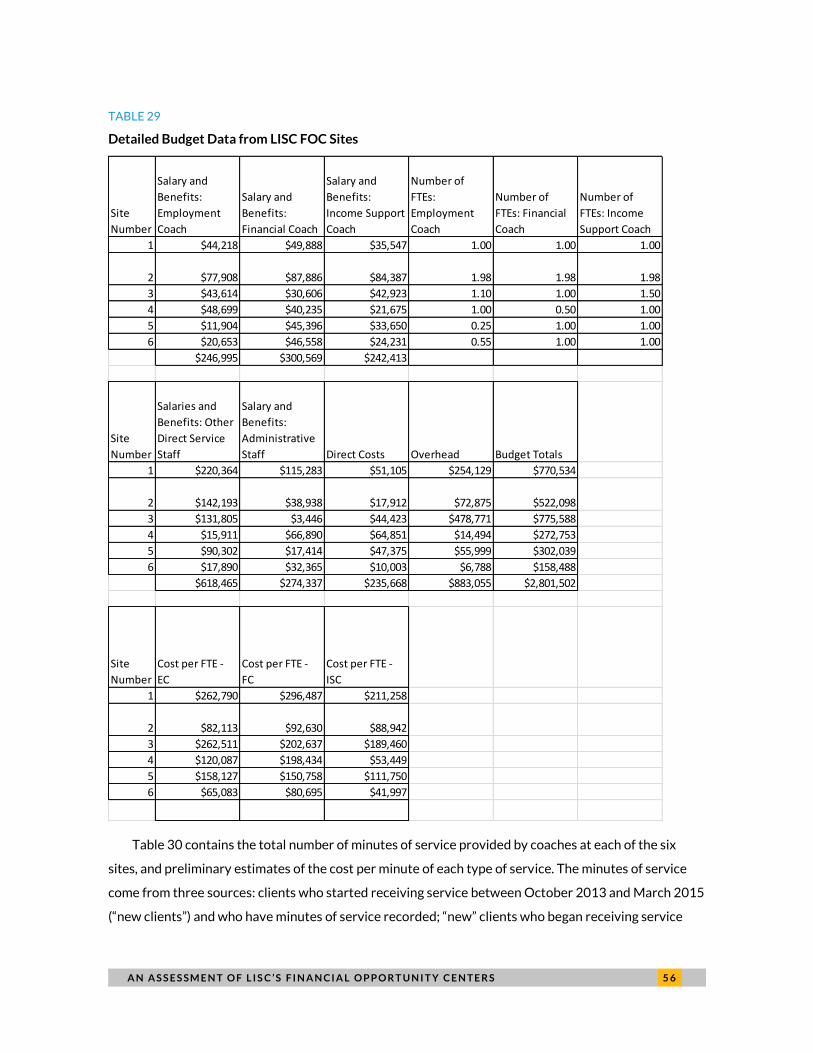
A N A S S E S S M E N T O F L I S C ’ S F I N A N C I A L O P P O R T U N I T Y C E N T E R S 5 6
TABLE 29
Detailed Budget Data from LISC FOC Sites
Table 30 contains the total number of minutes of service provided by coaches at each of the six
sites, and preliminary estimates of the cost per minute of each type of service. The minutes of service
come from three sources: clients who started receiving service between October 2013 and March 2015
(“new clients”) and who have minutes of service recorded; “new” clients who began receiving service
Site
Number
Salary and
Benefits:
Employment
Coach
Salary and
Benefits:
Financial Coach
Salary and
Benefits:
Income Support
Coach
Number of
FTEs:
Employment
Coach
Number of
FTEs: Financial
Coach
Number of
FTEs: Income
Support Coach
1 $44,218 $49,888 $35,547 1.00 1.00 1.00
2 $77,908 $87,886 $84,387 1.98 1.98 1.98
3 $43,614 $30,606 $42,923 1.10 1.00 1.50
4 $48,699 $40,235 $21,675 1.00 0.50 1.00
5 $11,904 $45,396 $33,650 0.25 1.00 1.00
6 $20,653 $46,558 $24,231 0.55 1.00 1.00
$246,995 $300,569 $242,413
Site
Number
Salaries and
Benefits: Other
Direct Service
Staff
Salary and
Benefits:
Administrative
Staff Direct Costs Overhead Budget Totals
1 $220,364 $115,283 $51,105 $254,129 $770,534
2 $142,193 $38,938 $17,912 $72,875 $522,098
3 $131,805 $3,446 $44,423 $478,771 $775,588
4 $15,911 $66,890 $64,851 $14,494 $272,753
5 $90,302 $17,414 $47,375 $55,999 $302,039
6 $17,890 $32,365 $10,003 $6,788 $158,488
$618,465 $274,337 $235,668 $883,055 $2,801,502
Site
Number
Cost per FTE -
EC
Cost per FTE -
FC
Cost per FTE -
ISC
1 $262,790 $296,487 $211,258
2 $82,113 $92,630 $88,942
3 $262,511 $202,637 $189,460
4 $120,087 $198,434 $53,449
5 $158,127 $150,758 $111,750
6 $65,083 $80,695 $41,997
5 7 A N A S S E S S M E N T O F L I S C ’ S F I N A N C I A L O P P O R T U N I T Y C E N T E R S
during this time period, but have data missing for the amount of service they received; and clients who
began receiving FOC services before October 2013, but received more coaching after that (“existing
clients”). For the first group of clients, ETO records the number of minutes spent with a coach for each
type of FOC service the client was scheduled to receive. For the second group of clients, we impute a
small number of minutes of service for clients with missing time data for the services they received. The
amount of time imputed depends on whether the client met with a coach in person (20 minutes) or not
(10 minutes); these figures are based on the average for those clients with available ETO data. Finally,
the third group of clients represents a substantial addition to the workload of FOC coaches at all sites,
so this time must be considered when calculating total costs.
Table 31 contains the remaining steps in the derivation of the final FOC cost per minute estimates,
The top panel of table 31 contains the “stage 1” cost per minute estimates, which are simply the share of
the budget devoted to each FOC service (from table 29) divided by the total number of minutes of each
FOC service provided to all clients (from table 30). The total amount of service received by all clients,
when expressed in terms of FTE (by dividing by 2080 hours per year times 60 minutes per hour), is often
very different from the FTE amounts recorded in table 29 for each site. When the amount of service
recorded is less than the FTE total, this might be due to direct-service minutes that are not reported by
staff, or to minutes spent on non-direct-service activities. The time that FOC coaches spend on
activities other than direct service to clients may vary by the type of FOC service, across sites, and/or
across coaches.
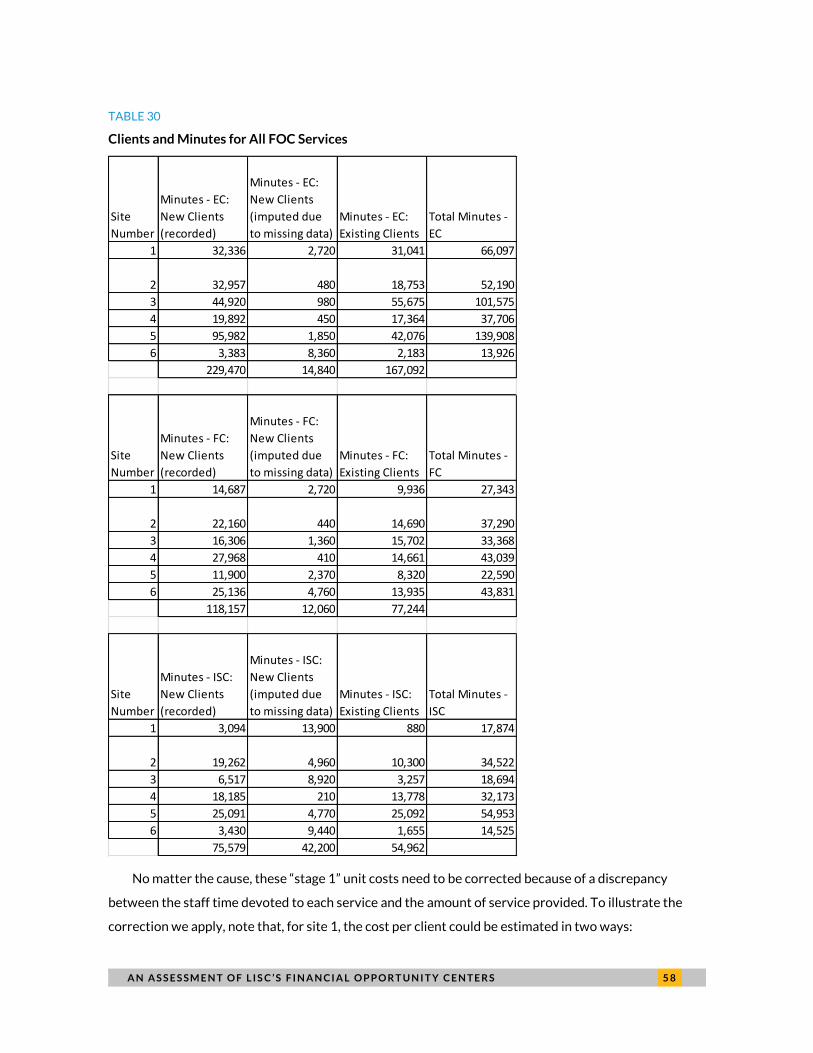
A N A S S E S S M E N T O F L I S C ’ S F I N A N C I A L O P P O R T U N I T Y C E N T E R S 5 8
TABLE 30
Clients and Minutes for All FOC Services
No matter the cause, these “stage 1” unit costs need to be corrected because of a discrepancy
between the staff time devoted to each service and the amount of service provided. To illustrate the
correction we apply, note that, for site 1, the cost per client could be estimated in two ways:
Site
Number
Minutes - EC:
New Clients
(recorded)
Minutes - EC:
New Clients
(imputed due
to missing data)
Minutes - EC:
Existing Clients
Total Minutes -
EC
1 32,336 2,720 31,041 66,097
2 32,957 480 18,753 52,190
3 44,920 980 55,675 101,575
4 19,892 450 17,364 37,706
5 95,982 1,850 42,076 139,908
6 3,383 8,360 2,183 13,926
229,470 14,840 167,092
Site
Number
Minutes - FC:
New Clients
(recorded)
Minutes - FC:
New Clients
(imputed due
to missing data)
Minutes - FC:
Existing Clients
Total Minutes -
FC
1 14,687 2,720 9,936 27,343
2 22,160 440 14,690 37,290
3 16,306 1,360 15,702 33,368
4 27,968 410 14,661 43,039
5 11,900 2,370 8,320 22,590
6 25,136 4,760 13,935 43,831
118,157 12,060 77,244
Site
Number
Minutes - ISC:
New Clients
(recorded)
Minutes - ISC:
New Clients
(imputed due
to missing data)
Minutes - ISC:
Existing Clients
Total Minutes -
ISC
1 3,094 13,900 880 17,874
2 19,262 4,960 10,300 34,522
3 6,517 8,920 3,257 18,694
4 18,185 210 13,778 32,173
5 25,091 4,770 25,092 54,953
6 3,430 9,440 1,655 14,525
75,579 42,200 54,962
5 9 A N A S S E S S M E N T O F L I S C ’ S F I N A N C I A L O P P O R T U N I T Y C E N T E R S
1. As the total FOC costs from table 29 ($770, 534) divided by the total number of clients (1,323,
including new clients with recorded and imputed data, and existing clients) = $582.41; or
2. As the sum of (unit cost per minute * minutes of service) for each type of FOC service
($234,395) divided by the total number of clients (1,323) = $177.17.
Table 31 contains the final stage in the procedure for calculating unit costs: the cost per client is
adjusted to bring the cost per client estimates into alignment. The “correction factor” in table 31 –
($582.41 / $177.17) = 3.29 – is then used to adjust the cost per minute for each service. The bottom
panels of table 31 contain the final, corrected, cost per minute estimates for each service at each site, as
well as an “aggregate” cost per minute estimate. The aggregate cost per minute is a weighted average of
the three service-specific unit costs, where the weights are constructed from the proportion of minutes
devoted to each type of service.
The corrected, “final” unit cost (cost-per-minute) estimates in table 31 now match the FOC budget
totals in table 29: the cost per minute times the number of minutes of service, summed over all three
FOC services, equals the total amount that the site reported spending on FOC services. These unit cost
measures vary somewhat across sites: Site 5, the site serving the largest number of clients, has the
lowest aggregate cost-per-minute estimate, but the smallest sites (sites 2 and 4) have unit costs that are
closer to the middle of the pack. In general, the differences in table 31 may appear because of
differences in the client population served by the site, the type of services clients receive, and other
unmeasured site-specific characteristics that might influence the costs of providing FOC services. The
next section contains an analysis that is designed to disentangle these differences to learn more about
the costs of providing FOC services.
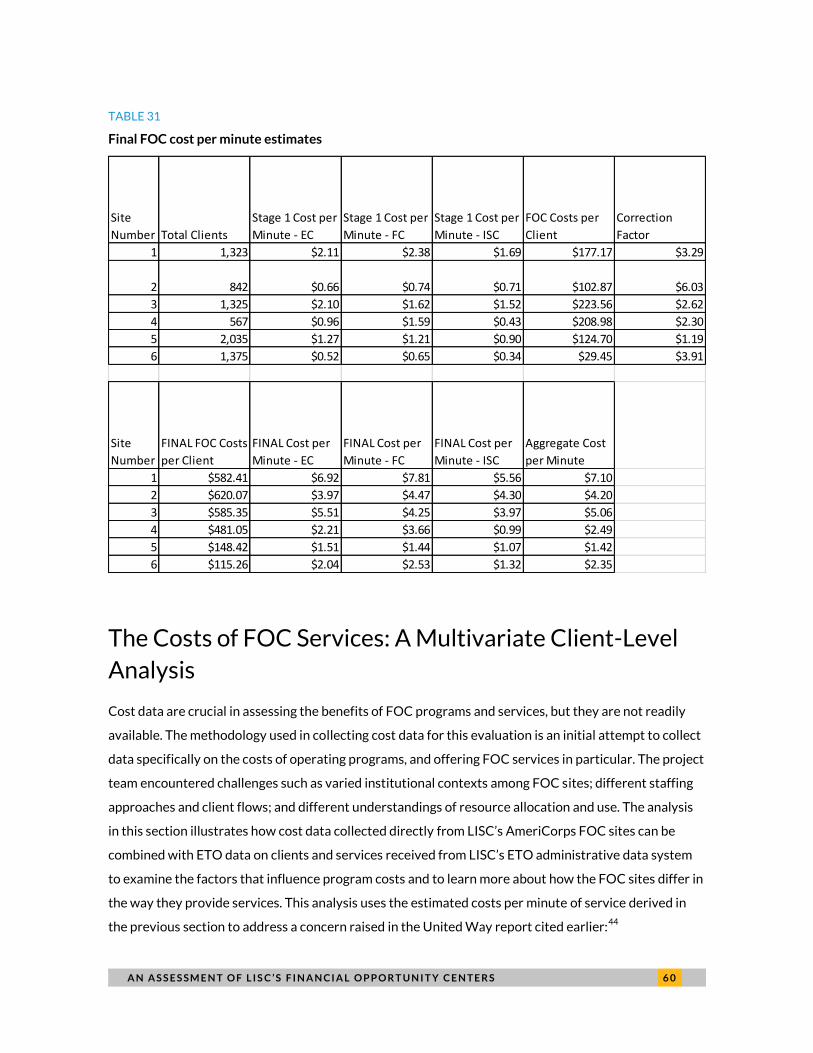
A N A S S E S S M E N T O F L I S C ’ S F I N A N C I A L O P P O R T U N I T Y C E N T E R S 6 0
TABLE 31
Final FOC cost per minute estimates
The Costs of FOC Services: A Multivariate Client-Level
Analysis
Cost data are crucial in assessing the benefits of FOC programs and services, but they are not readily
available. The methodology used in collecting cost data for this evaluation is an initial attempt to collect
data specifically on the costs of operating programs, and offering FOC services in particular. The project
team encountered challenges such as varied institutional contexts among FOC sites; different staffing
approaches and client flows; and different understandings of resource allocation and use. The analysis
in this section illustrates how cost data collected directly from LISC’s AmeriCorps FOC sites can be
combined with ETO data on clients and services received from LISC’s ETO administrative data system
to examine the factors that influence program costs and to learn more about how the FOC sites differ in
the way they provide services. This analysis uses the estimated costs per minute of service derived in
the previous section to address a concern raised in the United Way report cited earlier:44
Site
Number Total Clients
Stage 1 Cost per
Minute - EC
Stage 1 Cost per
Minute - FC
Stage 1 Cost per
Minute - ISC
FOC Costs per
Client
Correction
Factor
1 1,323 $2.11 $2.38 $1.69 $177.17 $3.29
2 842 $0.66 $0.74 $0.71 $102.87 $6.03
3 1,325 $2.10 $1.62 $1.52 $223.56 $2.62
4 567 $0.96 $1.59 $0.43 $208.98 $2.30
5 2,035 $1.27 $1.21 $0.90 $124.70 $1.19
6 1,375 $0.52 $0.65 $0.34 $29.45 $3.91
Site
Number
FINAL FOC Costs
per Client
FINAL Cost per
Minute - EC
FINAL Cost per
Minute - FC
FINAL Cost per
Minute - ISC
Aggregate Cost
per Minute
1 $582.41 $6.92 $7.81 $5.56 $7.10
2 $620.07 $3.97 $4.47 $4.30 $4.20
3 $585.35 $5.51 $4.25 $3.97 $5.06
4 $481.05 $2.21 $3.66 $0.99 $2.49
5 $148.42 $1.51 $1.44 $1.07 $1.42
6 $115.26 $2.04 $2.53 $1.32 $2.35
6 1 A N A S S E S S M E N T O F L I S C ’ S F I N A N C I A L O P P O R T U N I T Y C E N T E R S
For example, the cost-per-client calculations in the chart below use a broad base for number of
clients – those receiving at least one service. Those receiving multiple services, or returning
several times to utilize Center resources, cost more than a client who attends one workshop or
one counseling session and does not return. This measure, therefore, does not capture the cost
of bundling; it does not offer any insights into comparisons between those using one vs. many
services.
The results suggest that client characteristics have some influence over the resources that FOC
sites devote to clients, but that the costs of providing service also depend on the mix of FOC services
the client receives, and vary substantially across sites, controlling for all other factors. These results
shed some light on the reasons why the costs of serving some clients are greater than the costs of
serving others. Because of program design, client characteristics, and/or available resources, sites
supply different services to particular clients at different levels of intensity. The FOC program mix a
client receives is driven by these factors, as well as by the client’s own demands; it costs more to provide
a client more intensive services and a more complete bundle of FOC services. However, the site-specific
differences are significant predictors even after controlling for client demographics and program mix.
These differences are due in part to the site-specific unit costs, but also appear to be influenced by
other unmeasured characteristics of the sites and the way they operate their FOC programs.
Data and Model Specification
Table 32 below contains descriptive statistics for the FOC clients who received services during program
year 2013-2014 from one of the six AmeriCorps sites with complete cost data. The dataset includes
4,642 clients, some of whom had missing data for one or more of the services they received. The
dependent variable for the analysis is the total amount of service, in dollars, that the client received,
which is calculated as follows:
3. Total Costi = (EC Unit Costj * EC Minutesi) + (FC Unit Costj * FC Minutesi) + (ISC Unit Costj * ISC
Minutesi)
Equation (3) uses the cost per minute calculated for site j = 1, 2, …, 6, and the minutes of service
client i received, which are recorded in ETO or imputed as described in the previous section. The
independent variables used in the regression models include client characteristics, program mix
indicators, and site indicators. Table 32 illustrates that a substantial number of clients fall into “high-
needs” categories due to their unemployment, homelessness, low income, or prior criminal convictions
recorded at intake – but that the characteristics of the client population also vary across sites. Table 32
A N A S S E S S M E N T O F L I S C ’ S F I N A N C I A L O P P O R T U N I T Y C E N T E R S 6 2
also shows that the missing-data rates are also high for several of the independent variables, especially
for certain sites.
In this section, we use ordinary least squares (OLS) to estimate regression models of the following
form:
4. Y = βX + γP + δS + u,
where Y is the total costs recorded or imputed of all the FOC services the client received, X is a vector
of client characteristics measured in ETO, P is a vector of indicators representing the client’s mix of
FOC services, S is a vector of site dummies, and u ~ N[0,σ2] is a vector of randomly distributed error
terms that are uncorrelated with any of the variables in X, P or S.
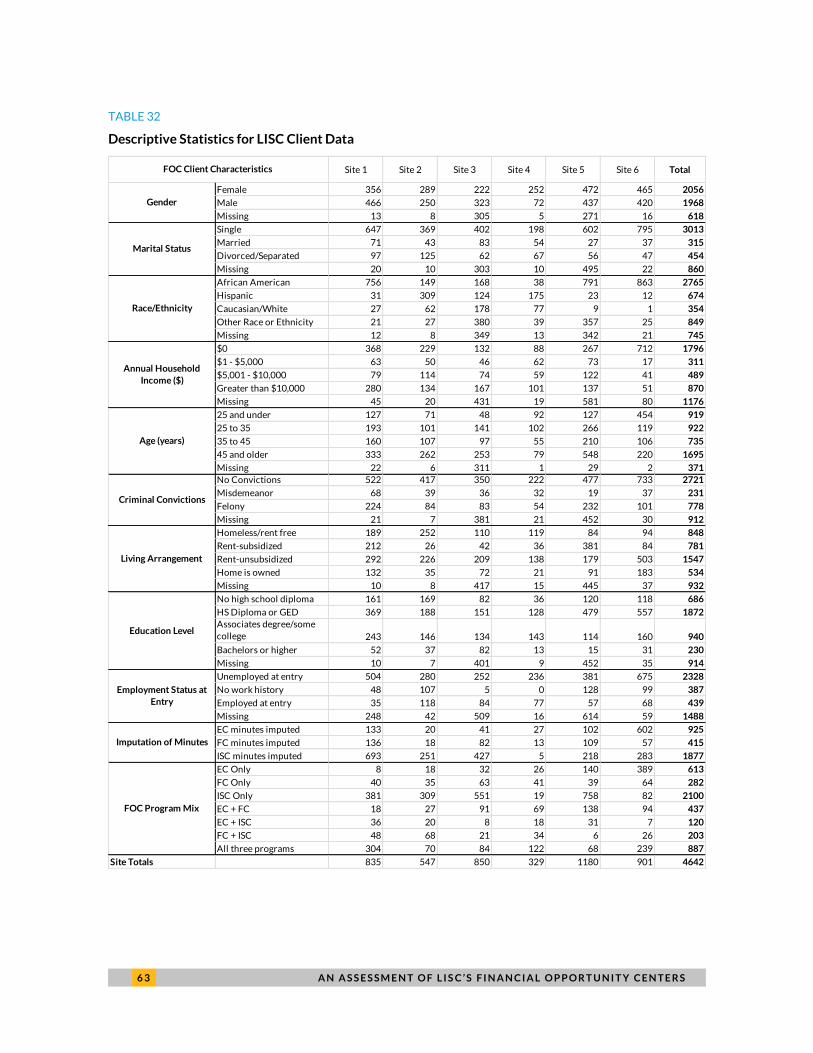
6 3 A N A S S E S S M E N T O F L I S C ’ S F I N A N C I A L O P P O R T U N I T Y C E N T E R S
TABLE 32
Descriptive Statistics for LISC Client Data
Site 1 Site 2 Site 3 Site 4 Site 5 Site 6 Total
Female 356 289 222 252 472 465 2056
Male 466 250 323 72 437 420 1968
Missing 13 8 305 5 271 16 618
Single 647 369 402 198 602 795 3013
Married 71 43 83 54 27 37 315
Divorced/Separated 97 125 62 67 56 47 454
Missing 20 10 303 10 495 22 860
African American 756 149 168 38 791 863 2765
Hispanic 31 309 124 175 23 12 674
Caucasian/White 27 62 178 77 9 1 354
Other Race or Ethnicity 21 27 380 39 357 25 849
Missing 12 8 349 13 342 21 745
$0 368 229 132 88 267 712 1796
$1 - $5,000 63 50 46 62 73 17 311
$5,001 - $10,000 79 114 74 59 122 41 489
Greater than $10,000 280 134 167 101 137 51 870
Missing 45 20 431 19 581 80 1176
25 and under 127 71 48 92 127 454 919
25 to 35 193 101 141 102 266 119 922
35 to 45 160 107 97 55 210 106 735
45 and older 333 262 253 79 548 220 1695
Missing 22 6 311 1 29 2 371
No Convictions 522 417 350 222 477 733 2721
Misdemeanor 68 39 36 32 19 37 231
Felony 224 84 83 54 232 101 778
Missing 21 7 381 21 452 30 912
Homeless/rent free 189 252 110 119 84 94 848
Rent-subsidized 212 26 42 36 381 84 781
Rent-unsubsidized 292 226 209 138 179 503 1547
Home is owned 132 35 72 21 91 183 534
Missing 10 8 417 15 445 37 932
No high school diploma 161 169 82 36 120 118 686
HS Diploma or GED 369 188 151 128 479 557 1872
Associates degree/some
college 243 146 134 143 114 160 940
Bachelors or higher 52 37 82 13 15 31 230
Missing 10 7 401 9 452 35 914
Unemployed at entry 504 280 252 236 381 675 2328
No work history 48 107 5 0 128 99 387
Employed at entry 35 118 84 77 57 68 439
Missing 248 42 509 16 614 59 1488
EC minutes imputed 133 20 41 27 102 602 925
FC minutes imputed 136 18 82 13 109 57 415
ISC minutes imputed 693 251 427 5 218 283 1877
EC Only 8 18 32 26 140 389 613
FC Only 40 35 63 41 39 64 282
ISC Only 381 309 551 19 758 82 2100
EC + FC 18 27 91 69 138 94 437
EC + ISC 36 20 8 18 31 7 120
FC + ISC 48 68 21 34 6 26 203
All three programs 304 70 84 122 68 239 887
Site Totals 835 547 850 329 1180 901 4642
FOC Program Mix
FOC Client Characteristics
Gender
Marital Status
Race/Ethnicity
Annual Household
Income ($)
Age (years)
Criminal Convictions
Living Arrangement
Education Level
Employment Status at
Entry
Imputation of Minutes
A N A S S E S S M E N T O F L I S C ’ S F I N A N C I A L O P P O R T U N I T Y C E N T E R S 6 4
The demographic variables represented in X are:
Gender: Overall, these FOC sites are more likely to serve women than men, although sites 3 and
4 appear to be exceptions to this pattern.
Marital status: Most clients are single, although some sites (Site 6 in particular) appear to serve a
younger, heavily single client population.
Race and Ethnicity: Most clients are African American, but the client populations of sites 1 and 6
seem to be almost exclusively African American. Sites 2 and 4 appear to serve an especially
large proportion of Latino clients.
Income: Most FOC clients have very low income; only 19 percent have income greater than
$10,000. At some sites (like site 6), almost 80 percent of clients had no income at intake, as
recorded in ETO.
Age: Several sites (especially sites 2 and 5) tend to serve a larger-than-average proportion of
older clients, but about 37 percent of FOC clients are 45 and older.
Criminal convictions: Overall, about 22 percent of clients have criminal records. Sites 1 and 5
have above-average numbers of clients who have been convicted of felonies.
Living arrangements: About half of clients at these six sites with non-missing data are renters.
Sites 2 and 4 have the largest proportions of clients who live rent-free or have no fixed address.
Educational attainment: About 15 percent of clients at these sites are recorded as not having
high school diplomas. Sites 1 and 2 contain the largest concentrations of this client group.
Employment status: About half of clients with non-missing data are jobless at intake, according
to ETO; another 8 percent have no work history. Sites 2 and 4 contain the largest percentages
of clients who have jobs when they begin receiving FOC services.
Table 32 also contains data on the proportion of clients with imputed data and on the mix of FOC
services that the clients receive. Overall, the prevalence of missing data on minutes of service is highest
for income support counseling, but at certain sites, large numbers of clients have minutes missing for
other types of service (such as employment counseling at site 1). For the six sites reporting complete
cost data, the “full bundle” rate (19.9 percent) is much lower than it is for AmeriCorps sites as a whole
for the same time period.45
The most common type of program mix overall is ISC only, which is also
6 5 A N A S S E S S M E N T O F L I S C ’ S F I N A N C I A L O P P O R T U N I T Y C E N T E R S
unusual but here too, there are exceptions for certain sites: EC only is the most common program mix at
site 6, and the full bundle is the most common type of program mix at site 4.
Regression Results
Table 33 below contains the results of the estimation of Equation (4) using OLS regression. The “full
model” contains client characteristics (X), indicators for program mix (P), and for sites (S); the other
specifications omit the indicators for site and/or program mix. X, the vector of client characteristics,
includes control variables for clients with imputed data for FOC services, which are included in all three
models. These variables are included in the model strictly to control for the imputation that fills in data
for clients with missing minutes of service in the ETO system; they are intended to distinguish clients
with missing data from clients with data recorded in ETO who receive very little service. Because most
of the demographic variables in X are categorical, they are expressed as dummy variables; a client with
missing data for any variable is included in the reference category. Appendix C contains the full set of
regression results models, including the standardized beta coefficients, which permit comparison of
results between variables (but not across models).46
The results in table 33 from the full model specification suggest that client characteristics influence
how much service the client receives, even controlling for the mix of services the client receives and
other site-specific factors. The site effects (δ from Equation (4) above) reflect the unit costs estimated in
the previous section, which directly affect the cost of providing service, and also any other unmeasured
factors that are specific to that site. In general, as the standardized coefficients in the tables in Appendix
C indicate, the site effects have less explanatory power than the program-mix variables, controlling for
other factors, but both have much more impact than client characteristics.
Some, but not all, of the full-model results in table 33 suggest that sites spend more on hard-to-
employ, or “high-needs” clients, controlling for program mix and site-specific factors. In the fully
specified model, the association between client costs and variables such as sex, marital status, race and
ethnicity is only marginally statistically significant. The results suggest that sites tend to spend more on
clients who are homeless or with no fixed address and to spend less on clients with at least some college
education.
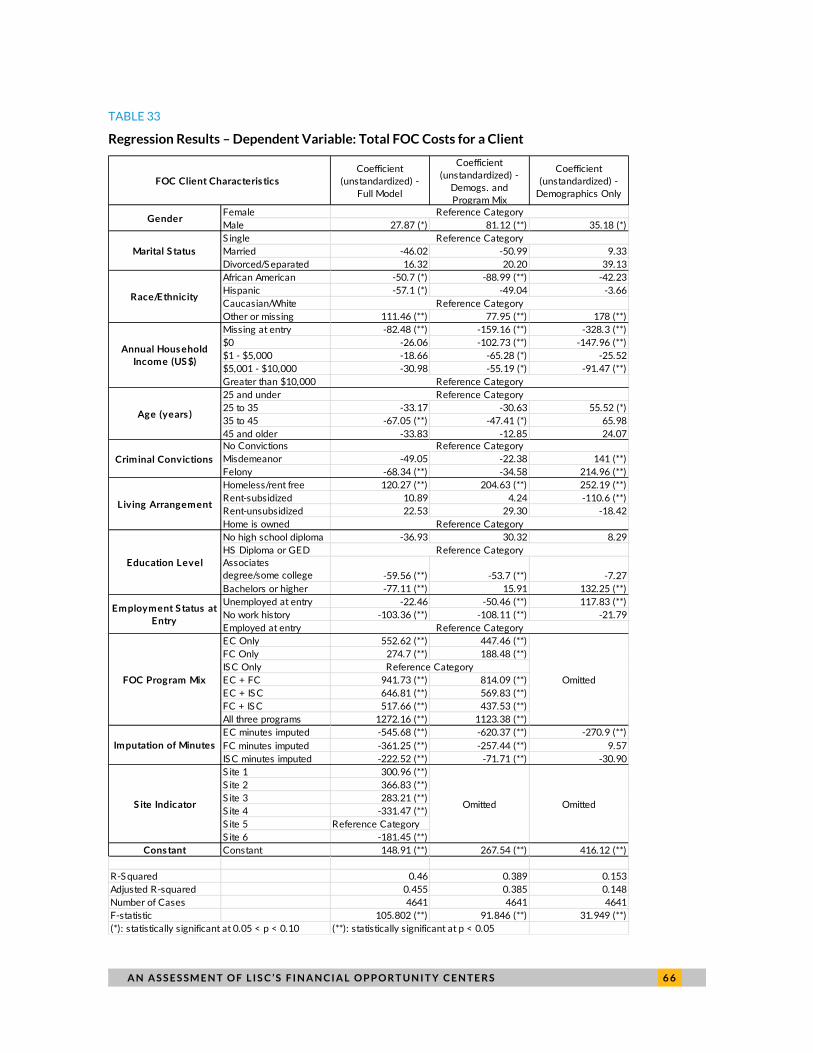
A N A S S E S S M E N T O F L I S C ’ S F I N A N C I A L O P P O R T U N I T Y C E N T E R S 6 6
TABLE 33
Regression Results – Dependent Variable: Total FOC Costs for a Client
Coefficient
(unstandardized) -
Full Model
Coefficient
(unstandardized) -
Demogs. and
Program Mix
Coefficient
(unstandardized) -
Demographics Only
Female
Male 27.87 (*) 81.12 (**) 35.18 (*)
S ingle
Married -46.02 -50.99 9.33
Divorced/S eparated 16.32 20.20 39.13
African American -50.7 (*) -88.99 (**) -42.23
Hispanic -57.1 (*) -49.04 -3.66
Caucasian/White
Other or missing 111.46 (**) 77.95 (**) 178 (**)
Missing at entry -82.48 (**) -159.16 (**) -328.3 (**)
$0 -26.06 -102.73 (**) -147.96 (**)
$1 - $5,000 -18.66 -65.28 (*) -25.52
$5,001 - $10,000 -30.98 -55.19 (*) -91.47 (**)
Greater than $10,000
25 and under
25 to 35 -33.17 -30.63 55.52 (*)
35 to 45 -67.05 (**) -47.41 (*) 65.98
45 and older -33.83 -12.85 24.07No Convictions
Misdemeanor -49.05 -22.38 141 (**)
Felony -68.34 (**) -34.58 214.96 (**)
Homeless/rent free 120.27 (**) 204.63 (**) 252.19 (**)
Rent-subsidized 10.89 4.24 -110.6 (**)
Rent-unsubsidized 22.53 29.30 -18.42
Home is owned
No high school diploma -36.93 30.32 8.29
HS Diploma or GED
Associates
degree/some college -59.56 (**) -53.7 (**) -7.27
Bachelors or higher -77.11 (**) 15.91 132.25 (**)
Unemployed at entry -22.46 -50.46 (**) 117.83 (**)
No work history -103.36 (**) -108.11 (**) -21.79
Employed at entry
EC Only 552.62 (**) 447.46 (**)
FC Only 274.7 (**) 188.48 (**)
IS C Only
EC + FC 941.73 (**) 814.09 (**)
EC + IS C 646.81 (**) 569.83 (**)
FC + IS C 517.66 (**) 437.53 (**)
All three programs 1272.16 (**) 1123.38 (**)
EC minutes imputed -545.68 (**) -620.37 (**) -270.9 (**)
FC minutes imputed -361.25 (**) -257.44 (**) 9.57
IS C minutes imputed -222.52 (**) -71.71 (**) -30.90
S ite 1 300.96 (**)
S ite 2 366.83 (**)
S ite 3 283.21 (**)
S ite 4 -331.47 (**)
S ite 5 Reference Category
S ite 6 -181.45 (**)
Cons tant Constant 148.91 (**) 267.54 (**) 416.12 (**)
R-S quared 0.46 0.389 0.153
Adjusted R-squared 0.455 0.385 0.148
Number of Cases 4641 4641 4641
F-statistic 105.802 (**) 91.846 (**) 31.949 (**)
(*): statistically significant at 0.05 < p < 0.10 (**): statistically significant at p < 0.05
OmittedOmitted
Omitted
S ite Indicator
Reference Category
Reference Category
Reference Category
Reference Category
Reference Category
Reference Category
Reference Category
Reference Category
Em ploym ent S tatus at
Entry
FOC Program Mix
Reference Category
Im putation of Minutes
FOC Client Characteris tics
Gender
Reference Category
Crim inal Convictions
Living Arrangem ent
Education Level
Marital S tatus
Race/Ethnicity
Annual Hous ehold
Incom e (US $)
Age (years )
6 7 A N A S S E S S M E N T O F L I S C ’ S F I N A N C I A L O P P O R T U N I T Y C E N T E R S
Table 33 also suggests that the influence of certain client characteristics depends on whether or not
the model controls for differences in program mix and site-specific influences. For instance, in the
model that only contains demographic variables, costs appear to have a slightly nonlinear relationship
with household income at intake. Sites appear to devote more resources to clients with some but very
little income at intake, and to clients with relatively high incomes, while spending less on clients who
have zero income, missing data, or mid-level income values. In the demographics-only model, sites
appear to devote more resources to clients aged 25 to 35 than on older or younger clients, and to spend
more on average on jobless clients than on clients who were employed at intake and those with no work
history. This model also suggests that sites, on average, spend more on clients with prior criminal
convictions (either misdemeanors or felonies) than on clients with no criminal histories.
Several of these relationships change in the fully specified model that controls for program mix and
site-specific impacts. Household income at intake does not seem to influence the amount spent on a
client, except that sites tend to spend less on average on clients with missing data. Sites appear to spend
somewhat less on clients who are aged 35-45 at intake than on older or younger clients, and to spend
less on clients with no work history, controlling for site-specific differences and differences in program
mix. Finally, controlling for program mix and site-specific impacts, sites tend to spend less on clients
with convictions for felonies, on average. While fewer of the demographic variables have statistically
significant effects in the fully specified model, the demographic variables do appear to have some
significant effects on cost, even controlling for program mix and site impacts.
Not surprisingly, table 33 shows that sites tend to spend more on clients who receive the “full
bundle” of FOC services than on those who receive partial bundles, controlling for other factors. In
general, sites tend to spend more on clients who receive employment counseling (EC) than on clients
who only receive financial coaching (FC) and/or income supports counseling (ISC). Next to the full
bundle, the second most expensive mix of services is EC + FC, followed by EC + ISC and EC alone. Sites
tend to spend the least on clients who receive ISC services only, and slightly more on clients who
receive FC only and the combination of these two services, controlling for other factors. The control
variables for clients with imputed data are negative and significant, which primarily reflects the fact that
the imputed values are smaller on average than the real values might be. Their presence in these models
increases our confidence that the decision to fill in missing data does not drive the results for the rest of
the variables.
Taken as a whole, these results suggest that “high-needs” clients are more likely to receive
“bundles” of FOC services that are relatively costly. For instance, as table 34 below illustrates, clients
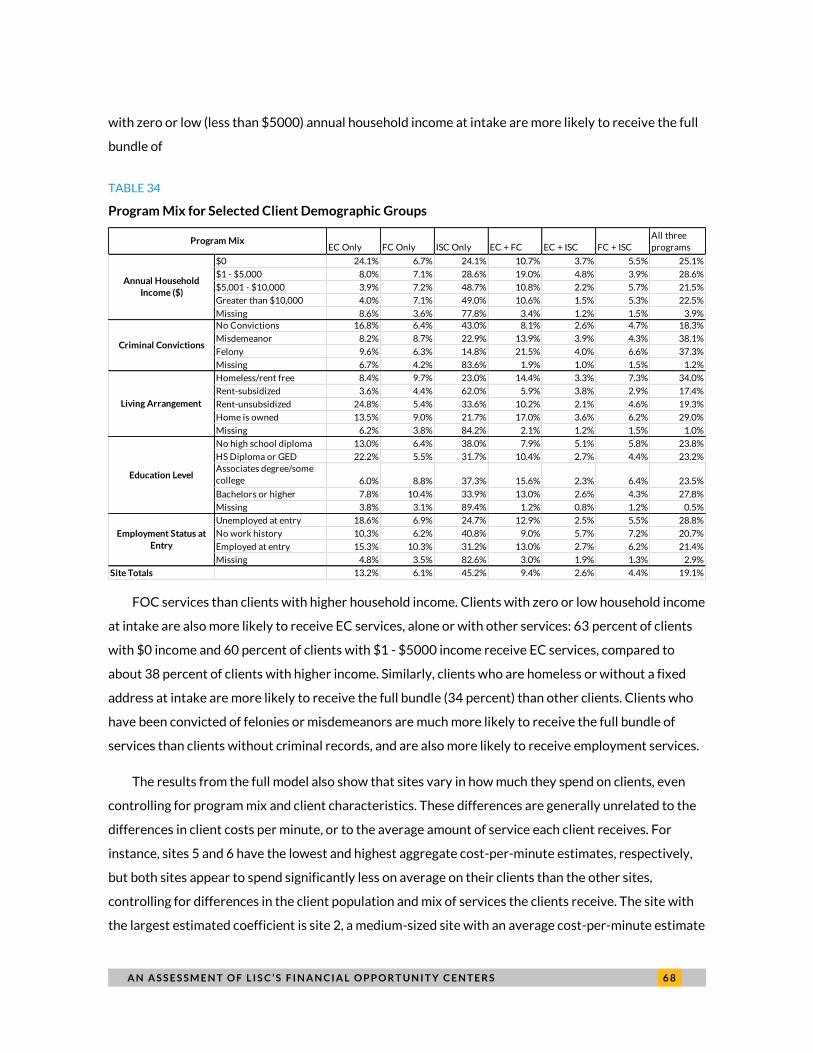
A N A S S E S S M E N T O F L I S C ’ S F I N A N C I A L O P P O R T U N I T Y C E N T E R S 6 8
with zero or low (less than $5000) annual household income at intake are more likely to receive the full
bundle of
TABLE 34
Program Mix for Selected Client Demographic Groups
FOC services than clients with higher household income. Clients with zero or low household income
at intake are also more likely to receive EC services, alone or with other services: 63 percent of clients
with $0 income and 60 percent of clients with $1 - $5000 income receive EC services, compared to
about 38 percent of clients with higher income. Similarly, clients who are homeless or without a fixed
address at intake are more likely to receive the full bundle (34 percent) than other clients. Clients who
have been convicted of felonies or misdemeanors are much more likely to receive the full bundle of
services than clients without criminal records, and are also more likely to receive employment services.
The results from the full model also show that sites vary in how much they spend on clients, even
controlling for program mix and client characteristics. These differences are generally unrelated to the
differences in client costs per minute, or to the average amount of service each client receives. For
instance, sites 5 and 6 have the lowest and highest aggregate cost-per-minute estimates, respectively,
but both sites appear to spend significantly less on average on their clients than the other sites,
controlling for differences in the client population and mix of services the clients receive. The site with
the largest estimated coefficient is site 2, a medium-sized site with an average cost-per-minute estimate
EC Only FC Only ISC Only EC + FC EC + ISC FC + ISC
All three
programs
$0 24.1% 6.7% 24.1% 10.7% 3.7% 5.5% 25.1%
$1 - $5,000 8.0% 7.1% 28.6% 19.0% 4.8% 3.9% 28.6%
$5,001 - $10,000 3.9% 7.2% 48.7% 10.8% 2.2% 5.7% 21.5%
Greater than $10,000 4.0% 7.1% 49.0% 10.6% 1.5% 5.3% 22.5%
Missing 8.6% 3.6% 77.8% 3.4% 1.2% 1.5% 3.9%
No Convictions 16.8% 6.4% 43.0% 8.1% 2.6% 4.7% 18.3%
Misdemeanor 8.2% 8.7% 22.9% 13.9% 3.9% 4.3% 38.1%
Felony 9.6% 6.3% 14.8% 21.5% 4.0% 6.6% 37.3%
Missing 6.7% 4.2% 83.6% 1.9% 1.0% 1.5% 1.2%
Homeless/rent free 8.4% 9.7% 23.0% 14.4% 3.3% 7.3% 34.0%
Rent-subsidized 3.6% 4.4% 62.0% 5.9% 3.8% 2.9% 17.4%
Rent-unsubsidized 24.8% 5.4% 33.6% 10.2% 2.1% 4.6% 19.3%
Home is owned 13.5% 9.0% 21.7% 17.0% 3.6% 6.2% 29.0%
Missing 6.2% 3.8% 84.2% 2.1% 1.2% 1.5% 1.0%
No high school diploma 13.0% 6.4% 38.0% 7.9% 5.1% 5.8% 23.8%
HS Diploma or GED 22.2% 5.5% 31.7% 10.4% 2.7% 4.4% 23.2%
Associates degree/some
college 6.0% 8.8% 37.3% 15.6% 2.3% 6.4% 23.5%
Bachelors or higher 7.8% 10.4% 33.9% 13.0% 2.6% 4.3% 27.8%
Missing 3.8% 3.1% 89.4% 1.2% 0.8% 1.2% 0.5%
Unemployed at entry 18.6% 6.9% 24.7% 12.9% 2.5% 5.5% 28.8%
No work history 10.3% 6.2% 40.8% 9.0% 5.7% 7.2% 20.7%
Employed at entry 15.3% 10.3% 31.2% 13.0% 2.7% 6.2% 21.4%
Missing 4.8% 3.5% 82.6% 3.0% 1.9% 1.3% 2.9%
Site Totals 13.2% 6.1% 45.2% 9.4% 2.6% 4.4% 19.1%
Criminal Convictions
Living Arrangement
Education Level
Employment Status at
Entry
Program Mix
Annual Household
Income ($)
6 9 A N A S S E S S M E N T O F L I S C ’ S F I N A N C I A L O P P O R T U N I T Y C E N T E R S
whose client base is heavily Latino and serves above-average proportions of clients who are 45 and
over, lacking a high school diploma, or without a fixed residence. Meanwhile, site 4 has the largest
minutes-per-client ratio of any site, in part because they have the smallest proportion of clients
receiving ISC-only services, and have the largest proportion of clients receiving financial coaching, but
its site effect is smaller than that of any other site. However, site 2, which has the largest estimated site
effect, also has the second-largest average minutes-per-client ratio. The site indicators are included in
the model to control for site-specific differences in unit costs, as well as to identify the effects of the
organization hosting the site, the location of the site, and any other unmeasured characteristics of the
program. The lack of correlation between unit costs and minutes per client suggest that these other
unmeasured factors exert an independent influence on the costs of providing FOC services.
These results illustrate why the costs of delivering FOC services to clients may vary across LISC’s
AmeriCorps sites. The cost of the service that a client receives appears to depend on the contents of the
“bundle” of services, on the client’s characteristics and circumstances when entering the program, and
on factors that are specific to the site. The analysis in the next section combines the cost data from the
previous section and the impact estimates calculated using propensity score matching to enable a direct
comparison between the short-term benefits to clients and the costs of providing FOC services to them.
A N A S S E S S M E N T O F L I S C ’ S F I N A N C I A L O P P O R T U N I T Y C E N T E R S 7 0
Comparing the Costs and Benefits of
FOC Services Received by Clients This section presents the results of the cost-benefit analysis that addresses the second research
question. The analysis uses the cost-per-minute estimates for the six sites with reliable cost data, the
minutes of service received by the clients at these sites, and the estimated impacts of receiving full or
partial bundles of FOC services, which were derived using propensity score matching. The results
illustrate the implications of the impact estimates by calculating the monetary value of the short-term
benefits of receiving FOC services to jobless clients. The benefits are based on the dollar value of the
estimated economic impacts of FOC services, which, in the case of the employment-based impacts, are
in turn based on data-driven assumptions about the effects of finding a job. After calculating the
aggregate dollar value of each of the client benefits, the value is compared to the costs of providing FOC
services to these clients. The net-benefit calculations show that not all of the individual short-term
benefits of FOC services equal the costs. However, the results suggest that, taken together, the benefits
could be substantial relative to the costs, even in the short term.
The analysis considers three of the economic outcomes47
used in the impact analysis:
Estimated difference in wages
Estimated change in net income from obtaining employment
Estimated difference in net worth
Two other outcomes, the difference net income and credit score changes, are not considered in this
section. Reliable impact estimates for the “treatment versus treatment-plus” analysis for net income
could not be calculated, while credit score impacts are difficult to express in monetary terms.
Propensity score matching (PSM), which controls for potential differences between the treatment
group and the comparison group, was used to estimate the impact of FOC services on these outcomes.48
The impact estimate for each outcome reflects the average change for a treatment group member of
receiving a certain mix of FOC services, compared to a member of the comparison group who is similar
in measureable characteristics but who has not received this mix of services.
The scope of the analysis in this section is constrained by several limitations that prevent us from
fully characterizing the benefits of FOC services. First, the analysis is limited to clients who are jobless
when they started receiving FOC services; PSM matches these clients to comparison group members
7 1 A N A S S E S S M E N T O F L I S C ’ S F I N A N C I A L O P P O R T U N I T Y C E N T E R S
who are also jobless. This decision was driven by sample-size limitations: at the six sites with complete
cost data, only 68 FOC clients (9.5 percent) were recorded as having jobs at intake. Second, the analysis
focuses on short-term impacts because of the need to focus on recent clients who received services
during the 2013-2014 program year, and the lack of outcome data for the treatment and comparison
groups that would cover a longer time frame.
Finally, the analysis focuses on benefits to clients because data on public-sector income supports
are missing for many FOC clients, and are not consistently updated after intake – even for clients who
receive income support counseling, which is designed to provide access to such support. The ETO
system allows users to enter data on income support such as unemployment insurance, SSDI, veterans’
benefits, food stamps, and other public benefits. However, information about these supports, with the
exception of food stamps, is recorded for fewer than five percent of clients. The decision to focus on
benefits to clients is also justified by the literature on job training and human resource development
programs: studies of these programs have often used wages earned from employment as the primary
outcome. To take one example, a study that performs a cost-benefit analysis of the early-1980s
Comprehensive Employment and Training Act (CETA) does includes the cost of public support
payments for former participants in the cost-benefit calculation. However, the author treats these costs
as “secondary” compared to the wages that the participants would lose if CETA were canceled.49
Following the literature, the analysis in this section focuses on the effects of employment on wages
(gross income from employment), net income from employment, and net worth, which are all key
economic outcomes tracked by LISC to measure the impact of FOC services. The first group of results is
based on a comparison of outcomes for jobless FOC clients with a matched comparison group drawn
from SIPP respondents who were also jobless at the first time period. As noted earlier, the SIPP does
not contain measures of net worth or net income for the period covered by the LISC administrative
data, so the cost-benefit analysis only covers the impacts of FOC services on employment and wages.
More significantly, using the SIPP as a comparison group does not permit us to use PSM to control for
differences in location (except by state of residence) or to control for unmeasured factors that impel
some potential clients, but not others, to seek FOC services. According to the results, FOC services
deliver short-term wage-differential benefits to jobless clients that, by themselves, narrowly exceed the
costs of delivering the services, compared to the estimated outcomes for a matched comparison group
drawn from a nationally representative sample (the SIPP). The short-term impact on net income
resulting from increased probability of employment is estimated to be smaller, based on a comparison
of outcomes for jobless FOC clients and a SIPP comparison group. In both cases, the emphasis on short-
term impacts understates the probable overall impact on clients: FOC services may allow clients to gain
A N A S S E S S M E N T O F L I S C ’ S F I N A N C I A L O P P O R T U N I T Y C E N T E R S 7 2
employment, establish positive work and salary histories, purchase needed goods and services for their
households, and learn how to manage their finances so that they have more opportunities to save and
accumulate wealth. Further analysis is required to characterize the long-term value of these benefits,
but the short-term impacts presented here may be best described as a portion of the benefits that
clients may eventually receive from FOC services.
The analysis concludes with cost-benefit comparisons based on the “treatment versus treatment-
plus” impact estimates. The “treatment versus treatment-plus” analysis compares outcomes for a group
of FOC clients who are jobless at intake, and receive a certain mix of services, with those of another
jobless group of clients who receive a different bundle of FOC services. The impact estimates used in
this section are generally of higher quality than the estimates based on a comparison group selected
from SIPP respondents, since the treatment and comparison group members have something important
in common: they have sought FOC services from LISC at an AmeriCorps site. The approach we take is to
show what happens if clients received the “full bundle” of FOC services, rather than the partial bundles
they actually received. As discussed in the last section, LISC’s FOC sites encourage their clients to
choose the bundle of services that is appropriate for their circumstances and goals, and are intentional
about not mandating the full bundle for all clients. Nevertheless, these results illustrate that the
benefits of the full bundle for certain clients might actually exceed the costs of providing these
additional services. The results also show that clients receiving financial coaching would probably
experience a substantial short-term increase in their net worth from receiving all three FOC services,
relative to the costs of providing these additional services.
The cost figures used in this analysis came from the six AmeriCorps FOC sites that reported
complete data on program costs. The cost-per-minute estimates presented in the previous section were
used to calculate the costs of receiving FOC services. The results in the tables below contain a direct
comparison of the aggregate short-term benefits of FOC services and the costs of providing these
services, both measured in dollars. The ratio of benefits to costs summarizes the net impact of the
treatment. When this ratio is greater than one, the (short-term) benefits outweigh the costs. When this
ratio is less than one, it is equivalent to the percentage of overall FOC costs that can be “recouped” by
the estimated short-term benefits of providing FOC services. Cost-benefit analyses often express this
ratio in percentage terms and subtract 100 percent to create a return on investment estimate. In these
presentations, this term is purposely not used because analysis does not consider the full range of
benefits to clients.
Besides the issues mentioned above, certain limitations apply to all of the results of the cost-benefit
analysis presented in this section:
7 3 A N A S S E S S M E N T O F L I S C ’ S F I N A N C I A L O P P O R T U N I T Y C E N T E R S
The results do not apply to all clients at FOC sites. These results apply to FOC clients who have
received one or more FOC services (as recorded in the ETO system) and who were jobless at
intake. The results may be hard to generalize to FOC clients who do not have recorded data for
the outcomes in question, because site staff only record certain outcomes for clients who
receive certain FOC services. Pre- and post-FOC50
outcome data for employment and wages
are only available for clients who received employment counseling; net income and net worth
measures are only available for clients who received financial coaching. A full accounting of the
benefits of FOC services would include benefits for the relatively small number of clients who
were employed at intake, and for clients with missing data for one or more outcomes.
The results do not describe the portion of the net benefit that can be attributed to AmeriCorps. Even if
complete cost data were available for all 16 of LISC’s AmeriCorps FOC sites, the cost-benefit
results would not capture the net benefits of AmeriCorps funding. In part, this is because the
cost measures used in the analysis contain the total amount expended by the sites to support
the provision of FOC services, including (but not limited to) funds that originated from LISC’s
AmeriCorps grant. This analysis follows the example set by earlier cost-benefit studies of
AmeriCorps programs, which treat matching resources as inputs into the service-delivery
process. However, it departs from several of these studies by not attempting to quantify any of
the impacts that can be attributed to AmeriCorps, such as the benefit to members themselves.
The results do not describe the long-term benefits of FOC services to clients. Cost-benefit analyses
often use discount values to project the present value of the long-term benefits of a policy or
program. This analysis focuses solely on the short-term benefits of receiving FOC services,
even though the program model is designed to encourage behavioral changes that can have
long-lasting effects on financial capability and security. However, because of the need to focus
this study on a recently completed program year, the data required to estimate long-term
impacts is not available.
The analysis does not attempt to quantify all outcomes. Even though the impact analysis did not
find that FOC services had any measureable short-term impact on credit outcomes, the
estimated impacts, in principle, could be quantified and expressed in terms of dollars. Similarly,
the experience of achieving positive net income, or positive net worth, might be quantifiable
and could even be monetized. Finally, unlike many previous studies, the analysis does not
attempt to estimate the benefits to anyone except the program participants themselves. Due to
this decision, the overall benefit estimates presented below certainly understate the overall
benefits that FOC clients receive.
A N A S S E S S M E N T O F L I S C ’ S F I N A N C I A L O P P O R T U N I T Y C E N T E R S 7 4
Literature Review
The analysis in this section is a form of cost-benefit analysis,51
in that the goal is to compare the costs of
providing FOC services to the benefits of receiving these services. Perhaps the most well-known use of
cost-benefit analysis is to “promote efficient resource allocation through well-informed decision-
making by the Federal Government,” as stated in official guidance published by the Office of
Management and Budget.52
While the federal government’s reliance on cost-benefit analysis has been
criticized,53
numerous studies have applied cost-benefit analysis to policy questions, and the variation in
methodology and motivation tends to vary widely across these applications.
Several studies, using data from the earliest years of AmeriCorps, have used cost-benefit analysis in
an attempt to quantify the net benefits of national service programs. Two of the most prominent cost-
benefit analyses of AmeriCorps programs – by Neumann et al.54
and Wang et al.55
– illustrate the
decisions and assumptions that the analyst needs to make in order to compare the costs and benefits.
The Neumann et al. study estimates the net benefits of several AmeriCorps programs, including one
that provides educational services to at-risk youth. The authors assume that the main benefits of this
program are experienced by youth who gain a GED. The calculated benefits include benefits to the
youth who receive service (increased earnings) as well as benefits to society as a whole (reductions in
crime, lower special-education costs, and smaller welfare expenses) from the increase in educational
attainment. The study by Wang et al. focuses on the benefits realized by the community (of the direct
service provided by AmeriCorps members, future volunteerism, leveraged volunteers) as well as the
benefits to AmeriCorps members themselves (expected benefits of increased educational attainment
funded by the AmeriCorps education award). In both studies, the costs include the funds provided by
AmeriCorps grants as well as matching resources provided by nonfederal sources.
The analysis in this section takes a more basic, and less ambitious, approach than many studies that
employ cost-benefit analysis. The analysis below is similar in many respects, especially its substantive
focus, to the earliest studies of job-training programs such as CETA.56
The results of these studies
tended to vary considerably based on the specifications of the analysis, particularly in how the impacts
of the training programs were measured.57
This analysis borrows from the methodological discussions
about how to conduct cost-benefit analyses of job-training programs, but the primary question
addressed here is the same: do the employment services have a significant and positive impact on the
income and wealth of program participants, and how does the quantified value of this impact compare
to the costs of providing these services? Some United Way FOC centers – particularly the Greater
Detroit Centers for Working Families58
– have attempted to quantify the value of the benefits received
7 5 A N A S S E S S M E N T O F L I S C ’ S F I N A N C I A L O P P O R T U N I T Y C E N T E R S
by clients. However, the analysis presented here represents one of the first attempts to calculate the
net benefit of FOC services by directly comparing benefits to costs.
Cost-Benefit Analysis of Program Participation
Wage Changes for the Jobless
One of the impact estimates that can be quantified is the estimated wage increase for clients who
receive employment counseling services. Wage increases are the outcome most commonly used to
gauge the effectiveness of job training programs. The estimated wage increases are found in table 36
below: on average, jobless clients who receive the full bundle of FOC services from an AmeriCorps-
sponsored LISC site earn about 70 cents in wages more per hour, relative to a comparison group drawn
from the SIPP. Both groups include people who may not have found employment at the time of the
second observation.
To estimate the dollar value of this wage difference, we need estimates of the number of hours that
the client would work over a one-year period after finding a job. Studies on job training programs
frequently assume that the benefits of training persist for five years or more.59
However, because the
data required to estimate long-term impacts is not yet available, we estimate short-term impacts using
PSM, and use these estimates to calculate the dollar value of the short-term benefits to clients. We use
job retention data, which is entered into the ETO system by employment counselors,60
to estimate the
amount of hours an FOC client would work per year if he or she found employment. In the six sites with
complete cost data, a majority of jobless clients (54.1 percent) who found jobs during the study period
retained them for 90 days or less.61
Two percent kept their jobs for a year or more; over a longer
timeframe, some of these clients would have kept their positions for even longer. Table 35 contains the
estimated number of days that clients at the six sites with complete cost data would work, assuming
that they were jobless at intake but later found jobs.
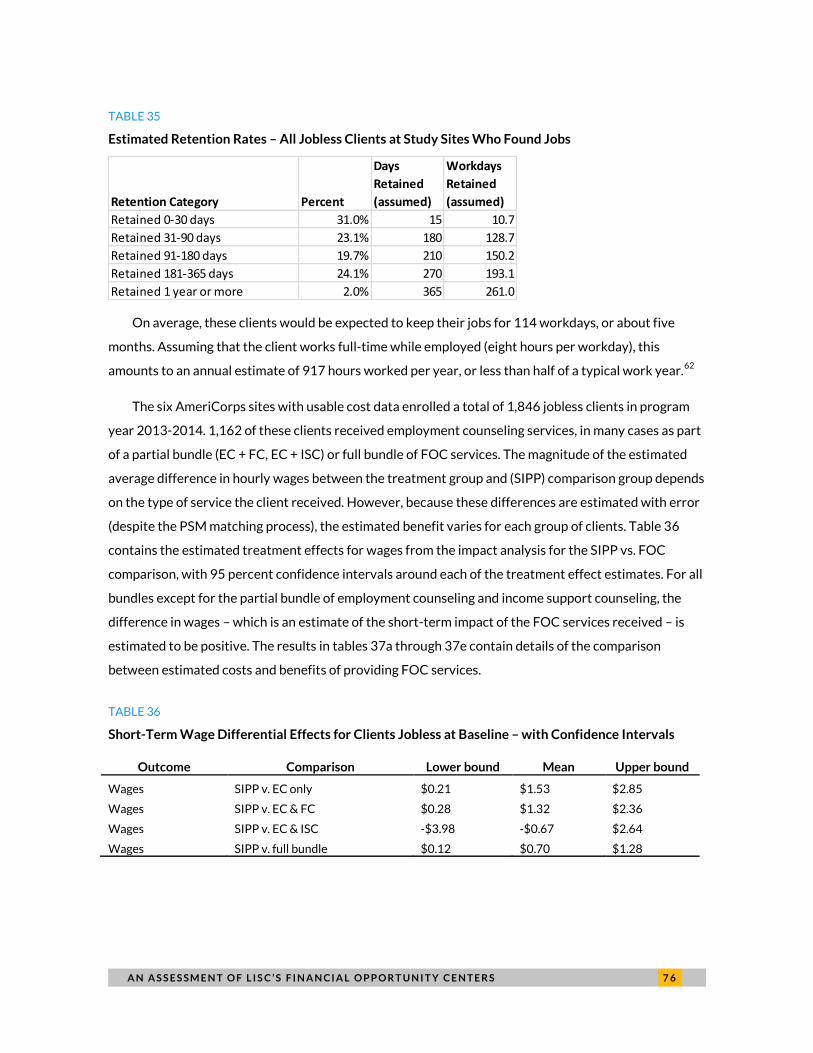
A N A S S E S S M E N T O F L I S C ’ S F I N A N C I A L O P P O R T U N I T Y C E N T E R S 7 6
TABLE 35
Estimated Retention Rates – All Jobless Clients at Study Sites Who Found Jobs
On average, these clients would be expected to keep their jobs for 114 workdays, or about five
months. Assuming that the client works full-time while employed (eight hours per workday), this
amounts to an annual estimate of 917 hours worked per year, or less than half of a typical work year.62
The six AmeriCorps sites with usable cost data enrolled a total of 1,846 jobless clients in program
year 2013-2014. 1,162 of these clients received employment counseling services, in many cases as part
of a partial bundle (EC + FC, EC + ISC) or full bundle of FOC services. The magnitude of the estimated
average difference in hourly wages between the treatment group and (SIPP) comparison group depends
on the type of service the client received. However, because these differences are estimated with error
(despite the PSM matching process), the estimated benefit varies for each group of clients. Table 36
contains the estimated treatment effects for wages from the impact analysis for the SIPP vs. FOC
comparison, with 95 percent confidence intervals around each of the treatment effect estimates. For all
bundles except for the partial bundle of employment counseling and income support counseling, the
difference in wages – which is an estimate of the short-term impact of the FOC services received – is
estimated to be positive. The results in tables 37a through 37e contain details of the comparison
between estimated costs and benefits of providing FOC services.
TABLE 36
Short-Term Wage Differential Effects for Clients Jobless at Baseline – with Confidence Intervals
Outcome Comparison Lower bound Mean Upper bound
Wages SIPP v. EC only $0.21 $1.53 $2.85
Wages SIPP v. EC & FC $0.28 $1.32 $2.36
Wages SIPP v. EC & ISC -$3.98 -$0.67 $2.64
Wages SIPP v. full bundle $0.12 $0.70 $1.28
Retention Category Percent
Days
Retained
(assumed)
Workdays
Retained
(assumed)
Retained 0-30 days 31.0% 15 10.7
Retained 31-90 days 23.1% 180 128.7
Retained 91-180 days 19.7% 210 150.2
Retained 181-365 days 24.1% 270 193.1
Retained 1 year or more 2.0% 365 261.0

7 7 A N A S S E S S M E N T O F L I S C ’ S F I N A N C I A L O P P O R T U N I T Y C E N T E R S
TABLE 37
Cost-Benefit Comparisons – Short-Term Wage Differential Benefit for Jobless Clients Receiving
Employment Counseling Services
Table 37a: Clients Receiving Employment Counseling Only
Lower
Bound
Mean
Estimate
Upper
Bound
Estimated Change in Hourly Wage $0.21 $1.53 $2.85
Average Hours Worked per Year 917 917 917
Clients Served 106 106 106
Average Minutes of Service per Client 136.9 136.9 136.9
Benefits of Service Received $20,284 $148,539 $276,785
Costs of FOC Service $34,598 $34,598 $34,598
Table 37b: Clients Receiving Employment Counseling and Financial Coaching
Lower
Bound
Mean
Estimate
Upper
Bound
Estimated Change in Hourly Wage $0.28 $1.32 $2.36
Average Hours Worked per Year 917 917 917
Clients Served 304 304 304
Average Minutes of Service per Client 246.3 246.3 246.3
Benefits of Service Received $78,836 $369,055 $659,245
Costs of FOC Service $204,890 $204,890 $204,890
Lower
Bound
Mean
Estimate
Upper
Bound
Estimated Change in Hourly Wage -$3.98 -$0.67 $2.64
Average Hours Worked per Year 917 917 917
Clients Served 54 54 54
Average Minutes of Service per Client 183.5 183.5 183.5
Benefits of Service Received -$197,153 -$33,149 $130,854
Costs of FOC Service $29,103 $29,103 $29,103
Table 37c: Clients Receiving Employment Counseling and Income Support
Counseling
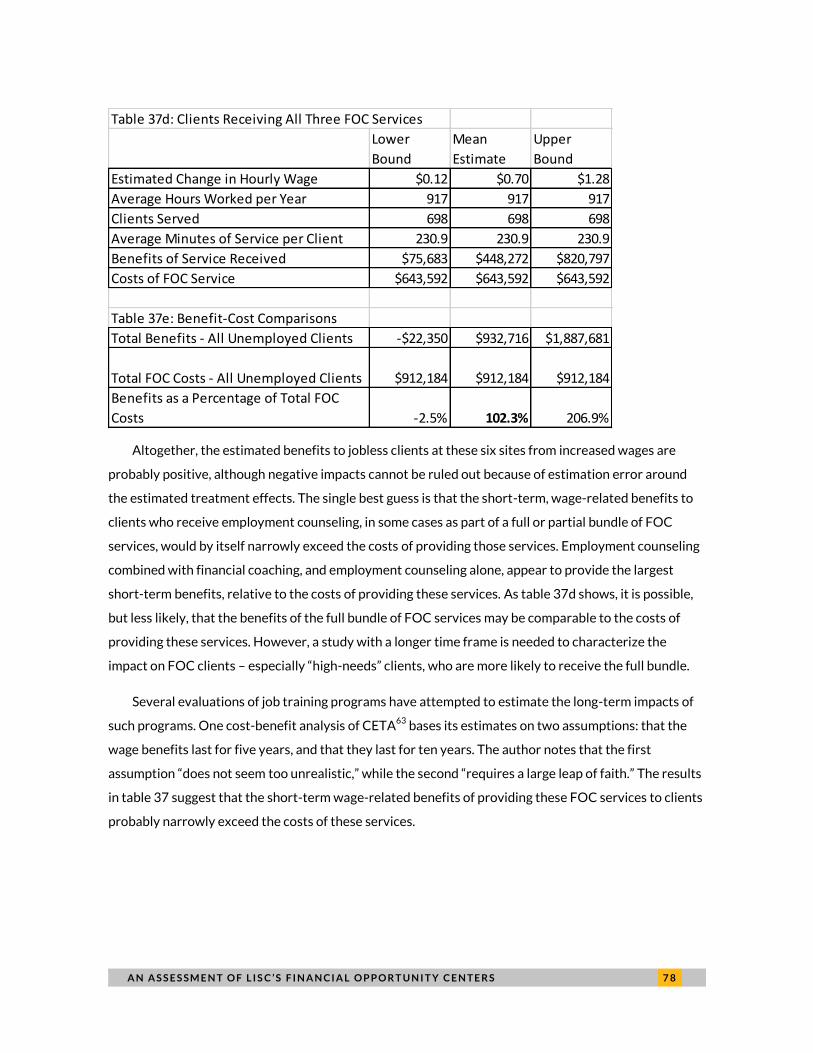
A N A S S E S S M E N T O F L I S C ’ S F I N A N C I A L O P P O R T U N I T Y C E N T E R S 7 8
Altogether, the estimated benefits to jobless clients at these six sites from increased wages are
probably positive, although negative impacts cannot be ruled out because of estimation error around
the estimated treatment effects. The single best guess is that the short-term, wage-related benefits to
clients who receive employment counseling, in some cases as part of a full or partial bundle of FOC
services, would by itself narrowly exceed the costs of providing those services. Employment counseling
combined with financial coaching, and employment counseling alone, appear to provide the largest
short-term benefits, relative to the costs of providing these services. As table 37d shows, it is possible,
but less likely, that the benefits of the full bundle of FOC services may be comparable to the costs of
providing these services. However, a study with a longer time frame is needed to characterize the
impact on FOC clients – especially “high-needs” clients, who are more likely to receive the full bundle.
Several evaluations of job training programs have attempted to estimate the long-term impacts of
such programs. One cost-benefit analysis of CETA63
bases its estimates on two assumptions: that the
wage benefits last for five years, and that they last for ten years. The author notes that the first
assumption “does not seem too unrealistic,” while the second “requires a large leap of faith.” The results
in table 37 suggest that the short-term wage-related benefits of providing these FOC services to clients
probably narrowly exceed the costs of these services.
Table 37d: Clients Receiving All Three FOC Services
Lower
Bound
Mean
Estimate
Upper
Bound
Estimated Change in Hourly Wage $0.12 $0.70 $1.28
Average Hours Worked per Year 917 917 917
Clients Served 698 698 698
Average Minutes of Service per Client 230.9 230.9 230.9
Benefits of Service Received $75,683 $448,272 $820,797
Costs of FOC Service $643,592 $643,592 $643,592
Table 37e: Benefit-Cost Comparisons
Total Benefits - All Unemployed Clients -$22,350 $932,716 $1,887,681
Total FOC Costs - All Unemployed Clients $912,184 $912,184 $912,184
Benefits as a Percentage of Total FOC
Costs -2.5% 102.3% 206.9%
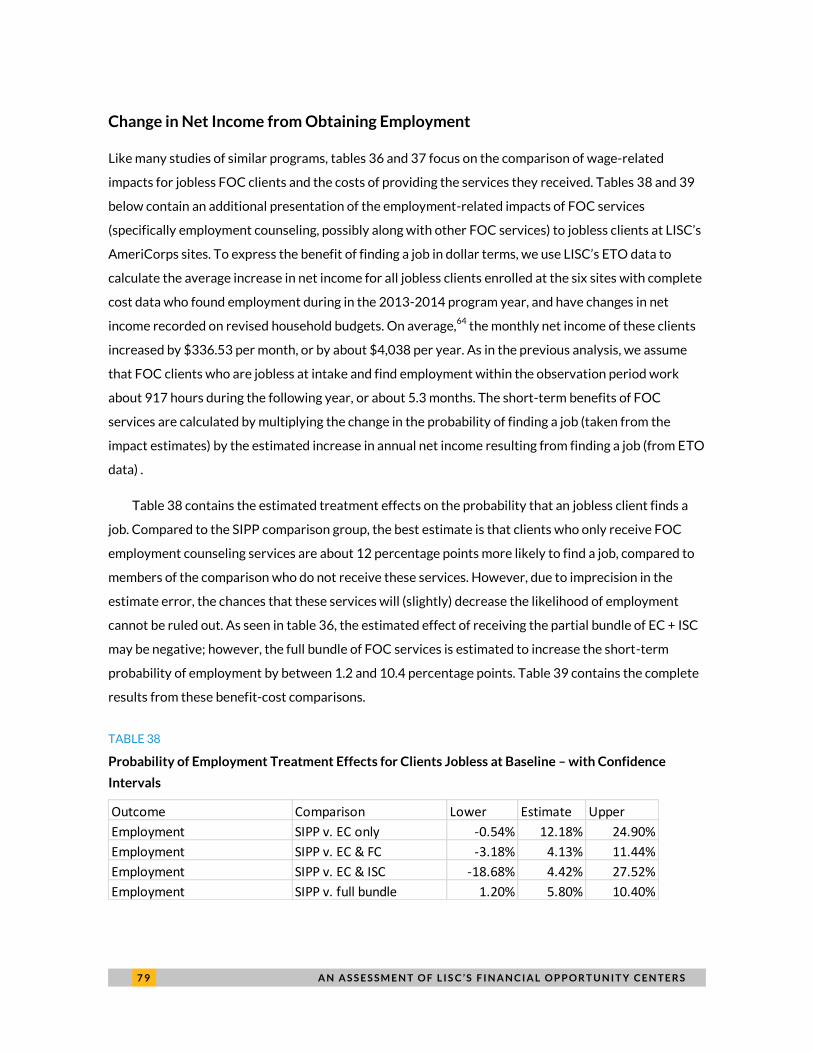
7 9 A N A S S E S S M E N T O F L I S C ’ S F I N A N C I A L O P P O R T U N I T Y C E N T E R S
Change in Net Income from Obtaining Employment
Like many studies of similar programs, tables 36 and 37 focus on the comparison of wage-related
impacts for jobless FOC clients and the costs of providing the services they received. Tables 38 and 39
below contain an additional presentation of the employment-related impacts of FOC services
(specifically employment counseling, possibly along with other FOC services) to jobless clients at LISC’s
AmeriCorps sites. To express the benefit of finding a job in dollar terms, we use LISC’s ETO data to
calculate the average increase in net income for all jobless clients enrolled at the six sites with complete
cost data who found employment during in the 2013-2014 program year, and have changes in net
income recorded on revised household budgets. On average,64
the monthly net income of these clients
increased by $336.53 per month, or by about $4,038 per year. As in the previous analysis, we assume
that FOC clients who are jobless at intake and find employment within the observation period work
about 917 hours during the following year, or about 5.3 months. The short-term benefits of FOC
services are calculated by multiplying the change in the probability of finding a job (taken from the
impact estimates) by the estimated increase in annual net income resulting from finding a job (from ETO
data) .
Table 38 contains the estimated treatment effects on the probability that an jobless client finds a
job. Compared to the SIPP comparison group, the best estimate is that clients who only receive FOC
employment counseling services are about 12 percentage points more likely to find a job, compared to
members of the comparison who do not receive these services. However, due to imprecision in the
estimate error, the chances that these services will (slightly) decrease the likelihood of employment
cannot be ruled out. As seen in table 36, the estimated effect of receiving the partial bundle of EC + ISC
may be negative; however, the full bundle of FOC services is estimated to increase the short-term
probability of employment by between 1.2 and 10.4 percentage points. Table 39 contains the complete
results from these benefit-cost comparisons.
TABLE 38
Probability of Employment Treatment Effects for Clients Jobless at Baseline – with Confidence
Intervals
Outcome Comparison Lower Estimate Upper
Employment SIPP v. EC only -0.54% 12.18% 24.90%
Employment SIPP v. EC & FC -3.18% 4.13% 11.44%
Employment SIPP v. EC & ISC -18.68% 4.42% 27.52%
Employment SIPP v. full bundle 1.20% 5.80% 10.40%
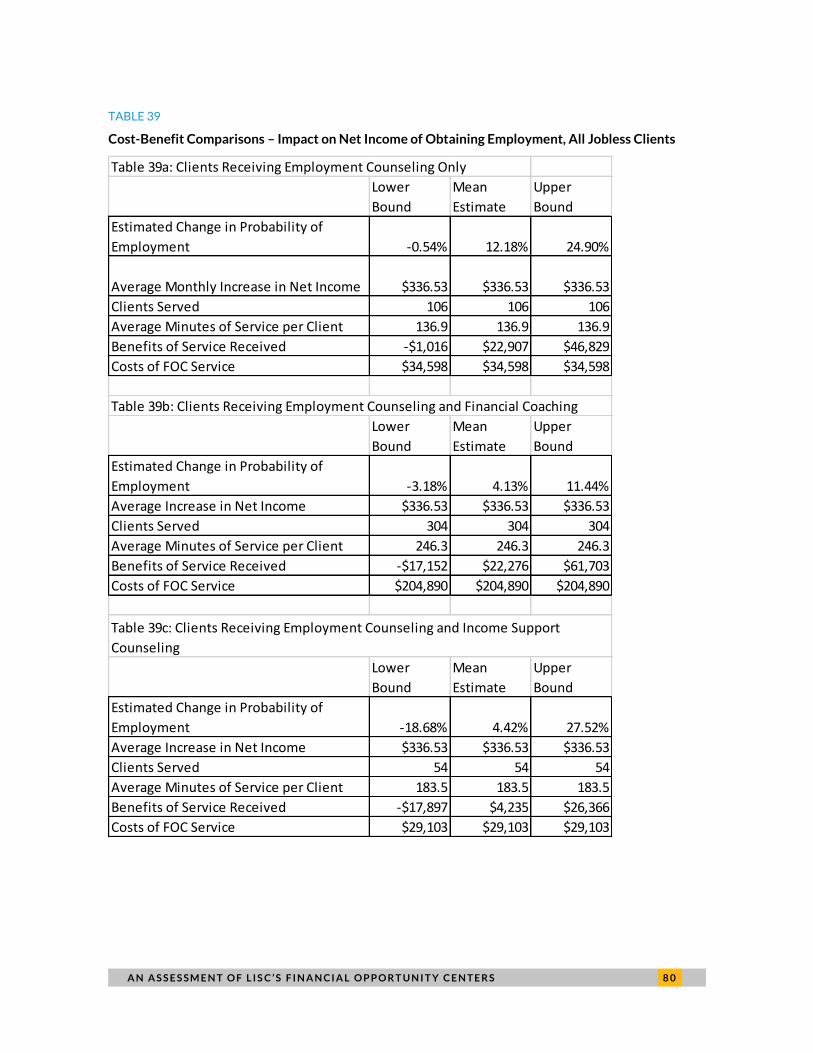
A N A S S E S S M E N T O F L I S C ’ S F I N A N C I A L O P P O R T U N I T Y C E N T E R S 8 0
TABLE 39
Cost-Benefit Comparisons – Impact on Net Income of Obtaining Employment, All Jobless Clients
Table 39a: Clients Receiving Employment Counseling Only
Lower
Bound
Mean
Estimate
Upper
Bound
Estimated Change in Probability of
Employment -0.54% 12.18% 24.90%
Average Monthly Increase in Net Income $336.53 $336.53 $336.53
Clients Served 106 106 106
Average Minutes of Service per Client 136.9 136.9 136.9
Benefits of Service Received -$1,016 $22,907 $46,829
Costs of FOC Service $34,598 $34,598 $34,598
Table 39b: Clients Receiving Employment Counseling and Financial Coaching
Lower
Bound
Mean
Estimate
Upper
Bound
Estimated Change in Probability of
Employment -3.18% 4.13% 11.44%
Average Increase in Net Income $336.53 $336.53 $336.53
Clients Served 304 304 304
Average Minutes of Service per Client 246.3 246.3 246.3
Benefits of Service Received -$17,152 $22,276 $61,703
Costs of FOC Service $204,890 $204,890 $204,890
Lower
Bound
Mean
Estimate
Upper
Bound
Estimated Change in Probability of
Employment -18.68% 4.42% 27.52%
Average Increase in Net Income $336.53 $336.53 $336.53
Clients Served 54 54 54
Average Minutes of Service per Client 183.5 183.5 183.5
Benefits of Service Received -$17,897 $4,235 $26,366
Costs of FOC Service $29,103 $29,103 $29,103
Table 39c: Clients Receiving Employment Counseling and Income Support
Counseling
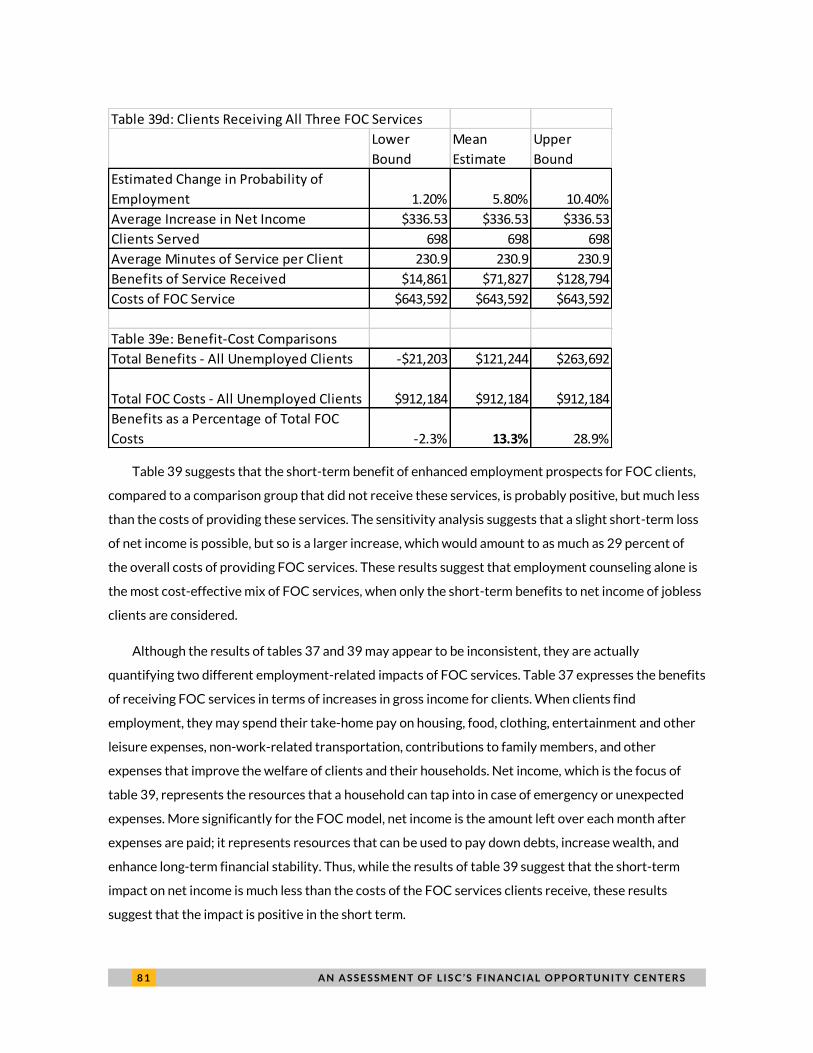
8 1 A N A S S E S S M E N T O F L I S C ’ S F I N A N C I A L O P P O R T U N I T Y C E N T E R S
Table 39 suggests that the short-term benefit of enhanced employment prospects for FOC clients,
compared to a comparison group that did not receive these services, is probably positive, but much less
than the costs of providing these services. The sensitivity analysis suggests that a slight short-term loss
of net income is possible, but so is a larger increase, which would amount to as much as 29 percent of
the overall costs of providing FOC services. These results suggest that employment counseling alone is
the most cost-effective mix of FOC services, when only the short-term benefits to net income of jobless
clients are considered.
Although the results of tables 37 and 39 may appear to be inconsistent, they are actually
quantifying two different employment-related impacts of FOC services. Table 37 expresses the benefits
of receiving FOC services in terms of increases in gross income for clients. When clients find
employment, they may spend their take-home pay on housing, food, clothing, entertainment and other
leisure expenses, non-work-related transportation, contributions to family members, and other
expenses that improve the welfare of clients and their households. Net income, which is the focus of
table 39, represents the resources that a household can tap into in case of emergency or unexpected
expenses. More significantly for the FOC model, net income is the amount left over each month after
expenses are paid; it represents resources that can be used to pay down debts, increase wealth, and
enhance long-term financial stability. Thus, while the results of table 39 suggest that the short-term
impact on net income is much less than the costs of the FOC services clients receive, these results
suggest that the impact is positive in the short term.
Table 39d: Clients Receiving All Three FOC Services
Lower
Bound
Mean
Estimate
Upper
Bound
Estimated Change in Probability of
Employment 1.20% 5.80% 10.40%
Average Increase in Net Income $336.53 $336.53 $336.53
Clients Served 698 698 698
Average Minutes of Service per Client 230.9 230.9 230.9
Benefits of Service Received $14,861 $71,827 $128,794
Costs of FOC Service $643,592 $643,592 $643,592
Table 39e: Benefit-Cost Comparisons
Total Benefits - All Unemployed Clients -$21,203 $121,244 $263,692
Total FOC Costs - All Unemployed Clients $912,184 $912,184 $912,184
Benefits as a Percentage of Total FOC
Costs -2.3% 13.3% 28.9%
A N A S S E S S M E N T O F L I S C ’ S F I N A N C I A L O P P O R T U N I T Y C E N T E R S 8 2
A recent evaluation of another job training program also found that program participants may
experience slight decreases in net income. A recently published evaluation of REDF, which provides
program participants with workforce training and employment at social enterprises in California, shows
that the net income impact on workers can, in fact, be negative on average relative to a comparison
group. As the evaluation report explains, “Each dollar spent by the SE [social enterprise] is associated
with a loss to workers of $0.02. This occurs because although the earned income of SE workers rises,
the workers face cuts in government transfers and increased housing costs.”65
However, a longer-term
evaluation of the impact of FOC services may find that net income increases at a faster rate over the
medium and long term.
Effects of Providing a Full Bundle of FOC Services to All Jobless Clients
Some program observers and funders believe in the value of a full bundle of FOC services, and even
believe that a full bundle is superior to any other possible services combination. According to the
descriptive statistics in tables 32 and 34, clients vary substantially in how likely they are to receive the
full bundle, but most clients receive a partial bundle of services. While the results in tables 32 and 34
directly address the research question – how the benefits of FOC services compare to the costs of
providing these services – the remainder of this section assesses a different but related question: What
would the effect be if all jobless clients received the full bundle of all three FOC services, instead of the
partial bundle of services they actually received?
The results below show that for certain types of outcomes, even after controlling for different client
types and locations, a full bundle of FOC services may not convey a benefit relative to costs that are
superior to other combinations of services. These results use the cost-benefit methodology developed
above to calculate the potential net benefits of providing all three FOC services to all enrolled clients
who were jobless at intake. Like the results presented earlier, where the comparison group was selected
from respondents to the SIPP, these results are limited by the scope of the analysis: we are only
considering short-term benefits to jobless clients who have data available for the key financial
outcomes. Despite these limitations, the results presented below suggest that offering additional FOC
services to certain clients can be a cost-effective strategy, even in the short term.
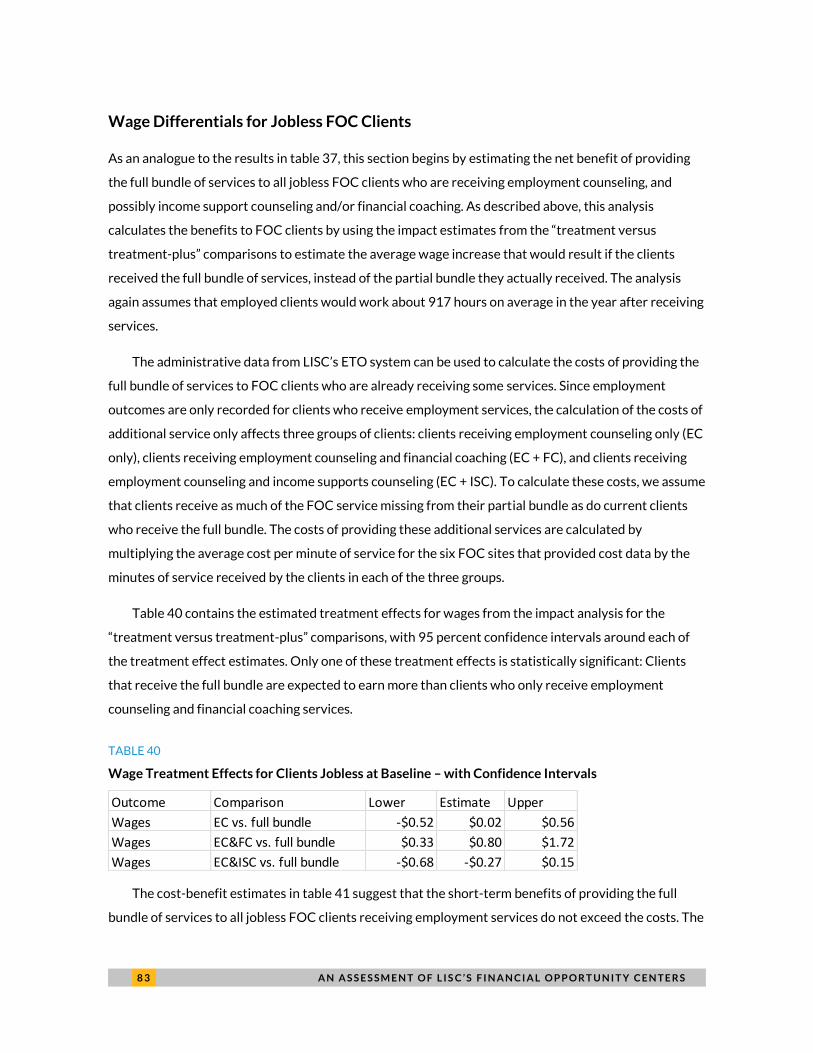
8 3 A N A S S E S S M E N T O F L I S C ’ S F I N A N C I A L O P P O R T U N I T Y C E N T E R S
Wage Differentials for Jobless FOC Clients
As an analogue to the results in table 37, this section begins by estimating the net benefit of providing
the full bundle of services to all jobless FOC clients who are receiving employment counseling, and
possibly income support counseling and/or financial coaching. As described above, this analysis
calculates the benefits to FOC clients by using the impact estimates from the “treatment versus
treatment-plus” comparisons to estimate the average wage increase that would result if the clients
received the full bundle of services, instead of the partial bundle they actually received. The analysis
again assumes that employed clients would work about 917 hours on average in the year after receiving
services.
The administrative data from LISC’s ETO system can be used to calculate the costs of providing the
full bundle of services to FOC clients who are already receiving some services. Since employment
outcomes are only recorded for clients who receive employment services, the calculation of the costs of
additional service only affects three groups of clients: clients receiving employment counseling only (EC
only), clients receiving employment counseling and financial coaching (EC + FC), and clients receiving
employment counseling and income supports counseling (EC + ISC). To calculate these costs, we assume
that clients receive as much of the FOC service missing from their partial bundle as do current clients
who receive the full bundle. The costs of providing these additional services are calculated by
multiplying the average cost per minute of service for the six FOC sites that provided cost data by the
minutes of service received by the clients in each of the three groups.
Table 40 contains the estimated treatment effects for wages from the impact analysis for the
“treatment versus treatment-plus” comparisons, with 95 percent confidence intervals around each of
the treatment effect estimates. Only one of these treatment effects is statistically significant: Clients
that receive the full bundle are expected to earn more than clients who only receive employment
counseling and financial coaching services.
TABLE 40
Wage Treatment Effects for Clients Jobless at Baseline – with Confidence Intervals
The cost-benefit estimates in table 41 suggest that the short-term benefits of providing the full
bundle of services to all jobless FOC clients receiving employment services do not exceed the costs. The
Outcome Comparison Lower Estimate Upper
Wages EC vs. full bundle -$0.52 $0.02 $0.56
Wages EC&FC vs. full bundle $0.33 $0.80 $1.72
Wages EC&ISC vs. full bundle -$0.68 -$0.27 $0.15
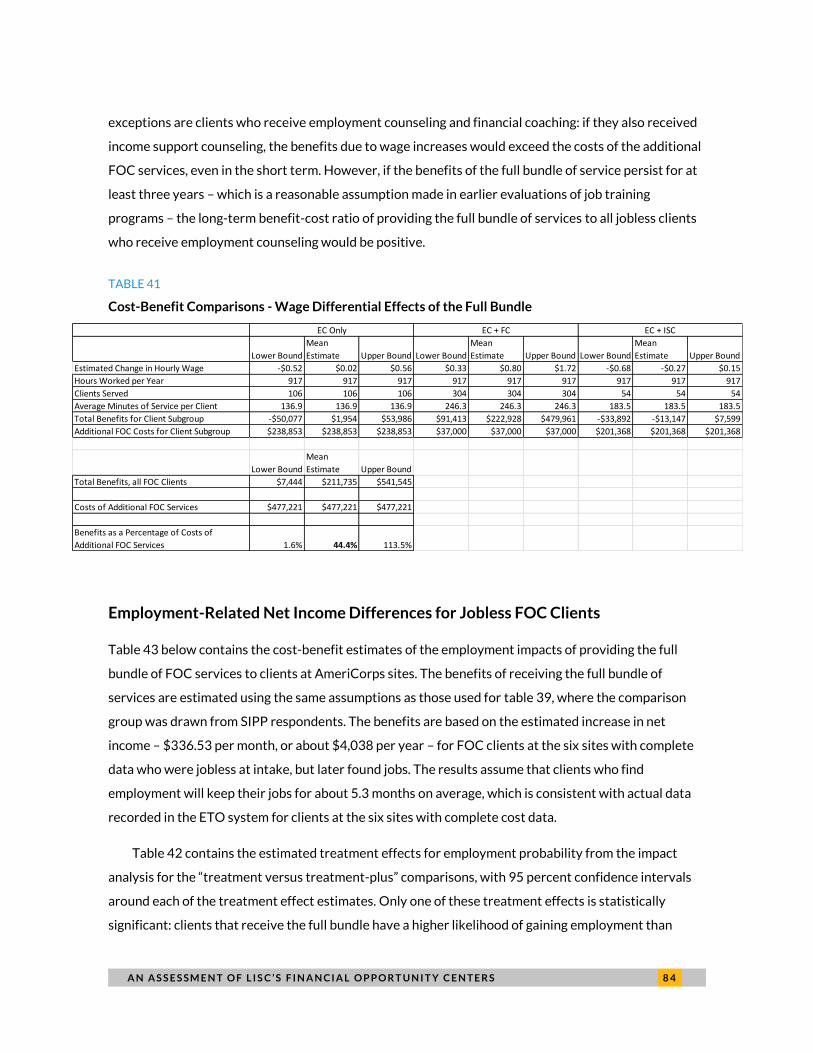
A N A S S E S S M E N T O F L I S C ’ S F I N A N C I A L O P P O R T U N I T Y C E N T E R S 8 4
exceptions are clients who receive employment counseling and financial coaching: if they also received
income support counseling, the benefits due to wage increases would exceed the costs of the additional
FOC services, even in the short term. However, if the benefits of the full bundle of service persist for at
least three years – which is a reasonable assumption made in earlier evaluations of job training
programs – the long-term benefit-cost ratio of providing the full bundle of services to all jobless clients
who receive employment counseling would be positive.
TABLE 41
Cost-Benefit Comparisons - Wage Differential Effects of the Full Bundle
Employment-Related Net Income Differences for Jobless FOC Clients
Table 43 below contains the cost-benefit estimates of the employment impacts of providing the full
bundle of FOC services to clients at AmeriCorps sites. The benefits of receiving the full bundle of
services are estimated using the same assumptions as those used for table 39, where the comparison
group was drawn from SIPP respondents. The benefits are based on the estimated increase in net
income – $336.53 per month, or about $4,038 per year – for FOC clients at the six sites with complete
data who were jobless at intake, but later found jobs. The results assume that clients who find
employment will keep their jobs for about 5.3 months on average, which is consistent with actual data
recorded in the ETO system for clients at the six sites with complete cost data.
Table 42 contains the estimated treatment effects for employment probability from the impact
analysis for the “treatment versus treatment-plus” comparisons, with 95 percent confidence intervals
around each of the treatment effect estimates. Only one of these treatment effects is statistically
significant: clients that receive the full bundle have a higher likelihood of gaining employment than
Lower Bound
Mean
Estimate Upper Bound Lower Bound
Mean
Estimate Upper Bound Lower Bound
Mean
Estimate Upper Bound
Estimated Change in Hourly Wage -$0.52 $0.02 $0.56 $0.33 $0.80 $1.72 -$0.68 -$0.27 $0.15
Hours Worked per Year 917 917 917 917 917 917 917 917 917
Clients Served 106 106 106 304 304 304 54 54 54
Average Minutes of Service per Client 136.9 136.9 136.9 246.3 246.3 246.3 183.5 183.5 183.5
Total Benefits for Client Subgroup -$50,077 $1,954 $53,986 $91,413 $222,928 $479,961 -$33,892 -$13,147 $7,599
Additional FOC Costs for Client Subgroup $238,853 $238,853 $238,853 $37,000 $37,000 $37,000 $201,368 $201,368 $201,368
Lower Bound
Mean
Estimate Upper Bound
Total Benefits, all FOC Clients $7,444 $211,735 $541,545
Costs of Additional FOC Services $477,221 $477,221 $477,221
Benefits as a Percentage of Costs of
Additional FOC Services 1.6% 44.4% 113.5%
EC Only EC + FC EC + ISC
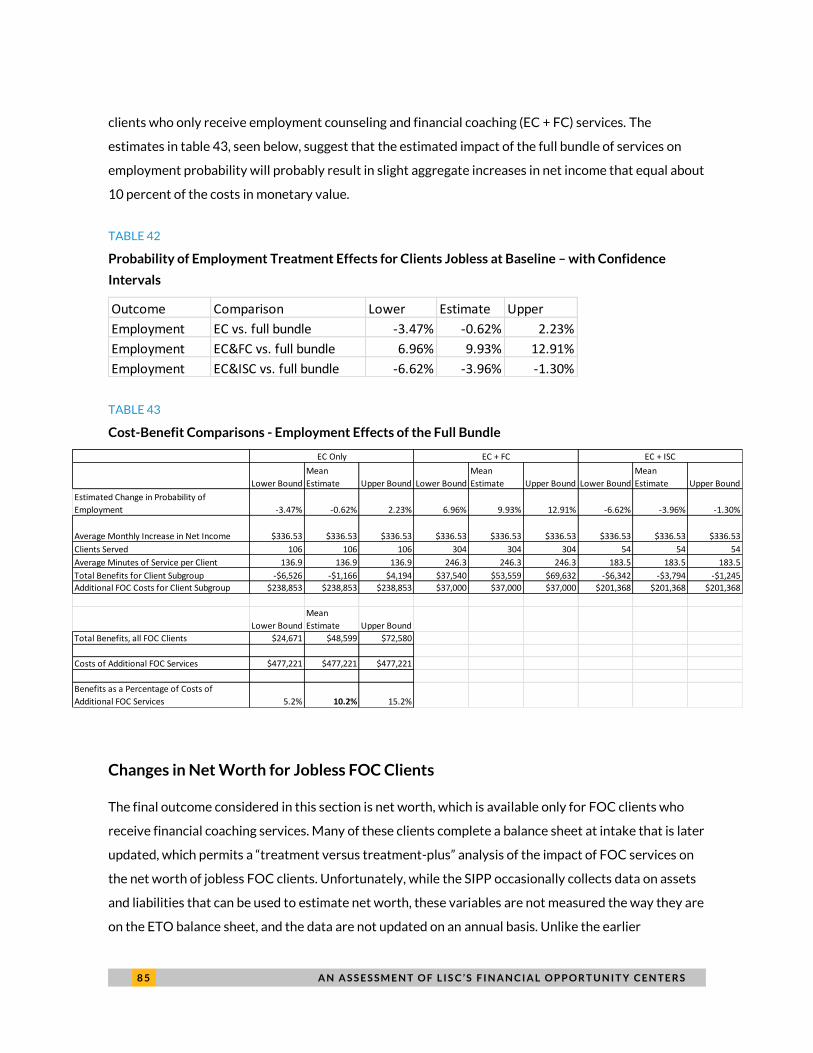
8 5 A N A S S E S S M E N T O F L I S C ’ S F I N A N C I A L O P P O R T U N I T Y C E N T E R S
clients who only receive employment counseling and financial coaching (EC + FC) services. The
estimates in table 43, seen below, suggest that the estimated impact of the full bundle of services on
employment probability will probably result in slight aggregate increases in net income that equal about
10 percent of the costs in monetary value.
TABLE 42
Probability of Employment Treatment Effects for Clients Jobless at Baseline – with Confidence
Intervals
TABLE 43
Cost-Benefit Comparisons - Employment Effects of the Full Bundle
Changes in Net Worth for Jobless FOC Clients
The final outcome considered in this section is net worth, which is available only for FOC clients who
receive financial coaching services. Many of these clients complete a balance sheet at intake that is later
updated, which permits a “treatment versus treatment-plus” analysis of the impact of FOC services on
the net worth of jobless FOC clients. Unfortunately, while the SIPP occasionally collects data on assets
and liabilities that can be used to estimate net worth, these variables are not measured the way they are
on the ETO balance sheet, and the data are not updated on an annual basis. Unlike the earlier
Outcome Comparison Lower Estimate Upper
Employment EC vs. full bundle -3.47% -0.62% 2.23%
Employment EC&FC vs. full bundle 6.96% 9.93% 12.91%
Employment EC&ISC vs. full bundle -6.62% -3.96% -1.30%
Lower Bound
Mean
Estimate Upper Bound Lower Bound
Mean
Estimate Upper Bound Lower Bound
Mean
Estimate Upper Bound
Estimated Change in Probability of
Employment -3.47% -0.62% 2.23% 6.96% 9.93% 12.91% -6.62% -3.96% -1.30%
Average Monthly Increase in Net Income $336.53 $336.53 $336.53 $336.53 $336.53 $336.53 $336.53 $336.53 $336.53
Clients Served 106 106 106 304 304 304 54 54 54
Average Minutes of Service per Client 136.9 136.9 136.9 246.3 246.3 246.3 183.5 183.5 183.5
Total Benefits for Client Subgroup -$6,526 -$1,166 $4,194 $37,540 $53,559 $69,632 -$6,342 -$3,794 -$1,245
Additional FOC Costs for Client Subgroup $238,853 $238,853 $238,853 $37,000 $37,000 $37,000 $201,368 $201,368 $201,368
Lower Bound
Mean
Estimate Upper Bound
Total Benefits, all FOC Clients $24,671 $48,599 $72,580
Costs of Additional FOC Services $477,221 $477,221 $477,221
Benefits as a Percentage of Costs of
Additional FOC Services 5.2% 10.2% 15.2%
EC Only EC + FC EC + ISC
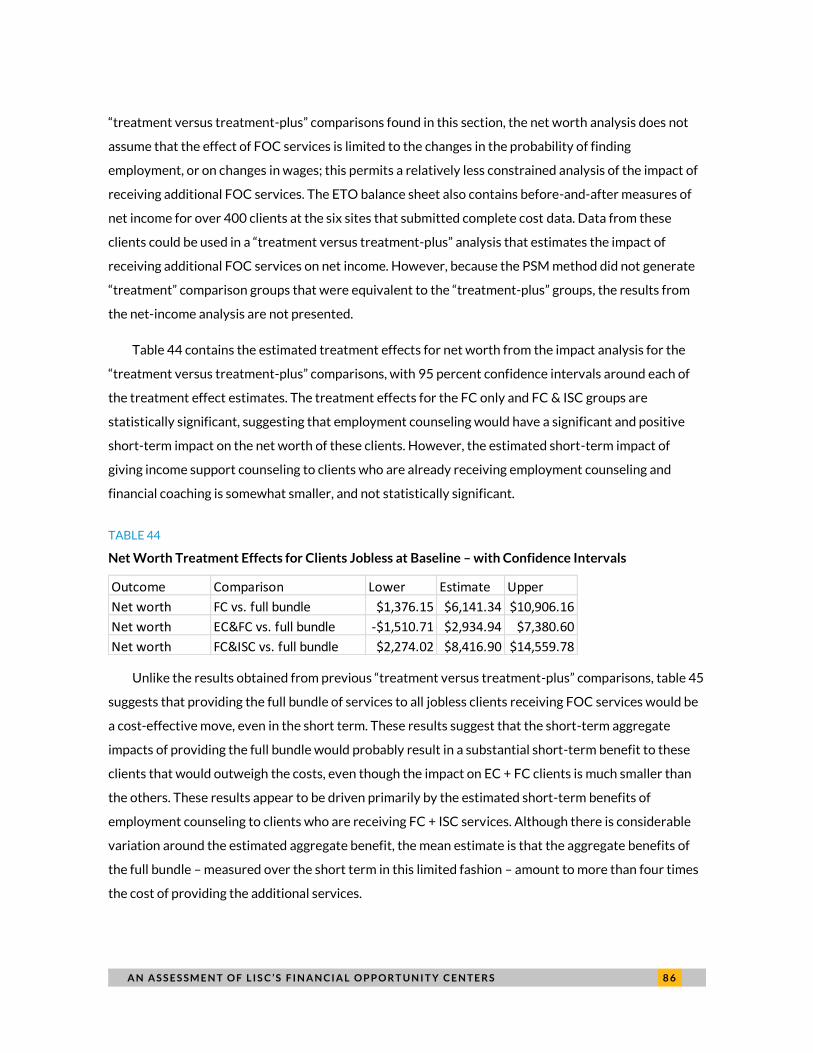
A N A S S E S S M E N T O F L I S C ’ S F I N A N C I A L O P P O R T U N I T Y C E N T E R S 8 6
“treatment versus treatment-plus” comparisons found in this section, the net worth analysis does not
assume that the effect of FOC services is limited to the changes in the probability of finding
employment, or on changes in wages; this permits a relatively less constrained analysis of the impact of
receiving additional FOC services. The ETO balance sheet also contains before-and-after measures of
net income for over 400 clients at the six sites that submitted complete cost data. Data from these
clients could be used in a “treatment versus treatment-plus” analysis that estimates the impact of
receiving additional FOC services on net income. However, because the PSM method did not generate
“treatment” comparison groups that were equivalent to the “treatment-plus” groups, the results from
the net-income analysis are not presented.
Table 44 contains the estimated treatment effects for net worth from the impact analysis for the
“treatment versus treatment-plus” comparisons, with 95 percent confidence intervals around each of
the treatment effect estimates. The treatment effects for the FC only and FC & ISC groups are
statistically significant, suggesting that employment counseling would have a significant and positive
short-term impact on the net worth of these clients. However, the estimated short-term impact of
giving income support counseling to clients who are already receiving employment counseling and
financial coaching is somewhat smaller, and not statistically significant.
TABLE 44
Net Worth Treatment Effects for Clients Jobless at Baseline – with Confidence Intervals
Unlike the results obtained from previous “treatment versus treatment-plus” comparisons, table 45
suggests that providing the full bundle of services to all jobless clients receiving FOC services would be
a cost-effective move, even in the short term. These results suggest that the short-term aggregate
impacts of providing the full bundle would probably result in a substantial short-term benefit to these
clients that would outweigh the costs, even though the impact on EC + FC clients is much smaller than
the others. These results appear to be driven primarily by the estimated short-term benefits of
employment counseling to clients who are receiving FC + ISC services. Although there is considerable
variation around the estimated aggregate benefit, the mean estimate is that the aggregate benefits of
the full bundle – measured over the short term in this limited fashion – amount to more than four times
the cost of providing the additional services.
Outcome Comparison Lower Estimate Upper
Net worth FC vs. full bundle $1,376.15 $6,141.34 $10,906.16
Net worth EC&FC vs. full bundle -$1,510.71 $2,934.94 $7,380.60
Net worth FC&ISC vs. full bundle $2,274.02 $8,416.90 $14,559.78
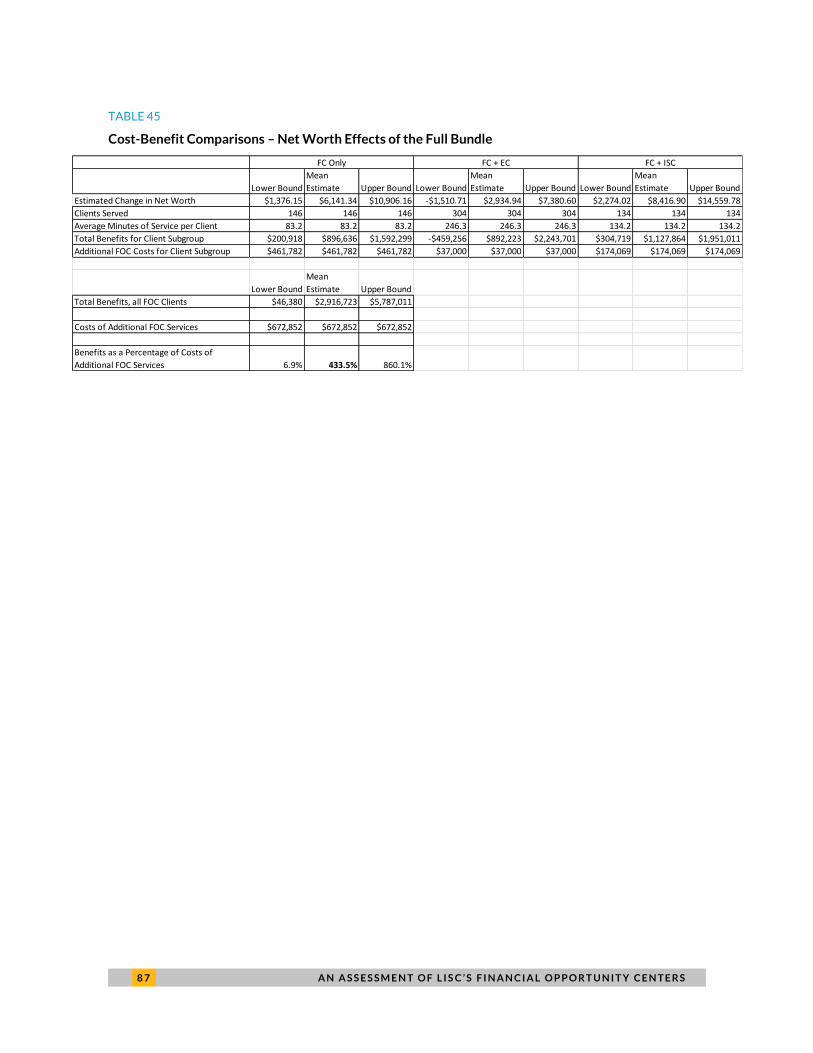
8 7 A N A S S E S S M E N T O F L I S C ’ S F I N A N C I A L O P P O R T U N I T Y C E N T E R S
TABLE 45
Cost-Benefit Comparisons – Net Worth Effects of the Full Bundle
Lower Bound
Mean
Estimate Upper Bound Lower Bound
Mean
Estimate Upper Bound Lower Bound
Mean
Estimate Upper Bound
Estimated Change in Net Worth $1,376.15 $6,141.34 $10,906.16 -$1,510.71 $2,934.94 $7,380.60 $2,274.02 $8,416.90 $14,559.78
Clients Served 146 146 146 304 304 304 134 134 134
Average Minutes of Service per Client 83.2 83.2 83.2 246.3 246.3 246.3 134.2 134.2 134.2
Total Benefits for Client Subgroup $200,918 $896,636 $1,592,299 -$459,256 $892,223 $2,243,701 $304,719 $1,127,864 $1,951,011
Additional FOC Costs for Client Subgroup $461,782 $461,782 $461,782 $37,000 $37,000 $37,000 $174,069 $174,069 $174,069
Lower Bound
Mean
Estimate Upper Bound
Total Benefits, all FOC Clients $46,380 $2,916,723 $5,787,011
Costs of Additional FOC Services $672,852 $672,852 $672,852
Benefits as a Percentage of Costs of
Additional FOC Services 6.9% 433.5% 860.1%
FC Only FC + EC FC + ISC
A N A S S E S S M E N T O F L I S C ’ S F I N A N C I A L O P P O R T U N I T Y C E N T E R S 8 8
Conclusions and Recommendations LISC has been at the forefront of a national network of organizations working to promote integrated
delivery to promote financial capability. For over ten years, LISC has built and operated a network of
Financial Opportunity Centers (FOCs). FOCs are employment/career and personal financial service
centers that help low-to-moderate income individuals achieve financial stability through changes in
financial behavior that lead to increased income, improved credit, and asset-building. The distinctive
feature of LISC’s integrated service delivery model is that employment counseling, financial coaching,
and income support counseling services are presented to clients as a “bundle” rather than delivered
individually.
LISC recently published a report that showed that clients who received a bundle of services tended
to experience better outcomes than clients who receive only one of these services – and that clients
who received the complete bundle of all three services experienced the best outcomes of all. This report
led to two followup questions: Do the services provided by LISC AmeriCorps members placed in Financial
Opportunity Centers help produce positive benefits to the clients they serve relative to those who do not receive
services? and What does it cost to supply FOC services relative to any public sector cost savings that accrue due
to reduced public program participation? This study, conducted by the Urban Institute to satisfy the
AmeriCorps evaluation requirement, addresses both of these questions.
The report suggests that LISC’s AmeriCorps FOC sites seem to vary in the composition of their
client population, and in how they administer FOC services to clients. For instance, the sites varied
substantially in how often their clients received the full bundle of all three FOC services. A consistent
theme that emerged throughout interview with site staff is that FOC clients define the goals they wish
to prioritize and work with FOC staff to obtain services that meet their needs for as long as they desire.
The client-driven approach described in the interviews suggests FOCs are designed to be less
restrictive and burdensome on clients. Yet, the dosage and duration of services could influence the
extent to which clients change behaviors and achieve positive outcomes.
To address the first research question, the team produced a number of impact estimates to discover
whether clients who receive FOC services are more likely to experience positive outcomes, or to derive
greater economic benefits, compared to others who do not receive these services. Propensity score
matching (PSM) is used to form comparison groups that are similar to FOC clients, to control for other
factors that might be responsible for the short-term changes observed in the data. We used comparison
groups drawn from other data sources – namely, the Survey of Income and Program Participation and a

8 9 A N A S S E S S M E N T O F L I S C ’ S F I N A N C I A L O P P O R T U N I T Y C E N T E R S
database provided by the credit bureau that contains credit scores– to estimate the impacts of
receiving FOC services. A second set of impact estimates, also calculated using PSM, illustrate the
impact of providing additional services to FOC clients who are already receiving partial bundles of
service. The results suggest that adding employment counseling to the bundle of services received by
jobless clients tends to result in positive outcomes for clients who are already receiving financial
coaching, and that offering financial coaching to clients who are already receiving employment
counseling is also associated with positive outcomes in many cases. The short-term impact of FOC
services on credit outcomes is less clear, both because longer-term impacts are not measured and
because data on credit outcomes are only collected from clients who receive financial coaching.
To address the second research question, the project team combined the impact estimates for
economic outcomes from the previous section with cost data, collected directly from the FOC sites, in
order to compare the benefits of FOC services to the costs of providing those services. Six AmeriCorps
sites provided data on the costs of providing FOC services, data that are not available from any other
source. The cost data were used to create unit costs of FOC services (FOC costs per minute of service
received) for each type of service for each of the six sites. These unit costs were used to compute the
dependent variable for a multivariate client-level analysis of the total cost of service received by clients.
The results of this multivariate analysis suggest that the amount of resources that sites devote to clients
depends on the characteristics of the client; the mix of FOC services clients receive, which are likely
influenced by the client’s circumstances; and site-specific characteristics, including unit costs and other
program-specific and site-specific characteristics that are not directly measured.
The second research question asks about the comparison between the costs of providing FOC
services and the benefits, as measured by the public sector cost savings that result from providing FOC
services to clients. These cost savings could not be addressed directly because of data limitations:
although site staff use the ETO system to record the client’s receipt of income supports at intake, this
information is missing for many clients and is not consistently updated. Despite these data limitations,
the team was able to compare benefits and costs of FOC services by focusing on client outcomes. The
analysis was limited in scope: the focus was on short-term benefits to clients who were jobless at intake.
The cost-benefit analysis involved comparisons the costs of the FOC services that clients received
(calculated as cost per minute times the minutes of service received by clients) with the benefits of
these services, which were quantified and calculated from the PSM impact estimates and data-driven
assumptions about the benefits of gaining employment.
The analysis that addresses the second research question focuses on employment-related wage
differentials, changes in net income from employment, and changes in net worth. All three are key
A N A S S E S S M E N T O F L I S C ’ S F I N A N C I A L O P P O R T U N I T Y C E N T E R S 9 0
economic outcomes tracked by LISC to measure the impact of FOC services, and serve as outcomes for
the benefit-cost comparisons. According to the results, jobless clients who receive FOC services
experience positive employment-related short-term benefits, relative to a comparison group that is
drawn via PSM from SIPP respondents. The results show that the short-term wage changes associated
with the receipt of FOC services, relative to the SIPP comparison group, exceed the costs of delivering
the services. The results also show that FOC clients at LISC’s AmeriCorps sites are likely to experience
short-term increases in net income, which is a stepping stone to wealth accumulation. The section
concludes with an assessment of the impact of mandating that all jobless clients who receive partial
bundles of service receive the full bundle instead. Although this strategy has never been recommended
by LISC, the results of this analysis are suggest that giving the full bundle to all jobless clients may not be
more cost-effective than providing the full bundle to some jobless clients and partial bundles to others.
Overall, the results shed light on the extent to which FOC clients benefit from FOC services,
compared to the costs of providing these services. However, the process of collecting, cleaning and
processing the data revealed several issues that placed limitations on the analysis. The biggest
limitation to the analysis is the fact that LISC coaches do not capture data on all economic outcomes for
all clients. For instance, data on employment status and wages are only captured for clients who receive
employment counseling services, and data on net income, net worth and credit scores are only collected
from financial coaching clients. This requires analysts to exclude about a third of all clients from each
analysis, and prevents them from using administrative data to estimate the benefits of receiving each
type of service. If, as has been recommended,66
financial coaching programs adopt national
performance measures, analysts would gain the ability to use outcome data to compare the
effectiveness of LISC’s program outcomes with outcome data from other clients. Although the
collection of national performance measures for all clients would represent an increase in burden on
FOC clients and sites, the benefits of standardized performance measures would benefit LISC and other
FOC-like programs that promote the delivery of integrated services.
The project team also noticed irregularities in the ETO data, such as missing data on minutes of
service provided by coaches, and missing follow-up data for some participants. While the team used
imputations to account for this problem, we did not conduct systematic analysis of the data to detect
patterns in the incidence of missing data. However, site staff who participated in interviews with site
staff often expressed challenges with data collection and quality. As noted earlier, most FOCs have
multiple staff entering information, which can produce inconsistencies and challenges to ensuring data
quality. Sites also have problems collecting client follow-up data, due to limitations on staff resources
that can be dedicated to tracking down former clients. LISC is aware of both issues, and has offered
9 1 A N A S S E S S M E N T O F L I S C ’ S F I N A N C I A L O P P O R T U N I T Y C E N T E R S
guidance to sites about effective practices in collecting followup data and ensuring data integrity.67
Improvements in these areas would allow LISC to capitalize on the opportunity to follow up on this
analysis – and also on the SIF evaluation conducted by Economic Mobility – to learn more about the
long-term impacts of FOC services on wealth building and credit.
The FOC cost data were essential to the analysis, but the process of data collection should be
further integrated into the management of the program. In order to better understand program costs
by site, Urban researchers requested cost data from FOC sites using a standardized spreadsheet for
budget information. Urban researchers also received ETO data from LISC, including the number of
minutes per client spent by each site on each FOC service component. Program cost and ETO data were
then analyzed to determine FOC costs by budget category and FOC costs per client per minute. This
data collection strategy has a couple of limitations: the program cost data is self-reported by sites and
not vetted against actual financial records or budgets and data was not reported uniformly and
completely across sites. Lessons learned from this study can inform future cost studies.
In order to conduct future cost studies, researchers will require access to data documenting the
type, quantity, and cost of services received by clients at each FOC site. This includes both FOC and
non-FOC services in sites with multiple and co-located programming. The quality of any cost analysis
will depend on the research team’s ability to obtain all this information and the quality of the data
received from the sites. However, sites can be expected to question and resist full access to their cost
data, particularly salaries and other expenditures, over concerns of confidentiality and additional
burden on staff members. LISC and the research team can allay these concerns by underscoring the
value of cost analysis and by working closely with sites to determine ways to reduce burden on staff
members while gathering reliable and quality information.
LISC should work in tandem with the research team to explain how sites will be able to use cost
analysis as a tool to gauge their own progress at managing costs and optimizing resources. They will be
able to estimate the cost of implementing and sustaining FOCs, costs for specific FOC components, and
costs per individual. If they have other programs and services, sites will be able to see how their FOC
services relate to these other programs and services. Cost analysis can also establish a foundation for
other types of financial analysis, such as resource allocation. For example, estimating the cost of
program management in relation to program delivery can prompt a site to understand how personnel
and resources are allocated and to make strategic decisions about its budget. Moreover, understanding
the trajectory of how costs change over time can provide important insight into areas where efficiency
gains have been realized, as well as areas where costs are permanently fixed.
A N A S S E S S M E N T O F L I S C ’ S F I N A N C I A L O P P O R T U N I T Y C E N T E R S 9 2
It is recommended that future cost studies have two stages. First, the research team should conduct
site visits at each site during which they will meet with program managers, mid-level staff, and frontline
staff to better understand how FOC service components and other services are delivered and at what
cost. Interview protocols will include questions about service and client mix, resource and time
allocation, and other details not captured in a standardized budget spreadsheet. The research team will
take the opportunity to address any concerns and questions sites might have about sharing cost data.
The team should also conduct focus groups of FOC program participants to learn how they utilize FOC
services. This first step is crucial to learning what it takes to deliver all the programs and services at
each site and how FOC services fit into the mix. It will enable the research team to estimate the
percentage costs allocated to FOC component services as well as the percentage costs of
administrative and overhead costs at each site. It will allow sites to corroborate these estimates. Face-
to-face interactions will also build relationships and trust between the research team and the sites.
After the site visits, the team will tailor cost data spreadsheets for each site, taking into account what
was learned during the site visits. The team should take a “bottom-up” approach to developing the
spreadsheet and estimating costs, in which sites provide feedback and data during the process.
9 3 A P P E N D I X A
Appendix A. Interview Protocol Interview Protocol – Organizational Leadership
Purpose of the Study
Good __________, I am __________ and this is my colleague, __________. We are researchers from the Urban
Institute, a private, nonprofit research organization based in Washington, DC, which conducts policy-
related research on a variety of social welfare and economic issues. We are interested in talking with
you today about Local Initiative Support Corporation’s (LISC) Financial Opportunity Center (FOC)
Model. The Urban Institute is under contract to LISC to conduct an assessment the work that
AmeriCorps members perform at LISC FOC affiliates.
We want to thank you for agreeing to participate in the study. We know that you are busy and we will
be as focused as possible. We also want to make sure you know that this is not a “good-bad” kind of
assessment. Our aim is to learn from your experiences and better understand how the FOC model is
implemented by your organization.
Confidentiality Statement/Informed Consent
Your participation in this discussion is voluntary and you may choose not to answer questions you do
not wish to. We also want to let you know that we will be taking notes and – with your permission –
recording this interview. The recording will only be used as back-up for our notes and will be destroyed
at the termination of the project. Are you comfortable with this interview being recorded?
Please be assured that information that identifies you or any other respondent by name is never shared
outside of our evaluation team. When we write our reports and discuss our findings, we will present
information aggregated from across our interviews from your site in order to shield the identities of
individual interviewees, such as yourself. However, if you are in a position that makes it so that you are
the only person who could know a certain piece of information, it is possible someone reading our report
might infer the source of the information. We will make every effort to avoid this, but you should be
aware of the possibility. We also ask that you refrain from sharing anything we discuss today with
others to help us ensure confidentiality.
Do you have any questions before we begin?
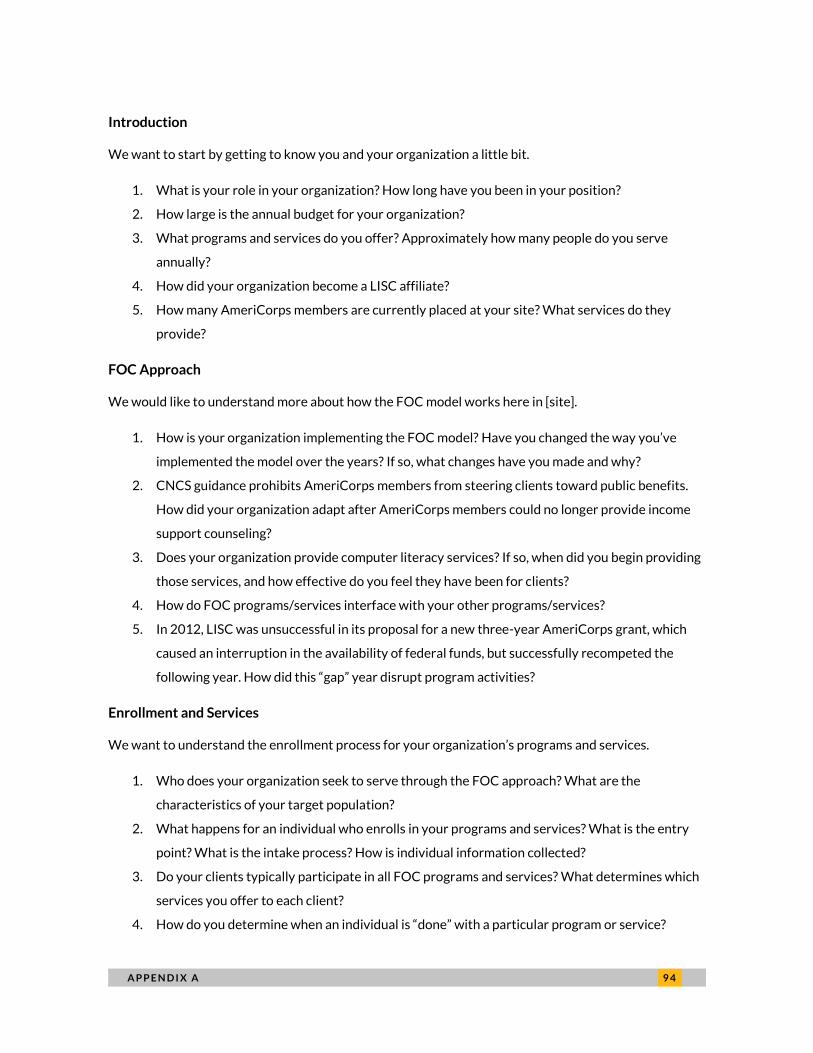
A P P E N D I X A 9 4
Introduction
We want to start by getting to know you and your organization a little bit.
1. What is your role in your organization? How long have you been in your position?
2. How large is the annual budget for your organization?
3. What programs and services do you offer? Approximately how many people do you serve
annually?
4. How did your organization become a LISC affiliate?
5. How many AmeriCorps members are currently placed at your site? What services do they
provide?
FOC Approach
We would like to understand more about how the FOC model works here in [site].
1. How is your organization implementing the FOC model? Have you changed the way you’ve
implemented the model over the years? If so, what changes have you made and why?
2. CNCS guidance prohibits AmeriCorps members from steering clients toward public benefits.
How did your organization adapt after AmeriCorps members could no longer provide income
support counseling?
3. Does your organization provide computer literacy services? If so, when did you begin providing
those services, and how effective do you feel they have been for clients?
4. How do FOC programs/services interface with your other programs/services?
5. In 2012, LISC was unsuccessful in its proposal for a new three-year AmeriCorps grant, which
caused an interruption in the availability of federal funds, but successfully recompeted the
following year. How did this “gap” year disrupt program activities?
Enrollment and Services
We want to understand the enrollment process for your organization’s programs and services.
1. Who does your organization seek to serve through the FOC approach? What are the
characteristics of your target population?
2. What happens for an individual who enrolls in your programs and services? What is the entry
point? What is the intake process? How is individual information collected?
3. Do your clients typically participate in all FOC programs and services? What determines which
services you offer to each client?
4. How do you determine when an individual is “done” with a particular program or service?

9 5 A P P E N D I X A
5. How do you follow up with clients that have found jobs or stopped receiving services? How
effective is the follow-up process, and what would make follow-up easier and more effective?
Closing
1. Is there anything else about the FOC approach you’d like to tell us, which we did not ask?
2. If we think of additional questions later, can we reach out to you?
Thank you!
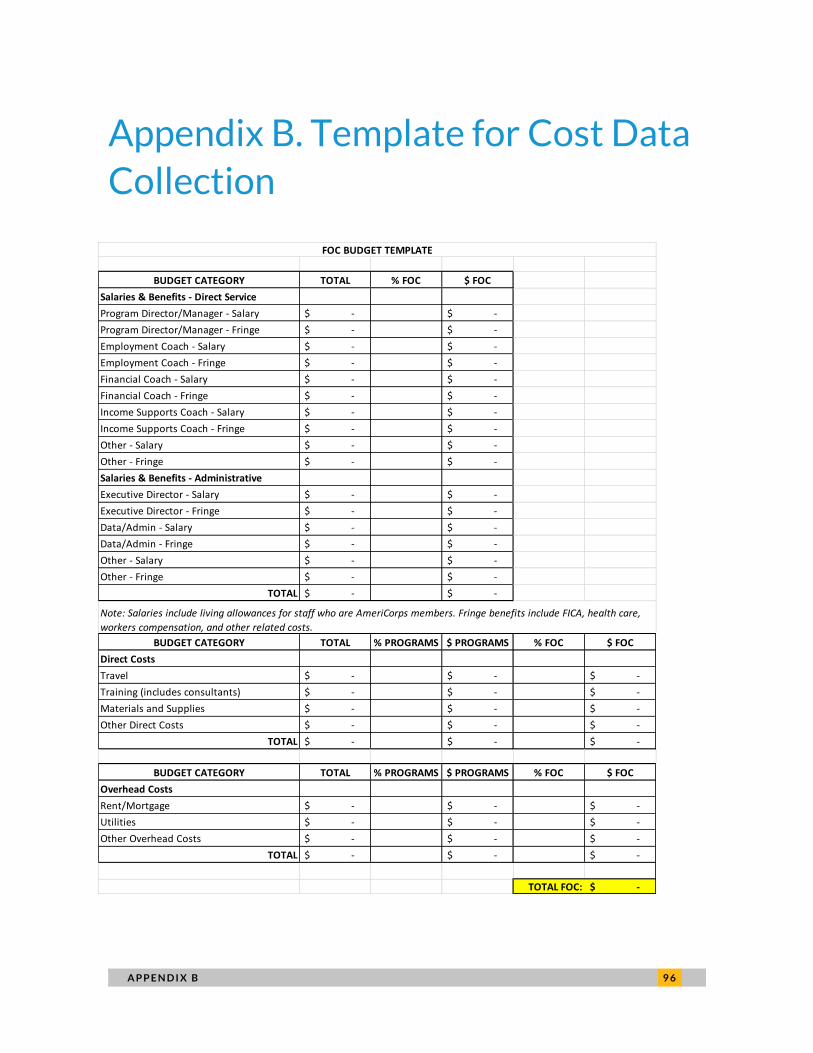
A P P E N D I X B 9 6
Appendix B. Template for Cost Data
Collection
BUDGET CATEGORY TOTAL % FOC $ FOC
Salaries & Benefits - Direct Service
Program Director/Manager - Salary -$ -$
Program Director/Manager - Fringe -$ -$
Employment Coach - Salary -$ -$
Employment Coach - Fringe -$ -$
Financial Coach - Salary -$ -$
Financial Coach - Fringe -$ -$
Income Supports Coach - Salary -$ -$
Income Supports Coach - Fringe -$ -$
Other - Salary -$ -$
Other - Fringe -$ -$
Salaries & Benefits - Administrative
Executive Director - Salary -$ -$
Executive Director - Fringe -$ -$
Data/Admin - Salary -$ -$
Data/Admin - Fringe -$ -$
Other - Salary -$ -$
Other - Fringe -$ -$
TOTAL -$ -$
BUDGET CATEGORY TOTAL % PROGRAMS $ PROGRAMS % FOC $ FOC
Direct Costs
Travel -$ -$ -$
Training (includes consultants) -$ -$ -$
Materials and Supplies -$ -$ -$
Other Direct Costs -$ -$ -$
TOTAL -$ -$ -$
BUDGET CATEGORY TOTAL % PROGRAMS $ PROGRAMS % FOC $ FOC
Overhead Costs
Rent/Mortgage -$ -$ -$
Utilities -$ -$ -$
Other Overhead Costs -$ -$ -$
TOTAL -$ -$ -$
TOTAL FOC: -$
FOC BUDGET TEMPLATE
Note: Salaries include living allowances for staff who are AmeriCorps members. Fringe benefits include FICA, health care,
workers compensation, and other related costs.
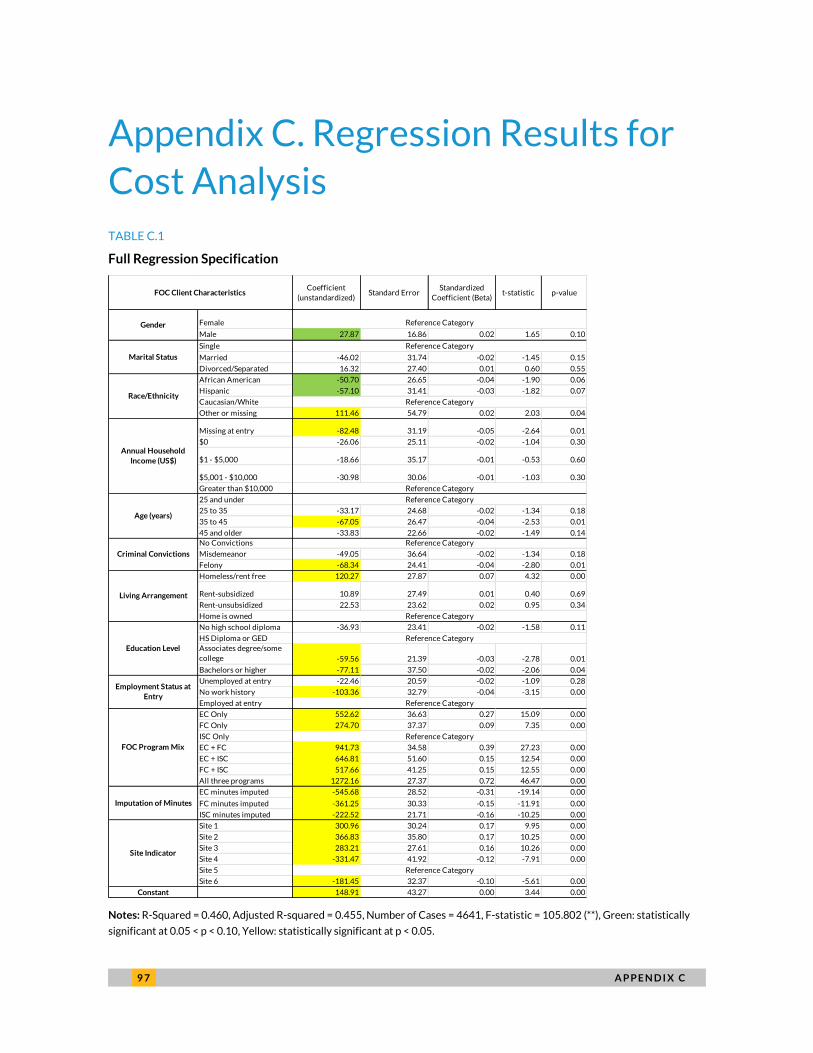
9 7 A P P E N D I X C
Appendix C. Regression Results for
Cost Analysis TABLE C.1
Full Regression Specification
Notes: R-Squared = 0.460, Adjusted R-squared = 0.455, Number of Cases = 4641, F-statistic = 105.802 (**), Green: statistically
significant at 0.05 < p < 0.10, Yellow: statistically significant at p < 0.05.
Coefficient
(unstandardized)Standard Error
Standardized
Coefficient (Beta)t-statistic p-value
Female
Male 27.87 16.86 0.02 1.65 0.10
Single
Married -46.02 31.74 -0.02 -1.45 0.15
Divorced/Separated 16.32 27.40 0.01 0.60 0.55
African American -50.70 26.65 -0.04 -1.90 0.06
Hispanic -57.10 31.41 -0.03 -1.82 0.07
Caucasian/White
Other or missing 111.46 54.79 0.02 2.03 0.04
Missing at entry -82.48 31.19 -0.05 -2.64 0.01
$0 -26.06 25.11 -0.02 -1.04 0.30
$1 - $5,000 -18.66 35.17 -0.01 -0.53 0.60
$5,001 - $10,000 -30.98 30.06 -0.01 -1.03 0.30
Greater than $10,000
25 and under
25 to 35 -33.17 24.68 -0.02 -1.34 0.18
35 to 45 -67.05 26.47 -0.04 -2.53 0.01
45 and older -33.83 22.66 -0.02 -1.49 0.14
No Convictions
Misdemeanor -49.05 36.64 -0.02 -1.34 0.18
Felony -68.34 24.41 -0.04 -2.80 0.01
Homeless/rent free 120.27 27.87 0.07 4.32 0.00
Rent-subsidized 10.89 27.49 0.01 0.40 0.69
Rent-unsubsidized 22.53 23.62 0.02 0.95 0.34
Home is owned
No high school diploma -36.93 23.41 -0.02 -1.58 0.11
HS Diploma or GED
Associates degree/some
college -59.56 21.39 -0.03 -2.78 0.01
Bachelors or higher -77.11 37.50 -0.02 -2.06 0.04
Unemployed at entry -22.46 20.59 -0.02 -1.09 0.28
No work history -103.36 32.79 -0.04 -3.15 0.00
Employed at entry
EC Only 552.62 36.63 0.27 15.09 0.00
FC Only 274.70 37.37 0.09 7.35 0.00
ISC Only
EC + FC 941.73 34.58 0.39 27.23 0.00
EC + ISC 646.81 51.60 0.15 12.54 0.00
FC + ISC 517.66 41.25 0.15 12.55 0.00
All three programs 1272.16 27.37 0.72 46.47 0.00
EC minutes imputed -545.68 28.52 -0.31 -19.14 0.00
FC minutes imputed -361.25 30.33 -0.15 -11.91 0.00
ISC minutes imputed -222.52 21.71 -0.16 -10.25 0.00
Site 1 300.96 30.24 0.17 9.95 0.00
Site 2 366.83 35.80 0.17 10.25 0.00
Site 3 283.21 27.61 0.16 10.26 0.00
Site 4 -331.47 41.92 -0.12 -7.91 0.00
Site 5
Site 6 -181.45 32.37 -0.10 -5.61 0.00
Constant 148.91 43.27 0.00 3.44 0.00
Reference Category
Age (years)
Reference Category
Reference Category
Reference Category
Reference Category
FOC Client Characteristics
Gender
Marital Status
Race/Ethnicity
Annual Household
Income (US$)
Reference Category
Reference Category
FOC Program Mix
Site Indicator
Reference Category
Criminal Convictions
Living Arrangement
Education Level
Employment Status at
Entry
Reference Category
Reference Category
Reference Category
Imputation of Minutes
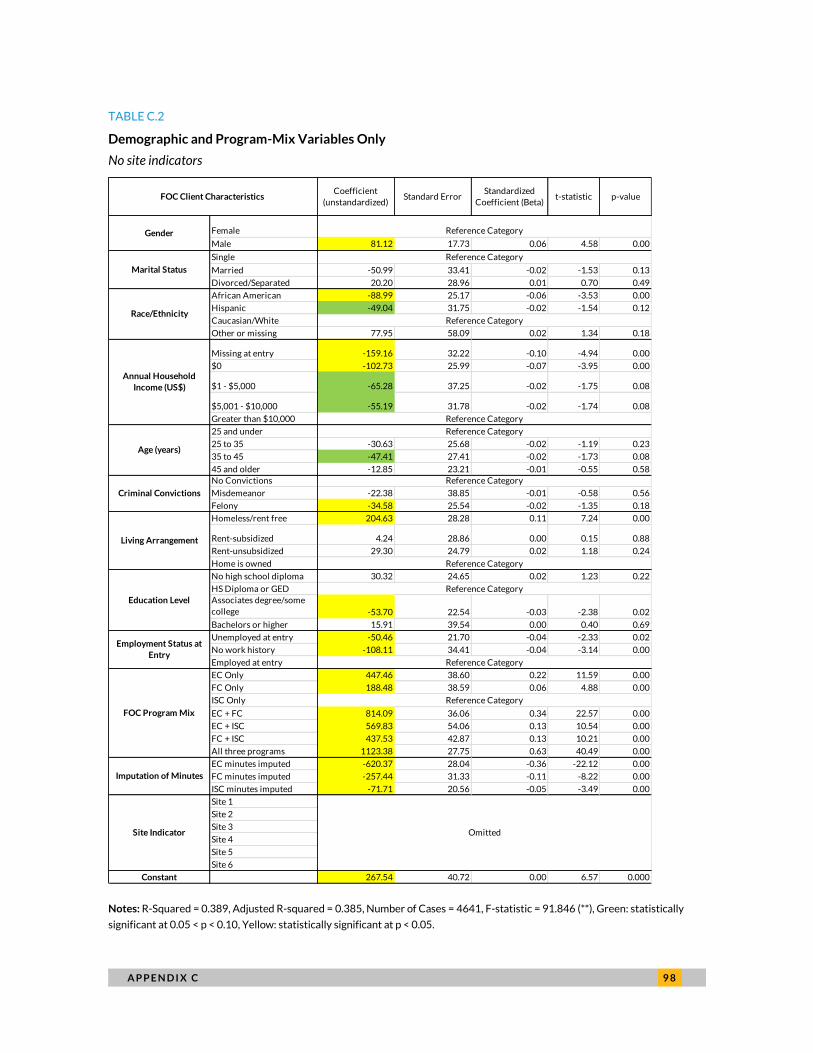
A P P E N D I X C 9 8
TABLE C.2
Demographic and Program-Mix Variables Only
No site indicators
Notes: R-Squared = 0.389, Adjusted R-squared = 0.385, Number of Cases = 4641, F-statistic = 91.846 (**), Green: statistically
significant at 0.05 < p < 0.10, Yellow: statistically significant at p < 0.05.
Coefficient
(unstandardized)Standard Error
Standardized
Coefficient (Beta)t-statistic p-value
Female
Male 81.12 17.73 0.06 4.58 0.00
Single
Married -50.99 33.41 -0.02 -1.53 0.13
Divorced/Separated 20.20 28.96 0.01 0.70 0.49
African American -88.99 25.17 -0.06 -3.53 0.00
Hispanic -49.04 31.75 -0.02 -1.54 0.12
Caucasian/White
Other or missing 77.95 58.09 0.02 1.34 0.18
Missing at entry -159.16 32.22 -0.10 -4.94 0.00
$0 -102.73 25.99 -0.07 -3.95 0.00
$1 - $5,000 -65.28 37.25 -0.02 -1.75 0.08
$5,001 - $10,000 -55.19 31.78 -0.02 -1.74 0.08
Greater than $10,000
25 and under
25 to 35 -30.63 25.68 -0.02 -1.19 0.23
35 to 45 -47.41 27.41 -0.02 -1.73 0.08
45 and older -12.85 23.21 -0.01 -0.55 0.58
No Convictions
Misdemeanor -22.38 38.85 -0.01 -0.58 0.56
Felony -34.58 25.54 -0.02 -1.35 0.18
Homeless/rent free 204.63 28.28 0.11 7.24 0.00
Rent-subsidized 4.24 28.86 0.00 0.15 0.88
Rent-unsubsidized 29.30 24.79 0.02 1.18 0.24
Home is owned
No high school diploma 30.32 24.65 0.02 1.23 0.22
HS Diploma or GED
Associates degree/some
college -53.70 22.54 -0.03 -2.38 0.02
Bachelors or higher 15.91 39.54 0.00 0.40 0.69
Unemployed at entry -50.46 21.70 -0.04 -2.33 0.02
No work history -108.11 34.41 -0.04 -3.14 0.00
Employed at entry
EC Only 447.46 38.60 0.22 11.59 0.00
FC Only 188.48 38.59 0.06 4.88 0.00
ISC Only
EC + FC 814.09 36.06 0.34 22.57 0.00
EC + ISC 569.83 54.06 0.13 10.54 0.00
FC + ISC 437.53 42.87 0.13 10.21 0.00
All three programs 1123.38 27.75 0.63 40.49 0.00
EC minutes imputed -620.37 28.04 -0.36 -22.12 0.00
FC minutes imputed -257.44 31.33 -0.11 -8.22 0.00
ISC minutes imputed -71.71 20.56 -0.05 -3.49 0.00
Site 1
Site 2
Site 3
Site 4
Site 5
Site 6
Constant 267.54 40.72 0.00 6.57 0.000
Reference Category
FOC Client Characteristics
Gender Reference Category
Marital Status
Reference Category
Race/EthnicityReference Category
Criminal Convictions
Education Level
Reference Category
Omitted
Employment Status at
EntryReference Category
FOC Program Mix
Reference Category
Site Indicator
Imputation of Minutes
Annual Household
Income (US$)
Reference Category
Age (years)
Reference Category
Living Arrangement
Reference Category
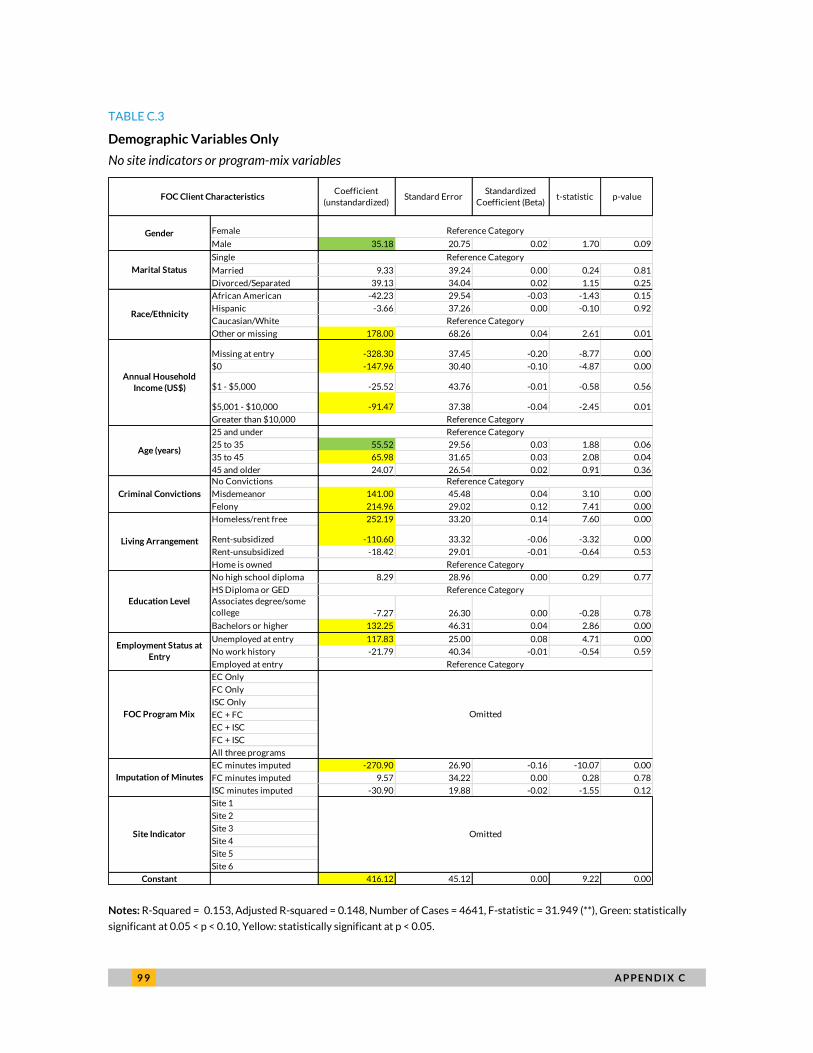
9 9 A P P E N D I X C
TABLE C.3
Demographic Variables Only
No site indicators or program-mix variables
Notes: R-Squared = 0.153, Adjusted R-squared = 0.148, Number of Cases = 4641, F-statistic = 31.949 (**), Green: statistically
significant at 0.05 < p < 0.10, Yellow: statistically significant at p < 0.05.
Coefficient
(unstandardized)Standard Error
Standardized
Coefficient (Beta)t-statistic p-value
Female
Male 35.18 20.75 0.02 1.70 0.09
Single
Married 9.33 39.24 0.00 0.24 0.81
Divorced/Separated 39.13 34.04 0.02 1.15 0.25
African American -42.23 29.54 -0.03 -1.43 0.15
Hispanic -3.66 37.26 0.00 -0.10 0.92
Caucasian/White
Other or missing 178.00 68.26 0.04 2.61 0.01
Missing at entry -328.30 37.45 -0.20 -8.77 0.00
$0 -147.96 30.40 -0.10 -4.87 0.00
$1 - $5,000 -25.52 43.76 -0.01 -0.58 0.56
$5,001 - $10,000 -91.47 37.38 -0.04 -2.45 0.01
Greater than $10,000
25 and under
25 to 35 55.52 29.56 0.03 1.88 0.06
35 to 45 65.98 31.65 0.03 2.08 0.04
45 and older 24.07 26.54 0.02 0.91 0.36
No Convictions
Misdemeanor 141.00 45.48 0.04 3.10 0.00
Felony 214.96 29.02 0.12 7.41 0.00
Homeless/rent free 252.19 33.20 0.14 7.60 0.00
Rent-subsidized -110.60 33.32 -0.06 -3.32 0.00
Rent-unsubsidized -18.42 29.01 -0.01 -0.64 0.53
Home is owned
No high school diploma 8.29 28.96 0.00 0.29 0.77
HS Diploma or GED
Associates degree/some
college -7.27 26.30 0.00 -0.28 0.78
Bachelors or higher 132.25 46.31 0.04 2.86 0.00
Unemployed at entry 117.83 25.00 0.08 4.71 0.00
No work history -21.79 40.34 -0.01 -0.54 0.59
Employed at entry
EC Only
FC Only
ISC Only
EC + FC
EC + ISC
FC + ISC
All three programs
EC minutes imputed -270.90 26.90 -0.16 -10.07 0.00
FC minutes imputed 9.57 34.22 0.00 0.28 0.78
ISC minutes imputed -30.90 19.88 -0.02 -1.55 0.12
Site 1
Site 2
Site 3
Site 4
Site 5
Site 6
Constant 416.12 45.12 0.00 9.22 0.00
Age (years)
Reference Category
FOC Client Characteristics
Gender Reference Category
Marital Status
Reference Category
Race/EthnicityReference Category
Annual Household
Income (US$)
Reference Category
Criminal Convictions
Reference Category
Living Arrangement
Reference Category
Education Level
Reference Category
Omitted
Omitted
Employment Status at
EntryReference Category
FOC Program Mix
Site Indicator
Imputation of Minutes
A P P E N D I X D 1 0 0
Appendix D. Balancing Statistics for
Propensity Score Matching Although many evaluations skip balancing tests entirely, it is important to check a few standard
diagnostic tests to determine whether a propensity score matching exercise adequately “balances” the
treatment and comparison groups. “Balanced” groups will be identical on observable characteristics,
mimicking the gold standard of random assignment (of course there is no way to test that two samples
are identical on unobservable characteristics). This appendix reports information from the two principal
balancing tests used in the literature: the mean standardized bias and the share of matching variables in
a propensity score analysis that pass a t-test comparison of the matched treatment and comparison
groups, and therefore remain statistically distinguishable (i.e., imbalanced) after matching. A well
balanced sample will have a low mean standardized bias and a low share of matching variables passing
the t-test. A standard cut-off between a low and a high standardized bias is 20.
No propensity score matching analysis is perfect, and all matches here exhibit some imbalance.
Recall that the treatment effects reported in the body of the report further correct for these remaining
imbalances because they are estimated in a regression framework, rather than a simple difference in
means. This helps to control for any remaining imbalances.
Each row of every table of treatment effects in the body of this report is a separate propensity
score matching analysis with separate model coefficients and balancing test statistics. The results of
these tests are condensed and summarized in this appendix.
As in the body of the report, each row of tables D.1, D.2, and D.3 represent a separate propensity
score matching analysis with a different sample. The sample is identified by the treatment group,
comparison group, outcome variable, and notes columns in these tables. Three balancing statistics are
reported: the mean standardized bias, the share of matching variables passing their t-tests at the 10
percent significance level, and the share of matching variables passing their t-tests at the 5 percent
significance level. Each of these statistics should be low in the case of a good match.
Table D.1 presents the balancing tests for the employment and wage outcome samples. Generally
speaking, the SIPP comparison group is much more poorly matched to FOC client groups than other
FOC clients. This was anticipated and discussed at length in the body of the report. When FOC client
treatment cases are matched to SIPP comparison cases, the mean bias is generally higher than the
standard threshold of 20, but it is always below this threshold when FOC clients are matched to other

1 0 1 A P P E N D I X D
FOC clients. The t-tests suggest that some client groups tend to be poorly matched, including EC & ISC
and full bundle clients, and EC and full bundle clients. Although a large share of the matching variables
for these samples pass their t-test (i.e., are not balanced), the magnitude of the bias is never especially
high. Generally, table D.1 suggests that FOC client comparison groups are preferred to SIPP
comparison groups.
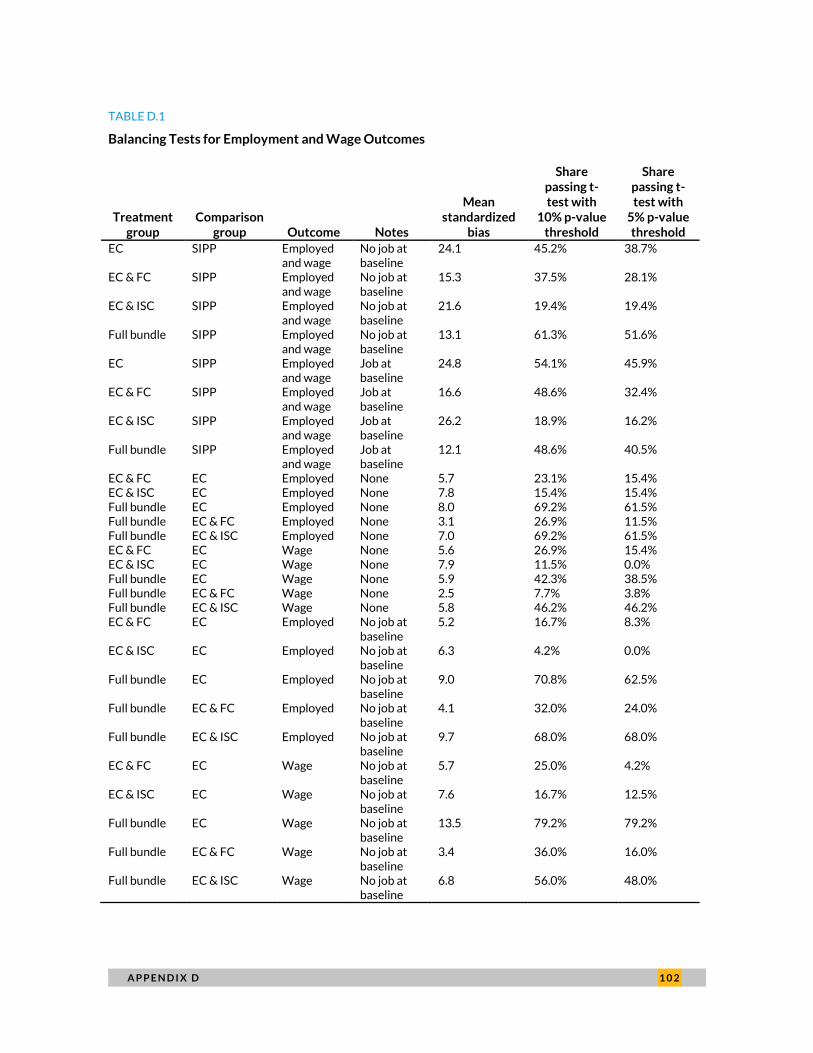
A P P E N D I X D 1 0 2
TABLE D.1
Balancing Tests for Employment and Wage Outcomes
Treatment group
Comparison group Outcome Notes
Mean standardized
bias
Share passing t-test with
10% p-value threshold
Share passing t-test with
5% p-value threshold
EC SIPP Employed and wage
No job at baseline
24.1 45.2% 38.7%
EC & FC SIPP Employed and wage
No job at baseline
15.3 37.5% 28.1%
EC & ISC SIPP Employed and wage
No job at baseline
21.6 19.4% 19.4%
Full bundle SIPP Employed and wage
No job at baseline
13.1 61.3% 51.6%
EC SIPP Employed and wage
Job at baseline
24.8 54.1% 45.9%
EC & FC SIPP Employed and wage
Job at baseline
16.6 48.6% 32.4%
EC & ISC SIPP Employed and wage
Job at baseline
26.2 18.9% 16.2%
Full bundle SIPP Employed and wage
Job at baseline
12.1 48.6% 40.5%
EC & FC EC Employed None 5.7 23.1% 15.4% EC & ISC EC Employed None 7.8 15.4% 15.4% Full bundle EC Employed None 8.0 69.2% 61.5% Full bundle EC & FC Employed None 3.1 26.9% 11.5% Full bundle EC & ISC Employed None 7.0 69.2% 61.5% EC & FC EC Wage None 5.6 26.9% 15.4% EC & ISC EC Wage None 7.9 11.5% 0.0% Full bundle EC Wage None 5.9 42.3% 38.5% Full bundle EC & FC Wage None 2.5 7.7% 3.8% Full bundle EC & ISC Wage None 5.8 46.2% 46.2% EC & FC EC Employed No job at
baseline 5.2 16.7% 8.3%
EC & ISC EC Employed No job at baseline
6.3 4.2% 0.0%
Full bundle EC Employed No job at baseline
9.0 70.8% 62.5%
Full bundle EC & FC Employed No job at baseline
4.1 32.0% 24.0%
Full bundle EC & ISC Employed No job at baseline
9.7 68.0% 68.0%
EC & FC EC Wage No job at baseline
5.7 25.0% 4.2%
EC & ISC EC Wage No job at baseline
7.6 16.7% 12.5%
Full bundle EC Wage No job at baseline
13.5 79.2% 79.2%
Full bundle EC & FC Wage No job at baseline
3.4 36.0% 16.0%
Full bundle EC & ISC Wage No job at baseline
6.8 56.0% 48.0%
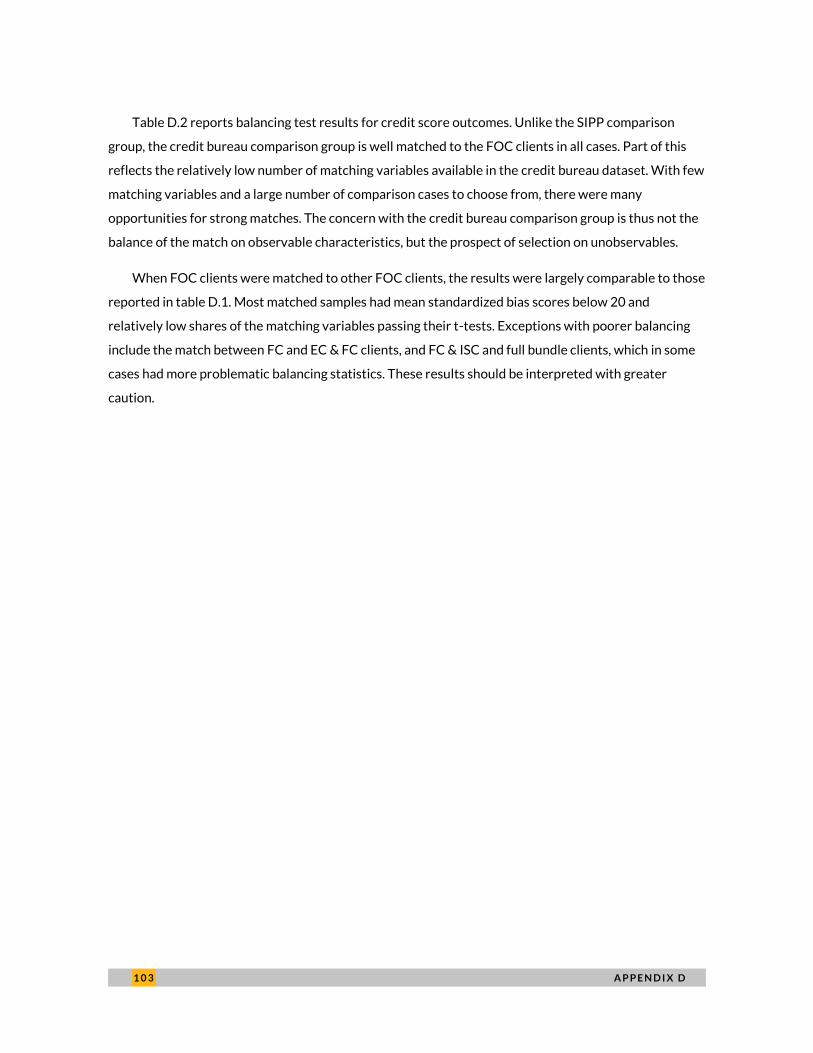
1 0 3 A P P E N D I X D
Table D.2 reports balancing test results for credit score outcomes. Unlike the SIPP comparison
group, the credit bureau comparison group is well matched to the FOC clients in all cases. Part of this
reflects the relatively low number of matching variables available in the credit bureau dataset. With few
matching variables and a large number of comparison cases to choose from, there were many
opportunities for strong matches. The concern with the credit bureau comparison group is thus not the
balance of the match on observable characteristics, but the prospect of selection on unobservables.
When FOC clients were matched to other FOC clients, the results were largely comparable to those
reported in table D.1. Most matched samples had mean standardized bias scores below 20 and
relatively low shares of the matching variables passing their t-tests. Exceptions with poorer balancing
include the match between FC and EC & FC clients, and FC & ISC and full bundle clients, which in some
cases had more problematic balancing statistics. These results should be interpreted with greater
caution.
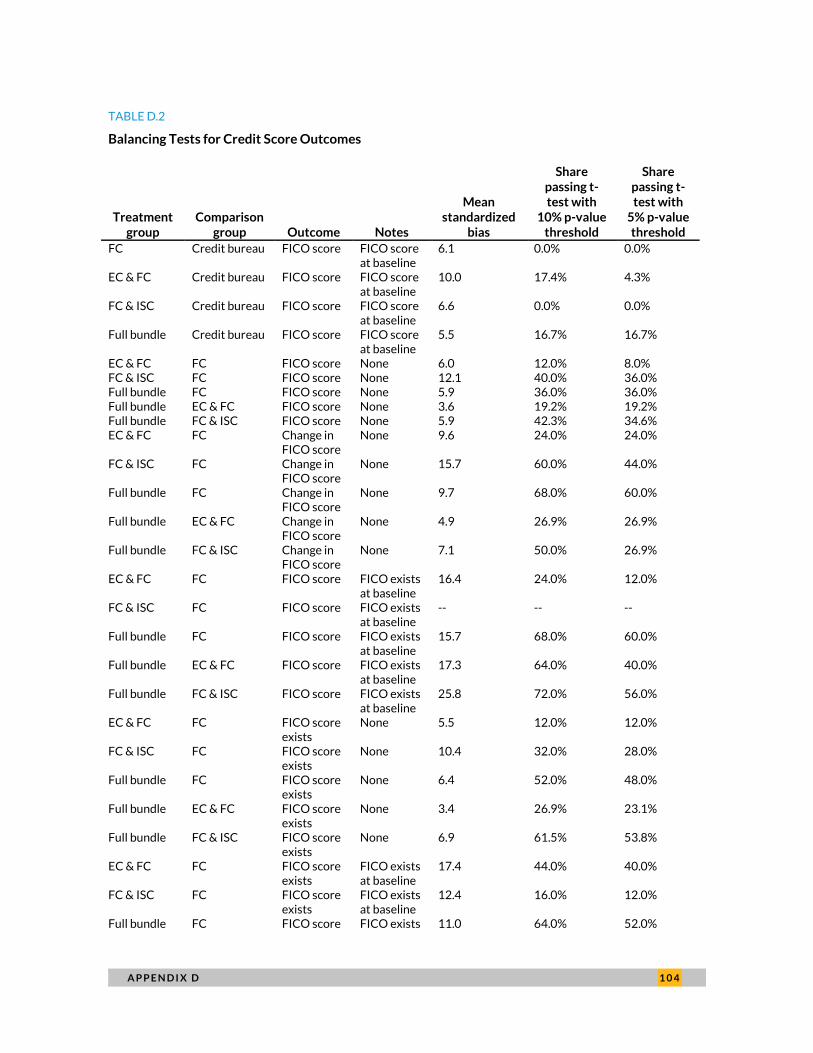
A P P E N D I X D 1 0 4
TABLE D.2
Balancing Tests for Credit Score Outcomes
Treatment group
Comparison group Outcome Notes
Mean standardized
bias
Share passing t-test with
10% p-value threshold
Share passing t-test with
5% p-value threshold
FC Credit bureau FICO score FICO score at baseline
6.1 0.0% 0.0%
EC & FC Credit bureau FICO score FICO score at baseline
10.0 17.4% 4.3%
FC & ISC Credit bureau FICO score FICO score at baseline
6.6 0.0% 0.0%
Full bundle Credit bureau FICO score FICO score at baseline
5.5 16.7% 16.7%
EC & FC FC FICO score None 6.0 12.0% 8.0% FC & ISC FC FICO score None 12.1 40.0% 36.0% Full bundle FC FICO score None 5.9 36.0% 36.0% Full bundle EC & FC FICO score None 3.6 19.2% 19.2% Full bundle FC & ISC FICO score None 5.9 42.3% 34.6% EC & FC FC Change in
FICO score None 9.6 24.0% 24.0%
FC & ISC FC Change in FICO score
None 15.7 60.0% 44.0%
Full bundle FC Change in FICO score
None 9.7 68.0% 60.0%
Full bundle EC & FC Change in FICO score
None 4.9 26.9% 26.9%
Full bundle FC & ISC Change in FICO score
None 7.1 50.0% 26.9%
EC & FC FC FICO score FICO exists at baseline
16.4 24.0% 12.0%
FC & ISC FC FICO score FICO exists at baseline
-- -- --
Full bundle FC FICO score FICO exists at baseline
15.7 68.0% 60.0%
Full bundle EC & FC FICO score FICO exists at baseline
17.3 64.0% 40.0%
Full bundle FC & ISC FICO score FICO exists at baseline
25.8 72.0% 56.0%
EC & FC FC FICO score exists
None 5.5 12.0% 12.0%
FC & ISC FC FICO score exists
None 10.4 32.0% 28.0%
Full bundle FC FICO score exists
None 6.4 52.0% 48.0%
Full bundle EC & FC FICO score exists
None 3.4 26.9% 23.1%
Full bundle FC & ISC FICO score exists
None 6.9 61.5% 53.8%
EC & FC FC FICO score exists
FICO exists at baseline
17.4 44.0% 40.0%
FC & ISC FC FICO score exists
FICO exists at baseline
12.4 16.0% 12.0%
Full bundle FC FICO score FICO exists 11.0 64.0% 52.0%
1 0 5 A P P E N D I X D
Treatment group
Comparison group Outcome Notes
Mean standardized
bias
Share passing t-test with
10% p-value threshold
Share passing t-test with
5% p-value threshold
exists at baseline Full bundle EC & FC FICO score
exists FICO exists at baseline
6.7 34.6% 23.1%
Full bundle FC & ISC FICO score exists
FICO exists at baseline
6.8 38.5% 26.9%
Finally, table D.3 reports balancing test results for net worth and net income outcome samples. The
net worth samples were generally well matched, with low mean standardized biases and a low share of
matching variables passing their t-tests. However, the net income samples tended to have very poor
match quality, with some of the highest standardized biases and shares of matching variables passing
their t-tests. Since the sources for the treatment and comparison groups (i.e., the treatment and
comparison group columns in table D.3) are the same across net worth and net income outcomes, the
stark contrast in the balance between these samples is due to the net income reporting rates. The
sample of clients that have net incomes reported is generally smaller and harder to match than the
comparable sample of clients with net worth reported.
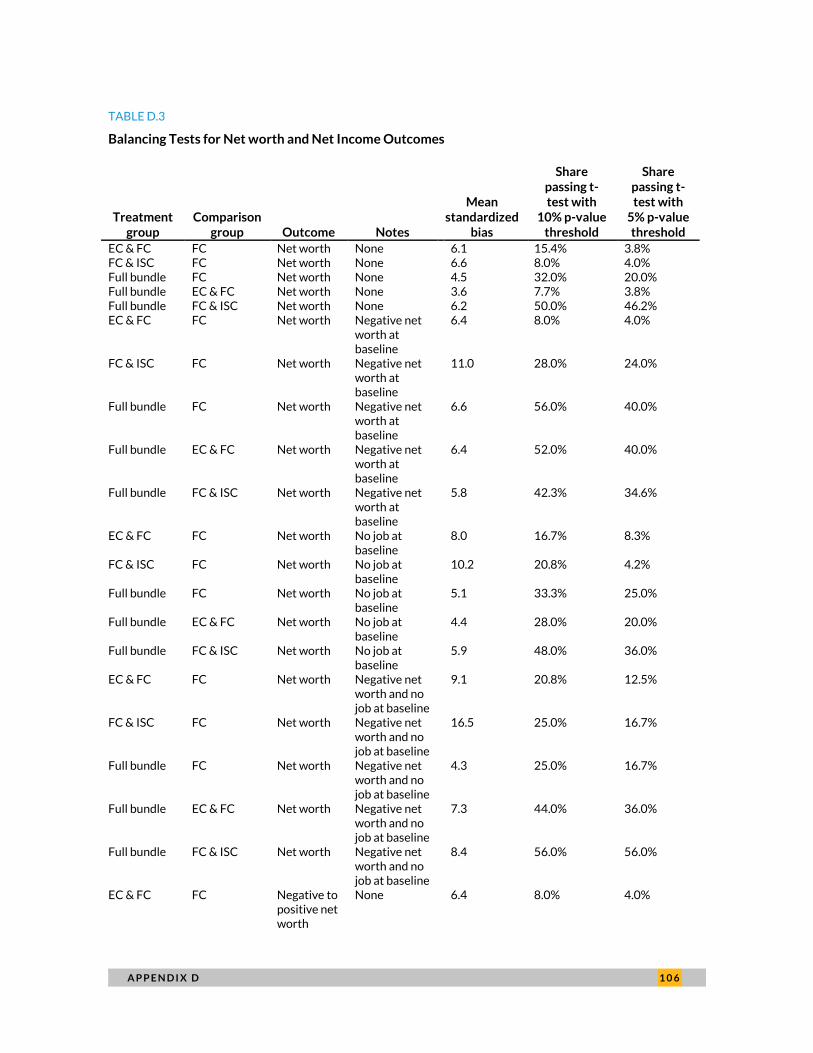
A P P E N D I X D 1 0 6
TABLE D.3
Balancing Tests for Net worth and Net Income Outcomes
Treatment group
Comparison group Outcome Notes
Mean standardized
bias
Share passing t-test with
10% p-value threshold
Share passing t-test with
5% p-value threshold
EC & FC FC Net worth None 6.1 15.4% 3.8% FC & ISC FC Net worth None 6.6 8.0% 4.0% Full bundle FC Net worth None 4.5 32.0% 20.0% Full bundle EC & FC Net worth None 3.6 7.7% 3.8% Full bundle FC & ISC Net worth None 6.2 50.0% 46.2% EC & FC FC Net worth Negative net
worth at baseline
6.4 8.0% 4.0%
FC & ISC FC Net worth Negative net worth at baseline
11.0 28.0% 24.0%
Full bundle FC Net worth Negative net worth at baseline
6.6 56.0% 40.0%
Full bundle EC & FC Net worth Negative net worth at baseline
6.4 52.0% 40.0%
Full bundle FC & ISC Net worth Negative net worth at baseline
5.8 42.3% 34.6%
EC & FC FC Net worth No job at baseline
8.0 16.7% 8.3%
FC & ISC FC Net worth No job at baseline
10.2 20.8% 4.2%
Full bundle FC Net worth No job at baseline
5.1 33.3% 25.0%
Full bundle EC & FC Net worth No job at baseline
4.4 28.0% 20.0%
Full bundle FC & ISC Net worth No job at baseline
5.9 48.0% 36.0%
EC & FC FC Net worth Negative net worth and no job at baseline
9.1 20.8% 12.5%
FC & ISC FC Net worth Negative net worth and no job at baseline
16.5 25.0% 16.7%
Full bundle FC Net worth Negative net worth and no job at baseline
4.3 25.0% 16.7%
Full bundle EC & FC Net worth Negative net worth and no job at baseline
7.3 44.0% 36.0%
Full bundle FC & ISC Net worth Negative net worth and no job at baseline
8.4 56.0% 56.0%
EC & FC FC Negative to positive net worth
None 6.4 8.0% 4.0%
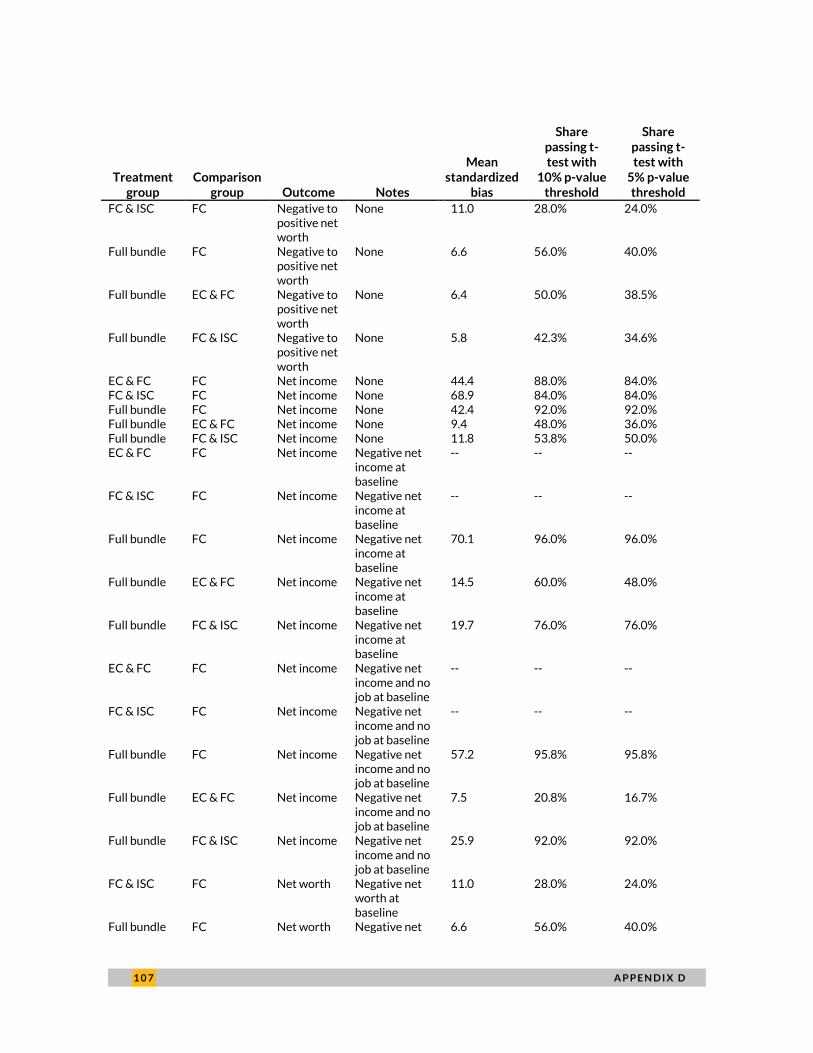
1 0 7 A P P E N D I X D
Treatment group
Comparison group Outcome Notes
Mean standardized
bias
Share passing t-test with
10% p-value threshold
Share passing t-test with
5% p-value threshold
FC & ISC FC Negative to positive net worth
None 11.0 28.0% 24.0%
Full bundle FC Negative to positive net worth
None 6.6 56.0% 40.0%
Full bundle EC & FC Negative to positive net worth
None 6.4 50.0% 38.5%
Full bundle FC & ISC Negative to positive net worth
None 5.8 42.3% 34.6%
EC & FC FC Net income None 44.4 88.0% 84.0% FC & ISC FC Net income None 68.9 84.0% 84.0% Full bundle FC Net income None 42.4 92.0% 92.0% Full bundle EC & FC Net income None 9.4 48.0% 36.0% Full bundle FC & ISC Net income None 11.8 53.8% 50.0% EC & FC FC Net income Negative net
income at baseline
-- -- --
FC & ISC FC Net income Negative net income at baseline
-- -- --
Full bundle FC Net income Negative net income at baseline
70.1 96.0% 96.0%
Full bundle EC & FC Net income Negative net income at baseline
14.5 60.0% 48.0%
Full bundle FC & ISC Net income Negative net income at baseline
19.7 76.0% 76.0%
EC & FC FC Net income Negative net income and no job at baseline
-- -- --
FC & ISC FC Net income Negative net income and no job at baseline
-- -- --
Full bundle FC Net income Negative net income and no job at baseline
57.2 95.8% 95.8%
Full bundle EC & FC Net income Negative net income and no job at baseline
7.5 20.8% 16.7%
Full bundle FC & ISC Net income Negative net income and no job at baseline
25.9 92.0% 92.0%
FC & ISC FC Net worth Negative net worth at baseline
11.0 28.0% 24.0%
Full bundle FC Net worth Negative net 6.6 56.0% 40.0%
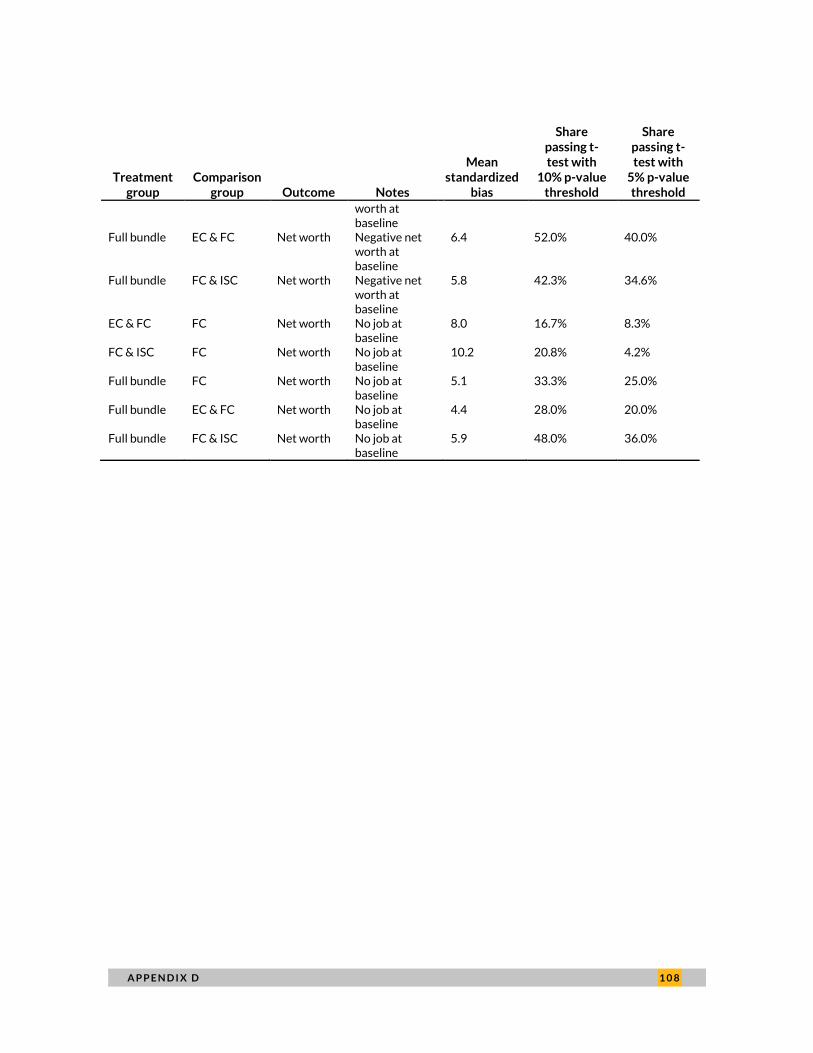
A P P E N D I X D 1 0 8
Treatment group
Comparison group Outcome Notes
Mean standardized
bias
Share passing t-test with
10% p-value threshold
Share passing t-test with
5% p-value threshold
worth at baseline
Full bundle EC & FC Net worth Negative net worth at baseline
6.4 52.0% 40.0%
Full bundle FC & ISC Net worth Negative net worth at baseline
5.8 42.3% 34.6%
EC & FC FC Net worth No job at baseline
8.0 16.7% 8.3%
FC & ISC FC Net worth No job at baseline
10.2 20.8% 4.2%
Full bundle FC Net worth No job at baseline
5.1 33.3% 25.0%
Full bundle EC & FC Net worth No job at baseline
4.4 28.0% 20.0%
Full bundle FC & ISC Net worth No job at baseline
5.9 48.0% 36.0%
1 0 9 N O T E S
Notes 1. Rankin, Sarah. 2015. Building Sustainable Communities: Integrated Services and Improved Financial
Outcomes for Low-Income Households. Washington, DC: LISC. Available at
http://www.lisc.org/docs/publications/041415_srankin_foc_report.pdf (accessed October 28, 2015).
2. “Financial Opportunity Centers and Field Building Initiatives,” LISC,
http://www.lisc.org/section/ourwork/national/family/foc/ (accessed October 29, 2015).
3. “CWF Earn Benefits Evaluation/Learning Paper,” Seedco and The Annie E. Casey Foundation,
http://www.aecf.org/resources/center-for-working-families-earnbenefits-evaluation-learning-paper/
(accessed October 29, 2015).
4. Burnett, Kimberly, Christopher Herbert, Anne St. George, and Melissa Vanderwalker (2009) “Pathways to
Financial Success: Initial Findings of the Financial Progress Study of Center for Working Family Participants.”
Abt Associates: Prepared for the Annie E. Casey Foundation, June 2009,
http://www.lisc.org/isd/images/about_integrated_services_delivery/asset_upload_file147_17260.pdf
(accessed October 29, 2015).
5. “Seeding the Field: The Creation and Growth of the Center for Working Families Approach,” The Annie E.
Casey Foundation, http://www.aecf.org/m/resourcedoc/AECF-SeedingTheField-2013.pdf (accessed October
29, 2015)
6. “Seeding the Field: The Creation and Growth of the Center for Working Families Approach,” The Annie E.
Casey Foundation, http://www.aecf.org/m/resourcedoc/AECF-SeedingTheField-2013.pdf (accessed October
29, 2015).
7. “The Working Families Success Network,” Integrated Services Delivery,
http://www.lisc.org/isd/about_integrated_services_delivery/the_working_families_success_network.php
(accessed October 29, 2015).
8. “The Strategy,” Working Families Success Network, http://workingfamiliessuccess.com/who-we-are/about-
the-working-families-success-network/ (accessed October 29, 2015).
9. “Working Families Success Network: Common Participant Outcomes,” Working Families Success Network,
http://workingfamiliessuccess.com/wp-content/uploads/2013/10/WFSN-Common-Participant-Outcomes-
10913-FINAL.pdf (accessed October 29, 2015).
10. “Network Sites,” Working Families Success Network, http://workingfamiliessuccess.com/network-sites/
(accessed October 29, 2015).
11. “Expanding Financial Opportunity: LISC’s Experience With Scaling Up Financial Opportunity Centers,” Chris
Walker and Dana Huff. Unpublished manuscript, 2012. Available at
http://www.lisc.org/docs/publications/122012_expanding_financial_opportunity.pdf (accessed October 29,
2015).
12. An additional 17 new FOC sites were financed by private funding during this time.
13. “Expanding Financial Opportunity: LISC’s Experience With Scaling Up Financial Opportunity Centers,” Chris
Walker and Dana Huff. Unpublished manuscript, 2012. Available at
http://www.lisc.org/docs/publications/122012_expanding_financial_opportunity.pdf (accessed October 29,
2015).
14. Building Financial Counseling into Social Service Delivery: Research and Implementation Findings for Social
Service Programs (New York: Office of Financial Empowerment, 2014).
N O T E S 1 1 0
15. “Building Stronger Financial Futures: Interim Findings from the Evaluation of LISC’s Financial Opportunity
Centers.” Anne Roder, Economic Mobility Corporation, 2014. Available at
http://lisc.org/docs/publications/economicmobility_building-stronger-financial-futures.pdf (accessed October
29, 2015).
16. “Building Stronger Financial Futures: Interim Findings from the Evaluation of LISC’s Financial Opportunity
Centers.” Anne Roder, Economic Mobility Corporation, 2014. Available at
http://lisc.org/docs/publications/economicmobility_building-stronger-financial-futures.pdf (accessed October
29, 2015).
17. “Gaining and Retaining Employment,” Alicia Atkinson and Jeremie Greer, Corporation for Enterprise
Development. Available at http://cfed.org/assets/pdfs/Gaining_and_Retaining_Employment.pdf (accessed
October 28, 2015).
18. “What Might Improve the Employment and Advancement Prospects of the Poor?” Harry M. Holzer, in M.
Touissant and B. Meyer eds. Strategies for Improving the Economic Mobility of Workers: Bridging the Gap between
Research and Practice. Kalamazoo MI: W.E. Upjohn Institute for Employment Research (accessed January 2,
2016).
19. Theodos, Brett, et al. "An Evaluation of the Impacts and Implementation Approaches of Financial Coaching
Programs." Washington, DC: The Urban Institute (2015). Available at
http://www.urban.org/sites/default/files/alfresco/publication-pdfs/2000448-An-Evaluation-of-the-Impacts-
and-Implementation-Approaches-of-Financial-Coaching-Programs.pdf (accessed October 28, 2015).
20. Theodos, Brett, et al. "An Evaluation of the Impacts and Implementation Approaches of Financial Coaching
Programs." Washington, DC: The Urban Institute (2015). Available at
http://www.urban.org/sites/default/files/alfresco/publication-pdfs/2000448-An-Evaluation-of-the-Impacts-
and-Implementation-Approaches-of-Financial-Coaching-Programs.pdf (accessed October 28, 2015).
21. Theodos, Brett, et al. "An Evaluation of the Impacts and Implementation Approaches of Financial Coaching
Programs," page xxiii.
22. About one-third of clients who received services during the 34 months prior to April 2015 received two f the
three FOC services. See Rankin, Sarah. 2015. Building Sustainable Communities: Integrated Services and
Improved Financial Outcomes for Low-Income Households. Washington, DC: LISC. Available at
http://www.lisc.org/docs/publications/041415_srankin_foc_report.pdf (accessed October 28, 2015).
23. “Gaining and Retaining Employment,” Alicia Atkinson and Jeremie Greer, Corporation for Enterprise
Development. Available at http://cfed.org/assets/pdfs/Gaining_and_Retaining_Employment.pdf (accessed
October 28, 2015).
24. Purposive sampling is a “qualitative inquiry that typically focuses on relatively small samples… selected
purposefully to permit inquiry into an understanding of a phenomenon in depth” (Patton 2002, 46). This
approach is a common, nonprobability sampling technique in which cases are selected based on characteristics
that are of interest to and central importance to the purpose of the study.
25. Rankin, Sarah. 2015. Building Sustainable Communities: Integrated Services and Improved Financial
Outcomes for Low-Income Households. Washington, DC: LISC. Available at
http://www.lisc.org/docs/publications/041415_srankin_foc_report.pdf (accessed October 28, 2015).
26. The spreadsheet instructed site staff to include the salaries (stipends) of AmeriCorps members in this line item,
but most sites did not indicate separate staff costs for their AmeriCorps member or members.
27. Theodos, Brett, et al. "An Evaluation of the Impacts and Implementation Approaches of Financial Coaching
Programs." Washington, DC: The Urban Institute (2015). Available at
http://www.urban.org/sites/default/files/alfresco/publication-pdfs/2000448-An-Evaluation-of-the-Impacts-
and-Implementation-Approaches-of-Financial-Coaching-Programs.pdf (accessed October 28, 2015).
1 1 1 N O T E S
28. This is the unweighted sample, that is, the sample size of unique comparison cases rather than the weighted
sample size when comparison cases that match to multiple treatment cases are given a higher weight.
29. Most variables used to estimate the propensity score were also used in the regression estimation of the
treatment effect. In these PSM analyses, Z only consists of individual site indicator variables (when FOC
clients are compared to other FOC clients) and state indicator variables (when FOC clients are compared to
SIPP cases). The first stage model estimating the propensity score often did not converge (i.e., find a solution)
when these site or state indicators were included, although they could be included in the second stage.
30. Probit models were used because a few of the models did not converge with the logit. However, for those
models that did converge, the probit, logit, and linear probability models all provided approximately the same
treatment effect, which is expected.
31. That is, the length of time between initial enrollment and the last service delivery date in the file.
32. See Heckman, J., H. Ichimura, J. Smith, and P. Todd. (1996). Sources of selection bias in evaluating social
programs: An interpretation of conventional measures and evidence on the effectiveness of matching as a
program evaluation method. Proceedings of the National Academy of Sciences, 93(23), 13416-13420; Heckman,
J., H. Ichimura, J. Smith, and P. Todd. (1998). Characterizing selection bias using experimental data.
Econometrica, 66(5):1017-1098; and Heckman, J., H. Ichimura, and P. Todd. (1997). Matching as an
econometric evaluation estimator: evidence from evaluating a job training programme. Review of Economic
Studies, 64(4): 605-654.
33. Because employment-related outcomes are only recorded in ETO for clients who receive employment
counseling services, the client dataset does not contain any clients who have not received employment
counseling but who do have data for these outcomes.
34. Information from the distribution of household income for FOC clients that had this information recorded is
used to restrict the SIPP sample. The 95th percentile for household income for FOC clients is just under
$40,000. SIPP cases are only included in the PSM analysis if their household income is $40,000 a year or less.
Household income is also used as a matching variable in the PSM analysis.
35. This possibility should be minimized since we control for baseline employment and household income.
36. In all prior PSM analyses some comparison cases are matched to multiple treatment cases, which is why the
comparison group is always smaller than the treatment group.
37. 79.9 percent of FOC clients receiving services for more than a month received financial counseling and
therefore have FICO scores measured as an outcome variable had a FICO score at baseline. As table 12
indicates, this share is somewhat lower when cases with missing values are removed.
38. It is not possible to assess the impact of FOC services on the change in a client’s FICO score for this sub-group
because a FICO score change can only be calculated if the client had a FICO score at baseline.
39. Individuals can lose credit scores over time if their credit history happened far enough in the past to be
disregarded by the credit rating agency.
40. Rankin, Sarah. 2015. Building Sustainable Communities: Integrated Services and Improved Financial Outcomes for
Low-Income Households. Washington, DC: LISC. Available at
http://www.lisc.org/docs/publications/041415_srankin_foc_report.pdf (accessed October 28, 2015).
41. Bowen, Rita, and United Way Worldwide. “Financial Stability Through Integrated Service Delivery: Highlights
from the United Way System” (2011). Available at
http://unway.3cdn.net/a6b53e050d6a0507f4_y0m6yx1rg.pdf (accessed October 28, 2015).
42. The six sites are numbered to ensure that their cost data remain confidential.
N O T E S 1 1 2
43. For example, at one site, this category includes an in-person counselor who is responsible for outreach and
enrollment; three additional employment coaches not listed in the Employment Coach line-item; and a
receptionist who provides support to FOC students and direct staff.
44. Bowen, Rita, and United Way Worldwide. “Financial Stability Through Integrated Service Delivery: Highlights
from the United Way System” (2011). Available at
http://unway.3cdn.net/a6b53e050d6a0507f4_y0m6yx1rg.pdf (accessed October 28, 2015).
45. The proportion of clients who receive the full bundle of FOC services has grown in recent years. For instance,
47 percent of all FOC clients who began receiving services between February and November 2015 received all
three services.
46. Although the coefficients in table 6 can be expressed in terms of dollars per client, the standardized betas are
preferable for these comparisons because they control for differences in the distributions of the independent
variables.
47. Two other outcomes, the difference net income and credit score changes, are not considered in this section.
Reliable impact estimates for the “treatment versus treatment-plus” analysis for net income could not be
calculated, while credit score impacts are difficult to express in monetary terms.
48. However, as seen in the previous section, certain client characteristics that have an impact on the type of FOC
services clients receive – and hence the costs of FOC services – are not included in the PSM matching
equations. For instance, criminal convictions are not available in the SIPP, and are also not used in the
“treatment versus treatment-plus” PSM equations. These data limitations constrain the power of the PSM
analysis, and affect the impact estimates as well as the cost-benefit comparisons below.
49. Bassi, Laurie J. "CETA–DID IT WORK?" Policy Studies Journal 12.1 (1983): 106-118. Available at
http://onlinelibrary.wiley.com/doi/10.1111/j.1541-0072.1983.tb00464.x/pdf (accessed October 20, 2015).
50. While the ETO system allows LISC staff members to update the data on an ongoing basis, the “post-FOC”
outcome measures are the most recently updated values as of March 2015.
51. Many sources, including the U.S. government, use the term “benefit-cost analysis” in official publications. Here,
we use “cost-benefit analysis” as a generic descriptive term. Both terms should be distinguished from cost-
effectiveness analysis, which “seeks to determine how a given goal can be achieved at the least cost.” See
also Maeve Carey, CRS report, available at http://fas.org/sgp/crs/misc/R41974.pdf.
52. U.S. Office of Management and Budget, Circular A-94. “Guidelines and Discount Rates for Benefit-Cost
Analysis of Federal Programs.” Available at
https://www.whitehouse.gov/sites/default/files/omb/assets/a94/a094.pdf (accessed October 28, 2015). See
also Posner, Richard A. "Cost-benefit analysis: Definition, justification, and comment on conference papers."
The Journal of Legal Studies 29.S2 (2000): 1153-1177. Available at
http://www.jstor.org/stable/10.1086/468108 (accessed October 20, 2015), and Arrow, Kenneth J., et al.
"Benefit-cost analysis in environmental, health, and safety regulation." Washington, DC: American Enterprise
Institute (1996): 1-17. Available at http://down.cenet.org.cn/upfile/13/20051271682167.pdf (accessed
October 20, 2015).
53. See, for instance, the discussion and resources at http://www.progressivereform.org/costBenefit.cfm.
54. Neumann, George R., et al. "The Benefits and Costs of National Service: Methods for Benefit Assessment with
Application to Three AmeriCorps Programs." (1995). Available at
http://files.eric.ed.gov/fulltext/ED383853.pdf (accessed October 20, 2015).
55. Wang, Changhua, et al. "A Cost-and-Benefit Study of Two AmeriCorps Projects in the State of Washington."
(1995). Available at http://files.eric.ed.gov/fulltext/ED387886.pdf (accessed October 20, 2015).
56. Bassi, Laurie J. "CETA–DID IT WORK?." Policy Studies Journal 12.1 (1983): 106-118.Available at
http://onlinelibrary.wiley.com/doi/10.1111/j.1541-0072.1983.tb00464.x/pdf (accessed October 20, 2015).
1 1 3 N O T E S
57. Barnow, Burt S. "The impact of CETA programs on earnings: a review of the literature." Journal of Human
Resources (1987): 157-193. Available at http://www.jstor.org/stable/145901 (accessed October 20, 2015). The
debates over the first cost-benefit analyses used in these studies have spawned a huge literature about the
appropriate way to use data from a comparison group to estimate the value added by job-training programs.
58. Bowen, Rita, and United Way Worldwide. “Financial Stability Through Integrated Service Delivery: Highlights
from the United Way System” (2011). Available at
http://unway.3cdn.net/a6b53e050d6a0507f4_y0m6yx1rg.pdf (accessed October 28, 2015).
59. Bassi, Laurie J. "CETA–DID IT WORK?." Policy Studies Journal 12.1 (1983): 106-118.Available at
http://onlinelibrary.wiley.com/doi/10.1111/j.1541-0072.1983.tb00464.x/pdf (accessed October 20, 2015).
60. The ETO system also allows counselors to record the number of hours that the client typically works, but this
information was not available at the time the analysis was conducted.
61. The percentages in table 34 were based on the 294 clients at the six sites who were unemployed at baseline,
later found employment, and had non-missing data for the job retention indicators. 30 of these clients had
missing data for job retention.
62. The retention data may understate the amount of time that FOC clients actually worked if they quickly found
another job after leaving their initial placement.
63. Bassi, Laurie J. "CETA–DID IT WORK?." Policy Studies Journal 12.1 (1983): 106-118.Available at
http://onlinelibrary.wiley.com/doi/10.1111/j.1541-0072.1983.tb00464.x/pdf (accessed October 20, 2015).
64. While the size of these increases in net income may vary based on the mix of FOC services that clients receive,
among other factors, the average value is used in the calculations to improve reliability.
65. Rotz, D.; Maxwell, N.; Dunn, A. (2014). “Economic Self-Sufficiency and Life Stability One Year After Starting a
Social Enterprise Job.” Oakland, CA: Mathematica Policy Research. Available at
http://www.nationalservice.gov/sites/default/files/evidenceexchange/REDF_SocialEnterprise.pdf (accessed
October 21, 2015).
66. “Gaining and Retaining Employment,” Alicia Atkinson and Jeremie Greer, Corporation for Enterprise
Development. Available at http://cfed.org/assets/pdfs/Gaining_and_Retaining_Employment.pdf (accessed
October 28, 2015).
67. “Elements of a Successful Financial Opportunity Center,” LISC, available at
http://www.lisc.org/isd/images/isd_providers/asset_upload_file322_17269.pdf (accessed October 28, 2015).
ST A T E M E N T O F I N D E P E N D E N C E
The Urban Institute strives to meet the highest standards of integrity and quality in its research and analyses and in
the evidence-based policy recommendations offered by its researchers and experts. We believe that operating
consistent with the values of independence, rigor, and transparency is essential to maintaining those standards. As
an organization, the Urban Institute does not take positions on issues, but it does empower and support its experts
in sharing their own evidence-based views and policy recommendations that have been shaped by scholarship.
Funders do not determine our research findings or the insights and recommendations of our experts. Urban
scholars and experts are expected to be objective and follow the evidence wherever it may lead.

2100 M Street NW Washington, DC 20037
www.urban.org