Embed Size (px)
Citation preview
AN ASSESSMENT OF THE SKIPJACK AND BAITFISH RESOURCES OF AMERICAN SAMOA
Lit
•an
Skipjack Survey and Assessment Programme Final Country Report No. 17
South Pacific Commission Noumea, New Caledonia
June 1984

1& SEP; KJO4
AN ASSESSMENT OF THE SKIPJACK AND BAITFISH RESOURCES OF AMERICAN SAMOA
Skipjack Survey and Assessment Programme
Final Country Report No.17
South Pacific Commission
Noumea, New Caledonia
June 1984

©Copyright 1984, South Pacific Commission Original text: English
Prepared for publication at South Pacific Commission headquarters, Moumea, New Caledonia
and printed at System Press Pty Ltd, Sydney, 1984
iii
PREFACE
The Skipjack Survey and Assessment Programme was an externally funded part of the work programme of the South Pacific Commission. Governments which provided funding for the Programme were Australia, France, Japan, New Zealand, United Kingdom and the United States of America, and the generosity of these governments is gratefully acknowledged.
The Skipjack Programme has been succeeded by the Tuna and Billfish Assessment Programme which is receiving funding from Australia, France, New Zealand and the United States of America. The Tuna Programme is designed to improve understanding of the status of the stocks of commercially important tuna and billfish species in the region. Publication of final results from the Skipjack Programme, including results from the Programme's investigation of yellowfin tuna resources of the region, is continuing under the Tuna Programme. Reports for each of the countries and territories for which the South Pacific Commission works have been prepared in a final country report series. Most of these reports have been co-operative efforts involving all members of the Tuna Programme staff in some way.
The staff of the Programme at the time of preparation of this report comprised the Programme Co-ordinator, R.E. Kearney; Research Scientists, A.W. Argue, C.P. Ellway, R.S. Farman, R.D. Gillett, L.S. Hammond, P. Kleiber, J.R. Sibert, W.A. Smith and M.J. Williams; Research Assistants, Susan Van Lopik and Veronica van Kouwen; and Programme Secretary, Carol Moulin.
The Skipjack Programme is grateful for the assistance provided by officials of the Government of American Samoa, in particular Henry Sesepasara, Director of the Office of Marine Resources, Pago Pago.
Tuna Programme South Pacific Commission
For bibliographic purposes this document should be cited as follows:
Tuna Programme (1984). An assessment of the skipjack and baitfish resources of American Samoa. Skipjack Survey and Assessment Programme Final Country Report No. 17, South Pacific Commission, Noumea, New Caledonia.

V
CONTENTS
Page.
PREFACE iii
LIST OF TABLES vi
LIST OF FIGURES v i i
1.0 INTRODUCTION *
1.1 Historical Background 1 1.2 Previous Research 2
2.0 METHODS 3
2.1 Vessels and Crew 3 2.2 Baitfishing 3 2.3 Skipjack Fishing and Tagging 3 2.4 Biological Sampling 4 2.5 Data Compilation and Analysis 4
3.0 SUMMARY OF FIELD ACTIVITIES 5
4.0 RESULTS AND DISCUSSION 9 4.1 Baitfishing 9 4.2 Skipjack Fishing 16
4.3 Skipjack Biology 17 4.3.1 Diet 17 4.3.2 Maturity and reproduction 17 4.3.3 Blood genetics and population structure 18 4.3.4 Growth 19
4.4 Tag Recapture Data 21 4.4.1 Skipjack migrations 21 4.4.2 Resource assessment 22 4.4.3 Fishery interactions 27
5.0 CONCLUSIONS 29
REFERENCES 32
APPENDICES
A. Scientists, observers and crew on board the research 39 vessels
B. Abbreviations used for countries and territories in the 41 central and western Pacific
vi
LIST OF TABLES
Table Page
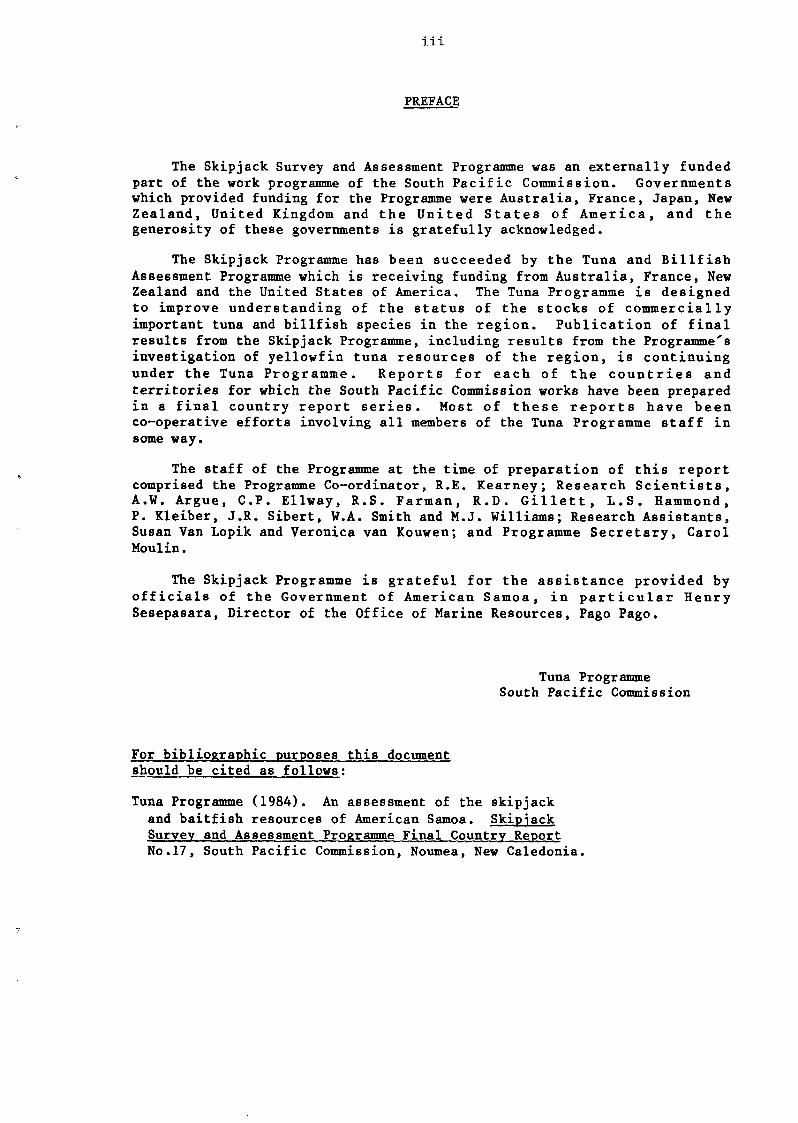
1 Summary of daily field activities by the Skipjack Programme in the waters of American Samoa 5
2 Summary of baitfishing effort and catch by the Skipjack 7 Programme in the waters of American Samoa
3 Catch and frequency of occurrence of all taxa in bouki-ami hauls made by the Skipjack Programme in g American Samoa
4 Numbers of fish sampled for biological data by the 9 Skipjack Programme in American Samoa
5 Items found in stomachs of skipjack sampled in American 13 Samoa
6 Incidence of tuna juveniles in the stomachs of predator 13 tuna sampled in American Samoa
7 Summary of length increments for skipjack tagged by the Skipjack Programme in various countries and territories 20 in the Skipjack Programme study area
8 Standardised increments of length for fish 50 cm long 21 at release and at liberty for 90 days
9 Summary of skipjack release and recovery data for the 28 entire Skipjack Programme, as of 10 October 1983
10 Coefficients of interaction between fisheries operating in various countries and territories in the central and 30 western Pacific
V l l
LIST OF FIGURES
Figure
A The area of the South P a c i f i c Commission
B S t r a i g h t l i n e r e p r e s e n t a t i o n s of movements of s k i p j a c k t a g g e d by t h e S k i p j a c k Programme and s u b s e q u e n t l y recovered
1 Areas surveyed for sk ip jack and l o c a l i t i e s f i s h e d f o r b a i t by t h e S k i p j a c k Programme i n t h e w a t e r s of American Samoa
2 Length frequency d i s t r i b u t i o n s of s k i p j a c k t a g g e d or sampled by the Skipjack Programme i n American Samoa
3 D i s t r i b u t i o n of female sk ip jack by m a t u r i t y s t a g e f o r samples from A m e r i c a n Samoa and f rom t h e e n t i r e Skipjack Programme study a rea
4 Average gonad i n d i c e s , by month , f o r f emale s k i p j a c k sampled by the Skipjack Programme from t r o p i c a l w a t e r s south of the Equator
5 Skipjack serum e s t e r a s e gene frequency for 163 samples ve r sus the longi tude of the sample l o c a t i o n
6 S t r a i g h t - l i n e r e p r e s e n t a t i o n s of movements o u t of American Samoan waters of sk ip j ack t a g g e d i n American Samoa, and i n t o American Samoan w a t e r s of s k i p j a c k tagged elsewhere by the Skipjack Programme
7 Numbers of s k i p j a c k t a g r e c o v e r i e s , by d i s t a n c e t r a v e l l e d and t i m e - a t - l a r g e , f o r t h e e n t i r e S k i p j a c k Programme data s e t
8 Numbers of s k i p j a c k t a g r e c o v e r i e s v e r s u s months a t l a r g e , for the e n t i r e Skipjack Programme data s e t
AN ASSESSMENT OF THE SKIPJACK AND BAITFISH RESOURCES OF AMERICAN SAMOA
1.0 INTRODUCTION
The Skipjack Survey and Assessment Programme was created in response to rapid expansion of surface fisheries for skipjack (Katsuwonus pelamis) during the 1970s in the waters of the central and western Pacific. The objectives of the Skipjack Programme were to survey the skipjack and baitfish resources within the area of the South Pacific Commission, and to assess the status of skipjack stocks and the degree of interaction between fisheries for skipjack within the Commission region and beyond. These assessments provide a basis for rational development of skipjack fisheries throughout the region and sound management of the resource.
The Programme's field research spanned almost three years between October 1977 and August 1980, and included 847 days of tagging and survey operations. Visits were made to all countries and territories in the area of the South Pacific Commission (Figure A, inside front cover) as well as New Zealand and Australia. Fifteen days were spent in the waters of American Samoa from 1 to 5 and 15 to 21 June 1978, and 20, 21 and 27 February 1980. Preliminary results from the 1978 visits were given by Kearney & Hallier (1978). This report presents the final analyses of the work by the Programme in the waters of American Samoa, compares them to previous data and to results from elsewhere in the Programme's study area, and considers their implications for skipjack and baitfish resource management.
1.1 Historical Background
In American Samoa, as in o ther i s l a n d s of Po lynes i a , sk ip j ack f i s h i n g t r a d i t i o n a l l y was c a r r i e d out by g roups l e d by m a s t e r f i s h e r m e n , u s i n g s p e c i a l i s e d canoes and p e a r l - s h e l l l u r e s (Hiroa 1930) . Local tuna f i s h i n g i n American Samoa in the e a r l y 1950s was d e s c r i b e d by van P e l (1954) as "very small s c a l e " , ma in ly conduc t ed by p a r t l y decked canoes t r o l l i n g ou t s ide t h e f r i n g i n g r e e f . In 1 9 7 1 , a p r o j e c t was i n i t i a t e d t o b u i l d e i g h t - m e t r e , Oregon-s ty le f i s h i n g dor i e s (Anon. 1973) . T w e n t y - f i v e were b u i l t in the e a r l y 1970s, but only one was s t i l l f i s h i n g i n 197 8 (Wendler 1980). The t o t a l ca tch of pe l ag i c s p e c i e s , mainly tuna , by l o c a l fishermen in 1978 was r e p o r t e d by C r o s s l a n d & G r a n d p e r r i n (1979) t o be abou t 20 t onnes .
In American Samoan w a t e r s , u n l i k e many o t h e r p a r t s of t h e S o u t h P a c i f i c Commission r e g i o n , t h e r e has been v e r y l i t t l e f i s h i n g by t h e Japanese d i s t a n t - w a t e r p o l e - a n d - l i n e f l e e t . The on ly a c t i v i t y r e p o r t e d be tween 1972 and 1978 , t h e most r e c e n t y e a r s f o r w h i c h f i g u r e s a r e a v a i l a b l e , was four boat-days in 1975 and f ive boat-days in 1976, y i e l d i n g a t o t a l ca tch of 67 tonnes of sk ip jack (Skipjack Programme 1980a) .
By v i r t u e of i t s magnif icent harbour , one of the bes t in the P a c i f i c , and t h e f a v o u r e d s t a t u s en joyed by American Samoa under U . S . t a r i f f r e g u l a t i o n s , Pago Pago has become the s i t e of two l a r g e cannery o p e r a t i o n s , and subsequent ly , a major c e n t r e f o r s u p p l y i n g f u e l t o and p r o v i s i o n i n g f i s h i n g v e s s e l s opera t ing in the c e n t r a l P a c i f i c . The f i r s t c anne ry was e s t a b l i s h e d by the government in 1949 but soon f a i l e d (Kent 1980) . I t was
2
reopened by the Van Camp Company in early 1954 (van Pel 1954), p rocess ing the catch of Japanese longline vessels based in Pago Pago. The S t a r k i s t Company began operating a second cannery in 1963, but plans in the ea r ly 1970s by the Bumble Bee Company for a th i rd cannery were thwarted by the lack of adequate suppl ies of water (Kent 1980) . In the l a t e 1960s and early 1970s the canneries were supplied by more than 250 Japanese , Korean and Taiwanese longline vessels (Baldwin 1977), which took a l l but a few per cent of thei r catch in waters further than 200 mi les from American Samoa (Kent 1980). Catches in various years between 1962 and 1977 by Japanese , Korean and Taiwanese l o n g l i n e r s ope ra t i ng wi th in the 200-mile zone of American Samoa were summarised by Klawe (1978) and Skipjack Programme (1981a). There are now fewer l ong l ine v e s s e l s o p e r a t i n g , and a l a r g e proportion of the tuna supplied to the canneries comes from United S t a t e s purse-seiners operating in the c e n t r a l P a c i f i c . The canner ies possess l a rge f r eeze r f a c i l i t i e s to cope w i t h e x c e s s s h o r t - t e r m s u p p l i e s , par t icu la r ly from super-se iners , which commonly may carry approximately 1,000 tonnes of f i sh . In 1978, each cannery was r epor t ed to have 3,000 tonnes of freezing capacity (Crossland & Grandperrin 1979). About 70,000 tonnes of tuna, with a landed value of around US$100 mill ion was processed in 1980 (Simiki, Ratcl iffe & Sorrensen 1981).
Other f a c i l i t i e s of significance to the development of Pago Pago as a f l e e t cen t re inc lude the marine ra i lway and dry dock , b u i l t by t h e government in 1958, and the ava i l ab i l i t y of fuel a t p r i c e s s i g n i f i c a n t l y lower than elsewhere in the Pacific (Simiki et a l . 1981).
The development of canning operations has limited the development of local f i sher ies (Wendler 1980). The ava i l ab i l i t y of employment has led to « a decline in t r ad i t iona l l i f e s t y l e s , including involvement wi th f i s h i n g . As wel l , cheap fish became read i ly a v a i l a b l e , both through the domestic marketing of canned wahoo, and the development of a blackmarket in f i s h from vessels supplying the canneries (Simiki e t a l . 1981). The government's "Economic Development Plan for American Samoa : FY 197 9-1984" ( i n Wendler 1980) r e c o g n i s e d t h e need t o r e - e s t a b l i s h l o c a l l y b a s e d , small-scale commercial f i she r i e s , as well as to promote i n d u s t r i a l - s c a l e operations in t e r r i t o r i a l waters .
1.2 Previous Research
Early investigations of fisheries in American Samoa by American authorities and by the South Pacific Commission (van Pel 1954) concluded that tuna was an abundant but underexploited resource. Preliminary data on abundance were obtained by the United States Bureau of Commercial Fisheries, which spent 26 hours sighting for tuna schools and bird flocks in the general area of the Samoa Islands between 1951 and 1960 (Waldron 1964). A visit by the United Nations Development Programme/Food and Agriculture Organization (UNDP/FA0) South Pacific Tuna Mission (Anon. 1969) concluded that Hawaiian techniques could be used to catch skipjack if adequate bait supplies could be caught. Subsequent surveys by the U.S. National Marine Fisheries Service (NMFS) in 1970, using the Charles H. Gilbert (Hida 1970) and in 1972 using the Anela (Uchida & Sumida 1973) failed to catch quantities of bait adequate to the needs of a pole-and-line operation. Using bait from Hawaii as well as locally captured wild bait, the Charles H. Gilbert survey tagged 840 skipjack and 91 yellowfin (Hida 1970), none of which has since been recovered (Shomura pers. comm.). The Anela also made good catches of tuna, mostly skipjack, taking an average of 4.0 tonnes per day, using bait transported from the Marshall Islands. Research by American Samoa government agencies between 1970 and 1975, using

3
the Alofaga and a number of smaller vessels, obtained school sightings data and catches which further indicated that the tuna resource was large, but inadequate bait resources were again encountered (Swerdloff 1972; Sesepasara undated). The Alofaga cruises also indicated that the skipjack resource was relatively evenly dispersed around Tutuila Island, and that it peaked in abundance in the summer months.
Recognition of the inadequacy of the baitfish resource of American Samoa led to the establishment in 1973 of a project to culture mollies (also called top minnows), Poecilia mexicana and P. vittata (Baldwin 1977). Fishing trials were conducted in conjunction with the Pacific Tuna Development Foundation (PTDF) aboard the Alofaga in 1975 (Sesepasara undated) and aboard the J-Ann in 1978 (Vergne, Bryan & Broadhead 1978). The trials indicated that cultured mollies could be used successfully as bait, but that the culture techniques were not cost effective.
Other surveys of skipjack in American Samoan waters have been by surface-trolling by the PTDF in 1975, using the Alofaga (Anon. 1975) and by the NMFS in 1979 using the Townsend Cromwell (Anon. 1979). The French research organisation, Office de la Recherche Scientifique et Technique Outre-Mer (ORSTOM), collected some data on tuna ecology and thermoclines during three cruises spent partly in American Samoan waters between 1970 and 1977 (Cremoux 1980), and conducted aerial spotting for tuna in an area northwest of Pago Pago in October 1979 (Marsac 1981).
2.0 METHODS
2.1 Vessels and Crew
Two Japanese commercial fishing vessels, the Hatsutori Maru No.l and the Hatsutori Maru No.5. were chartered at different times by the Skipjack Programme from Hokoku Marine Products Company Limited, Tokyo, Japan. Details of both vessels are given in Kearney (1982a). The 192-gross tonne Hatsutori Maru No.1 was used during the survey of American Samoa in May-June 1978, and the Hatsutori Maru No .5 of 254 gross tonnes was used during the second, in February 1980.
The Hatsutori Maru No.l was operated with at least three Skipjack Programme scientists, nine Japanese officers and twelve Fijian crew. Up to three additional Fijian crew were employed on the Hatsutori Maru No.5. Names of all personnel and details of the times scientists and observers spent on board are given in Appendix A.
2.2 Baitfishing
Bai t f i sh ing was c a r r i e d out a t n ight us ing a "bouki-ami" ne t se t around ba i t a t t r ac t ion l i g h t s . In some c o u n t r i e s , beach-se in ing during daylight hours supplemented n igh t c a t c h e s , but i t was not a t tempted in American Samoa. Night bait ing procedures were s imi l a r to those used by commercial v e s s e l s , but were m o d i f i e d where n e c e s s a r y t o meet t h e Programme's special requirements. Details of techniques and modi f ica t ions employed are given in Hal l ie r , Kearney & G i l l e t t (1982).
2.3 Skipjack Fishing and Tagging
Both the vessels used by the Skipjack Programme were designed for commercial, l i ve -ba i t p o l e - a n d - l i n e f i s h i n g , and the ba s i c s t r a t e g y of
4
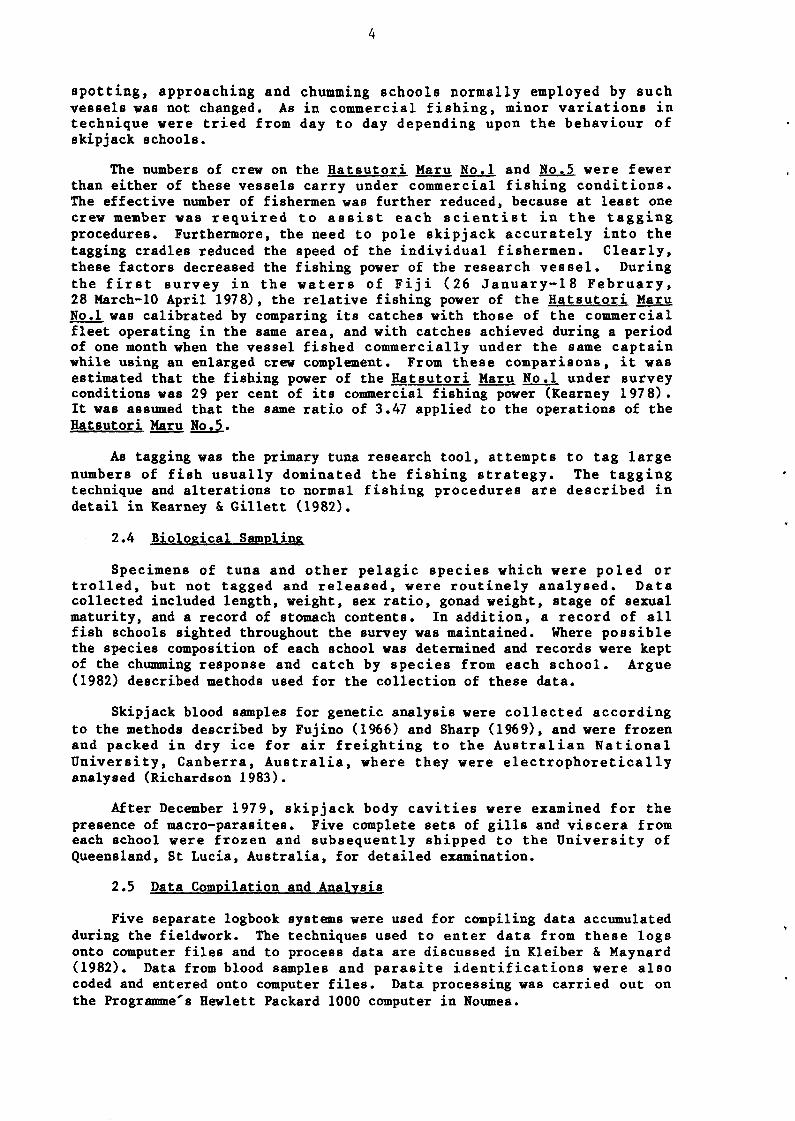
spotting, approaching and chumming schools normally employed by such vessels was not changed. As in commercial fishing, minor variations in technique were tried from day to day depending upon the behaviour of skipjack schools.
The numbers of crew on the Hatsutori Maru No.l and No.5 were fewer than either of these vessels carry under commercial fishing conditions. The effective number of fishermen was further reduced, because at least one crew member was required to assist each scientist in the tagging procedures. Furthermore, the need to pole skipjack accurately into the tagging cradles reduced the speed of the individual fishermen. Clearly, these factors decreased the fishing power of the research vessel. During the first survey in the waters of Fiji (26 January-18 February, 28 March-10 April 1978), the relative fishing power of the Hatsutori Maru No.l was calibrated by comparing its catches with those of the commercial fleet operating in the same area, and with catches achieved during a period of one month when the vessel fished commercially under the same captain while using an enlarged crew complement. From these comparisons, it was estimated that the fishing power of the Hatsutori Maru No .1 under survey conditions was 29 per cent of its commercial fishing power (Kearney 197 8). It was assumed that the same ratio of 3.47 applied to the operations of the Hatsutori Maru No.5.
As tagging was the primary tuna research tool, attempts to tag large numbers of fish usually dominated the fishing strategy. The tagging technique and alterations to normal fishing procedures are described in detail in Kearney & Gillett (1982).
2.4 Biological Sampling
Specimens of tuna and other pelagic species which were poled or trolled, but not tagged and released, were routinely analysed. Data collected included length, weight, sex ratio, gonad weight, stage of sexual maturity, and a record of stomach contents. In addition, a record of all fish schools sighted throughout the survey was maintained. Where possible the species composition of each school was determined and records were kept of the chumming response and catch by species from each school. Argue (1982) described methods used for the collection of these data.
Skipjack blood samples for genetic analysis were collected according to the methods described by Fujino (1966) and Sharp (1969), and were frozen and packed in dry ice for air freighting to the Australian National University, Canberra, Australia, where they were electrophoretically analysed (Richardson 1983).
After December 1979, skipjack body cavities were examined for the presence of macro-parasites. Five complete sets of gills and viscera from each school were frozen and subsequently shipped to the University of Queensland, St Lucia, Australia, for detailed examination.
2.5 Data Compilation and Analysis
Five separate logbook systems were used for compiling data accumulated during the fieldwork. The techniques used to enter data from these logs onto computer files and to process data are discussed in Kleiber & Maynard (1982). Data from blood samples and parasite identifications were also coded and entered onto computer files. Data processing was carried out on the Programme's Hewlett Packard 1000 computer in Noumea.

5
Assessment of the skipjack resource and possible interactions between fisheries for skipjack in American Samoa and those in other countries required several different approaches. Records of the migration of tagged skipjack formed the basis of the investigations of movement patterns and fishery interactions, using analytic techniques described in Skipjack Programme (1981b) and Kleiber, Sibert & Hammond (ms.). Evaluation of the magnitude of the skipjack resource and its dynamics, based on tag recapture data, are described in Kleiber, Argue & Kearney (1983). Methods employed in studies of growth are described in Sibert, Kearney & Lawson (1983) and Lawson, Kearney & Sibert (1984), and of juvenile abundance, in Argue, Conand & Whyman (1983). Procedures used to compare fishing effectiveness of different baitfish families are described in Argue, Williams & Hallier (ms.). Evaluation of population structuring across the whole of the western and central Pacific was based on a comparison of the tagging results with the blood genetics analyses (Anon. 1980, 1981; Skipjack Programme 1981c) and analyses of the occurrence and distribution of skipjack parasites (Lester, Barnes & Habib ms.).
3.0 SUMMARY OF FIELD ACTIVITIES
Seven days were spent fishing, three days steaming and five days in port during the Skipjack Programme surveys of American Samoa (Table 1). Unloading 10 tonnes of skipjack accumulated in the ship's freezers and loading cultured baitfish necessitated the long period in port. Figure 1 shows the areas covered by the surveys, and the four localities at which baitfishing was conducted.
TABLE 1. SUMMARY OF DAILY FIELD ACTIVITIES BY THE SKIPJACK PROGRAMME IN THE WATERS OF AMERICAN SAMOA. Schools sighted are given by species: SJ = skipjack or skipjack with other species except yellowfin, YF = yellowfin or yellowfin with other species except skipjack, S+Y = skipjack with yellowfin or skipjack with yellowfin and other species, OT = other species without skipjack or yellowfin, UN = unidentified, but most likely schools with tuna. * Steaming through American Samoan waters in transit between Cook Islands and Western Samoa.
Hours Fishing Schools Sighted Fish Tagged Fish Caught
Principal Bait and (numbers) (numbers) (kg) Total Date General Area Activity Carried Sighting SJ YF S+Y OT UN SJ YF OT SJ YF Catch
(kg) (kg)
01/06/78 02/06/78 03/06/78 04/06/78 05/06/78 15/06/78 16/06/78 17/06/78 18/06/78 19/06/78 20/06/78 21/06/78 20/02/80 21/02/80 27/02/80
TOTALS
Pago Pago Pago Pago N. Tutuila N. Tutuila Pago Pago Pago Pago Pago Pago N. Tutuila N. Tutuila S. Tutuila S. Tutuila W. Tutuila E. Am. Samoa Manua Is. S. Am. Samoa
Days 15
In Port In Port Steaming Steaming In Port In Port In Port Fishing Fishing Fishing Fishing Fishing Fishing Fishing Steaming*
0 0 0 0 0
155 509 509 480 459 399 519 125 123 294
0 0 2 7 0 0 0 9 10 10 9 5 12 11 3
78
0 0 0 0 3 - _ _ _ _ 3 0 0 0 10 0 0 0 20 0 20
2 0 3 0 1 0 3 0
1 0 0 0 0 0 2 0
0 3 0 0 0 0 0 0
1 1 3 0 0 0 0 0
5 2 2 3 3 0 3 0
0 1
73 0 0 0
701 0
0 0 0 0 0 0 0 0
0 0 0 0 0 0 0 0
2 5
303 0 0 0
2381 0
6 10 0 0 0 0 0 0
12 3 3 5 31 775 0 0 2789 16 2765
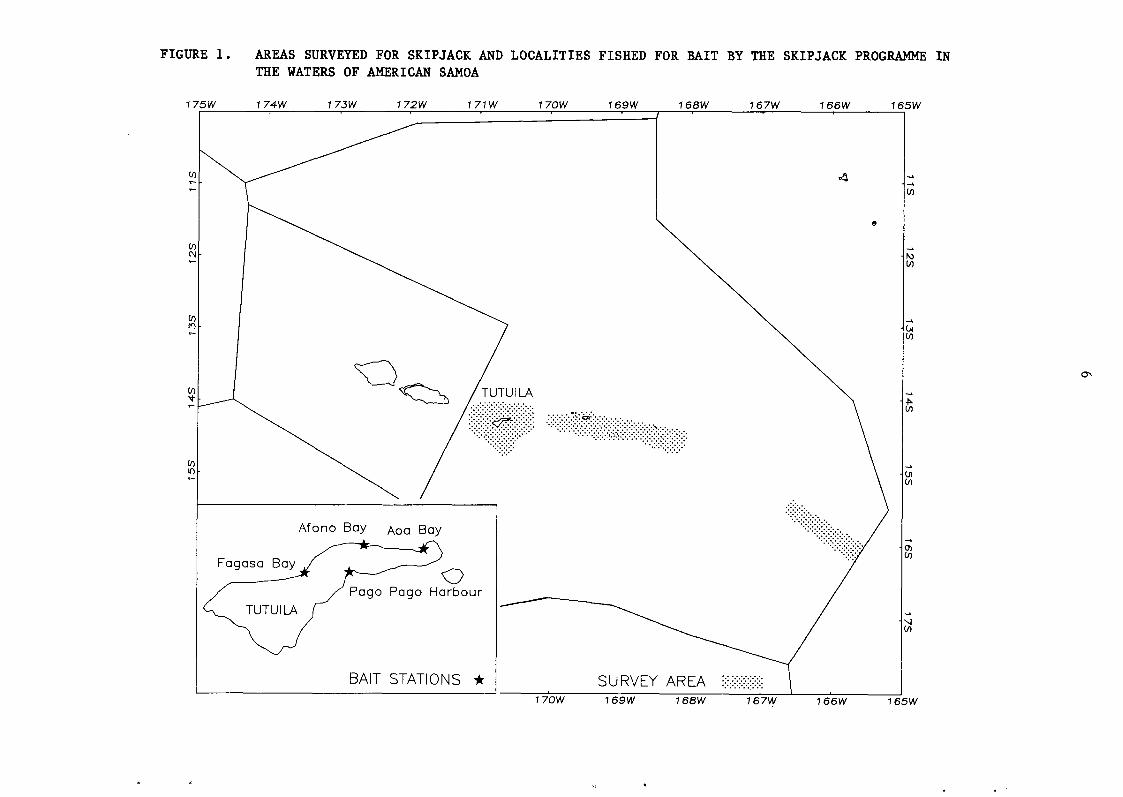
FIGURE 1. AREAS SURVEYED FOR SKIPJACK AND LOCALITIES FISHED FOR BAIT BY THE SK THE WATERS OF AMERICAN SAMOA
175W 174W 173W 172W 171W 170W 169W 168W 167W
170W 169W 168W 167W
7
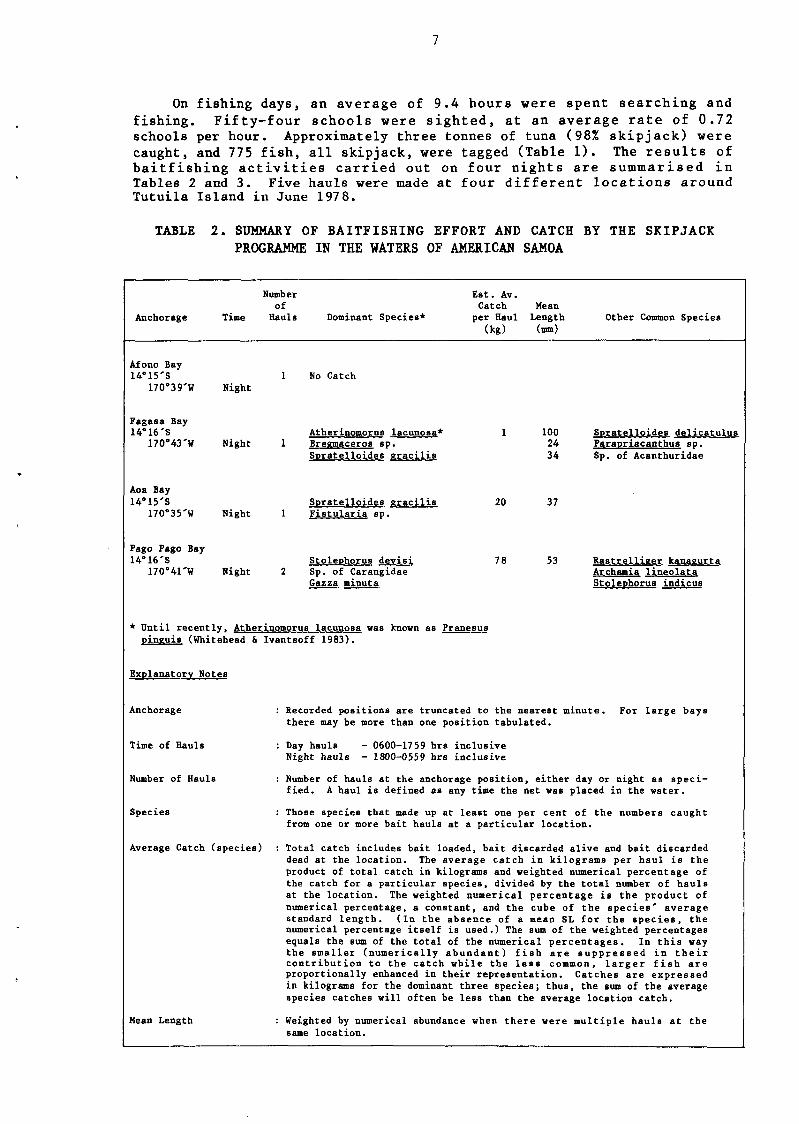
On fishing days, an average of 9.4 hours were spent searching and fishing. Fifty-four schools were sighted, at an average rate of 0.72 schools per hour. Approximately three tonnes of tuna (98% skipjack) were caught, and 775 fish, all skipjack, were tagged (Table 1). The results of baitfishing activities carried out on four nights are summarised in Tables 2 and 3. Five hauls were made at four different locations around Tutuila Island in June 1978.
TABLE 2. SUMMARY OF BAITFISHING EFFORT AND CATCH BY THE SKIPJACK PROGRAMME IN THE WATERS OF AMERICAN SAMOA
Anchorage Time
Number of
Hauls Dominant Species*
Est. Av. Catch Mean
per Haul Length (kg) (mm)
Other Common Species
Afono Bay 14°15'S
170°39'W Night
Fagasa Bay 14°16'S
170°43'W
Aoa Bay 14°15'S
170°35'W
Night
Night
Pago Pago Bay 14°16'S
170°41'W Night
No Catch
Atherinomorus lacunosa* 1 Bregmaceros sp.
Spratelloides gracilis
Spratelloides gracilis 1 Fistularia sp.
Stolephorus devisi 2 Sp. of Carangidae
Gazza minuta
20
78
100 24 34
37
53
Spratelloides delicatulus Parapriacanthus sp. Sp. of Acanthuridae
Rastrelliger kanagurta Archamia lineolata Stolephorus indicus
* Until recently, Atherinomorus lacunosa was known as Pranesus pinguis (Whitehead & Ivantsoff 1983).
Explanatory Notes
Anchorage
Time of Hauls
Number of Hauls
Species
Average Catch (species)
Recorded positions are truncated to the nearest minute. there may be more than one position tabulated.
For large bays
Day hauls Night hauls
0600-17 59 hrs inc lus ive 1800-0559 hrs i n c l u s i v e
Mean Length
Number of hauls at the anchorage position, either day or night as specified. A haul is defined as any time the net was placed in the water.
Those species that made up at least one per cent of the numbers caught from one or more bait hauls at a particular location.
Total catch includes bait loaded, bait discarded alive and bait discarded dead at the location. The average catch in kilograms per haul is the product of total catch in kilograms and weighted numerical percentage of the catch for a particular species, divided by the total number of hauls at the location. The weighted numerical percentage is the product of numerical percentage, a constant, and the cube of the species' average standard length. (In the absence of a mean SL for the species, the numerical percentage itself is used.) The sum of the weighted percentages equals the sum of the total of the numerical percentages. In this way the smaller (numerically abundant) fish are suppressed in their contribution to the catch while the less common, larger fish are proportionally enhanced in their representation. Catches are expressed in kilograms for the dominant three species; thus, the sum of the average species catches will often be less than the average location catch.
Weighted by numerical abundance when there were multiple hauls at the same location.
8
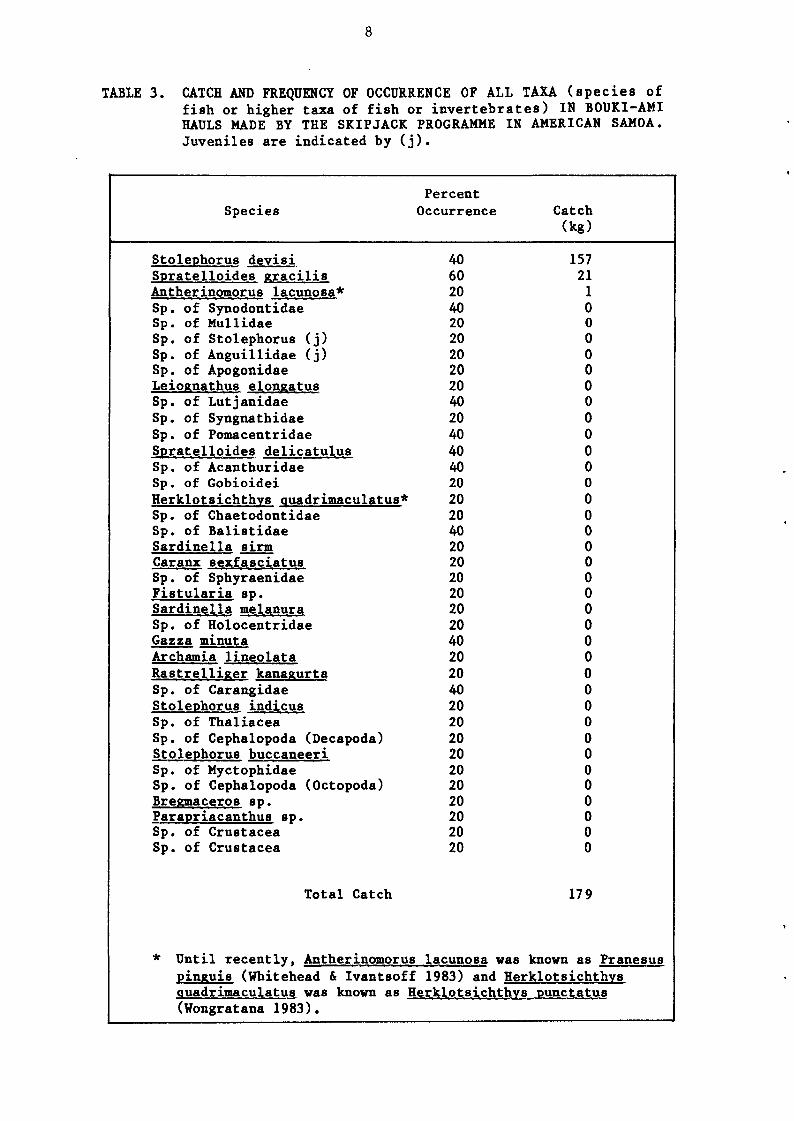
TABLE 3. CATCH AND FREQUENCY OF OCCURRENCE OF ALL TAXA (species of fish or higher taxa of fish or invertebrates) IN BOUKI-AMI HAULS MADE BY THE SKIPJACK PROGRAMME IN AMERICAN SAMOA. Juveniles are indicated by (j).
Species
Stolephorus devisi Spratelloides gracilis Antherinomorus lacunosa* Sp. of Synodontidae Sp. of Mullidae Sp. of Stolephorus (j) Sp. of Anguillidae (j) Sp. of Apogonidae Leioenathus elongatus Sp. of Lutjanidae Sp. of Syngnathidae Sp. of Pomacentridae Spratelloides delicatulus Sp. of Acanthuridae Sp. of Gobioidei Herklotsichthys auadrimaculatus* Sp. of Chaetodontidae Sp. of Balistidae Sardinella sirm Caranx sexfasciatus Sp. of Sphyraenidae Fistularia sp. Sardinella melanura Sp. of Holocentridae Gazza minuta Archamia lineolata Rastrellieer kanasurta Sp. of Carangidae Stolephorus indicus Sp. of Thaliacea Sp. of Cephalopoda (Decapoda) Stolephorus buccaneeri Sp. of Myctophidae Sp. of Cephalopoda (Octopoda) Breemaceros sp. Parapriacanthus sp. Sp. of Crustacea Sp. of Crustacea
Total Catch
* Until recently. Antherinomorus pineuis (Whitehead & Ivantsoff
Percent Occurrence
40 60 20 40 20 20 20 20 20 40 20 40 40 40 20 20 20 40 20 20 20 20 20 20 40 20 20 40 20 20 20 20 20 20 20 20 20 20
lacunosa was
Catch (kg)
157 21 1 0 0 0 0 0 0 0 0 0 0 0 0 0 0 0 0 0 0 0 0 0 0 0 0 0 0 0 0 0 0 0 0 0 0 0
179
known as Pranesus 1983) and Herklotsichthys
auadrimaculatus was known as Herklotsichthys (Wongratana 1983).
punctatus
9
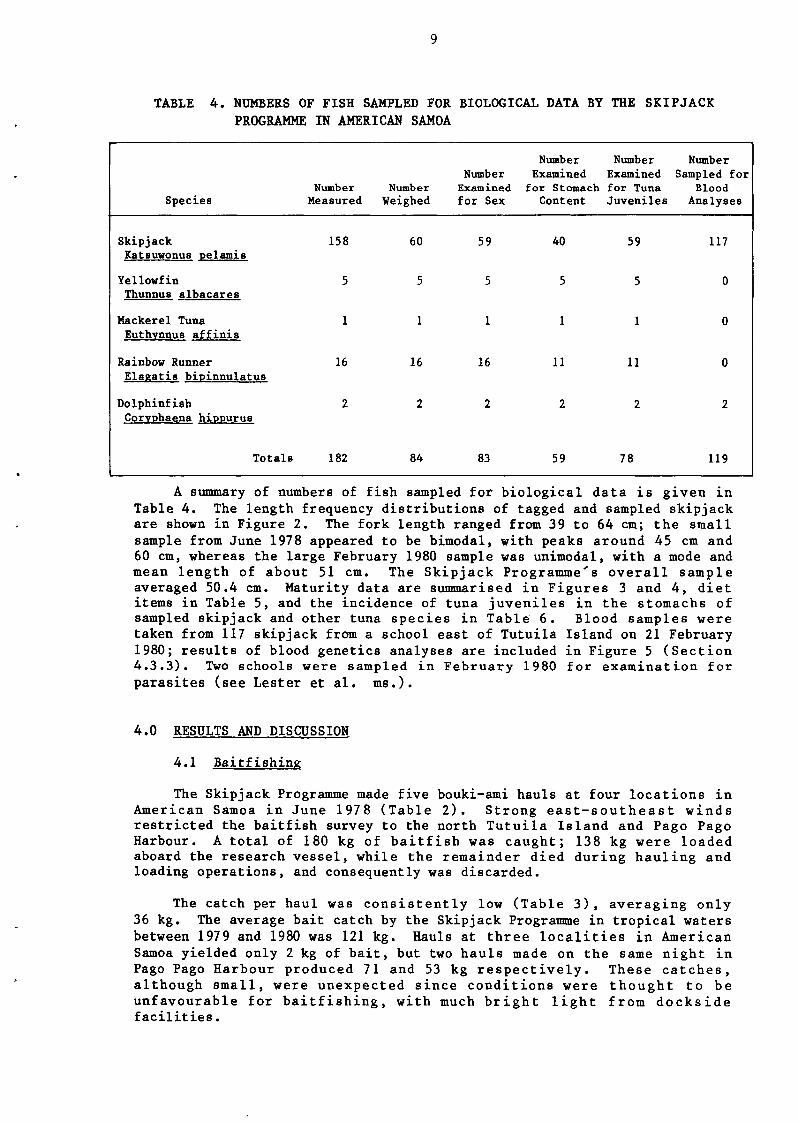
TABLE 4. NUMBERS OF FISH SAMPLED FOR BIOLOGICAL DATA BY THE SKIPJACK PROGRAMME IN AMERICAN SAMOA
Species
Skipjack Katsuwonus pelamis
Yellowfin Thunnus albacares
Mackerel Tuna Euthynnus affinis
Rainbow Runner Elafcatis bipinnulatus
Dolphinfish Coryphaena hippurus
Totals
Number Measured
158
5
1
16
2
182
Number Weighed
60
5
1
16
2
84
Number Examined for Sex
59
5
1
16
2
83
Number Examined for Stomach Content
40
5
1
11
2
59
Number Examined for Tuna Juveniles
59
5
1
11
2
78
Number Sampled for
Blood Analyses
117
0
0
0
2
119
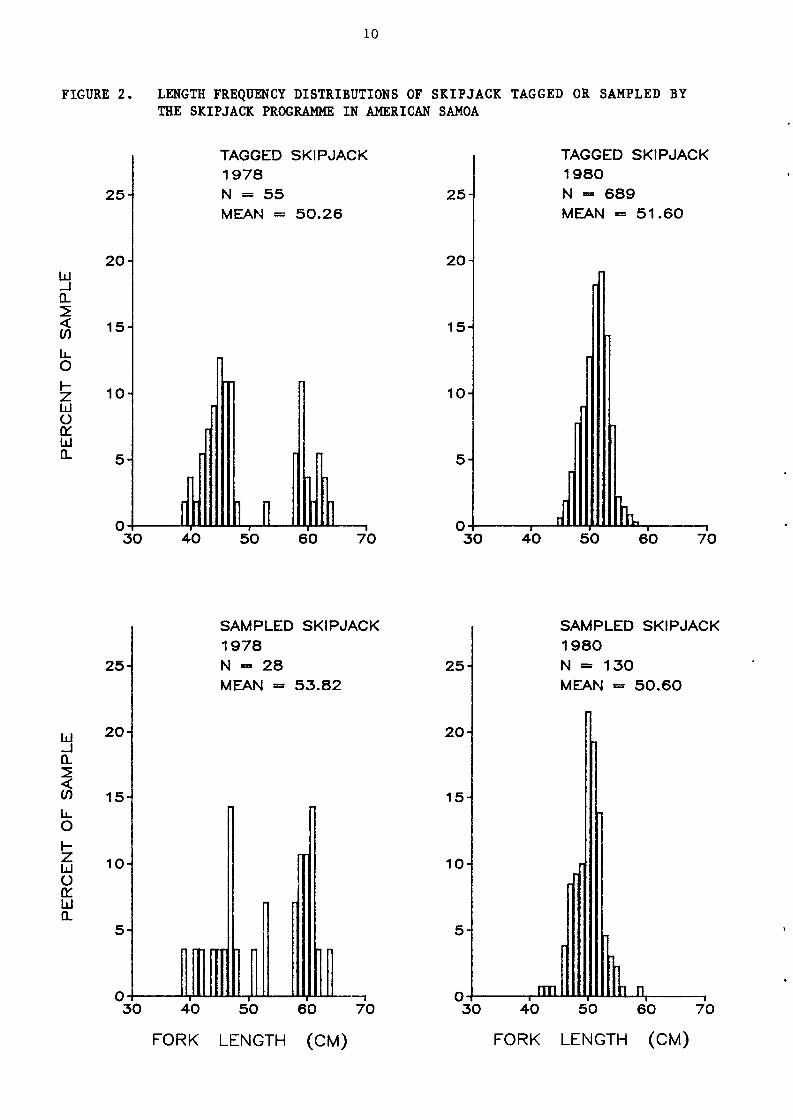
A summary of numbers of fish sampled for biological data is given in Table 4. The length frequency distributions of tagged and sampled skipjack are shown in Figure 2. The fork length ranged from 39 to 64 cm; the small sample from June 1978 appeared to be bimodal, with peaks around 45 cm and 60 cm, whereas the large February 1980 sample was unimodal, with a mode and mean length of about 51 cm. The Skipjack Programme's overall sample averaged 50.4 cm. Maturity data are summarised in Figures 3 and 4, diet items in Table 5, and the incidence of tuna juveniles in the stomachs of sampled skipjack and other tuna species in Table 6. Blood samples were taken from 117 skipjack from a school east of Tutuila Island on 21 February 1980; results of blood genetics analyses are included in Figure 5 (Section 4.3.3). Two schools were sampled in February 1980 for examination for parasites (see Lester et al. ms.).
4.0 RESULTS AND DISCUSSION
4.1 Baitfishing
The Skipjack Programme made five bouki-ami hauls at four locations in American Samoa in June 1978 (Table 2). Strong east-southeast winds restricted the baitfish survey to the north Tutuila Island and Pago Pago Harbour. A total of 180 kg of baitfish was caught; 138 kg were loaded aboard the research vessel, while the remainder died during hauling and loading operations, and consequently was discarded.
The catch per haul was consistently low (Table 3), averaging only 36 kg. The average bait catch by the Skipjack Programme in tropical waters between 1979 and 1980 was 121 kg. Hauls at three localities in American Samoa yielded only 2 kg of bait, but two hauls made on the same night in Pago Pago Harbour produced 71 and 53 kg respectively. These catches, although small, were unexpected since conditions were thought to be unfavourable for baitfishing, with much bright light from dockside facilities.
10
FIGURE 2 . LENGTH FREQUENCY DISTRIBUTIONS OF SKIPJACK TAGGED OR SAMPLED BY THE SKIPJACK PROGRAMME IN AMERICAN SAMOA
25-
20-
15-
10-
5-
0-
TAGGED SKIPJACK 1978 N = 5 5 MEAN «- 50 .26
r
r
_ [ , : . . .
n r
r
l B
•
l ,
2 5 -
20-
15-
10-
5-
0-
TAGGED SKIPJACK 1980 N - 6 8 9 MEAN = 5 1 . 6 0
r
, i ,
•
•
lh.. , 30 40 50 60 70 30 40 50 60 70
25-
20-
15-
10-
5-
0 -
3 A M r 1978
U t U J >»\ir jMv_.
N - 2 8 MEAN = 53 .82
11,111 I I
•
• "I r
-LU.L_.LL u—no,
•
LLUJ ,
25-
20-
15-
10-
5-
0-
O M M t - L C U 2>l \ i rOA<-.
1980 N = 130 MEAN = 5 0 . 6 0
j
.ml...
•
-
-.
....Jui ., 30 40 50 60 70 30 40 50 60 70
FORK LENGTH (CM) FORK LENGTH (CM)
11
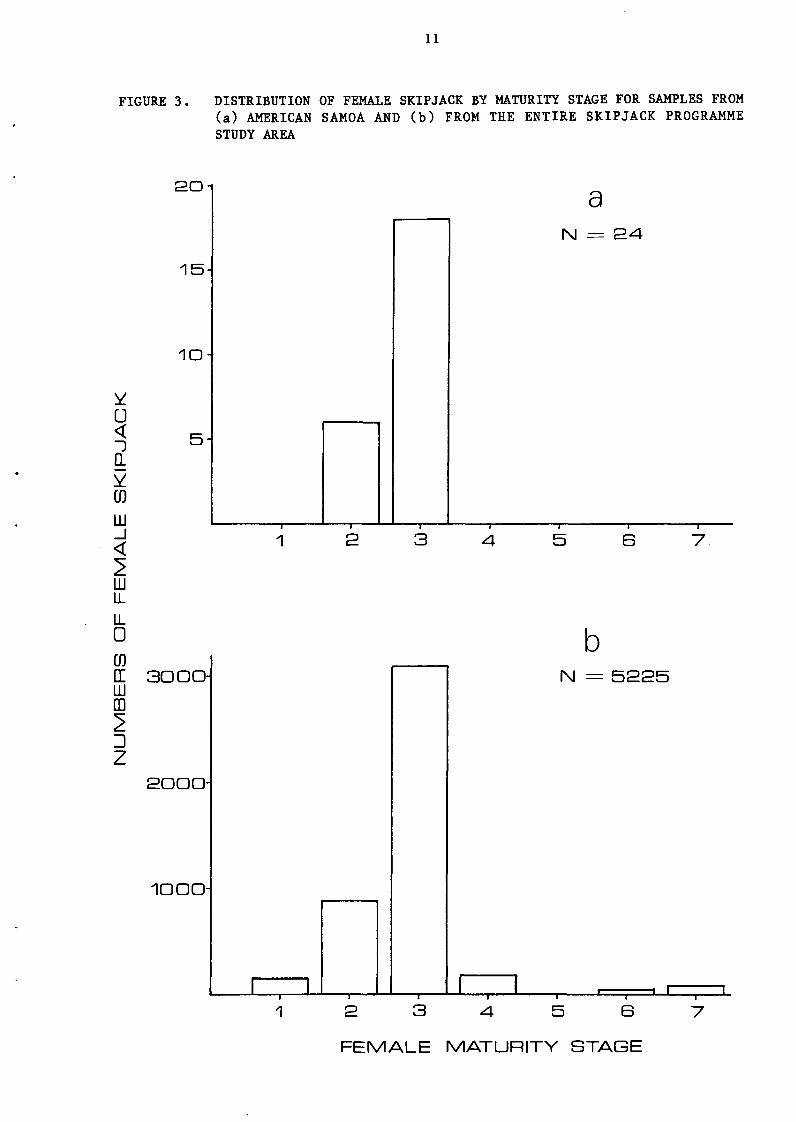
FIGURE 3 . DISTRIBUTION OF FEMALE SKIPJACK BY MATURITY STAGE FOR SAMPLES FROM ( a ) AMERICAN SAMOA AND ( b ) FROM THE ENTIRE SKIPJACK PROGRAMME STUDY AREA
2 0
u <
y CD
LU I
<
1 5
10-
a N = 2 4
7
LU LL
LL 0 CD LI LU CD
3 Z
b 3 0 00 -
2 0 0 0 -
1000
N = 5 2 2 5
- 1 —
B 1 r
~7
F E M A L E MATURITY STAGE
12
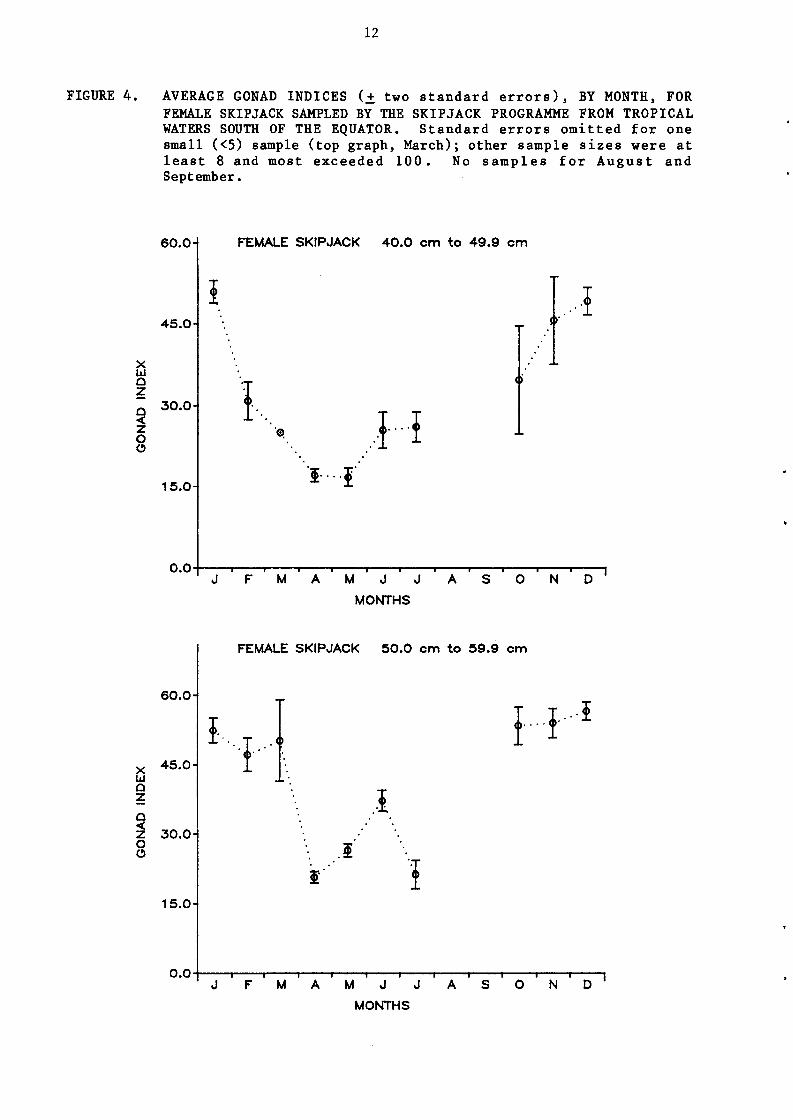
FIGURE 4. AVERAGE GONAD INDICES (± two standard errors), BY MONTH, FOR FEMALE SKIPJACK SAMPLED BY THE SKIPJACK PROGRAMME FROM TROPICAL WATERS SOUTH OF THE EQUATOR. Standard errors omitted for one small (<5) sample (top graph, March); other sample sizes were at least 8 and most exceeded 100. No samples for August and September.
6 0 . 0
X Ui Q
z
z o o
4 5 . 0
3 0 . 0 -
15.0
FEMALE SKIPJACK 4 0 . 0 c m to 4 9 . 9 cm
\ "A *>•
\ }A I ••i....f'
— , , — i i — i — i — i — i — i — i — i — 1 0.0-J F M A M J J A S O N D
MONTHS
6 0 . 0
x 45.0-1 Ui Q Z
Q
Z 3 0 . 0 O O
15.0
0.0
FEMALE SKIPJACK 5 0 . 0 c m to 5 9 . 9 cm
I r i-i ,i
$
r I
i i l i i r i 1 i 1 1 1
J F M A M J J A S O N D
MONTHS
13
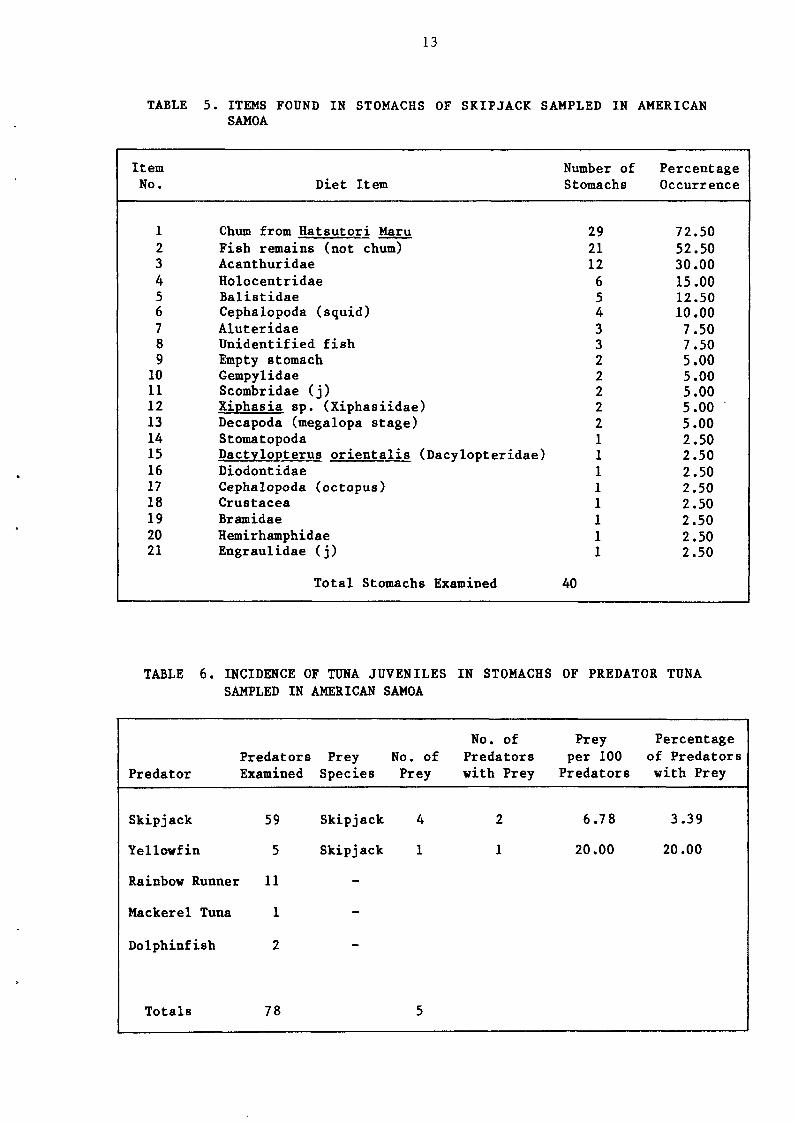
TABLE 5 . ITEMS FOUND IN STOMACHS OF SKIPJACK SAMPLED IN AMERICAN SAMOA
Item No.
1 2 3 4 5 6 7 8 9 10 11 12 13 14 15 16 17 18 19 20 21
Diet Item
Chum from Hatsutori Maru Fish remains (not chum) Acanthuridae Holocentridae Balistidae Cephalopoda (squid) Aluteridae Unidentified fish Empty stomach Gempylidae Scombridae (j) Xiphasia sp. (Xiphasiidae) Decapoda (megalopa stage) Stomatopoda Dactvlopterus orientalis (I Diodontidae Cephalopoda (octopus) Crustacea Bramidae Hemirhamphidae Engraulidae (j)
Total Stomachs
lacylopteridae)
Examined
Number of Stomachs
40
29 21 12 6 5 4 3 3 2 2 2 2 2
Percentage Occurrence
72.50 52.50 30.00 15.00 12.50 10.00 7.50 7.50 5.00 5.00 5.00 5.00 5.00 2.50 2.50 2.50 2.50 2.50 2.50 2.50 2.50
TABLE 6 . INCIDENCE OF TUNA JUVENILES IN STOMACHS OF PREDATOR TUNA SAMPLED IN AMERICAN SAMOA
Predator
Skipjack
Yellowfin
Predators Examined
59
5
Rainbow Runner 11
Mackerel Tuna
Dolphinfish
Totals
1
2
78
Prey No. of Species Prey
Skipjack 4
Skipjack 1
-
-
-
5
No. of Predators with Prey
2
1
Prey per 100 Predators
6.78
20.00
Percentage of Predators with Prey
3.39
20.00

FIGURE 5.
1.0
> o z LU D o LU (Z LL
LU Z LU O
LU (/)
<
(Z L U I -(/)
i_u
.9 -
.8
.7 -
.6
.5 -
.4 --
.3
SKIPJACK SERUM ESTERASE GENE FREQUENCY FOR 163 SAMPLES VERSUS TH SAMPLE LOCATION. Each point is the average of approximately 100 spe a single school on the same day. The American Samoa sample is shown
1
—
-
-
1
1
••
1
X . • *
• X,
1 I
•
• •
1 1
• • •
• • • *
#» *
X. • •
• * A .
• X.
• • \ • •
1
«.• • • • •
1
•
•
•
i
1
•
•
^X\ •
. * • I N • • • t
• • • •
1
1 1
•
o •
1
•
X. •
•
1
1
• •
• x^
1
1 '
• • • • • • • • •
100E 120E 140E 160E 180 160W 140W 120W
LONGITUDE
15
The bait catch from Pago Pago Harbour was dominated by one species of anchovy, Stolephorus devisi. Other hauls were dominated by the sprat Spratelloides gracilis. Both species are very effective as live bait for tuna (Argue et al. ms.). The relative abundances of baitfish species captured during all surveys undertaken by the Programme throughout the central and western Pacific are given in Skipjack Programme (1981d).
Published results of other baitfish surveys in American Samoa have been similarly low. In 1970 the Charles H. Gilbert caught only 2 80 kg of bait in eight sets of a lampara net in Pago Pago Harbour at night, and only 308 kg in 31 sets of a beach seine during daylight hours (Hida 1970). Catches were dominated by the mackerel, Rastrelliger kanagurta. the sardine Sardinella melanura and the herring Herklotsichthys punctatus (synonymous with H. quadrimaculatus; Wongratana 1983). The last two species are usually considered to be good live bait for tuna, but specimens of S. melanura were too big to be effective. Daytime visual surveys and night sets of bait attraction lights by the Anela in 1972 revealed insignificant quantities of bait in Pago Pago Harbour or around the coast of Tutuila (Uchida & Sumida 1973). During fishing trials by the research vessel Alofaga between 1972 and 1975, an average of less than 8 kg of bait was taken in several hundred sets of either a beach seine, a lift net or a "blanket net" (Sesepasara undated). The J-Ann crew were unable to capture significant quantities of live bait during surveys in 1978 (Vergne et al. 1978). The Towns end Cromwell made observations of bait around attraction lights at six stations during 1979, but reported only minor quantities (Anon. 1979).
The paucity of the baitfish resource can be largely attributed to the absence of suitable habitat. In general, baitfish require extensive shallow areas, usually within reef lagoons, adjacent to freshwater inflows which carry nutrients to support high local productivity. Exploitation of such a resource by bouki-ami techniques requires anchorages protected from the wind, with little current and between 25 and 40 metres depth to allow deployment of the net (Hallier et al. 1982). Few such areas exist in American Samoa except for Pago Pago Harbour, but it has not proved to be a good baiting ground. The poor results obtained by the Skipjack Programme and by previous surveys, which have tended to concentrate on what were thought to be the best available grounds, suggest that other areas are unlikely to contain extensive baitfish resources.
The culture of mollies (Poecilia mexicana and P. vittata) as an alternative source of bait was initiated in American Samoa in 1973 (Baldwin 1977; Pacific Tuna Development Foundation 1982). Preliminary fishing trials aboard the Alofaga (Sesepasara undated) led to an expansion of the project in 1977 (Pacific Tuna Development Foundation 1982), with major fishing trials conducted aboard the J-Ann in 1978. Almost 18 tonnes of tuna were caught, with an average tuna to bait ratio of 9.6:1 (Vergne et al. 1978); Pacific Tuna Development Foundation 1982). Similar results were reported by the Skipjack Programme (1980b, 1981e) during trials conducted at various times between June 1978 and February 1980. However, production costs are a major factor in the viability of a pole-and-line fishery relying on the culture of bait. Vergne et al. (1978) reported that bait costs were twice the value of the tuna catches, and that significant improvements in culture techniques were required to achieve cost effectiveness. Further discussion of economic aspects of baitfish culture to supply commercial-scale operations may be found in Kearney & Rivkin (1981).
16
4.2 Skipiack Fishing
A total of 2.8 tonnes of skipjack and yellowfin were captured in seven fishing days during the two Skipjack Programme surveys of American Samoa, an average catch of 0.4 tonnes per day. Using the conversion ratio of 3.47 (Section 2.3), the Skipjack Programme catches under commercial conditions would have been approximately 0.2 tonnes per day for the June 197 8 survey and 4.0 tonnes in February 1980. The 1980 figure reflects very good fishing on one day (estimated commercial catch: 8.1 tonnes), using cultured milkfish (Chanos chanos) transported from Rangiroa, French Polynesia, as live bait. The result during the first survey might be attributed to the live-bait characteristics of mollies, which were used almost exclusively, but the tuna schools also responded poorly to wild bait at the time. The estimated average commercial catch during the entire period of the Skipjack Programme throughout the central and western Pacific was 3.5 tonnes per day. Fishing operations in American Samoa by the Anela in 1972, using bait transported from the Marshall Islands and Fiji, produced an average of 4 tonnes per day during 3 fishing days (Uchida & Sumida 1973). The Japanese pole-and-line fleet, using live bait transported from Japan, caught 7.4 tonnes of tuna per day during 9 boat days spent in American Samoan waters in 1975 and 1976 (Skipjack Programme 1980a).
Since the Programme's fishing success in American Samoa was strongly affected by the poor biting response of tuna schools chummed during June 1978, the rate of sighting tuna schools is probably more informative of the abundance of surface tuna than is catch rate. Fifty-four schools of tuna were sighted by the Skipjack Programme in the waters of American Samoa on both surveys. During the first survey 0.88 schools were sighted per hour, and during the second, the rate was 0.31 per hour. The figure for the first survey was slightly higher than the average sighting rate of 0.75/hour during the entire Skipjack Programme. Very high school sighting rates were recorded during the same periods in nearby waters of Western Samoa (Tuna Programme 1984). Most of the 23 schools identified to species contained skipjack (Table 1). Yellowfin occurred in six schools and there were occasional schools of other species, mainly rainbow runner (Elagatis bipinnulatis) and dolphinf ish (Coryphaena hippurus). A large proportion (57%) of schools were not identified, and may have contained species less commercially valuable than skipjack or yellowfin.
During 26 hours of searching for tuna schools in the Samoa area in the 1950s and early 1960s, the U.S. Bureau of Commercial Fisheries spotted only one tuna school (Waldron 1964). From February to April 1970, the crew of the NMFS vessel Charles H. Gilbert observed 144 schools in the general area of Samoa in 31 days of spotting, an average rate of 4.6 schools per day. In 4 days in March and April of 1972 the crew of another NMFS vessel Anela. sighted an average of 6.2 schools per day. Surveys around Tutuila by the Alofaga and various smaller vessels between 1972 and 1978 (Swerdloff 1972; Sesepasara undated) produced similar school sighting rates. Most schools were of skipjack.
The Skipjack Programme surveys, and those by other agencies, demonstrate that surface tuna may be abundant in American Samoa. Differences between the Skipjack Programme results and those from previous surveys undoubtedly are due to differences between spotters, vessels and weather conditions as well as variations in the numbers of tuna schools. While tuna are present year-round, there appears to be a peak in skipjack abundance in summer (Swerdloff 1972; Sesepasara undated). Other areas at similar latitudes in the South Pacific, such as Fiji and French Polynesia,
17
report abundance and catches peaking in summer (Kearney 1982b; Gillett & Kearney 1983).
4.3 Skipjack Biology
4.3.1 Diet
Table 5 lists 20 food items found in the 40 skipjack stomachs examined by the Skipjack Programme in American Samoa. The stomach contents were typical of those from skipjack from other tropical waters in the South Pacific Commission area. Apart from chum from the research vessel, unidentified fish remains and surgeonfish (Acanthuridae) were the most common food items, occurring in over 15 per cent of the stomachs examined. The results in Table 5 indicate the importance of fish to the diet, but also emphasise the opportunistic nature of skipjack feeding. Analyses based on contents of all skipjack stomachs sampled throughout the entire region are currently in progress.
4.3.2 Maturity and reproduction
Female gonad maturity stages for skipjack samples from both v i s i t s to American Samoa are shown in Figure 3 . During the Skipjack Programme's work, seven stages of gonad ma tu r i t y were recognised using c r i t e r i a in Argue (1982), representing a p rogress ion in r ep roduc t ive cond i t ion from immature (stage 1) to post-spawning (stages 6 and 7 ) . Maturing gonads were c lass i f ied as stages 2 and 3 , mature gonads as stage 4 and r i p e gonads as s tage 5 . On both v i s i t s to American Samoa, s t a g e 3 gonads were predominant, with no mature f i sh . Notwithstanding the limited sample s ize , th i s d i s t r ibu t ion of maturity s tages i s s i m i l a r to t h a t found for 5,225 female skipjack examined by the Programme between 1977 and 1980 (Figure 3 ) .
Seasonal changes in female gonad index'1' for a l l Skipjack Programme samples from tropical waters suggest that skipjack spawning is most intense south of the Equator between October and March (Figure 4) . This t rend i s very similar to that presented by Naganuma (197 9) for samples c o l l e c t e d from a wide area of the t ropica l south Pacific waters, and by Lewis (1981) for samples from the Papua New Guinea f ishery, a few degrees south of the Equator, Skipjack sampled from American Samoa in June 197 8 and February 1980 had mean gonad index values of 21.1 and 24.9 respect ively . The former figure i s similar to winter averages in Figure 4, but the l a t t e r va lue i s considerably lower than average summer values. However, the February 1980 figure for American Samoa i s based on a sample of only 11 s k i p j a c k , which renders close comparison unre l iab le . Evidence from the skipjack surveys of other countries at the same la t i tude as American Samoa, inc lud ing Western Samoa, suggests that breeding i s l i k e l y to occur in summer in American Samoa.
A further index of breeding is the incidence of skipjack j uven i l e s in the stomachs of p reda to r s (Table 6 ) . Only t h ree of the 78 p r e d a t o r s examined from American Samoa (two skipjack and one yellowfin) had sk ip jack juveniles in t h e i r stomachs. They contained f ive sk ip jack j u v e n i l e s ,
1 Gonad index=10?(gonad weight g m / ( f i s h l e n g t h mm)3) ( S c h a e f e r & Orange 1956). High index values, par t icu la r ly over 50, a re a s s o c i a t e d with skipjack whose gonads have a high percentage of eggs that are ready to be spawned (Raju 1964).
18
giving a frequency of 6.41 per 100 predator stomachs. This was among the lowest figures recorded during the entire Skipjack Programme, and may be compared to values of 25-50 juveniles per 100 predator stomachs found in Vanuatu, Wallis and Futuna or the Marquesas Islands (Argue et al. 1983). The frequency of juvenile skipjack in predator stomachs was also low (4.55) in adjacent waters of Western Samoa (Tuna Programme 1984). The overall average for the Programme was 10.8 in tropical waters. Argue et al. (1983) presented detailed analyses of the tuna juvenile data, taking into account size-selective predation by adults, time of day, distance from land and sampling season. Skipjack juveniles occurred most frequently in the stomachs of skipjack captured by the Programme between October and March in tropical waters south of the Equator, coinciding with the period of maximum gonad development in skipjack in these waters. The data also indicate that during the 1977 to 1980 survey period, abundance of juvenile skipjack within this region was highest in two areas, one centred approximately on Solomon Islands - Papua New Guinea - Vanuatu, and the other on the Marquesas and Tuamotu Islands. As virtually nothing is known about the movements of juvenile skipjack, the relative contributions of spawning in these areas or in local waters to recruitment in American Samoa cannot be established.
4.3.3 Blood genetics and population structure
There is movement of some skipjack adults over much of the western and central Pacific (Figure B, inside back cover), suggesting that genetic exchange is possible among all parts of the Programme's study area. However, detailed examination of tag recapture data (Section 4.4) and preliminary analyses of fishery interactions (Section 4.4.3) indicate that the actual level of exchange of skipjack, at least of the size caught by pole-and-line gear, may be quite low. Analyses of the genetic variation in skipjack throughout the central and western Pacific were undertaken by the Skipjack Programme to provide additional information on migration and population structure and, ultimately, potential fisheries interactions.
Electrophoretic analyses of skipjack blood samples reveal a gradient in esterase gene frequency, a genetic marker used to infer population structure, across the tropical Pacific between approximately 120°E and 130°W (Figure 5). The esterase gene frequency for the sample taken in the waters of American Samoa was within the 95 per cent prediction limits for the regression line of average gene frequency on longitude. There was considerable variation in individual esterase gene frequency values along this average line, although the cause of this variability was unclear (Anon. 1981).
Several models of population structure of skipjack in the Pacific Ocean have been proposed (Fujino 1972, 1976; Sharp 1978; Anon. 1981). One of these models, suggested by the Programme's tagging and blood genetics data, is called the clinal population structure model (Anon. 1981). It has the basic premise that the probability of breeding between skipjack is inversely proportional to the distance between them. Acceptance of this model implies that there are no genetically isolated skipjack subpopulations in the study area, separated by geographical boundaries, which is contrary to hypotheses advanced by Fujino (1972, 1976) and Sharp (1978).
The gradient in esterase gene frequency is consistent with several possible distributions of skipjack spawning, one being a relatively even distribution of skipjack spawning in tropical waters across the study area.
19
Alternatively, it may be considered a product of "overlap" of skipjack from two or more centres of higher spawner density at the approximate extremes of the study area or beyond. The similarity between eastern Pacific esterase gene frequencies (east of 130°W) and those from French Polynesia suggests that skipjack from these areas may have the same genetic origin, and collectively may represent a spawning group at the eastern extreme of the study area. The geographic pattern of occurrence of juvenile skipjack in predator stomachs (Section 4.3.2) tentatively supports the latter view of skipjack spawning.
Parasite samples were taken over a wide range of tropical waters, including those of American Samoa, and from subtropical and temperate waters of Norfolk Island and New Zealand. A multivariate analysis presented by Lester et al. (ms.) showed that the parasite faunas from widely separated tropical areas were similar, and that skipjack caught in New Zealand carried many tropical parasites. The parasite studies did not improve definition of skipjack population structure, nor offer a means of clarifying fishery interactions.
After two workshops hosted by the Skipjack Programme to examine the question of skipjack population structure, it was concluded (Anon. 1980, 1981) that it is difficult to choose between the various population structure hypotheses, due to limitations of the extant blood genetics, tagging and ancillary data. However, the genetics data supported the conclusions that there should be minimal short-term interactions between fisheries at the extremes of the Programme's study area, and that interaction should increase as the distance between fisheries decreases.
4.3.4 Growth
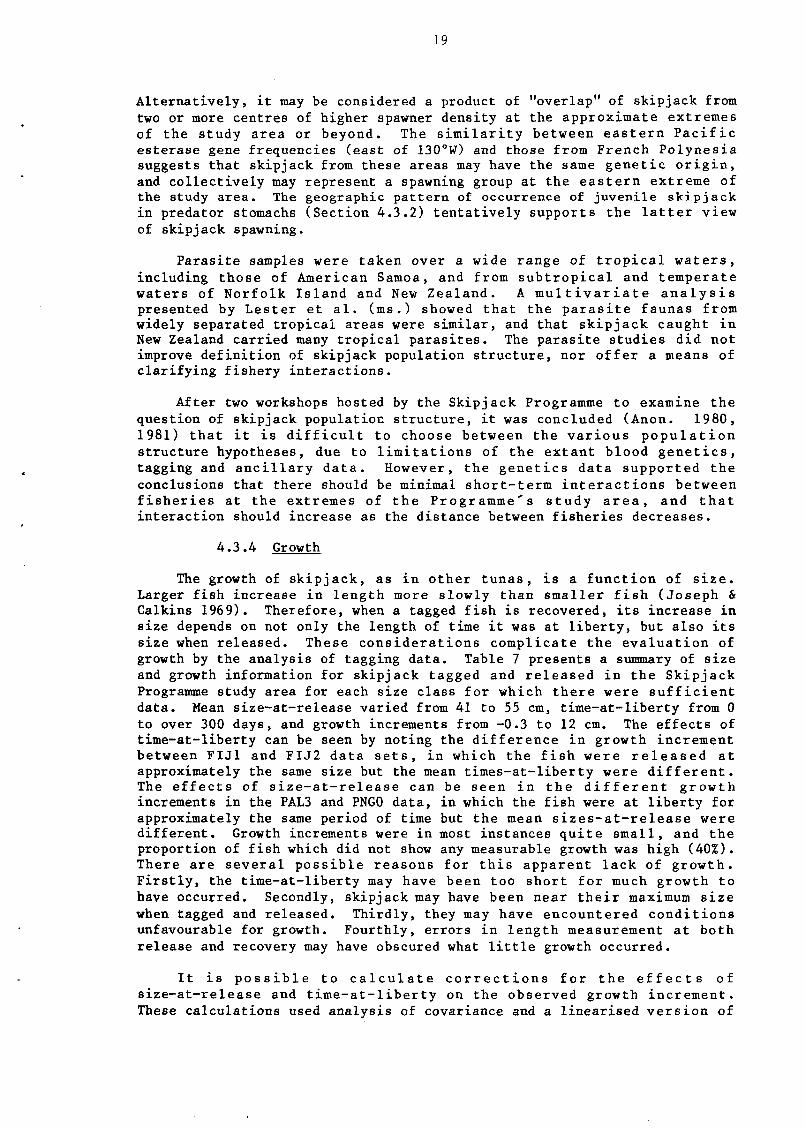
The growth of sk ip jack , as in o ther t u n a s , i s a funct ion of s i z e . Larger fish increase in l eng th more slowly than smal ler f i s h (Joseph & Calkins 1969). Therefore, when a tagged fish is recovered, i t s increase in size depends on not only the length of time i t was at l i be r ty , but also i t s size when released. These cons ide ra t i ons complicate the eva lua t ion of growth by the analysis of tagging data. Table 7 presents a summary of size and growth information for skipjack tagged and r e l e a s e d in the Skipjack Programme study area for each size class for which the re were s u f f i c i e n t data. Mean s ize-a t - re lease varied from 41 to 55 cm, t ime-a t - l iber ty from 0 to over 300 days, and growth increments from -0.3 to 12 cm. The effects of t ime-a t - l iber ty can be seen by noting the d i f fe rence in growth increment between FIJ I and FIJ2 data s e t s , in which the f i s h were r e l e a s e d a t approximately the same size but the mean t imes -a t - l ibe r ty were d i f f e r e n t . The e f f e c t s of s i z e - a t - r e l e a s e can be seen i n t h e d i f f e r e n t growth increments in the PAL3 and PNGO data, in which the fish were at l iber ty for approximately the same period of time but the mean s i z e s - a t - r e l e a s e were d i f ferent . Growth increments were in most instances q u i t e smal l , and the proportion of f ish which did not show any measurable growth was high (40%). There are severa l pos s ib l e reasons for t h i s apparent lack of growth. F i r s t l y , the t ime-a t - l iber ty may have been too short for much growth to have occurred. Secondly, skipjack may have been near t h e i r maximum s i z e when tagged and released. Thirdly, they may have encountered cond i t ions unfavourable for growth. Fourthly, errors in length measurement a t both release and recovery may have obscured what l i t t l e growth occurred.
I t i s p o s s i b l e to c a l c u l a t e c o r r e c t i o n s for t he e f f e c t s of s i z e - a t - r e l e a s e and t i m e - a t - l i b e r t y on the observed growth increment . These calculat ions used analysis of covariance and a l inearised v e r s i o n of
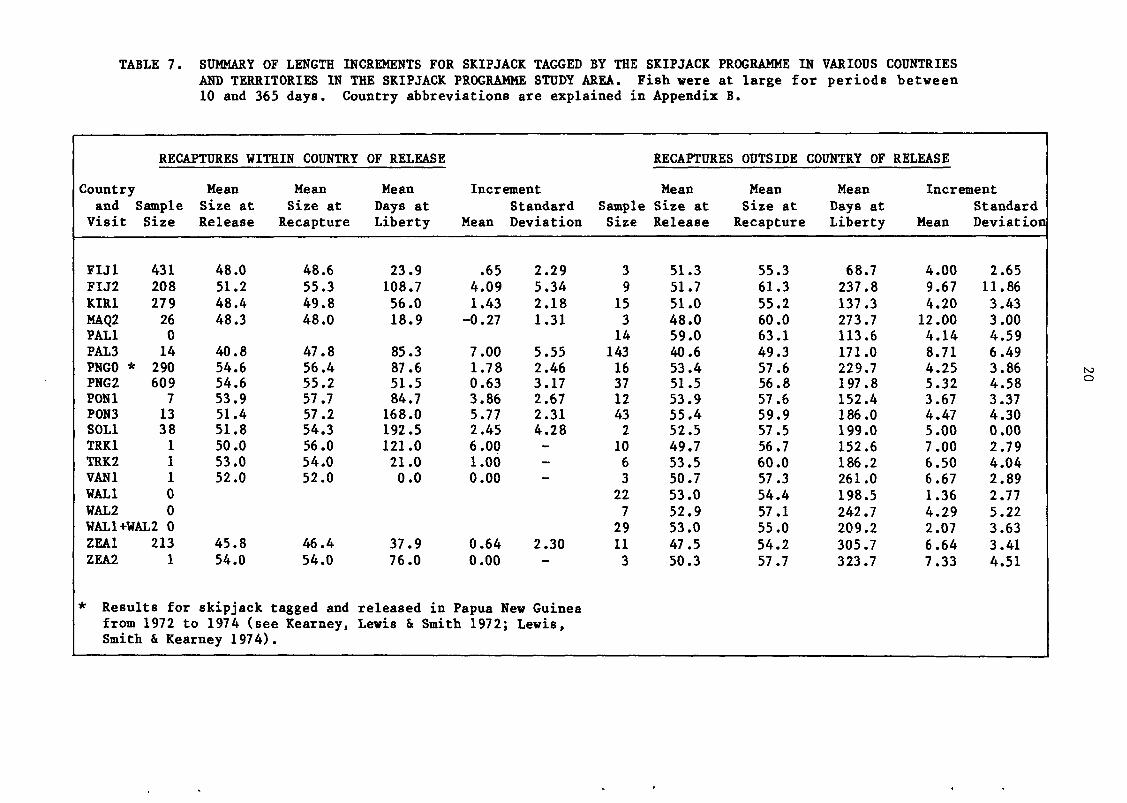
TABLE 7. SUMMARY OF LENGTH INCREMENTS FOR SKIPJACK TAGGED BY THE SKIPJACK PROGRAMME AND TERRITORIES IN THE SKIPJACK PROGRAMME STUDY AREA. Fish were at large f 10 and 365 days. Country abbreviations are explained in Appendix B.
RECAPTURES WITHIN COUNTRY OF RELEASE RECAPTURES OUTSIDE
Country Mean Mean Mean Increment Mean Mean and Sample Size at Size at Days at Standard Sample Size at Size at Visit Size Release Recapture Liberty Mean Deviation Size Release Recapture
FIJI FIJ2 KIR1 MAQ2 PALI PAL3 PNGO * PNG2 PON1 PON3 SOLI TRK1 TRK2 VAN1 WAL1 WAL2
431 208 279 26 0 14 290 609 7 13 38 1 1 1 0 0
WAL1+WAL2 0 ZEA1 ZEA2
213 1
48.0 51.2 48.4 48.3
40.8 54.6 54.6 53.9 51.4 51.8 50.0 53.0 52.0
45.8 54.0
48.6 55.3 49.8 48.0
47.8 56.4 55.2 57.7 57.2 54.3 56.0 54.0 52.0
46.4 54.0
23.9 108.7 56.0 18.9
85.3 87.6 51.5 84.7 168.0 192.5 121.0 21.0 0.0
37.9 76.0
.65 4.09 1.43 -0.27
7.00 1.78 0.63 3.86 5.77 2.45 6.00 1.00 0.00
0.64 0.00
2.29 5.34 2.18 1.31
5.55 2.46 3.17 2.67 2.31 4.28 ---
2.30 -
3 9 15 3 14 143 16 37 12 43 2 10 6 3 22 7 29 11 3
51.3 51.7 51.0 48.0 59.0 40.6 53.4 51.5 53.9 55.4 52.5 49.7 53.5 50.7 53.0 52.9 53.0 47.5 50.3
55.3 61.3 55.2 60.0 63.1 49.3 57.6 56.8 57.6 59.9 57.5 56.7 60.0 57.3 54.4 57.1 55.0 54.2 57.7
Results for skipjack tagged and released in Papua New Guinea from 1972 to 1974 (see Kearney, Lewis & Smith 1972; Lewis, Smith & Kearney 1974).
21
the von Ber ta lanf fy growth equa t ion , to produce a s tandard growth increment for an a r b i t r a r y s i z e - a t - r e l e a s e and t i m e - a t - l i b e r t y ( S i b e r t e t a l . 1983) . S tandardised growth increments a r e p r e s e n t e d i n T a b l e 8 . Growth v a r i e d cons iderab ly from country to coun t ry , and d i f f e r e d s i g n i f i c a n t l y be tween v i s i t s t o a c o u n t r y and be tween f i s h r e c o v e r e d i n s i d e or o u t s i d e t h e country of r e l e a s e ( S i b e r t e t a l . 1983). Thus, s k i p j a c k growth seems t o be h i g h l y v a r i a b l e i n t ime and s p a c e . The growth o b s e r v e d i n t a g g e d sk ip jack was a funct ion of where and when the f i s h were t a g g e d , and where they were r ecovered . I t may be c l o s e l y coupled to environmental cond i t i ons such as tempera ture and the o c e a n o g r a p h i c v a r i a b l e s t h a t a r e t h o u g h t t o r e g u l a t e the abundance of food.
TABLE 8. STANDARDISED INCREMENTS (cm) OF LENGTH FOR FISH 50 CM LONG AT RELEASE AND AT LIBERTY FOR 90 DAYS. The 95 pe r c e n t c o n f i d e n c e i n t e r v a l of e a c h i n c r e m e n t i s g i v e n i n p a r e n t h e s e s . Count ry a b b r e v i a t i o n s a r e e x p l a i n e d i n Appendix B.
Country
FIJ
KIR
PAL
PNG
PON
SOL
ZEA
Increment
4.5
1.4
8.5
3.6
4.1
2.5
1.5
(±1.2)
(±1.2)
(±6.4)
(±1.9)
(±4.1)
(±1.4)
(±5.2)
Visits Included
FIJI, FIJ2
KIR1
PAL3
PNG 2
P0N3
SOLI
ZEA1
Only four of the sk ip jack r e l ea sed i n American Samoa were r e c o v e r e d w i t h r e l i a b l e i n f o r m a t i o n on t i m e - a t - l i b e r t y and s i z e - a t - r e l e a s e and - r e c a p t u r e . Thus, t h e r e a re i n s u f f i c i e n t da ta on which t o make a g e n e r a l assessment of the growth of f i s h i n American Samoan w a t e r s .
4 .4 Tag Recapture Data
As of 10 October 1983 , fou r r e c o v e r i e s of t h e 775 t a g g e d s k i p j a c k (1.2%) r e l e a s e d i n the waters of American Samoa had been n o t i f i e d t o t h e Skipjack Programme. Three were r e c o v e r e d l o c a l l y , t h a t i s , i n American Samoan w a t e r s , and one was recovered in Western Samoan w a t e r s . A l l of t h e l oca l r ecove r i e s were by the Skipjack Programme resea rch v e s s e l on the same day they were r e l e a s e d .
4 . 4 . 1 Skipjack migra t ions
The one s k i p j a c k w h i c h m i g r a t e d t o W e s t e r n Samoan w a t e r s was recap tured a f t e r a per iod of 54 days a t l i b e r t y , 120 n a u t i c a l m i l e s from i t s r e l e a s e p o i n t . There was a l s o one r e c o r d of a m i g r a t i o n i n t h e
22
opposite d i rec t ion: one skipjack released in Western Samoa was recap tu red in American Samoa after 224 days a t l i b e r t y , 76 n a u t i c a l mi les from i t s point of r e l e a s e . A mig ra t ion of 2,561 n a u t i c a l miles was made by a skipjack tagged in New South Wales (Australia) and recaptured in American Samoa by a Japanese p o l e - a n d - l i n e v e s s e l a f t e r 305 days a t l i b e r t y . S t ra igh t - l ine representat ions of these three internat ional migrat ions i n t o or out of American Samoan waters are shown in Figure 6.
The low number of recoveries in American Samoan waters of f i sh tagged e i t h e r in American Samoa or elsewhere by t h e S k i p j a c k Programme i s undoubtedly a r e f l e c t i o n of the low f i sh ing e f f o r t in American Samoa. There i s only a low l e v e l of l o c a l f i s h i n g f o r t una ( C r o s s l a n d & Grandperrin 1979), while most indus t r i a l - sca le operations a t the time the tags were at l ibe r ty used longl in ing techniques (Sec t ion 1 .1) , to which surface-schooling skipjack are rare ly vulnerable.
The capacity of skipjack to undertake long mig ra t ions i s wel l known (Joseph, Klawe & Murphy 1980). The longes t migra t ion recorded by the Skipjack Programme was 3,740 nautical miles ; many of the mig ra t ions over long distances are shown in Figure B (inside back cover), which p r e s e n t s a select ion of Skipjack Programme tag returns from throughout the central and western P a c i f i c . Returns were s e l e c t e d by p l o t t i n g no more than one example of a migration in each d i r e c t i o n between any p a i r of ten degree squares and no more than two examples of a migration wholly within any ten degree square. The impression from t h i s f i gu re i s one of cons ide rab le mixing of skipjack, with l i t t l e evidence of bar r ie rs to movement within the study area. The lack of apparent movement to the e a s t , nor th and south beyond the area surveyed re f l ec t s poor chances for recovery as a r e s u l t of low fishing ef for t , as well as the presence of unsui table h a b i t a t s a t the l a t i t u d i n a l extremes ( sk ip j ack are seldom encountered polewards of 40 degrees l a t i tude or in waters less than 16°C).
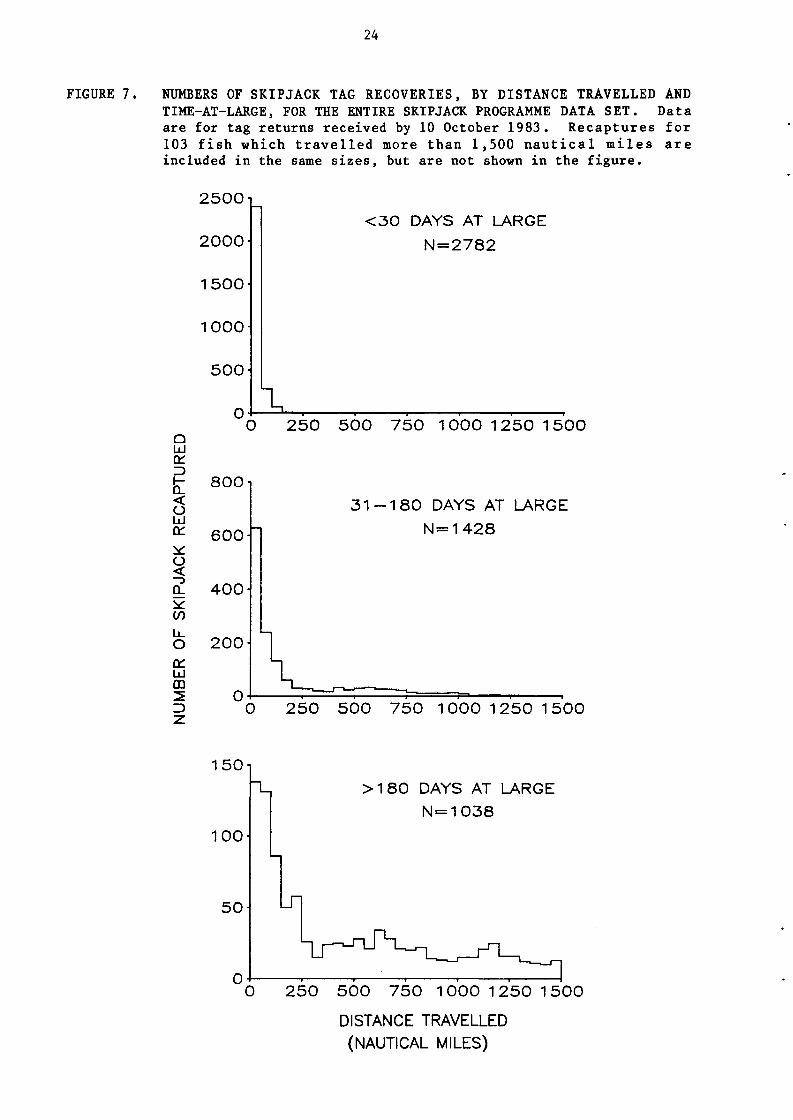
However, the impression of many wide-ranging internat ional migra t ions gained from Figure B does not accurately re f lec t the average over a l l the tag recover ies . The figure overemphasises long d i s tance , r e l a t i v e l y r a r e migrations, due to the procedure used to select recoveries for the f i g u r e . The majority (86%) of tag recoveries were made less than 250 nautical miles from t h e i r r e l e a s e s i t e and w i th in 180 days of t a g g i n g ( F i g u r e 7 ) . Long-distance migrations are prevalent only w i th in the group of sk ip jack that were at large for more than 180 days.
4.4.2 Resource assessment
The Programme's tag recapture data provide a basis for a s s e s s i n g the magnitude of the skipjack resource and i t s r e s i l i ence to fishing p r e s s u r e . A model formulated by Kleiber et a l . (1983) was used to analyse t a g a t t r i t i o n ra tes (the frequency of tag r e t u r n s as a funct ion of time) to de r ive e s t ima tes of var ious parameters of s k i p j a c k s t o c k d y n a m i c s . Separate analyses were performed for the whole study area covered by the Programme and for the 200-mile zones of Papua New Guinea, Solomon I s l a n d s ,
2 Previous r e l e a s e - r e c a p t u r e summaries ( e . g . Kleiber et a l . 1983) included a tag released in K i r i b a t i and recovered in American Samoa. The recovery p o s i t i o n had been e r r o n e o u s l y l o c a t e d ; t h e t a g was recovered in Western Samoan waters and i s considered in tha t c o u n t r y ' s report (Tuna Programme 1984).
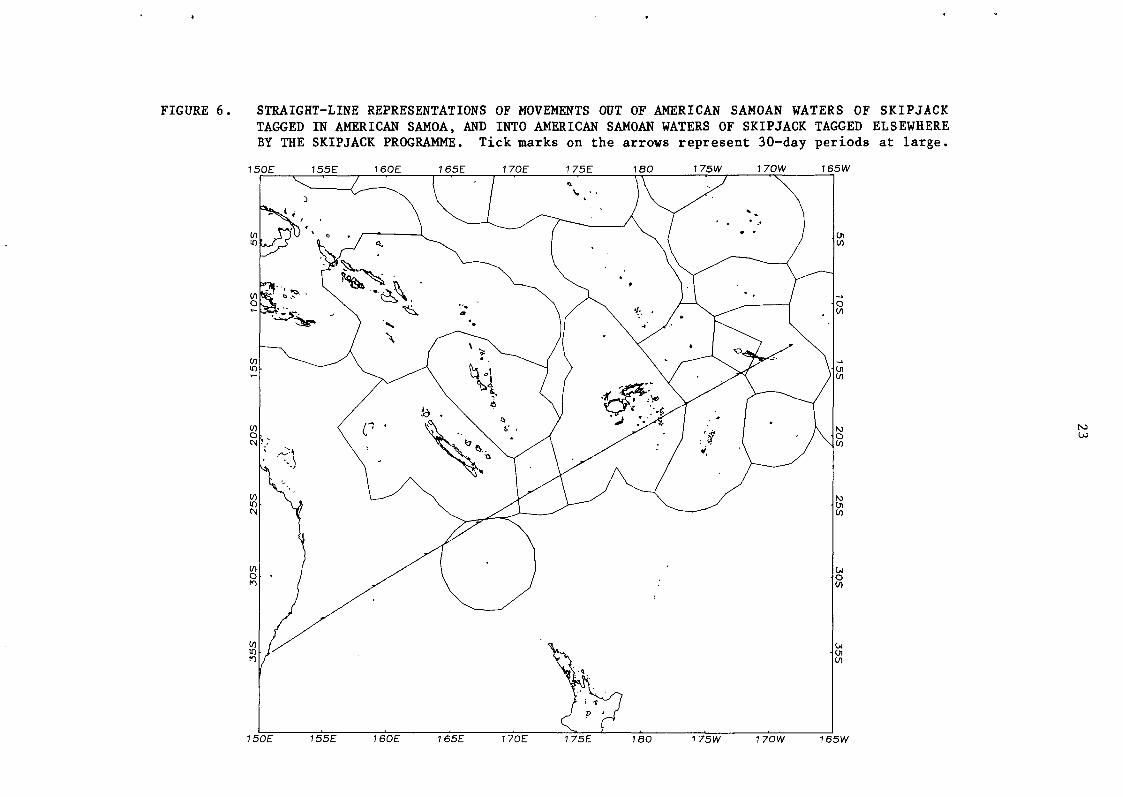
FIGURE 6. STRAIGHT-LINE REPRESENTATIONS OF MOVEMENTS OUT OF AMERICAN SAMOAN W TAGGED IN AMERICAN SAMOA, AND INTO AMERICAN SAMOAN WATERS OF SKIPJAC BY THE SKIPJACK PROGRAMME. Tick marks on the arrows represent 30-da
150E 155E 160E 165E 170E 175E 180 175W 170W
150E 155E 160E 165E 1 70E 175E 180 175W 170W
24
FIGURE 7. NUMBERS OF SKIPJACK TAG RECOVERIES, BY DISTANCE TRAVELLED AND TIME-AT-LARGE, FOR THE ENTIRE SKIPJACK PROGRAMME DATA SET. Data are for tag returns received by 10 October 1983. Recaptures for 103 fish which travelled more than 1,500 nautical miles are included in the same sizes, but are not shown in the figure.
Q L±J QT =3 I -CL < O UJ
a: o <
Q_
OH UJ 00
3
2500
2000
1500
1000
500
<30 DAYS AT LARGE N=2782
1 0 250 500 750 1000 1250 1500
800 !
600
400
200
3 1 - 1 8 0 DAYS AT LARGE N=1428
0 250 500 750 1000 1250 1500
150i
100
>180 DAYS AT LARGE N=1038
250 500 750 1000 1250 1500 DISTANCE TRAVELLED (NAUTICAL MILES)
25
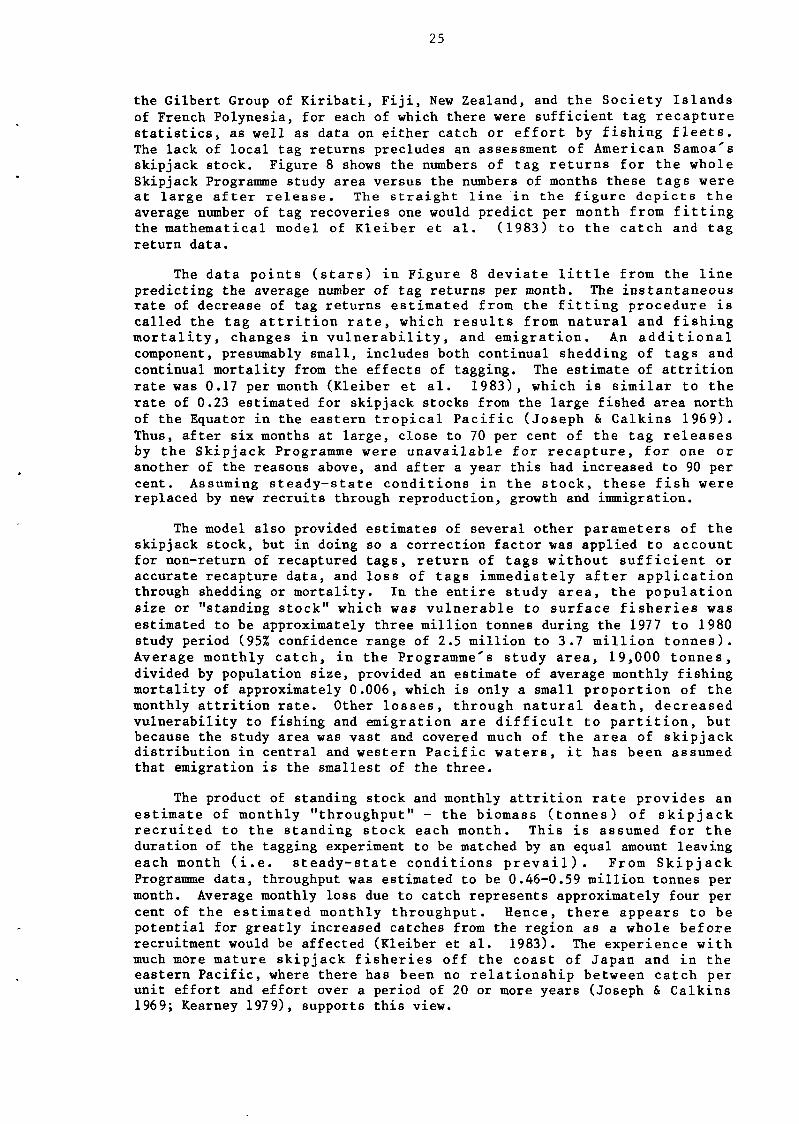
the Gilbert Group of Kiribati, Fiji, New Zealand, and the Society Islands of French Polynesia, for each of which there were sufficient tag recapture statistics, as well as data on either catch or effort by fishing fleets. The lack of local tag returns precludes an assessment of American Samoa's skipjack stock. Figure 8 shows the numbers of tag returns for the whole Skipjack Programme study area versus the numbers of months these tags were at large after release. The straight line in the figure depicts the average number of tag recoveries one would predict per month from fitting the mathematical model of Kleiber et al. (1983) to the catch and tag return data.
The data points (stars) in Figure 8 deviate little from the line predicting the average number of tag returns per month. The instantaneous rate of decrease of tag returns estimated from the fitting procedure is called the tag attrition rate, which results from natural and fishing mortality, changes in vulnerability, and emigration. An additional component, presumably small, includes both continual shedding of tags and continual mortality from the effects of tagging. The estimate of attrition rate was 0.17 per month (Kleiber et al. 1983), which is similar to the rate of 0.23 estimated for skipjack stocks from the large fished area north of the Equator in the eastern tropical Pacific (Joseph & Calkins 1969). Thus, after six months at large, close to 70 per cent of the tag releases by the Skipjack Programme were unavailable for recapture, for one or another of the reasons above, and after a year this had increased to 90 per cent. Assuming steady-state conditions in the stock, these fish were replaced by new recruits through reproduction, growth and immigration.
The model also provided estimates of several other parameters of the skipjack stock, but in doing so a correction factor was applied to account for non-return of recaptured tags, return of tags without sufficient or accurate recapture data, and loss of tags immediately after application through shedding or mortality. In the entire study area, the population size or "standing stock" which was vulnerable to surface fisheries was estimated to be approximately three million tonnes during the 1977 to 1980 study period (95% confidence range of 2.5 million to 3.7 million tonnes). Average monthly catch, in the Programme's study area, 19,000 tonnes, divided by population size, provided an estimate of average monthly fishing mortality of approximately 0.006, which is only a small proportion of the monthly attrition rate. Other losses, through natural death, decreased vulnerability to fishing and emigration are difficult to partition, but because the study area was vast and covered much of the area of skipjack distribution in central and western Pacific waters, it has been assumed that emigration is the smallest of the three.
The product of standing stock and monthly attrition rate provides an estimate of monthly "throughput" - the biomass (tonnes) of skipjack recruited to the standing stock each month. This is assumed for the duration of the tagging experiment to be matched by an equal amount leaving each month (i.e. steady-state conditions prevail). From Skipjack Programme data, throughput was estimated to be 0.46-0.59 million tonnes per month. Average monthly loss due to catch represents approximately four per cent of the estimated monthly throughput. Hence, there appears to be potential for greatly increased catches from the region as a whole before recruitment would be affected (Kleiber et al. 1983). The experience with much more mature skipjack fisheries off the coast of Japan and in the eastern Pacific, where there has been no relationship between catch per unit effort and effort over a period of 20 or more years (Joseph & Calkins 1969; Kearney 1979), supports this view.
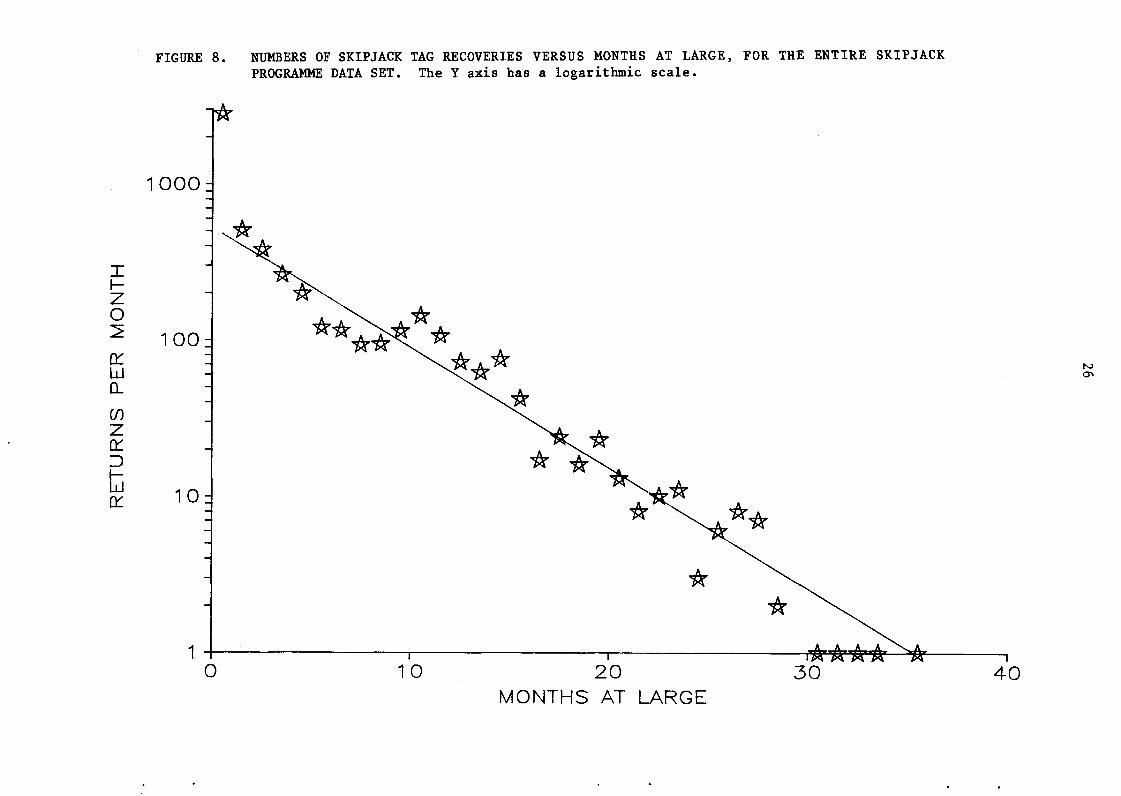
FIGURE 8. NUMBERS OF SKIPJACK TAG RECOVERIES VERSUS MONTHS AT LARGE, FOR TH PROGRAMME DATA SET. The Y axis has a logarithmic scale.
1000:
1 0 0 -
10 2 0 MONTHS AT LARGE
27
The resource of skipjack in the waters of American Samoa is obviously a small fraction of the total standing stock in the study area. Although the data for American Samoa are insufficient to estimate the size of the local skipjack resource quantitatively, because of the lack of tag returns from a well-documented, locally based fishery, it is likely that the catch of skipjack in the waters of American Samoa could increase greatly without significantly impairing recruitment. However, a large increase in skipjack fisheries in neighbouring countries could have a detrimental impact on the quantity of skipjack available in American Samoa (see Section 4.4.3).
4.4.3 Fishery interactions
With increasing fishing activity and changing gear technology, catches from the area served by the South Pacific Commission have grown remarkably in recent years, leading inevitably to greater interaction between fisheries (Kearney 1983). These may occur, for example, between various types of fishery within a particular country (e.g. artisanal vs. industrial), between fisheries based on different gear types (e.g. purse-seine vs. longline for yellowfin) or between fisheries operating in different countries. The data of the Skipjack Programme provide a measure of the last type of interaction.
Tag recapture data enable assessment of interaction only within one generation of fish. However, within-generation assessments are most appropriate for skipjack, since the absence of any relationship between catch per unit effort and effort, even within intense fisheries (Joseph & Calkins 1969; Kearney 1979), suggests that between-generation interactions are not significant. Within-generation interactions between fisheries may be construed in various ways, such as the change in catch in one fishery resulting from catches in another, or the fraction of recruitment in a fishery attributable to migration from another fishery. The methods developed by the Skipjack Programme measure interaction in the latter way, that is, as a function of throughput.
A parameter, the "immigration coefficient" I was derived to express interaction as the percentage of the throughput in a "receiver" country which could be ascribed to migration from another, "donor" country (Kleiber et al. ms.). An earlier version of I, expressed interaction as the contribution of migrants to standing stock of the receiver country (Skipjack Programme 1981b). The present coefficent is computed from the number of tag releases in the donor country and the number of recoveries of those tags in the receiver country, together with various parameters of the two stocks, estimated by the tag attrition model of Kleiber et al. (1983). Two values of I exist for any pair of fisheries, one for each of the directions in which interaction may occur. It should be remembered that, as with the parameters derived from the tag attrition model, the immigration coefficient measures only the interaction between particular fisheries operating in defined areas. It does not provide a measure of migration of fish from all parts of a country's fishery zone to the whole fishery zone of another country, and is therefore a minimum estimate of interaction.
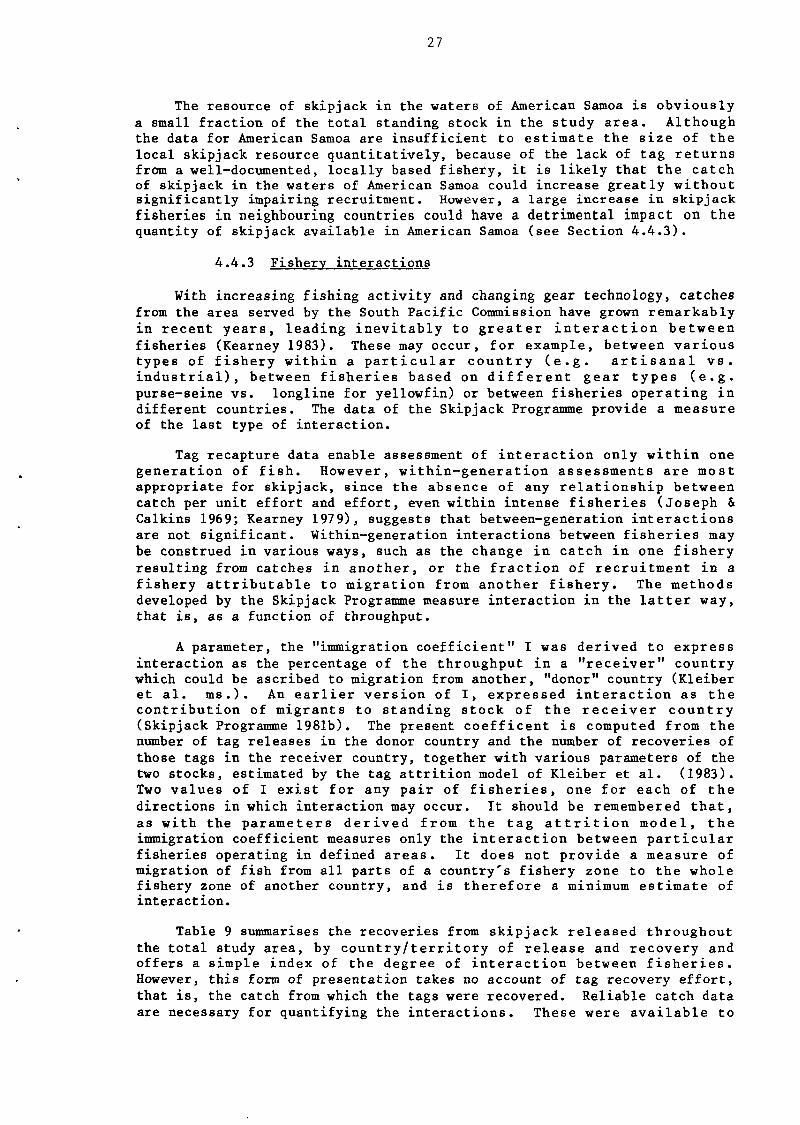
Table 9 summarises the recoveries from skipjack released throughout the total study area, by country/territory of release and recovery and offers a simple index of the degree of interaction between fisheries. However, this form of presentation takes no account of tag recovery effort, that is, the catch from which the tags were recovered. Reliable catch data are necessary for quantifying the interactions. These were available to
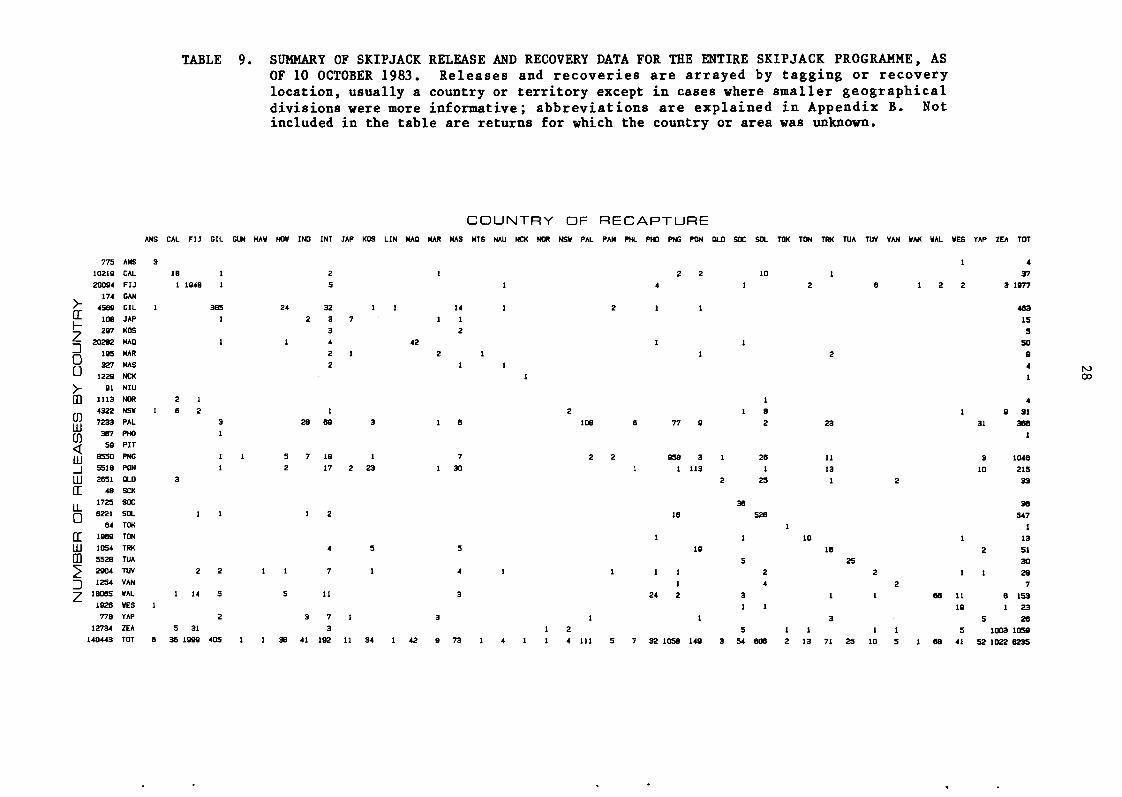
TABLE 9. SUMMARY OF SKIPJACK RELEASE AND RECOVERY DATA FOR THE ENTIRE SKIPJ OF 10 OCTOBER 1983. R e l e a s e s and r e c o v e r i e s are arrayed by ta loca t ion , usual ly a country or t err i tory except in cases where sma d iv i s ions were more informative; a b b r e v i a t i o n s are e x p l a i n e d i n included in the table are returns for which the country or area wa
C O U N T R Y OF R E C A P T U R E AMS CAL FIJ GIL GUM HAW HOW IND INT JAP KOS LIN MAO MAR MAS MTS NAU NCK NOR NSW PAL PAM PHL PHO PNG PON OLD SOC SOL TOK
2 1 2 2 10
5 1 4 1
24 32 1 1 14 1 2 1 1 2 3 7 1 1
3 2 1 4 42 1 1
2 1 2 1 1 2 1 1
JNT
RY
0 u >-CD
LE
AS
ES
LU DC LL 0 DC LU CD 2 D Z
775
10219
20094
174
4569
106
297
20282
195
327
1229
91
1113
4322
7233
367
59
6550
5518
2651
48
1725
6221
64
1969
1054
5528
2904
12S4
16065
1926
778
12734
140443
AMS
CAL
FIJ
GAM
GIL
JAP
KOS
MAO
MAR
MAS
NCK
NIU
NOR
NSW
PAL
PHO
PIT
PNG
PON
OLD
SCK
SOC
SOL
TOK
TON
TRK
TUA
TUV
VAN
WAL
WES
YAP
ZEA
TOT
3
IB
1
1
2
1 6
3
1
1
5
6 36
1948
1
2
1
2
14
31
1999
1
1
385
1
1
3
1
1
1
1
2
5
2
405
5
2
28
7
1
69
18
17 2
3
1
23
1
5
38
3
41
4
7
11
7
3
192
1
11
1 2 1 8
1 6 108 6 7 7 9 2
7 2 2 958 3 1 26 1 30 1 1 113 1
2 25
36 16 526
1 1 1
5 5 19
5 1 4 1 1 1 1 2
1 4 3 24 2 3
1 1 3 1 1
1 2 5 1
34 1 42 9 73 1 4 1 1 4 111 5 7 32 1058 149 3 54 606 2
29
the Programme for some locally based fisheries during the period tags were at large, but not for catches between 1979 and 1982 by the large United States and Japanese distant-water purse-seine fisheries and the Japanese distant-water pole-and-line fishery. These fisheries operate in much of the western Pacific and over the period of tag recoveries they accounted for a significant percentage (~20%) of Skipjack Programme tag returns. Until the Programme receives catch data from these fisheries, accurate estimates of interaction between distant-water and locally based fisheries cannot be made.
The Skipjack Programme has calculated coefficients of interaction in at least one direction for as many pairs of countries and territories in the South Pacific Commission region as possible with the available data. A selection of the results is shown in Table 10. Most coefficients are small, with over half of them less than two per cent, but they span a wide range, from less than 0.1 per cent for movements from Kiribati to the Federated States of Micronesia to 37 per cent for movements from the Federated States of Micronesia to the Marshall Islands. Most of those omitted from the selection in Table 10 were also very low, from 0.1 to 1.0 per cent (e.g. Argue & Kearney 1982; Tuna Programme 1984). Thus, with very few exceptions, interactions at the time of tagging were quite low, at least between the particular fisheries listed in Table 10. Developments in these areas since then may have already altered the levels of interaction. It should also be noted that these results apply only to skipjack of the size tagged by the Programme (mostly >45 cm). Skipjack smaller than this could very well move large distances and contribute significantly to interactions between stocks in the fished areas.
Fishery interactions increase as the distance between fisheries decreases. If fisheries in neighbouring countries expand their areas of operation to include waters adjacent to common borderlines, the degree of interaction may increase. Furthermore, if different gear types were to operate in the same area, such as purse-seine and pole-and-line fleets working in the same or nearby fishing grounds of a country, then the degree of interaction would be much higher than present figures indicate.
5.0 CONCLUSIONS
Bouki-ami catches by the Skipjack Programme confirm that the live bait resources of American Samoa are small, and probably inadequate to support operations by pole-and-line vessels. Similar conclusions may be drawn from the results of previous baitfish surveys by other agencies.
Skipjack catches by the Skipjack Programme were low in American Samoa, perhaps because of a period of poor biting response by skipjack schools and lack of good quality bait. However, surface schooling tuna apparently are abundant in American Samoan waters. Both the school sighting rate and, occasionally, the catch rate during the Skipjack Programme surveys were comparable to results achieved by the Skipjack Programme in other areas presently supporting commercial tuna fisheries. The lack of local tag returns precluded an assessment of the size of the skipjack resource in American Samoan waters. However, extrapolating from analyses for the entire Skipjack Programme study area in the central and western Pacific, American Samoa's 200-mile zone is likely to support much larger catches than presently are being made.
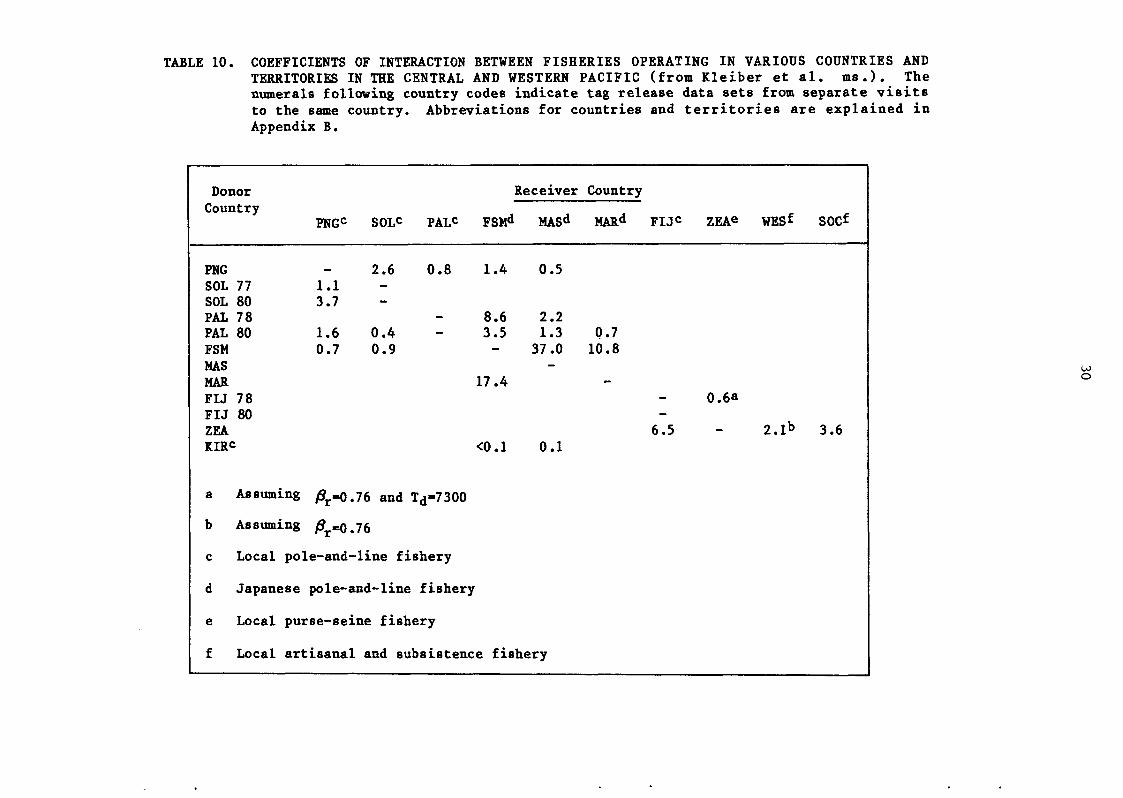
TABLE 10. COEFFICIENTS OF INTERACTION BETWEEN FISHERIES OPERATING IN VARIOU TERRITORIES IN THE CENTRAL AND WESTERN PACIFIC (from Kleiber et numerals following country codes indicate tag release data sets from to the same country. Abbreviations for countries and territories a Appendix B.
Donor Country
PNG SOL 77 SOL 80 PAL 78 PAL 80 FSM MAS MAR FIJ 78 FIJ 80 ZEA KIRC
a As suming
b Assuming
c Local pol
d Japanese
e Local
f Local
PNGC
,
1.1 3.7
1.6 0.7
0r=O.
£r=0.
e-and-
SOLC
2.6 --
0.4 0.9
76 and
76
PALC
0.8
--
Td=7300
-line fishery
pole-and-line ; fishery
purse-seine fishery
artisana!
Receiver
FSMd
1.4
8.6 3.5 -
17.4
<0.1
r
MASd
0.5
2.2 1.3
37.0 -
0.1
. and subsistence fishery
Country
MARd FIJC
0.7 10.8
---
6.5
ZEAe
0.6a
-
WESf
2.1b
31
Techniques such as t ro l l i ng and g i l l - ne t t i ng around FADs, such as have been tes ted in Western Samoa, may be e f fec t ive a l t e r n a t i v e s to l i v e - b a i t pole-and-line operations for subs i s t ence or s m a l l - s c a l e , l o c a l l y based commercial operat ions. Another technique which does not depend on l i v e b a i t i s p u r s e - s e i n i n g , which has become a v e r y e f f i c i e n t method of harvesting tuna in the central and western Pacific in the l a s t few y e a r s . The a v a i l a b i l i t y of r e l a t i v e l y cheap fuel and t h e canne ry and p o r t f a c i l i t i e s at Pago Pago would favour the e x p l o i t a t i o n of American Samoan sk ip jack s tocks by p u r s e - s e i n e r s , whether l o c a l l y or f o r e i g n b a s e d . However, purse-seiners would almost cer ta inly need access to more than jus t the waters of American Samoa if they are to main ta in economically v i a b l e year-round a c t i v i t i e s .
No estimates of in teract ion between skipjack stocks in American Samoan waters and those in other areas could be made, but tag r e c a p t u r e s t u d i e s confirm that there i s exchange with adjacent areas . Since interact ions are l ikely to i nc rease as ca tches i nc r ea se and d i s t a n c e between f i s h e r i e s decreases, future f isher ies in American Samoa and adjacent r eg ions should be monitored closely for evidence of in te rac t ion .

32
REFERENCES
ANON. (1969) . Report of the UNDP/FAQ Tuna Mission to the South P a c i f i c . May-June 1969 . Food and A g r i c u l t u r e Organ iza t ion of t h e U n i t e d Nations, Rome, I t a l y , 11 pp. + 6 annexes, mimeo.
ANON. (1973) . Food from the sea : the Samoan way. Samoan Scene 1 ( 4 ) , 4 p p . , mimeo.
ANON. ( 1 9 7 5 ) . Samoan t r o l l i n g s u r v e y . R e p o r t from L i v i n g Marine Resources Inc. to the Pac i f i c Tuna Development Foundation, Honolu lu , Hawaii, U.S.A. , 18 pp . , mimeo.
ANON. (1979) . Cruise report: Townsend Cromwell, c r u i s e 7 9 - 0 4 ( T C - 8 5 ) . Southwest F i sher ies Center, United S t a t e s N a t i o n a l Marine F i s h e r i e s Service , Honolulu, Hawaii, U.S.A., 8 pp, mimeo.
ANON. (1980) . Review of p r e l i m i n a r y r e s u l t s from g e n e t i c a n a l y s i s of skipjack blood samples co l l e c t ed by the Skipjack Survey and Assessment Programme. Skipjack Survey and Assessment Programme Technical Report N o . l , South Pac i f i c Commission, Noumea, New Caledonia, 22 pp.
ANON. ( 1 9 8 1 ) . Report of the second Sk ipjack Survey and A s s e s s m e n t Programme workshop to review r e s u l t s from genet ic analys i s of skipjack blood samples. Skipjack Survey and Assessment Programme Techn ica l Report N o . 6 . South P a c i f i c Commiss ion , Noumea, New C a l e d o n i a , v + 39 pp.
ARGUE, A.W. (1982) . Methods used by the Sk ipjack Survey and Assessment Programme for c o l l e c t i n g b i o l o g i c a l , tuna s c h o o l and a n c i l l a r y data from a p o l e - a n d - l i n e f i s h i n g v e s s e l , pp. 45 -69 i f i Kearney, R.E. ( e d . ) , Methods used by the South Pac i f i c Commission for the survey and assessment of s k i p j a c k and b a i t f i s h r e s o u r c e s . Tuna and B i l l f i s h Assessment Programme Technical Report No.7. South Pac i f i c Commission, Noumea, New Caledonia.
ARGUE, A.W., F. CONAND & D. WHYMAN ( 1 9 8 3 ) . S p a t i a l and t e m p o r a l d i s t r i b u t i o n s of j u v e n i l e tunas from stomachs of tunas caught by pole-and- l ine gear in the central and western Pac i f i c Ocean. Tuna and B i l l f i s h Assessment Programme T e c h n i c a l Report N o . 9 . South P a c i f i c Commission, Noumea, New Caledonia, v i i + 47 pp.
ARGUE, A.W. & R.E. KEARNEY ( 1 9 8 2 ) . An assessment of the s k i p j a c k and b a i t f i s h resources of Solomon Is lands . Skipjack Survey and Assessment Programme Final Country Report No.3. South Pac i f i c Commission, Noumea, New Caledonia, x + 73 pp.
ARGUE, A.W., M.J. WILLIAMS & J . - P . HALLIER (ms . ) . F i sh ing performance of some natural and cultured b a i t f i s h used by p o l e - a n d - l i n e v e s s e l s t o f i s h tunas i n the c e n t r a l and w e s t e r n P a c i f i c O c e a n . Tuna and B i l l f i s h Assessment Programme T e c h n i c a l R e p o r t . S o u t h P a c i f i c Commission, Noumea, New Caledonia.
BALDWIN, W.J. (1977) . Hatchery system p r o v i d e s smal l f i s h as b a i t for skipjack tuna t r i a l s . Fishing News International July 1977:33-34.
CREMOUX, J.L. (1980) . RSsultats des c r o i s i e r e s " t r o p i c a l e s " du Centre

33
ORSTOM de Noumea (1967-1977) : 2e p a r t i e : P a c i f i q u e C e n t r a l . Rapports Sc ient i f iques e t Techniques. ORSTOM, Noumea, New C a l e d o n i a , approx. 150 pp.
CROSSLAND, J . & R. GRANDPERRIN ( 1 9 7 9 ) . F i s h e r y d i r e c t o r y o£ the. South Pac i f i c Commission r e g i o n . South P a c i f i c Commission, Noumea, New Caledonia, 47 pp.
FUJINO, K. (1966) . Instruct ions on c o l l e c t i n g blood and serum samples from tuna f i s h e s . FAQ Fisher ies Circular No.26. Food and A g r i c u l t u r e Organization of the United Nations, Rome, I t a l y , 5 pp.
FUJINO, K. ( 1 9 7 2 ) . Range of the s k i p j a c k tuna subpopu la t ion i n t h e w e s t e r n P a c i f i c Ocean, pp . 373-384 in. Sugawara, K. ( e d . ) , The Kuroshio I I , Proceedings of the second symposium on the r e s u l t s of the cooperative study of the Kuroshio and adjacent reg ions , Tokyo, Japan, September 28-October 1 , 1970 . Saikon P u b l i s h i n g Company, Tokyo, Japan.
FUJINO, K. ( 1 9 7 6 ) . Subpopulat ion i d e n t i f i c a t i o n of s k i p j a c k tuna specimens from the southwes tern P a c i f i c Ocean. B u l l e t i n of t h e Japanese Society of S c i e n t i f i c F i sher ies 42:1229-1235.
GILLETT, R.D. & R.E. KEARNEY ( 1 9 8 3 ) . An as ses sment of the s k i p j a c k and b a i t f i s h r e s o u r c e s o f F r e n c h P o l y n e s i a . S k i p j a c k S u r v e y and Assessment Programme F i n a l Country R e p o r t N o . 7 , S o u t h P a c i f i c Commission, Noumea, New Caledonia.
HALLIER, J . - P . , R.E. KEARNEY & R.D. GILLETT ( 1 9 8 2 ) . B a i t f i s h i n g methods u s e d by t h e S k i p j a c k S u r v e y and A s s e s s m e n t Programme and recommendations on ba i t f i sh ing techniques for the t r o p i c a l P a c i f i c . pp. 71-107 i n Kearney, R.E. ( e d . ) , Methods used by the South P a c i f i c Commission for the survey and assessment of s k i p j a c k and b a i t f i s h resources . Tuna and B i l l f i s h Assessment Programme T e c h n i c a l Report No.7, South Pac i f i c Commission, Noumea, New Caledonia.
HIDA, T.S. (1970) . Surface tuna-school f i sh ing and b a i t i n g around Samoa I s lands . Commercial F i sher ies Review 32(12) :37-41 .
HIROA, T.H. (1930) . Samoan material cu l ture . Bu l l e t in No.75, Bernice P. Bishop Museum, Honolulu, Hawaii, U.S.A., x i + 724 p p . , 56 p l a t e s .
JOSEPH, J . & T.P. CALKINS (1969) . Population dynamics of the skipjack tuna (Katsuwonus pelamis) of the e a s t e r n P a c i f i c Ocean. Inter-American Tropical Tuna Commission Bul le t in 13:1-273.
JOSEPH, J . , W. KLAWE & P. MURPHY (1980) . Tuna and b i l l f i s h : f i s h wi thout a country, 2nd edn, Inter-American Tropical Tuna Commission, La J o l l a , U.S.A., v i i + 46 pp.
KEARNEY, R.E. (1978) . Interim report of the a c t i v i t i e s of the Skipjack Survey and Assessment Programme in the waters of F i j i (26 January-18 February, 28 March-10 April 197 8) . Skipjack Survey and Assessment Programme Preliminary Country Report No.5. South P a c i f i c Commission, Noumea, New Caledonia, 13 pp.
KEARNEY, R.E. (1979) . An overview of recent changes in the f i s h e r i e s for highly migratory species in the western Pac i f i c Ocean and p r o j e c t i o n s

34
for f u t u r e deve lopments . SPEC(79)17. South P a c i f i c Bureau f o r Economic Co-operation, Suva, F i j i , i i i + 96 pp.
KEARNEY, R.E. (1982a) . Development and implementat ion of the Skipjack Survey and Assessment Programme, pp. 1-17 .in Kearney, R.E. ( e d . ) , Methods used by the South P a c i f i c Commission for the s u r v e y and assessment of s k i p j a c k and b a i t f i s h r e s o u r c e s . Tuna and B i l l f i s h Assessment Programme Technical Report No.7, South Pac i f i c Commission, Noumea, New Caledonia.
KEARNEY, R.E. ( 1 9 8 2 b ) . An assessment of the s k i p j a c k and b a i t f i s h resources of F i j i . Skipjack Survey and Assessment Programme F i n a l Country Report No.1 . South Pac i f i c Commission, Noumea, New C a l e d o n i a . v i i i + 43 pp.
KEARNEY, R.E. (1983) . Assessment of the skipjack and b a i t f i s h r e s o u r c e s in the central and western tropica l Pac i f i c Ocean : a summary of the Skipjack Survey and Assessment Programme. South P a c i f i c Commission, Noumea, New Caledonia, i i i + 37 pp.
KEARNEY, R.E. & R.D. GILLETT (1982) . Methods used by the Sk ipjack Survey and Assessment Programme for t a g g i n g s k i p j a c k and o t h e r t u n a . pp. 19-43 in Kearney. R.E. ( e d . ) , Methods used by the South P a c i f i c Commission for the survey and as ses sment of s k i p j a c k and b a i t f i s h resources . Tuna and B i l l f i sh Assessment Programme Techn ica l Report No.7, South Pac i f i c Commission, Noumea, New Caledonia.
KEARNEY, R.E. & J . - P . HALLIER (1978) . Interim report of the a c t i v i t i e s of the Skipjack Survey and Assessment Programme in the waters of American Samoa (31 May-5 J u n e , 1 5 - 2 1 June 1 9 7 8 ) . S k i p j a c k S u r v e y and Assessment Programme Preliminary Country Report N o . 9 , South P a c i f i c Commission, Noumea, New Caledonia, 9 pp.
KEARNEY, R.E. , A.D. LEWIS & B.R. SMITH (1972) . Cruise Report Tagula 7 1 - 1 , survey of skipjack tuna and ba i t resources in Papua New Guinea waters . Research B u l l e t i n N o . 8 , Depar tment of A g r i c u l t u r e , S t o c k and F i s h e r i e s , Port Moresby, Papua New Guinea, i x + 145 pp.
KEARNEY, R.E. & M.L. RIVKIN (1981) . An examination of the f e a s i b i l i t y of b a i t f i s h c u l t u r e f o r s k i p j a c k p o l e - a n d - l i n e f i s h i n g i n t h e South Pac i f i c Commission area. Sk ipjack Survey and Assessment Programme T e c h n i c a l Report N o . 4 . S o u t h P a c i f i c C o m m i s s i o n , Noumea, New Caledonia, 23 pp.
KENT, G. (1980) . The p o l i t i c s of P a c i f i c i s l a n d f i s h e r i e s . Westview Press , Boulder, Colorado, U.S.A., i x + 191 pp.
KLAWE, W.L. (1978) . Estimates of catches of tunas and b i l l f i s h e s by the Japanese, Korean and Taiwanese l o n g l i n e r s from w i t h i n the 2 0 0 - m i l e economic zone of the member countries of the South Pac i f i c Commission. O c c a s i o n a l Paper N o . 1 0 , South P a c i f i c C o m m i s s i o n , Noumea, New Caledonia, 41 pp.
KLEIBER, P . , A.W. ARGUE & R.E. KEARNEY ( 1 9 8 3 ) . Assessment of s k i p j a c k (Katsuwonus pelamis) resources in the central and w e s t e r n P a c i f i c by estimating standing stock and components of populat ion turnover from tagging data. Tuna and B i l l f i s h Assessment Programme Technical Report No.8, South Pac i f i c Commission, Noumea, New Caledonia, v i + 38 pp.

35
KLEIBER, P. & C.A. MAYNARD ( 1 9 8 2 ) . Data p r o c e s s i n g procedures of the S k i p j a c k Survey and A s s e s s m e n t Programme. p p . 1 0 9 - 1 2 2 i_n Kearney, R.E. ( e d . ) , Methods used by the South Pac i f i c Commission for the survey and assessment of skipjack and b a i t f i s h r e s o u r c e s . Tuna and B i l l f i s h Assessment Programme Technical Report No.7, South Pac i f i c Commission, Noumea, New Caledonia.
KLEIBER, P . , J.R. SIBERT & L.S. HAMMOND ( m s . ) . A parameter for e s t i m a t i n g in terac t ion between f i s h e r i e s for skipjack tuna (Katsuwonus p e l a m i s ) i n the w e s t e r n P a c i f i c . Tuna and B i l l f i s h Assessment Programme Technical Report, South Pac i f i c Commission, Noumea, New Caledonia.
LAWSON, T.A. & R.E. KEARNEY ( m s . ) . Estimates of growth r a t e s and l e n g t h measurement errors for skipjack (Katsuwonus pelamis) from the w e s t e r n Pac i f i c Ocean based on tagging d a t a . Tuna and B i l l f i s h Assessment Programme Technical Report . South P a c i f i c Commission, Noumea, New Caledonia.
LESTER, R.H.G., A. BARNES & G. HABIB ( m s . ) . P a r a s i t e s of s k i p j a c k tuna: f i s h e r y i m p l i c a t i o n s . P a r a s i t o l o g y D e p a r t m e n t , U n i v e r s i t y of Queensland, Brisbane, Austra l ia .
LEWIS, A.D. ( 1 9 8 1 ) . P o p u l a t i o n g e n e t i c s , e c o l o g y and s y s t e m a t i c a of Indo-Australian scombrid f i s h e s , with part icular reference to skipjack tuna (Katsuwonus p e l a m i s ) . Unpublished Ph.D t h e s i s , A u s t r a l i a n National Univers i ty , Canberra, Austra l ia , i x + 314 pp.
LEWIS, A . D . , B.R. SMITH & R.E. KEARNEY ( 1 9 7 4 ) . S t u d i e s on tunas and b a i t f i s h in Papua New Guinea waters - I I . Research B u l l e t i n No. 1 1 , Department of Agriculture, Stock and F i s h e r i e s , Port Moresby, Papua New Guinea, v i i + 111 pp.
MARSAC, F. (1981) . Prospection thoniere par observat ions e t r a d i o m e t r i c a S r i e n n e s : t e r r i t o i r e de W a l l i s e t Futuna: r a p p o r t de s y n t h e s e p r o v i s o i r e . O f f i c e de l a Recherche S c i e n t i f i q u e e t T e c h n i q u e Outre-Mer, Noumea, New Caledonia, 52 pp.
NAGANUMA, A. ( 1 9 7 9 ) . On spawning a c t i v i t i e s of s k i p j a c k tuna i n the western Pac i f i c Ocean. B u l l e t i n of the Tohoku Regional F i s h e r i e s Research Laboratory 40:1-13 .
PACIFIC TUNA DEVELOPMENT FOUNDATION (1982) . The P a c i f i c Tuna Development Foundation program and p r o j e c t s . 1974-1985. Pac i f i c Tuna Development Foundation, Honolulu, Hawaii, U.S.A., approx. 60 pp.
RAJU, G. ( 1 9 6 4 ) . S t u d i e s on the spawning of t h e o c e a n i c s k i p j a c k Katsuwonus pelamis (Linnaeus) in Minicoy waters . Proceed ings of the Symposium on Scombroid F i s h e s . Part 2 : 7 4 4 - 7 6 8 . Marine B i o l o g i c a l Associat ion of India, Mandapam Camp, India.
RICHARDSON, B.J. (1983) . Dis tr ibut ion of p r o t e i n v a r i a t i o n i n s k i p j a c k tuna (Katsuwonus pelamis) from the central and south-western P a c i f i c . Austral ian Journal of Marine and Freshwater Research 34:231-251.
SCHAEFER, M.B. & C.J. ORANGE (1956) . Studies of the sexual development and spawning of y e l l o w f i n tuna (Neothunnus macropterus) and s k i p j a c k (Katsuwonus pelamis) in three areas of the e a s t e r n t r o p i c a l P a c i f i c Ocean, by examinat ion of gonads . I n t e r - A m e r i c a n T r o p i c a l Tuna Commission Bul le t in 1:281-349.

36
SESEPASARA, H. (undated). Further s tudies of the nearshore tuna resources of American Samoa. Completion report , project 4-22-D American Samoa, Office of Marine Resources, Pago Pago, American Samoa, approx. 40 pp.
SHARP, G.D. ( 1 9 6 9 ) . E l e c t r o p h o r e t i c s t u d y of tuna h e m o g l o b i n s . Comparative Biochemistry and Physiology 31:749-755.
SHARP, G.D. (1978) . Behavioural and phys io log ica l propert ies of tunas and t h e i r e f f e c t s on v u l n e r a b i l i t y to f i s h i n g g e a r . pp . 3 9 7 - 4 4 9 i n Sharp, G.D. and A.E. Dizon ( e d s ) , The phys io log ica l ecology of tunas. Academic Press , New York, U.S.A.
SIBERT, J .R, R.E. KEARNEY & T.A. LAWSON ( 1 9 8 3 ) . V a r i a t i o n i n growth increments of tagged skipjack (Katsuwonus pe lamis) . Tuna and B i l l f i s h Assessment Programme Technical Report No.10, South Pac i f i c Commission, Noumea, New Caledonia, v i i + 43 pp.
SIMIKI, T . , C. RATCLIFFE & W. SORRENSON ( 1 9 8 1 ) . Report on the deep sea tuna f i sh ing industr ies in American Samoa and the Solomon I s l a n d s . F i sher ies Working Paper N o . l . F i sher ies D iv i s i on , N u k u ' a l o f a , Tonga, 45 pp.
SKIPJACK PROGRAMME (1980a) . Skipjack f i sh ing e f fort and catch, 1 9 7 2 - 1 9 7 8 , by the Japanese po le -and- l ine f l e e t within 200 miles of the c o u n t r i e s in the area of the South P a c i f i c Commission. Skipjack Survey and Assessment Programme Technical Report No.2. South Pac i f i c Commission, Noumea, New Caledonia, i i i + 91 pp.
SKIPJACK PROGRAMME ( 1 9 8 0 b ) . A p r e l i m i n a r y c o m p a r i s o n of f i s h i n g e f f ec t ivenes s between cultured and natura l b a i t f i s h s p e c i e s used by tuna p o l e - a n d - l i n e f i s h i n g g e a r . Working Paper N o . 1 7 , T w e l f t h Regional Technical Meeting on F i s h e r i e s . Noumea. New Caledonia. 17-21 November 1980. South Pac i f i c Commission, Noumea, New Caledonia, 11 pp.
SKIPJACK PROGRAMME ( 1 9 8 1 a ) . F i s h i n g e f f o r t and catch by the l o n g l i n e f l e e t s of Japan (1962-77) and Taiwan (1967-77) within 200 mi les of the countr i e s i n the area of the South P a c i f i c Commission. Skipjack Survey and Assessment Programme Technical Report N o . 3 . South P a c i f i c Commission, Noumea, New Caledonia, v i i i + 249 pp.
SKIPJACK PROGRAMME ( 1 9 8 1 b ) . Sk ipjack m i g r a t i o n , m o r t a l i t y and f i s h e r y i n t e r a c t i o n s . Working Paper N o . 9 , T h i r t e e n t h Regional T e c h n i c a l Meeting on F i s h e r i e s . Noumea. New Caledonia. 24-28 August 1981 . South Pac i f i c Commission, Noumea, New Caledonia, 35 pp.
SKIPJACK PROGRAMME ( 1 9 8 1 c ) . An a p p r a i s a l of the g e n e t i c a n a l y s i s of skipjack blood samples . Working Paper No. 10 , T h i r t e e n t h Regional Technical Meeting on F i s h e r i e s . Noumea. New Ca ledon ia . 24 -28 August 1981. South Pac i f i c Commission, Noumea, New Caledonia, 8 pp.
SKIPJACK PROGRAMME (1981d). An assessment of b a i t f i s h r e s o u r c e s i n the South P a c i f i c Commission a r e a . Working Paper N o . 1 2 , T h i r t e e n t h Regional Technical Meeting on F i s h e r i e s . Noumea. New Caledonia. 24-28 August 1981. South Pac i f i c Commission, Noumea, New Caledonia, 8 pp.
SKIPJACK PROGRAMME (1981e) . Further observations on f i sh ing performance of b a i t f i s h species in the South Pac i f i c Commission area. Working Paper No. 13, Thirteenth Regional Technical Meeting on F i s h e r i e s . Noumea. New

37
Caledonia. 24-28 August 1981. South Pacific Commission, Noumea, New Caledonia, 15 pp.
SWERDLOFF, S.N. (1972). Development of a. pole-and-line skipjack tuna fishery in American Samoa. Completion report, project H-15-D American Samoa, Office of Marine Resources, Pago Pago, American Samoa, 24 pp.
TUNA PROGRAMME (1984). An assessment of the skipjack and baitfish resources of Western Samoa. Skipjack Survey and Assessment Programme Final Country Report No.14, South Pacific Commission, Noumea, New Caledonia, vii +45 pp.
UCHIDA, R.N.& R.F. SUMIDA (1973). Tuna: pole-and-line fishing trials in central and western Pacific. Marine Fisheries Review 35(1/2):31-41.
VAN PEL, H. (1954). Possibilities for improving the fisheries of American Samoa. South Pacific Commission, Noumea, New Caledonia, 13 pp.
VERGNE, P., P. BRYAN & G. BROADHEAD (1978). Large-scale production of the top minnows (Poecilia mexicana) in American Samoa and the testing of their efficiency as tuna bait. Technical Bulletin No.l, Pacific Tuna Development Foundation, Honolulu, Hawaii, U.S.A., 63 pp.
WALDRON, K.D. (1964). Fish schools and bird flocks in the central Pacific Ocean, 1950-61. Special Scientific Report. United States Fisheries and Wildlife Service (Fisheries) No.464, 20 pp.
WENDLER, H.O. (1980). Draft recommendations for fisheries development and management in American Samoa. Unpublished report, Office of Marine Resources, Pago Pago, American Samoa, 72 pp.
WHITEHEAD, P.J.P. & W. IVANTSOFF (1983). Atherina lacunosa and the fishes described by J.R. Forster. Japanese Journal of Ichthyology 29:355-364.
WONGRATANA, T. (1983). Diagnoses of 24 new species and proposal of a new name for a species of Indo-Pacific clupeoid fishes. Japanese Journal of Ichthyology 29:385-407.

39
APPENDIX A. SCIENTISTS, OBSERVERS AND
South Pacific Commission Scientists
A.W. Argue
Charles Ellway
Jean-Pierre Hallier
James lane H i
Desmond Whyman
Observers
Patrick Bryan Baitfish Project Manager Marine Resources Office Pago Pago
Japanese Crew Cruise One
Masahiro Matsumoto, Captai Ryoichi Eda Sakae Hyuga Yoshihiro Kondoh Yoshio Kozuka Yoshikatsu Oikawa Akio Okumura Kohji Wakasaki Mikio Yamashita
Fijian Crew Cruise One
Eroni Marawa Lui Andrews Vonitiese Bainimoli Mosese Cakau Samuela Delana Lui Diva Kitione Koroi Jone Manuku Jona Ravasakula Ravaele Tikovakaca Samuela Ue Taniela Verekila
CREW ON BOARD THE RESEARCH VESSELS
20-21 February 1980
31 May, 1-5 and 14-21 June 1978
31 May, 1-5 and 15-21 June 1978 20-21 February 1980
20-21 February 1980
31 May, 1-5 and 15-21 June 1978
17-20 June 197 8
Japanese Crew Cruise Two
Mitsutoyo Kaneda, Captain Kenji Arima Seima Kobayashi Yoshihiro Kondoh Yoshikatzu Oikawa Tsunetaka Ono Yukio Sasaya Kohji Wakasaki Mikio Yamashita
Fijian Crew Cruise Two
Ravaele Tikovakaca Lui Andrews Samuela Delana Eroni Dolodai Luke Kaidrokai Veremalua Kaliseiwaga Metuisela Koroi Aminiasi Kurugawa Kitione Naivaurerega Jona Ravasakula Napolioni Ravitu Samuela Ue

41
APPENDIX B. ABBREVIATIONS USED FOR COUNTRIES AND TERRITORIES IN THE CENTRAL AND WESTERN PACIFIC
AMS - American Samoa CAL - New Caledonia COK - Cook Islands FIJ - Fiji GAM - Gambier Islands (French Polynesia) GIL - Gilbert Islands (Kiribati) GUM - Guam HAW - Hawaii HOW - Howland and Baker Islands (U.S. Territory) IND - Indonesia INT - International waters JAP - Japan JAR - Jarvis (U.S. Territory) KIR - Kiribati KOS - Kosrae (Federated States of Micronesia) LIN - Line Islands (Kiribati) MAQ - Marquesas Islands (French Polynesia) MAR - Northern Mariana Islands MAS - Marshall Islands MTS - Minami-tori shima (Japan) NAU - Nauru NCK - Northern Cook Islands NIU - Niue NOR - Norfolk Island NSW - New South Wales (Australia) PAL - Palau PAM - Palmyra (U.S. Territory) PHL - Philippines PHO - Phoenix Islands (Kiribati) PIT - Pitcairn Islands PNG - Papua New Guinea POL - French Polynesia PON - Ponape (Federated States of Micronesia) QLD - Queensland (Australia) SCK - Southern Cook Islands SOC - Society Islands (French Polynesia) SOL - Solomon Islands TOK - Tokelau TON - Tonga TRK - Truk (Federated States of Micronesia) TUA - Tuamotu Islands (French Polynesia) TUV - Tuvalu VAN - Vanuatu WAK - Wake Island (U.S. Territory) WAL - Wallis and Futuna WES - Western Samoa YAP - Yap (Federated States of Micronesia) ZEA - New Zealand