Embed Size (px)
Citation preview
An assessment of validity and responsiveness of generic measuresof health-related quality of life in hearing impairment
Yaling Yang • Louise Longworth • John Brazier
Accepted: 14 April 2013
� The Author(s) 2013. This article is published with open access at Springerlink.com
Abstract
Purpose This review examines psychometric perfor-
mance of three widely used generic preference-based
measures, that is, EuroQol 5 dimensions (EQ-5D), Health
Utility Index 3 (HUI3) and Short-form 6 dimensions (SF-
6D) in patients with hearing impairments.
Methods A systematic search was undertaken to identify
studies of patients with hearing impairments where health
state utility values were measured and reported. Data were
extracted and analysed to assess the reliability, validity
(known group differences and convergent validity) and
responsiveness of the measures across hearing impairments.
Results Fourteen studies (18 papers) were included in the
review. HUI3 was the most commonly used utility mea-
sures in hearing impairment. In all six studies, the HUI3
detected difference between groups defined by the severity
of impairment, and four out of five studies detected sta-
tistically significant changes as a result of intervention. The
only study available suggested that EQ-5D only had weak
ability to discriminate difference between severity groups,
and in four out of five studies, EQ-5D failed to detected
changes. Only one study involved the SF-6D; thus, the
information is too limited to conclude on its performance.
Also evidence for the reliability of these measures was not
found.
Conclusion Overall, the validity and responsiveness of the
HUI3 in hearing impairment was good. The responsiveness
of EQ-5D was relatively poor and weak validity was sug-
gested by limited evidence. The evidence on SF-6D was too
limited to make any judgment. More head-to-head com-
parisons of these and other preference measures of health
are required.
Keywords Validity � Responsiveness � EQ-5D � HUI3 �SF-6D � Hearing impairments
Abbreviations
ADPI Audiological Disability Preference Index
AI Amsterdam Inventory
BEPTA Better ear unaided pure-tone average
CI Cochlear implant
EQ-5D Euroqol 5 dimensions
EQ-VAS Euroqol Visual Analogue Scale
ES Effect size
GPBMs Generic preference-based measures of health
HHDI Hearing Handicap and Disability Index
HHIE-S Hearing Handicap Inventory for the Elderly
HRQoL Health-related quality of life
HSUVs Health state utility values
HUI3 Health Utilities Index 3
ICC Intra-class correlation coefficients
LVAS Large vestibular aqueduct syndrome
NCIQ Nijmegen cochlear implant questionnaire
NICE National institute for health and clinical
excellence
QALY Quality-adjusted life year
QWB Quality of well-being
SF-6D Short-form 6 dimensions
SF-36 Short-form 36
SF-12 Short-form 12
SG Standard gamble
SRM Standard response mean
Y. Yang (&) � L. Longworth
Health Economics Research Group, Brunel University,
Uxbridge, UK
e-mail: [email protected]
J. Brazier
Health Economics and Decision Science, School of Health and
Related Research, University of Sheffield, Sheffield, UK
123
Qual Life Res
DOI 10.1007/s11136-013-0417-6
SSQ Speech spatial and qualities of hearing scale for
parents
TTO Time trade-off
VAS Visual Analogue Scale
Introduction
Economic evaluations using a cost-utility framework have
been increasingly used to support decision-making in the
allocation of health resources and priority setting [1–3].
Cost-utility analyses assess health care interventions in
terms of the incremental cost per quality-adjusted life year
(QALY) gained. QALYs combine length of life with a
quality of life where the quality of life component is usu-
ally based on health state utility values [4].
One common way to obtain health state utility values is to
use one of the generic preference-based measures (GPBMs)
of health-related quality of life. Examples of the most
commonly used GPBMs include the EuroQol 5 dimension
(EQ-5D) [5, 6], Short-form 6 dimension (SF-6D) [7] and the
Health Utilities Index (HUI3) [8]. For the purpose of eco-
nomic evaluation, these measures have the advantage of
reflecting the value people place on different dimensions or
levels of health and enable comparisons of health outcomes
to be made across conditions. EQ-5D has 5 health dimen-
sions (mobility, self-care, usual activities, pain/discomfort
and depression/anxiety). Each dimension has 3 levels of
severity in the original version, and a version with 5 levels of
severity has recently been developed [5, 9]. Derived from
the Short-form 36 and Short-form 12 health questionnaires,
the SF-6D has 6 dimensions (physical functioning, role
limitation, social functioning, bodily pain, mental health and
vitality), and each dimension has 4–6 severity levels. The
HUI3 has 8 dimensions (vision, hearing, speech, ambula-
tion, dexterity, emotion, cognition and pain), and each
dimension has 5 or 6 severity levels. These measures differ
in terms of the description of health. The HUI3 can be seen
as a ‘within the skin’ measure of health and includes sensory
dimensions such as vision, speech and hearing. EQ-5D and
SF-6D focus more on how health impacts on functioning in
life, but nonetheless there are important differences in
coverage, such as EQ-5D not having vitality and SF-6D
containing role and social functioning dimensions compared
to usual activities in EQ-5D. Apart from the different
descriptive systems, the measures also differ in terms of the
methods used to estimate health state values.
Empirical evidence has confirmed that health state utility
values obtained from these three GPBMs are different from
each other [10–14]. In order to allow comparability between
conditions, in the United Kingdom, the National Institute for
Health and Clinical Excellence has prefers the use of a single
GPBM, the EQ-5D [15]. However, GPBMs have attracted
criticism for failing to capture important aspects of health
and insensitive to the change of health states because one or
more important dimensions of health relevant to a medical
condition have been excluded [16–18] [19–21]. National
Institute for Health and Clinical Excellence recognized that
there may be specific circumstances in which the EQ-5D is
not appropriate and offers some advice for these circum-
stances; however, it does not identify those areas where
EQ-5D is inappropriate nor provide criteria to determine this.
More evidence on the performance of EQ-5D and other
GPBMs is required for a wider range of conditions and/or
treatments to demonstrate whether these measures are
appropriate for these conditions in order to judge when
alternative measures should be considered. The assessment
of the validity and responsiveness of GPBMs is fraught with
conceptual and empirical problems owing to the lack of a
gold standard measure. However, by taking into account of a
range of evidence on specific conditions in a systematic and
transparent way, it is possible to judge the performance of the
instruments [22]. This is important in order to help inform
which measures should be included for the assessment of
benefits of specific health interventions, or for interpreting
the evidence from population studies that include such
instruments. For example, recently in the United States, the
National Health Measurement Study (http://www.health
measurement.org/NHMS.html) attempted to build a versa-
tile ‘toolbox’ for this purpose, and EQ-5D, Short-form 36
version 2 (from which SF-6D can be derived) and HUI were
included in the toolbox (http://www.healthmeasurement.
org/NHMS.html).
Hearing impairment is one of the most common chronic
health problems in Western society, in part due to the
growth of the elderly population, affecting 15 % of the adult
population [23]. Hearing loss affects a person’s ability to
communicate, social participation, independence, employ-
ment and overall quality of life [23]. Previous research has
suggested that health state utility values obtained from
people with hearing impairments are different using dif-
ferent generic instruments [24]. A review of the evidence on
the validity of GPBMs in hearing impairment has not been
previously undertaken. The aim of this study was to sys-
tematically review the published literature to assess the
reliability, validity and responsiveness of three key generic
measures of health-related quality of life (EQ-5D, HUI3 and
SF-6D) in people with hearing impairment.
Methods
Search strategy and data identification
The objective of the literature review was to identify
published papers reporting evidence of the performance of
Qual Life Res
123
EQ-5D, HUI3 and SF-6D in patients with hearing
impairments.
A broad search was conducted to identify studies
reporting EQ-5D, SF-6D and HUI3 to examine the health-
related quality of life of patients with a hearing impair-
ment. BIOSIS, CINAHL, EMBASE, MEDLINE, PsychI-
NFO and Web of Science electronic databases were
searched. The database available from the EuroQol Group
Website was also searched but comparable databases for
HUI3 and SF-6D are not available. The search focused on
key words search, including ‘hearing impairment/disorder’,
‘euroqol/EQ-5D’, ‘hui3’ and ‘sf6d’, all with alternative
spellings. The search strategy is presented in Appendix 1.
The criteria for inclusion were that the study population
had a hearing impairment, the study reported at least one
from the EQ-5D, SF-6D or HUI3 and reported another
measure of quality of life (generic- or condition-specific) or
a measure of clinical severity, or direct valuation of health.
Papers only reporting EQ-VAS (EuroQol Visual Analogue
Scale) scores were excluded as the main interest was the
descriptive systems and utility indices of the three mea-
sures. Papers that only used vignettes or own health state
valuations, and not one of the three generic measures, were
excluded. There was no restriction relating to the type of
study. Due to resource limitations, only English language
studies were reviewed.
Analytic strategy
Data extraction
Considering the aim of the study and reviewing forms used
for similar studies in other disease areas [17, 25], a tem-
plate was developed to extract data in a standardised format
including the following:
• Study characteristics—country, type of hearing impair-
ment, disease or treatment stage, any treatment given,
study design;
• Participant characteristics—number of participants,
age, gender, ethnicity, missing data;
• Instruments used—EQ-5D/SF-6D/HUI3, other generic
measures of health-rated quality of life, condition-
specific health-related quality of life measures and
clinical measures of disease severity, patient’s own
health state valuations (e.g. Visual Analogue Scale
(VAS), Time trade-off (TTO) and Standard Gamble
(SG));
• Health state utility values—mean of utility index,
scoring algorithm;
• Construct and convergent validity—methods of assess-
ment and results;
• Responsiveness—methods of assessment and results.
• Reliability—methods of assessment and results.
Quality assessment of studies
For the review, of the most importance was the relevance
of the study in terms of the patient population and inclusion
of evidence to answer our research question. Nevertheless,
the quality of studies was assessed by examining study
design, recruitment process, sample size and the extent of
missing data reported. The intention of the assessment of
quality was not to exclude relevant studies. Rather, it gives
some indications of quality to assist with the interpretation
of the findings. It should be noted that some studies may be
of high quality for their research question, but provide
limited information for the assessment of validity, reli-
ability and responsiveness. For example, a case–control
study may be well designed and conducted, but offer
information limited to the presence or absence of hearing
problems, and not detailed information on the severity of
the condition.
Assessment of validity
Validity is defined as how well an instrument measures
what it was intended to measure [22, 26]. Ideally, validity
would be assessed by comparing an instrument to an
established gold standard. However, in the case of health-
related quality of life, no gold standard measure exists.
Therefore, construct validity was assessed by making
comparisons with other measures of quality of life and
disease severity, and assessing the totality of that evidence
to see whether the results from the GPBMs reflect the
patterns in scores seen in those other measures [22].
A common test to identify construct validity is the
‘known group’ method [22]. This is determined by the
degree to which an instrument can demonstrate different
scores for groups know to vary on the variables being
measured. In this study, health state utility values are
compared between groups of patients that are defined in
terms of disease severity and trends in the pattern of utility,
statistical tests (e.g. t test) and regression were used for
assessment. The patient population could be stratified on
the basis of a clinical indicator or a health-related quality of
life measure (generic- or condition-specific). A less strin-
gent test of construct validity is to define groups using a
case–control analysis where scores of patient group and
non-patient groups or general population are compared.
Another type of construct validity is known as con-
vergent validity [22]. This is defined as the extent to
which one measure correlates with another measure of the
same concept (although this measure is not regarded as
gold standard). In this review, the extent to which EQ-5D,
Qual Life Res
123
SF-6D or the HUI3 correlated with other measures of
hearing problems or health-related quality of life was
examined based on statistics including correlation coeffi-
cients or regression analysis with hearing-specific health-
related quality of life measures or measures of hearing
loss.
Assessment of responsiveness
Responsiveness is the ability to measure change. A pre/
post-intervention study which reports EQ-5D, SF-6D or the
HUI3 and another valid measure of health change would
allow the responsiveness of a measure due to change in
health status to be identified. As with the tests of validity, it
is important to consider whether the measures of health
change that used for comparison are valid themselves. In
addition, it is important to consider whether other health
changes not directly related to the condition could have
impacted upon health-related utility (for example, side
effects of treatment).
Assessment of reliability
The reliability of a measure is defined as its ability to
reproduce results when measurements are repeated on an
unchanged population [22]. Reliability can be measured by
retesting and reporting either the correlation or difference
between estimates. For this study, the measures were
considered reliable if they demonstrated no change in
health-related quality of life when the other reference
measures also demonstrated no change in health.
Presentation of data
Data were presented in a series of summary tables as well
as brief text, providing information on characteristics and
quality assessment of included studies, the measures
included, methods and result for validity assessment,
methods and results for responsiveness assessment. At the
end, a table providing an overview of performance of EQ-
5D, HUI3 and SF-6D was presented recording the findings
as a ‘H’ if the evidence supported the statement, or ‘x’ if
the evidence did not support the statement, or ‘?’ if the
evidences were mixed and conclusion could not be made,
or ‘N/R’ if no information was reported. If the pattern and
direction of EQ-5D were consistent with other measures in
terms of difference between groups or change over time,
this was considered as supporting evidence. Correlation
coefficients were grouped as small (\0.3), moderate
(0.03–0.5) and strong ([0.5), and a significant predictor of
regression was recorded as ‘H’.
Results
Search results
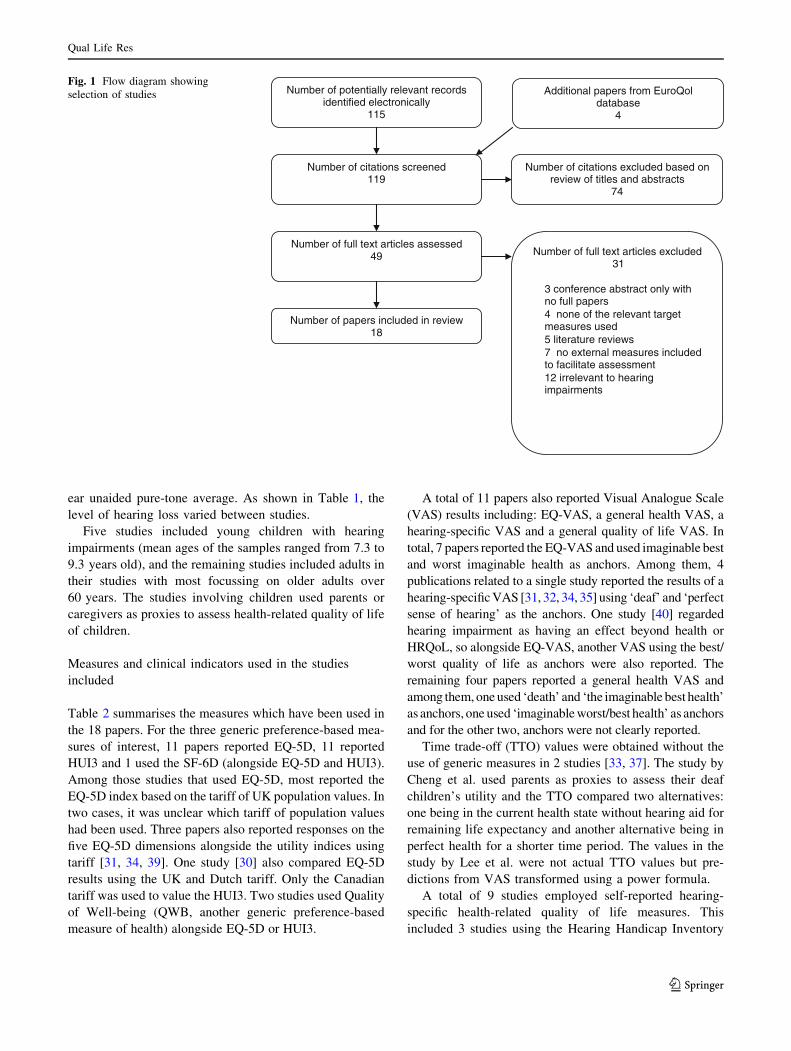
Bibliographic searching was completed in July 2010. The
search strategy identified 119 articles. After reviewing
titles and abstracts, 70 papers were excluded. Forty-nine
papers were reviewed in full, and a further 31 were
excluded and 18 papers were included in the final review
(see Fig. 1). Papers were included if they provided suffi-
cient evidence to assess the validity, responsiveness and
reliability of EQ-5D, HUI3 and SF-6D. However, the paper
did not have to have been designed for this purpose. Papers
were excluded if they did not include one of the generic
measures of interest. Papers were also excluded if validity
or responsiveness could not be assessed because no other
clinical or quality of life measures were included, and
differences over time or between interventions were not
reported. Since the focus of the review is preference-based
measures, papers only reporting Visual Analogue Scale
scores were also excluded.
Quality assessment and characteristics and of included
studies
Most studies were not designed to specifically assess the
validity, reliability and responsiveness of the instruments,
but all provided data in sufficient detail to allow an
assessment to be made. A range of recruitment procedures
was noted in the studies included in the review. Some were
cross-sectional observational studies [27, 28] but the
majority were prospective or retrospective before–after
studies [29–32]. Studies had well-defined inclusion/exclu-
sion criteria in recruitment. Sample size ranged from 20 to
3,272 with most of studies had around 100 participants but
two studies only had around 20 participants [29, 33]. For
longitudinal studies, no study had extremely high levels of
missing data. The reporting in these papers was reasonably
clear. After quality assessment, no studies were excluded
from the review.
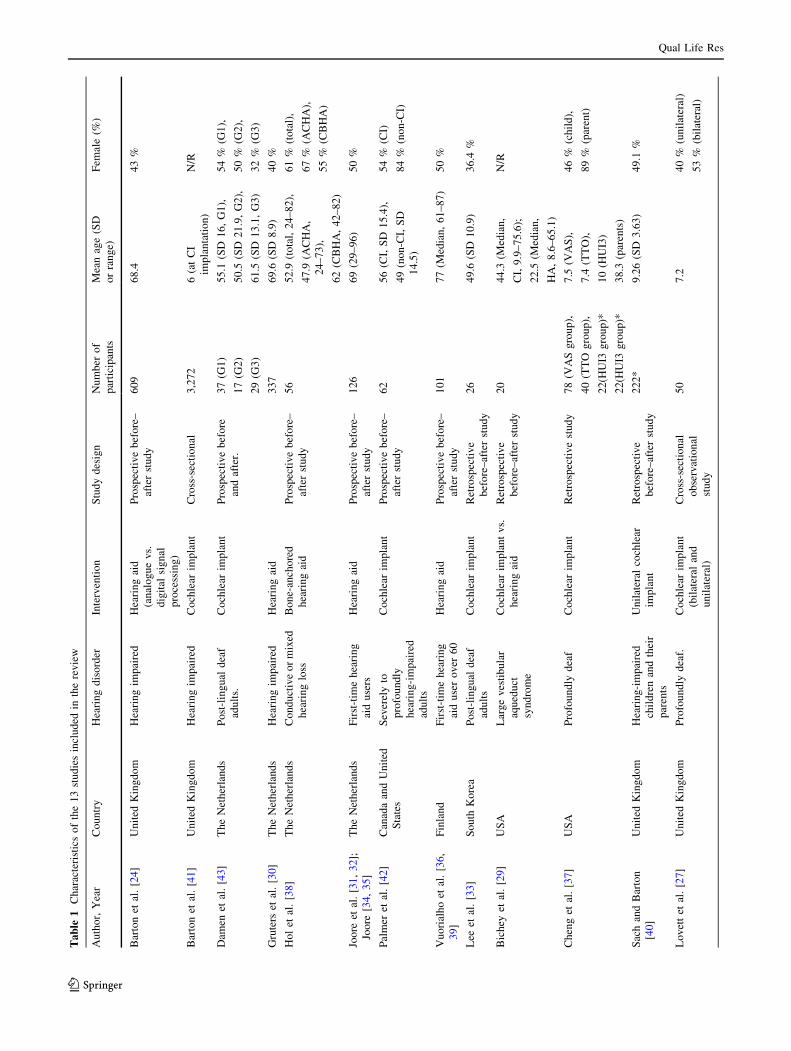
The main characteristics of the 18 papers included in
this review are shown in Table 1. The four papers by Joore
et al. [31, 32]; Joore [34, 35] reported the results of one
specific study and similarly the two papers by Vuorialho
et al. [36] reported a single study, resulting in 14 studies in
total. The studies were undertaken in a range of countries,
including United Kingdom, the Netherlands, USA, Canada
and Finland. Some studies recruited patients with specific
hearing problems, for example, Large Vestibular Aqueduct
Syndrome [29], profoundly deaf or conductive or mixed
hearing loss [37, 38]. Twelve papers reported hearing loss
of their sample using clinical indicators such as the better
Qual Life Res
123
ear unaided pure-tone average. As shown in Table 1, the
level of hearing loss varied between studies.
Five studies included young children with hearing
impairments (mean ages of the samples ranged from 7.3 to
9.3 years old), and the remaining studies included adults in
their studies with most focussing on older adults over
60 years. The studies involving children used parents or
caregivers as proxies to assess health-related quality of life
of children.
Measures and clinical indicators used in the studies
included
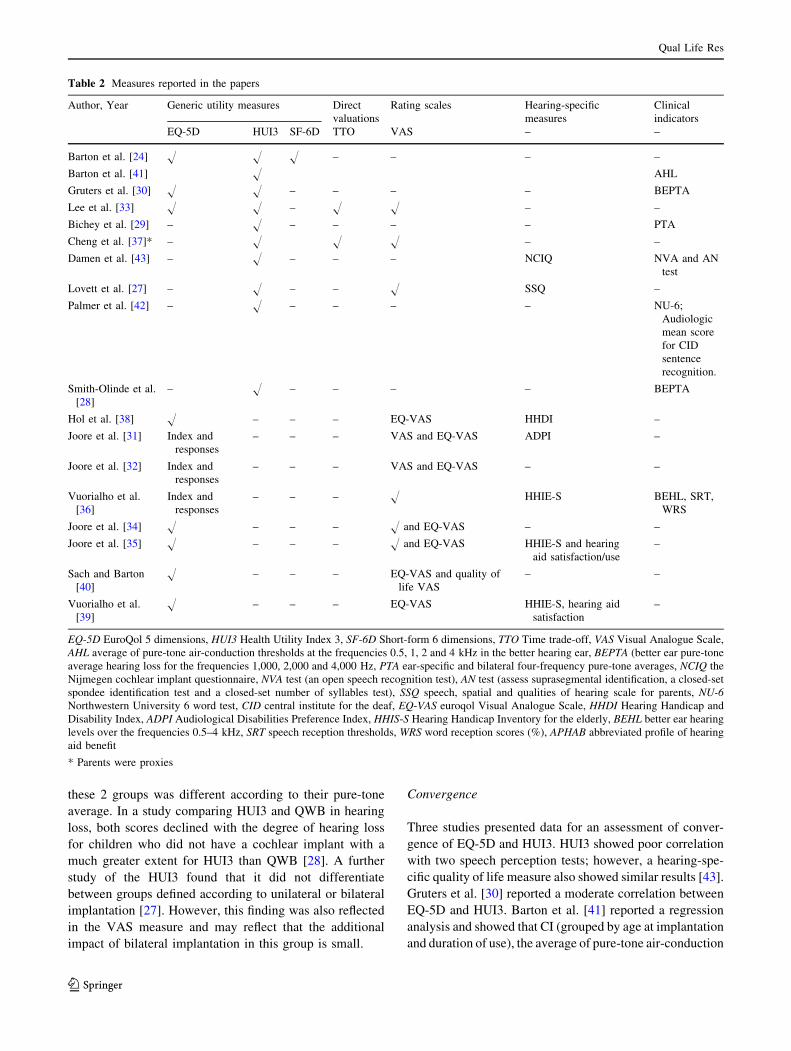
Table 2 summarises the measures which have been used in
the 18 papers. For the three generic preference-based mea-
sures of interest, 11 papers reported EQ-5D, 11 reported
HUI3 and 1 used the SF-6D (alongside EQ-5D and HUI3).
Among those studies that used EQ-5D, most reported the
EQ-5D index based on the tariff of UK population values. In
two cases, it was unclear which tariff of population values
had been used. Three papers also reported responses on the
five EQ-5D dimensions alongside the utility indices using
tariff [31, 34, 39]. One study [30] also compared EQ-5D
results using the UK and Dutch tariff. Only the Canadian
tariff was used to value the HUI3. Two studies used Quality
of Well-being (QWB, another generic preference-based
measure of health) alongside EQ-5D or HUI3.
A total of 11 papers also reported Visual Analogue Scale
(VAS) results including: EQ-VAS, a general health VAS, a
hearing-specific VAS and a general quality of life VAS. In
total, 7 papers reported the EQ-VAS and used imaginable best
and worst imaginable health as anchors. Among them, 4
publications related to a single study reported the results of a
hearing-specific VAS [31, 32, 34, 35] using ‘deaf’ and ‘perfect
sense of hearing’ as the anchors. One study [40] regarded
hearing impairment as having an effect beyond health or
HRQoL, so alongside EQ-VAS, another VAS using the best/
worst quality of life as anchors were also reported. The
remaining four papers reported a general health VAS and
among them, one used ‘death’ and ‘the imaginable best health’
as anchors, one used ‘imaginable worst/best health’ as anchors
and for the other two, anchors were not clearly reported.
Time trade-off (TTO) values were obtained without the
use of generic measures in 2 studies [33, 37]. The study by
Cheng et al. used parents as proxies to assess their deaf
children’s utility and the TTO compared two alternatives:
one being in the current health state without hearing aid for
remaining life expectancy and another alternative being in
perfect health for a shorter time period. The values in the
study by Lee et al. were not actual TTO values but pre-
dictions from VAS transformed using a power formula.
A total of 9 studies employed self-reported hearing-
specific health-related quality of life measures. This
included 3 studies using the Hearing Handicap Inventory
Number of potentially relevant records identified electronically
115
Number of citations screened119
Number of citations excluded based on review of titles and abstracts
74
Number of full text articles assessed49 Number of full text articles excluded
31
• 3 conference abstract only with no full papers
• 4 none of the relevant target measures used
• 5 literature reviews• 7 no external measures included
to facilitate assessment • 12 irrelevant to hearing
impairments
Number of papers included in review18
Additional papers from EuroQol database
4
Fig. 1 Flow diagram showing
selection of studies
Qual Life Res
123
Ta
ble
1C
har
acte
rist
ics
of
the
13
stu
die
sin
clu
ded
inth
ere
vie
w
Au
tho
r,Y
ear
Co
un
try
Hea
rin
gd
iso
rder
Inte
rven
tio
nS
tud
yd
esig
nN
um
ber
of
par
tici
pan
ts
Mea
nag
e(S
D
or
ran
ge)
Fem
ale
(%)
Bar
ton
etal
.[2
4]
Un
ited
Kin
gd
om
Hea
rin
gim
pai
red
Hea
rin
gai
d
(an
alo
gu
ev
s.
dig
ital
sig
nal
pro
cess
ing
)
Pro
spec
tiv
eb
efo
re–
afte
rst
ud
y
60
96
8.4
43
%
Bar
ton
etal
.[4
1]
Un
ited
Kin
gd
om
Hea
rin
gim
pai
red
Co
chle
arim
pla
nt
Cro
ss-s
ecti
on
al3
,27
26
(at
CI
imp
lan
tati
on
)
N/R
Dam
enet
al.
[43]
Th
eN
eth
erla
nd
sP
ost
-lin
gu
ald
eaf
adu
lts.
Co
chle
arim
pla
nt
Pro
spec
tiv
eb
efo
re
and
afte
r.
37
(G1
)
17
(G2
)
29
(G3
)
55
.1(S
D1
6,
G1
),
50
.5(S
D2
1.9
,G
2),
61
.5(S
D1
3.1
,G
3)
54
%(G
1),
50
%(G
2),
32
%(G
3)
Gru
ters
etal
.[3
0]
Th
eN
eth
erla
nd
sH
eari
ng
imp
aire
dH
eari
ng
aid
33
76
9.6
(SD
8.9
)4
0%
Ho
let
al.
[38]
Th
eN
eth
erla
nd
sC
on
du
ctiv
eo
rm
ixed
hea
rin
glo
ss
Bo
ne-
anch
ore
d
hea
rin
gai
d
Pro
spec
tiv
eb
efo
re–
afte
rst
ud
y
56
52
.9(t
ota
l,2
4–
82
),
47
.9(A
CH
A,
24
–7
3),
62
(CB
HA
,4
2–
82
)
61
%(t
ota
l),
67
%(A
CH
A),
55
%(C
BH
A)
Joo
reet
al.
[31
,3
2];
Joo
re[3
4,
35
]
Th
eN
eth
erla
nd
sF
irst
-tim
eh
eari
ng
aid
use
rs
Hea
rin
gai
dP
rosp
ecti
ve
bef
ore
–
afte
rst
ud
y
12
66
9(2
9–
96
)5
0%
Pal
mer
etal
.[4
2]
Can
ada
and
Un
ited
Sta
tes
Sev
erel
yto
pro
fou
nd
ly
hea
rin
g-i
mp
aire
d
adu
lts
Co
chle
arim
pla
nt
Pro
spec
tiv
eb
efo
re–
afte
rst
ud
y
62
56
(CI,
SD
15
.4),
49
(no
n-C
I,S
D
14
.5)
54
%(C
I)
84
%(n
on
-CI)
Vu
ori
alh
oet
al.
[36
,
39
]
Fin
lan
dF
irst
-tim
eh
eari
ng
aid
use
ro
ver
60
Hea
rin
gai
dP
rosp
ecti
ve
bef
ore
–
afte
rst
ud
y
10
17
7(M
edia
n,
61
–8
7)
50
%
Lee
etal
.[3
3]
So
uth
Ko
rea
Po
st-l
ing
ual
dea
f
adu
lts
Co
chle
arim
pla
nt
Ret
rosp
ecti
ve
bef
ore
–af
ter
stu
dy
26
49
.6(S
D1
0.9
)3
6.4
%
Bic
hey
etal
.[2
9]
US
AL
arg
ev
esti
bu
lar
aqu
edu
ct
syn
dro
me
Co
chle
arim
pla
nt
vs.
hea
rin
gai
d
Ret
rosp
ecti
ve
bef
ore
–af
ter
stu
dy
20
44
.3(M
edia
n,
CI,
9.9
–7
5.6
);
22
.5(M
edia
n,
HA
,8
.6–
65
.1)
N/R
Ch
eng
etal
.[3
7]
US
AP
rofo
un
dly
dea
fC
och
lear
imp
lan
tR
etro
spec
tiv
est
ud
y7
8(V
AS
gro
up
),
40
(TT
Og
rou
p),
22
(HU
I3g
rou
p)*
22
(HU
I3g
rou
p)*
7.5
(VA
S),
7.4
(TT
O),
10
(HU
I3)
38
.3(p
aren
ts)
46
%(c
hil
d),
89
%(p
aren
t)
Sac
han
dB
arto
n
[40
]
Un
ited
Kin
gd
om
Hea
rin
g-i
mp
aire
d
chil
dre
nan
dth
eir
par
ents
Un
ilat
eral
coch
lear
imp
lan
t
Ret
rosp
ecti
ve
bef
ore
–af
ter
stu
dy
22
2*
9.2
6(S
D3
.63
)4
9.1
%
Lo
vet
tet
al.
[27]
Un
ited
Kin
gd
om
Pro
fou
nd
lyd
eaf.
Co
chle
arim
pla
nt
(bil
ater
alan
d
un
ilat
eral
)
Cro
ss-s
ecti
on
al
ob
serv
atio
nal
stu
dy
50
7.2
40
%(u
nil
ater
al)
53
%(b
ilat
eral
)
Qual Life Res
123
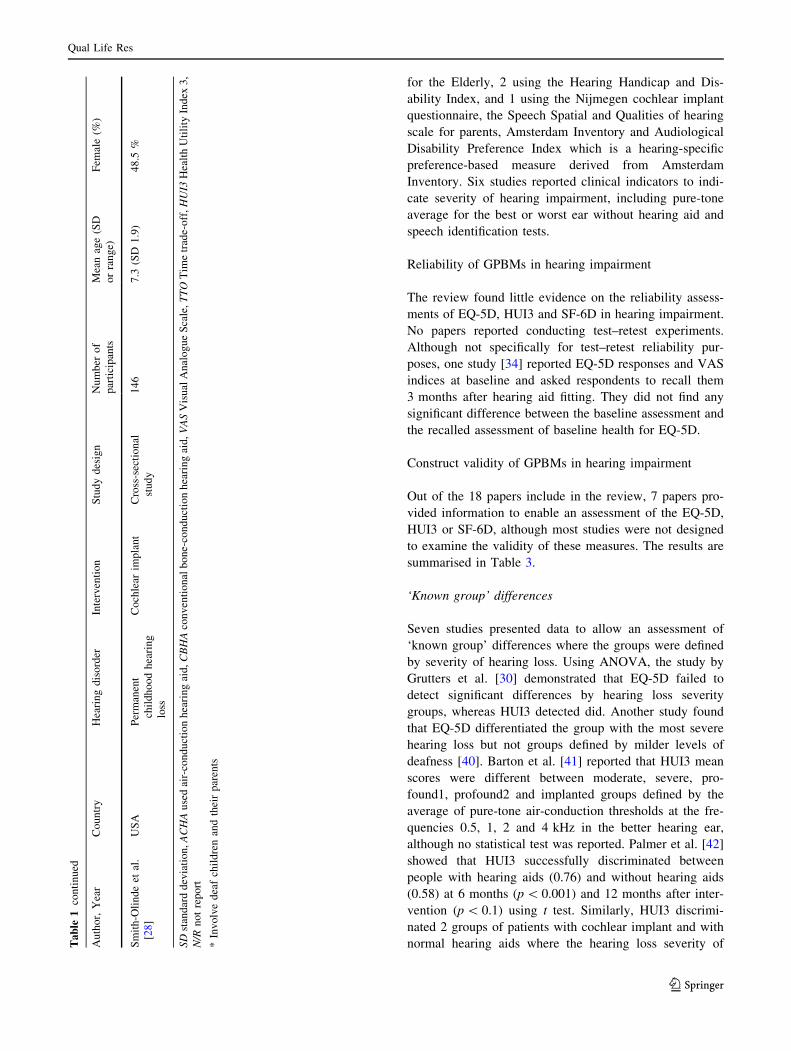
for the Elderly, 2 using the Hearing Handicap and Dis-
ability Index, and 1 using the Nijmegen cochlear implant
questionnaire, the Speech Spatial and Qualities of hearing
scale for parents, Amsterdam Inventory and Audiological
Disability Preference Index which is a hearing-specific
preference-based measure derived from Amsterdam
Inventory. Six studies reported clinical indicators to indi-
cate severity of hearing impairment, including pure-tone
average for the best or worst ear without hearing aid and
speech identification tests.
Reliability of GPBMs in hearing impairment
The review found little evidence on the reliability assess-
ments of EQ-5D, HUI3 and SF-6D in hearing impairment.
No papers reported conducting test–retest experiments.
Although not specifically for test–retest reliability pur-
poses, one study [34] reported EQ-5D responses and VAS
indices at baseline and asked respondents to recall them
3 months after hearing aid fitting. They did not find any
significant difference between the baseline assessment and
the recalled assessment of baseline health for EQ-5D.
Construct validity of GPBMs in hearing impairment
Out of the 18 papers include in the review, 7 papers pro-
vided information to enable an assessment of the EQ-5D,
HUI3 or SF-6D, although most studies were not designed
to examine the validity of these measures. The results are
summarised in Table 3.
‘Known group’ differences
Seven studies presented data to allow an assessment of
‘known group’ differences where the groups were defined
by severity of hearing loss. Using ANOVA, the study by
Grutters et al. [30] demonstrated that EQ-5D failed to
detect significant differences by hearing loss severity
groups, whereas HUI3 detected did. Another study found
that EQ-5D differentiated the group with the most severe
hearing loss but not groups defined by milder levels of
deafness [40]. Barton et al. [41] reported that HUI3 mean
scores were different between moderate, severe, pro-
found1, profound2 and implanted groups defined by the
average of pure-tone air-conduction thresholds at the fre-
quencies 0.5, 1, 2 and 4 kHz in the better hearing ear,
although no statistical test was reported. Palmer et al. [42]
showed that HUI3 successfully discriminated between
people with hearing aids (0.76) and without hearing aids
(0.58) at 6 months (p \ 0.001) and 12 months after inter-
vention (p \ 0.1) using t test. Similarly, HUI3 discrimi-
nated 2 groups of patients with cochlear implant and with
normal hearing aids where the hearing loss severity ofTa
ble
1co
nti
nu
ed
Au
tho
r,Y
ear
Co
un
try
Hea
rin
gd
iso
rder
Inte
rven
tio
nS
tud
yd
esig
nN
um
ber
of
par
tici
pan
ts
Mea
nag
e(S
D
or
ran
ge)
Fem
ale
(%)
Sm
ith
-Oli
nd
eet
al.
[28
]
US
AP
erm
anen
t
chil
dh
oo
dh
eari
ng
loss
Co
chle
arim
pla
nt
Cro
ss-s
ecti
on
al
stu
dy
14
67
.3(S
D1
.9)
48
.5%
SD
stan
dar
dd
evia
tio
n,A
CH
Au
sed
air-
con
du
ctio
nh
eari
ng
aid
,C
BH
Aco
nv
enti
on
alb
on
e-co
nd
uct
ion
hea
rin
gai
d,V
AS
Vis
ual
An
alo
gu
eS
cale
,T
TO
Tim
etr
ade-
off
,H
UI3
Hea
lth
Uti
lity
Ind
ex3
,
N/R
no
tre
po
rt
*In
vo
lve
dea
fch
ild
ren
and
thei
rp
aren
ts
Qual Life Res
123
these 2 groups was different according to their pure-tone
average. In a study comparing HUI3 and QWB in hearing
loss, both scores declined with the degree of hearing loss
for children who did not have a cochlear implant with a
much greater extent for HUI3 than QWB [28]. A further
study of the HUI3 found that it did not differentiate
between groups defined according to unilateral or bilateral
implantation [27]. However, this finding was also reflected
in the VAS measure and may reflect that the additional
impact of bilateral implantation in this group is small.
Convergence
Three studies presented data for an assessment of conver-
gence of EQ-5D and HUI3. HUI3 showed poor correlation
with two speech perception tests; however, a hearing-spe-
cific quality of life measure also showed similar results [43].
Gruters et al. [30] reported a moderate correlation between
EQ-5D and HUI3. Barton et al. [41] reported a regression
analysis and showed that CI (grouped by age at implantation
and duration of use), the average of pure-tone air-conduction
Table 2 Measures reported in the papers
Author, Year Generic utility measures Direct
valuations
Rating scales Hearing-specific
measures
Clinical
indicators
EQ-5D HUI3 SF-6D TTO VAS – –
Barton et al. [24] H H H – – – –
Barton et al. [41] H AHL
Gruters et al. [30] H H – – – – BEPTA
Lee et al. [33] H H – H H – –
Bichey et al. [29] – H – – – – PTA
Cheng et al. [37]* – H H H – –
Damen et al. [43] – H – – – NCIQ NVA and AN
test
Lovett et al. [27] – H – – H SSQ –
Palmer et al. [42] – H – – – – NU-6;
Audiologic
mean score
for CID
sentence
recognition.
Smith-Olinde et al.
[28]
– H – – – – BEPTA
Hol et al. [38] H – – – EQ-VAS HHDI –
Joore et al. [31] Index and
responses
– – – VAS and EQ-VAS ADPI –
Joore et al. [32] Index and
responses
– – – VAS and EQ-VAS – –
Vuorialho et al.
[36]
Index and
responses
– – – H HHIE-S BEHL, SRT,
WRS
Joore et al. [34] H – – – H and EQ-VAS – –
Joore et al. [35] H – – – H and EQ-VAS HHIE-S and hearing
aid satisfaction/use
–
Sach and Barton
[40]
H – – – EQ-VAS and quality of
life VAS
– –
Vuorialho et al.
[39]
H – – – EQ-VAS HHIE-S, hearing aid
satisfaction
–
EQ-5D EuroQol 5 dimensions, HUI3 Health Utility Index 3, SF-6D Short-form 6 dimensions, TTO Time trade-off, VAS Visual Analogue Scale,
AHL average of pure-tone air-conduction thresholds at the frequencies 0.5, 1, 2 and 4 kHz in the better hearing ear, BEPTA (better ear pure-tone
average hearing loss for the frequencies 1,000, 2,000 and 4,000 Hz, PTA ear-specific and bilateral four-frequency pure-tone averages, NCIQ the
Nijmegen cochlear implant questionnaire, NVA test (an open speech recognition test), AN test (assess suprasegmental identification, a closed-set
spondee identification test and a closed-set number of syllables test), SSQ speech, spatial and qualities of hearing scale for parents, NU-6Northwestern University 6 word test, CID central institute for the deaf, EQ-VAS euroqol Visual Analogue Scale, HHDI Hearing Handicap and
Disability Index, ADPI Audiological Disabilities Preference Index, HHIS-S Hearing Handicap Inventory for the elderly, BEHL better ear hearing
levels over the frequencies 0.5–4 kHz, SRT speech reception thresholds, WRS word reception scores (%), APHAB abbreviated profile of hearing
aid benefit
* Parents were proxies
Qual Life Res
123
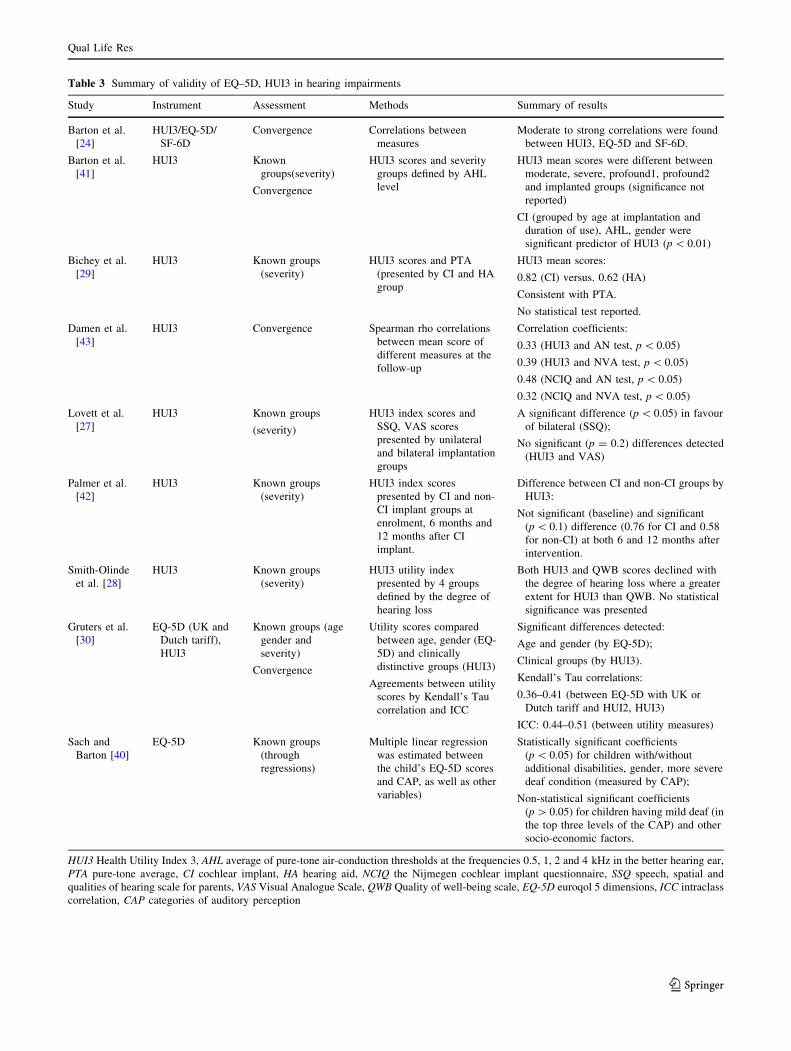
Table 3 Summary of validity of EQ–5D, HUI3 in hearing impairments
Study Instrument Assessment Methods Summary of results
Barton et al.
[24]
HUI3/EQ-5D/
SF-6D
Convergence Correlations between
measures
Moderate to strong correlations were found
between HUI3, EQ-5D and SF-6D.
Barton et al.
[41]
HUI3 Known
groups(severity)
Convergence
HUI3 scores and severity
groups defined by AHL
level
HUI3 mean scores were different between
moderate, severe, profound1, profound2
and implanted groups (significance not
reported)
CI (grouped by age at implantation and
duration of use), AHL, gender were
significant predictor of HUI3 (p \ 0.01)
Bichey et al.
[29]
HUI3 Known groups
(severity)
HUI3 scores and PTA
(presented by CI and HA
group
HUI3 mean scores:
0.82 (CI) versus. 0.62 (HA)
Consistent with PTA.
No statistical test reported.
Damen et al.
[43]
HUI3 Convergence Spearman rho correlations
between mean score of
different measures at the
follow-up
Correlation coefficients:
0.33 (HUI3 and AN test, p \ 0.05)
0.39 (HUI3 and NVA test, p \ 0.05)
0.48 (NCIQ and AN test, p \ 0.05)
0.32 (NCIQ and NVA test, p \ 0.05)
Lovett et al.
[27]
HUI3 Known groups
(severity)
HUI3 index scores and
SSQ, VAS scores
presented by unilateral
and bilateral implantation
groups
A significant difference (p \ 0.05) in favour
of bilateral (SSQ);
No significant (p = 0.2) differences detected
(HUI3 and VAS)
Palmer et al.
[42]
HUI3 Known groups
(severity)
HUI3 index scores
presented by CI and non-
CI implant groups at
enrolment, 6 months and
12 months after CI
implant.
Difference between CI and non-CI groups by
HUI3:
Not significant (baseline) and significant
(p \ 0.1) difference (0.76 for CI and 0.58
for non-CI) at both 6 and 12 months after
intervention.
Smith-Olinde
et al. [28]
HUI3 Known groups
(severity)
HUI3 utility index
presented by 4 groups
defined by the degree of
hearing loss
Both HUI3 and QWB scores declined with
the degree of hearing loss where a greater
extent for HUI3 than QWB. No statistical
significance was presented
Gruters et al.
[30]
EQ-5D (UK and
Dutch tariff),
HUI3
Known groups (age
gender and
severity)
Convergence
Utility scores compared
between age, gender (EQ-
5D) and clinically
distinctive groups (HUI3)
Agreements between utility
scores by Kendall’s Tau
correlation and ICC
Significant differences detected:
Age and gender (by EQ-5D);
Clinical groups (by HUI3).
Kendall’s Tau correlations:
0.36–0.41 (between EQ-5D with UK or
Dutch tariff and HUI2, HUI3)
ICC: 0.44–0.51 (between utility measures)
Sach and
Barton [40]
EQ-5D Known groups
(through
regressions)
Multiple linear regression
was estimated between
the child’s EQ-5D scores
and CAP, as well as other
variables)
Statistically significant coefficients
(p \ 0.05) for children with/without
additional disabilities, gender, more severe
deaf condition (measured by CAP);
Non-statistical significant coefficients
(p [ 0.05) for children having mild deaf (in
the top three levels of the CAP) and other
socio-economic factors.
HUI3 Health Utility Index 3, AHL average of pure-tone air-conduction thresholds at the frequencies 0.5, 1, 2 and 4 kHz in the better hearing ear,
PTA pure-tone average, CI cochlear implant, HA hearing aid, NCIQ the Nijmegen cochlear implant questionnaire, SSQ speech, spatial and
qualities of hearing scale for parents, VAS Visual Analogue Scale, QWB Quality of well-being scale, EQ-5D euroqol 5 dimensions, ICC intraclass
correlation, CAP categories of auditory perception
Qual Life Res
123
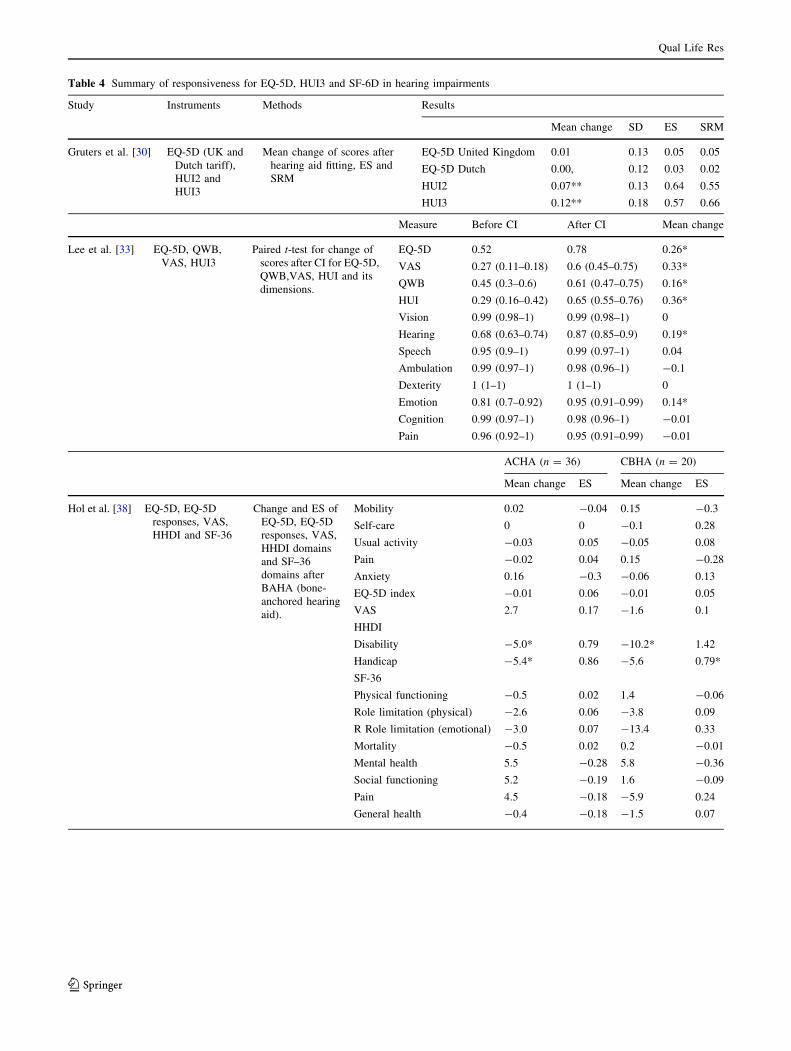
Table 4 Summary of responsiveness for EQ-5D, HUI3 and SF-6D in hearing impairments
Study Instruments Methods Results
Mean change SD ES SRM
Gruters et al. [30] EQ-5D (UK and
Dutch tariff),
HUI2 and
HUI3
Mean change of scores after
hearing aid fitting, ES and
SRM
EQ-5D United Kingdom 0.01 0.13 0.05 0.05
EQ-5D Dutch 0.00, 0.12 0.03 0.02
HUI2 0.07** 0.13 0.64 0.55
HUI3 0.12** 0.18 0.57 0.66
Measure Before CI After CI Mean change
Lee et al. [33] EQ-5D, QWB,
VAS, HUI3
Paired t-test for change of
scores after CI for EQ-5D,
QWB,VAS, HUI and its
dimensions.
EQ-5D 0.52 0.78 0.26*
VAS 0.27 (0.11–0.18) 0.6 (0.45–0.75) 0.33*
QWB 0.45 (0.3–0.6) 0.61 (0.47–0.75) 0.16*
HUI 0.29 (0.16–0.42) 0.65 (0.55–0.76) 0.36*
Vision 0.99 (0.98–1) 0.99 (0.98–1) 0
Hearing 0.68 (0.63–0.74) 0.87 (0.85–0.9) 0.19*
Speech 0.95 (0.9–1) 0.99 (0.97–1) 0.04
Ambulation 0.99 (0.97–1) 0.98 (0.96–1) -0.1
Dexterity 1 (1–1) 1 (1–1) 0
Emotion 0.81 (0.7–0.92) 0.95 (0.91–0.99) 0.14*
Cognition 0.99 (0.97–1) 0.98 (0.96–1) -0.01
Pain 0.96 (0.92–1) 0.95 (0.91–0.99) -0.01
ACHA (n = 36) CBHA (n = 20)
Mean change ES Mean change ES
Hol et al. [38] EQ-5D, EQ-5D
responses, VAS,
HHDI and SF-36
Change and ES of
EQ-5D, EQ-5D
responses, VAS,
HHDI domains
and SF–36
domains after
BAHA (bone-
anchored hearing
aid).
Mobility 0.02 -0.04 0.15 -0.3
Self-care 0 0 -0.1 0.28
Usual activity -0.03 0.05 -0.05 0.08
Pain -0.02 0.04 0.15 -0.28
Anxiety 0.16 -0.3 -0.06 0.13
EQ-5D index -0.01 0.06 -0.01 0.05
VAS 2.7 0.17 -1.6 0.1
HHDI
Disability -5.0* 0.79 -10.2* 1.42
Handicap -5.4* 0.86 -5.6 0.79*
SF-36
Physical functioning -0.5 0.02 1.4 -0.06
Role limitation (physical) -2.6 0.06 -3.8 0.09
R Role limitation (emotional) -3.0 0.07 -13.4 0.33
Mortality -0.5 0.02 0.2 -0.01
Mental health 5.5 -0.28 5.8 -0.36
Social functioning 5.2 -0.19 1.6 -0.09
Pain 4.5 -0.18 -5.9 0.24
General health -0.4 -0.18 -1.5 0.07
Qual Life Res
123
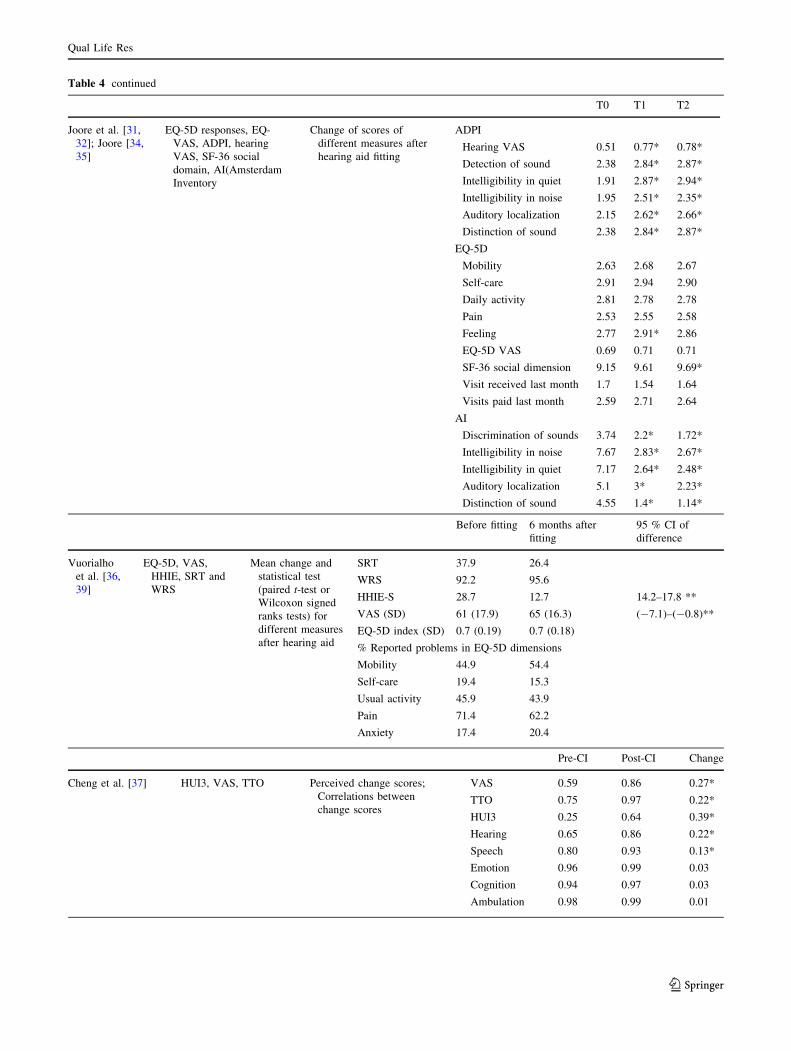
Table 4 continued
T0 T1 T2
Joore et al. [31,
32]; Joore [34,
35]
EQ-5D responses, EQ-
VAS, ADPI, hearing
VAS, SF-36 social
domain, AI(Amsterdam
Inventory
Change of scores of
different measures after
hearing aid fitting
ADPI
Hearing VAS 0.51 0.77* 0.78*
Detection of sound 2.38 2.84* 2.87*
Intelligibility in quiet 1.91 2.87* 2.94*
Intelligibility in noise 1.95 2.51* 2.35*
Auditory localization 2.15 2.62* 2.66*
Distinction of sound 2.38 2.84* 2.87*
EQ-5D
Mobility 2.63 2.68 2.67
Self-care 2.91 2.94 2.90
Daily activity 2.81 2.78 2.78
Pain 2.53 2.55 2.58
Feeling 2.77 2.91* 2.86
EQ-5D VAS 0.69 0.71 0.71
SF-36 social dimension 9.15 9.61 9.69*
Visit received last month 1.7 1.54 1.64
Visits paid last month 2.59 2.71 2.64
AI
Discrimination of sounds 3.74 2.2* 1.72*
Intelligibility in noise 7.67 2.83* 2.67*
Intelligibility in quiet 7.17 2.64* 2.48*
Auditory localization 5.1 3* 2.23*
Distinction of sound 4.55 1.4* 1.14*
Before fitting 6 months after
fitting
95 % CI of
difference
Vuorialho
et al. [36,
39]
EQ-5D, VAS,
HHIE, SRT and
WRS
Mean change and
statistical test
(paired t-test or
Wilcoxon signed
ranks tests) for
different measures
after hearing aid
SRT 37.9 26.4
WRS 92.2 95.6
HHIE-S 28.7 12.7 14.2–17.8 **
VAS (SD) 61 (17.9) 65 (16.3) (-7.1)–(-0.8)**
EQ-5D index (SD) 0.7 (0.19) 0.7 (0.18)
% Reported problems in EQ-5D dimensions
Mobility 44.9 54.4
Self-care 19.4 15.3
Usual activity 45.9 43.9
Pain 71.4 62.2
Anxiety 17.4 20.4
Pre-CI Post-CI Change
Cheng et al. [37] HUI3, VAS, TTO Perceived change scores;
Correlations between
change scores
VAS 0.59 0.86 0.27*
TTO 0.75 0.97 0.22*
HUI3 0.25 0.64 0.39*
Hearing 0.65 0.86 0.22*
Speech 0.80 0.93 0.13*
Emotion 0.96 0.99 0.03
Cognition 0.94 0.97 0.03
Ambulation 0.98 0.99 0.01
Qual Life Res
123
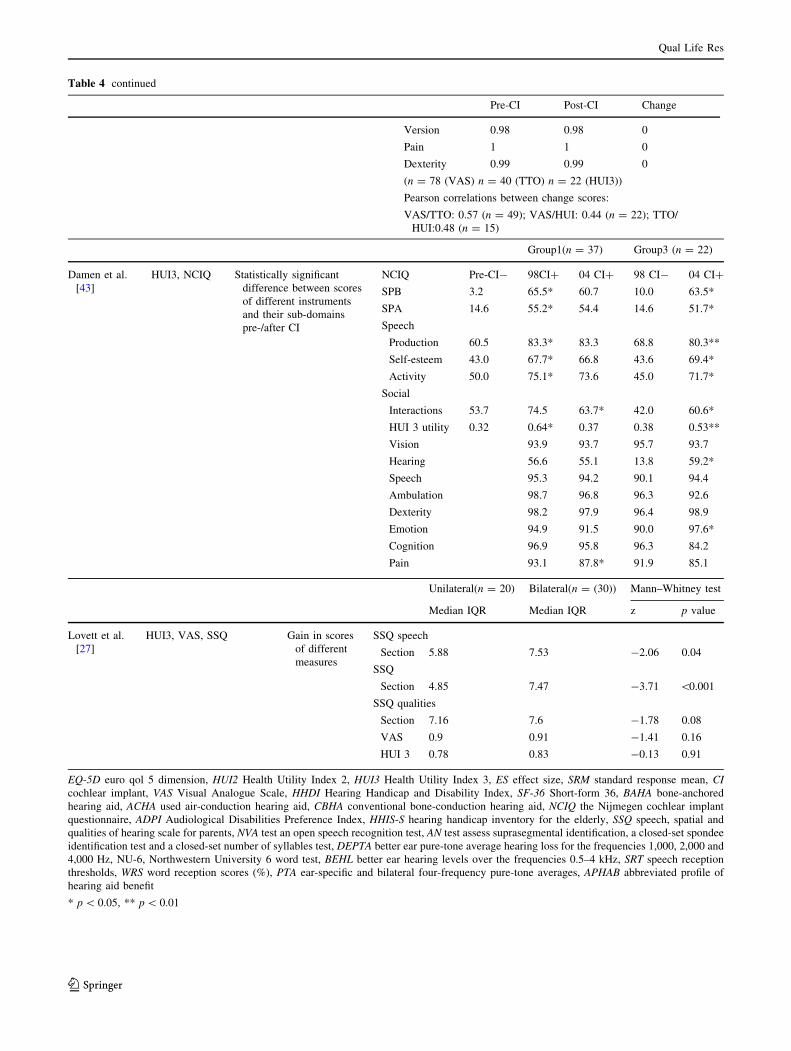
Table 4 continued
Pre-CI Post-CI Change
Version 0.98 0.98 0
Pain 1 1 0
Dexterity 0.99 0.99 0
(n = 78 (VAS) n = 40 (TTO) n = 22 (HUI3))
Pearson correlations between change scores:
VAS/TTO: 0.57 (n = 49); VAS/HUI: 0.44 (n = 22); TTO/
HUI:0.48 (n = 15)
Group1(n = 37) Group3 (n = 22)
Damen et al.
[43]
HUI3, NCIQ Statistically significant
difference between scores
of different instruments
and their sub-domains
pre-/after CI
NCIQ Pre-CI- 98CI? 04 CI? 98 CI- 04 CI?
SPB 3.2 65.5* 60.7 10.0 63.5*
SPA 14.6 55.2* 54.4 14.6 51.7*
Speech
Production 60.5 83.3* 83.3 68.8 80.3**
Self-esteem 43.0 67.7* 66.8 43.6 69.4*
Activity 50.0 75.1* 73.6 45.0 71.7*
Social
Interactions 53.7 74.5 63.7* 42.0 60.6*
HUI 3 utility 0.32 0.64* 0.37 0.38 0.53**
Vision 93.9 93.7 95.7 93.7
Hearing 56.6 55.1 13.8 59.2*
Speech 95.3 94.2 90.1 94.4
Ambulation 98.7 96.8 96.3 92.6
Dexterity 98.2 97.9 96.4 98.9
Emotion 94.9 91.5 90.0 97.6*
Cognition 96.9 95.8 96.3 84.2
Pain 93.1 87.8* 91.9 85.1
Unilateral(n = 20) Bilateral(n = (30)) Mann–Whitney test
Median IQR Median IQR z p value
Lovett et al.
[27]
HUI3, VAS, SSQ Gain in scores
of different
measures
SSQ speech
Section 5.88 7.53 -2.06 0.04
SSQ
Section 4.85 7.47 -3.71 \0.001
SSQ qualities
Section 7.16 7.6 -1.78 0.08
VAS 0.9 0.91 -1.41 0.16
HUI 3 0.78 0.83 -0.13 0.91
EQ-5D euro qol 5 dimension, HUI2 Health Utility Index 2, HUI3 Health Utility Index 3, ES effect size, SRM standard response mean, CIcochlear implant, VAS Visual Analogue Scale, HHDI Hearing Handicap and Disability Index, SF-36 Short-form 36, BAHA bone-anchored
hearing aid, ACHA used air-conduction hearing aid, CBHA conventional bone-conduction hearing aid, NCIQ the Nijmegen cochlear implant
questionnaire, ADPI Audiological Disabilities Preference Index, HHIS-S hearing handicap inventory for the elderly, SSQ speech, spatial and
qualities of hearing scale for parents, NVA test an open speech recognition test, AN test assess suprasegmental identification, a closed-set spondee
identification test and a closed-set number of syllables test, DEPTA better ear pure-tone average hearing loss for the frequencies 1,000, 2,000 and
4,000 Hz, NU-6, Northwestern University 6 word test, BEHL better ear hearing levels over the frequencies 0.5–4 kHz, SRT speech reception
thresholds, WRS word reception scores (%), PTA ear-specific and bilateral four-frequency pure-tone averages, APHAB abbreviated profile of
hearing aid benefit
* p \ 0.05, ** p \ 0.01
Qual Life Res
123
thresholds at the frequencies 0.5, 1, 2 and 4 kHz in the better
hearing ear, and gender were significant predictor of HUI3
(p \ 0.01) in a large cross-sectional study. HUI3 scores apart
from this, no other papers reported correlations between
health-related quality of life measures with clinical indica-
tors of hearing loss. Barton et al. [24] reported strong cor-
relations between EQ-5D, HUI3 and SF-SD in their study.
Responsiveness of GPBMs in hearing impairment
Twelve papers involved a total of 8 studies that provided
adequate information to allow an assessment of respon-
siveness of EQ-5D and/or HUI3 (see Table 4). Only two
studies were specifically designed to examine responsive-
ness of different measures and responsiveness indices such
as effect size and standard response mean were reported
[38, 39].
Comparison between GPBMs
Comparison of mean change scores of different GPBMs
using statistical tests were reported by Gruter et al. [30] and
Lee et al. [33] (See below Table 4 for details). Gruter
et al.’s study found that HUI2 and HUI3 detected statisti-
cally significant change after cochlear implant fitting (0.07
and 0.12, respectively), whereas change scores of EQ-5D
were smaller and not statistically significant (0.01). In
terms of effect size, HUI2 and HUI3 were high (0.57 and
0.64, respectively), whereas the change in EQ-5D was very
small (0.02 and 0.05 for both UK and Dutch tariffs). The
study by Lee et al. demonstrated that the increase in scores
of the GPBMs, including EQ-5D (0.26), VAS (0.33), HUI3
(0.36) and QWB (0.16), was all statistically significant
following cochlear implantation. For HUI3 dimensions,
score increases for hearing (0.19) and emotion (0.14) was
statistically significant (p \ 0.05), whereas non-significant
for other dimensions. The results suggest that the EQ-5D
was responsive in capturing larger improvements in hear-
ing as in the study by Lee et al. but was not able to capture
the smaller levels of improvement shown in the study by
Grunter et al.
Responsiveness of EQ-5D
Eight papers reported the responsiveness of EQ-5D without
the other 2 generic measures by comparing them with
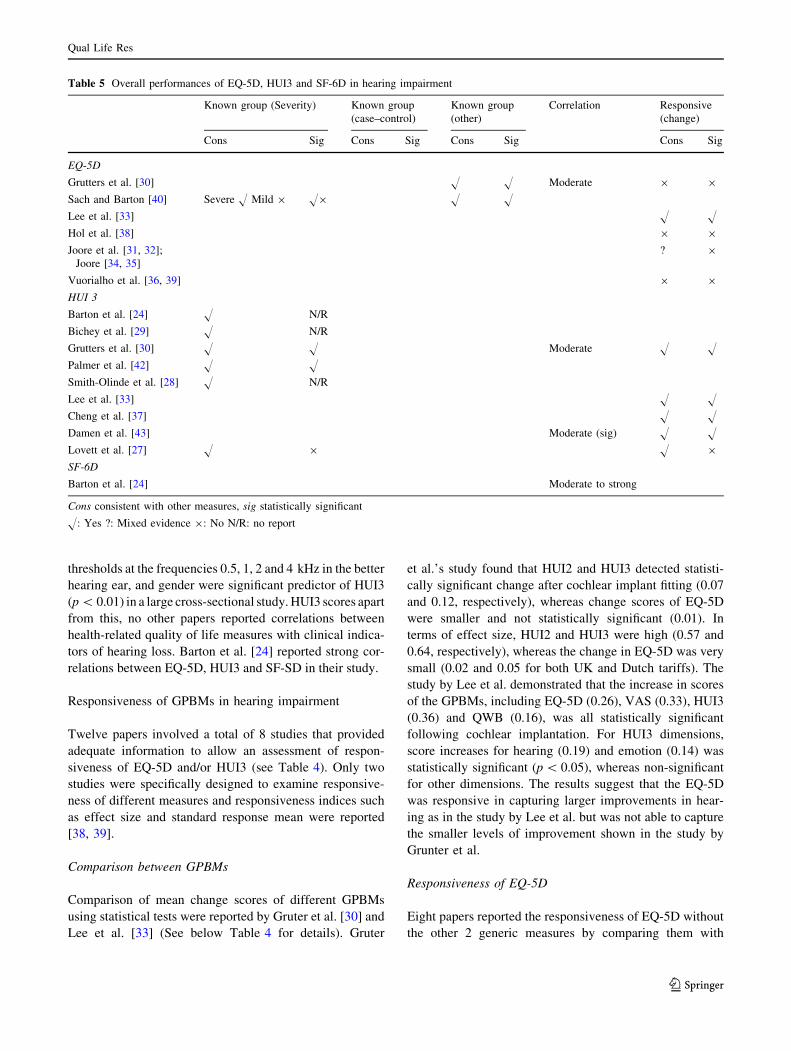
Table 5 Overall performances of EQ-5D, HUI3 and SF-6D in hearing impairment
Known group (Severity) Known group
(case–control)
Known group
(other)
Correlation Responsive
(change)
Cons Sig Cons Sig Cons Sig Cons Sig
EQ-5D
Grutters et al. [30] H H Moderate 9 9
Sach and Barton [40] Severe H Mild 9 H9 H H
Lee et al. [33] H H
Hol et al. [38] 9 9
Joore et al. [31, 32];
Joore [34, 35]
? 9
Vuorialho et al. [36, 39] 9 9
HUI 3
Barton et al. [24] H N/R
Bichey et al. [29] H N/R
Grutters et al. [30] H H Moderate H H
Palmer et al. [42] H H
Smith-Olinde et al. [28] H N/R
Lee et al. [33] H H
Cheng et al. [37] H H
Damen et al. [43] Moderate (sig) H H
Lovett et al. [27] H 9 H 9
SF-6D
Barton et al. [24] Moderate to strong
Cons consistent with other measures, sig statistically significant
H: Yes ?: Mixed evidence 9: No N/R: no report
Qual Life Res
123
EQ-VAS, hearing VAS or other hearing-specific measures,
which involved a total of 4 separate studies. In these studies,
no statistically significant changes before and after the
hearing intervention were detected by the EQ-5D [31, 32, 34,
35, 38, 39] and the effect size where reported was very low
[38]. Whereas statistically significant improvements were
shown in VAS scores [32, 34–36, 39], and condition-specific
measures such as two sub-domains (disability and handicap)
of Hearing Handicap and Disability Index [38], overall
scores of the Hearing Handicap Inventory for the Elderly and
its 2 sub-domain scores [36, 39], and the 5 questions of
Amsterdam Inventory and Audiological Disabilities Pref-
erence Index [35]. Joore’s study reported the self-perceived
SF-36 social functioning which was significantly improved
after hearing aid fitting in long term.
Responsiveness of HUI3
Three papers reported responsiveness of HUI3 without the
other 2 generic measures, comparing with VAS/TTO and
hearing-specific measures [27, 37, 43]. Cheng et al. found
that the change of HUI3 overall score (0.39) was higher
than both VAS score (0.27) and TTO (0.22) after cochlear
implant fitting, but all were statistically significant
(p \ 0.1). Only the change scores of hearing and speech
dimension of HUI3 were significant and the hearing
dimension had the biggest change score while scores of
other dimensions were stable over time. Moderate corre-
lations (around 0.48) between change scores of VAS, TTO
and HUI3 were found [43].
Discussion and conclusions
The 18 papers (14 studies) included in this review provide
useful information to assess the validity and responsiveness
of GPBMs for use in hearing impairment. A summary of
the overall performance of the 3 GPBMs is provided in
Table 5. There was heterogeneity in the studies reviewed,
in terms of study design, patient populations, which needs
to be taken into account when interpreting the findings.
Overall, the HUI3 was the most commonly used mea-
sure in the studies. In all 6 cases, the HUI3 detected dif-
ference between groups defined by their severity of hearing
impairment and 4 out of 5 cases detected statistically sig-
nificant changes as a result of intervention. Differences
picked up by the HUI3 were driven by the hearing
dimensions, and also, in some cases, the speech dimension
and the emotion dimension. On the other hand, the findings
of the review suggested relatively poor responsiveness of
EQ-5D in this condition as in 4 out of 5 cases EQ-5D failed
to detected change. The only study that allowed an
assessment of known groups using the EQ-5D suggested it
only had weak ability to discriminate difference between
severity groups. Only one study involved the SF-6D, thus
the information is too limited to conclude on its perfor-
mance. Converting published mean SF-36 scores into SF-
6D would not help since psychometric testing requires
individual level data.
Two studies reported validity of EQ-5D where the results
were mixed when the groups were defined by severity of
hearing impairment [40]. In terms of responsiveness, EQ-
5D did not demonstrate statistically significant changes
after hearing aid fitting but there were statistically signifi-
cant changes detected by clinical indicators or condition-
specific measures. The EQ-5D appears to reflect less, or
often no, change/difference compared to the HUI3 and
clinical measures. Possible reasons for this include the EQ-
5D not capturing important effects of hearing on quality of
life, or that the changes/differences in hearing have little
impact on overall quality of life (e.g. because the level of
change is small or people have adapted to their hearing loss
and value other aspects of health more). Also, the use of
clinical measures or else for grouping hearing impairment
severity may be regarded as poor indicators to use for
testing construct validity. However, given that significant
differences were found for HUI3 and hearing-specific
health-related quality of life measures, it suggests that the
lack of significant differences for EQ-5D is a concern.
There were 2 exceptions to the poor performance of EQ-
5D: one study demonstrated a statistically significant
improvement in EQ-5D index scores after cochlear
implantation and in another study, the EQ-5D differentiated
between severe hearing loss but not in different levels of
milder hearing loss. Although EQ-5D utility indices
remained stable over time, 1 study showed that the propor-
tion of respondents who reported problems for dimensions of
EQ-5D increased or decreased. Another study treated
responses of EQ-5D dimension as continuous variables to
compare mean responses before and after intervention,
which was judged to be problematic for analysis. There were
2 studies where the HUI3 reflected differences, but much
smaller differences were found in the EQ-5D utilities.
It is perhaps unsurprising that HUI3 performs well as it
explicitly includes a hearing dimension. The lack of a
direct reference to an impairment or symptom in EQ-5D
does not mean that, by definition, its effects will not be
captured; however, this review suggests that EQ-5D may
perform poorly in this particular type of condition. A five-
level version of the EQ-5D has recently been developed
and this may overcome the problem if it is simply one of
the sensitivity. However, it may be related to a lack of
relevant dimensions to pick up the impact of hearing loss.
Evidence is required using the 5-level version to confirm
Qual Life Res
123
this hypothesis. Another approach to the problem might be
to use a condition-specific preference-based measure for
hearing like the one developed by Yang et al. for asthma
[44] or Rowen et al. in cancer [45]. The problem with using
condition-specific measures is that they may miss impor-
tant side effects of treatment and the values may exag-
gerate the impact of the conditions due to focusing effects
by member of the general public [46]. This is the reason for
ongoing research into developing bolt-ons to the EQ-5D to
cover those dimensions that appear to be missing for
cognition in EQ-5D [47], and in the same way, one could
be developed for hearing. In the meantime, the best option
appears to be to use HUI3.
It cannot always be assumed that a generic measure
should reflect the change of health states which a condi-
tion-specific measure detects. Disease- or condition-spe-
cific measures are tailored to the condition of interest and
are therefore more focussed on the condition of interest and
may be more sensitive to change. However, they may not
capture the broader impacts of the condition on health-
related quality of life. In addition, the general population
(or indeed the patients) may not regard the change as
sufficiently important when valuing health. Interestingly, in
this study, not only GPBMs, but also the hearing-specific
measures showed poor correlations with clinical indicators.
This emphasises the importance of including patient-
reported outcome measures in the evaluations of health
care interventions. In addition, preference-based measures
can reflect how changes in health states are valued, in
relation to other aspects of health.
This is the first-time information on the validity and
responsiveness of GPBMs that have been comprehen-
sively reported and analysed in hearing impairment. This
paper reports important findings for the use of GPBMs of
health to compare the impact of hearing loss on health-
related utility. The results indicate that HUI3 is an
appropriate measure for use in hearing impairment given
its good performance of validity and responsiveness. EQ-
5D was not responsive to modest changes in hearing
impairment, and the limited evidence suggested it has
weak validity in this condition. Very little evidence was
found for SF-6D.
Acknowledgments This review has been conducted as part of the
NICEQoL project, which is funded by the Medical Research Council
as part of the MRC-NIHR Methodology Research Programme (ref:
G0901486). The authors would like to thank Pippa Evans for
undertaking the literature search. The authors would also like to thank
Aki Tsuchiya and Donna Rowen from the NICEQoL project team for
their comments on preliminary findings of this review.
Open Access This article is distributed under the terms of the
Creative Commons Attribution License which permits any use, dis-
tribution, and reproduction in any medium, provided the original
author(s) and the source are credited.
Appendix 1: Search strategy used for the hearing
review in Medline
1. (euroqol or euro qol or eq5d or eq 5d or eq-5d or (euro
adj qol) Or eur adj qual) or (eq adj 5d)).mp
2. (hui3 or hui 3 or health utilities index mark 3 or health
utilities mark three or hui III or huiIII).mp
3. (sf6D or sf 6D or short form 6D or shortform 6D or sf
six D or sfsixD or shortform six D or short form sixD
or sf-6d or 6d or 6-d or 6 dimension).mp
4. (hearing disorder or dysacusis or paracousis or para-
cusis or Distorted hearing).mp
5. (hearing loss or hearing complaints or hearing aids or
cochlear implants).mp. [mp = title, original title,
abstract, name of substance word, subject heading
word, unique identifier]
6. hearing disorders/
7. 1 or 2 or 3
8. 4 or 5 or 6
9. 7 and 8
References
1. National Institute of Health and Clinical Excellence (NICE) (2008).
NICE Guide to the Methods of Technology Appraisal. NICE, London .
2. Canadian Coordinating Office for Health Technology Assessment
(CCOHTA) (2003). Canada. Canada Common Drug ReviewSubmission Guidelines for Manufacturers.
3. Scotish Medicine Consortium (SMC) (2007). Scotlant. Guidanceto Manufacturers for Completion of New Product AssessmentForm (NPAF). .
4. Torrance, G. W. (1986). Measurement of health state utilities for
economic appraisal. Journal of Health Economics, 5(1), 1.
5. Brooks, R. (1996). EuroQol: The current state of play. HealthPolicy, 37(1), 53–72.
6. Dolan, P. (1997). Modeling valuations for EuroQol health states.
Medical Care, 35(11), 1095–1108.
7. Brazier, J., Roberts, J., & Deverill, M. (2002). The estimation of a
preference-based measure of health from the SF-36. Journal ofHealth Economics, 21(2), 271–292.
8. Feeny, D., Furlong, W., Torrance, G. W., Goldsmith, C. H., Zhu,
Z., DePauw, S., et al. (2002). Multiattribute and single-attribute
utility functions for the health utilities index mark 3 system.
Medical Care, 40(2), 113–128.
9. Herdman, M., Gudex, C., Lloyd, A., Janssen, M. F., Kind, P.,
Parkin, D. et al. (2011). Development and preliminary testing of
the new five-level version of EQ-5D (EQ-5D-5L). Quality of LifeResearch, 20(10), 1727–1736.
10. Hawthorne, G., Richardson, J., & Day, N. A. (2001). A comparison
of the assessment of quality of life (AQoL) with four other generic
utility instruments. Annals of Medicine, 33(5), 358–370.
11. Longworth, L., & Bryan, S. (2003). An empirical comparison of
EQ-5D and SF-6D in liver transplant patients. Health Economics,12(12), 1061–1067.
12. Brazier, J. E., Tsuchiya, A., Roberts, J., & Busschbach, J. (2004).
A comparison of the EQ-5D and the SF-6D across seven patient
groups. Health Economics, 13(9), 873–884.
Qual Life Res
123
13. Feeny, D., Wu, L., & Eng, K. (2004). Comparing short form 6D,
standard gamble, and health utilities index mark 2 and mark 3
utility scores: Results from total hip arthroplasty patients. Qualityof Life Research, 13(10), 1659–1670.
14. Marra, C. A., Woolcott, J. C., Kopec, J. A., Shojania, K., Offer, R.,
Brazier, J. E., et al. (2005). A comparison of generic, indirect utility
measures (the HUI2, HUI3, SF-6D, and the EQ-5D) and disease-
specific instruments (the RAQoL and the HAQ) in rheumatoid
arthritis. Social Science and Medicine, 60(7), 1571–1582.
15. National Institute of Health and clinical Excellence (NICE) (2004).
NICE Guide to the Methods of Technology Appraisal. NICE, London.
16. Brazier, J. E., Rowen, D., Mavranezouli, I., Tsuchiya, A., Young,
T., Yang, Y., et al. (2012). Developing and testing methods for
deriving preference-based measures of health from condition
specific measures (and other patient based measures of outcome).
Health Technology Assessment, 16(32), 1366–5278.
17. Tosh, J., Brazier, J., Evans, P., & Longworth, L. (2012). A review
of generic preference-based measures of health-related quality of
life in visual disorders. Value in Health, 15(1), 118–127.
18. Papaioannou, D., Brazier, J., & Parry, G. (2011). How valid and
responsive are generic health status measures, such as EQ-5D and
SF-36, in Schizophrenia? A Systematic Review. Value Health,14(6), 907–920.
19. Harper, R., Brazier, J. E., Waterhouse, J. C., Walters, S. J., Jones,
N. M., & Howard, P. (1997). Comparison of outcome measures
for patients with chronic obstructive pulmonary disease (COPD)
in an outpatient setting. British Medical Journal, 52(10), 879.
20. Sand, P. K., Staskin, D., Miller, J., Diokno, A., Sant, G. R.,
Davila, G. W., et al. (1999). Effect of a urinary control insert on
quality of life in incontinent women. International Urogynecol-ogy Journal, 10(2), 100–105.
21. Kobelt, G., Kirchberger, I., & MaloneLee, J. (1999). Ouality of life
aspects of the overactive bladder and the effect of treatment with
tolterodine. British journal of urology (Print), 83(6), 583–590.
22. Brazier, J., & Deverill, M. (1999). A checklist for judging pref-
erence based measures of health related quality of life: Learning
from psychometrics. Health Economics, 8(1), 41–51.
23. Dalton, D. S., Cruickshanks, K. J., Klein, B. E. K., Klein, R.,
Wiley, T. L., & Nondahl, D. M. (2003). The impact of hearing loss
on quality of life in older adults. The Gerontologist, 43(5), 661.
24. Barton, G. R., Bankart, J., & Davis, A. C. (2005). A comparison
of the quality of life of hearing-impaired people as estimated by
three different utility measures. International Journal of Audiol-ogy, 44(3), 157–163.
25. Pickard, A. S., Wilke, C. T., Lin, H. W., & Lloyd, A. (2007).
Health utilities using the EQ-5D in studies of cancer. Pharma-coeconomics, 25(5), 365–384.
26. Streiner, D. L., & Norman, G. R. (2008). Health measurementscales: A practical guide to their development and use. USA:
Oxford University Press.
27. Lovett, R. E. S., Kitterick, P. T., Hewitt, C. E., & Summerfield,
A. Q. (2010). Bilateral or unilateral cochlear implantation for
deaf children: an observational study. Archives of Disease inChildhood, 95(2), 107–112.
28. Smith-Olinde, L., Grosse, S. D., Olinde, F., Martin, P. F., &
Tilford, J. M. (2008). Health state preference scores for children
with permanent childhood hearing loss: A comparative analysis
of the QWB and HUI3. Quality of Life Research, 17(6), 943–953.
29. Bichey, B. G., Hoversland, J. M., Wynne, M. K., & Miyamoto, R.
T. (2002). Changes in quality of life and the cost-utility associated
with cochlear implantation in patients with large vestibular aque-
duct syndrome. Otology and neurotology : official publication ofthe American Otological Society, American Neurotology Society[and] European Academy of Otology and Neurotology, 7(3), 323.
30. Grutters, J. P. C., Joore, M. A., van der Horst, F., Verschuure, H.,
Dreschler, W. A., & Anteunis, L. J. C. (2007). Choosing between
measures: Comparison of EQ-5D, HUI2 and HUI3 in persons with
hearing complaints. Quality of Life Research, 16(8), 1439–1449.
31. Joore, M., Brunenberg, D., Zank, H., van der Stel, H., Anteunis,
L., Boas, G., et al. (2002). Development of a questionnaire to
measure hearing-related health state preferences framed in an
overall health perspective. International Journal of TechnologyAssessment in Health Care, 18(03), 528–539.
32. Joore, M. A., van der Stel, H., Peters, H. J. M., Boas, G. M., &
Anteunis, J. C. (2003). The cost-effectiveness of hearing-aid fit-
ting in the Netherlands. Archives of Otolaryngology-Head andNeck Surgery, 129(3), 297–304.
33. Lee, H. Y., Park, E. C., Joong Kim, H., Choi, J. Y., & Kim, H. N.
(2006). Cost-utility analysis of cochlear implants in Korea using dif-
ferent measures of utility. Acta Oto-Laryngologica, 126(8), 817–823.
34. Joore, M. A. (2002). Response shift in the measurement of quality
of life in hearing impaired adults after hearing aid fitting. Qualityof life research: An international journal of quality of life aspectsof treatment, care and rehabilitation, 11(4), 299–307.
35. Joore, M. A. B. (2003). Societal effects of hearing aid fitting
among the moderately hearing impaired. International Journal ofAudiology, 42(3), 152–160.
36. Vuorialho, A., Karinen, P., & Sorri, M. (2006). Effect of hearing
aids on hearing disability and quality of life in the elderly.
International Journal of Audiology, 45(7), 400–405.
37. Cheng, A. K., Rubin, H. R., Powe, N. R., Mellon, N. K., Francis,
H. W., & Niparko, J. K. (2000). Cost-utility analysis of the
cochlear implant in children. JAMA: The journal of the AmericanMedical Association, 284(7), 850–856.
38. Hol, M. K. S., Spath, M. A., Krabbe, P. F. M., van der Pouw, C.
T. M., Snik, A. F. M., Cremers, C. W. R. J., et al. (2004). The
bone-anchored hearing aid: Quality-of-life assessment. Archivesof Otolaryngology-Head and Neck Surgery, 130(4), 394–399.
39. Vuorialho, A., Karinen, P., & Sorri, M. (2006). Counselling of
hearing aid users is highly cost-effective. European Archives ofOto-Rhino-Laryngology, 263(11), 988–995.
40. Sach, T. H., & Barton, G. R. (2007). Interpreting parental proxy
reports of (health-related) quality of life for children with uni-
lateral cochlear implants. International Journal of PediatricOtorhinolaryngology, 71(3), 435–445.
41. Barton, G. R., Stacey, P. C., Fortnum, H. M., & Summerfield, A.
Q. (2006). Hearing-impaired children in the United Kingdom. IV:
Cost-effectiveness of pediatric cochlear implantation (Structured
abstract). Ear and Hearing, 5, 575–588.
42. Palmer, C. S., Niparko, J. K., Wyatt, J. R., Rothman, M., &
de Lissovoy, G. (1999). A prospective study of the cost-utility of the
multichannel cochlear implant. Archives of OtolaryngologyGCo-Head and Neck Surgery, 125(11), 1221.
43. Damen, G. W. J. A., Beynon, A. J., Krabbe, P. F. M., Mulder, J.
J. S., & Mylanus, E. A. M. (2007). Cochlear implantation and
quality of life in postlingually deaf adults: Long-term follow-up.
Otolaryngology-Head and Neck Surgery, 136(4), 597–604.
44. Yang, Y., Brazier, J. E., Tsuchiya, A., & Young, T. A. (2011).
Estimating a preference-based index for a 5-dimensional health
state classification for asthma derived from the asthma quality of
life questionnaire. Medical Decision Making, 31(2), 281–291.
45. Rowen, D., Brazier, J. E., Young, T. A., Gaugrist, S., Craig, B.
M., King, M. T., & Velikova, G. (2011). Deriving a preference-
based measure for cancer using the EORTC QLQ-C30. Value inHealth, 14(5), 721–731.
46. Brazier, J., & Tsuchiya, A. (2010). Preference-based condition-
specific measures of health: What happens to cross programme
comparability? Health Economics, 19(2), 125–129.
47. Krabbe, P. F. M., Stouthard, M. E. A., Essink-Bot, M. L., &
Bonsel, G. J. (1999). The effect of adding a cognitive dimension
to the EuroQol multiattribute health-status classification system.
Journal of Clinical Epidemiology, 52(4), 293–301.
Qual Life Res
123