Embed Size (px)
DESCRIPTION
Lars Axell and Per Kållberg Research and Development Swedish Meteorological and Hydrological Institute. An atmosphere-ice-ocean reanalysis of the Arctic for the IPY. Outline. Description of the coupled model system Results from the Arctic reanalysis Conclusions so far Outlook. - PowerPoint PPT Presentation
Citation preview

An atmosphere-ice-ocean reanalysis of the Arcticfor the IPY
Lars Axell and Per Kållberg
Research and Development
Swedish Meteorological and Hydrological Institute

Signatur
Outline
•Description of the coupled model system
•Results from the Arctic reanalysis
•Conclusions so far
•Outlook
Signatur
Description of the coupled model system
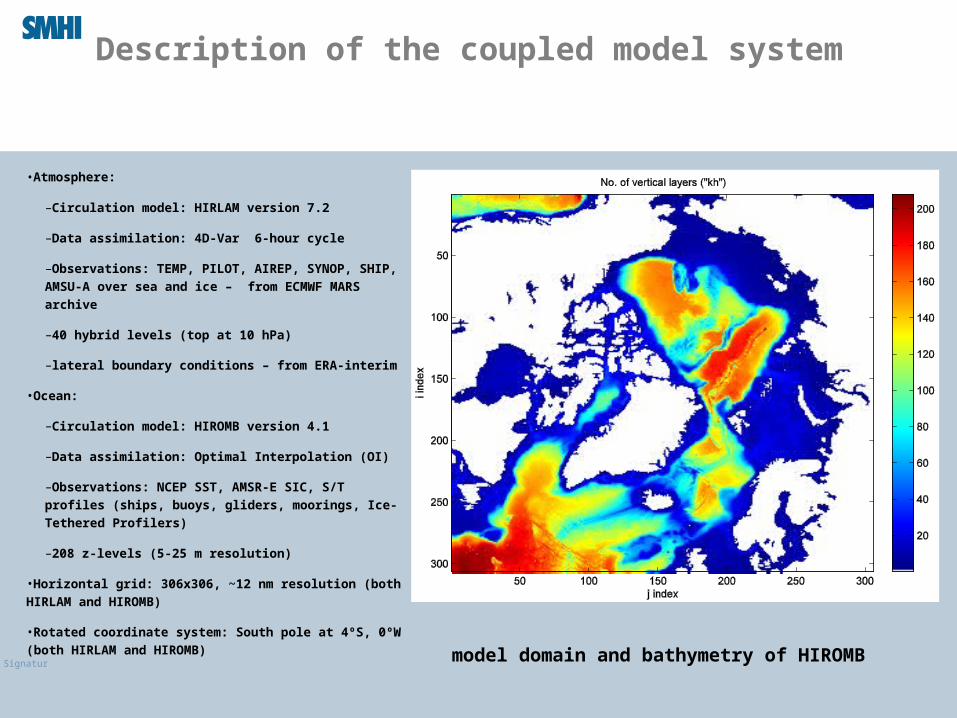
•Atmosphere:
–Circulation model: HIRLAM version 7.2
–Data assimilation: 4D-Var 6-hour cycle
–Observations: TEMP, PILOT, AIREP, SYNOP, SHIP,
AMSU-A over sea and ice – from ECMWF MARS archive
–40 hybrid levels (top at 10 hPa)
–lateral boundary conditions – from ERA-interim
•Ocean:
–Circulation model: HIROMB version 4.1
–Data assimilation: Optimal Interpolation (OI)
–Observations: NCEP SST, AMSR-E SIC, S/T profiles
(ships, buoys, gliders, moorings, Ice-Tethered Profilers)
–208 z-levels (5-25 m resolution)
•Horizontal grid: 306x306, ~12 nm resolution (both HIRLAM
and HIROMB)
•Rotated coordinate system: South pole at 4ºS, 0ºW (both
HIRLAM and HIROMB)model domain and bathymetry of HIROMB

Hiromb OI coast following structure functions
Signatur
Description of the coupled model system(cont.)
•Exactly the same horizontal grid as HIRLAM (no separate coupler)
•Bathymetry data:
– International Bathymetric Chart of the Arctic Ocean (IBCAO)
– Regional data from the Baltic Sea
– Scripps Institution of Oceanography, UCSD (satellite altimetry and depth soundings)
•47 rivers (annual means)
•Open boundaries:
– Salinity and temperature from World Ocean Atlas 2005, monthly means
– Sea levels: inverse barometer effect
Signatur
The coupling
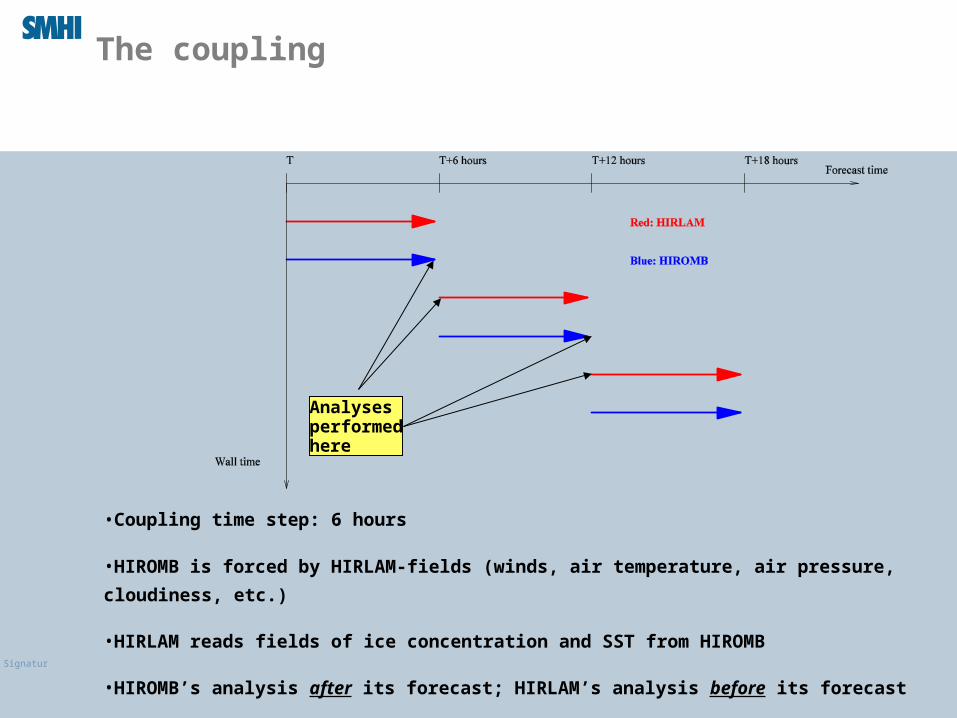
•Coupling time step: 6 hours
•HIROMB is forced by HIRLAM-fields (winds, air temperature, air pressure, cloudiness, etc.)
•HIRLAM reads fields of ice concentration and SST from HIROMB
•HIROMB’s analysis after its forecast; HIRLAM’s analysis before its forecast
Analysesperformedhere

Signatur
Number of ocean observations (2005-2007) (note the logarithmic scale)
temperature salinity
Signatur
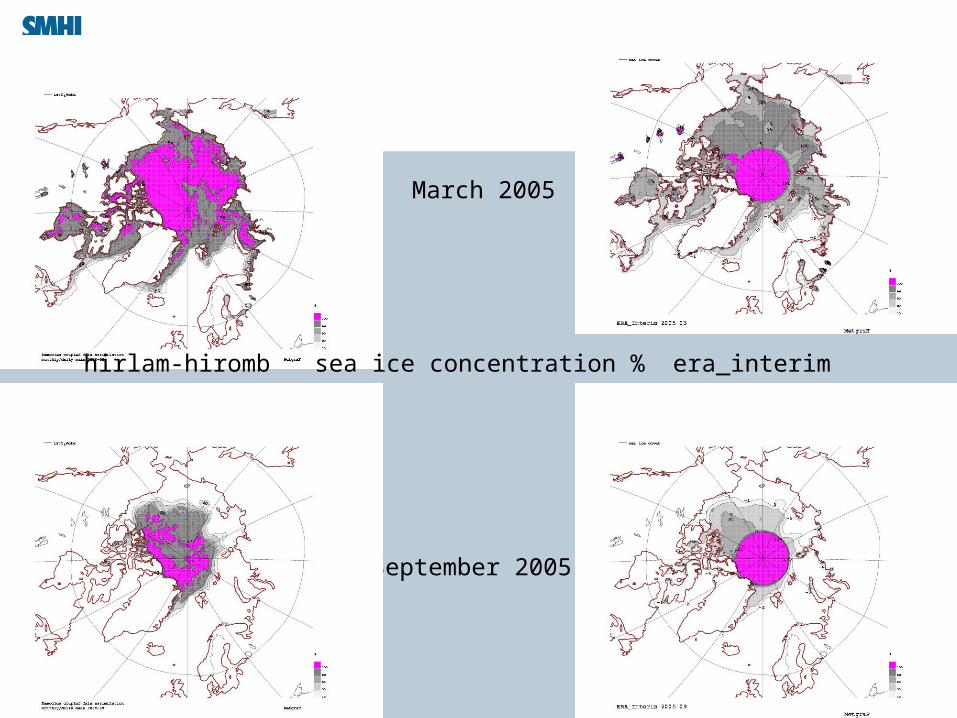
March 2005
September 2005
hirlam-hiromb sea ice concentration % era_interim

Signatur
March 2005
September 2005
surface salinity surface temperature
Monthly mean fields

Signatur
monthly mean ocean-air net energy exchange, march 2006
hirlam/hiromb era interim
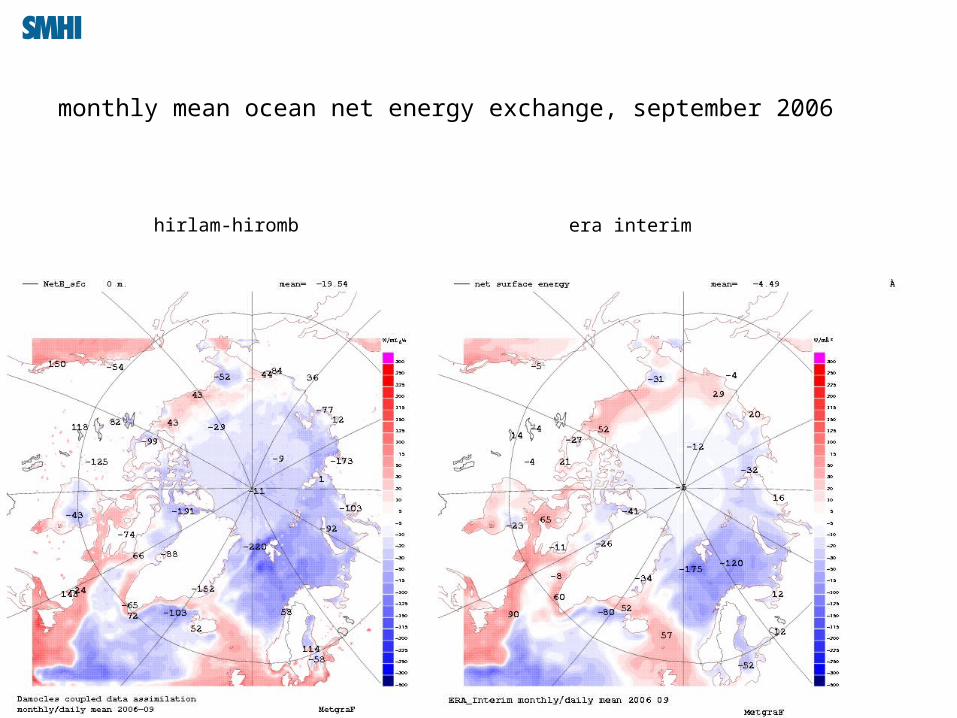
red=downwards, blue=upwards
Signatur
monthly mean ocean net energy exchange, september 2006
hirlam-hiromb era interim

Signatur
hiromb ice-driftmarch 2006
hirlam 10-metre windmarch 2006
Signatur
hiromb ice-driftMarch 2006
hirlam 10-metre windMarch 2006
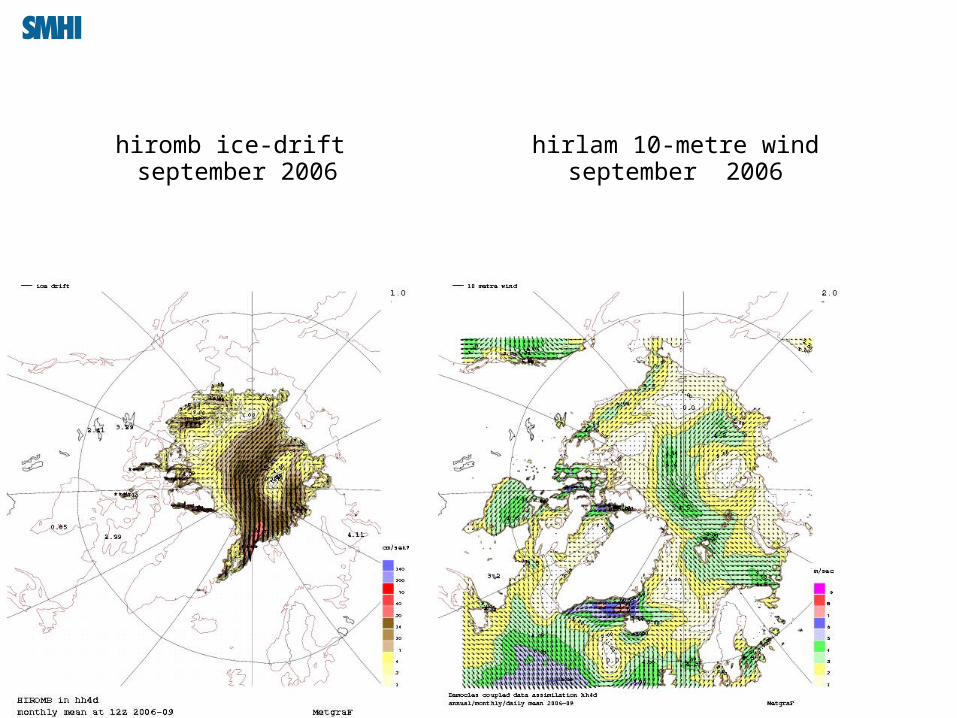
hiromb ice-drift september 2006
hirlam 10-metre windseptember 2006

Signatur
hirlam wind-stressmarch 2006
hirlam wind-stressseptember 2006

Signatur
Arctic Sea Ice Extent(reanalysis updated until 200610)
Ice extent = sum of area with at least 15 % sea ice

Signatur
Transect across Fram StraitDate: 2005-09-15 (Greenland left)
Temperature (°C)
Velocity (cm/s)
Salinity (psu)
•Northward transport of high-saline, warm water west of Svalbard•Southward transport of low-saline, cold water off Greenland’s shelf•Data assimilation of mooring data (S/T)•Net southward volume transport: 1 Sverdrup (mean 2005)•Net northward heat transport: 10 TW (mean 2005)
Signatur
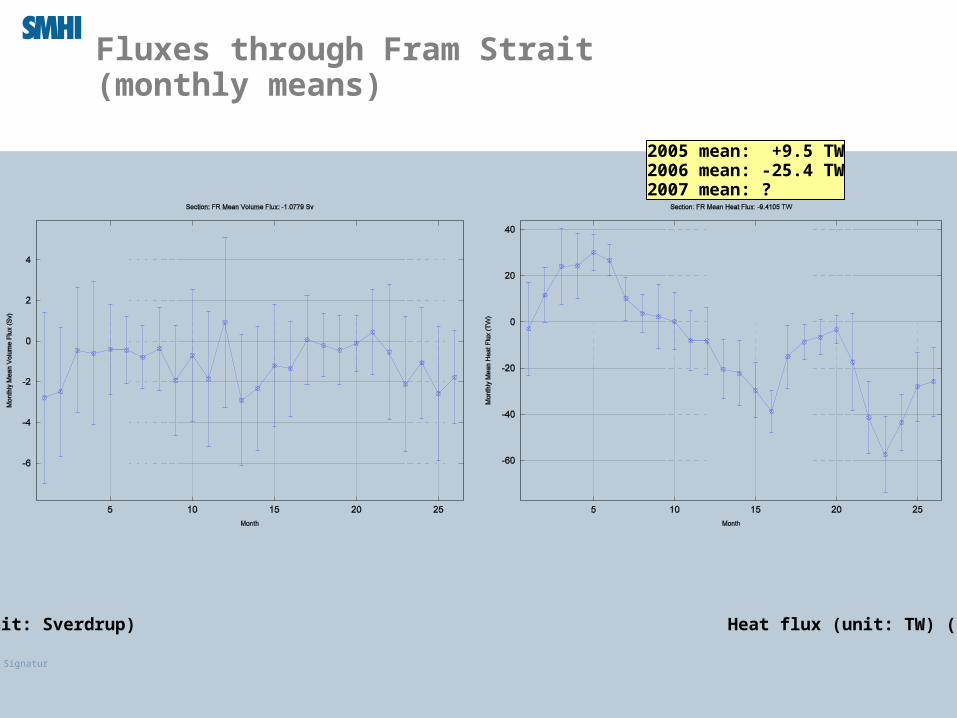
Fluxes through Fram Strait(monthly means)
Volume flux (unit: Sverdrup) Heat flux (unit: TW) (0 deg reference)
2005 mean: +9.5 TW2006 mean: -25.4 TW2007 mean: ?
Signatur
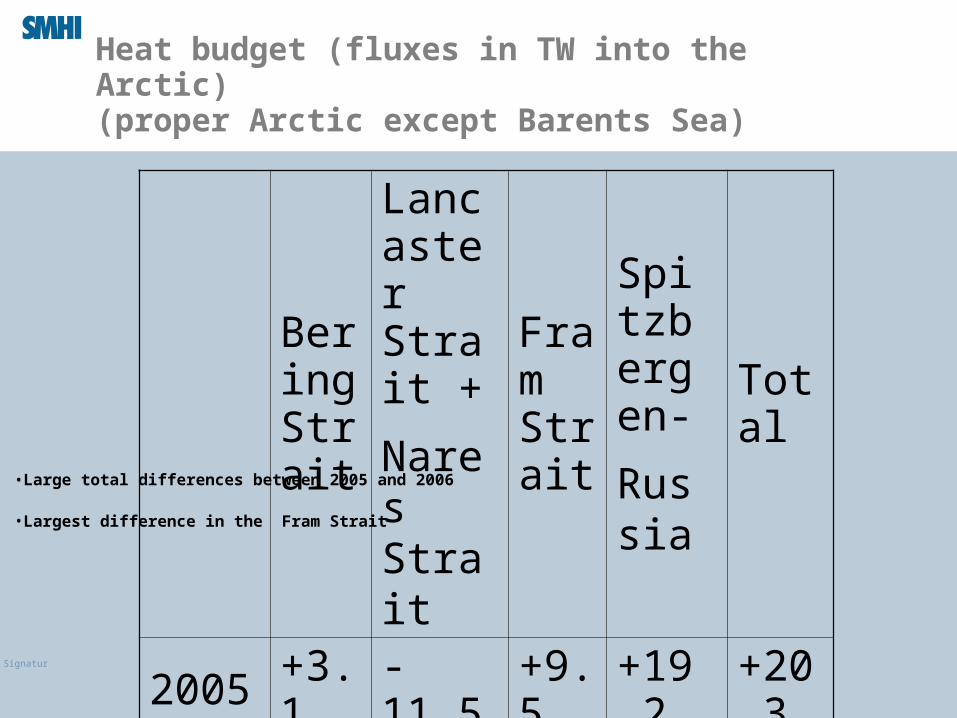
Heat budget (fluxes in TW into the Arctic)(proper Arctic except Barents Sea)
•Large total differences between 2005 and 2006
•Largest difference in the Fram Strait
Bering Strait
Lancaster Strait +
Nares Strait
Fram Strait
Spitzbergen-
Russia
Total
2005 +3.1 -11.5 +9.5 +19.2+20.3
2006
preliminary
+1.2 -10.9-25.4
+22.1-13.0

Signatur
Changes in total ice volume(proper Arctic except Barents Sea)
2005-04-16 12:00 UTC
2005-09-18 00:00 UTC
Change:5622 km3
2006-04-24 12:00 UTC
2006-09-29 06:00 UTC
Change:8600 km3
Ice decrease 2005: 5 622 km3Ice export 2005: 482 km3 (9%)
Ice decrease 2006: 8600 km3Ice export 2006: 377 km3 (4%)
-------------------------------------------------------------------------------------------BE DA FR BS Tot
-------------------------------------------------------------------------------------------2005 73 102 273 34 4822006 56 82 241 -2 377-------------------------------------------------------------------------------------------
Signatur
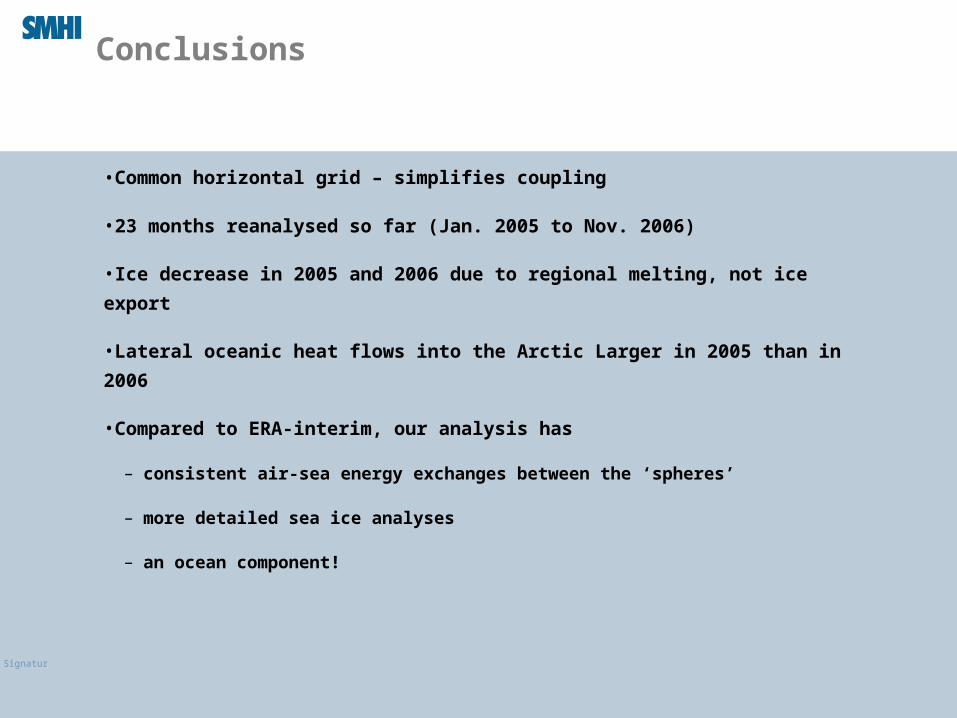
Conclusions
•Common horizontal grid – simplifies coupling
•23 months reanalysed so far (Jan. 2005 to Nov. 2006)
•Ice decrease in 2005 and 2006 due to regional melting, not ice export
•Lateral oceanic heat flows into the Arctic Larger in 2005 than in 2006
•Compared to ERA-interim, our analysis has
– consistent air-sea energy exchanges between the ‘spheres’
– more detailed sea ice analyses
– an ocean component!

Signatur
Outlook
•Complete three years, 2005-2007
•Replace HIROMB bulk formulae with HIRLAM fluxes
•Re-calculate lateral oceanic budgets (volume, heat, freshwater)
•Write a report and a paper
END