Embed Size (px)
Citation preview

1 C-ANPROM/UK/PIP/0001 January 2021
An Attribution of Value Framework for
Combination Therapies
Report by the Value Attribution Working Group
January 2021

2 C-ANPROM/UK/PIP/0001 January 2021
Authors
Andrew H. Briggs1,2, Alexis Doyle2, John Schneider2, Helen Taylor3, Emma Roffe3,
Eric Low4, Sarah Davis5, Martin Kaiser6,7, Anthony Hatswell8, Neil Rabin9, Tanja
Podkonjak3
1London School of Hygiene & Tropical Medicine, London, UK
2Avalon Health Economics, Morristown, NJ, USA
3Takeda UK Ltd, London, UK
4Eric Low Consulting, Edinburgh, UK
5University of Sheffield, Sheffield, UK
6Royal Marsden NHS Foundation Trust, London, UK
7The Institute of Cancer Research, London, UK
8Delta Hat, Nottingham, UK
9University College Hospital, London, UK
For any queries regarding this Whitepaper please contact: [email protected]
Acknowledgements
Development of this Whitepaper was funded by Takeda UK Ltd
The authors are grateful for oversight and comments during the development of this Whitepaper from
the following individuals:
Carla Deakina, Francois Maignena, Nina Pinwillb, Tamir Singerb
aNational Institute of Health and Care Excellence (NICE), UK
bNHS England, UK

3 C-ANPROM/UK/PIP/0001 January 2021
Table of Contents
1. Executive Summary ............................................................................................................... 4
2. Introduction ............................................................................................................................ 6
3. Background ............................................................................................................................. 8
3.1. Definition of combination therapies ........................................................................................................... 8
3.2. Economic evaluation of combination therapies ....................................................................................... 8
3.3. The value attribution problem ................................................................................................................... 10
Imperfect information ......................................................................................................................... 11
Imbalance of market power ............................................................................................................... 11
4. Attribution of Value Framework........................................................................................ 13
4.1. Standard rules of cost-effectiveness analysis........................................................................................... 13
4.2. Some notation ................................................................................................................................................ 14
Incremental benefits and value .......................................................................................................... 14
Sub-additive versus synergistic benefits .......................................................................................... 15
4.3. The framework .............................................................................................................................................. 16
Perfect information and balance of market power ...................................................................... 16
Perfect information and imbalance of market power .................................................................. 17
Imperfect information and balance of market power .................................................................. 19
Imperfect information and imbalance of market power ............................................................. 20
Summary of solutions .......................................................................................................................... 22
5. Case Studies ......................................................................................................................... 23
5.1. Perfect information and balanced market power: nivolumab with ipilimumab .............................. 24
5.2. Perfect information and imbalanced market power: pembrolizumab with pemetrexed and
platinum chemotherapy ............................................................................................................................................. 30
5.3. Imperfect information and balanced market power: pertuzumab with trastuzumab and
docetaxel ....................................................................................................................................................................... 36
5.4. Imperfect information and imbalanced market power: carfilzomib with lenalidomide and
dexamethasone ............................................................................................................................................................ 41
6. Discussion ............................................................................................................................. 47
7. References ............................................................................................................................ 49

4 C-ANPROM/UK/PIP/0001 January 2021
1. Executive Summary
In 2014, the Decision Support Unit (DSU) for the UK National Institute of Health and Care Excellence
(NICE) published a working paper that outlined the circumstances in which health technologies that are
demonstrated to be effective, may nevertheless be deemed not cost-effective even at a zero price [1].
In particular, the report highlighted that in certain situations it is possible for a treatment combination
consisting of a backbone treatment and a novel add-on therapy to fail to be cost-effective even if the
price of the add-on treatment equals zero. This can lead to the add-on therapy within a combination
not having a recommendation at the end of a lengthy appraisal and negotiation process, or
manufacturers taking the decision to not enter the appraisal process at all despite evidence of clinical
efficacy.
The crux of the issue stems from combination treatments being evaluated as single technologies but
composed of component treatments that are each priced independently. The initial entrant to the
market, commonly referred to as the “backbone treatment”, has the entire willingness-to-pay (WTP)
threshold to work with and once assessed and recommended is unlikely to be reassessed. Since the
overall cost of the treatment combination includes both components, the add-on component of a
combination therapy, by contrast, has a much-reduced opportunity to demonstrate value. Furthermore,
if the component treatments are manufactured by different companies, they cannot discuss and re-align
prices since this is prohibited by anti-trust law. Therefore, manufacturers of the add-on therapy only
have control over the price of their own products and not the overall cost of the treatment
combination. Since the publication of the DSU report in 2014 the issue surrounding how to assess
combination treatments has been discussed and debated, but with few tangible and workable solutions
documented.
In November 2019, the Bellberry Group convened a three-day international workshop, inviting experts
representing all relevant stakeholders from around the world to discuss the challenges associated with
valuing and paying for treatment combinations in oncology. In their discussions, which included input
from HTA representatives, academia, industry and wider stakeholders, there was support for flexible
payment systems and pricing, including potential re-assessment of the backbone therapy by Health
Technology Assessment (HTA) agencies and re-visitation of the prices of component treatments.
Addressing the question of how the price reduction should be shared requires an accepted method for
determining how much of the value of a combination treatment should be attributed to each of its
component treatments. The participants at the Bellberry workshop highlighted a need for dedicated
research on methods of value attribution [2].
Taken together, it is clear that all stakeholders: government, HTA bodies, payers, and manufacturers,
agree that a fair, implementable and transactable solution needs to be found. Takeda UK Ltd has been
looking into this issue for several years; they held a parliamentary roundtable in 2016 and has had
ongoing discussions with stakeholders on a number of topics raised. In 2019, Takeda established an
Advisory Panel that was tasked with designing transactable and implementable solutions to the problem

5 C-ANPROM/UK/PIP/0001 January 2021
of assessing combination treatments. The group was made up of experts from HTA, National Health
Service England (NHSE) commercial and commissioning, clinical practice, pricing & competition, health
economics and patient organisations. These advisors split proposed solutions into two distinct
interlinking activities:
1. An Attribution of Value Framework to assign a specific value to each combination treatment
2. A Conceptual Framework and Standard Operating Procedure for an arbitration process which
considers competition law
In this Whitepaper, the results of the first workstream for attributing value to the components of a
combination treatment are reported. An accompanying Whitepaper addressing the second workstream
on voluntary arbitration will be published shortly.
The proposed value attribution methodology is explored through four scenarios which are characterised
by key features of the problem: perfect/imperfect information about the monotherapy effect of
component treatments and balanced/unbalanced market power between their manufacturers. The
proposed solutions are grounded in the standard rules of cost-effectiveness and designed to make use of
the same information that NICE uses to undertake its appraisals of technologies. One advantage of the
proposed framework is that it is independent of price and focuses on the (value of) Quality Adjusted
Life Year (QALY), the standard metric by which NICE, and many other HTA agencies, compare the
health benefits of different treatments. In addition, case studies are employed to demonstrate how
implementable the proposed solutions could be based on publicly available information for some
treatment combinations which have previously been appraised by NICE.
The Attribution of Value Framework described is meant to serve as a preliminary structure to facilitate
discussion and debate among stakeholders. The proposed framework is grounded in careful review of
the challenges to valuing and pricing combination treatments and has been developed over time with
input from the Advisory Panel. This work aims to advance the objective of researching and developing
methods of value attribution that was set forth at the Bellberry workshop [2] and supports efforts to
ensure that patients have access to clinically important treatments as rapidly as possible.
6 C-ANPROM/UK/PIP/0001 January 2021
2. Introduction
The use of combination therapies has been increasing over time with greater scientific understanding of
the complex pathophysiology of disease progression. As combination therapies can target multiple
pathways and levels of a disease simultaneously, they often exhibit greater clinical efficacy than single-
agent therapies [3,4]. This has been evident in the treatment of HIV infection, for example, where
standard use of antiretroviral combination therapies has reduced rates of disease transmission and
increased patient life expectancy [5, 6]. Combination therapies have also emerged as mainstay
treatments in the field of oncology. Treatment with multiple agents often generates a higher therapeutic
response and better outcomes for cancer patients [7]. Yet despite their known clinical benefits, value
assessment of novel combination therapies using conventional methods has proved challenging. This can
cause combination therapies to receive a ‘not recommended’ decision and may discourage
manufacturers from making HTA submissions of combination therapies. As a result, patients could be
unable to access innovative therapies which could bring substantial clinical benefits.
While combination therapies in many disease areas share features that make it more difficult to
demonstrate economic value under existing valuation frameworks, it has been especially challenging for
combination therapies in oncology. Thus, although much of the discussion that follows will be relevant
to combination therapies in many fields, this paper focuses on the value assessment of combination
therapies in oncology.
A key challenge to value assessment is that a treatment combination is evaluated as a single technology,
but the component therapies are priced independently. The situation is made more difficult when the
component therapies that form a combination are patented and produced by different manufacturers.
Manufacturers have control over the price of their own product(s) but not over the overall price of the
combination. The economic evaluation challenge of combination medicines was discussed in a report by
the NICE Decision Support Unit (DSU) which highlighted how combination medicines can fail to be
cost-effective even if the novel add-on therapy is provided at zero cost [1]. Within the field of oncology,
this scenario often arises where a clinically effective combination therapy is administered until disease
progression, so if the combination improves progression-free survival it will lengthen the duration of
both the backbone and add-on treatment. Even if the cost of the add-on therapy equals zero, the total
cost of treatment will increase because patients will be treated with the existing backbone therapy for
longer. We describe these challenges in more detail in the sections that follow together with proposed
solutions to the problem that the DSU has highlighted.
A group of international stakeholders and experts in health technology assessment outlined key
challenges and potential solutions to valuing and paying for combination therapies in oncology at an
international workshop hosted by Bellberry in 2019 [2]. Stakeholders included HTA agency staff,
clinicians, academics, patient representatives, and pharmaceutical industry personnel. The ideas that
emerged from this workshop thus reflect a diverse set of perspectives. There was unanimous
recognition of the issue that combination medicines present to health technology appraisals and the

7 C-ANPROM/UK/PIP/0001 January 2021
need to find a solution. In addition, there was broad support for flexible payment systems and pricing,
which were believed to be the most implementable solutions in the near term. The proposed solutions
included potential re-assessment of the backbone therapy by HTA agencies and payers and re-visitation
of the prices of component therapies by their respective manufacturers. Participants emphasised that
implementation of such solutions requires an accepted method for attributing the value of a combination
to its component therapies. They asserted that there was a need for dedicated research on methods of
value attribution, and that such research should involve a wide variety of stakeholders.
Despite the wide recognition of the issue and the need for a solution, to date, no solution has been
proposed to address the valuation of component therapies of a combination for a number of reasons. It
is difficult to demarcate the marginal contributions of individual component therapies even when their
monotherapy effects are known since the outcomes generated by the combination are the product of
unobservable and potentially synergistic pharmacological processes and drug interactivity [3, 8].
Furthermore, when component therapies are developed specifically to be used in combination with
existing therapies, such therapies may not have been clinically evaluated independently outside of early
phase safety and dose escalation trials. This poses an additional challenge to value attribution since the
monotherapy effect of component therapies will be uncertain as well [9].
In this paper, we propose an Attribution of Value Framework for combination therapies. The
framework provides a structured method for determining how to attribute the benefit of a combination
therapy to each of its component therapies. The proposed framework is grounded in careful review of
the challenges of valuing and pricing combination therapies and has been developed over time with input
from the Advisory Panel consisting of a broad spectrum of stakeholders, including HTA staff, clinicians,
academics, and pharmaceutical company personnel. This work thus advances the objective of
researching and developing methods of value attribution that was set forth at the Bellberry workshop by
presenting a possible solution. The goal of the paper is to facilitate discussion among stakeholders—such
as HTA agencies, manufacturers, and payers—who must work together to ensure that these therapies
are available and accessible to the patients who benefit from their use.
In the next section we present the background to the problem. Section 4 then lays out the framework
we propose for the basis of negotiations between stakeholders and Section 5 presents a series of case
studies. A final section offers a discussion of the issues.

8 C-ANPROM/UK/PIP/0001 January 2021
3. Background
3.1. Definition of combination therapies
A combination therapy combines two or more individual component therapies to treat a single disease.
Many combination therapies are comprised of a “backbone” therapy and one or more “add-on”
therapies. A backbone therapy is a drug or drug combination that is already approved for use and whose
market share and use in clinical practice is well-established prior to it being used in combination with
another therapy. These backbone therapies are often the existing standard of care for a given disease.
An add-on therapy is a drug or set of drugs that is added to an existing backbone therapy. This therapy
may have been developed and introduced into the market as an independent therapy, or it may have
been developed specifically to work in combination with the backbone therapy. In the latter case, the
clinical development program and registrational trials would likely have been conducted with the
combination regimen only. We note that a combination therapy that includes an add-on therapy can
become a backbone therapy as the standard of care changes over time.
Combination therapies may exhibit greater clinical efficacy than single-agent therapies when their
component therapies have complementary or synergistic pharmacodynamic effects. Component
therapies often generate better health outcomes when used in combination because they target different
receptors and pathophysiological pathways of a disease. For example, pertuzumab and trastuzumab,
both immunotherapy agents, each bind to different human epidermal growth factor receptor 2 (HER2)
epitopes. Their combined use thus provides dual blockade of HER2 signalling pathways, which showed
interim improved survival for patients [10]. Similarly, combination therapies may generate better health
outcomes because the activity of one component therapy potentiates the activity of another. In another
example, research suggests that pembrolizumab (another immunotherapy agent) may potentiate the
effect of pemetrexed-platinum (a doublet chemotherapy) and thereby enhance anti-tumour activity
when they are used in combination to treat programmed death-ligand 1 (PD-L1) positive advanced or
metastatic non-small cell lung cancer (NSCLC) without epidermal growth factor receptor (EGFR) or
anaplastic lymphoma kinase (ALK) tumour mutations [11].
3.2. Economic evaluation of combination therapies
Novel therapies and technologies are subject to rigorous economic assessment to optimise the
allocation of finite healthcare budgets. One method that is commonly used to assess the economic value
of new therapies is cost-effectiveness analysis (CEA). This approach assesses value based on how
changes in healthcare costs correlate to changes in health outcomes. The quality-adjusted life year
(QALY) is the standard outcome measure that is used in CEA. Use of the QALY makes it possible to
compare healthcare interventions based on a common measure of value across different therapy areas.
Currently, HTA agencies evaluate combination therapies as single technologies using the same methods

9 C-ANPROM/UK/PIP/0001 January 2021
used to evaluate monotherapies. Yet there are systemic factors that make it difficult for combination
therapies to achieve cost-effectiveness when applying conventional CEA methods.
A feature of combination drugs that influences the results of CEAs is that component therapies are
often patented therapies with a higher price. Adding a costly novel drug to an already expensive drug or
drug combination increases drug acquisition costs significantly. Since all therapies are evaluated at the
same willingness-to-pay (WTP) threshold, the combined costs of two or more patented therapies will
often exceed the WTP for a given health benefit. In a scenario where a novel add-on therapy is
combined with an existing backbone therapy, the manufacturer of the add-on therapy will only have
control over the price of its own product and not the overall combination. The existing backbone
therapy will already have gone through the appraisal process and have a set price. Furthermore, the
price of the existing backbone therapy may already be set close to the WTP for its associated health
benefits. This leaves little room for the additional cost of the add-on therapy and may prohibit
innovation.
The report by the NICE Decision Support Unit (DSU) demonstrated that it is possible for a
combination therapy consisting of an existing backbone therapy and a novel add-on to fail to be cost-
effective even if the add-on therapy is provided for free [1, 12]. In oncology, patients are commonly
treated until disease progression occurs. Thus, if a novel combination therapy consisting of two or more
patented drugs delays disease progression, patients are treated with both costly drugs for a longer
duration of time [1, 12]. This is the most common reason why novel cancer combination therapies fail
to achieve cost-effectiveness, as many treatments are administered in a treat-to-progression approach.
The DSU showed that, even if the price of the add-on therapy equals zero, the longer duration of
treatment with the backbone drug increases the total cost of treatment with the combination therapy.
The DSU similarly showed that if a combination therapy lengthens the amount of time that patients
spend in a post-progression state, patients receive best supportive care for a longer duration of time and
thereby incur additional costs [1, 12]. As a result of this perverse relationship between gains in survival
and costs, clinically beneficial combination therapies may not be cost-effective even when the novel add-
on therapy is provided for free [1, 12].
The challenges described above are exacerbated when the backbone therapy meets end-of-life criteria at
the time of its appraisal, but the combination therapy does not similarly qualify. This scenario may arise
because life-expectancy prior to the introduction of the backbone therapy was lower than the time
typically considered end-of-life, but the introduction of the backbone therapy into clinical practice has
considerably improved life expectancy, meaning that the population no longer meets the end-of-life
criteria. In these cases, the price of the backbone therapy will be set based on the higher WTP
threshold that is applied to end-of-life treatments. This makes it especially challenging for a combination
therapy to be considered cost-effective at the standard WTP threshold since there is even less room for
the additional cost of the add-on therapy. Thus, there are many distinct issues that arise when assessing
the value of combination therapies.

10 C-ANPROM/UK/PIP/0001 January 2021
These issues with CEA of combination medicines and the lack of appropriate methods to address the
attribution of value may discourage HTA submissions of effective novel combination therapies. As a
result, patients could be unable to access clinically important innovative therapies and there remains an
urgent need as a community to develop solutions.
3.3. The value attribution problem
Combination therapies are clinically important for the treatment of diseases with complex
pathophysiological processes such as cancer. For patients to have access to these beneficial treatments,
combination therapies must be priced commensurately with their value as measured by accepted WTP.
Yet when combination therapies are composed of individual drugs that are priced independently, the
cost of the combination may, for the reasons described in section 4.2.2, exceed its value-based price.
This occurs because: 1) the prices of component therapies that have already been approved will have
been set without consideration of the total cost of the combination, and; 2) WTP for the incremental
benefits generated by the combination is often absorbed by a corresponding increase in the cost of the
backbone therapy as described in the previous section.
The prices of component drugs must therefore be reduced for the combination therapy to be cost-
effective. To address the question of how the cost reduction should be shared, we must determine how
much of the value of the combination therapy should be attributed to each of its component therapies.
A desirable value attribution strategy would attribute value to each component therapy based on its
marginal contribution to the health outcome generated by the combination. However, these marginal
contributions are often difficult to quantify. Practical implementation is further hampered as even the
independent clinical benefits of component therapies are often unknown. Value attribution is also more
difficult when component therapies are produced by different manufacturers since any imbalance in
market power creates potential “winners” and “losers” (either compared to the status quo or indeed to
a perception of what could be achieved). In the case of a combination therapy that is formed by
combining an existing backbone therapy with a novel add-on, the balance of power will often be tilted
towards the manufacturer of the backbone therapy. This occurs in part because combination therapy
and its backbone therapy are appraised independently. Once an existing backbone therapy has been
appraised and approved by an HTA, it is not likely to be re-assessed. The appraisal of the combination
therapy will be fully sponsored by the manufacturer of the add-on therapy. The manufacturer of the
existing backbone therapy thus has a reduced incentive to revisit the price of its own product and
participate in negotiations related to value attribution.
In the sub-sections below, we discuss in more detail these two defining features of the value attribution
problem: 1) imperfect information and 2) imbalance of market power.

11 C-ANPROM/UK/PIP/0001 January 2021
Imperfect information
The health outcome generated by a combination therapy is the product of pharmacodynamic or, more
rarely, pharmacokinetic interactions. Thus, the extent to which component therapies independently
contribute to the observed health outcome is unknown. In some cases, component therapies will have
been studied independently in phase III clinical trials. In these cases, we still will not know the extent to
which each therapy contributes to the outcome generated by the combination therapy. However, we
can use what we know about the health benefits generated by each therapy independently to apportion
the value derived from the combination therapy. In many cases, however, the independent value of
component therapies will not be known. Many therapies are developed specifically to work in tandem
with another therapy and as such may be authorised for use only within the combination.1 With the
possible exception of early-stage clinical studies to establish the pharmacodynamic properties of the
drug and the essential information to support its future therapeutic use (indication, dose and tolerability
for example), add-on therapies are often only studied in combination with the backbone therapy. We
use the term “imperfect information” to define scenarios where the independent benefit of one or more
of the component therapies is unknown for the indication under consideration. Imperfect information
scenarios typically arise when a novel add-on is combined with an existing backbone therapy. In
contrast, we use the term “perfect information” to define scenarios where the independent benefit of
every component benefit is known for the indication for which the combination therapy is being
assessed. Perfect information scenarios typically arise when a combination therapy is composed of two
existing therapies that have already been appraised and approved independently. It is more difficult to
solve the value attribution problem in scenarios where there is imperfect information.
Imbalance of market power
Given that the WTP ceiling is often the same regardless of regimens being monotherapies or
combinations, the price of the backbone therapy may need to be reduced to establish prices for add-on
therapies that are commensurate with their value. As discussed previously, a backbone therapy that has
already been appraised will be priced near the WTP threshold for the health benefit it generates. There
is thus little room for innovation and the additional cost of an add-on therapy if the same WTP
threshold is applied to the cost of the combination.
The degree to which price coordination is possible depends on whether component therapies are
produced by one or several manufacturers. When all the component therapies are produced by a single
manufacturer, the manufacturer has full control over pricing decisions. Furthermore, the manufacturer
has access to relevant information about each of the therapies, such as forecasted sales volumes, which
it can use to optimise pricing. [7].
1 Although this paper focuses on the case where component therapies are pharmaceuticals, this is true of other
types of medical interventions as well. Medical devices and companion diagnostics, for example, are often
developed to guide and monitor treatment with a specific drug therapy.

12 C-ANPROM/UK/PIP/0001 January 2021
Price coordination must take into consideration anti-competition laws when component therapies are
produced by different manufacturers. Antitrust regulation prohibits different manufacturers from
working together explicitly to make pricing decisions [3, 9]. Thus, in this situation the manufacturer of
the add-on therapy must devise a pricing strategy without knowing the pricing strategy of the
manufacturer of the backbone therapy [7]. Flexibility in the pricing of the backbone therapy will depend
on its current stage in the product life cycle as well as whether it remains under patent and for how
long. If a backbone therapy has many years left under patent or holds sufficiently large market share, its
manufacturer may have little incentive to reduce its price.
The feasibility of flexible pricing will also depend on the local market construct. Different jurisdictions
may not allow for indication specific discounts or the variation of prices across indications. Any
reduction in price will reduce revenue across all indications. If a backbone therapy is approved for
multiple indications, and the market does not allow price or discount variation by indication, its
manufacturer may have little incentive to reduce its price. The manufacturer of the add-on therapy may
be forced into setting a lower price so that the combination therapy will be cost-effective as a result. In
this scenario, the manufacturer of the add-on therapy bears the full cost of developing the combination
therapy but captures limited value [3, 8]. In contrast, the manufacturer of the backbone therapy captures
additional value from the combination therapy without bearing new costs. When the backbone therapy
is an established therapy while the add-on is a new market entrant, many novel combination therapies
will fail to demonstrate cost-effectiveness. This reduces patient access to clinically important
combination therapies in markets where cost-effectiveness is the route to reimbursement [3].
We use the term “imbalanced market power” to define scenarios where the manufacturer of one
component therapy has more control over pricing decisions compared to the manufacturer of another
component therapy. There will typically be an imbalance of market power when a novel add-on is
combined with an existing backbone therapy that has already been appraised and approved. Additionally,
there can be an imbalance of market power when each of the component therapies has been appraised
and approved, but one of the component therapies holds a larger share of the market—either in the
indication for which the combination is being appraised or across multiple indications—than another
component therapy. We use the term “balanced market power” to define scenarios where none of the
component therapy manufacturers has more control over pricing decisions than another. Market power
will often be balanced in cases where a combination therapy consists of two or more existing therapies
that have already been appraised and approved and there is no large discrepancy in their respective
market shares.

13 C-ANPROM/UK/PIP/0001 January 2021
4. Attribution of Value Framework
In this section we lay out the proposed Attribution of Value Framework. We start from the standard
rules of cost-effectiveness analysis and we assume that the value of the combination therapy can be
determined. We then go on to define the problem in terms of whether component treatments are sub-
additive or synergistic. Finally, we propose potential solutions to each of four scenarios defined by the
information available (perfect/imperfect) and the balance of power between manufacturers
(balanced/imbalanced).
4.1. Standard rules of cost-effectiveness analysis
Standard health economic decision rules dictate that an intervention should be implemented over a
comparator if its incremental health benefits justify its incremental costs [13]. When incremental costs
are negative and incremental benefits are positive, the treatment is considered ‘cost-saving’ and should be
implemented. When incremental costs are positive and incremental benefits are negative, the treatment
is ‘dominated’ and should not be implemented. When incremental costs and benefits are both positive or
both negative, decision-makers must consider the value of the treatment in terms of the ratio of the
additional costs relative to the additional benefits.
The incremental cost-effectiveness ratio (ICER) is the statistic that is used to summarise this value and is
defined as the incremental costs (ΔC) divided by incremental benefits (ΔE). When QALYs are employed
as the measure of health benefit in cost-effectiveness analysis, ICERs represent the cost-per-QALY gained
attributable to implementing a treatment versus its comparator. Value for money is assessed by comparing
the ICER statistic to a maximum willingness-to-pay (WTP) for an additional QALY represented by the
decision-maker’s cost-effectiveness threshold, λ. This ‘decision rule’ for cost-effectiveness can be
represented as an inequality with the decision to implement a new treatment supported if its ICER falls
below the threshold:
∆𝐶
∆𝐸< 𝜆.
This decision rule can be rearranged to define an equivalent decision rule in terms of incremental net
health benefit (∆NHB) [14] whereby the new technology is adopted if its ∆NHB is greater than zero.
∆𝑁𝐻𝐵 = ∆𝐸 −∆𝐶
𝜆> 0.
Weinstein and Stason describe how the incremental costs and effects attributable to implementing a health
care intervention compared to a relevant comparator can be disaggregated into constituent parts [15]:

14 C-ANPROM/UK/PIP/0001 January 2021
∆𝐶 = ∆𝐶𝑟𝑥 + ∆𝐶𝑠𝑒 − ∆𝐶𝑚𝑜𝑟𝑏 + ∆𝐶𝑙𝑒
∆𝐸 = ∆𝐸𝑙𝑒 + ∆𝐸𝑚𝑜𝑟𝑏 − ∆𝐸𝑠𝑒
The constituent parts of incremental costs (ΔC) are those differences attributable to treatment cost (rx),
treatment-related side-effects (se), reduced morbidity of the disease (morb) and increased life-expectancy
(le). The constituent parts attributable to the incremental QALYs (ΔE) are the difference in QALYs due
to increased life-expectancy (le), reduced morbidity of disease (morb) and reduction in quality of life due
to side-effects (se).
Substituting these components into the inequality for the NHB decision rule generates a further
(equivalent) interpretation of the decision rule: that the new treatment will only be considered cost-
effective if the additional benefits of the new treatment (net of differences in the QALY equivalent values
of any cost-savings) outweigh the additional cost of the new treatment (also expressed as a QALY
equivalent)
𝑛𝑒𝑡𝛥𝑄 = (∆𝐸𝑙𝑒 + ∆𝐸𝑚𝑜𝑟𝑏 − ∆𝐸𝑠𝑒) −(∆𝐶𝑠𝑒 − ∆𝐶𝑚𝑜𝑟𝑏 + ∆𝐶𝑙𝑒)
𝜆>∆𝐶𝑟𝑥𝜆.
The importance of this derivation of the decision rule is that the left-hand side of the inequality expresses
the value of the new intervention in terms of its (net) impact on health (measured in terms of QALY gain,
or netQ) which includes any cost-savings (represented as equivalent health effects). Multiplying this
quantity by the threshold generates a monetized value of the net-benefits of treatment that represent the
maximum cost-effective incremental cost (price) that can be supported for the product. Note that since
the value on the left-hand side of the equation is a QALY equivalent, the framework can be employed just
on QALY differences or on a full net-equivalent QALY. This is important since in the case studies, we
illustrate the framework only using published net-QALYs due to the restrictions imposed by working with
information that is only available in the public domain.
4.2. Some notation
Incremental benefits and value
Let 𝑄𝐴 and 𝑄𝐵 be the net-equivalent QALYs attained from monotherapy with Therapy A and Therapy B,
respectively, and 𝑄𝐴,𝐵 be the net-equivalent QALYs attained from Therapy A and Therapy B used in
combination.
Let 𝑣𝐴 be the monotherapy value of Therapy A and 𝑣𝐵 be the monotherapy value of Therapy B for a given
indication. Similarly, let 𝑣𝐴,𝐵 be the value of the combination therapy composed of Therapy A and Therapy
B for the same indication. The value of Therapy A, Therapy B, and the combination therapy are given by
the following:

15 C-ANPROM/UK/PIP/0001 January 2021
𝑣𝐴 = 𝜆 ∙ 𝑄𝐴
𝑣𝐵 = 𝜆 ∙ 𝑄𝐵
𝑣𝐴,𝐵 = 𝜆 ∙ 𝑄𝐴𝐵
Sub-additive versus synergistic benefits
We say that a combination therapy is “additive” when the incremental benefit it generates equals the sum
of the incremental benefits that each of its component therapies generate when used independently in the
same indication, against the same comparator. That is, a combination therapy consisting of Therapy A and
Therapy B is additive when the following relation holds:
𝑄𝐴𝐵 = 𝑄𝐴 + 𝑄𝐵
A feature of combination therapies that makes value attribution challenging is that their efficacy is often
less than additive in practice. In cases where the monotherapy effect of each component therapy is known,
we often observe that combination therapies are strictly “sub-additive”. A combination therapy is strictly
sub-additive if it is more effective than each of the component therapies as monotherapies, but the
incremental benefit generated by the combination is less than the sum of the incremental benefits of each
component therapy when used alone. The following relation holds for strictly sub-additive combination
therapies:
max(𝑄𝐴, 𝑄𝐵) < 𝑄𝐴𝐵 < 𝑄𝐴 + 𝑄𝐵
Value attribution is more challenging for strictly sub-additive combinations because the value of a strictly
sub-additive combination therapy will be less than the sum of the independent values of its component
therapies. This follows directly from the inequality shown above:
𝑄𝐴𝐵 < 𝑄𝐴 + 𝑄𝐵
𝜆 ∙ 𝑄𝐴𝐵 < (𝜆 ∙ 𝑄𝐴) + (𝜆 ∙ 𝑄𝐵)
𝑣𝐴,𝐵 < 𝑣𝐴 + 𝑣𝐵
The last inequality implies that the value attributed to at least one of the component therapies will be less
than its monotherapy value. It is this constraint that creates potential “winners” and “losers”.
Combination therapies may also be synergistic, as described in section 3.1. The following relation will hold
for synergistic combinations:
𝑄𝐴𝐵 > 𝑄𝐴 + 𝑄𝐵

16 C-ANPROM/UK/PIP/0001 January 2021
Although the manner in which value is attributed is still a concern for synergistic combinations, this
scenario is less problematic since in this case 𝑣𝐴,𝐵 > 𝑣𝐴 + 𝑣𝐵. This implies that the value that is attributed
to each of the component therapies can be at least as great as their respective monotherapy values if not
greater. In this scenario, there is potential for more than one “winner” and no “losers”. We note that in
cases where we have imperfect information about the independent benefits of component therapies, we
cannot say with certainty whether a combination therapy is additive, strictly sub-additive, or synergistic.
4.3. The framework
Consider the combination therapy with component therapies A and B.2 Let 𝑘𝐴 be the proportion of the
value of the combination therapy that is attributed to Therapy A, and let 𝑘𝐵 be the proportion of the
value that is attributed to Therapy B, where 𝑘𝐴 + 𝑘𝐵 = 1. Here we present a framework for selecting
values for 𝑘𝐴 and 𝑘𝐵 that accounts for differences in the clinical effectiveness of therapies A and B as well
as the balance of market power.
Perfect information and balance of market power
The simplest scenario is one where there is perfect information and balanced market power. In this
scenario, we use what we know about the incremental benefits attained from monotherapy treatment
with each of the component therapies to select 𝑘𝐴 and 𝑘𝐵. Assume that the incremental benefit of
monotherapy with each drug is strictly positive. We can then attribute value to each of the component
therapies based on the amount each contributes to the sum of their independent benefits as follows:
𝑘𝐴 =𝑄𝐴
𝑄𝐴+𝑄𝐵 and 𝑘𝐵 =
𝑄𝐵
𝑄𝐴+𝑄𝐵
(Soln. 1)
Figure 4.1 illustrates a case where the combination therapy consisting of Therapy A and Therapy B is
strictly sub-additive. Since 𝑄𝐴,𝐵 < 𝑄𝐴 + 𝑄𝐵 , it follows that 𝑣𝐴,𝐵 < 𝑣𝐴 + 𝑣𝐵. The region shaded in blue
represents the monotherapy value of Therapy A and the region shaded in green represents the
monotherapy value of Therapy B. The sum of the monotherapy values of each drug is given by the height
of the stacked blue and green regions. The maximum WTP for the incremental benefit generated by the
combination therapy is given by the dashed line in Figure 4.1. The left panel of Figure 4.1 shows that the
2 We present the framework using the simple case of a combination therapy consisting of two components.
However, the framework can also be applied to combination therapies with more than two components. In the
latter case, one or both of therapies A and B will be combination therapies consisting of more than one
component.

17 C-ANPROM/UK/PIP/0001 January 2021
sum of the monotherapy values of the component drugs exceeds the WTP for the incremental benefit
generated by the combination therapy.
Figure 4.1. Perfect Information and Balanced Market Power Solution
The left panel of Figure 4.1 also shows that the monotherapy benefit of Therapy A equals that of Therapy
B, i.e. 𝑄𝐴 = 𝑄𝐵. This implies that 𝑄𝐴
𝑄𝐴+𝑄𝐵=
𝑄𝐵
𝑄𝐴+𝑄𝐵= 0.5. The solution for a scenario where there is perfect
information and no imbalance of market power thus attributes an equal share of the value of the
combination therapy to each component drug. This is shown in the right panel of Figure 4.1 above.
Perfect information and imbalance of market power
The solution presented above for the scenario where there is perfect information and no imbalance of
market power accounts for observed differences in the clinical effectiveness of each of the component
drugs. However, it does not account for differences in the timing of market entry and established market
share. Suppose that Therapy A is the backbone therapy in the combination and was licensed and
reimbursed on the market prior to the introduction of Therapy B. Since the manufacturer of Therapy A
has the “first-mover advantage”, it has less incentive to accept a share of the value of the combination that
is less than the monotherapy value of Therapy A. The value attributed to Therapy A will equal its
monotherapy value if 𝑘𝐴 and 𝑘𝐵 are chosen as follows:

18 C-ANPROM/UK/PIP/0001 January 2021
𝑘𝐴 =𝑄𝐴
𝑄𝐴,𝐵 and 𝑘𝐵 =
𝑄𝐴,𝐵−𝑄𝐴
𝑄𝐴,𝐵
This is true because 𝑄𝐴
𝑄𝐴,𝐵∙ 𝑣𝐴,𝐵 = 𝑣𝐴. When the combination therapy is strictly sub-additive, the value
attributed to Therapy A will be greater under this solution as compared to the solution for the perfect
information scenario where there is no imbalance of market power.
However, if the combination therapy is synergistic, then the value attributed to Therapy A when 𝑘𝐴 =𝑄𝐴
𝑄𝐴,𝐵 would be less than the value it would be attributed if 𝑘𝐴 =
𝑄𝐴
𝑄𝐴+𝑄𝐵. Recall that the overall QALY gain
is larger for synergistic combinations, since 𝑄𝐴,𝐵 > 𝑄𝐴 + 𝑄𝐵. This in turn implies that 𝑣𝐴,𝐵 > 𝑣𝐴 + 𝑣𝐵 such
that the value attributed to both component therapies could exceed their monotherapy value. Thus,
although the value attributed to Therapy A equals its monotherapy value when 𝑘𝐴 =𝑄𝐴
𝑄𝐴,𝐵, in this case all
of the value in excess of 𝑣𝐴 + 𝑣𝐵 will be attributed to Therapy B. When there is an imbalance of market
power, the manufacturer of the backbone therapy can select the solution that maximizes its share of the
value. The solution in this scenario is thus the following:
𝑘𝐴 = 𝑚𝑎𝑥 (𝑄𝐴
𝑄𝐴,𝐵,
𝑄𝐴
𝑄𝐴+𝑄𝐵) and 𝑘𝐵 = 𝑚𝑖𝑛 (
𝑄𝐴,𝐵−𝑄𝐴
𝑄𝐴,𝐵,
𝑄𝐵
𝑄𝐴+𝑄𝐵) ,
(Soln. 2)
where max and min are functions that return the maximum and minimum values, respectively, of the
parameters contained within the parentheses.
Here we demonstrate how the attribution of value between the component drugs changes when we
have perfect information, but there is an imbalance of market power. Note that the following relations
hold for strictly sub-additive combinations:
𝑄𝐴𝐵 < 𝑄𝐴 + 𝑄𝐵 ⇒ 𝑄𝐴 ⋅ 𝑄𝐴𝐵 < 𝑄𝐴 ⋅ (𝑄𝐴 +𝑄𝐵) ⇒𝑄𝐴
𝑄𝐴 + 𝑄𝐵<𝑄𝐴𝑄𝐴,𝐵
⇒ 𝑚𝑎𝑥 (𝑄𝐴𝑄𝐴,𝐵
,𝑄𝐴
𝑄𝐴 + 𝑄𝐵 ) =
𝑄𝐴𝑄𝐴,𝐵
⇒ 𝑘𝐴 = 𝑄𝐴𝑄𝐴,𝐵
The above inequalities show that a greater share of the value of the combination is attributed to the
backbone drug, Therapy A, when market power is imbalanced than when there was no imbalance of
market power. Consequently, a lower share of the value of the combination is attributed to the add-on
drug, Therapy B, when market power is imbalanced as compared to when it is balanced. This is shown
below in the right panel of Figure 4.2. Note that the height of the blue rectangles shown in the left and
right panels of Figure 4.2 are equal. This illustrates that the share of the value of the combination
therapy that is attributed to Therapy A is equal to its value as a monotherapy.

19 C-ANPROM/UK/PIP/0001 January 2021
Imperfect information and balance of market power
It is often the case that the independent benefit of the backbone therapy is known, but that the
independent benefit of the add-on drug is unknown or cannot be measured (e.g. in the hypothetical case
of a pharmacokinetic interaction). We would expect there to be an imbalance of market power in this
case as well since the backbone therapy would have been available on the market prior to the introduction
of the add-on drug. Furthermore, the backbone therapy can be used as a monotherapy, whereas the add-
on therapy can only be used in combination with the backbone therapy for the indication in question. Yet
even in a scenario where there is no imbalance of market power, an imbalance is created by the asymmetry
in the available information.
Intuitively, our solution should resemble that presented for the perfect information scenario where there
was an imbalance of market power. However, we cannot know whether the combination is strictly sub-
additive or synergistic if we do not know the independent benefit of the new add-on drug. If we assume
that the combination therapy is additive, then 𝑄𝐴
𝑄𝐴,𝐵=
𝑄𝐴
𝑄𝐴+𝑄𝐵 and
𝑄𝐴,𝐵−𝑄𝐴
𝑄𝐴,𝐵=
𝑄𝐵
𝑄𝐴+𝑄𝐵. Thus, in a scenario
where there is imperfect information, we assume that the combination is additive and select 𝑘𝐴 and 𝑘𝐵 as
follows:
𝑘𝐴 = 𝑄𝐴
𝑄𝐴,𝐵 and 𝑘𝐵 =
𝑄𝐵
𝑄𝐴,𝐵=
𝑄𝐴,𝐵−𝑄𝐴
𝑄𝐴,𝐵
(Soln. 3)
Figure 4.2. Perfect Information and Imbalanced Market Power Solution
20 C-ANPROM/UK/PIP/0001 January 2021
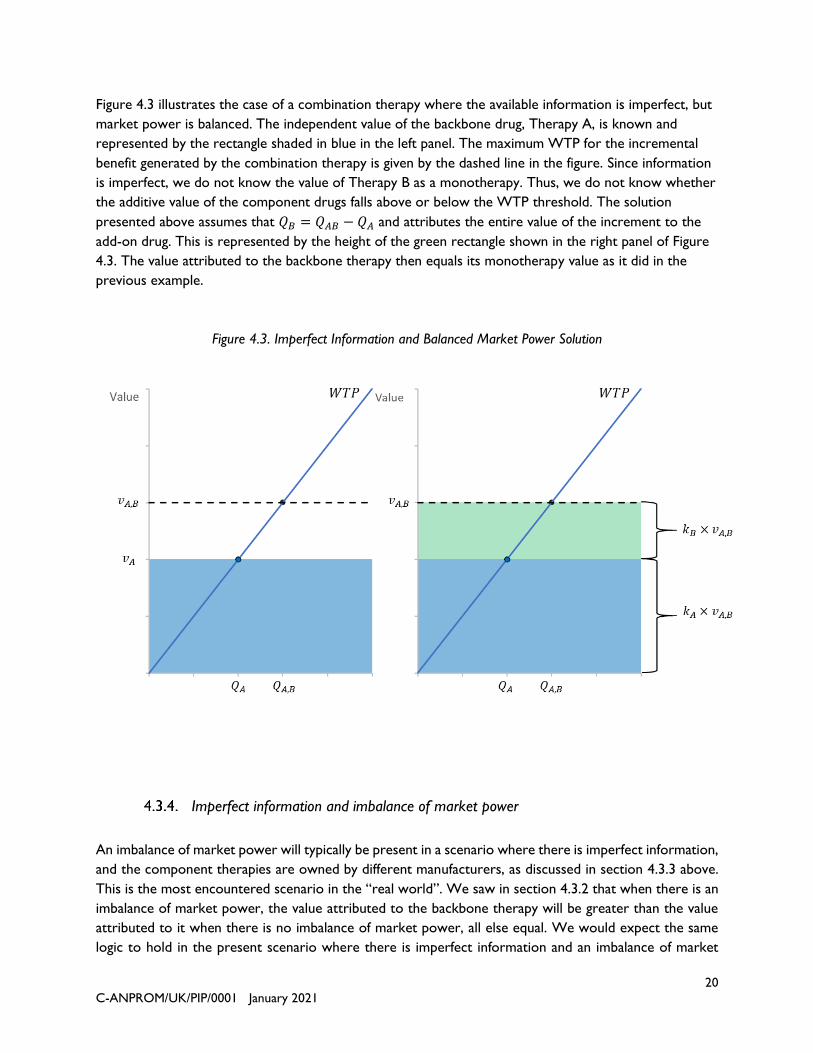
Figure 4.3 illustrates the case of a combination therapy where the available information is imperfect, but
market power is balanced. The independent value of the backbone drug, Therapy A, is known and
represented by the rectangle shaded in blue in the left panel. The maximum WTP for the incremental
benefit generated by the combination therapy is given by the dashed line in the figure. Since information
is imperfect, we do not know the value of Therapy B as a monotherapy. Thus, we do not know whether
the additive value of the component drugs falls above or below the WTP threshold. The solution
presented above assumes that 𝑄𝐵 = 𝑄𝐴𝐵 − 𝑄𝐴 and attributes the entire value of the increment to the
add-on drug. This is represented by the height of the green rectangle shown in the right panel of Figure
4.3. The value attributed to the backbone therapy then equals its monotherapy value as it did in the
previous example.
Imperfect information and imbalance of market power
An imbalance of market power will typically be present in a scenario where there is imperfect information,
and the component therapies are owned by different manufacturers, as discussed in section 4.3.3 above.
This is the most encountered scenario in the “real world”. We saw in section 4.3.2 that when there is an
imbalance of market power, the value attributed to the backbone therapy will be greater than the value
attributed to it when there is no imbalance of market power, all else equal. We would expect the same
logic to hold in the present scenario where there is imperfect information and an imbalance of market
Figure 4.3. Imperfect Information and Balanced Market Power Solution
21 C-ANPROM/UK/PIP/0001 January 2021
power. The manufacturer of the backbone therapy would favour a solution where 𝑘𝐴 >𝑄𝐴
𝑄𝐴,𝐵. The solution
to the scenario where there is imperfect information and no imbalance of market power thus becomes a
lower bound for the solution to the current problem. In this case, 𝑘𝐴 and 𝑘𝐵 will fall within the following
ranges:
𝑄𝐴
𝑄𝐴,𝐵≤ 𝑘𝐴 < 1 and 0 < 𝑘𝐵 ≤
𝑄𝐴,𝐵−𝑄𝐴
𝑄𝐴,𝐵, with 𝑘𝐴 + 𝑘𝐵 = 1.
The “negotiable share” of the incremental value offered by the combination therapy consists of the set
of possible values of 𝑘𝐴 that fall between 𝑄𝐴
𝑄𝐴,𝐵 and 1 or some predefined subset of this interval. For
example, the negotiable share may be predefined such that 𝑘𝐴 and 𝑘𝐵 must fall within the following
intervals:
{
𝑄𝐴𝑄𝐴,𝐵
≤ 𝑘𝐴 ≤ (1 + 𝑝) ⋅𝑄𝐴𝑄𝐴,𝐵
, if 𝑄𝐴𝑄𝐴,𝐵
< 0.50
𝑘𝐴 =𝑄𝐴𝑄𝐴,𝐵
, if 𝑄𝐴𝑄𝐴,𝐵
≥ 0.50 ,
where 𝑝 is a pre-specified value between 0 and 1. However, predefining the negotiable share in this way
requires buy-in from both manufacturers; this is likely to be the main topic of negotiations among
manufacturers should any dialogue or arbitration take place.
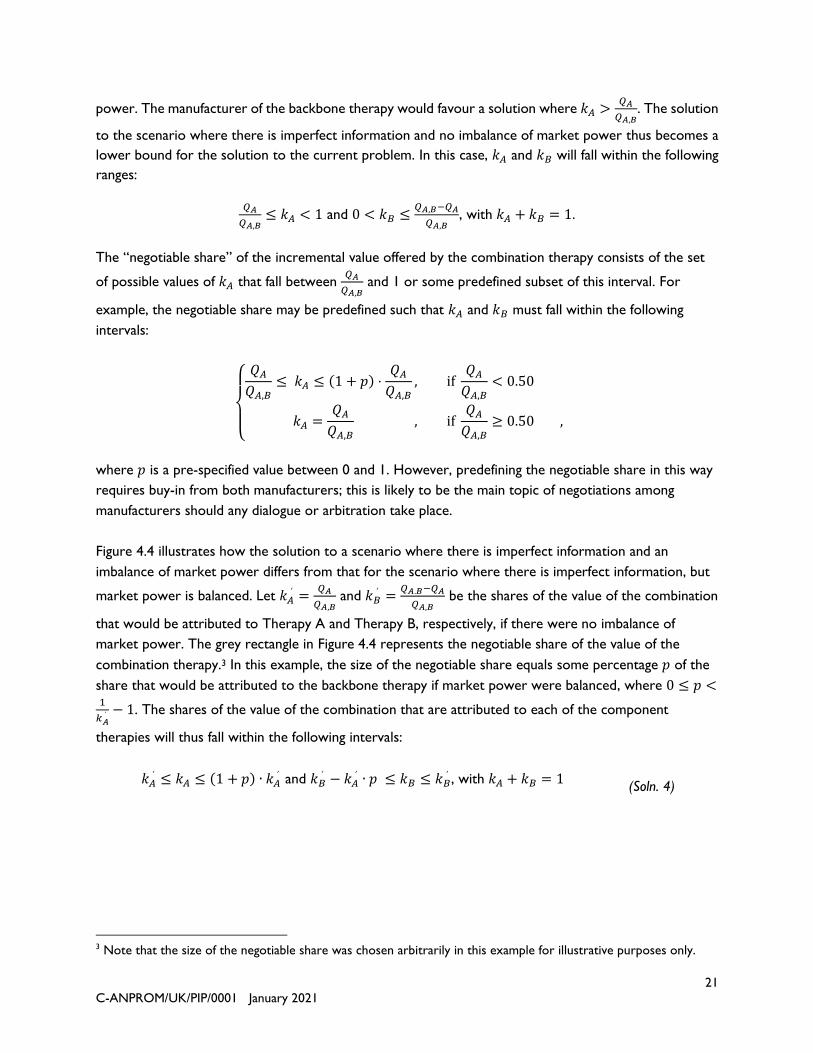
Figure 4.4 illustrates how the solution to a scenario where there is imperfect information and an
imbalance of market power differs from that for the scenario where there is imperfect information, but
market power is balanced. Let 𝑘𝐴′ =
𝑄𝐴
𝑄𝐴,𝐵 and 𝑘𝐵
′ =𝑄𝐴.𝐵−𝑄𝐴
𝑄𝐴,𝐵 be the shares of the value of the combination
that would be attributed to Therapy A and Therapy B, respectively, if there were no imbalance of
market power. The grey rectangle in Figure 4.4 represents the negotiable share of the value of the
combination therapy.3 In this example, the size of the negotiable share equals some percentage 𝑝 of the
share that would be attributed to the backbone therapy if market power were balanced, where 0 ≤ 𝑝 <1
𝑘𝐴′ − 1. The shares of the value of the combination that are attributed to each of the component
therapies will thus fall within the following intervals:
𝑘𝐴′ ≤ 𝑘𝐴 ≤ (1 + 𝑝) ∙ 𝑘𝐴
′ and 𝑘𝐵′ − 𝑘𝐴
′ ∙ 𝑝 ≤ 𝑘𝐵 ≤ 𝑘𝐵′ , with 𝑘𝐴 + 𝑘𝐵 = 1
(Soln. 4)
3 Note that the size of the negotiable share was chosen arbitrarily in this example for illustrative purposes only.
22 C-ANPROM/UK/PIP/0001 January 2021
Summary of solutions
The solutions to each of the four scenarios are summarized below in Table 4.3.1. Value Attribution
Solutions by Scenario. We demonstrate the application of these scenarios in the case studies that follow
in section 5.
Table 4.3.1. Value Attribution Solutions by Scenario
Scenario 𝒌𝑨 𝒌𝑩
Perfect Info, Balanced Power 𝑄𝐴
𝑄𝐴 + 𝑄𝐵
𝑄𝐵𝑄𝐴 + 𝑄𝐵
Perfect Info, Unbalanced Power 𝑚𝑎𝑥 (𝑄𝐴𝑄𝐴,𝐵
,𝑄𝐴
𝑄𝐴 + 𝑄𝐵 ) 𝑚𝑖𝑛 (
𝑄𝐴,𝐵 − 𝑄𝐴𝑄𝐴,𝐵
,𝑄𝐵
𝑄𝐴 + 𝑄𝐵 )
Imperfect Info, Balanced Power 𝑄𝐴𝑄𝐴,𝐵
𝑄𝐴,𝐵 − 𝑄𝐴𝑄𝐴,𝐵
Figure 4.4. Imperfect Information and Imbalanced Market Power Solution

23 C-ANPROM/UK/PIP/0001 January 2021
Imperfect Info, Unbalanced Power 𝑄𝐴𝑄𝐴,𝐵
≤ 𝑘𝐴 < 1 0 < 𝑘𝐵 ≤𝑄𝐴,𝐵 − 𝑄𝐴𝑄𝐴,𝐵
5. Case Studies
We demonstrate how the Attribution of Value Framework can be applied in practice through case
studies of combination therapies that have been previously appraised by NICE. The case studies selected
and detailed in this section were chosen solely for their illustrative value. To apply the Attribution of
Value Framework, we require estimates for the clinical benefits corresponding to a combination therapy
and each of its component therapies when these are known. Since we propose that the described
methodology for value attribution can be incorporated into the current technology appraisal process,
we obtain incremental QALY estimates from published NICE technology appraisals and related
documents to demonstrate how the framework would be applied in practice. QALY estimates were
selected for specific indications based on data availability. We use estimated incremental QALYs to link
comparators across appraisals and estimate total QALYs. Throughout the case studies, we use the
upper end of NICE’s standard WTP of £30,000/QALY as the cost-effectiveness threshold, λ.
We note that there are larger issues related to the evaluation and selection of clinical evidence. One
issue is that many therapies are used for more than one indication and reports suggest that at least 75%
of cancer drugs will be marketed for multiple indications by 2020 [16, 17]. Trastuzumab, for example, is
approved to treat HER2-positive metastatic gastric cancer as well as HER2-positive metastatic breast
cancer [18, 19]. This poses a challenge for value attribution and pricing since the value of a drug and
potential revenue is not constant across indications [2]. Furthermore, the value of a drug may also
change over time as new indications are discovered through further research and development [3].
Even within a single indication, QALY estimates will vary depending upon factors such as the sources
and strength of clinical evidence, data cut-off dates, and the structure and assumptions used in the
underlying economic model. This raises questions related to the implementation of the framework.
Which data to employ in the framework when there are competing estimates for the health benefits
attained from treatment with a given therapy? How do we account for uncertainty stemming from
immature data and changes in the strength of clinical evidence over time? Imbalances in the quality and
quantity of evidence for established versus newly emerging drugs will also affect the process of value
attribution. Although these questions and challenges must be addressed, they are not unlike those
encountered during the process of conventional cost-effectiveness analyses and economic evaluation and
are therefore not the focus of this framework.
One question that is central to the implementation of the framework is related to the classification of
combination therapies within this framework. The framework assumes that the relative effectiveness of
both therapies was estimated in direct or indirect comparisons (and QALY gain derived) using identical
PICO elements i.e. in the same populations within the same indication, same comparators, under the

24 C-ANPROM/UK/PIP/0001 January 2021
same conditions (dose, schedule of administration and positioning) and ideally QALY gains derived from
the same clinical endpoints. Consequently, the “perfect information” scenario is an ideal scenario which
is unfortunately rarely encountered in practice. What bar of clinical evidence is required to conclude
that a given combination therapy satisfies the condition of “perfect information”? Early-phase trials often
generate preliminary evidence of clinical efficacy. Is this evidence sufficient to conclude that a given
therapy has value as a monotherapy? We suggest that early-phase safety and dose escalation trials
provide insufficient evidence for establishing the monotherapy benefit of a given drug. Establishing
whether the bar of evidence has been met is even more challenging when a component therapy has
been studied in a phase III trial but was not administered following the same dosing schedule as when it
is administered as part of the combination therapy. Component therapies may also have been studied in
a different line of treatment or for a different indication than the combination is being appraised for. Do
we assume that we lack perfect information when component therapies demonstrate efficacy in different
lines of treatment? It is probable that the use of the framework will require some assumptions, scenario
analyses, dialogue, cooperation and compromises which will allow its implementation. In particular,
considering that the clinical evidence relevant to its implementation will have to be appropriately
generated during the clinical development of either or both therapies, the implementation of the
framework will benefit from early discussions between the companies involved and early dialogues with
relevant HTA bodies.
We note that the combination therapies selected to illustrate the scenarios where there is no imbalance
of market power are composed of component therapies that are produced by the same manufacturer.
These therapies were selected for the case studies based on the available data. Arguably, cases where
component therapies are produced by a single manufacturer pose the least challenge for value
attribution. In these cases, all the value will be captured by the one manufacturer irrespective of how
value is attributed to each of the component therapies. The manufacturer of a combination therapy
consisting of 𝑛 components can set each of 𝑘1, … , 𝑘𝑛 equal to any value between 0 and 1 so long as
𝑘1 + 𝑘2 +⋯+ 𝑘𝑛 = 1. We do not attribute value specifically to generic drugs in the case studies for
two reasons: (1) we do not believe the major issues that arise if combination therapies are found to be
‘not cost-effective at zero price’ are due to the generic component of combinations, and (2)
manufacturers of patented component therapies can choose to manufacture generic components as
well, thereby internalising the generic component of the combination. We present the case studies for
each of the four scenarios in the sections that follow.
5.1. Perfect information and balanced market power: nivolumab with ipilimumab
Combination therapy with nivolumab and ipilimumab is indicated for the treatment of patients with
unresectable or metastatic melanoma [20].4 Nivolumab and ipilimumab are each approved as single-
4 Nivolumab in combination with ipilimumab is also NICE recommended for patients in the UK with untreated
advanced renal cell carcinoma and is currently under NICE appraisal for additional indications such as untreated
unresectable malignant pleural mesothelioma and untreated advanced non-small-cell lung cancer [63, 64].

25 C-ANPROM/UK/PIP/0001 January 2021
agent treatments for unresectable or metastatic melanoma as well [20, 21]. Since nivolumab and
ipilimumab have been studied independently as well as in combination in phase III clinical trials for this
indication, we have information about their independent clinical benefits [22–25]. This is thus a
combination for which we have “perfect information” under the Attribution of Value Framework.
Ipilimumab was already available on the market and used in clinical practice for the treatment of
advanced melanoma when both the NICE appraisals of single-agent nivolumab and nivolumab in
combination with ipilimumab began in 2015 [26, 27].5 Ipilimumab was the standard of care for treating
the BRAF mutation-negative subtype of the disease, and was a treatment option for the BRAF mutation-
positive subtype as well [28]. Since ipilimumab was registered first [20,21], we identify ipilimumab as the
“backbone therapy” and nivolumab as the “add-on therapy”. As ipilimumab had already been
recommended by NICE as a monotherapy, at the time when the combination was being appraised, the
manufacturer of ipilimumab would have had greater market power than the manufacturer of nivolumab.
However, ipilimumab and nivolumab are both produced by the same manufacturer, so market power is
balanced by default in this case.
When assessing the relative clinical benefits of component drugs, it is optimal to consider evidence from
head-to-head clinical trials when available. Nivolumab and ipilimumab were compared alone and in
combination as therapies for untreated metastatic melanoma in a randomized phase III clinical trial [24,
25, 29]. The clinical data suggest that the combination therapy is more effective than single-agent
treatment with either of the component therapies (see Tables Table 5.1.1 through Table 5.1.3).
Survival estimates corresponding to nivolumab monotherapy, ipilimumab monotherapy, and nivolumab in
combination with ipilimumab are shown below in Table 5.1.1. The combination therapy is associated
with an estimated gain in median progression-free survival (PFS) of 4.6 months in comparison to
nivolumab monotherapy and 8.6 months in comparison to ipilimumab monotherapy. Median overall
survival (OS) in the combination therapy arm was not reached, but was greater than 60 months [28].
The combination is thus associated with an estimated gain in overall survival of more than 23.1 months
in comparison to nivolumab monotherapy and more than 40.1 months in comparison to ipilimumab
monotherapy. Furthermore, the data suggest that nivolumab monotherapy has greater clinical efficacy
than ipilimumab monotherapy for the indication of advanced melanoma.
Table 5.1.1. Survival Estimates (in months)
Treatment PFS OS
Nivolumab with ipilimumab 11.5 (95% CI: 8.7-19.3) Not reached (> 60)
Nivolumab 6.9 (95% CI: 5.1-10.2) 36.9 (95% CI: 28.2-58.7)
5 NICE issued its final scope for an appraisal of single-agent nivolumab for treating advanced melanoma in July 2015.
It issued its final scope for a separate appraisal of nivolumab in combination with ipilimumab for treating advanced
melanoma just a few months later in November 2015.

26 C-ANPROM/UK/PIP/0001 January 2021
Ipilimumab 2.9 (95% CI:2.8-3.2) 19.9 (95% CI: 16.8-24.6)
Source: [30]
Table 5.1.2. Hazard Ratio for Death
Treatment Compared to Ipilimumab Compared to Nivolumab
Nivolumab with ipilimumab HR: 0.52 (95% CI: 0.42-0.64; P<0.001) HR: 0.83 (95% CI: 0.67-1.03)
Nivolumab HR: 0.63 (95% CI: 0.52-0.76; P<0.001) –
Source: [29]
Table 5.1.3. Hazard Ratio for Disease Progression or Death
Treatment Compared to Ipilimumab Compared to Nivolumab
Nivolumab with ipilimumab HR: 0.42 (95% CI: 0.35-0.51; P<0.001) HR: 0.79 (95% CI: 0.64-0.96)
Nivolumab HR: 0.53 (95% CI: 0.44-0.64; P<0.001) –
Source: [29]
We demonstrate how the Attribution of Value Framework can be applied in this case using data that we
obtained from publicly available documents from the NICE appraisals of nivolumab and nivolumab in
combination with ipilimumab for treating advanced melanoma. To implement the solution to a perfect
information scenario, we require incremental QALY estimates for the combination therapy as well as
each of its component therapies. We use incremental QALY estimates for the BRAF mutation-negative
subgroup of patients with advanced melanoma based on data availability [30. 31].6 Dacarbazine is used as
the common comparator in line with the appraisal of nivolumab monotherapy for this subgroup of
patients. The incremental QALY estimates we use are shown below in Table 5.1.4. We obtain the
monetized value of these incremental health benefits by multiplying each estimate by the willingness-to-
pay for one additional QALY.
6 These incremental QALY estimates were generated by the base case models the company submitted for
technology appraisals of nivolumab monotherapy and nivolumab in combination with ipilimumab as treatments for
advanced melanoma [30,31].

27 C-ANPROM/UK/PIP/0001 January 2021
Table 5.1.4. Estimated QALYs for BRAF mutation-negative patients
Therapy Total
QALYs
∆QALYs Value
Dacarbazine 1.23 ------- -------
Ipilimumab 2.64 1.41 £42,300
Nivolumab 4.31 3.08 £92,400
Nivolumab + ipilimumab 4.83 3.60 £108,000
Substituting the incremental QALY estimates for the BRAF mutation-negative population into the
framework gives the following:7
𝑄𝐼𝑃𝐼 = 1.41
𝑄𝑁𝐼𝑉𝑂 = 3.08
𝑄𝑁𝐼𝑉𝑂,𝐼𝑃𝐼 = 3.60
𝑄𝐼𝑃𝐼 + 𝑄𝑁𝐼𝑉𝑂 = 4.49
We observe that nivolumab with ipilimumab is a strictly sub-additive combination since
𝑄𝑁𝐼𝑉𝑂,𝐼𝑃𝐼 < 𝑄𝐼𝑃𝐼 + 𝑄𝑁𝐼𝑉𝑂.
Let λ denote the WTP for an additional QALY. The value of each therapy is then given by 𝑣𝑖 = 𝜆 × 𝑄𝑖 ,
where 𝑖 is an index that specifies the therapy. Setting WTP equal to £30,000 per QALY gained, the value
of the combination therapy and each of its component drugs are as follows:
𝑣𝐼𝑃𝐼 = £42,300
𝑣𝑁𝐼𝑉𝑂 = £92,400
𝑣𝑁𝐼𝑉𝑂,𝐼𝑃𝐼 = £108,000
Since the combination therapy is strictly sub-additive, the value of the combination is less than the sum
of the independent values of its component therapies. That is, 𝑣𝑁𝐼𝑉𝑂,𝐼𝑃𝐼 < 𝑣𝐼𝑃𝐼 + 𝑣𝑁𝐼𝑉𝑂. This is shown
graphically below in Figure 5.1. We observe that the sum of the independent values exceeds the
willingness-to-pay for the incremental benefits attained from treatment with the combination therapy.
7 Abbreviations: IPI – ipilimumab; NIVO – nivolumab; NIVO,IPI – combination therapy with nivolumab and
ipilimumab
28 C-ANPROM/UK/PIP/0001 January 2021
Figure 5.1. Value and Willingness-to-Pay for Nivolumab with Ipilimumab
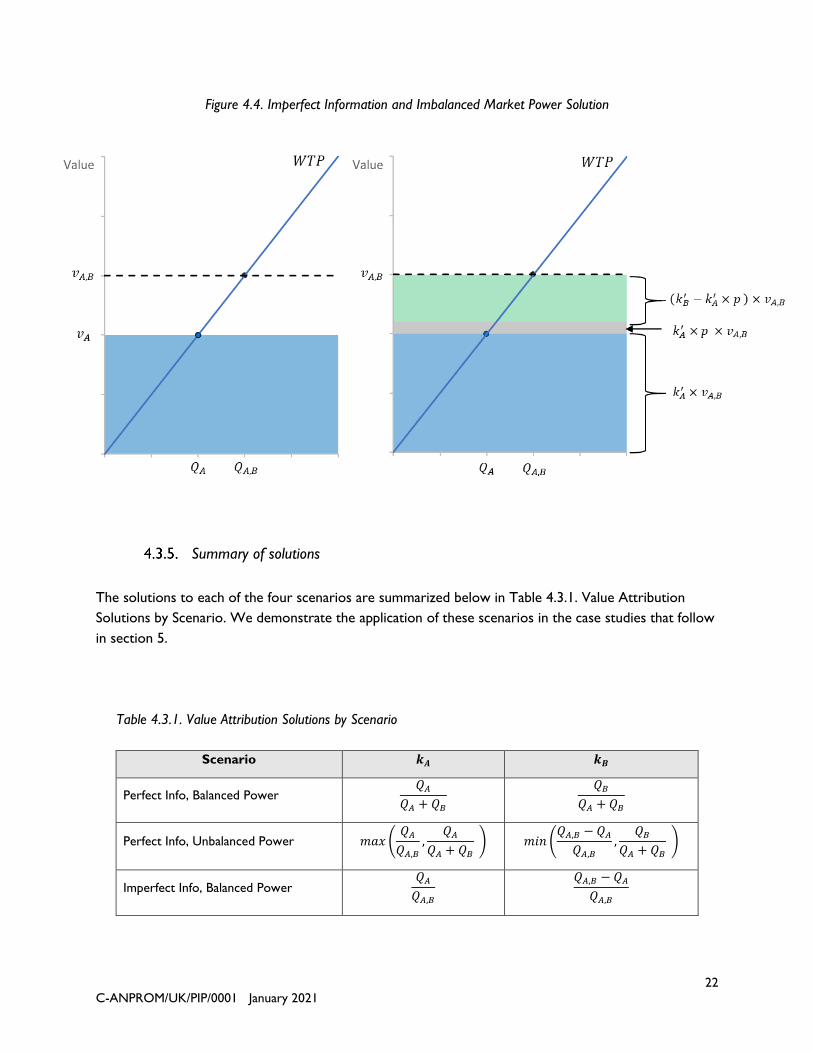
Since market power is balanced in the given example, we apply the value attribution solution
corresponding to the perfect information and balanced market power scenario. Under this scenario,
each of the component therapies receives a share of the value of the combination that is proportional to
its share of the sum of their monotherapy benefits. In the current example, the value of the combination
is attributed to each of the component therapies as follows:
𝑘𝐼𝑃𝐼 =𝑄𝐼𝑃𝐼
𝑄𝑁𝐼𝑉𝑂 + 𝑄𝐼𝑃𝐼=1.41
4.49≈ 31%
𝑘𝑁𝐼𝑉𝑂 =𝑄𝑁𝐼𝑉𝑂
𝑄𝑁𝐼𝑉𝑂 + 𝑄𝐼𝑃𝐼=3.08
4.49≈ 69%
The solution implies that 31% of the value of the combination is attributed to ipilimumab and 69% is
attributed to nivolumab. Ipilimumab’s contribution to the incremental benefit attained under the
combination is valued at £33,915 and nivolumab’s contribution is valued at £74,085. This is shown
graphically below in Figure 5.2, where the shaded regions of the graph illustrate the share of the value of
the combination that is attributed to each of the component therapies.
Abbreviations: IPI – ipilimumab, NIVO – nivolumab, NIVO,IPI –
combination therapy with nivolumab and ipilimumab, WTP – willingness-to-
pay (equals £30,000 per QALY gained).

29 C-ANPROM/UK/PIP/0001 January 2021
Figure 5.2. Case Study: Perfect Information and Balanced Market Power Solution
Now consider a hypothetical example where the incremental benefits of each of the therapies are the
same as in the previous example, but market power is imbalanced. The value of the combination that is
attributed to the backbone therapy equals its independent value, while the value of the incremental
benefit obtained from treatment with the combination therapy is attributed to the add-on therapy as
follows:
𝑘𝐼𝑃𝐼 =𝑄𝐼𝑃𝐼
𝑄𝑁𝐼𝑉𝑂,𝐼𝑃𝐼=1.41
3.60≈ 39%
𝑘𝑁𝐼𝑉𝑂 =𝑄𝑁𝐼𝑉𝑂 − 𝑄𝐼𝑃𝐼𝑄𝑁𝐼𝑉𝑂,𝐼𝑃𝐼
=2.19
3.60≈ 61%
The solution implies that 39% of the value of the combination is attributed to ipilimumab and 61% is
attributed to nivolumab. Ipilimumab’s contribution to the incremental benefit attained under the
combination is valued at £42,300 and nivolumab’s contribution is valued at £65,700. Under this scenario,
the backbone therapy receives a higher share of the value of the combination than when market power
is equal while the add-on therapy receives a lower share. This outcome is depicted below in Figure 5.3.
Abbreviations: IPI – ipilimumab, NIVO – nivolumab, NIVO,IPI –
combination therapy with nivolumab and ipilimumab, WTP – willingness-to-
pay (equals £30,000 per QALY gained).

30 C-ANPROM/UK/PIP/0001 January 2021
Figure 5.3. Illustrative Example: Perfect Information and Imbalanced Market Power Solution
5.2. Perfect information and imbalanced market power: pembrolizumab with
pemetrexed and platinum chemotherapy
Pembrolizumab with pemetrexed and platinum chemotherapy (carboplatin or cisplatin) is indicated as a
first-line treatment for metastatic non-squamous non-small-cell lung cancer (NSCLC) with no epidermal
growth factor receptor (EGFR) or anaplastic lymphoma kinase (ALK) tumour mutations [32,33].
Pembrolizumab monotherapy is indicated as a first-line treatment for patients with metastatic NSCLC
with programmed death-ligand 1 (PD-L1) tumour proportion score (TPS) ≥ 50% and no EGFR or ALK
mutations [32,34]. Pemetrexed plus cisplatin is indicated as a first-line treatment for locally advanced or
metastatic NSCLC other than predominantly squamous cell histology [35,36].
Pembrolizumab with pemetrexed and platinum chemotherapy (hereafter referred to as the
pembrolizumab combination) satisfies the condition for perfect information for the subgroup of patients
with metastatic non-squamous NSCLC without EGFR or ALK mutations with PD-L1 TPS ≥ 50% since
the combination and each of its component therapies has been studied independently as treatments for
this population in phase III clinical trials [37–40]. The pembrolizumab combination therapy also satisfies
Abbreviations: IPI – ipilimumab, NIVO – nivolumab, NIVO,IPI –
combination therapy with nivolumab and ipilimumab, WTP – willingness-to-
pay (equals £30,000 per QALY gained).

31 C-ANPROM/UK/PIP/0001 January 2021
the condition for imbalanced market power since pembrolizumab and pemetrexed have different
manufacturers and pemetrexed-platinum was an established therapy for advanced non-squamous
NSCLC when pembrolizumab was introduced into the market as a monotherapy. We do not consider
the platinum-based chemotherapies as independent components since these drugs are available as
generics that can be manufactured at low cost. We thus identify pemetrexed-platinum as the backbone
therapy in the pembrolizumab combination and pembrolizumab as the add-on therapy.8
Survival and hazard ratio estimates based on the September 2018 data cut of the phase III clinical trial of
the pembrolizumab combination are shown below in TablesTable 5.2.1 and Table 5.2.2, respectively.
Although the trial included patients with untreated metastatic nonaqueous NSCLC without EGFR or
ALK mutations regardless of their PD-L1 expression, these estimates are specific to the subgroup of
patients with PD-L1 TPS ≥ 50%.
Table 5.2.1. Progression-free survival and Survival Estimates for Patients with PD-L1 TPS ≥ 50% (in months)
Treatment PFS OS
Pembrolizumab plus pemetrexed-platinum 11.1 (95% CI: 9.1, 14.4) NR (95% CI: 20.4, NR)
Pemetrexed-platinum 4.8 (95% CI: 3.1, 6.2) 10.1 (95% CI: 7.5, NR)
Source: [38]
Table 5.2.2. Hazard Ratios for the Pembrolizumab Combination Compared to Pemetrexed-Platinum for Patients
with PD-L1 TPS ≥ 50%
Hazard Ratios
Hazard Ratio for Death HR: 0.59 (95% CI: 0.39, 0.88)
Hazard Ratio for Disease Progression HR: 0.36 (95% CI: 0.26, 0.51)
Source: [38]
The incremental benefits derived from treatment with the combination therapy and each of its
component therapies are shown below in Table 5.2.3. Since pembrolizumab monotherapy is only
8 We note that pembrolizumab monotherapy became the standard of care for treating patients with metastatic
NSCLC with no EGFR or ALK mutations with PD-L1 TPS ≥ 50% after it received positive guidance from NICE in
2018 [33]. Given that, it is arguable that the manufacturer of pembrolizumab, who also sponsored the appraisal of
the pembrolizumab combination, would have had greater market power than the manufacturer of pemetrexed at
the time when the appraisal of the combination occurred. Furthermore, at the time when the pembrolizumab
combination was being appraised, there was an expectation that generic versions of pemetrexed would soon be
available [43]. As we discuss elsewhere, the challenges that make it difficult for novel combination therapies to
demonstrate cost-effectiveness arise when component therapies are patented and cannot be produced at low cost.
However, we assume that both component therapies are patented for the purpose of demonstrating the
framework.

32 C-ANPROM/UK/PIP/0001 January 2021
indicated for the subgroup of patients who are PD-L1-positive with TPS ≥ 50%, the estimated benefits
we use to illustrate the framework are specific to this population.9 The common comparator used is
best supportive care.10,11 The incremental benefit corresponding to treatment with pemetrexed-platinum
was estimated using data obtained from a NICE appraisal of pemetrexed for the first-line treatment of
NSCLC (TA181) and an appraisal of gemcitabine as a treatment for lung cancer (TA26) [38, 39].12 The
estimated incremental benefits corresponding to treatment with pembrolizumab monotherapy and the
pembrolizumab combination are imputed using total QALY estimates reported in the NICE appraisal for
pembrolizumab with pemetrexed and platinum chemotherapy (TA557) and the estimated incremental
benefit for pemetrexed-platinum [43].
Table 5.2.3. Estimated QALYs for Patients with PD-L1 TPS ≥ 50%13
Therapy Total
QALYs
∆QALYs Value
Best supportive care 0.58 – –
Pemetrexed-platinum 0.95 0.37 £11,100
Pembrolizumab 1.57 0.99 £29,700
Pembrolizumab with pemetrexed and platinum 2.35 1.77 £53,100
9 There is a phase III clinical trial that compares pembrolizumab monotherapy to platinum-based chemotherapy as
first-line treatments for patients with advanced NSCLC with a PD-L1 TPS ≥ 1% [65]. However, the technology
appraisals for pembrolizumab monotherapy and the pembrolizumab combination were published before the
completion of this study. We demonstrate the Attribution of Value Framework using data inputs for the subgroup
of patients with advanced NSCLC who are PD-L1-positive with TPS ≥ 50% solely because of data availability. 10 Other chemotherapies that are used as first-line treatments for advanced non-squamous NSCLC are
gemcitabine, docetaxel, paclitaxel, or vinorelbine in combination with carboplatin or cisplatin [31]. These therapies
were not selected as baseline comparators since they exhibit similar efficacy to pemetrexed-platinum. We use BSC
as the common comparator, since it was used as such in the NICE appraisal of paclitaxel, docetaxel, gemcitabine
and vinorelbine for lung cancer [42]. 11 We note that the estimated QALYs corresponding to BSC shown in Table 5.2.3 are for a general population of
patients with lung cancer. The estimates are not specific to patients with PD-L1 TPS ≥ 50%. 12 We estimate incremental QALYs for pemetrexed-platinum compared to BSC by linking the incremental QALYs
for gemcitabine versus BSC reported in TA26 with the incremental QALYs for pemetrexed plus cisplatin versus
gemcitabine plus cisplatin reported in TA181. The estimate for the incremental benefit corresponding to treatment
with pemetrexed-platinum is therefore specific to the combination consisting of pemetrexed plus cisplatin, but we
use it as a proxy for the combination consisting of pemetrexed plus carboplatin as well. 13 The estimates shown in Table 5.2.3 are the discounted base-case results from the NICE appraisal of the
pembrolizumab combination therapy [43]. The estimates are based on the results from the 2017 data cut of the
phase III clinical trial of the pembrolizumab combination [37, 38].

33 C-ANPROM/UK/PIP/0001 January 2021
Substituting the incremental QALY estimates into the framework gives the following:14,15
𝑄𝑃𝐸𝑀,𝑃𝐿𝑇 = 0.37
𝑄𝑃𝐵𝑍 = 0.99
𝑄𝑃𝐵𝑍,𝑃𝐸𝑀,𝑃𝐿𝑇 = 1.77
𝑄𝑃𝐸𝑀,𝑃𝐿𝑇 + 𝑄𝑃𝐵𝑍 = 1.36
We observe that the estimated incremental QALYs shown in Table 5.2.3 above show that
pembrolizumab with pemetrexed and platinum-based chemotherapy is a synergistic combination since:
𝑄𝑃𝐵𝑍,𝑃𝐸𝑀,𝑃𝐿𝑇 > 𝑄𝑃𝐸𝑀,𝑃𝐿𝑇 + 𝑄𝑃𝐵𝑍.
Setting WTP equal to £30,000 per QALY gained, the value of the combination therapy and each of its
component drugs are as follows:
𝑣𝑃𝐸𝑀,𝑃𝐿𝑇 = £11,100
𝑣𝑃𝐵𝑍 = £29,700
𝑣𝑃𝐵𝑍,𝑃𝐸𝑀,𝑃𝐿𝑇 = £53,100
Since the pembrolizumab combination therapy is synergistic, the value of the pembrolizumab
combination is greater than the additive value of its component therapies. That is,
𝑣𝑃𝐵𝑍,𝑃𝐸𝑀,𝑃𝐿𝑇 > 𝑣𝑃𝐸𝑀,𝑃𝐿𝑇 + 𝑣𝑃𝐵𝑍. This is shown graphically below in Figure 5.4. We observe that the
WTP for the incremental benefit attained from treatment with the combination therapy exceeds the
additive value of the component therapies.
14 Abbreviations: PEM,PLT – pemetrexed with platinum chemotherapy; PBZ – pembrolizumab monotherapy;
PBZ,PEM,PLT – combination therapy with pembrolizumab, pemetrexed and platinum chemotherapy 15 The NICE appraisal for pembrolizumab monotherapy (TA531) suggests that the incremental benefit derived
from treatment with single-agent pembrolizumab may be higher than the estimate reported in Table 5.2.3. The
company’s base case and updated base case models estimate that the incremental benefit derived from treatment
with pembrolizumab monotherapy as compared to the standard of care (SOC) are 1.27 and 0.96, respectively,
where SOC is a chemotherapy regimen (gemcitabine, paclitaxel, pemetrexed) combined with a platinum therapy
(cisplatin or carboplatin). We use QALY estimates from the more recent appraisal of the pembrolizumab
combination to demonstrate the Attribution of Value Framework.

34 C-ANPROM/UK/PIP/0001 January 2021
Figure 5.4. Value and Willingness-to-Pay for Pembrolizumab with Pemetrexed and Platinum
When market power is imbalanced, the manufacturer with more power will seek to capture a greater
share of the value of the combination or be less inclined to cede value than it would if market power
were balanced. Under this scenario, the manufacturer of the backbone therapy receives a share of the
value of the novel combination that equals the ratio of its independent benefit to the benefit of the
combination if the resulting share is greater than the share it would receive under the corresponding
balanced market power scenario. The value of the pembrolizumab combination is attributed to each of
the component therapies as follows:
𝑘𝑃𝐸𝑀,𝑃𝐿𝑇 = max(𝑄𝑃𝐸𝑀,𝑃𝐿𝑇
𝑄𝑃𝐵𝑍,𝑃𝐸𝑀,𝑃𝐿𝑇,
𝑄𝑃𝐸𝑀,𝑃𝐿𝑇𝑄𝑃𝐸𝑀,𝑃𝐿𝑇 + 𝑄𝑃𝐵𝑍
) = max(0.37
1.77,0.37
1.36) ≈ max (0.21, 0.27) ≈ 27%
𝑘𝑃𝐵𝑍 = min (𝑄𝑃𝐵𝑍,𝑃𝐸𝑀,𝑃𝐿𝑇 − 𝑄𝑃𝐸𝑀,𝑃𝐿𝑇
𝑄𝑃𝐵𝑍,𝑃𝐸𝑀,𝑃𝐿𝑇,
𝑄𝑃𝐵𝑍𝑄𝑃𝐸𝑀,𝑃𝐿𝑇 + 𝑄𝑃𝐵𝑍
) = min (1.40
1.77,0.99
1.36) ≈ min(0.79, 0.73) ≈ 73%
Abbreviations: PEM,PLT – pemetrexed-platinum, PBZ – pembrolizumab,
PBZ,PEM,PLT – combination therapy with pembrolizumab and
pemetrexed-platinum, WTP – willingness-to-pay (equals £30,000 per
QALY gained).

35 C-ANPROM/UK/PIP/0001 January 2021
The solution implies that 27% of the value of the combination is attributed to the backbone, pemetrexed
with platinum chemotherapy and 73% is attributed to the add-on, pembrolizumab. In the combination,
the contribution of pemetrexed-platinum to the incremental benefit is valued at £14,446 and the
contribution of pembrolizumab is valued at £38,654. This is shown below in Figure 5.5.
Figure 5.5. Case Study: Perfect Information and Imbalanced Market Power Solution
Note that in this example, the resulting attribution of value when market power is imbalanced is the
same that would result if market power were balanced. This will be true for all combinations that are
additive or synergistic. If the share of the value attributed to pemetrexed-platinum were given by
𝑘𝑃𝐸𝑀,𝑃𝐿𝑇 =𝑄𝑃𝐸𝑀,𝑃𝐿𝑇
𝑄𝑃𝐵𝑍,𝑃𝐸𝑀,𝑃𝐿𝑇≈ 21% instead, then the backbone therapy would receive a share of the value
of the pembrolizumab combination such that the value of this share and the independent value of the
backbone therapy are equal. However, the backbone therapy would then fail to capture any of the
synergistic gains where the value of the pembrolizumab combination exceeds the additive value of its
component therapies. This is shown below in Figure 5.6. If the combination therapy were strictly sub-
additive, however, then a greater share of the value of the combination would be attributed to the
backbone therapy if 𝑘𝑃𝐸𝑀,𝑃𝐿𝑇 =𝑄𝑃𝐸𝑀,𝑃𝐿𝑇
𝑄𝑃𝐵𝑍,𝑃𝐸𝑀,𝑃𝐿𝑇 as compared to when 𝑘𝑃𝐸𝑀,𝑃𝐿𝑇 =
𝑄𝑃𝐸𝑀,𝑃𝐿𝑇
𝑄𝑃𝐸𝑀,𝑃𝐿𝑇+𝑄𝑃𝐵𝑍. In general,
Abbreviations: PEM,PLT – pemetrexed-platinum, PBZ – pembrolizumab,
PBZ,PEM,PLT – combination therapy with pembrolizumab and
pemetrexed-platinum, WTP – willingness-to-pay (equals £30,000 per
QALY gained).

36 C-ANPROM/UK/PIP/0001 January 2021
the resulting attribution of value for a strictly sub-additive combination therapy for which perfect
information exists will differ depending upon whether market power is balanced or imbalanced, even
when all other factors are held constant.
Figure 5.6. Illustrative Example: Attribution of Value if 𝑘𝑃𝐸𝑀,𝑃𝐿𝑇 =𝑄𝑃𝐸𝑀,𝑃𝐿𝑇
𝑄𝑃𝐵𝑍,𝑃𝐸𝑀,𝑃𝐿𝑇
5.3. Imperfect information and balanced market power: pertuzumab with
trastuzumab and docetaxel
Pertuzumab with trastuzumab and docetaxel is indicated for the treatment of patients with HER2-
positive metastatic or locally recurrent unresectable breast cancer (HER2+ mBC) who have not
received prior anti-HER2 therapy or chemotherapy for metastatic disease [32, 44]. This combination
therapy holds significance as its appraisal motivated the original work culminating in the 2014 NICE
Decision Support Unit (DSU) report that illustrates how health technologies can fail to be cost-effective
even at ‘zero price’ [1, 12]. This work defined what is now well-recognized as a key challenge to the
economic evaluation of combination therapies in oncology—that clinically effective therapies can fail to
be cost-effective, even at zero cost of the add-on therapy, because gains in progression-free survival
Abbreviations: PEM,PLT – pemetrexed-platinum, PBZ – pembrolizumab,
PBZ,PEM,PLT – combination therapy with pembrolizumab and
pemetrexed-platinum, WTP – willingness-to-pay (equals £30,000 per
QALY gained).
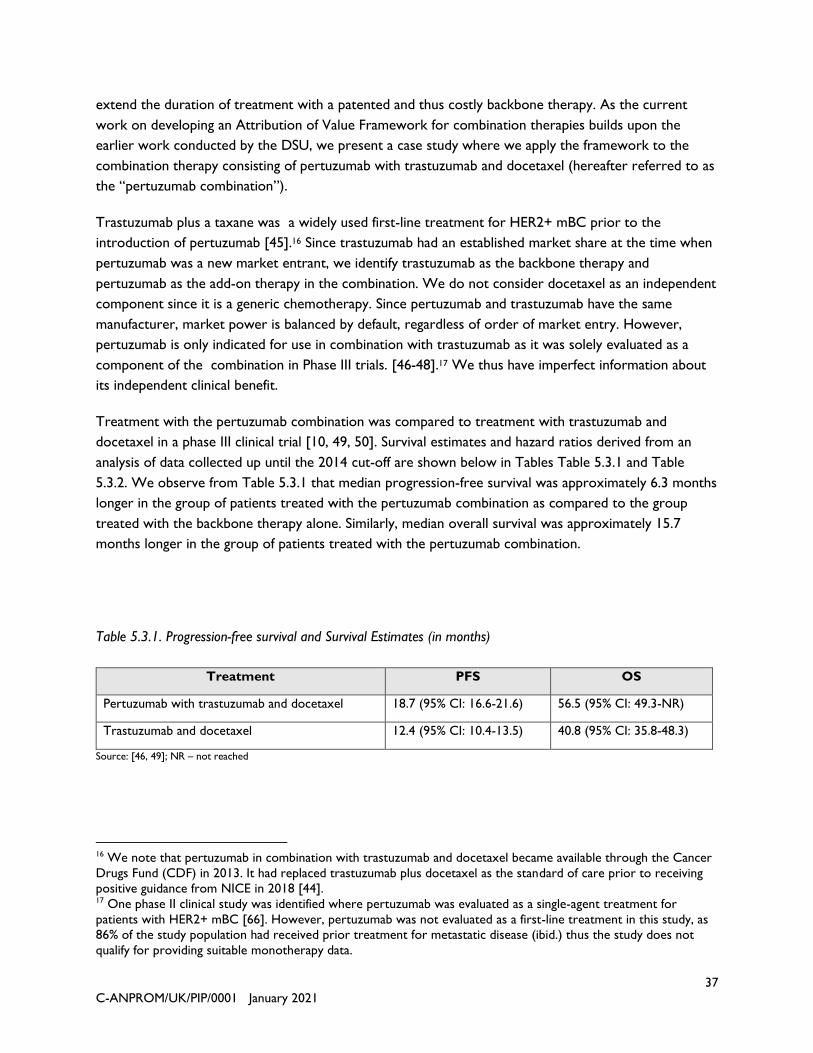
37 C-ANPROM/UK/PIP/0001 January 2021
extend the duration of treatment with a patented and thus costly backbone therapy. As the current
work on developing an Attribution of Value Framework for combination therapies builds upon the
earlier work conducted by the DSU, we present a case study where we apply the framework to the
combination therapy consisting of pertuzumab with trastuzumab and docetaxel (hereafter referred to as
the “pertuzumab combination”).
Trastuzumab plus a taxane was a widely used first-line treatment for HER2+ mBC prior to the
introduction of pertuzumab [45].16 Since trastuzumab had an established market share at the time when
pertuzumab was a new market entrant, we identify trastuzumab as the backbone therapy and
pertuzumab as the add-on therapy in the combination. We do not consider docetaxel as an independent
component since it is a generic chemotherapy. Since pertuzumab and trastuzumab have the same
manufacturer, market power is balanced by default, regardless of order of market entry. However,
pertuzumab is only indicated for use in combination with trastuzumab as it was solely evaluated as a
component of the combination in Phase III trials. [46-48].17 We thus have imperfect information about
its independent clinical benefit.
Treatment with the pertuzumab combination was compared to treatment with trastuzumab and
docetaxel in a phase III clinical trial [10, 49, 50]. Survival estimates and hazard ratios derived from an
analysis of data collected up until the 2014 cut-off are shown below in Tables Table 5.3.1 and Table
5.3.2. We observe from Table 5.3.1 that median progression-free survival was approximately 6.3 months
longer in the group of patients treated with the pertuzumab combination as compared to the group
treated with the backbone therapy alone. Similarly, median overall survival was approximately 15.7
months longer in the group of patients treated with the pertuzumab combination.
Table 5.3.1. Progression-free survival and Survival Estimates (in months)
Treatment PFS OS
Pertuzumab with trastuzumab and docetaxel 18.7 (95% CI: 16.6-21.6) 56.5 (95% CI: 49.3-NR)
Trastuzumab and docetaxel 12.4 (95% CI: 10.4-13.5) 40.8 (95% CI: 35.8-48.3)
Source: [46, 49]; NR – not reached
16 We note that pertuzumab in combination with trastuzumab and docetaxel became available through the Cancer
Drugs Fund (CDF) in 2013. It had replaced trastuzumab plus docetaxel as the standard of care prior to receiving
positive guidance from NICE in 2018 [44]. 17 One phase II clinical study was identified where pertuzumab was evaluated as a single-agent treatment for
patients with HER2+ mBC [66]. However, pertuzumab was not evaluated as a first-line treatment in this study, as
86% of the study population had received prior treatment for metastatic disease (ibid.) thus the study does not
qualify for providing suitable monotherapy data.
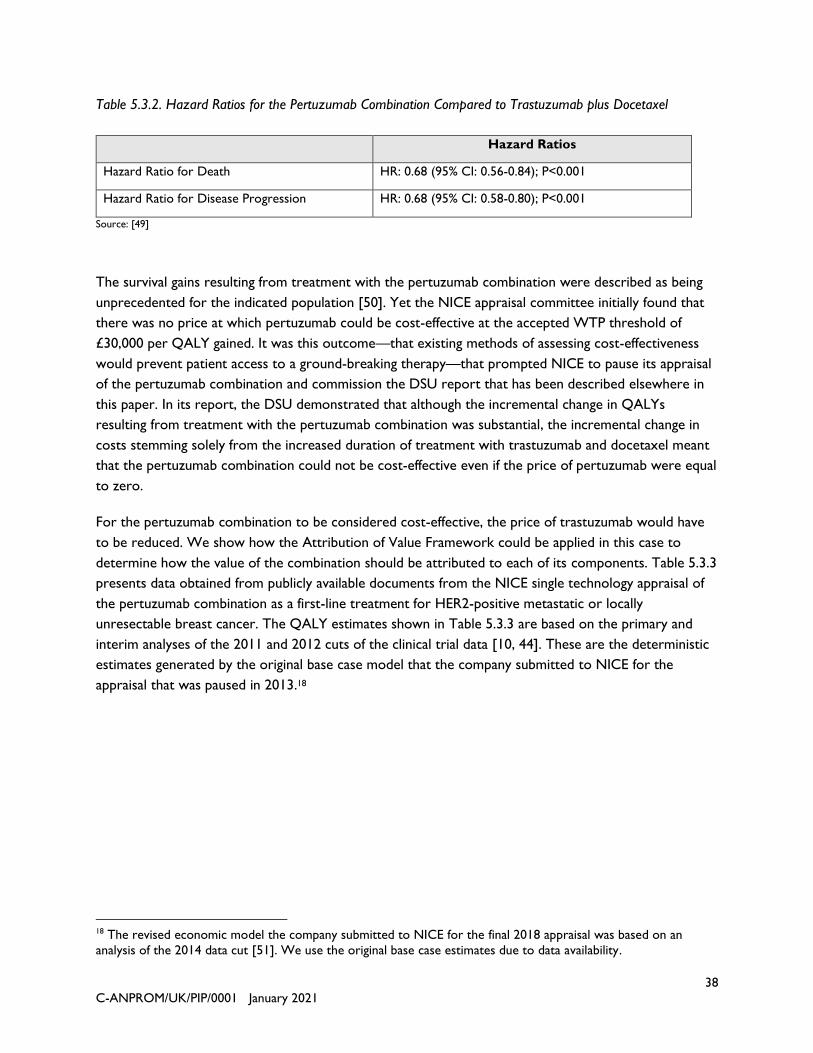
38 C-ANPROM/UK/PIP/0001 January 2021
Table 5.3.2. Hazard Ratios for the Pertuzumab Combination Compared to Trastuzumab plus Docetaxel
Hazard Ratios
Hazard Ratio for Death HR: 0.68 (95% CI: 0.56-0.84); P<0.001
Hazard Ratio for Disease Progression HR: 0.68 (95% CI: 0.58-0.80); P<0.001
Source: [49]
The survival gains resulting from treatment with the pertuzumab combination were described as being
unprecedented for the indicated population [50]. Yet the NICE appraisal committee initially found that
there was no price at which pertuzumab could be cost-effective at the accepted WTP threshold of
£30,000 per QALY gained. It was this outcome—that existing methods of assessing cost-effectiveness
would prevent patient access to a ground-breaking therapy—that prompted NICE to pause its appraisal
of the pertuzumab combination and commission the DSU report that has been described elsewhere in
this paper. In its report, the DSU demonstrated that although the incremental change in QALYs
resulting from treatment with the pertuzumab combination was substantial, the incremental change in
costs stemming solely from the increased duration of treatment with trastuzumab and docetaxel meant
that the pertuzumab combination could not be cost-effective even if the price of pertuzumab were equal
to zero.
For the pertuzumab combination to be considered cost-effective, the price of trastuzumab would have
to be reduced. We show how the Attribution of Value Framework could be applied in this case to
determine how the value of the combination should be attributed to each of its components. Table 5.3.3
presents data obtained from publicly available documents from the NICE single technology appraisal of
the pertuzumab combination as a first-line treatment for HER2-positive metastatic or locally
unresectable breast cancer. The QALY estimates shown in Table 5.3.3 are based on the primary and
interim analyses of the 2011 and 2012 cuts of the clinical trial data [10, 44]. These are the deterministic
estimates generated by the original base case model that the company submitted to NICE for the
appraisal that was paused in 2013.18
18 The revised economic model the company submitted to NICE for the final 2018 appraisal was based on an
analysis of the 2014 data cut [51]. We use the original base case estimates due to data availability.

39 C-ANPROM/UK/PIP/0001 January 2021
Table 5.3.3. Estimated QALYs and Total Costs for the Pertuzumab Combination and Backbone Therapy
Therapy Total
QALYs
∆QALYs Value
Docetaxel 1.81 ------- -------
Trastuzumab plus docetaxel 2.60 0.79 £23,700
Pertuzumab with trastuzumab and docetaxel 3.50 1.69 £50,700
Source: [51]
We use the QALY estimates shown in Table 5.3.3 to demonstrate how value would be attributed to
each of the component therapies in this scenario where market power is balanced but information is
imperfect. Substituting the QALYs produced by the company’s base case model into the framework
gives the following:
𝑄𝑇𝑅𝐴,𝐷𝑇𝑋 = 0.79
𝑄𝑃𝐸𝑅 = ?
𝑄𝑃𝐸𝑅,𝑇𝑅𝐴,𝐷𝑇𝑋 = 1.69
𝑄𝑇𝑅𝐴,𝐷𝑇𝑋 + 𝑄𝑃𝐸𝑅 = ?
Setting WTP equal to £30,000 per QALY gained, the value of the combination therapy and each of its
component therapies are as follows:
𝑣𝑇𝑅𝐴,𝐷𝑇𝑋 = £23,700
𝑣𝑃𝐸𝑅 = 𝜆 × 𝑄𝑃𝐸𝑅 = ?
𝑣𝑃𝐸𝑅,𝑇𝑅𝐴,𝐷𝑇𝑋 = £50,700
Since we do not have monotherapy data for pertuzumab in this setting and we do not know 𝑄𝑃𝐸𝑅, we
do not know the independent value of the add-on therapy, 𝑣𝑃𝐸𝑅 . We also do not know whether the
pertuzumab combination is strictly sub-additive, additive, or synergistic. This fact is illustrated below in
Figure 5.7.

40 C-ANPROM/UK/PIP/0001 January 2021
Figure 5.7. Value and Willingness-to-Pay for Pertuzumab with Trastuzumab and Docetaxel
Given this uncertainty, we assume that the combination is additive such that the following relation holds:
𝑄𝑃𝐸𝑅,𝑇𝑅𝐴,𝐷𝑇𝑋 = 𝑄𝑇𝑅𝐴,𝐷𝑇𝑋 + 𝑄𝑃𝐸𝑅 ⇒ 𝑄𝑃𝐸𝑅 = 𝑄𝑃𝐸𝑅,𝑇𝑅𝐴,𝐷𝑇𝑋 − 𝑄𝑇𝑅𝐴,𝐷𝑇𝑋
In the case of the current example, this implies that
1.69 = 0.79 + 𝑄𝑃𝐸𝑅 ⇒ 𝑄𝑃𝐸𝑅 = 0.90
Using the resulting value for 𝑄𝑃𝐸𝑅, we can solve the given value attribution problem as if we had perfect
information and market power were equal. The share of the value of the pertuzumab combination that
is attributed to each of the component therapies is given by the following:
𝑘𝑇𝑅𝐴,𝐷𝑇𝑋 =𝑄𝑇𝑅𝐴,𝐷𝑇𝑋
𝑄𝑇𝑅𝐴,𝐷𝑇𝑋 + 𝑄𝑃𝐸𝑅=
𝑄𝑇𝑅𝐴,𝐷𝑇𝑋𝑄𝑃𝐸𝑅,𝑇𝑅𝐴,𝐷𝑇𝑋
=0.79
1.69≈ 47%
𝑘𝑃𝐸𝑅 =𝑄𝑃𝐸𝑅
𝑄𝑇𝑅𝐴,𝐷𝑇𝑋 + 𝑄𝑃𝐸𝑅=𝑄𝑃𝐸𝑅,𝑇𝑅𝐴,𝐷𝑇𝑋 − 𝑄𝑇𝑅𝐴,𝐷𝑇𝑋
𝑄𝑃𝐸𝑅,𝑇𝑅𝐴,𝐷𝑇𝑋=0.90
1.69≈ 53%
Abbreviations: TRA,DTX – trastuzumab and docetaxel, PER,TRA,DTX –
combination therapy with pertuzumab plus trastuzumab and docetaxel,
WTP – willingness-to-pay (equals £30,000 per QALY gained).

41 C-ANPROM/UK/PIP/0001 January 2021
The resulting values for 𝑘𝑇𝑅𝐴,𝐷𝑇𝑋 and 𝑘𝑃𝐸𝑅 imply that £23,700 of the value of the pertuzumab
combination is attributed to trastuzumab plus docetaxel, and £27,000 is attributed to pertuzumab. This
is shown below in Figure 5.8. The value attributed to the backbone therapy equals its monotherapy
value since we assumed that the combination is additive. The remaining value of the incremental benefit
attained from treatment with the pertuzumab combination is fully attributed to pertuzumab.
Figure 5.8. Case Study: Imperfect Information and Balanced Market Power Solution
5.4. Imperfect information and imbalanced market power: carfilzomib with
lenalidomide and dexamethasone
Carfilzomib with lenalidomide and dexamethasone is indicated for the treatment of patients with
multiple myeloma (MM) who have received one or more prior lines of therapy [52]. At the time when
the carfilzomib combination was being appraised by NICE, lenalidomide with dexamethasone
(lenalidomide-dexamethasone) had been appraised and recommended for the treatment of patients with
MM who have received two or more prior lines of therapy [53]. We therefore restrict our analysis to
the population of patients with MM who have received two or more prior lines of therapy and no prior
treatment with lenalidomide.
Abbreviations: TRA,DTX – trastuzumab and docetaxel, PER,TRA,DTX –
combination therapy with pertuzumab plus trastuzumab and docetaxel,
WTP – willingness-to-pay (equals £30,000 per QALY gained).

42 C-ANPROM/UK/PIP/0001 January 2021
Lenalidomide-dexamethasone has been evaluated as a treatment for relapsed or refractory (RR) MM in
phase III clinical trials [54, 55], so we have information about its independent benefit for the given
indication. Although single-agent carfilzomib has been evaluated as a treatment for RRMM, these were
small sample studies that followed a different dosing schedule than the carfilzomib combination under
consideration or included patients who received prior treatment with lenalidomide [56-60]. We thus do
not have information about the independent benefit attained from treatment with single-agent
carfilzomib for the given indication. Since carfilzomib and lenalidomide have different manufacturers, and
lenalidomide-dexamethasone was an established therapy for RRMM when carfilzomib entered the
market [52], the carfilzomib combination reflects a scenario where there is imperfect information and an
imbalance of market power. We identify lenalidomide-dexamethasone as the backbone therapy in this
case since it was registered first, and carfilzomib as the add-on therapy. Because it is an inexpensive
medicine, we consider that dexamethasone is a negligible component of the combination therapy which
could therefore be disregarded.
Survival estimates from the phase III trial that compared treatment with the carfilzomib combination to
treatment with lenalidomide-dexamethasone are shown below in Table 5.4.1. The corresponding hazard
ratio estimates are shown in Table 5.4.2. These estimates are based on trial data collected until the final
April 2017 cut-off.19 We note that these results were for the entire sample of patients included in the
study and are not specific to patients who received two or more prior lines of therapy.
Table 5.4.1. Progression-free survival and Survival Estimates (in months)
Treatment PFS OS
Carfilzomib with lenalidomide-dexamethasone 26.1 (95% CI: 23.2-30.3) 48.3 (95% CI: 42.4-52.8)
Lenalidomide-dexamethasone 16.6 (95% CI: 14.5-19.4) 40.4 (95% CI: 33.6-44.4)
Source: [55]
Table 5.4.2. Hazard Ratios for the Carfilzomib Combination Compared to Lenalidomide-Dexamethasone
Hazard Ratios
Hazard Ratio for Death HR: 0.79 (95% CI: 0.67-0.95); P=.0045
Hazard Ratio for Disease Progression HR: 0.66 (95% CI: 0.55-0.78); P<.001
Source: [55]
19 The QALY estimates reported in Table 5.4.3 are based on the interim analysis of trial data collected until the
June 2014 cut-off [54, 61].

43 C-ANPROM/UK/PIP/0001 January 2021
As described in the NICE submission, the carfilzomib combination is an example of a scenario where an
add-on drug combined with an existing backbone therapy is not cost-effective even when the price of
the add-on equals zero [61], Patients are treated with the carfilzomib combination until disease-
progression or unacceptable toxicity occurs. Since progression-free survival was roughly 9.5 months
longer in the combination therapy arm compared to the backbone arm of the phase III trial, the duration
of treatment with lenalidomide was longer on average in the group of patients treated with the
carfilzomib combination. This shows that, even without accounting for the cost of carfilzomib,
treatment costs are higher for carfilzomib combination therapy due to the additional lenalidomide.
Furthermore, in this case the backbone therapy met the end-of-life criteria during its own appraisal and
was priced according to the higher WTP threshold, whereas the combination therapy did not meet the
criteria because the life-expectancy of the patients eligible for the combination therapy was now longer
than 24 months. These factors made it challenging for the carfilzomib combination to be considered
cost-effective.
Table 5.4.3 contains QALY estimates that were obtained from publicly available documents from the
2017 NICE appraisal for the carfilzomib combination and the 2009 appraisal for lenalidomide-
dexamethasone for previously treated multiple myeloma [57, 58]. These estimates are specific to the
subgroup of patients who received two prior therapies and no prior lenalidomide. This finding again
highlights how combination therapies often fail to be cost-effective because gains in progression-free
survival increase the duration of treatment with the backbone therapy, which generates additional costs
[1, 12, 61]. This is further complicated due to the imbalance of market power as the combination
components are manufactured by different companies.
Table 5.4.3. QALYs and Total Costs for Patients who Received Two or More Prior lines of Therapy20
Therapy Total
QALYs ∆QALYs Value
Dexamethasone 0.87 ------- -------
Lenalidomide-dexamethasone 3.33 2.46 £73,800
Carfilzomib with lenalidomide-dexamethasone 4.32 3.45 £103,500
Source: [61, 62]
Substituting the incremental QALY estimates from Table 5.4.3 into the Attribution of Value Framework
gives the following:21
20 These estimates reflect the results generated by the companies’ original base case models. 21 Abbreviations: LEN,DEX – lenalidomide-dexamethasone; CFZ – carfilzomib; CFZ,LEN,DEX – combination
therapy with carfilzomib and lenalidomide-dexamethasone /

44 C-ANPROM/UK/PIP/0001 January 2021
𝑄𝐿𝐸𝑁,𝐷𝐸𝑋 = 2.46
𝑄𝐶𝐹𝑍 = ?
𝑄𝐶𝐹𝑍,𝐿𝐸𝑁,𝐷𝐸𝑋 = 3.45
𝑄𝐿𝐸𝑁,𝐷𝐸𝑋 + 𝑄𝐶𝐹𝑍 = ?
Setting WTP equal to £30,000 per QALY gained, the value of the combination therapy and each of its
component drugs are as follows:
𝑣𝐿𝐸𝑁,𝐷𝐸𝑋 = £73,800
𝑣𝐶𝐹𝑍 = ?
𝑣𝐶𝐹𝑍,𝐿𝐸𝑁,𝐷𝐸𝑋 = £103,500
Since we do not have appropriate monotherapy data on carfilzomib in this setting, we do not know
𝑄𝐶𝐹𝑍, and so we do not know the independent value of the add-on therapy, 𝑣𝐶𝐹𝑍. We also do not know
whether the carfilzomib combination is strictly sub-additive, additive, or synergistic. This is illustrated
below in Figure 5.9.
Figure 5.9. Value and Willingness-to-Pay for Carfilzomib with Lenalidomide and Dexamethasone
Abbreviations: LEN,DEX – lenalidomide and dexamethasone, CFZ,LEN,DEX –
combination therapy with carfilzomib plus lenalidomide and dexamethasone,
WTP – willingness-to-pay (equals £30,000 per QALY gained).

45 C-ANPROM/UK/PIP/0001 January 2021
If we assume that the combination is additive, then the following relation holds:
𝑄𝐶𝐹𝑍,𝐿𝐸𝑁,𝐷𝐸𝑋 = 𝑄𝐿𝐸𝑁,𝐷𝐸𝑋 + 𝑄𝐶𝐹𝑍 ⇒ 𝑄𝐶𝐹𝑍 = 𝑄𝐶𝐹𝑍,𝐿𝐸𝑁,𝐷𝐸𝑋 − 𝑄𝐿𝐸𝑁,𝐷𝐸𝑋
In the case of the current example, this implies that
3.45 = 2.46 + 𝑄𝐶𝐹𝑍 ⇒ 𝑄𝐶𝐹𝑍 = 0.99
Suppose that the negotiable share of the combination therapy is predefined such that22:
{
𝑄𝐿𝐸𝑁,𝐷𝐸𝑋𝑄𝐶𝐹𝑍,𝐿𝐸𝑁,𝐷𝐸𝑋
≤ 𝑘𝐿𝐸𝑁,𝐷𝐸𝑋 ≤ (1 + 𝑝) ⋅𝑄𝐿𝐸𝑁,𝐷𝐸𝑋
𝑄𝐶𝐹𝑍,𝐿𝐸𝑁,𝐷𝐸𝑋, if
𝑄𝐿𝐸𝑁,𝐷𝐸𝑋𝑄𝐶𝐹𝑍,𝐿𝐸𝑁,𝐷𝐸𝑋
< 0.50, 𝑤here 𝑝 = 0.10
𝑘𝐿𝐸𝑁,𝐷𝐸𝑋 =𝑄𝐿𝐸𝑁,𝐷𝐸𝑋
𝑄𝐶𝐹𝑍,𝐿𝐸𝑁,𝐷𝐸𝑋 , if
𝑄𝐿𝐸𝑁,𝐷𝐸𝑋𝑄𝐶𝐹𝑍,𝐿𝐸𝑁,𝐷𝐸𝑋
≥ 0.50
Since 𝑄𝐿𝐸𝑁,𝐷𝐸𝑋
𝑄𝐶𝐹𝑍,𝐿𝐸𝑁,𝐷𝐸𝑋≈ 0.71 > .050, we obtain the following solution to the value attribution problem:
𝑘𝐿𝐸𝑁,𝐷𝐸𝑋 =𝑄𝐿𝐸𝑁,𝐷𝐸𝑋
𝑄𝐶𝐹𝑍,𝐿𝐸𝑁,𝐷𝐸𝑋=2.46
3.45≈ 71%
𝑘𝐶𝐹𝑍 =𝑄𝐶𝐹𝑍,𝐿𝐸𝑁,𝐷𝐸𝑋 − 𝑄𝐿𝐸𝑁,𝐷𝐸𝑋
𝑄𝐶𝐹𝑍,𝐿𝐸𝑁,𝐷𝐸𝑋=0.99
3.45≈ 29%
This is the same solution that we would obtain if market power were balanced. The resulting values for
𝑘𝐿𝐸𝑁,𝐷𝐸𝑋 and 𝑘𝐶𝐹𝑍 imply that £73,800 of the value of the carfilzomib combination is attributed to
lenalidomide plus dexamethasone, and £29,700 is attributed to carfilzomib. This is shown below in
Figure 5.10. The value attributed to the backbone therapy, 71%, equals its monotherapy value since we
assumed that the combination is additive. The remaining value of the incremental benefit, 29%, attained
from treatment with the carfilzomib combination is attributed to carfilzomib.
22 Note that we set 𝑝 equal to 0.10 arbitrarily for illustrative purposes only. This implies that the manufacturer of
lenalidomide plus dexamethasone may negotiate for an additional (0.10 ×𝑄𝐿𝐸𝑁,𝐷𝐸𝑋
𝑄𝐶𝐹𝑍,𝐿𝐸𝑁,𝐷𝐸𝑋× 100) percent of the value
of the combination therapy if 𝑄𝐿𝐸𝑁,𝐷𝐸𝑋
𝑄𝐶𝐹𝑍,𝐿𝐸𝑁,𝐷𝐸𝑋< 0.50.

46 C-ANPROM/UK/PIP/0001 January 2021
Figure 5.10. Case Study: Imperfect Information and Balanced Market Power Scenario
Abbreviations: LEN,DEX – lenalidomide and dexamethasone, CFZ,LEN,DEX –
combination therapy with carfilzomib plus lenalidomide and dexamethasone,
WTP – willingness-to-pay (equals £30,000 per QALY gained).

47 C-ANPROM/UK/PIP/0001 January 2021
6. Discussion
This Whitepaper has outlined a potential framework for attributing the value of independent products
used in combination. One of the advantages of the framework is that it is independent of price and
focuses on the QALY. As is described in section 4.1, it is possible to consider a QALY equivalent of all
the impacts of a combination product – including any cost-savings. Together, this ‘net-QALY’ represents
the value of a new treatment in health terms and is easily converted to a monetary value by multiplying
by the threshold willingness to pay for a QALY. This monetised value of the net-health consequences
becomes the maximum (differential) price that the health system should be willing to pay for the
combination treatment. Thus, the framework as proposed avoids the complications of judging whether
the existing price charged for a product is ‘fair’ and does not require knowledge of potentially
confidential patient access schemes. While users may be unfamiliar with this particular formulation of
the cost-effectiveness decision problem, it is a simple rearrangement of the existing decision rules and
therefore is entirely consistent with the existing decision-making framework used by HTA bodies such
as NICE.
In the case studies presented in section 5, the incremental QALY estimates used are those reported in
the corresponding technology appraisal documents without an attempt to include the net-QALY
concept identified above. This simplification was judged expedient in the context of this Whitepaper and
in light of the fact that the case studies as presented were based only on information publicly available
from the technology appraisal documentation. Notwithstanding this simplification in the case studies
presented, the generalisability of the framework remains and should not form an impediment to the use
of the value attribution formulae as presented. However, further consideration must be given to
questions related to the evaluation and selection of clinical evidence such as whether we have ‘perfect
information’ if one of the component therapies has only been studied for a subgroup of the larger
population for which the combination therapy is indicated. Treatment patterns and outcomes often vary
based on histology and biomarker status, for example, and this introduces additional layers of
complexity that we do not consider here.
Overall, the framework requires an accepted health economic model of the combination therapy and its
component parts. This modelling exercise will face the usual challenges of evidence synthesis,
extrapolation beyond observed data and potentially the use of indirect comparisons. While not to be
underestimated, these are the usual tasks required of an economic modelling exercise for a submission
to a reimbursement HTA body such as NICE. We have not, therefore, focused on the (considerable)
methodological literature describing how these tasks might be conducted. We simply note that the
framework presented here does not require any additional modelling beyond that which would be
expected for an economic submission.
Although the principles of how to conduct the modelling are standard, a potential practical and legal
issue is the need for two independent companies to agree on a core model of the combination product
and their respective component therapies that make up the combination. In cases of imperfect
information and unbalanced market power, predefining the combination therapy’s negotiable share

48 C-ANPROM/UK/PIP/0001 January 2021
would be an important but potentially contentious step. The need for agreement is a significant practical
hurdle, which is further complicated by existing anti-trust legislation designed to prevent price-collusion
that limits the ability of individual companies to collaborate on pricing strategies. This emphasises the
importance of the companion ‘voluntary arbitration Whitepaper’ that provides a road map for
negotiations. The framework presented here should be seen as a starting point for those negotiations.
In applying the standard rules of cost-effectiveness analysis, the framework proposed here makes use of
the maximum willingness to pay for health gain. The appropriate value of this metric is hotly debated in
terms of what is appropriate for a health system to use in guiding its decision making. Is it the
(perceived) social value of a QALY? Or is it, as suggested by theory, the value of the marginally displaced
intervention in a budget constrained health system? In discussing the framework itself, we conditioned
out the value of this threshold. The implicit assumption was that this has already been set by the HTA
agency involved; as the case studies presented were based on NICE single technology appraisals, the
upper end of NICE’s standard WTP threshold of £30,000/QALY were applied. We nevertheless
assumed that the price of the two component products would add up to a level that is not supported by
the health gains from the combination (at least in the non-synergistic ‘sub additive’ scenario).
It is worth noting that to implement the framework, cooperation between all parties will be required. It
is likely that individual company stakeholders will be asked to accept a price reduction when it comes to
the use of their products in combination, at least for many scenarios. We note the additional challenge
that arises when one or more component therapies met the criteria to be appraised at a higher WTP
threshold, but the combination therapy is appraised at the standard threshold. It is possible that the
HTA authority could consider raising the threshold as an inducement for all parties to come to the
negotiating table, although discussions emerging from the Bellberry workshop suggest that this approach
is unlikely to be implemented in practice [2]. Although the incentive for the backbone manufacturer to
participate is vital to the implementation of any solution to the combination medicines issue, and is an
important aspect to be discussed as part of the arbitration process, it is beyond the scope of this paper.
Understanding of the issues that make it challenging for combination therapies to demonstrate
economic value has deepened considerably since the NICE DSU first showed how clinically effective
combination therapies can fail to be cost-effective even if the price of an add-on component equals zero.
Many stakeholders have been involved in efforts to identify additional challenges and potential solutions
to the problems inherent to valuing and paying for combination therapies. Such stakeholders include the
participants at the recent Bellberry workshop, who identified a need for research on methods of value
attribution to serve as the basis for pricing negotiations. The Attribution of Value Framework presented
in this paper, which has been developed with input from a diverse group of stakeholders, is one such
method that we put forth for consideration and discussion.

49 C-ANPROM/UK/PIP/0001 January 2021
7. References
[1] Davis S. Assessing Technologies That Are Not Cost-Effective at a Zero Price. NICE Decis Support Unit Rep 2014; 1–36.
[2] Latimer N, Pollard D, Towse A, et al. Challenges in valuing and paying for combination regimens in oncology. Report of an international workshop convened by Bellberry, held on November 18-20, in Sydney, Australia. 2020; 1–26.
[3] Persson U, Norlin JM. Multi-indication and Combination Pricing and Reimbursement of Pharmaceuticals: Opportunities for Improved Health Care through Faster Uptake of New Innovations. Appl Health Econ Health Policy 2018; 16: 157–165.
[4] Brockbank T, Granzow H, Czira A. Combination therapy for melanoma: What are the current challenges in pricing & access from EU and US payers’ perspective? 2019.
[5] Yendewa GA, Salata RA. Ready for HIV Dual Therapy? - New Data from IAS 2017. AIDS Rev 2017; 19: 175.
[6] Greber D, Vaidyanathan S. The Challenge of Pricing Combination Therapies. BCG Perspect.
[7] Mokhtan, RB, Homayouni, TS, Baluch, N, et al. Combination therapy in combating cancer. Oncotarget. 2017; 8(23): 38022–38043.
[8] Danko D, Blay J-Y, Garrison LP. Challenges in the value assessment, pricing and funding of targeted combination therapies in oncology. Health Policy (New York) 2019; 1–7.
[9] Kanavos P. Combination Treatments in Oncology: Ensuring patients get access to the treatments they need. 2019; 1–6.
[10] Baselga J, Cortés J, Kim SB, et al. Pertuzumab plus trastuzumab plus docetaxel for metastatic breast cancer. N Engl J Med 2012; 366: 109–119.
[11] Gandhi, L, Rodríguez-Abreu, D, Gadgeel, S, et al. Pembrolizumab plus chemotherapy in metastatic non-small-cell lung cancer. N Engl J Med 2018; 378:2078-2092.
[12] Davis S, Akehurst R. How Do We Evaluate Technologies That Are Not Cost Effective at Zero Price? Values & Outcomes Spotlight 2016; 4: 6–8.
[13] Drummond M, Sculpher M, Torrance G, et al. Methods for the Economic Evaluation of Health Care Programmes. 3rd ed. Oxford: Oxford University Press, 2005.
[14] Stinnett A, Mullahy J. Net health benefits: a new framework for the analysis of uncertainty in cost-effectiveness analysis. Med Decis Mak 1998; 18: S68-80.
[15] Weinstein MC, Stason WB. Foundations of Cost-Effectiveness Analysis for Health and Medical Practices. N Engl J Med 1977; 296: 716–721.

50 C-ANPROM/UK/PIP/0001 January 2021
[16] Mestre J, Néboa F, Bleric Z, et al. Multi‑Indication Pricing: Nice in Theory but Can it Work in Practice? Pharmacoeconomics 2018; 36: 1407–1420.
[17] Ernst & Young. Think like a patient act like a tax payer The case for multi-indication discounting in immuno-oncology. 2018.
[18] Roche. Herceptin Summary of Product Characteristics
[19] National Institute for Health and Care Excellence. Guidance on the use of trastuzumab for the treatment of advanced breast cancer (TA34). 2002.
[20] Bristol Myers Squibb. Opdivo Summary of Product Characteristics
[21] Bristol Myers Squibb. Yervoy Summary of Product Characteristics
[22] Hodi FS, O’Day SJ, McDermott DF, et al. Improved survival with ipilimumab in patients with metastatic melanoma. N Engl J Med 2010; 363: 711–723.
[23] Robert C, Long G V., Brady B, et al. Nivolumab in previously untreated melanoma without BRAF mutation. N Engl J Med 2015; 372: 320–330.
[24] Larkin J, Chiarion-Sileni V, Gonzalez R, et al. Combined nivolumab and ipilimumab or monotherapy in untreated Melanoma. N Engl J Med 2015; 373: 23–34.
[25] Hodi FS, Chiarion-Sileni V, Gonzalez R, et al. Nivolumab plus ipilimumab or nivolumab alone versus ipilimumab alone in advanced melanoma (CheckMate 067): 4-year outcomes of a multicentre, randomised, phase 3 trial. Lancet Oncol 2018; 19: 1480–1492.
[26] National Institute for Health and Care Excellence. Nivolumab for treating advanced (unresectable or metastatic) melanoma: Final scope. 2015.
[27] National Institute for Health and Care Excellence. Nivolumab for treating advanced (unresectable or metastatic) melanoma (TA384). 2016.
[28] National Institute for Health and Care Excellence. Nivolumab combination with ipilimumab for treating advanced (unresectable or metastatic) melanoma (TA400). 2016.
[29] Larkin J, Chiarion-Sileni V, Gonzalez R, et al. Five-year survival with combined nivolumab and ipilimumab in advanced melanoma. N Engl J Med 2019; 381: 1535–1546.
[30] National Institute for Health and Care Excellence. Single Technology Appraisal: STA Nivolumab in combination with ipilimumab for treating advanced melanoma [ID848] (Committee papers). 2016.
[31] National Institute for Health and Care Excellence. Single Technology Appraisal: Nivolumab for treating advanced (unresectable or metastatic) melanoma [ID845] (committee papers). 2016.
[32] Merck, Sharp & Dohme. Keytruda Summary of Product Characteristics.
[33] National Institute for Health and Care Excellence. Pembrolizumab with pemetrexed and platinum
51 C-ANPROM/UK/PIP/0001 January 2021
chemotherapy for untreated, metastatic, non-squamous non-small-cell lung cancer (TA557). 2019
[34] National Institute for Health and Care Excellence. Pembrolizumab for untreated PD-L1-positive metastatic non-small-cell lung cancer (TA531). 2018.
[35] Eli Lilly. Alimta Summary of Product Characteristics.
[36] National Institute for Health and Care Excellence. Pemetrexed for the first-line treatment of non-small-cell lung cancer (TA181). 2009.
[37] Gandhi L, Rodríguez-Abreu D, Gadgeel S, et al. Pembrolizumab plus Chemotherapy in Metastatic Non–Small-Cell Lung Cancer. N Engl J Med 2018; 378: 2078–2092.
[38] Gadgeel S, Rodriguez-Abreu D, Speranza G, et al. Updated Analysis From KEYNOTE-189: Pembrolizumab or Placebo Plus Pemetrexed and Platinum for Previously Untreated Metastatic Nonsquamous Non – Small-Cell Lung Cancer. J Clin Oncol 2020; 38: 1–15.
[39] Reck M, Rodriguez-Abreu D, Robinson AG, et al. Updated Analysis of KEYNOTE-024: Pembrolizumab Versus Platinum-Based Chemotherapy for Advanced Non – Small-Cell Lung Cancer With PD-L1 Tumor Proportion Score of 50% or Greater. J Clin Oncol 2019; 37: 537–548.
[40] Mok TSK, Wu Y-L, Kudaba I, et al. Pembrolizumab versus chemotherapy for previously untreated, PD-L1-expressing, locally advanced or metastatic non-smallcell lung cancer (KEYNOTE-042): A randomised, open-label, controlled, phase 3 trial. Lancet 2019; 393: 1819–1830.
[41] National Institute for Health and Care Excellence. Single Technology Appraisal (STA): Pemetrexed for the first line treatment of non-small cell lung cancer (Manufacturer Submission). 2008.
[42] Scott DA, Clegg A, Sidhu M, et al. Clinical and Cost Effectiveness of Paclitaxel, Docetaxel, Gemcitabine and Vinorelbine in Lung Cancer (TA26). NHS HTA Program Rep 2001; 1–182.
[43] National Institute for Health and Care Excellence. Single Technology Appraisal (STA): Pembrolizumab with pemetrexed and platinum chemotherapy for untreated lung cancer [ID1173] (Committee Papers). 2018.
[44] National Institute for Health and Care Excellence. Pertuzumab with trastuzumab and docetaxel for treating HER2-positive breast cancer. Technology appraisal guidance [TA509]. 2018.
[45] National Institute for Health and Care Excellence. Single Technology Appraisal: Pertuzumab in combination with trastuzumab and docetaxel for treating HER2-positive metastatic or locally recurrent unresectable breast cancer [ID523]. 2017.
[46] Swain SM, Kim S-B, Cortes J, et al. Overall survival benefit with pertuzumab, trastuzumab, and docetaxel for HER2-positive metastatic breast cancer in CLEOPATRA, a randomised Phase 3 study. Lancet Oncol 2013; 14: 461–471.
[47] Hurvitz, SA, Martin, M, Symmons, WF, et al. Neoadjuvant trastuzumab, pertuzumab, and chemotherapy versus trastuzumab emtansine plus pertuzumab in patients with HER2-positive breast cancer (KRISTINE): a randomised, open-label, multicentre, phase 3 trial Lancet Oncol.
52 C-ANPROM/UK/PIP/0001 January 2021
2018;19(1):115-126
[48] Woodward, N, de Boer, RH, Redfern, R, et al. Results From the First Multicenter, Open-label, Phase IIIb Study Investigating the Combination of Pertuzumab With Subcutaneous Trastuzumab and a Taxane in Patients With HER2-positive Metastatic Breast Cancer (SAPPHIRE). Clin Breast Cancer. 2019;19(3):216-224.
[49] Swain SM, Baselga J, Kim S-B, et al. Pertuzumab, Trastuzumab, and Docetaxel in HER2-Positive Metastatic Breast Cancer. N Engl J Med. 2015; 372: 724–734.
[50] National Institute for Health and Care Excellence. Pertuzumab with trastuzumab and docetaxel for treating HER2-positive breast cancer. Final appraisal determination (TA509). 2018.
[51] National Institute for Health and Care Excellence. Single Technology Appraisal: Pertuzumab in combination with trastuzumab and docetaxel for treating HER2-positive metastatic or locally recurrent unresectable breast cancer [ID523]. 2017.
[52] Amgen. Kyprolis Summary of Product Characteristics
[53] National Institute for Health and Care Excellence. Lenalidomide for the treatment of multiple myeloma in people who have received at least 2 prior therapies (TA171). 2009.
[54] Stewart AK, Rajkumar SV, Dimopoulos MA, et al. Carfilzomib, lenalidomide, and dexamethasone for relapsed multiple myeloma. N Engl J Med 2015; 372: 142–152.
[55] Siegel DS, Dimopoulos MA, Ludwig H, et al. Improvement in overall survival with carfilzomib, lenalidomide, and dexamethasone in patients with relapsed or refractory multiple myeloma. J Clin Oncol 2018; 36: 728–734.
[56] Vij R, Siegel DS, Jagannath S, Jakubowiak AJ S, AK, McDonagh K, Bahlis N, Belch A K LA, Wear S, Wong AF WM. An open-label, single-arm, phase 2 study of single-agent carfilzomib in patients with relapsed and/or refractory multiple myeloma who have been previously treated with bortezomib. Br J Haematol 2012; 158: 739–748.
[57] Siegel DS, Martin T, Wang M, et al. A phase 2 study of single-agent carfilzomib (PX-171-003-A1) in patients with relapsed and refractory multiple myeloma. Blood 2012; 120: 2817–2825.
[58] Jagannath S, Vij R, Stewart AK, Trudel S JA, Reiman T, Somlo G, Bahlis N, Lonial S, Kunkel LA W, A, Orlowski RZ SD. An open-label single-arm pilot phase II study (PX-171-003-A0) of low-dose, single-agent carfilzomib in patients with relapsed and refractory multiple myeloma. Clin Lymphoma, Myeloma, Leuk 2012; 12: 310–8.
[59] Hájek R, Masszi T, Petrucci MT, et al. A randomized phase III study of carfilzomib vs low-dose corticosteroids with optional cyclophosphamide in relapsed and refractory multiple myeloma (FOCUS). Leukemia 2017; 31: 107–113.
[60] Lendvai N, Hilden P, Devlin S, et al. A phase 2 single-center study of carfilzomib 56 mg/m2 with or without low-dose dexamethasone in relapsed multiple myeloma. Blood 2014; 124: 899–906.

53 C-ANPROM/UK/PIP/0001 January 2021
[61] National Institute for Health and Care Excellence. Single Technology Appraisal (STA): Carfilzomib for previously treated multiple myeloma [TA457] (Commitee Papers). 2017.
[62] Celgene Limited. Lenalidomide (Revlimid) for multiple myeloma in people who have received at least one prior therapy. Single technology appraisal (STA) submission to the National Institute for Health and Clinical Excellence. 2008.
[63] National Institute for Health and Care Excellence. Nivolumab with ipilimumab for untreated advanced renal cell carcinoma (TA581). 2019.
[64] National Institute for Health and Care Excellence. Nivolumab with ipilimumab for untreated unresectable malignant pleural mesothelioma [ID1609].
[65] Reck M, Rodríguez-Abreu D, Robinson AG, Het al. KEYNOTE-024 Investigators. Pembrolizumab versus Chemotherapy for PD-L1-Positive Non-Small-Cell Lung Cancer. N Engl J Med. 2016;375(19):1823-1833.
[66] Corteś J, Fumoleau P, Bianchi GV, et al. Pertuzumab monotherapy after trastuzumab-based treatment and subsequent reintroduction of trastuzumab: Activity and tolerability in patients with advanced human epidermal growth factor receptor 2-positive breast cancer. J Clin Oncol 2012; 30: 1594–1600.