Embed Size (px)
Citation preview
1378.0
Information Paper
Measuring Social Capital
An Australian Framework andIndicators
2004
w w w . a b s . g o v . a u

NewIssue
AUST R A L I A N BUR E A U OF STA T I S T I C S
EMBAR G O : 11 . 30 A M (CAN B E R R A T IME ) WED 11 FEB 2004
R . W . E d w a r d s
A c t i n g A u s t r a l i a n S t a t i s t i c i a n
Information Paper
Measuring Social Capital
An Australian Framework andIndicators
2004

! For further information about these and related statistics, contact the NationalInformation and Referral Service on 1300 135 070 or Elizabeth Davis on Canberra(02) 6252 7880.
I N Q U I R I E S
Produced by the Austra l ian Bureau of Stat ist ics
In all cases the ABS must be acknowledged as the source when reproducing or
quoting any part of an ABS publ icat ion or other product.
This work is copyr ight. Apart from any use as permitted under the Copyright Act
1968 , no part may be reproduced by any process without prior written permission
from the Commonwealth. Requests and inquir ies concerning reproduct ion and rights
in this publ icat ion should be addressed to The Manager, Intermediary Management,
Austra l ian Bureau of Stat ist ics, Locked Bag 10, Belconnen ACT 2616, by telephone
(02) 6252 6998, fax (02) 6252 7102, or email :
© Commonwealth of Austral ia 2004
ISBN 0 642 47937 2
ABS Catalogue No. 1378.0
107Isolation4.4 ! ! ! ! ! ! ! ! ! ! ! ! ! ! ! ! ! ! ! ! ! ! ! ! ! ! ! ! ! ! ! ! ! ! ! ! ! ! ! !106Linking4.3 ! ! ! ! ! ! ! ! ! ! ! ! ! ! ! ! ! ! ! ! ! ! ! ! ! ! ! ! ! ! ! ! ! ! ! ! ! ! ! ! !105Bridging4.2 ! ! ! ! ! ! ! ! ! ! ! ! ! ! ! ! ! ! ! ! ! ! ! ! ! ! ! ! ! ! ! ! ! ! ! ! ! ! ! !104Bonding4.1 ! ! ! ! ! ! ! ! ! ! ! ! ! ! ! ! ! ! ! ! ! ! ! ! ! ! ! ! ! ! ! ! ! ! ! ! ! ! ! !103Network types4 ! ! ! ! ! ! ! ! ! ! ! ! ! ! ! ! ! ! ! ! ! ! ! ! ! ! ! ! ! ! ! ! ! ! ! !101Applying sanctions3.4 ! ! ! ! ! ! ! ! ! ! ! ! ! ! ! ! ! ! ! ! ! ! ! ! ! ! ! ! ! ! ! ! ! !98Negotiation3.3 ! ! ! ! ! ! ! ! ! ! ! ! ! ! ! ! ! ! ! ! ! ! ! ! ! ! ! ! ! ! ! ! ! ! ! ! ! ! !94Sharing knowledge, information and introductions3.2 ! ! ! ! ! ! ! ! ! ! ! ! ! !91Common action3.1.3 ! ! ! ! ! ! ! ! ! ! ! ! ! ! ! ! ! ! ! ! ! ! ! ! ! ! ! ! ! ! ! ! ! ! ! !88Integration into the community3.1.2 ! ! ! ! ! ! ! ! ! ! ! ! ! ! ! ! ! ! ! ! ! ! ! ! ! !85Physical/financial assistance, emotional support and encouragement3.1.1 ! ! ! !85Sharing support3.1 ! ! ! ! ! ! ! ! ! ! ! ! ! ! ! ! ! ! ! ! ! ! ! ! ! ! ! ! ! ! ! ! ! ! ! !85Network transactions3 ! ! ! ! ! ! ! ! ! ! ! ! ! ! ! ! ! ! ! ! ! ! ! ! ! ! ! ! ! ! ! ! !81Power relationships2.5 ! ! ! ! ! ! ! ! ! ! ! ! ! ! ! ! ! ! ! ! ! ! ! ! ! ! ! ! ! ! ! ! ! !76Transience and mobility2.4 ! ! ! ! ! ! ! ! ! ! ! ! ! ! ! ! ! ! ! ! ! ! ! ! ! ! ! ! ! ! !74Density and openess2.3 ! ! ! ! ! ! ! ! ! ! ! ! ! ! ! ! ! ! ! ! ! ! ! ! ! ! ! ! ! ! ! ! !70Frequency/intensity and mode of communication2.2 ! ! ! ! ! ! ! ! ! ! ! ! ! ! !67Network size2.1 ! ! ! ! ! ! ! ! ! ! ! ! ! ! ! ! ! ! ! ! ! ! ! ! ! ! ! ! ! ! ! ! ! ! ! ! ! !67Network structure2 ! ! ! ! ! ! ! ! ! ! ! ! ! ! ! ! ! ! ! ! ! ! ! ! ! ! ! ! ! ! ! ! ! ! !63Economic participation1.2.5 ! ! ! ! ! ! ! ! ! ! ! ! ! ! ! ! ! ! ! ! ! ! ! ! ! ! ! ! ! ! ! !60Friendship1.2.4 ! ! ! ! ! ! ! ! ! ! ! ! ! ! ! ! ! ! ! ! ! ! ! ! ! ! ! ! ! ! ! ! ! ! ! ! ! ! ! !55Community support1.2.3 ! ! ! ! ! ! ! ! ! ! ! ! ! ! ! ! ! ! ! ! ! ! ! ! ! ! ! ! ! ! ! ! ! !49Civic participation1.2.2 ! ! ! ! ! ! ! ! ! ! ! ! ! ! ! ! ! ! ! ! ! ! ! ! ! ! ! ! ! ! ! ! ! ! !43Social participation1.2.1 ! ! ! ! ! ! ! ! ! ! ! ! ! ! ! ! ! ! ! ! ! ! ! ! ! ! ! ! ! ! ! ! ! !42Common purpose1.2 ! ! ! ! ! ! ! ! ! ! ! ! ! ! ! ! ! ! ! ! ! ! ! ! ! ! ! ! ! ! ! ! ! ! !38Acceptance of diversity and inclusiveness1.1.5 ! ! ! ! ! ! ! ! ! ! ! ! ! ! ! ! ! ! ! !36Cooperation1.1.4 ! ! ! ! ! ! ! ! ! ! ! ! ! ! ! ! ! ! ! ! ! ! ! ! ! ! ! ! ! ! ! ! ! ! ! ! ! !33Sense of efficacy1.1.3 ! ! ! ! ! ! ! ! ! ! ! ! ! ! ! ! ! ! ! ! ! ! ! ! ! ! ! ! ! ! ! ! ! ! ! !30Reciprocity1.1.2 ! ! ! ! ! ! ! ! ! ! ! ! ! ! ! ! ! ! ! ! ! ! ! ! ! ! ! ! ! ! ! ! ! ! ! ! ! ! !26Trust and trustworthiness1.1.1 ! ! ! ! ! ! ! ! ! ! ! ! ! ! ! ! ! ! ! ! ! ! ! ! ! ! ! ! ! !26Norms1.1 ! ! ! ! ! ! ! ! ! ! ! ! ! ! ! ! ! ! ! ! ! ! ! ! ! ! ! ! ! ! ! ! ! ! ! ! ! ! ! ! ! !26Network qualities1 ! ! ! ! ! ! ! ! ! ! ! ! ! ! ! ! ! ! ! ! ! ! ! ! ! ! ! ! ! ! ! ! ! ! !21Framework Elements and Indicators ! ! ! ! ! ! ! ! ! ! ! ! ! ! ! ! ! ! ! ! ! ! ! ! ! ! ! ! ! !
CH A P T E R 4
12A Framework for Social Capital ! ! ! ! ! ! ! ! ! ! ! ! ! ! ! ! ! ! ! ! ! ! ! ! ! ! ! ! ! ! ! ! !CH A P T E R 3
5Social Capital in Context ! ! ! ! ! ! ! ! ! ! ! ! ! ! ! ! ! ! ! ! ! ! ! ! ! ! ! ! ! ! ! ! ! ! ! ! ! !CH A P T E R 2
1Introduction ! ! ! ! ! ! ! ! ! ! ! ! ! ! ! ! ! ! ! ! ! ! ! ! ! ! ! ! ! ! ! ! ! ! ! ! ! ! ! ! ! ! ! ! ! !CH A P T E R 1
viiiAbbreviations ! ! ! ! ! ! ! ! ! ! ! ! ! ! ! ! ! ! ! ! ! ! ! ! ! ! ! ! ! ! ! ! ! ! ! ! ! ! ! ! ! ! !viiPreface ! ! ! ! ! ! ! ! ! ! ! ! ! ! ! ! ! ! ! ! ! ! ! ! ! ! ! ! ! ! ! ! ! ! ! ! ! ! ! ! ! ! ! ! ! ! ! !
page
A B S • ME A S U R I N G SO C I A L CA P I T A L , A N A U S T R A L I A N FR A M E W O R K A N D I N D I C A T O R S • 1 3 7 8 . 0 • 2 0 0 4 v
C O N T E N T S
150Bibliography ! ! ! ! ! ! ! ! ! ! ! ! ! ! ! ! ! ! ! ! ! ! ! ! ! ! ! ! ! ! ! ! ! ! ! ! ! ! ! ! ! ! ! !147Glossary ! ! ! ! ! ! ! ! ! ! ! ! ! ! ! ! ! ! ! ! ! ! ! ! ! ! ! ! ! ! ! ! ! ! ! ! ! ! ! ! ! ! ! ! ! !143Draft Group/Organisation Typology4 ! ! ! ! ! ! ! ! ! ! ! ! ! ! ! ! ! ! ! ! ! ! !118Example Questions From Existing Surveys3 ! ! ! ! ! ! ! ! ! ! ! ! ! ! ! ! ! ! !111Selected Social Capital Surveys2 ! ! ! ! ! ! ! ! ! ! ! ! ! ! ! ! ! ! ! ! ! ! ! ! ! !109Social and Other Capitals1 ! ! ! ! ! ! ! ! ! ! ! ! ! ! ! ! ! ! ! ! ! ! ! ! ! ! ! ! !
AP P E N D I C E S
page
v i A B S • ME A S U R I N G SO C I A L CA P I T A L , A N A U S T R A L I A N FR A M E W O R K A N D I N D I C A T O R S • 1 3 7 8 . 0 • 2 0 0 4
C O N T E N T S continued
De n n i s T r e w i n
Au s t r a l i a n S t a t i s t i c i a n
Social capital is a topic of considerable interest to a wide range of people because of its
links to individual and community wellbeing. There is as yet no internationally agreed
framework of what constitutes social capital, how it accumulates in society, the impacts
on communities and individuals, or how to measure the various elements and
dimensions of social capital. Following extensive consultation the Australian Bureau of
Statistics (ABS) has developed a broad conceptual framework for statistics on social
capital, as well as a set of possible indicators for measuring aspects of social capital.
These are described in this publication.
Social capital is a multi-dimensional concept, and different elements of the framework
may be appropriate for different purposes. Those interested in education or public
health, for instance, may focus on different areas from those whose interest is in
community renewal. The framework presented here provides a way of organising and
relating these different approaches.
The concept of social capital is also of interest to those concerned with the developing
knowledge-based economy. While the framework has relevance for economic
relationships, the indicators presented here are primarily focused on social rather than
economic relationships. Readers interested in the role of social capital in the economy
are referred to the publication Discussion Paper: Measuring a Knowledge-based
Economy and Society — An Australian Framework (cat. no. 1375.0).
The next step is to publish data in respect of the indicators. Some of the indicators have
been included in ABS collections and so national data is available. Some other data of
good quality may be available from other sources. It is expected that some data will be
available, through a web based release in mid-2004. Nethertheless, there will be no
suitable data available for some indicators.
The social capital framework is one of a number of social and cross-cutting frameworks
developed by the ABS in order to describe how various statistics relate to each other.
Measuring Wellbeing:Frameworks for Australian Social Statistics (cat. no. 4160.0)
draws social statistics together, while Measuring Australia's Progress (cat. no. 1370.0)
provides a set of economic, social and environmental progress indicators.
I would like to express special thanks to the external reviewers of this information paper:
Dr Michael Ackland of the Victorian Department of Human Services; Wendy Stone of the
Australian Housing and Urban Research Institute; and Rev Dr Philip Hughes of the
Christian Research Association. Suggestions and comments on this publication are
welcome. To express your views, please contact the Assistant Director, Community
Statistics, Family and Community Statistics Section, at the following address:
Australian Bureau of Statistics
Locked Bag 10
Belconnen ACT 2616
email: <[email protected]>
A B S • ME A S U R I N G SO C I A L CA P I T A L , A N A U S T R A L I A N FR A M E W O R K A N D I N D I C A T O R S • 1 3 7 8 . 0 • 2 0 0 4 v i i
P R E F A C E
World Health OrganizationWHO
Technical and Further EducationTAFE
short message serviceSMS
Royal Society for the Preventation of Cruelty to AnimalsRSPCA
Organisation for Economic Co-operation and DevelopmentOECD
Member of ParliamentMP
International Classification of Non-Profit InstitutionsICNPO
gross domestic productGDP
Australian National UniversityANU
Australian Institute of Family StudiesAIFS
Australian Bureau of StatisticsABS
v i i i A B S • ME A S U R I N G SO C I A L CA P I T A L , A N A U S T R A L I A N FR A M E W O R K A N D I N D I C A T O R S • 1 3 7 8 . 0 • 2 0 0 4
A B B R E V I A T I O N S
Interest in social capital has grown strongly over the last decade. In Australia, Eva Cox's
Boyer lectures, A Truly Civil Society (1995) gave social capital a high public profile. A few
months earlier, Robert Putnam's article, Bowling Alone: America's Declining Social
Capital (1995) had done the same in the United States of America. There had been an
emerging interest in some of the component ideas, under the name of citizenship, for
several years before. However, social capital combines a broader range of elements that
hold a society together, and is associated with potential positive outcomes for both
individuals and societies. At a time when the interdependence of many social problems
has been recognised, social capital appears to offer different insights to assist with
solutions.
More recently in Australia, the Productivity Commission has produced a paper Social
Capital: Reviewing the Concept and its Policy Implications. The Australian Institute of
Family Studies (AIFS) has also made a significant contribution to the development of
theoretically based and empirically valid social capital measures through its Social Capital
and Citizenship Project, the results and analysis of which are published in a research
paper Social capital: Empirical meaning and measurement validity,
Research Paper 27.
In 2002, the ABS held a number of workshops and meetings around Australia to gauge
the level of interest in measuring social capital, gain an understanding of its potential
policy applications and discover the associated information needs. The response was
very strong with representation from Australian and state/territory government agencies,
local governments, nonprofit institutions and university researchers. The level of
enthusiasm was also very high. Why are they interested?
Many are working to support the development of sustainable local communities,
including in rural and regional areas and within the major cities. Sustainability has been a
concern because of reduced employment opportunities or the withdrawal of some
services such as banks and post offices from the townships to larger regional centres.
The active engagement of the local people in envisioning, planning and implementing
possible futures is being seen as essential for the success of the process. Every state and
territory government, either in its premier and cabinet department or as a specific
community department, has a unit devoted to encouraging community participation in
planning and managing economic, social and environmental sustainability. Local
governments are also deeply involved in these projects.
Others are interested in health. There has been considerable recent research suggesting
that the quality of relationships people have and their level of involvement in a wider
community life may lead to better health, longer lives and more prolonged mental
alertness (Berkman & Glass 2000; Cullen & Whiteford 2001). State government health
departments have demonstrated their interest in social capital by conducting surveys
with social capital modules.
Some are trying new approaches to community housing renewal, with tenants assuming
responsibility for management and maintenance, supported by government resources.
Others see the potential of stronger relationships within communities for better
managing levels of crime and vandalism; or building a sense of efficacy that might
gradually overcome the hopelessness and powerlessness contributing to the complex
BA C K G R O U N D
A B S • ME A S U R I N G SO C I A L CA P I T A L , A N A U S T R A L I A N FR A M E W O R K A N D I N D I C A T O R S • 1 3 7 8 . 0 • 2 0 0 4 1
C H A P T E R 1 — I N T R O D U C T I O N
The ABS is participating in national and international discussions of social capital, many
aimed at developing some level of harmonisation of social capital data to allow for
comparison between and within countries. This information paper is a contribution to
this process.
Over the three-year period from July 2001 to June 2004, the ABS social capital work
program includes the following major outputs:
! production of a paper describing how social capital may enlarge our understanding
of societal well being, and the policy applications of social capital, released in
August 2002
! the development of an ABS Social Capital Framework which describes the range of
aspects of social capital, the current version of which is presented in this
information paper
! the development of a range of indicators that reflect the aspects of social capital
described in the framework, the current version of which is presented in this
information paper
! the release on the ABS web site of Indicators of Community which present data and
commentaries relating to social capital from existing ABS data sources, in mid-2004
! the specification of data items to support priority indicators for inclusion in the
2005–06 General Social Survey (GSS), to be completed in early 2004
AB S SO C I A L CA P I T A L
WO R K PR O G R A M
problems often associated with poverty, such as depression, poor educational outcomes
for children, poor health, drug addiction, crime and insecure housing.
On a society-wide basis, there are expressed concerns in public discussion that people
are becoming more individualistic or self-absorbed, and that families and other social
groups are breaking down. Democratic institutions are perceived by some as weakening
(Salvaris 2000). Increasing inequality within a number of nations (UNDP 2003),
widespread movements of people and the development of violent international
movements have led to concerns in many countries about social cohesion.
Finding an appropriate balance between governmental, business, communal and
personal responsibility in different social and economic areas is a current major policy
direction of governments in Australia. Related to all of these issues is a growing
awareness of the energy and resources created when people interact, both in close
personal relationships and in more formal associations; and a developing interest in
governance and citizenship, and in the qualities and relationships that strengthen
democracy. All of these factors have contributed to the level of interest in social capital.
While social capital is a relatively recent term, it draws together a number of concepts
that have been familiar for much longer in different disciplines. References through the
literature to Adam Smith's Theory of Moral Sentiments (1759), Alexis de Tocqueville's
Democracy in America (1835), Emile Durkheim's The Division of Labour in Society
(1893) and Suicide: a study in sociology (1897), Social Network Theory from the 1950s
on, and John Bowlby's Attachment Theory (Attachment 1969; Separation 1973; and Loss
1980) illustrate this. What is comparatively new is the attempt to understand and
measure the relationships and qualities of civic life and the household sector in the
interest of public policy.
BA C K G R O U N D continued
2 A B S • ME A S U R I N G SO C I A L CA P I T A L , A N A U S T R A L I A N FR A M E W O R K A N D I N D I C A T O R S • 1 3 7 8 . 0 • 2 0 0 4
C H A P T E R 1 — I N T R O D U C T I O N continued
The ABS has undertaken a broad consultation process in the development of the ABS
Social Capital Framework. Consultations on the framework were undertaken during May
and June 2002 in each state capital and in the ACT, with a high level of participation in
the information sessions and workshops. The participants were primarily from a wide
range of Commonwealth and state government agencies, non-government organisations,
and research institutions. The aim of the consultations was to present the draft version
of the ABS Social Capital Framework and receive feedback in response, to gain an
understanding of the policy applications of social capital data and the information needs
to support these applications.
In June 2003 the ABS presented a paper describing a range of social capital indicators at a
series of workshops. Around 60 participants participated in the workshops. During the
workshops, discussions focused on the suitability of the various indicators presented in
the paper to measure social capital and highlighting the indicators of highest priority.
Consultat ion Process
! the production of an Information Development Framework in 2004 that identifies
the demand for social capital data, the current availability of data relating to social
capital from both ABS and non-ABS sources, and the gaps between the demand and
availability.
From July 2004, the ABS is planning to explore whether there are existing sources of
reliable small area information that may be shaped to provide basic, local, social-capital
related profiles. These might frame more detailed local studies carried out by specific
communities. Also, some of the data sources identified in the Information Development
Framework may provide material for further analytic articles.
A module of questions will be designed and tested for the Social Capital component of
the 2005–06 GSS. Following the GSS collection phase, communities carrying out local
studies who have a particular interest in social capital data at a local or regional level will
be able to use any of these questions and items in their own data collection activity. This
will make it possible to compare the local area with national benchmarks, either for the
total population or for subpopulations of interest. In this way, the national survey will be
able to add value to smaller scale studies.
Social capital data collected in the GSS will be analysed to test the hypothesized
relationships between aspects of social capital and a range of outcome measures.
Whether the outcomes in turn contribute to further building those or other aspects of
social capital will also be examined.
Work by AIFS has contributed to the development of theoretically based and empirically
valid measures of social capital. The Families, Social Capital and Citizenship project
measured aspects of social capital such as informal ties, generalised relationships,
institutional relationships, and the diversity and extensiveness of people's networks. The
results were analysed by a variety of demographic variables of the survey respondents.
The relationships between the different aspects of social capital measured were also
analysed (Stone and Hughes 2002). Given the work planned by the ABS in collection and
analysis of social capital data, analysis of state agency data, and the work of AIFS, in a few
years there should be a considerable body of empirical evidence underpinning social
capital policy development, application and evaluation.
AB S SO C I A L CA P I T A L
WO R K PR O G R A M continued
A B S • ME A S U R I N G SO C I A L CA P I T A L , A N A U S T R A L I A N FR A M E W O R K A N D I N D I C A T O R S • 1 3 7 8 . 0 • 2 0 0 4 3
C H A P T E R 1 — I N T R O D U C T I O N continued
Chapter 1 has introduced social capital and discussed the ABS work program on social
capital.
Chapter 2 will:
! comment on the use of the term ‘capital’
! relate social capital to other concepts such as social cohesion and social
participation
! comment on the approach to ‘community’
! outline reasons for the measurement of social capital, with examples of Australian
policies and programs involving social capital
! introduce the ABS Social Capital Framework.
Chapter 3 describes the ABS Social Capital Framework.
Chapter 4 defines and discusses the framework elements, with suggested indicators that
could be used to measure them.
Structure of the paper
The framework and indicators presented in this information paper have been influenced
and refined by the consultation processes described above. However, the ABS recognises
the dynamic nature of research into social capital, and the potential for new information
needs to emerge. Feedback identifying the areas of the ABS Social Capital Framework
most relevant to your work, and the indicators of highest priority, would be particularly
useful. If you have any comments that you would like to make please contact the
Assistant Director, Community Statistics, Family and Community Statistics Section, by
email: <[email protected]> or phone (02) 6252 7880.
Feedback
The feedback received has contributed to shaping the smaller, refined range of social
capital indicators presented in this publication.
Consultat ion Process
continued
4 A B S • ME A S U R I N G SO C I A L CA P I T A L , A N A U S T R A L I A N FR A M E W O R K A N D I N D I C A T O R S • 1 3 7 8 . 0 • 2 0 0 4
C H A P T E R 1 — I N T R O D U C T I O N continued
Although the term ‘social capital’ is commonly used, it is not universally understood and
there are some concerns about using the term. It is sometimes criticised as using
economic language to make a social idea sound more important. Conversely, some see
the use of 'capital' as betraying the value of the social dimension by invoking an
economic justification. There are also a number of different theories of capital.
Cullen and Whiteford (2001) (citing Eatwell et al. 1987) refer to two of these as the
'technical' view of classic capital, a set of productive factors embodied in the production
process, as distinct from the 'financial' view of capital, a fund of resources which can be
moved from one use to another. The technical view of classic capital, from which other
commonly cited forms of capital developed, involves both social relationships and an
investment process producing a return in the market place (Lin 2001).
US E OF TH E TE R M
'C A P I T A L '
The ABS Social Capital Framework conceptualises social capital as a resource, drawing on
and feeding back into other types of resources. These other resources are grouped as
natural, produced economic, and human capital. The four sets of resources interact in a
context of cultural, political, institutional and legal conditions, and contribute to a wide
range of wellbeing outcomes. Social capital resources are presented as attributes of
networks, organised as network qualities, structure, transactions and broad types
(bonding, bridging and linking). Potential network participants (such as families, friends,
organisations/groups) are indicated by network composition.
Network qualities include norms, such as trust, reciprocity and inclusiveness, and
common purposes such as social, civic and economic participation. Structure refers to
size, frequency of interaction, density and openness, power relationships and
transience/mobility. Network transactions are those interactions which at the same time
invest in and maintain relationships and draw resources from them, such as sharing
knowledge and sharing support.
Network types are a higher level classification. In the ABS framework, ‘bonding’ refers to
relationships between similar kinds of people or groups; ‘bridging’ to connections where
members have less in common, or even differences; and 'linking' to vertical relationships
with sources of influence or authority which assist with access to financial and other
resources.
Framework
The ABS has adopted the Organisation for Economic Cooperation and Development
(OECD) definition of social capital: "networks, together with shared norms, values and
understandings which facilitate cooperation within or among groups". This OECD
definition is emerging as a common basis for international comparability.
Defini t ion
Social capital relates to the resources available within communities in networks of
mutual support, reciprocity, and trust. It is a contributor to community strength. Social
capital can be accumulated when people interact with each other in families, workplaces,
neighbourhoods, local associations, interest groups, government, and a range of informal
and formal meeting places.
WH A T I S SO C I A L
CA P I T A L ?
A B S • ME A S U R I N G SO C I A L CA P I T A L , A N A U S T R A L I A N FR A M E W O R K A N D I N D I C A T O R S • 1 3 7 8 . 0 • 2 0 0 4 5
C H A P T E R 2 — S O C I A L C A P I T A L I N C O N T E X T
Social attachment refers to the nature and strength of relationships that people have
with each other. It includes the more intimate relationships with family and friends as
well as people's associations with individuals and organisations in the wider community.
More generally, it refers to the way in which people bond, interact with, and feel about
other people, organisations and institutions (such as clubs, business organisations,
political parties and various government organisations). At social attachment's opposite
extreme lie notions of social detachment, social isolation and social exclusion. Social
capital embodies the concept of social attachment, but also recognises that the stock of
beliefs and values that can facilitate cooperation within or among groups and
communities are important to societal wellbeing.
Social attachment
This term has a broad and a narrow usage. More narrowly, it refers to socialising,
participation with others in activities enjoyed and valued for their own sake. Social
participation as an element of the ABS Social Capital Framework is defined in this way.
Understood broadly, social participation means that people are engaging effectively in all
the domains of living appropriate to their stage of life. Common areas of participation of
interest to government are family life and early childhood development, health,
education, employment, income and housing. Participation in these areas contributes to
the overall wellbeing of a society.
The International Classification of Functioning (WHO 2001) includes a comprehensive
set of life areas in which all people should be able to participate. People with disabilities
(and other potentially marginalised groups) may be excluded from participation in some
of these. It is not only their particular activity limitation or disadvantage that acts as a
barrier to participation, but also the attitudes of the people among whom they live, the
constructed environment and the framing of social institutions. Personal networks and
other less public areas of participation are particularly important in this context.
Community participation in the form of relationships with family, friends and the wider
community, spirituality or sense of purpose in life and meaningful activities including
socialising and leisure activities are emerging as important in achieving more general
wellbeing outcomes, such as health and education. Many of these areas are seen as part
of social capital, or effects of it. These are often relatively hidden areas of community life.
They also contribute to the resilience of individuals and communities.
Social part ic ipat ion
Social capital is related but not identical to a number of other ways of describing the
functioning of individuals and population groups in society, and of a society as a whole.
Terms such as social participation, attachment, inclusion, and social exclusion,
deprivation and social cohesion are often used in research and in the setting of policy
goals designed to mitigate social disadvantage and encourage economic and social
development. It is useful to outline the ways in which they relate to each other.
SO C I A L CA P I T A L AN D
OT H E R SO C I A L CO N C E P T S
The forms of capital used in the ABS Social Capital Framework (natural, produced
economic, human and social) are widely used in discussions of social capital and
sustainability, for instance by the OECD (2001b) and the World Bank (Vinod 1999). A
summary of the OECD perspective on the different types of capital and their
contribution to wellbeing is presented in Appendix 1.
US E OF TH E TE R M
'C A P I T A L ' continued
6 A B S • ME A S U R I N G SO C I A L CA P I T A L , A N A U S T R A L I A N FR A M E W O R K A N D I N D I C A T O R S • 1 3 7 8 . 0 • 2 0 0 4
C H A P T E R 2 — S O C I A L C A P I T A L I N C O N T E X T continued
Studies of social deprivation suggest that the capacity of individuals or groups of people
to participate fully may be diminished by their early life opportunities and early and
current environments. Some researchers suggest that children who grow up in
disadvantaged areas are unlikely to realise their positive potential without compensating
interventions. Neighbourhood deprivation is often measured by composite indicators,
drawing on a number of variables such as proportions within the area of unemployed,
youth unemployed, single parent families, low socioeconomic status groups,
overcrowding and people with long-term health conditions. (Garner & Raudenbush
Social deprivat ion
Conversely, social exclusion exists where people are not able to participate adequately.
This may be due to denial or non-realisation of access to social rights of citizenship,
which results in a rupture of social bonds between the individual and society. It covers a
range of social problems, such as unemployment and instability of families. On an
individual level there is economic, social and political disadvantage. At the level of a
society, lack of access to goods, services, activities and resources generally associated
with the rights of a citizen may cause deep divisions and break down social cohesion,
particularly if there appear to be systematic barriers (Berger-Schmitt & Noll, 2000).
There are many possible barriers to participation, such as
! legal or administrative restrictions, for example when government agencies barred
the employment of married women
! lack of social acceptance, for example because of race, culture, sexual orientation, or
mental illness
! language difficulties
! remoteness
! lack of reasonable adjustment to the needs of older people and people with
disabilities
! lack of suitable skills for available jobs
! lack of economic resources
! depression and despair.
Social exclusion may imply an absence of social connectedness at all, connections with
relatively powerless groups, or exclusion as part of a group which may have strong
internal connections, but no bridges or links to the rest of the community. Power
relationships are a structural feature of networks included in the social capital
framework, which also emphasize the importance of a balance between bonding,
bridging and linking social capital.
Social exclus ion
Where people are able to participate fully in the social and economic life of their
community, and have a good network of relationships with family, friends and the wider
community, a state of social inclusion exists. Social inclusion is closely related to social
participation, although social inclusion also has a more active meaning. It implies that
formal structures, institutions and informal relationships work to remove barriers to
participation that might be experienced by some individuals or populations. These
barriers may arise, for instance, because of perceived difference, early deprivation, or a
marginalised and unnoticed state of existence. Integration into social relationships and
attitudes of acceptance and inclusiveness are presented as some of the community
practices and values that are part of social capital.
Social inclus ion
A B S • ME A S U R I N G SO C I A L CA P I T A L , A N A U S T R A L I A N FR A M E W O R K A N D I N D I C A T O R S • 1 3 7 8 . 0 • 2 0 0 4 7
C H A P T E R 2 — S O C I A L C A P I T A L I N C O N T E X T continued
A very common term in the discussion of social capital is ‘community’. Community may
refer to the social networks themselves, or to the setting within which relationships
occur. The term has a wide range of meanings. It can range from a broad group with
which one shares a common interest or sense of identity to a small group where
everyone is known to each other. For instance, it may be valid to speak of:
! a global community, with highly interdependent trade, travel and communication
networks, facing common problems (such as the adequacy of clean water, air and
land, controlling movements of people, global warming; providing increased
potential for the rapid spread of plant, animal and human diseases; and global
insecurity) requiring coordinated responses and the capacity for effective
negotiation
! a national community, such as Australians, with a range of potent symbols of identity
CO M M U N I T Y
There is no universally accepted concept of social cohesion, but there is a certain
amount of convergence. Berger-Schmitt and Noll (2000) summarise a number of
different ways of mapping social cohesion, and conclude:
The point to be emphasized is that the concept of social cohesion incorporates mainly two
dimensions of societal development which may be related to each other but can be
analytically distinguished. The first dimension concerns the reduction of disparities,
inequalities, breaks and cleavages ...The concept of social exclusion is covered by this
dimension. The second dimension embraces all aspects which aim at strengthening social
connections, ties and commitments to a community. This dimension includes the concept of
social capital.
Beauvais and Jenson (2002) review the literature on social cohesion and draw from it five
constituent elements, which might be considered and prioritised differently by different
researchers:
1. Common values and a civic culture
2. Social order and social control
3. Social solidarity and reductions in wealth disparities
4. Social networks and social capital
5. Territorial belonging and identity.
Similarly, OECD discussions of social cohesion emphasize on the one hand participation
and inclusion (overcoming social exclusion), and on the other shared values,
commitments and relationships between individuals and between groups (OECD 2001a).
Social capital is therefore part of social cohesion. It is possible that a good balance
between the bonding, bridging and linking types of social capital might reflect social
cohesion. A poor balance between them, however, is damaging to social cohesion
through social exclusion, factional conflicts or corruption.
Social cohesion
1991; Kohen, Hertzman & Brooks-Gunn 1998; and others cited in Connor, S & Brink, S
1999).
Other forms of social deprivation include imprisonment, particularly where this is not on
an equitable basis, and systematic barriers to participation. The latter may be either
institutional or cultural, such as discouraging particular groups from completing their
education or joining the labour force.
Social deprivat ion
continued
8 A B S • ME A S U R I N G SO C I A L CA P I T A L , A N A U S T R A L I A N FR A M E W O R K A N D I N D I C A T O R S • 1 3 7 8 . 0 • 2 0 0 4
C H A P T E R 2 — S O C I A L C A P I T A L I N C O N T E X T continued
There has been growing appreciation of the importance of social and environmental as
well as economic considerations in pursuing national prosperity and wellbeing. Social
capital provides some of the important social indicators for understanding outcomes
across economic, social and environmental domains.
Social capital has become a common focus of policy within nations, and for international
bodies such as the World Bank, both as something to be fostered in its own right, and as
a resource to be drawn on to achieve other policy goals. In Australia there has been
considerable interest in policy and programs involving social capital at all levels of
government. Some examples of these are:
WH Y IS I T IM P O R T A N T TO
ME A S U R E SO C I A L
CA P I T A L ?
! communities sharing a loyalty to a state, ‘the bush’ or a particular city or area
! communities of identity (such as people with a common cultural background or
religious affiliation) whose importance depends on how closely people identify with
them, or are so identified by others, which may affect the way they are treated
! communities defined by location, such as regions, towns and suburbs or schools and
workplaces, where people may or may not know one another, but share in a
number of conditions of living and working, such as council or management
decisions, morale, availability of power, transport and communications technology,
local climate and topology
! communities of interest, where members share activities, enthusiasms or attitudes,
whether face-to-face or through other media of communication — virtual
communities would be included here; and
! intimate communities of family and friends.
There are many other ways of dividing people into groupings with some level of
common identity or interest, which may become important from time to time.
The broader concepts of community may only occasionally and in particular situations be
part of people’s consciousness. However, they may affect the types of smaller networks
people choose to join, particularly in the area of civic participation.
Closely bonded groups are most likely to be trusting, share common values, and provide
material and emotional support to members of the group. It is not useful, though, to
limit ‘community’ to these types of groups. Weak ties also provide different and valuable
resources (Granovetter 1973).
In researching social capital, it may be preferable not to set specific boundaries to the
concept of community. While the study of social capital has grown rapidly over the last
ten years, it draws together a number of areas separately studied for much longer. Social
Network Theory, beginning with Barnes (1954) and Bott (1957) contributes the
fundamental approach of analysing the actual structure of relationships among people
without setting a priori boundaries (Berkman & Glass 2000). Actual networks may cut
across kin and place groups. This advice has also emerged strongly from the ABS
consultation on social capital indicators.
Where the interest is in the strength of involvement and relations within a local area, it
may be useful to ask about these connections. However, the view of the resources
available to the local area through networks is very limited if the inhabitants’
‘community’ is constrained within it.
CO M M U N I T Y continued
A B S • ME A S U R I N G SO C I A L CA P I T A L , A N A U S T R A L I A N FR A M E W O R K A N D I N D I C A T O R S • 1 3 7 8 . 0 • 2 0 0 4 9
C H A P T E R 2 — S O C I A L C A P I T A L I N C O N T E X T continued
In response to requirements for social capital related data, a number of government
departments have conducted social capital surveys, or included social capital concepts in
other currently run surveys. Many have included social capital concepts in health surveys.
An interesting feature of the work being done on social capital by both government and
non-government agencies is the close working relationships with academics in the field.
This is an area of cooperative learning. The following surveys are a selection of
government surveys with questions relating to social capital.
Social Capital
measurement init iat ives
Another group of state agencies with a strong interest in social capital are the
departments responsible for public health. They are interested in the positive and
negative ways in which social capital may affect health, and the way to use this
understanding in developing health policies and programs. The state health departments
are already involved in the measurement of social capital.
Health and human
services departments
New South Wales Premier's Department
<http://www.communitybuilders.nsw.gov.au>
Department for Victorian Communities
Community Building Initiative/Learning Towns
Community Support Fund
Queensland Department of Premier and Cabinet
Community Cabinets, and Ministerial Regional Community Forums
Community Renewal projects
Local Area Multicultural Partnerships
e-Democracy.
South Australian Department of Premier and Cabinet
Social Inclusion Initiative
Premier's Community Initiatives Fund
Western Australia Department of Premier and Cabinet
Networked Neighbourhoods Initiative
Tasmanian State Government
Tasmania Together
Northern Territory Department of Community Development, Sport, and Cultural Affairs
Building Stronger Regions — Stronger Futures
ACT Chief Minister's Department
Canberra Social Plan (under development)
Austral ian state and
terr i tory government
init iat ives
Department of Family and Community Services
Stronger Families and Communities Strategy
National Agenda for Early Childhood
Volunteering programs
Prime Minister's Community Business Partnership
Department of Health and Ageing
Funding of Public Health measurement trials, including a social capital component
Austral ian Commonwealth
Government social pol icy
init iat ives
10 A B S • ME A S U R I N G SO C I A L CA P I T A L , A N A U S T R A L I A N FR A M E W O R K A N D I N D I C A T O R S • 1 3 7 8 . 0 • 2 0 0 4
C H A P T E R 2 — S O C I A L C A P I T A L I N C O N T E X T continued
! Collaborative Health and Wellbeing Survey, 2000–01, conducted in Western Australia
and South Australia — Commonwealth Department of Health and Aged Care and
National Public Health Partnership
! Families, Social Capital and Citizenship Survey, 2001 — Australian Institute of Family
Studies
! Australian Longitudinal Study of Women's Health (begun 1996) — Commonwealth
Department of Health and Ageing, and University of Newcastle
! Community Capacity Questionnaire, 2001 — Victorian Department of Human
Services, Tasmanian Department of Health and Human Services
! Victorian Population Health Survey, 2001 and 2002 — Victorian Department of
Human Services
! New South Wales Child Health Survey — New South Wales Department of Health
! Queensland Household Survey, annual from 1990 — Queensland Department of
Premier and Cabinet
! Social Capital Omnibus Survey 2002 — Queensland Health Information Centre
For further information about each survey, please refer to Appendix 2.
Measurement of social capital is required in Australia for several different purposes. The
first need is to provide:
! point-in-time national benchmarks, for monitoring change over time
! national profiles, including profiles of sub-populations, with which studies done in
local communities might be compared.
Secondly, there is a need to establish the relationships between elements of social capital
and wellbeing outcomes such as health, employment and educational achievement in an
Australian context. The third purpose is to monitor the success of projects to nurture the
growth of social capital in particular broad areas or sub-populations. Tracking the
relationship between levels of different dimensions of social capital and, for instance, the
movement and distribution of wellbeing outcomes in the same areas or populations
would give a useful insight into the important dynamics to foster.
Social Capital
measurement init iat ives
continued
A B S • ME A S U R I N G SO C I A L CA P I T A L , A N A U S T R A L I A N FR A M E W O R K A N D I N D I C A T O R S • 1 3 7 8 . 0 • 2 0 0 4 11
C H A P T E R 2 — S O C I A L C A P I T A L I N C O N T E X T continued
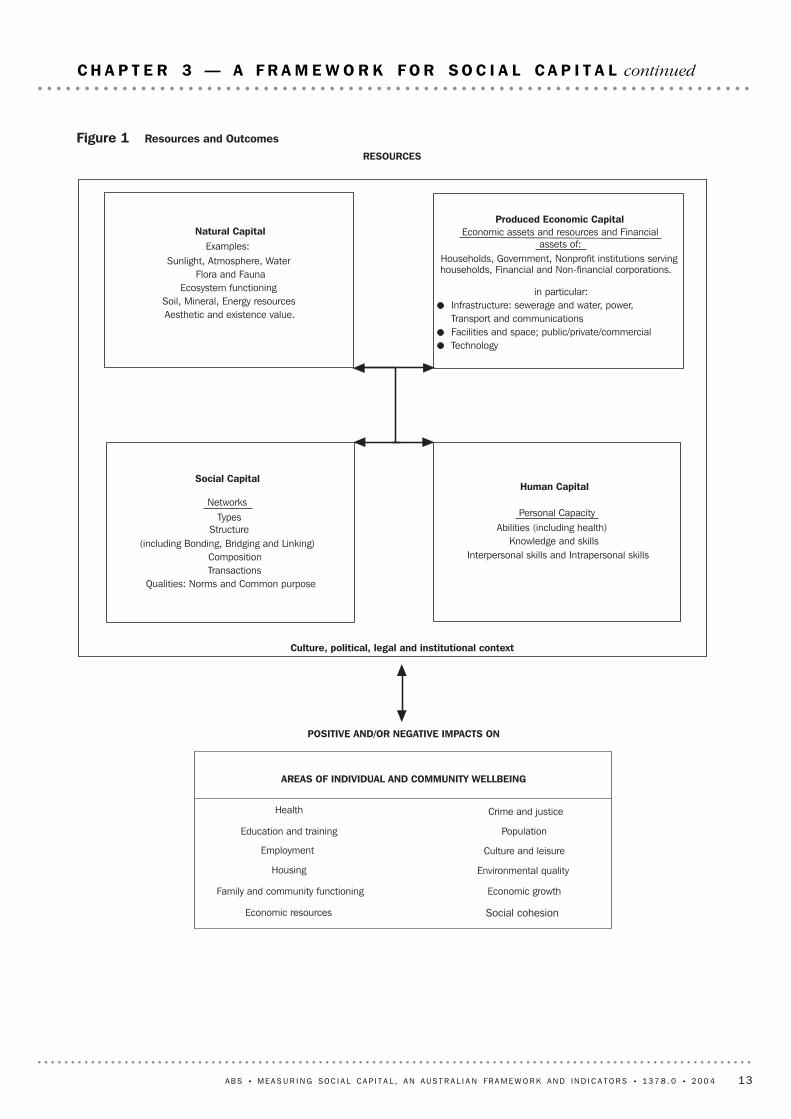
The ABS Social Capital Framework comprises two diagrams, Figure 1: Resources and
Outcomes and Figure 2: Social Capital, Culture and Political, Legal and Institutional
Conditions. The nature and functions of a statistical framework are outlined in the
following extract from Measuring Wellbeing: Frameworks for Australian Social
Statistics.
A framework defines the scope of enquiry, delineates important concepts and organises them
into a logical structure.
Each identified element can represent a specific area about which data is needed.
Frameworks represent an agreed way of thinking about an area of interest, and promote
standards, consistency and comparability across data collections and between jurisdictions and
sectors.
Frameworks can also show key relationships, processes or flows that exist between elements.
Frameworks can be used to direct investigation, and to assess the coverage of statistical
programs.
A framework ought to be logical in structure, comprehensive but concise, dynamic and flexible,
and cognisant of other frameworks, classifications and standards.
Source: Measuring Wellbeing: Frameworks for Australian Social Statistics, 2001
(cat. no. 4160.0).
AP P R O A C H TO A
ST A T I S T I C A L FR A M E W O R K
FO R SO C I A L CA P I T A L
12 A B S • ME A S U R I N G SO C I A L CA P I T A L , A N A U S T R A L I A N FR A M E W O R K A N D I N D I C A T O R S • 1 3 7 8 . 0 • 2 0 0 4
C H A P T E R 3 — A F R A M E W O R K F O R S O C I A L C A P I T A L
RESOURCES
Figure 1 Resources and Outcomes
POSITIVE AND/OR NEGATIVE IMPACTS ON
Culture, political, legal and institutional context
Natural Capital
Sunlight, Atmosphere, WaterFlora and Fauna
Ecosystem functioningSoil, Mineral, Energy resourcesAesthetic and existence value.
Produced Economic CapitalEconomic assets and resources and Financial
assets of:Households, Government, Nonprofit institutions servinghouseholds, Financial and Non-financial corporations.
in particular:Infrastructure: sewerage and water, power,Transport and communicationsFacilities and space; public/private/commercialTechnology
Social Capital
NetworksTypes
(including Bonding, Bridging and Linking)CompositionTransactions
Qualities: Norms and Common purpose
Human Capital
Personal CapacityAbilities (including health)
Knowledge and skillsInterpersonal skills and Intrapersonal skills
AREAS OF INDIVIDUAL AND COMMUNITY WELLBEING
Health Crime and justice
Education and training Population
Employment Culture and leisure
Housing Environmental quality
Family and community functioning Economic growth
Economic resources Social cohesion
Examples:
Structure
A B S • ME A S U R I N G SO C I A L CA P I T A L , A N A U S T R A L I A N FR A M E W O R K A N D I N D I C A T O R S • 1 3 7 8 . 0 • 2 0 0 4 13
C H A P T E R 3 — A F R A M E W O R K F O R S O C I A L C A P I T A L continued
LegalE.g. Independant judiciaryCriminal, civil, contract, property and constitutional lawProtection against arbitrary arrest and detentionTransparency of legal processInternational conventions and agreementsFreedoms of: speech; association; assembly; religion;
the press; movementRight to a fair trial, legal representation, presumption
of innocenceRegulatory mechanisms and framework
Positive effects of social capitalE.g. Network developmentIdentity and sense of belongingIncreased knowledge/understandingIncreased confidence in community
capacity to achieve goalsCommunity resilienceSatisfactory locus of controlLowering of transaction costsConflict resolution
InstitutionalE.g. Agents of policy implementation and review
(e.g. Ombudsman, Administrative Appeals Tribunal)Institutions for the promotion of economic stability
(e.g. Reserve Bank, International Monetary Fund)
Culture and Political, Legal and Institutional ConditionsCulture
E.g. LanguageHistoryGenderReligionsSportsCultural EventsArts
Political
E.g. Separation of powersUniversal adult suffrageTransparency of political processRule of lawRepresentative elected government
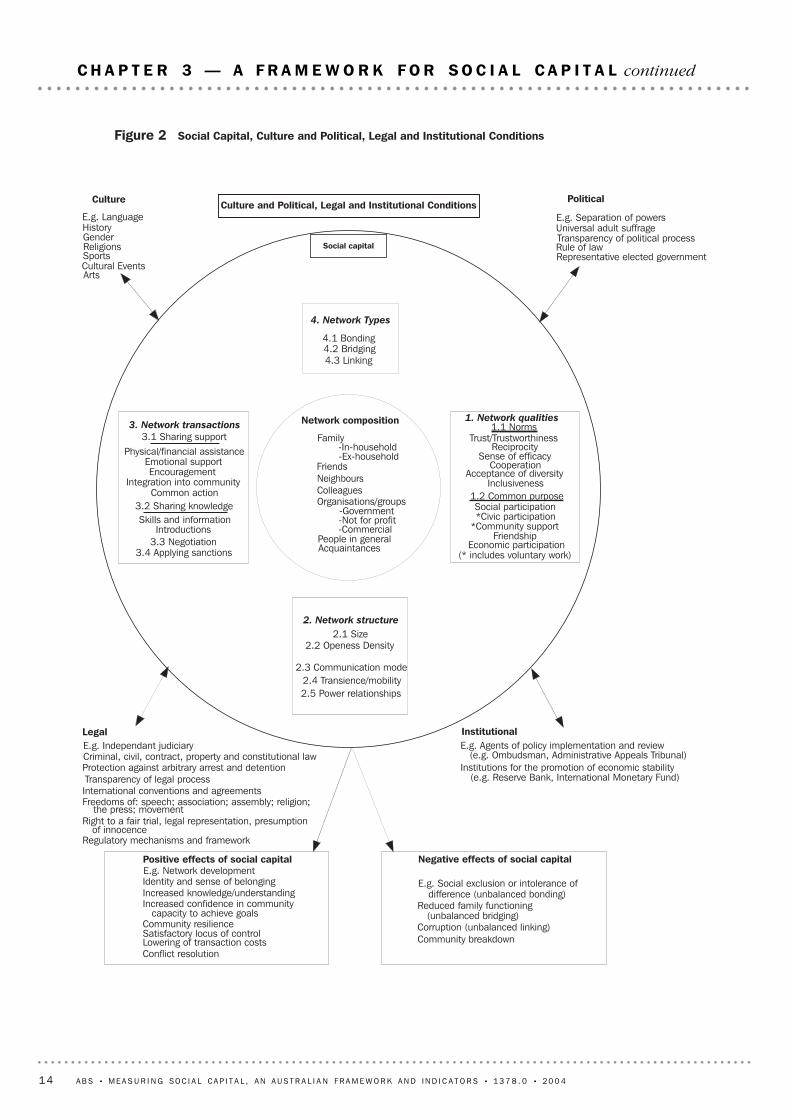
Figure 2 Social Capital, Culture and Political, Legal and Institutional Conditions
1. Network qualities1.1 Norms
Trust/TrustworthinessReciprocity
Sense of efficacyCooperation
Acceptance of diversityInclusiveness
1.2 Common purposeSocial participation*Civic participation
*Community supportFriendship
Economic participation(* includes voluntary work)
3. Network transactions3.1 Sharing support
Physical/financial assistanceEmotional supportEncouragement
Integration into communityCommon action
3.2 Sharing knowledgeSkills and information
Introductions3.3 Negotiation
3.4 Applying sanctions
2. Network structure2.1 Size
2.2 Openess Density
2.3 Communication mode2.4 Transience/mobility2.5 Power relationships
Social capital
Network composition
Family-In-household-Ex-household
FriendsNeighboursColleaguesOrganisations/groups
-Government-Not for profit-Commercial
People in generalAcquaintances
4. Network Types
4.1 Bonding4.2 Bridging4.3 Linking
Negative effects of social capital
E.g. Social exclusion or intolerance ofdifference (unbalanced bonding)
Reduced family functioning(unbalanced bridging)
Corruption (unbalanced linking)Community breakdown
14 A B S • ME A S U R I N G SO C I A L CA P I T A L , A N A U S T R A L I A N FR A M E W O R K A N D I N D I C A T O R S • 1 3 7 8 . 0 • 2 0 0 4
C H A P T E R 3 — A F R A M E W O R K F O R S O C I A L C A P I T A L continued
Figure 1 shows resources and the interactions between them, and how these resources
and interactions may influence outcomes in various areas of wellbeing. Resources may be
defined as 'a stock or a supply that can be drawn on' (Australian Oxford Dictionary).
Resources in Figure 1 are four types of capital commonly referred to: natural capital;
produced economic capital; human capital; and social capital, with the main elements of
each listed in the diagram. It is important to note that the descriptive lists are not
exhaustive, and there may be other elements of the different types of capital not
explicitly mentioned in the diagram.
In the ABS Social Capital Framework, human capital is considered to include a wide
range of abilities, knowledge and skills including intrapersonal and interpersonal skills, as
described in OECD (2001a). These skills and competencies include not only skills such
as numeracy, writing and reading, but also interpersonal skills such as teamwork and
leadership, and abilities such as health and physical attributes and dexterity. Although
human capital is an individual attribute, 'stores' of human capital can by held by families,
workplaces, clubs and organisations, and by nations. These stores are the aggregate of
the human capital of the individuals that comprise these groups. Human capital is
related to social capital in that the interpersonal skills of individuals affect the size of
their networks and individuals within networks bring their personal stock of human
capital (skills and competencies) to the network.
Multi-directional arrows between the boxes representing each type of capital illustrate
the interactions between the different types of capital. A primary interaction is the
production of goods and services. Goods and services are produced by particular
combinations of the different types of capital interacting. These goods and services may
be produced by businesses, government, nonprofit institutions or households. Goods
and services may be bought, sold or otherwise transferred in an economic market, or
alternatively can be of non-market nature, examples being parenting and unpaid
household work. Goods and services range from those produced by businesses as final
goods to be sold to consumers at market prices such as houses, cars, white goods,
clothing and personal services, through to those produced by government and provided
to households free of cost or at non-market prices such as health services, education
services, and public housing.
There can be unintended effects resulting from the production of goods and services,
their distribution and use, and the societal context in which all of this occurs. OECD
(2001a) refers to these effects as 'regrettables', with pollution and crime being examples.
Further effort and expenditure, through the provision of relevant goods and services
such as environmental remediation, courts and police is required to manage these types
of regrettables.
Other interactions may also occur between the different types of capital. The
development or depletion of a type of capital will have flow-on effects for other types of
capital. For example, an increase in stock of human capital may lead to further
development of technology perhaps resulting in ways to optimise use of other resources.
Possible flow on effects from this may include: an increase in the stock of produced
economic capital; reducing the depletion of stocks of natural capital; or minimising the
unintended effects of the production of goods and services, such as pollution.
ST R U C T U R E AN D
CO N T E N T OF TH E
D I A G R A M S
Figure 1: Resources and
Outcomes
A B S • ME A S U R I N G SO C I A L CA P I T A L , A N A U S T R A L I A N FR A M E W O R K A N D I N D I C A T O R S • 1 3 7 8 . 0 • 2 0 0 4 15
C H A P T E R 3 — A F R A M E W O R K F O R S O C I A L C A P I T A L continued
Infrastructure and facilities and space, considered to be components of produced
economic capital in the ABS Social Capital Framework, are also important resources for
social capital. In particular the existence of community facilities such as schools and
sport, culture and recreation facilities, together with services provided from these
facilities provide a focal point for community activities and social interaction. The
absence or inadequacy of these facilities can lead people apart or draw people together
to lobby for these facilities and their associated services to be provided, or to assist in
their provision.
The broad areas of wellbeing that the different types of capital and interactions between
them may influence appear in the diagram. These include: health; education and
training; employment; housing; family and community functioning; economic resources;
crime and justice; population; culture and leisure; social cohesion; environmental
quality; and economic growth. The impacts on these areas may range from an individual
to a societal level impact. For example economic growth can be viewed as a societal level
impact, but the distribution of this growth may not necessarily positively impact on all
individuals in a society. Alternatively a positive impact on the health of the population is
likely as a result of the health practices of individuals such as the immunisation of
children.
The impacts on areas of wellbeing can be either positive or negative or there may be no
impact. For example an impact which increases the level of educational attainment in
society would generally be considered a positive outcome, while an impact of
degradation in environmental quality would generally be viewed as a negative outcome.
However, it is important to note that some impacts may be related to less obviously
positive and negative outcomes, and that different stakeholders may view the merits of
some outcomes differently. The inter-relationship between the different types of capital,
the interactions between them, and the outcomes are shown by two way arrows.
The four types of capital are shown as set in a cultural, political, legal and institutional
context. This context refers to the features of culture, and the particular political, legal
and institutional conditions which give rise to norms, values and social relations that
bring people together in networks or associations which can result in collective action.
Examples of these conditions are listed in Figure 2: Social Capital, Culture, and Political,
Legal and Institutional Conditions.
The level and mix of resources and the ability to deploy resources in an optimal manner
influence the extent, strength and diversity of an individual's or a community's networks
and their capacity to achieve individual or community goals. Hence the importance of
including resources, and acknowledging the importance of the other types of capital in
the social capital framework diagrams.
There are no indicators of resources for produced economic capital, human capital,
natural capital or outcome indicators for the various areas of social and economic
concern presented in this information paper. There are a range of indicators derived
from both ABS and other data that are already in existence for produced economic
capital and natural capital, and for outcomes in various areas of social concern.
Figure 1: Resources and
Outcomes continued
16 A B S • ME A S U R I N G SO C I A L CA P I T A L , A N A U S T R A L I A N FR A M E W O R K A N D I N D I C A T O R S • 1 3 7 8 . 0 • 2 0 0 4
C H A P T E R 3 — A F R A M E W O R K F O R S O C I A L C A P I T A L continued

Figure 2 presents in detail the elements of social capital and culture, political, legal and
institutional conditions. These conditions provide the context in which social capital
operates. Networks are equated with social capital in the framework diagram. The effects
of social capital arise from the operation of networks.
CU L T U R E , PO L I T I C A L , L E G A L AN D IN S T I T U T I O N A L CO N D I T I O N S
The ABS Social Capital Framework identifies four broad types of societal conditions:
Culture; political; legal and institutional conditions. It is recognised that these conditions
are interdependent and overlap. They provide the context in a community or society for
the development and maintenance of social capital, as well as having an important
influence on other types of capital in terms of determining the conditions of utilisation
and distribution of other types of capital.
Not only does the position of culture, political, legal and institutional conditions in the
diagram emphasise the importance of these conditions in providing context, but the
diagram is also intended to show that culture, political, legal and institutional conditions
are closely related to social capital. They are the results of historical human interaction;
they pass on norms and values and condition present relationships, but they continue to
be modified by current interactions and emergent norms. These conditions also shape
the context and environment that may encourage social capital. In contrast, a lack of the
appropriate context and conditions may act as a barrier to forms and expressions of
social capital.
The ABS Social Capital Framework includes a list of examples of significant features of
culture, and a range of political, legal and institutional conditions that are relevant to the
Australian context. The list is not exhaustive and there are obviously a number of other
conditions that shape societal conditions.
Culture refers primarily to features of a cultural environment such as: language; history;
accepted behaviours and shared beliefs; religion; sport; art; and cultural events. These
features influence social capital in shaping the cultural and social life of a society. This
may be in terms of: the types of groups, organisations and institutions that exist; the
types of cultural and recreation activities available; the shared understandings gained
from a common history and language; the expressions of culture held in high esteem
Figure 2: Social Capital ,
Culture and Pol it ical,
Legal and Inst itut ional
Condit ions
The development of indicators of human capital is outside the scope of this project. The
ABS has been progressing work on the measurement of human capital. The work has
focused on applying a lifetime income approach to different age/sex/education cohorts
and aggregating these to estimate the stock of human capital in Australia. The paper
Measuring the Stock of Human Capital for Australia, presented at the 30th Conference
of Economists, Perth, Australia provides a detailed examination of this work. In addition,
a selection of indicators of human capital are presented in the Discussion Paper:
Measuring a Knowledge-based Economy and Society — An Australian
Framework (cat. no. 1375.0).
There are a range of indicators for outcomes and progress in areas of wellbeing such as
health, education, personal economic wellbeing and housing already in existence. A
selection of these indicators appears in Australian Social Trends (cat. no. 4102.0) and
Measuring Australia's Progress (cat. no. 1370.0).
Figure 1: Resources and
Outcomes continued
A B S • ME A S U R I N G SO C I A L CA P I T A L , A N A U S T R A L I A N FR A M E W O R K A N D I N D I C A T O R S • 1 3 7 8 . 0 • 2 0 0 4 17
C H A P T E R 3 — A F R A M E W O R K F O R S O C I A L C A P I T A L continued
CU L T U R E , PO L I T I C A L , L E G A L AN D IN S T I T U T I O N A L CO N D I T I O N S continued
and the accessibility of these. Culture also influences the structures of families, the types
of relationships people have and the shared norms in a community. Political, legal and
institutional conditions are to some extent a reflection of the shared norms and
understandings of a particular cultural setting.
Political conditions refer to the features of the political system in Australia such as the
existence of: separation of powers between the legislature, executive and the judiciary;
universal adult suffrage; transparency and accountability of political process; rule of law;
and representative elected government. These conditions influence social capital in
terms of the type and intensity of involvement citizens have in government and the
resulting quality of governance, and the trust and confidence that citizens have in public
institutions.
Legal conditions refer to the features of the legal system in Australia such as the
existence of: an independent judiciary; a body of law covering criminal, civil, property
and constitutional matters; a regulatory framework for commercial activities;
international conventions and agreements covering areas such as human rights,
environmental protection, and trade; human rights enshrined in law or convention such
as freedoms of association, assembly, religion, press, individual movement, property
ownership and equality before the law; the right to a fair trial, with legal representation
and the presumption of innocence; a transparent legal process; and laws and regulations
that are published and widely available.
These conditions influence the way in which social capital develops in a society. For
example, people may live in the knowledge that they are able to go about their daily lives
and conduct business in relatively secure conditions. People may also feel the freedom to
openly conduct associational life in joining and participating in a wide range of groups
representative of different interests, and to participate in political life and debate.
The term 'institutional' is used in a narrower sense in the ABS Social Capital Framework
than it is sometimes understood. The term 'institutional' in the framework is regarded as
pertaining to organised societies or the buildings used for their work. In this way the ABS
Social Capital Framework considers institutions to be an organisation or establishment
for the promotion of a particular object.
There are a great range of other institutions in Australia set up for a diverse range of
purposes which the ABS Social Capital Framework broadly refers to as agencies of policy
implementation and review. Some examples include: Human Rights and Equal
Opportunity Commission, Australian Competition and Consumer Commission,
Commonwealth and State and Territory Ombudsman, Administrative Appeals Tribunal,
Commonwealth and State government departments, and cultural institutions such as the
National Gallery of Australia and the National Museum of Australia. In the framework
institutional conditions refers to the existence and operation of these and other
institutions.
There are no indicators for Culture, Political, Legal and Institutional conditions presented
in this information paper. Data exists to support indicators for a range of these areas,
primarily from non-ABS sources. Selecting indicators for these areas was considered
beyond the scope of this project.
Figure 2: Social Capital ,
Culture and Pol it ical,
Legal and Inst itut ional
Condit ions continued
18 A B S • ME A S U R I N G SO C I A L CA P I T A L , A N A U S T R A L I A N FR A M E W O R K A N D I N D I C A T O R S • 1 3 7 8 . 0 • 2 0 0 4
C H A P T E R 3 — A F R A M E W O R K F O R S O C I A L C A P I T A L continued
NE T W O R K S
Networks are considered integral to social capital in almost all of the literature, and
therefore appear as the central feature of Figure 2: Social Capital, Culture and Political,
Legal and Institutional Conditions. While particular elements that have been included
may have been seen by some researchers as separate from 'intrinsic' social capital, we
have equated social capital with networks. The framework incorporates qualities,
transactions, structure and types of networks which describe different dimensions of the
functioning of networks.
Composition of networks is located at the centre of the diagram as this describes the
units between which networks exist. These units include: family, both in-household and
ex-household; friends and acquaintances; neighbours; colleagues; organisations/groups;
and people in general. Organisations and groups includes government, non-government,
and business/commercial groups. 'People in general' is considered to include strangers
and people in latent networks such as work/study colleagues who are currently strangers,
but with whom there is a shared characteristic or interest which potentially might lead to
a meeting or a relationship at some time in the future.
Chapter 4 of this paper describes each of the ABS Social Capital Framework elements in
detail, providing a definition and reasons for the inclusion of the element in the
framework.
EF F E C T S OF SO C I A L CA P I T A L
A range of what might be considered as some examples of the positive and negative
effects of social capital are listed in two boxes at the bottom of the framework diagram.
These effects differ from the outcomes shown in Figure 1 in terms of being the effects
more closely attributable to social capital.
The positive effects of social capital are likely to flow from the functional operation of
networks, and include identity and a sense of belonging, lowering of transaction costs
and an increased capacity of the community to achieve goals. These effects are important
to include in the framework and to measure, as their magnitude provides a sense of how
well networks in a community are operating and point to the level of different aspects of
social capital in a community.
In developing this framework, it has been recognised that elements included in networks
can have detrimental effects. There may be groups that actively exclude or oppress
others. Norms may bind a community so strongly that individuals who do not conform
are (or consider themselves to be) ostracised, harassed or marginalised (for instance
people with different sexual orientations, or pacifists during wartime). Social cohesion
may mean suppression of differences in the interests of 'social harmony'. Links to people
in positions of influence, possibly family members, can lead to or be thought to lead to
nepotism or corruption if not balanced by trustworthiness and bridging social capital.
These potential negative effects are also captured in Figure 2. It is also possible that a
group or group value may have both a positive and a negative effect at the same time. A
group that may exclude or oppress some people may, perhaps even because of that, give
its members a strong sense of identity and control.
Figure 2: Social Capital ,
Culture and Pol it ical,
Legal and Inst itut ional
Condit ions continued
A B S • ME A S U R I N G SO C I A L CA P I T A L , A N A U S T R A L I A N FR A M E W O R K A N D I N D I C A T O R S • 1 3 7 8 . 0 • 2 0 0 4 19
C H A P T E R 3 — A F R A M E W O R K F O R S O C I A L C A P I T A L continued
EF F E C T S OF SO C I A L CA P I T A L continued
There are no indicators for effects of social capital presented in this paper. Selection of
indicators to represent the different effects of social capital was considered outside of
the scope of this project. Further work may be undertaken at a later stage.
Figure 2: Social Capital ,
Culture and Pol it ical,
Legal and Inst itut ional
Condit ions continued
20 A B S • ME A S U R I N G SO C I A L CA P I T A L , A N A U S T R A L I A N FR A M E W O R K A N D I N D I C A T O R S • 1 3 7 8 . 0 • 2 0 0 4
C H A P T E R 3 — A F R A M E W O R K F O R S O C I A L C A P I T A L continued
The various elements of social capital are listed in Figure 2: Social Capital, Culture, and
Political, Legal and Institutional Conditions in Australia in chapter 3. This chapter
presents further detail of each of the elements of the ABS Social Capital Framework
beginning with the elements identified as Network Qualities, followed by Network
Structure, Network Transactions and Network Types. The elements within each of these
headings are numbered hierarchically, with the indicator set for each of the elements
following this numbering system for ease of reference and discussion.
The presentation of each framework element begins with a suggested definition for the
element, followed by a discussion of how the element is related to social capital drawing
upon current research and literature. A possible set of indicators and data items is then
set out for each of the elements. The purpose of each of the suggested indicators is to
provide a useful summary measure of that particular aspect of social capital for reporting
and analysis. Data items have been included to illustrate how the data to support the
indicator might be collected.
The development of the majority of the indicators and data items presented in this
information paper has been informed by the examination of a range of existing surveys
that contain questions on social capital. These surveys include current ABS surveys,
surveys conducted by other national statistical agencies such as Statistics Canada and the
Office of National Statistics in UK, collections by international statistical organisations,
surveys conducted by state government departments in Australia, and surveys conducted
by research institutions and academics, both in Australia and overseas. Example
questions selected from these surveys for each of the framework elements are contained
in Appendix 4 — Example Questions from Existing Surveys. These have been provided to
illustrate how some agencies/researchers have collected such information. The ABS has
not assessed the quality of these interview questions and does not endorse the use of
any of the listed survey questions without rigorous testing in the Australian context.
The suggested indicators and data items presented in this information paper are not
intended to represent a final definitive set of indicators for social capital. Rather, the
indicators and data items described are aimed at generating discussion and debate on
what items might be best collected to measure social capital. Discussion and feedback
will help inform the selection of a smaller set of high priority data items for further
development. The ABS will establish a User Advisory Group comprised primarily of
representatives of government agencies and academics with an active interest in social
capital data to play a key role in advising on the content and priority for social capital
data to be collected in the 2005–06 ABS General Social Survey (GSS). Once the social
capital content of the survey is agreed, questions to measure this small set of data items
will be further developed and tested for inclusion in the social capital component of the
GSS.
Data items for some of the indicators have already been included in ABS collections and
so national data is currently available. For indicators where this is the case, the ABS is
given as the source. However, some of the suggested indicators have not been tested in
the Australian context and some have not been subjected to the rigorous testing that the
ABS would consider necessary to include in an ABS survey. Only those indicators for
which the ABS is given as the source necessarily follow ABS standards in terms of
question design, standards and testing. The quality of the non-ABS data items has not
I N T R O D U C T I O N
A B S • ME A S U R I N G SO C I A L CA P I T A L , A N A U S T R A L I A N FR A M E W O R K A N D I N D I C A T O R S • 1 3 7 8 . 0 • 2 0 0 4 21
C H A P T E R 4 — F R A M E W O R K E L E M E N T S A N D I N D I C A T O R S
1.1 Norms
1.1.1 Trust and trustworthiness
1.1.1.1 Generalised trust
1.1.1.2 Informal trust
1.1.1.3 Institutional trust
1.1.1.4 Generalised trustworthiness
1.1.1.5 Feelings of safety using public transport
1.1.1.6. Feelings of safety walking in the street
1.1.1.7 Feelings of safety at home after dark
1.1.2 Reciprocity
1.1.2.1 Perception of reciprocity in the community
1.1.2.2 Donating time or money
1.1.2.3 Attitude towards contributing to the community
1.1.3 Sense of efficacy
1.1.3.1 Perceptions of community efficacy
1.1.3.2 Sense of personal efficacy in the community
1.1.3.3 Personal/ community efficacy
1.1.3.4 Efficacy in local decision making
1.1.3.5 Perception of Efficacy
1.1.4 Cooperation
1.1.4.1 Cooperation in conservation of water resources and electricity
1.1.4.2 Support for community events
1.1.4.3 Attitude toward community decision making capacity
1.1.4.4 Attitude to social and civic cooperation
1.1.5 Acceptance of diversity and inclusiveness
1.1.5.1 Acceptance of different lifestyles
1.1.5.2 Support for cultural diversity
1.1.5.3 Group diversity
1.1.5.4 Expressions of negative behaviours toward cultural diversity
1.1.5.5 Perception of change in negative attitudes toward cultural diversity
1.1.5.6 Attitude toward the practice of linguistic diversity
1. Network Quali t ies
been assessed. Information about these items is included in this information paper to
illustrate the type of indicators and data items that have been used by other
agencies/researchers that could be further tested in the Australian context if considered
useful.
I N T R O D U C T I O N continued
22 A B S • ME A S U R I N G SO C I A L CA P I T A L , A N A U S T R A L I A N FR A M E W O R K A N D I N D I C A T O R S • 1 3 7 8 . 0 • 2 0 0 4
C H A P T E R 4 — F R A M E W O R K E L E M E N T S A N D I N D I C A T O R S continued
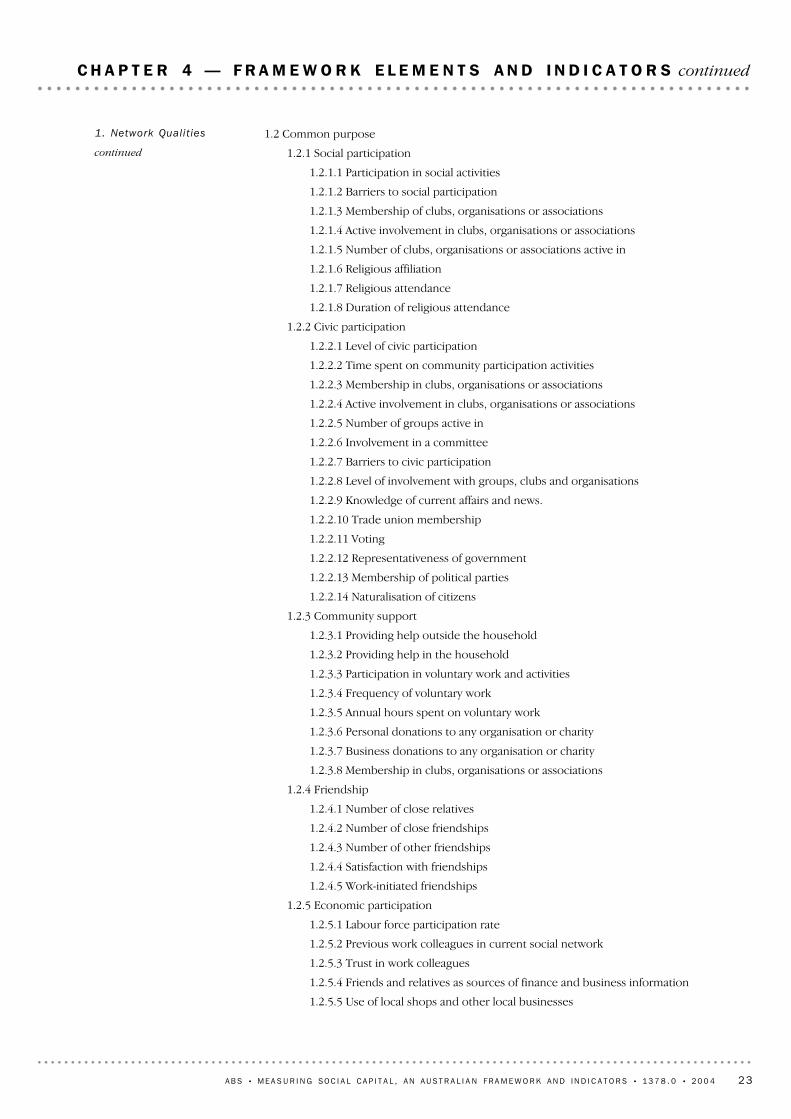
1.2 Common purpose
1.2.1 Social participation
1.2.1.1 Participation in social activities
1.2.1.2 Barriers to social participation
1.2.1.3 Membership of clubs, organisations or associations
1.2.1.4 Active involvement in clubs, organisations or associations
1.2.1.5 Number of clubs, organisations or associations active in
1.2.1.6 Religious affiliation
1.2.1.7 Religious attendance
1.2.1.8 Duration of religious attendance
1.2.2 Civic participation
1.2.2.1 Level of civic participation
1.2.2.2 Time spent on community participation activities
1.2.2.3 Membership in clubs, organisations or associations
1.2.2.4 Active involvement in clubs, organisations or associations
1.2.2.5 Number of groups active in
1.2.2.6 Involvement in a committee
1.2.2.7 Barriers to civic participation
1.2.2.8 Level of involvement with groups, clubs and organisations
1.2.2.9 Knowledge of current affairs and news.
1.2.2.10 Trade union membership
1.2.2.11 Voting
1.2.2.12 Representativeness of government
1.2.2.13 Membership of political parties
1.2.2.14 Naturalisation of citizens
1.2.3 Community support
1.2.3.1 Providing help outside the household
1.2.3.2 Providing help in the household
1.2.3.3 Participation in voluntary work and activities
1.2.3.4 Frequency of voluntary work
1.2.3.5 Annual hours spent on voluntary work
1.2.3.6 Personal donations to any organisation or charity
1.2.3.7 Business donations to any organisation or charity
1.2.3.8 Membership in clubs, organisations or associations
1.2.4 Friendship
1.2.4.1 Number of close relatives
1.2.4.2 Number of close friendships
1.2.4.3 Number of other friendships
1.2.4.4 Satisfaction with friendships
1.2.4.5 Work-initiated friendships
1.2.5 Economic participation
1.2.5.1 Labour force participation rate
1.2.5.2 Previous work colleagues in current social network
1.2.5.3 Trust in work colleagues
1.2.5.4 Friends and relatives as sources of finance and business information
1.2.5.5 Use of local shops and other local businesses
1. Network Quali t ies
continued
A B S • ME A S U R I N G SO C I A L CA P I T A L , A N A U S T R A L I A N FR A M E W O R K A N D I N D I C A T O R S • 1 3 7 8 . 0 • 2 0 0 4 23
C H A P T E R 4 — F R A M E W O R K E L E M E N T S A N D I N D I C A T O R S continued
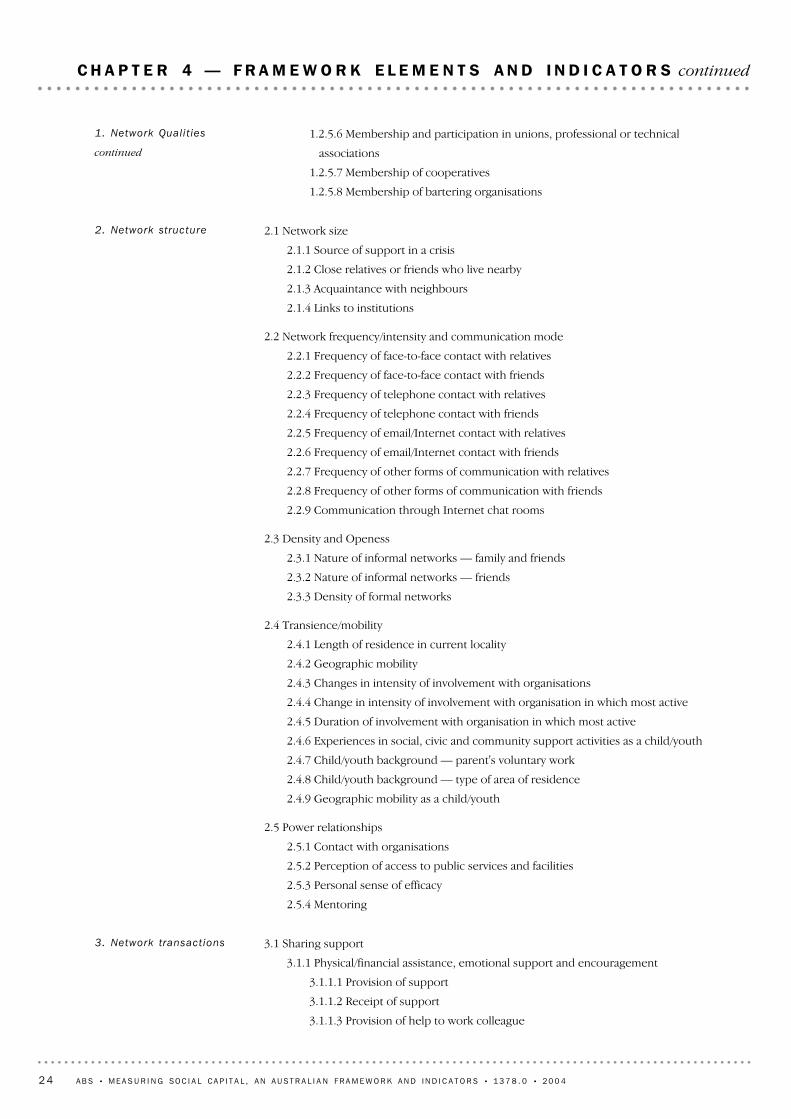
3.1 Sharing support
3.1.1 Physical/financial assistance, emotional support and encouragement
3.1.1.1 Provision of support
3.1.1.2 Receipt of support
3.1.1.3 Provision of help to work colleague
3. Network transact ions
2.1 Network size
2.1.1 Source of support in a crisis
2.1.2 Close relatives or friends who live nearby
2.1.3 Acquaintance with neighbours
2.1.4 Links to institutions
2.2 Network frequency/intensity and communication mode
2.2.1 Frequency of face-to-face contact with relatives
2.2.2 Frequency of face-to-face contact with friends
2.2.3 Frequency of telephone contact with relatives
2.2.4 Frequency of telephone contact with friends
2.2.5 Frequency of email/Internet contact with relatives
2.2.6 Frequency of email/Internet contact with friends
2.2.7 Frequency of other forms of communication with relatives
2.2.8 Frequency of other forms of communication with friends
2.2.9 Communication through Internet chat rooms
2.3 Density and Openess
2.3.1 Nature of informal networks — family and friends
2.3.2 Nature of informal networks — friends
2.3.3 Density of formal networks
2.4 Transience/mobility
2.4.1 Length of residence in current locality
2.4.2 Geographic mobility
2.4.3 Changes in intensity of involvement with organisations
2.4.4 Change in intensity of involvement with organisation in which most active
2.4.5 Duration of involvement with organisation in which most active
2.4.6 Experiences in social, civic and community support activities as a child/youth
2.4.7 Child/youth background — parent's voluntary work
2.4.8 Child/youth background — type of area of residence
2.4.9 Geographic mobility as a child/youth
2.5 Power relationships
2.5.1 Contact with organisations
2.5.2 Perception of access to public services and facilities
2.5.3 Personal sense of efficacy
2.5.4 Mentoring
2. Network structure
1.2.5.6 Membership and participation in unions, professional or technical
associations
1.2.5.7 Membership of cooperatives
1.2.5.8 Membership of bartering organisations
1. Network Quali t ies
continued
24 A B S • ME A S U R I N G SO C I A L CA P I T A L , A N A U S T R A L I A N FR A M E W O R K A N D I N D I C A T O R S • 1 3 7 8 . 0 • 2 0 0 4
C H A P T E R 4 — F R A M E W O R K E L E M E N T S A N D I N D I C A T O R S continued
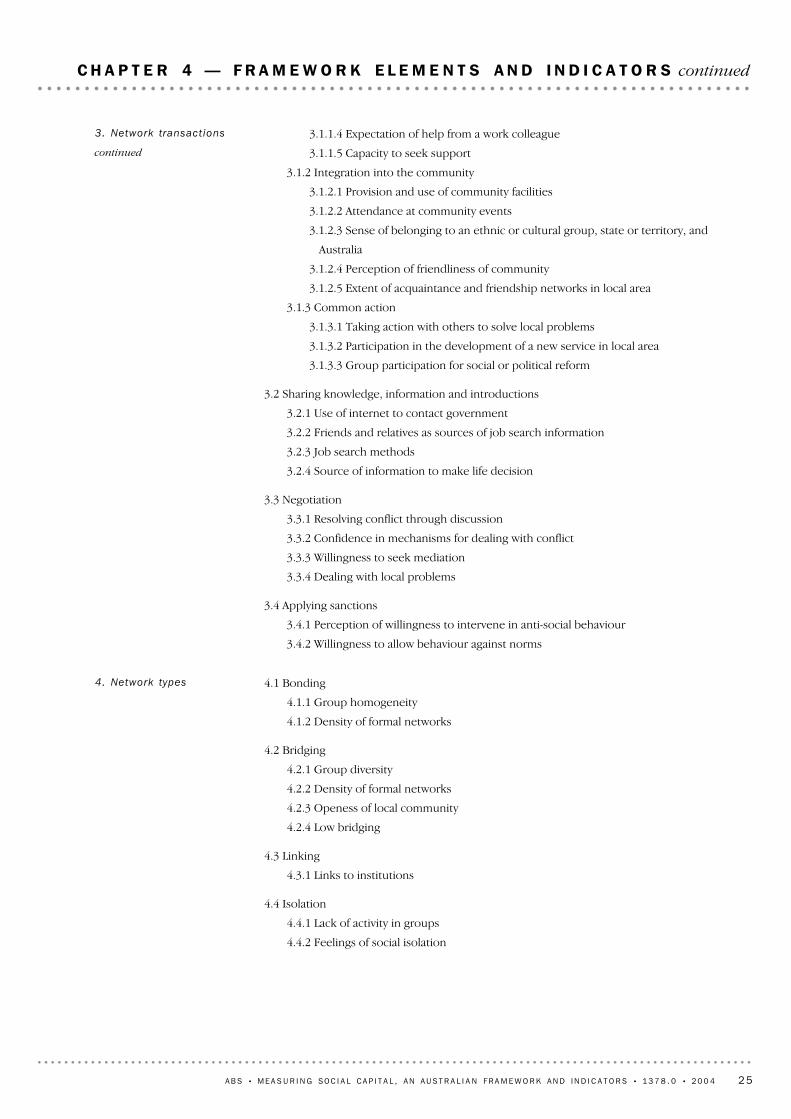
4.1 Bonding
4.1.1 Group homogeneity
4.1.2 Density of formal networks
4.2 Bridging
4.2.1 Group diversity
4.2.2 Density of formal networks
4.2.3 Openess of local community
4.2.4 Low bridging
4.3 Linking
4.3.1 Links to institutions
4.4 Isolation
4.4.1 Lack of activity in groups
4.4.2 Feelings of social isolation
4. Network types
3.1.1.4 Expectation of help from a work colleague
3.1.1.5 Capacity to seek support
3.1.2 Integration into the community
3.1.2.1 Provision and use of community facilities
3.1.2.2 Attendance at community events
3.1.2.3 Sense of belonging to an ethnic or cultural group, state or territory, and
Australia
3.1.2.4 Perception of friendliness of community
3.1.2.5 Extent of acquaintance and friendship networks in local area
3.1.3 Common action
3.1.3.1 Taking action with others to solve local problems
3.1.3.2 Participation in the development of a new service in local area
3.1.3.3 Group participation for social or political reform
3.2 Sharing knowledge, information and introductions
3.2.1 Use of internet to contact government
3.2.2 Friends and relatives as sources of job search information
3.2.3 Job search methods
3.2.4 Source of information to make life decision
3.3 Negotiation
3.3.1 Resolving conflict through discussion
3.3.2 Confidence in mechanisms for dealing with conflict
3.3.3 Willingness to seek mediation
3.3.4 Dealing with local problems
3.4 Applying sanctions
3.4.1 Perception of willingness to intervene in anti-social behaviour
3.4.2 Willingness to allow behaviour against norms
3. Network transact ions
continued
A B S • ME A S U R I N G SO C I A L CA P I T A L , A N A U S T R A L I A N FR A M E W O R K A N D I N D I C A T O R S • 1 3 7 8 . 0 • 2 0 0 4 25
C H A P T E R 4 — F R A M E W O R K E L E M E N T S A N D I N D I C A T O R S continued
DE F I N I T I O N
Trust refers to confidence in the reliability of a person or a system. It is based on the
expectation that people or organisations will act in ways that are expected or promised, and
will take into account the interest of others.
Trustworthiness involves honesty, accountability, fair dealing and a level of competence.
D I S C U S S I O N
Trust is based on the expectation that people or organisations will act in ways that are
expected or promised, and take into account the interest of others. Trust tends to be
cumulative and self-reinforcing, as recognised by Putnam (1993a). This aspect of trust is
evident in the increased capacity of people to trust others as result of previously having
this trust upheld. Trustworthiness is a quality of individuals and organisations that refers
to one's sense of honesty, accountability, fair dealing, and a level of competence; and to
how deserving an individual or organisation is of the trust afforded them by others. Paul
Zak notes that trusting "is a highly social activity" (Grimes 2003), and his studies have
shown that trustworthy behaviour seems to be a response to placed trust. This would
indicate that people who have trust placed in them, tend to act in a trustworthy manner.
The ABS Social Capital Framework considers three types of trust: generalised trust,
informal trust, and institutional trust.
Generalised trust refers to trust that individuals have toward other people in general.
Generalised trust is implicit in simple interactions with others such as asking the time of
a stranger and trusting that the correct response will be given (Caldwell and Cox 2000),
to more complex interactions such as trusting that others will respect an individual's
right to personal safety when walking along a street, and trusting that your local
shopkeeper is not charging exorbitant prices for goods. Bush and Baum (2001) indicate
that a reluctance to participate in social and civic activities may stem from a lack of trust
in others.
Informal trust refers to trust that individuals may have towards people in their social
network, such as family members, friends, neighbours, work colleagues, and fellow
members or participants in the clubs and organisations they belong to or participate in.
This form of trust relates to the levels of trust felt for individuals with whom there
generally is some form of relationship. The trust developed here is based on knowledge
of the individual, and an assessment of their trustworthiness.
1.1.1 Trust and
trustworthiness
Network qualities describes the norms and values that may exist within networks, and
serve to enhance the functioning of networks. These include but are not limited to, trust,
reciprocity, cooperation, and acceptance of diversity. These norms and values are
essential to healthy functioning of networks because they encourage people to act
cooperatively, and effectively provide rules and sanctions to govern people's behaviour.
More specifically, norms such as trust and reciprocity are important because they may
help reduce transaction costs relating to negotiation and enforcement, and encourage
the sharing of knowledge and ideas.
1 . NE T W O R K QU A L I T I E S
1.1 Norms
26 A B S • ME A S U R I N G SO C I A L CA P I T A L , A N A U S T R A L I A N FR A M E W O R K A N D I N D I C A T O R S • 1 3 7 8 . 0 • 2 0 0 4
C H A P T E R 4 — F R A M E W O R K E L E M E N T S A N D I N D I C A T O R S continued
INDICATORS
The proportion of people with a high level of trust in their immediate family
(e.g. categories 1 and 2).
1.1.1.2 Informal trust
INDICATOR
The proportion of people who feel that most people can be trusted.
DATA ITEM
Level of generalised trust
1. Most people can be trusted
2. Cannot be too careful dealing with people
1.1.1.1 General ised trust
D I S C U S S I O N continued
Institutional trust refers to levels of trust that individuals may have towards a range of
societal institutions, such as government, police, hospitals, and the courts. It also refers
to confidence in the capacity of these institutions to take reasonable actions in the
administration of their duties, which enhances the ease of acceptance of the results of
these actions.
Institutional trust is seen as important for the functioning of society, as many vital
services may be underutilised, to the detriment of members of the community, if trust of
institutions is deficient. Intrinsic to institutional trust, in addition to the trust people
place in the institutions generally, is the perceived trustworthiness of the actors that
administer the roles of the institution, such as magistrates, members of parliament, and
medical staff.
It is widely recognised that trust is a significant aspect of social capital, although there are
some theorists, such as Woolcock (1998), who regard trust as an output rather than an
integral part of social capital. The ABS recognises that trust can be an output; however it
is also an investment in relationships, and a resource within networks. For this reason
trust is included in the ABS Social Capital Framework.
Caldwell and Cox (2000) recognise that social trust enhances social capital, through
increased levels of interaction. As stated by Cox (1995), trust is essential for the effective
functioning of society; an absence of trust leads to increased demand for bureaucracy
and rules, and an increased burden on law and order. Many theorists recognise that
generalised social trust is important for the effective functioning of society. Putnam
(1993a) states that 'trust lubricates social life', and the Social Capital Community
Benchmark Survey (2001) conducted in the United States of America recognises the
importance of social trust in 'lubricating social interaction and getting things
accomplished'.
PO S S I B L E IN D I C A T O R S AN D DA T A I T E M S
The concept of trust as presented in the Social Capital Framework is divided into five
types of indicators: generalised trust; informal trust, institutional trust, trustworthiness
and feelings of safety.
1.1.1 Trust and
trustworthiness continued
A B S • ME A S U R I N G SO C I A L CA P I T A L , A N A U S T R A L I A N FR A M E W O R K A N D I N D I C A T O R S • 1 3 7 8 . 0 • 2 0 0 4 27
C H A P T E R 4 — F R A M E W O R K E L E M E N T S A N D I N D I C A T O R S continued
INDICATORS
The proportion of people who report a high level of trust in the police force
(e.g. categories 1 and 2).
The proportion of people who report a low level of trust in the police force
(e.g. categories 4 and 5).
DATA ITEMS
Level of institutional trust
1. A great deal of confidence in the police force
2. Quite a lot of confidence in the police force
3. A moderate amount of confidence in the police force
4. Not very much confidence in the police force
5. No confidence at all in the police force
Equivalent forms of indicators using the same form of data item are adopted for:
! The legal system and the courts
! Doctors and hospitals
! Local government or council
! The defence forces
! Organised religion
! The media (via press, radio, film and television, the internet)
! The industrial relations system
! Educational institutions (preschool, school, TAFE, university)
! The public transport system
! Commonwealth government
! State government
! Local government
! Public services
! Local trade and business people
1.1.1.3 Inst i tut ional trust
The proportion of people with a low level of trust in their immediate family
(e.g. categories 4 and 5).
DATA ITEM
Level of informal trust
1. Can be trusted a lot
2. Can mostly be trusted
3. Can be trusted sometimes
4. Mostly cannot be trusted
5. Cannot be trusted at all
Equivalent indicators using the same form of data item are adopted for:
! People in the wider family
! Friends
! People in the neighbourhood
! People at work or school
! People of different cultural backgrounds
! People of different religions.
1.1.1.2 Informal trust
continued
28 A B S • ME A S U R I N G SO C I A L CA P I T A L , A N A U S T R A L I A N FR A M E W O R K A N D I N D I C A T O R S • 1 3 7 8 . 0 • 2 0 0 4
C H A P T E R 4 — F R A M E W O R K E L E M E N T S A N D I N D I C A T O R S continued
INDICATORS
The proportion of people who feel safe using public transport at night
(e.g. categories 4 and 5).
The proportion of people who feel unsafe using public transport at night
(e.g. categories 1 and 2).
1.1.1.5 Feelings of safety
using publ ic transport
INDICATORS
The proportion of people who feel that their lost wallet or purse would be returned to
them, if found by someone that lives close by.
The proportion of people who feel that their lost wallet or purse would be returned to
them, if found by a complete stranger.
The proportion of people who feel that lying in self interest can be justified.
The proportion of people who feel that avoidance of fare payment on public transport
can be justified.
DATA ITEMS
Whether someone who lives close by would return the wallet
1. Very likely
2. Somewhat likely
3. Not at all likely
4. Don't know
The same form of data item is adopted for a complete stranger.
Whether lying in self interest is justified
1. Always justified
2. Often justified
3. Sometimes justified
4. Rarely justified
5. Never justified
The same form of data item is adopted for avoidance of fare payment on public
transport.
1.1.1.4 General ised
trustworthiness
! Charitable organisations
! Major Australian companies.
There is a large number of institutions which shape the public life of a society and
influence outcomes for members of society. The list above reflects many, but not all such
institutions. An abridged list would necessarily need to be considered for measurement.
These institutions in particular have an interest in the implications of social capital,
particularly relating to trust in the use of services, and the public perception of these
institutions having an impact on the ability of each to act effectively.
1.1.1.3 Inst i tut ional trust
continued
A B S • ME A S U R I N G SO C I A L CA P I T A L , A N A U S T R A L I A N FR A M E W O R K A N D I N D I C A T O R S • 1 3 7 8 . 0 • 2 0 0 4 29
C H A P T E R 4 — F R A M E W O R K E L E M E N T S A N D I N D I C A T O R S continued
DE F I N I T I O N
Reciprocity is any relationship between two parties or things where there is a mutual action,
giving and taking (Jary & Jary 2000). In the ABS Social Capital Framework, this is not seen
just as an exact exchange at a point of time. An action may be in response to one that took
place much earlier, or in expectation of a response at a time of need in future. The return
may be different in nature.
1.1.2 Reciprocity
INDICATORS
The proportion of people who feel safe at home after dark (e.g. categories 4 and 5).
The proportion of people who feel unsafe at home after dark (e.g. categories 1 and 2).
DATA ITEM
Perception of safety at home after dark
1. Very unsafe
2. Unsafe
3. Neither safe nor unsafe
4. Safe
5. Very safe
Source: General Social Survey (2002), ABS.
1.1.1.7 Feelings of safety
at home after dark
INDICATORS
The proportion of people who feel safe walking alone in their street after dark
(e.g. categories 4 and 5).
The proportion of people who feel unsafe walking alone in their street after dark
(e.g. categories 1 and 2).
DATA ITEM
Perception of safety in own street after dark
1. Very unsafe
2. Unsafe
3. Neither safe nor unsafe
4. Safe
5. Very safe
1.1.1.6. Feel ings of
safety walking in the
street
DATA ITEMS
Perception of safety on public transport at night
1. Very unsafe
2. Unsafe
3. Neither safe nor unsafe
4. Safe
5. Very safe
The equivalent indicator using the same form of data item is adopted for use of public
transport during the day.
1.1.1.5 Feelings of safety
using publ ic transport
continued
30 A B S • ME A S U R I N G SO C I A L CA P I T A L , A N A U S T R A L I A N FR A M E W O R K A N D I N D I C A T O R S • 1 3 7 8 . 0 • 2 0 0 4
C H A P T E R 4 — F R A M E W O R K E L E M E N T S A N D I N D I C A T O R S continued
De f i n i t i o n continued
The giving may be an investment in a process where the return to the giver is a generalised
improvement in which others as well as the giver participate. The return may be the sense of
satisfaction in enabling things to be done that the giver wishes to see done. Reciprocity is
considered to encompass the full spectrum of giving and receiving behaviour ranging from
the quid pro quo of favours and other direct exchanges, to behaviours considered to be
altruistic in considering the welfare and best interests of others, such as making charitable
donations.
D I S C U S S I O N
Actions that may be seen as demonstrating reciprocity include contributing time or
money to the community, making charitable donations, and sharing support among
friends and family. One important and widespread expression of reciprocity is that which
occurs in families, with recipricol provision of support that occurs between different
family members.
Reciprocity is related to altruism, which is seen as a social behaviour and value
orientation in which individuals give primary consideration to the interests and welfare
of other individuals, groups or the community as a whole (Drislane and Parkinson).
Although altruistic behaviours are commonly thought of as not yielding a return to the
giver, it is possible to consider that there is an intangible return associated with such
behaviours. For example, by making a donation to a particular charitable organisation,
we express a preference or support for a particular cause, be it the reduction of poverty,
protection of the environment, or research into the cause and treatment of a particular
disease. The return for our donation is not only the feeling that comes from making a
contribution, but that something in the world is a little more like how we would like it to
be, that our donation is helping to reduce poverty, protect rainforests or find a cure for
cancer. This is why altruism has been included in the spectrum of behaviour described as
reciprocity.
Reciprocity is an important aspect of social capital because the norm of reciprocity may
encourage the sharing of support, knowledge, and ideas between individuals, groups
and communities. In a community where reciprocity is strong, people care for each
other's interests. In this way, reciprocity encourages the individual to balance their own
self interest with the good of the community. Reciprocity has also been seen to be
closely related to trust, which assumes that individuals will act in ways that are expected
or promised, and take into account the interest of others (Black & Hughes 2001).
It should be noted that in the ABS Social Capital Framework, contractual economic
relationships and transactions, such as the purchasing of goods and services, or
employment, are not included in the definitional scope of reciprocity. This is due to
these types of relationships and transactions being somewhat different in nature, in that
the reciprocal expectations and returns are generally well understood by all parties and
governed by contracts, specific laws and regulations. Economic relationships are covered
in 1.2.5 Economic Participation.
1.1.2 Reciprocity continued
A B S • ME A S U R I N G SO C I A L CA P I T A L , A N A U S T R A L I A N FR A M E W O R K A N D I N D I C A T O R S • 1 3 7 8 . 0 • 2 0 0 4 31
C H A P T E R 4 — F R A M E W O R K E L E M E N T S A N D I N D I C A T O R S continued
INDICATORS
The proportion of people who strongly agree that they feel a responsibility to contribute
to the community they live in.
The proportion of people who strongly disagree that they feel a responsibility to
contribute to the community they live in.
1.1.2.3 Att i tude towards
contr ibut ing to the
community
INDICATORS
The proportion of people who report donating time to various organisations within the
previous 12 months.
The proportion of people who report donating money to various organisations within
the previous 12 months
DATA ITEMS
Donation of time to organisations within last twelve months
1. Yes
2. No
Donation of money to organisations within last twelve months
1. Yes
2. No
Source: Donation of money, Voluntary Work Survey (2000), ABS.
1.1.2.2 Donat ing time or
money
INDICATOR
The proportion of people who feel that most people in their local community would
contribute time to a project from which they would receive no personal benefit.
DATA ITEMS
Perception of community willingness to contribute time
1. Will contribute time
2. Will not contribute time
3. Don't know/not sure
The equivalent indicator using the same form of data item is adopted for the
contribution of money. An equivalent indicator is also adopted for perception of
reciprocity in an interest group or community of interest.
1.1.2.1 Perception of
reciproci ty in the
community
PO S S I B L E IN D I C A T O R S AN D DA T A I T E M S
The indicators of reciprocity have been selected to express concepts such as the
availability of assistance through community, and the likelihood of the contribution of
time or money to community projects.
1.1.2 Reciprocity continued
32 A B S • ME A S U R I N G SO C I A L CA P I T A L , A N A U S T R A L I A N FR A M E W O R K A N D I N D I C A T O R S • 1 3 7 8 . 0 • 2 0 0 4
C H A P T E R 4 — F R A M E W O R K E L E M E N T S A N D I N D I C A T O R S continued
DE F I N I T I O N
Sense of efficacy refers to the belief that an individual, group, or community has it in their
capacity to produce desired outcomes by their own actions. It also relates to self reliance,
initiative, and the degree of influence believed to be held, as well as the ability to draw upon
additional resources as required.
D I S C U S S I O N
Sense of efficacy is related to the capacity that individuals, groups and entire
communities possess to achieve goals, and the satisfaction with the degree of influence
that individuals or communities believe that they have in relation to activities and
outcomes in their community. Sense of efficacy may be shaped by previous experience,
and by confidence that individual, group or community input will be taken into account
in decision making.
People, groups, or communities with a poor sense of efficacy do not believe that the
actions they take are able to affect or effect outcomes. The ABS Social Capital Framework
presents sense of efficacy as associated with effects of social capital. These effects include
increased confidence in community capacity to achieve goals, and satisfaction with ones
perceived level of influence and control.
The propensity to participate in social and civic activities can be affected by sense of
efficacy. In the Adelaide Health Development and Social Capital Study, Bush and Baum
found that the extent of people's participation was influenced by a range of factors
including their feelings of control and self esteem (2001). Butcher et al. (2003) observed
that an individual’s capacity to engage effectively with his or her community is
dependent upon on his or her perception of capability or efficacy for engagement in the
community. Not only may a weak sense of efficacy lead to non-participation, but
potentially also to radical acts that are outside of social norms, such as vandalism.
1.1.3 Sense of eff icacy
DATA ITEMS
Level of feeling responsibility to contribute to the community that they live in
1. Strongly agree
2. Agree
3. Neither agree nor disagree
4. Disagree
5. Strongly disagree
The equivalent indicator using the same form of data item is adopted to measure feelings
of responsibility to contribute, but not necessarily to the respondent's local community.
OTHER RELATED INDICATORS
The following indicators are additional behavioural indicators related to reciprocity
which may be found in 1.2.3 Community Support.
1.2.3.3 Participation in voluntary work and activities
1.2.3.4 Frequency of voluntary work
1.2.3.6 Personal donations to any organisation or charity
1.2.3.7 Business donation to any organisation or charity
1.1.2.3 Att i tude towards
contr ibut ing to the
community continued
A B S • ME A S U R I N G SO C I A L CA P I T A L , A N A U S T R A L I A N FR A M E W O R K A N D I N D I C A T O R S • 1 3 7 8 . 0 • 2 0 0 4 33
C H A P T E R 4 — F R A M E W O R K E L E M E N T S A N D I N D I C A T O R S continued
INDICATORS
The proportion of people who agree that they can influence things in their community.
The proportion of people who disagree that they can influence things in their
community.
1.1.3.2 Sense of personal
eff icacy in the community
INDICATOR
The proportion of people who feel confident that people would work together to solve
problems in the community (e.g. categories 1 and 2).
DATA ITEM
Perception of community willingness to work together to solve problems
1. Strongly agree
2. Agree
3. Neither agree nor disagree
4. Disagree
5. Strongly disagree
1.1.3.1 Perceptions of
community eff icacy
D I S C U S S I O N continued
Falk (2001) notes of self-efficacy, that "when the individual realises that 'I can do
something'...the resulting self-confidence is an enabler of learning to manage change at a
personal level. And learning to manage change involves interacting with society and
learning how the networks, norms and trust work in the sense of power and resources."
Individuals, groups and communities who are empowered with a strong sense of efficacy
are able to actively participate in the groups and communities to which they belong, and
are able to develop trust with the people they interact with. This participation also feeds
back into an enhanced sense of efficacy. Bush and Baum found that engagement in civic
participation was associated with a sense of community control (2001).
A further important aspect of sense of efficacy is the degree of influence believed to be
held by an individual, group or community, and the ability to draw upon resources as
required. This may involve the capacity people have to establish linking relationships
with people of influence, and the degree to which people believe that the trust they
place in others will be upheld. The Department of the Parliamentary Library notes that
those who have high levels of trust in others are more likely to place trust and to have
confidence in public institutions; however, they may also be more likely to challenge the
decisions of these institutions (2002). This confidence is associated with a strong sense
of efficacy, in that confident individuals, groups, or communities feel they have the
capacity to provide input and have a positive effect on outcomes in relation to the
decisions made by societal institutions.
PO S S I B L E IN D I C A T O R S AN D DA T A I T E M S
The possible indicators of sense of efficacy have been selected to express concepts such
as community capacity to respond to problems, perceptions of influence in the
community and behaviours that reflect a sound sense of efficacy. Both behavioural and
perceptual indicators are listed.
1.1.3 Sense of eff icacy
continued
34 A B S • ME A S U R I N G SO C I A L CA P I T A L , A N A U S T R A L I A N FR A M E W O R K A N D I N D I C A T O R S • 1 3 7 8 . 0 • 2 0 0 4
C H A P T E R 4 — F R A M E W O R K E L E M E N T S A N D I N D I C A T O R S continued
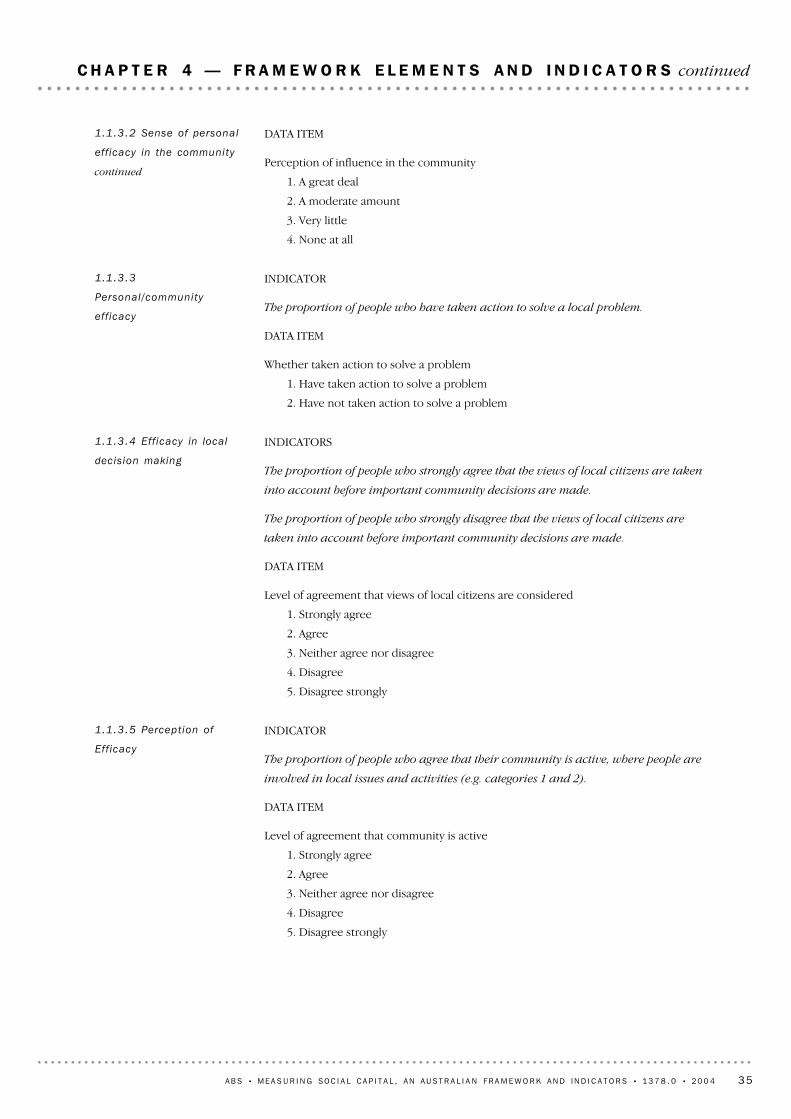
INDICATOR
The proportion of people who agree that their community is active, where people are
involved in local issues and activities (e.g. categories 1 and 2).
DATA ITEM
Level of agreement that community is active
1. Strongly agree
2. Agree
3. Neither agree nor disagree
4. Disagree
5. Disagree strongly
1.1.3.5 Perception of
Eff icacy
INDICATORS
The proportion of people who strongly agree that the views of local citizens are taken
into account before important community decisions are made.
The proportion of people who strongly disagree that the views of local citizens are
taken into account before important community decisions are made.
DATA ITEM
Level of agreement that views of local citizens are considered
1. Strongly agree
2. Agree
3. Neither agree nor disagree
4. Disagree
5. Disagree strongly
1.1.3.4 Eff icacy in local
decis ion making
INDICATOR
The proportion of people who have taken action to solve a local problem.
DATA ITEM
Whether taken action to solve a problem
1. Have taken action to solve a problem
2. Have not taken action to solve a problem
1.1.3.3
Personal/community
eff icacy
DATA ITEM
Perception of influence in the community
1. A great deal
2. A moderate amount
3. Very little
4. None at all
1.1.3.2 Sense of personal
eff icacy in the community
continued
A B S • ME A S U R I N G SO C I A L CA P I T A L , A N A U S T R A L I A N FR A M E W O R K A N D I N D I C A T O R S • 1 3 7 8 . 0 • 2 0 0 4 35
C H A P T E R 4 — F R A M E W O R K E L E M E N T S A N D I N D I C A T O R S continued
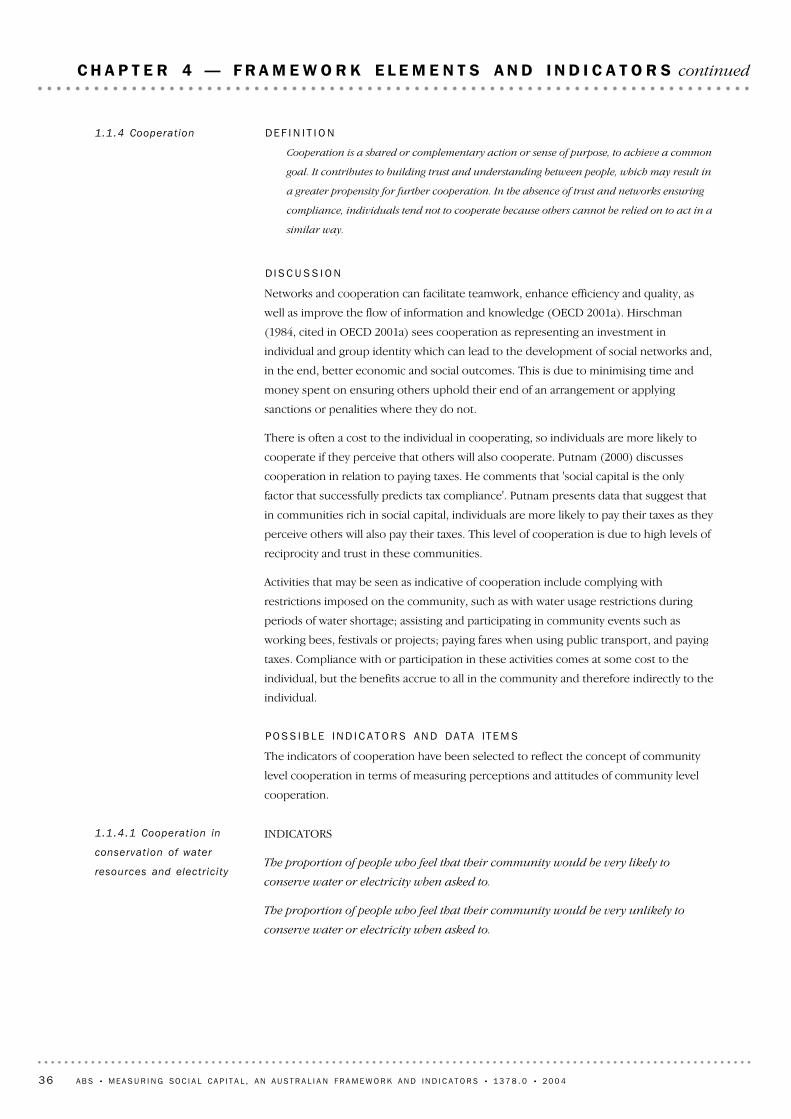
INDICATORS
The proportion of people who feel that their community would be very likely to
conserve water or electricity when asked to.
The proportion of people who feel that their community would be very unlikely to
conserve water or electricity when asked to.
1.1.4.1 Cooperat ion in
conservat ion of water
resources and electr ic i ty
DE F I N I T I O N
Cooperation is a shared or complementary action or sense of purpose, to achieve a common
goal. It contributes to building trust and understanding between people, which may result in
a greater propensity for further cooperation. In the absence of trust and networks ensuring
compliance, individuals tend not to cooperate because others cannot be relied on to act in a
similar way.
D I S C U S S I O N
Networks and cooperation can facilitate teamwork, enhance efficiency and quality, as
well as improve the flow of information and knowledge (OECD 2001a). Hirschman
(1984, cited in OECD 2001a) sees cooperation as representing an investment in
individual and group identity which can lead to the development of social networks and,
in the end, better economic and social outcomes. This is due to minimising time and
money spent on ensuring others uphold their end of an arrangement or applying
sanctions or penalities where they do not.
There is often a cost to the individual in cooperating, so individuals are more likely to
cooperate if they perceive that others will also cooperate. Putnam (2000) discusses
cooperation in relation to paying taxes. He comments that 'social capital is the only
factor that successfully predicts tax compliance'. Putnam presents data that suggest that
in communities rich in social capital, individuals are more likely to pay their taxes as they
perceive others will also pay their taxes. This level of cooperation is due to high levels of
reciprocity and trust in these communities.
Activities that may be seen as indicative of cooperation include complying with
restrictions imposed on the community, such as with water usage restrictions during
periods of water shortage; assisting and participating in community events such as
working bees, festivals or projects; paying fares when using public transport, and paying
taxes. Compliance with or participation in these activities comes at some cost to the
individual, but the benefits accrue to all in the community and therefore indirectly to the
individual.
PO S S I B L E IN D I C A T O R S AN D DA T A I T E M S
The indicators of cooperation have been selected to reflect the concept of community
level cooperation in terms of measuring perceptions and attitudes of community level
cooperation.
1.1.4 Cooperat ion
36 A B S • ME A S U R I N G SO C I A L CA P I T A L , A N A U S T R A L I A N FR A M E W O R K A N D I N D I C A T O R S • 1 3 7 8 . 0 • 2 0 0 4
C H A P T E R 4 — F R A M E W O R K E L E M E N T S A N D I N D I C A T O R S continued
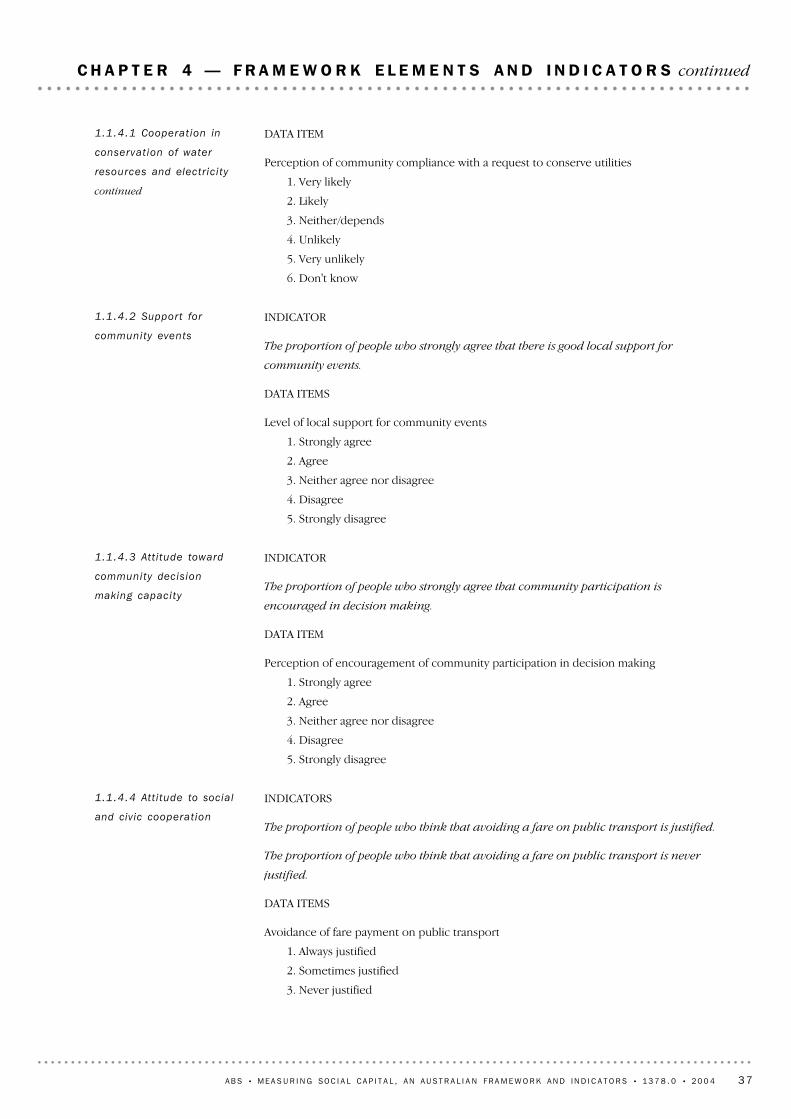
INDICATORS
The proportion of people who think that avoiding a fare on public transport is justified.
The proportion of people who think that avoiding a fare on public transport is never
justified.
DATA ITEMS
Avoidance of fare payment on public transport
1. Always justified
2. Sometimes justified
3. Never justified
1.1.4.4 Att i tude to social
and civ ic cooperat ion
INDICATOR
The proportion of people who strongly agree that community participation is
encouraged in decision making.
DATA ITEM
Perception of encouragement of community participation in decision making
1. Strongly agree
2. Agree
3. Neither agree nor disagree
4. Disagree
5. Strongly disagree
1.1.4.3 Att i tude toward
community decis ion
making capacity
INDICATOR
The proportion of people who strongly agree that there is good local support for
community events.
DATA ITEMS
Level of local support for community events
1. Strongly agree
2. Agree
3. Neither agree nor disagree
4. Disagree
5. Strongly disagree
1.1.4.2 Support for
community events
DATA ITEM
Perception of community compliance with a request to conserve utilities
1. Very likely
2. Likely
3. Neither/depends
4. Unlikely
5. Very unlikely
6. Don't know
1.1.4.1 Cooperat ion in
conservat ion of water
resources and electr ic i ty
continued
A B S • ME A S U R I N G SO C I A L CA P I T A L , A N A U S T R A L I A N FR A M E W O R K A N D I N D I C A T O R S • 1 3 7 8 . 0 • 2 0 0 4 37
C H A P T E R 4 — F R A M E W O R K E L E M E N T S A N D I N D I C A T O R S continued
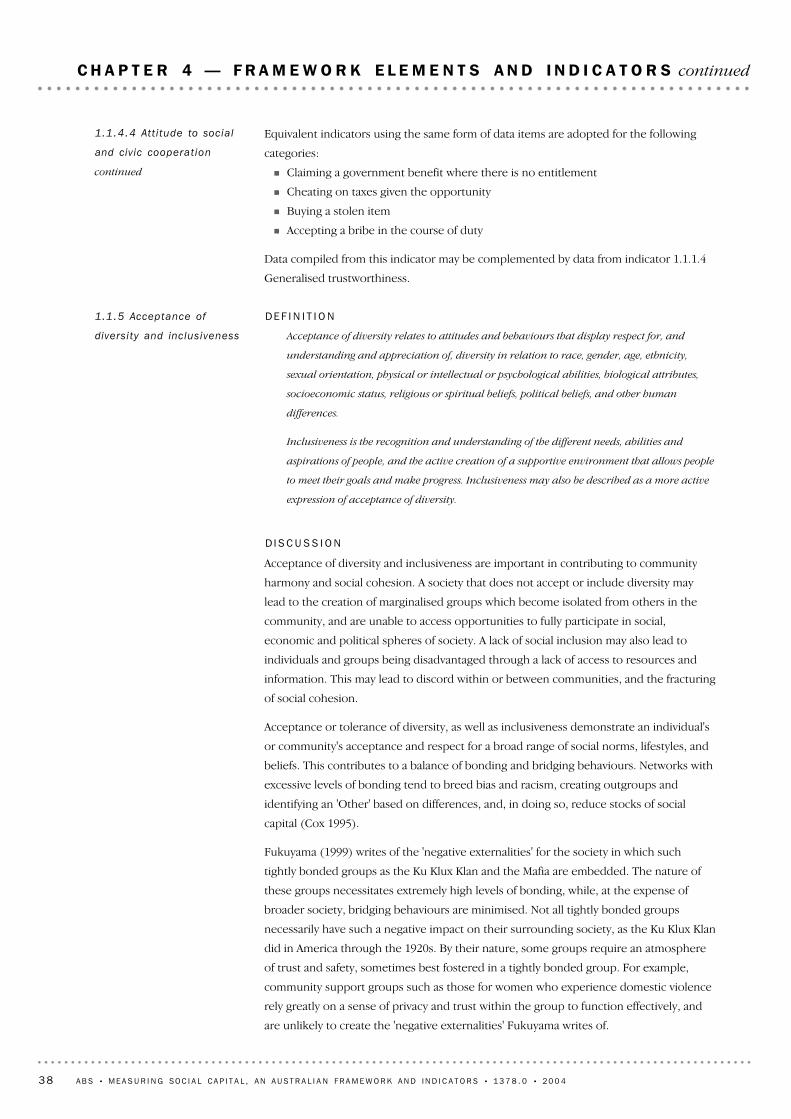
DE F I N I T I O N
Acceptance of diversity relates to attitudes and behaviours that display respect for, and
understanding and appreciation of, diversity in relation to race, gender, age, ethnicity,
sexual orientation, physical or intellectual or psychological abilities, biological attributes,
socioeconomic status, religious or spiritual beliefs, political beliefs, and other human
differences.
Inclusiveness is the recognition and understanding of the different needs, abilities and
aspirations of people, and the active creation of a supportive environment that allows people
to meet their goals and make progress. Inclusiveness may also be described as a more active
expression of acceptance of diversity.
D I S C U S S I O N
Acceptance of diversity and inclusiveness are important in contributing to community
harmony and social cohesion. A society that does not accept or include diversity may
lead to the creation of marginalised groups which become isolated from others in the
community, and are unable to access opportunities to fully participate in social,
economic and political spheres of society. A lack of social inclusion may also lead to
individuals and groups being disadvantaged through a lack of access to resources and
information. This may lead to discord within or between communities, and the fracturing
of social cohesion.
Acceptance or tolerance of diversity, as well as inclusiveness demonstrate an individual's
or community's acceptance and respect for a broad range of social norms, lifestyles, and
beliefs. This contributes to a balance of bonding and bridging behaviours. Networks with
excessive levels of bonding tend to breed bias and racism, creating outgroups and
identifying an 'Other' based on differences, and, in doing so, reduce stocks of social
capital (Cox 1995).
Fukuyama (1999) writes of the 'negative externalities' for the society in which such
tightly bonded groups as the Ku Klux Klan and the Mafia are embedded. The nature of
these groups necessitates extremely high levels of bonding, while, at the expense of
broader society, bridging behaviours are minimised. Not all tightly bonded groups
necessarily have such a negative impact on their surrounding society, as the Ku Klux Klan
did in America through the 1920s. By their nature, some groups require an atmosphere
of trust and safety, sometimes best fostered in a tightly bonded group. For example,
community support groups such as those for women who experience domestic violence
rely greatly on a sense of privacy and trust within the group to function effectively, and
are unlikely to create the 'negative externalities' Fukuyama writes of.
1.1.5 Acceptance of
divers i ty and inclus iveness
Equivalent indicators using the same form of data items are adopted for the following
categories:
! Claiming a government benefit where there is no entitlement
! Cheating on taxes given the opportunity
! Buying a stolen item
! Accepting a bribe in the course of duty
Data compiled from this indicator may be complemented by data from indicator 1.1.1.4
Generalised trustworthiness.
1.1.4.4 Att i tude to social
and civ ic cooperat ion
continued
38 A B S • ME A S U R I N G SO C I A L CA P I T A L , A N A U S T R A L I A N FR A M E W O R K A N D I N D I C A T O R S • 1 3 7 8 . 0 • 2 0 0 4
C H A P T E R 4 — F R A M E W O R K E L E M E N T S A N D I N D I C A T O R S continued
INDICATORS
The proportion of people who enjoy living among people of different lifestyles (e.g.
categories 3 and 4).
The proportion of people who do not enjoy living among people of different lifestyles
(e.g. categories 1 and 2).
DATA ITEM
Enjoyment of living amongst different lifestyles
1. No, not at all
2. Not often
3. Yes, sometimes
4. Yes, definitely
1.1.5.1 Acceptance of
dif ferent lifesty les
D I S C U S S I O N continued
Putnam (2000) discusses the relationship between social capital and inclusiveness,
observing that, in 1950s America, high social capital 'seemed to impose conformity and
social division'. He goes on to describe the seeming decline of social capital in the 1960s
to parallel a more open and tolerant society. However, Putnam also reports a link
between social participation and tolerance, stating that social 'joiners and civic activists
are as a rule more tolerant of dissent and unconventional behaviour than social isolates'
(2000), and notes that those states in America which are accepting of diversity and
inclusive tend to be more successful in terms of economic and civic equality.
This demonstrates the interplay between different network types. Tightly bonded
networks are those that impose the conformity within the groups, and the division with
those outside the groups. Putnam's 'social joiners and civic activists' are demonstrating
bridging behaviours when they act in ways that demonstrate their tolerance for diversity
by actively including those who do not directly fit traditional social norms.
Some research suggests that networks, communities and groups function most
cooperatively as a whole when they are diverse, flexible, and inclusive (Flora 1998). For
this to occur, a network or community needs the capacity to accept and include
diversity, whilst allowing the network and its members to maintain a sense of identity.
Bridging behaviours may act as a basis for inclusion of diversity, by creating links with
those in different groups and communities. Linking behaviours help to establish
connections with those of differing levels of power and resources within a community,
which may assist in increasing the inclusion and efficacy of those in the community who
are disadvantaged.
PO S S I B L E IN D I C A T O R S AN D DA T A I T E M S
The indicators presented below have been selected to indicate the concepts of
acceptance of different lifestyles, support for cultural diversity, and group diversity. The
indicators examine elements of personal and perceived community attitudes towards
acceptance of diversity and inclusiveness.
1.1.5 Acceptance of
divers i ty and inclus iveness
continued
A B S • ME A S U R I N G SO C I A L CA P I T A L , A N A U S T R A L I A N FR A M E W O R K A N D I N D I C A T O R S • 1 3 7 8 . 0 • 2 0 0 4 39
C H A P T E R 4 — F R A M E W O R K E L E M E N T S A N D I N D I C A T O R S continued

INDICATOR
The proportion of people who have seen or experienced negative attitude directed at
themselves or others due to their cultural background, by where this took place.
DATA ITEMS
Experience of negative attitude towards cultural background, at work
0. Not applicable
1. Yes, at work
2. No, at work
The same form of data item is adopted for the following settings:
! At school/university/TAFE
! In the community
1.1.5.4 Expressions of
negat ive behaviours
toward cultural divers i ty
INDICATOR
The proportion of people who undertake social activities only with people who have the
same first language.
DATA ITEMS
Proportion of people undertake social activities with, who have the same first language
1. All
2. Most
3. About Half
4. A Few
5. None
The equivalent indicator using the same form of data item is adopted for the following:
! Those from an ethnic group that is visibly different
! Those with similar education levels
! Those with similar family income levels
! Those in similar age groups.
The equivalent indicator and data item are found in 4.1.1 Group Homogeneity.
1.1.5.3 Group Divers i ty
INDICATORS
The proportion of people who strongly agree that Australian society is enriched by
people coming to live here from other countries.
The proportion of people who strongly disagree that Australian society is enriched by
people coming to live here from other countries.
DATA ITEM
Perception that Australian society is enriched by cultural diversity
1. Strongly agree
2. Agree
3. Neutral
5. Disagree
6. Strongly Disagree
1.1.5.2 Support for
cultural diversi ty
40 A B S • ME A S U R I N G SO C I A L CA P I T A L , A N A U S T R A L I A N FR A M E W O R K A N D I N D I C A T O R S • 1 3 7 8 . 0 • 2 0 0 4
C H A P T E R 4 — F R A M E W O R K E L E M E N T S A N D I N D I C A T O R S continued
INDICATORS
The proportion of people who strongly agree that they are comfortable hearing a
language other than English used in a public place (e.g. public transport, cafe,
workplace, shopping centre).
The proportion of people who strongly disagree that they are comfortable hearing a
language other than English used in a public place (e.g. public transport, cafe,
workplace, shopping centre).
DATA ITEM
Acceptance of use of languages other than English in public places such as cafes and
public transport.
1. Strongly agree
2. Agree
3. Neutral
4. Disagree
5. Strongly disagree
1.1.5.6 Att i tude toward
the pract ice of linguist ic
divers i ty
INDICATORS
The proportion of people who perceive negative attitude towards people of ethnic
background to be increasing in their community in the past two years.
The proportion of people who perceive negative attitude towards people of ethnic
background to be decreasing in their community in the past two years.
DATA ITEM
Negative attitude towards people of ethnic background
1. Decreasing
2. Staying the same
3. Increasing
1.1.5.5 Perception of
change in negative
att itudes toward cultural
divers i ty
! In the media
! Private gatherings of family/friends
! Transport/taxis
! Public events
! Government services
! Real estate agents/private businesses
! Hotels/clubs
! Other.
1.1.5.4 Expressions of
negat ive behaviours
toward cultural divers i ty
continued
A B S • ME A S U R I N G SO C I A L CA P I T A L , A N A U S T R A L I A N FR A M E W O R K A N D I N D I C A T O R S • 1 3 7 8 . 0 • 2 0 0 4 41
C H A P T E R 4 — F R A M E W O R K E L E M E N T S A N D I N D I C A T O R S continued
DE F I N I T I O N
Common purpose is a shared intention or motivation, an intended or desired result, end or
aim for which a group or community come together.
Five types of common purpose are identified in the ABS Social Capital Framework: social
participation; civic participation; community support; friendship; and economic
participation.
Some researchers include all involvement in the life of a society as social participation.
Others such as Putnam define all activities other than economic carried out through
organisations as civic participation.
The ABS Social Capital Framework breaks down what is commonly called social or civic
participation into three types of participation: social participation, civic participation and
community support.
! Civic participation is participation in governance and citizenship including political
activities.
! Social participation is participation in inherently enjoyable activities valued in their
own right, either formal, provided by organised groups, or informal, with family and
friends.
! Community support is participation in those activities that are aimed at providing
assistance to other individuals, groups and the wider community, which are not
directly related to political participation or participation in governance.
DR A F T GR O U P / O R G A N I S A T I O N ME M B E R S H I P T Y P O L O G Y
Membership or participation in groups and organisations is a significant aspect of social
participation, civic participation and community support. Vogel et al. (2003) use the term
associational life to describe this type of participation in community life, and describe the
importance of associational life in developing skills for participation in democracy.
The ABS Voluntary Work Survey defines a group or organisation as any body with a
formal structure. It may be as large as a national charity or as small as a local book club.
Purely ad hoc, informal and temporary gatherings of people do not constitute an
organisation.
There are a diverse range of groups and organisations in existence that reflect different
interests in the community and facilitate the provision of relevant activities. There is
interest in the types of groups that people belong to, the level and intensity of
involvement they have, the types of roles people play, and whether levels of participation
and the types of groups people participate in are changing over time.
To facilitate measurement of these information needs, a membership of/participation in
group/organisation typology is being suggested as a part of the ABS Social Capital
Framework. The draft group typology presented below has been adapted from a number
of sources, primarily surveys which have measured group/organisation membership,
participation and voluntary work. These sources are: 2000 ABS Voluntary Work Survey;
2003 Canadian General Social Survey — Survey on Social Engagement in Canada;
2000–01 Families, Social Capital and Citizenship Project conducted by AIFS; Volunteering
Germany Survey conducted by the Federal Statistics Office in Germany; 2000 Statistics
Sweden Living Conditions Survey; the Middle Australia Project conducted by researcher
1.2 Common Purpose
42 A B S • ME A S U R I N G SO C I A L CA P I T A L , A N A U S T R A L I A N FR A M E W O R K A N D I N D I C A T O R S • 1 3 7 8 . 0 • 2 0 0 4
C H A P T E R 4 — F R A M E W O R K E L E M E N T S A N D I N D I C A T O R S continued

DE F I N I T I O N
Social participation is the involvement in activities that are valued in their own right, and
reflect personal interests or a desire for individual enjoyment and gratification. From this
perspective, social participation includes the following :
activities carried out with family, friends, neighbours and colleagues, such as dining out,
picnics, having a party, going to a concert or dance party, playing cricket, swimming, or just
spending time together
1.2.1 Social Part ic ipat ion
DR A F T GR O U P / O R G A N I S A T I O N ME M B E R S H I P T Y P O L O G Y continued
Michael Pusey (2003); and the International Classification of Non-Profit
Organisations (ICNPO) Revision 1, described in Hall et al. (2000). The draft
group/organisation typology presented here is not an ABS standard classification. Rather
the draft typology appears here as a suggestion for further discussion, evaluation and
comment.
Each of these group/organisation typologies is somewhat different in the categories it
defines. Some of the typologies are less detailed and perhaps limited in their ability to
provide a good understanding of the types of groups and organisations people belong
to, and the types of participation this entails. The draft typology presented below
concords well with that used in the ABS Voluntary Work Survey and the International
Classification of Non-Profit Institutions (ICNPO).
The categories in the draft group/organisation typology for the ABS Social Capital
Framework are as follows:
Social participation
1. Sporting or recreation groups or organisations
2. Arts, culture, or education groups or organisations
3. Craft or hobby groups or organisations
4. Religious or spiritual groups or organisations
5. Social clubs
6. Ethnic or multicultural clubs, or organisations
Civic participation
7. A trade union, professional organisation or technical association
8. Political parties
9. Civic or community groups or organisations
10. Environment or animal welfare groups
11. Human and civil rights groups
12. Body corporate or tenants associations
13. Consumer organisations
Community support
14. Children, parenting or school related groups
15. Services clubs
16. Humanitarian aid groups
17. Welfare groups
18. Health or disability groups, self development groups
19. Voluntary emergency, rescue or fire services organisations
1.2 Common Purpose
continued
A B S • ME A S U R I N G SO C I A L CA P I T A L , A N A U S T R A L I A N FR A M E W O R K A N D I N D I C A T O R S • 1 3 7 8 . 0 • 2 0 0 4 43
C H A P T E R 4 — F R A M E W O R K E L E M E N T S A N D I N D I C A T O R S continued
De f i n i t i o n continued
activities carried out through organised groups, such as hobby clubs, organised tours, art and
craft circles, groups which enable public speaking, singing, performing, playing sport,
sharing the activities of others with a common religious, cultural or ethnic background
supporting or taking advantage of opportunities provided by the community, such as
attending a museum or art gallery, using a public library, attending a football match or a
drama performance, whether or not accompanied by others.
D I S C U S S I O N
Some level of participation in social and cultural life is recognised as a fundamental
human right (enshrined in the Universal Declaration of Human Rights) and need. Social
participation provides the opportunity both to take part in an enjoyed activity and to
interact with others. Bullen and Onyx (1998) recognise that social capital cannot be
developed by individuals acting on their own, but depends on a readiness for sociability,
which is integral to the formation of relationships and building potential social networks.
Social participation has many benefits for the individual, the workplace and the wider
community. Many workplaces encourage a level of social participation among staff to
build cooperative workplace behaviours and, in doing so, increase productivity. At the
community level, festivals and sports events promote a source of identity with the
community as a whole, as was clearly apparent during the Sydney 2000 Olympic Games.
There is evidence that high levels of social participation and social connectedness may
contribute to the overall wellbeing of society as well as contributing to resilience of
individuals and communities. Social participation is considered to have positive impacts
on an individual's health. A number of studies have shown that those with higher levels
of social interaction and participation are likely to enjoy better health and lower their risk
of premature morbidity (Berkman & Glass 2000; Baum et al. 2000).
Research suggests that the more people participate in their communities, including in
social, civic and community support activities, the better their mental health (Centre for
Mental Health Research 2003). Helen Berry, researcher at the Centre for Mental Health
Research, suggests that this is due to participation enhancing health protective factors,
such as a sense of belonging, trust and optimism.
Not all people are able to readily participate in social activities. Psychological,
physiological and sociological factors play a role in participation. Bush and Baum (2001)
observed that level and type of participation were influenced by factors such as age,
gender and income. Barriers to participation identified included transport difficulties,
child care problems, and lack of time. Trust and perceptions of crime and safety in the
community were also found to influence participation. A distrust of others and a feeling
that the community was unsafe or less safe than in the past were attitudes held by some
people who recorded low participation rates (Bush and Baum 2001).
1.2.1 Social Part ic ipat ion
continued
44 A B S • ME A S U R I N G SO C I A L CA P I T A L , A N A U S T R A L I A N FR A M E W O R K A N D I N D I C A T O R S • 1 3 7 8 . 0 • 2 0 0 4
C H A P T E R 4 — F R A M E W O R K E L E M E N T S A N D I N D I C A T O R S continued
INDICATORS
The proportion of people who have a barrier to social participation.
1.2.1.2 Barr iers to social
part ic ipat ion
INDICATOR
The proportion of people who participated in social activities at least once in the last
three months.
DATA ITEM
Participation in social activities in the last three months
1. Yes
2. No
INDICATOR
The proportion of people who participated in social activities at least once in the last
three months, by type of activity.
DATA ITEMS
Participation in social activities in the last three months: Recreation group/cultural group
1. Yes
2. No
The equivalent indicator using the same forms of data item is adopted for the following
social activities:
! Participation in community or special interest group activities
! Participation in religious or spiritual activities
! Participation in sport or physical activities
! Visited library, museum, or art gallery
! Went out to a restaurant/cafe/bar/club
! Attended sporting event as spectator
! Visited park/botanic gardens, zoo or theme park
! Cinema, theatre or concert
! Doing continuing education courses or classes
! Internet chatroom activities
! Visiting friends or being visited by friends
! Going out with a group of friends.
Source: General Social Survey (2002), ABS.
Some additional response categories have been added to the social activities list since
this data item appeared in the General Social Survey. These response categories would
need to be tested.
1.2.1.1 Part ic ipat ion in
social act iv i t ies
PO S S I B L E IN D I C A T O R S AN D DA T A I T E M S
The indicators of social participation have been selected to reflect concepts of both
formal and informal participation. The indicators focus on types of social activities
participated in, membership and participation in clubs and associations, religious
participation, and barriers to social participation.
1.2.1 Social Part ic ipat ion
continued
A B S • ME A S U R I N G SO C I A L CA P I T A L , A N A U S T R A L I A N FR A M E W O R K A N D I N D I C A T O R S • 1 3 7 8 . 0 • 2 0 0 4 45
C H A P T E R 4 — F R A M E W O R K E L E M E N T S A N D I N D I C A T O R S continued
The following set of indicators examines membership of organisations as well as active
participation in these organisations.
INDICATORS
The proportion of people who are members of a club, organisation or association for
social participation.
The type of organisation people are members of for social participation.
DATA ITEMS
Member or involved in organisations, clubs, or associations for social participation
1. Yes
2. No
Type of social participation organisation member of: Sporting or recreation group or
organisation
0. Not applicable
1. Yes
2. No
1.2.1.3 Membership of
clubs, organisat ions or
associat ions
Type of barrier to social participation.
Where this indicator is measured in a survey, it could be prefaced with a question on
satisfaction with levels of social participation.
DATA ITEMS
Experienced barrier to social participation
1. Yes
2. No
Type of barrier to social participation experienced: Not interested
0. Not applicable
1. Yes
2. No
The equivalent indicators using the same forms of data items are adopted for the
following barriers to social participation groups:
! Lack of interesting social options/activities/venues
! Lack of money
! Fear of burglary, vandalism or personal attack
! Child-care responsibilities
! Other caring responsibilities (elderly, persons with a disability, ill etc.)
! Personal disability, or physical or mental health issues
! Lack of time due to paid work
! Lack of sufficient private/public transport
! No one to go with (social reasons)
! Feel unwelcome (due to disability, cultural difference, gender, age, socio-economic
status etc.)
! Language barrier/difficulties.
1.2.1.2 Barr iers to social
part ic ipat ion continued
46 A B S • ME A S U R I N G SO C I A L CA P I T A L , A N A U S T R A L I A N FR A M E W O R K A N D I N D I C A T O R S • 1 3 7 8 . 0 • 2 0 0 4
C H A P T E R 4 — F R A M E W O R K E L E M E N T S A N D I N D I C A T O R S continued
The previous indicator could be followed by an indicator on the number of these types
of groups that the respondent is active in. This indicator could also examine elements of
network size.
INDICATOR
The proportion of the population by the number of social participation groups actively
involved in. (e.g. proportion of population involved in 3 or more social participation
groups.)
1.2.1.5 Number of clubs,
organisat ions or
associat ions act ive in
INDICATORS
The proportion of people who have been actively involved in an organisation for social
participation in the last 12 months.
The type of social participation organisation people are actively involved in.
DATA ITEMS
Active involvement in organisations, clubs or associations for social participation in last
three months
0. Not applicable
1. Yes
2. No
Actively involved in social participation organisation in last three months: Sporting or
recreation group or organisation
0. Not applicable
1. Yes
2. No
The equivalent indicators using the same form of data items are adopted for the
following social participation groups:
! Arts, culture, or education group or organisation
! Craft or hobby group or organisation
! Religious or spiritual group or organisation
! Social club
! Ethnic or multicultural club, or organisation.
1.2.1.4 Act ive
involvement in clubs,
organisat ions or
associat ions
The equivalent indicators using the same forms of data items are adopted for the
following social participation groups:
! Arts, culture, or education group or organisation
! Craft or hobby group or organisation
! Religious or spiritual group or organisation
! Social club
! Ethnic or multicultural club, or organisation.
1.2.1.3 Membership of
clubs, organisat ions or
associat ions continued
A B S • ME A S U R I N G SO C I A L CA P I T A L , A N A U S T R A L I A N FR A M E W O R K A N D I N D I C A T O R S • 1 3 7 8 . 0 • 2 0 0 4 47
C H A P T E R 4 — F R A M E W O R K E L E M E N T S A N D I N D I C A T O R S continued
INDICATOR
The proportion of the population by duration of attendance at religious services or
meetings.
1.2.1.8 Durat ion of
rel ig ious attendance
INDICATORS
The proportion of the population who are frequent participants in religious services or
meetings.
The proportion of the population who are infrequent participants in religious services
or meetings.
The proportion of the population who are non-participants in religious services or
meetings.
DATA ITEM
Frequency of religious participation.
1. At least once a week
2. Once or twice a month
3. Every few months
4. Once or twice a year
5. Not at all
1.2.1.7 Relig ious
attendance
INDICATOR
The proportion of the population with a religious affiliation.
DATA ITEM
Whether has religious affiliation
1. Yes
2. No
This could be accompanied by an indicator on the type of religious affiliation.
1.2.1.6 Relig ious
aff i l iat ion
DATA ITEMS
Number of social participation groups active in (the past 12 months)
1. None
2. 1–2
3. 3–5
4. 6–9
5. 10 or more
1.2.1.5 Number of clubs,
organisat ions or
associat ions act ive in
continued
48 A B S • ME A S U R I N G SO C I A L CA P I T A L , A N A U S T R A L I A N FR A M E W O R K A N D I N D I C A T O R S • 1 3 7 8 . 0 • 2 0 0 4
C H A P T E R 4 — F R A M E W O R K E L E M E N T S A N D I N D I C A T O R S continued
DE F I N I T I O N
Civic participation is the involvement in activities reflecting interest and engagement with
governance and democracy, such as membership of political parties and trade
unions/professional associations, serving on committees of clubs and associations,
contacting members of parliament, and attending community consultations. A civically
active populace is engaged in the process of governance through concern about a range of
issues that may affect themselves personally, or their community or society in a broader
sense. Civic participation is the process by which citizen's concerns, needs and values are
incorporated into governmental decision making.
D I S C U S S I O N
Civic participation is a two way communication process between the government and
citizens. The overall goal is for better decisions, supported by the public and fostering
the increased wellbeing of the population (World Bank 2002).
It is widely suggested that active citizen engagement is important for better government.
Putnam (1993b) observed marked differences in efficacy and performance amongst
regional governments in Italy and sought to discover the reasons for these differences.
Putnam observed some regions of Italy to have vibrant networks and norms of civic
engagement (measured by the density of clubs and associations in each region;
newspaper readership used as a measure of interest in civic affairs; voter turn out in
electoral referenda; and preference voting in general elections) while others were
characterised by vertically structured politics, a social life of fragmentation and isolation,
and a culture of distrust. In general the regions in the north and centre of Italy were
characterised by stronger and more vibrant culture of civic engagement, contrasting with
less and weaker civic engagement in the southern regions of Italy.
Putnam (2000) argues that civic engagement is associated with better government in two
ways: citizens in civic communities expect better government, and (in part through their
own efforts) get it, and that the performance of representative government is facilitated
by the social infrastructure of civic communities and by the democratic values of both
officials and citizens. Swedes regard participation in civic activities as training for effective
democracy (Vogel et al. 2003).
Civic participation involves both collective and individual activities. A significant
component of the collective activities is that of membership of civic organisations, such
as political parties and trade unions, as well as serving on committees of clubs, voluntary
organisations and associations. Not only do these activities open up and extend the
social networks of the people participating, but they are activities in which people
1.2.2 Civ ic part ic ipat ion
DATA ITEM
Number of years attended religious services or meetings.
0. Not applicable
1. Less than 1 year
2. 1–2 years
3. 3–4 years
4. 5 years
5. Over 5 years
1.2.1.8 Durat ion of
rel ig ious attendance
continued
A B S • ME A S U R I N G SO C I A L CA P I T A L , A N A U S T R A L I A N FR A M E W O R K A N D I N D I C A T O R S • 1 3 7 8 . 0 • 2 0 0 4 49
C H A P T E R 4 — F R A M E W O R K E L E M E N T S A N D I N D I C A T O R S continued
INDICATORS
The proportion of the population who participated in individual civic activities in the
last 12 months.
The proportion of the population who participated in collective civic activities in the
last 12 months.
Type of civic activity involved in, in the last 12 months.
DATA ITEMS
Participation in individual civic activities in the last 12 months
1. Yes
2. No
Participation in collective civic activities in the last 12 months
1. Yes
2. No
1.2.2.1 Level of civ ic
part ic ipat ion
D I S C U S S I O N continued
develop important skills for participating in democracy and governance. Both
Putnam(2000) and Vogel et al. (2003) emphasise the honing of skills such as the ability
to evaluate and argue a case, to make collective decisions, to run meetings and organise
projects, and to debate public issues with civility.
There is some evidence to suggest that levels of civic participation are declining in many
countries including the United States and Sweden, and suggestions that some forms of
civic participation are also in decline in Australia. Data analysed by Putnam (2000) from
the Roper Polls indicated that in the USA involvement in all types of civic participation
activities, from signing petitions to running for public office, has declined. Putnam notes
that involvement with political parties and volunteer campaigning activities has declined,
while spending on presidential campaigns has increased markedly. Vogel et al. (2003)
present data showing that membership (both active and passive) has declined in
organisations such as political parties and trade unions. In a recent speech Lawrence
(2003) suggested that interest in politics, and participation in campaigns and volunteer
work for political parties in Australia is in decline.
Critics of this view suggest that other forms of participation are replacing membership of
civic groups. These might include support for global or local advocacy groups or
campaigns, email networks, well publicised one day activities such as 'Clean Up Australia'
events, or local tree planting days. As yet there is insufficient evidence on these types of
activities to indicate whether they alter the apparent decline.
PO S S I B L E IN D I C A T O R S AN D DA T A I T E M S
The indicators of civic participation have been selected to reflect concepts of both
individual and collective civic participation. The indicators of civic participation focus on
activities that reflect an interest and engagement with governance and democracy, such
as membership of political parties, serving on committees of clubs and associations and
contacting members of parliament.
1.2.2 Civ ic part ic ipat ion
continued
50 A B S • ME A S U R I N G SO C I A L CA P I T A L , A N A U S T R A L I A N FR A M E W O R K A N D I N D I C A T O R S • 1 3 7 8 . 0 • 2 0 0 4
C H A P T E R 4 — F R A M E W O R K E L E M E N T S A N D I N D I C A T O R S continued
The following set of indicators examines membership of organisations as well as active
participation in these organisations.
INDICATORS
The proportion of the population who are members of a club, organisation or
association for civic activities.
The type of organisation people are members of for civic participation.
DATA ITEM
Member of or involved in organisations, clubs, or associations for civic activities
1. Yes
2. No
1.2.2.3 Membership in
clubs, organisat ions or
associat ions
INDICATOR
Average annual hours per person spent on civic activities.
The ABS 1997 Time Use Survey provides information on the time that people spend with
others, who they spend time with, and what activity they were participating in. Actual
time spent on civic activities by the whole population can be derived from this survey.
DATA ITEMS
Annual hours spent attending meetings
The same form of data item is adopted for the following activities:
! Civic ceremonies
! Civic obligations.
Source: Time Use Survey (1997), ABS.
1.2.2.2 Time spent on
community part ic ipat ion
activ i t ies
Type of civic activity in the last 12 months: Attended a council meeting
0. Not applicable (No participation in civic activities in last 12 months)
1. Yes
2. No
The equivalent indicators using the same form of data items are adopted for the
following civic participation activities:
! Written to the council
! Contacted a member of parliament
! Contacted a local councillor
! Signed a petition
! Attended a protest march/meeting/rally
! Written a letter to the editor of a newspaper
! Participated in a political campaign
! Boycotted or deliberately bought certain products for political, ethical or
environmental reasons
! Participated in a community consultation or attended a public meeting
! Participated in a strike or picket
! Phoned a 'talkback' radio program.
1.2.2.1 Level of civ ic
part ic ipat ion continued
A B S • ME A S U R I N G SO C I A L CA P I T A L , A N A U S T R A L I A N FR A M E W O R K A N D I N D I C A T O R S • 1 3 7 8 . 0 • 2 0 0 4 51
C H A P T E R 4 — F R A M E W O R K E L E M E N T S A N D I N D I C A T O R S continued
The previous indicator could be followed by an indicator on the number of these types
of groups that the respondent is active in. This indicator could also examine elements of
network size.
INDICATOR
The proportion of people by the number of civic participation groups they are actively
involved in (in the past 12 months).
1.2.2.5 Number of groups
active in
INDICATORS
The proportion of people who have been actively involved in an organisation relating
to civic participation in the last 12 months.
The type of organisation people are actively involved in.
DATA ITEMS
Active involvement in organisations, clubs or associations relating to civic participation
1. Yes
2. No
Type of organisation actively involved in: Trade union, professional organisation or
technical association
0. Not applicable (not actively involved in organisation for civic participation)
1. Yes
2. No
The equivalent indicators using the same form of data items are adopted for the
following civic participation groups:
! Political party
! Civic or community group or organisation
! Environment or animal welfare group
! Human and civil rights group
! Body corporate or tenants association
! Consumer organisation.
1.2.2.4 Act ive
involvement in clubs,
organisat ions or
associat ions
Type of organisation member of: Trade union, professional organisation or technical
association
0. Not applicable (Not a member of an organisation for civic activities)
1. Yes
2. No
The equivalent indicators using the same form of data item is adopted for the following
civic participation groups:
! Political party
! Civic or community group or organisation
! Environment or animal welfare group
! Human and civil rights group
! Body corporate or tenants association
! Consumer organisation.
1.2.2.3 Membership in
clubs, organisat ions or
associat ions continued
52 A B S • ME A S U R I N G SO C I A L CA P I T A L , A N A U S T R A L I A N FR A M E W O R K A N D I N D I C A T O R S • 1 3 7 8 . 0 • 2 0 0 4
C H A P T E R 4 — F R A M E W O R K E L E M E N T S A N D I N D I C A T O R S continued
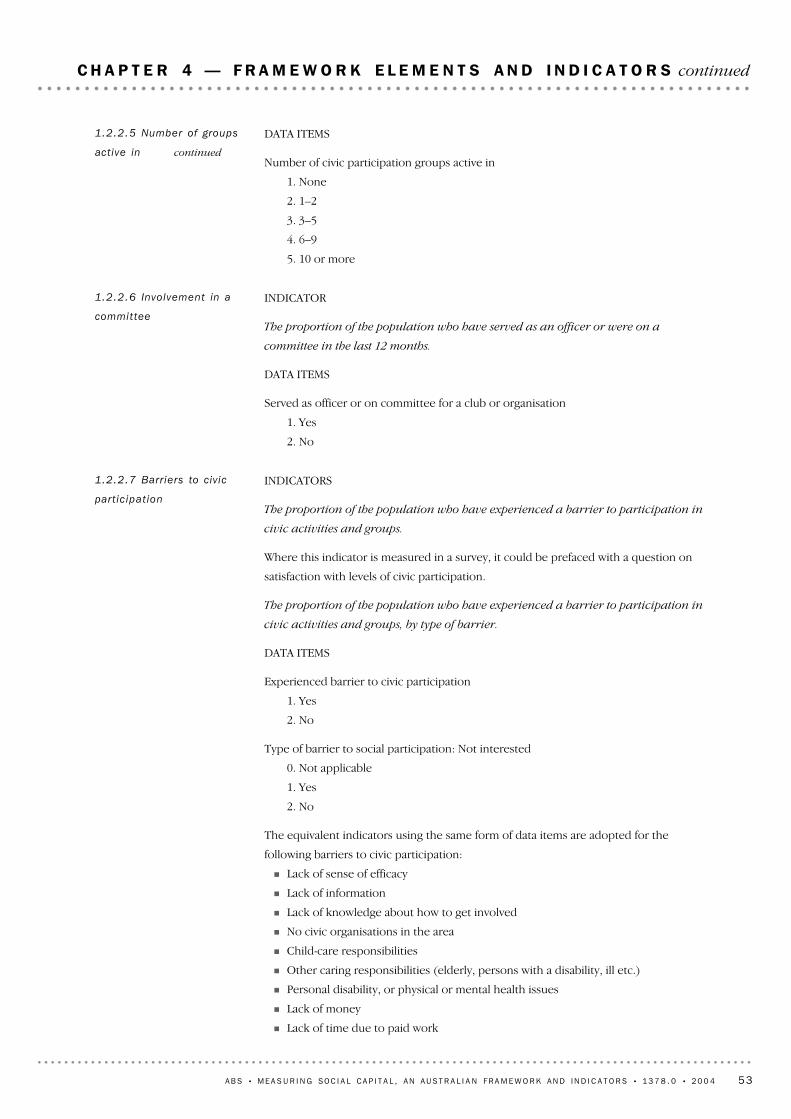
INDICATORS
The proportion of the population who have experienced a barrier to participation in
civic activities and groups.
Where this indicator is measured in a survey, it could be prefaced with a question on
satisfaction with levels of civic participation.
The proportion of the population who have experienced a barrier to participation in
civic activities and groups, by type of barrier.
DATA ITEMS
Experienced barrier to civic participation
1. Yes
2. No
Type of barrier to social participation: Not interested
0. Not applicable
1. Yes
2. No
The equivalent indicators using the same form of data items are adopted for the
following barriers to civic participation:
! Lack of sense of efficacy
! Lack of information
! Lack of knowledge about how to get involved
! No civic organisations in the area
! Child-care responsibilities
! Other caring responsibilities (elderly, persons with a disability, ill etc.)
! Personal disability, or physical or mental health issues
! Lack of money
! Lack of time due to paid work
1.2.2.7 Barr iers to civ ic
part ic ipat ion
INDICATOR
The proportion of the population who have served as an officer or were on a
committee in the last 12 months.
DATA ITEMS
Served as officer or on committee for a club or organisation
1. Yes
2. No
1.2.2.6 Involvement in a
committee
DATA ITEMS
Number of civic participation groups active in
1. None
2. 1–2
3. 3–5
4. 6–9
5. 10 or more
1.2.2.5 Number of groups
active in continued
A B S • ME A S U R I N G SO C I A L CA P I T A L , A N A U S T R A L I A N FR A M E W O R K A N D I N D I C A T O R S • 1 3 7 8 . 0 • 2 0 0 4 53
C H A P T E R 4 — F R A M E W O R K E L E M E N T S A N D I N D I C A T O R S continued
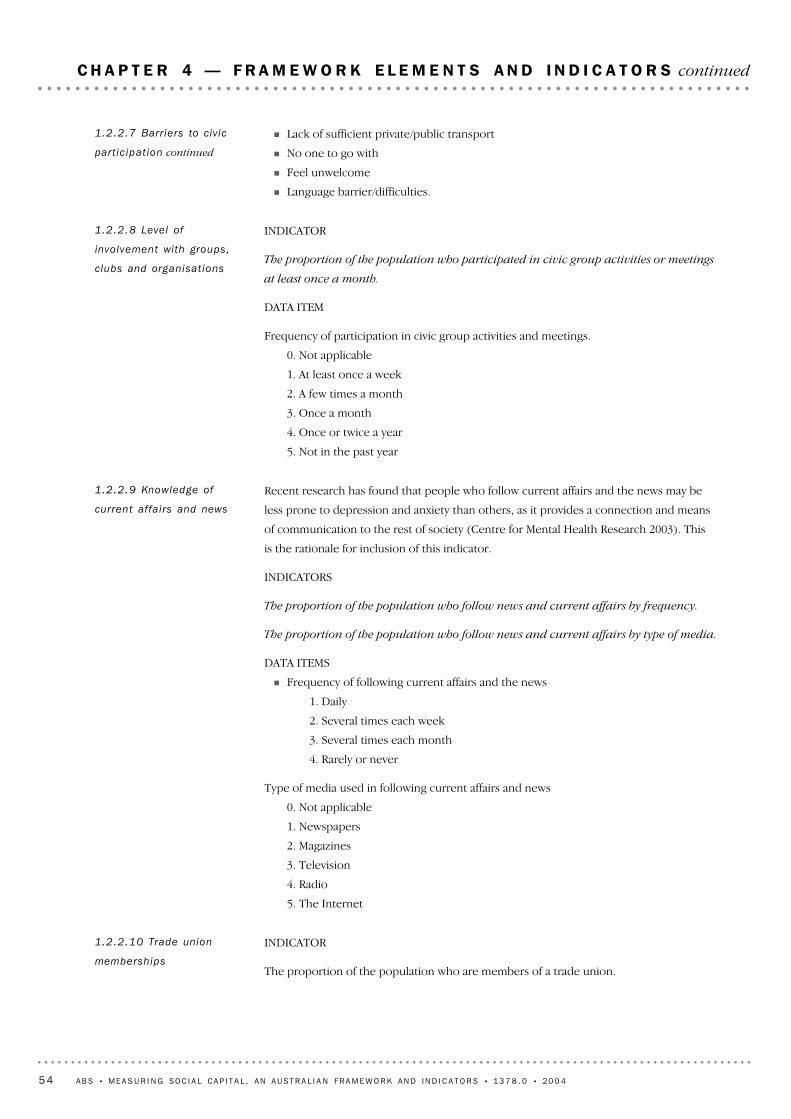
INDICATOR
The proportion of the population who are members of a trade union.
1.2.2.10 Trade union
memberships
Recent research has found that people who follow current affairs and the news may be
less prone to depression and anxiety than others, as it provides a connection and means
of communication to the rest of society (Centre for Mental Health Research 2003). This
is the rationale for inclusion of this indicator.
INDICATORS
The proportion of the population who follow news and current affairs by frequency.
The proportion of the population who follow news and current affairs by type of media.
DATA ITEMS
! Frequency of following current affairs and the news
1. Daily
2. Several times each week
3. Several times each month
4. Rarely or never
Type of media used in following current affairs and news
0. Not applicable
1. Newspapers
2. Magazines
3. Television
4. Radio
5. The Internet
1.2.2.9 Knowledge of
current affairs and news
INDICATOR
The proportion of the population who participated in civic group activities or meetings
at least once a month.
DATA ITEM
Frequency of participation in civic group activities and meetings.
0. Not applicable
1. At least once a week
2. A few times a month
3. Once a month
4. Once or twice a year
5. Not in the past year
1.2.2.8 Level of
involvement with groups,
clubs and organisat ions
! Lack of sufficient private/public transport
! No one to go with
! Feel unwelcome
! Language barrier/difficulties.
1.2.2.7 Barr iers to civ ic
part ic ipat ion continued
54 A B S • ME A S U R I N G SO C I A L CA P I T A L , A N A U S T R A L I A N FR A M E W O R K A N D I N D I C A T O R S • 1 3 7 8 . 0 • 2 0 0 4
C H A P T E R 4 — F R A M E W O R K E L E M E N T S A N D I N D I C A T O R S continued
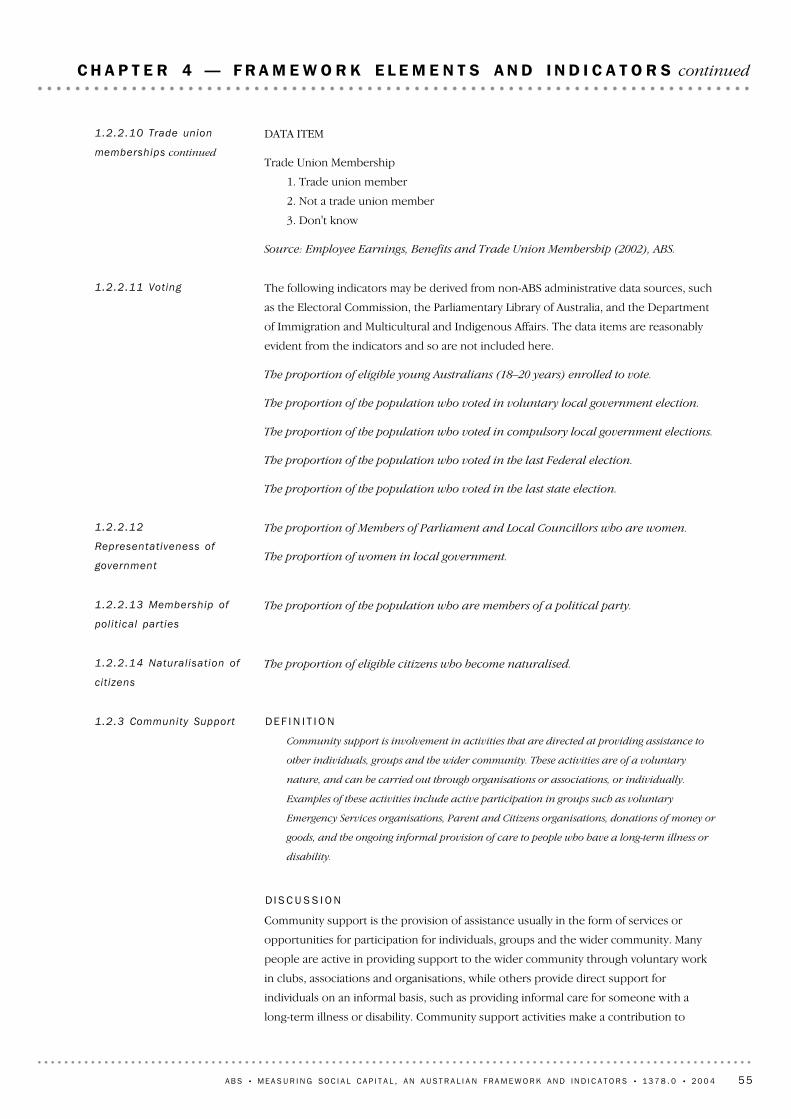
DE F I N I T I O N
Community support is involvement in activities that are directed at providing assistance to
other individuals, groups and the wider community. These activities are of a voluntary
nature, and can be carried out through organisations or associations, or individually.
Examples of these activities include active participation in groups such as voluntary
Emergency Services organisations, Parent and Citizens organisations, donations of money or
goods, and the ongoing informal provision of care to people who have a long-term illness or
disability.
D I S C U S S I O N
Community support is the provision of assistance usually in the form of services or
opportunities for participation for individuals, groups and the wider community. Many
people are active in providing support to the wider community through voluntary work
in clubs, associations and organisations, while others provide direct support for
individuals on an informal basis, such as providing informal care for someone with a
long-term illness or disability. Community support activities make a contribution to
1.2.3 Community Support
The proportion of eligible citizens who become naturalised.1.2.2.14 Natural isat ion of
cit izens
The proportion of the population who are members of a political party.1.2.2.13 Membership of
pol i t ical part ies
The proportion of Members of Parliament and Local Councillors who are women.
The proportion of women in local government.
1.2.2.12
Representat iveness of
government
The following indicators may be derived from non-ABS administrative data sources, such
as the Electoral Commission, the Parliamentary Library of Australia, and the Department
of Immigration and Multicultural and Indigenous Affairs. The data items are reasonably
evident from the indicators and so are not included here.
The proportion of eligible young Australians (18–20 years) enrolled to vote.
The proportion of the population who voted in voluntary local government election.
The proportion of the population who voted in compulsory local government elections.
The proportion of the population who voted in the last Federal election.
The proportion of the population who voted in the last state election.
1.2.2.11 Voting
DATA ITEM
Trade Union Membership
1. Trade union member
2. Not a trade union member
3. Don't know
Source: Employee Earnings, Benefits and Trade Union Membership (2002), ABS.
1.2.2.10 Trade union
memberships continued
A B S • ME A S U R I N G SO C I A L CA P I T A L , A N A U S T R A L I A N FR A M E W O R K A N D I N D I C A T O R S • 1 3 7 8 . 0 • 2 0 0 4 55
C H A P T E R 4 — F R A M E W O R K E L E M E N T S A N D I N D I C A T O R S continued
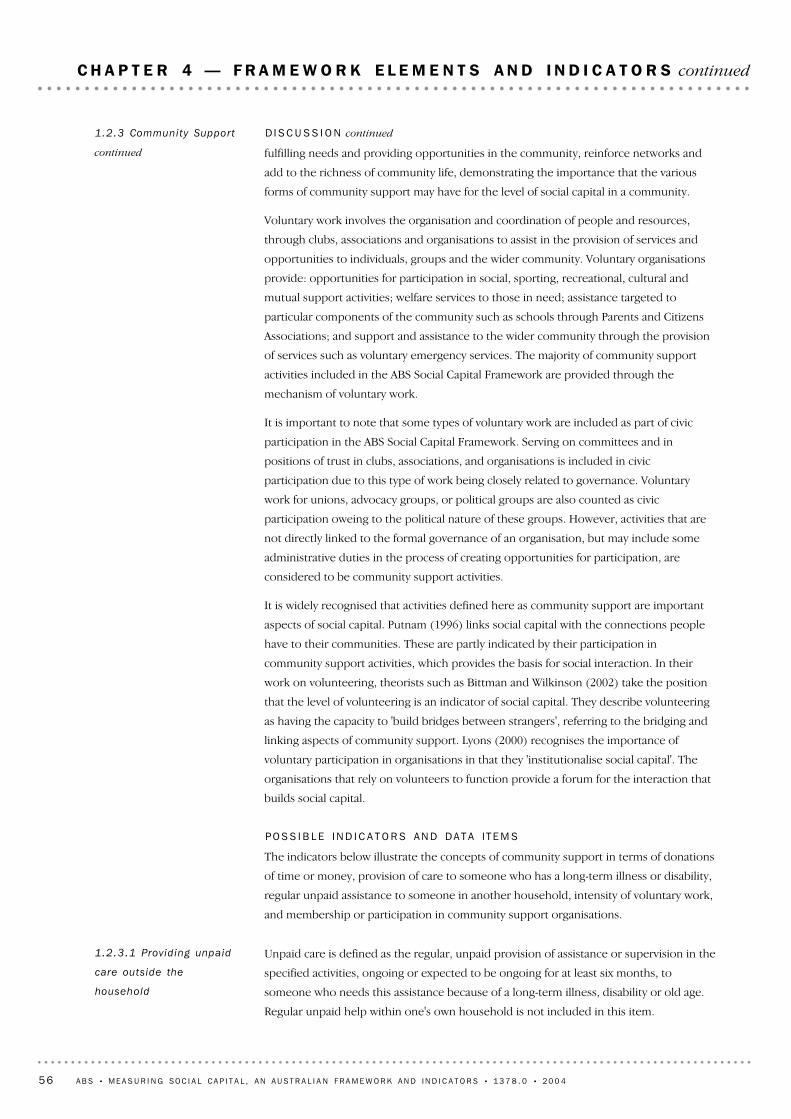
Unpaid care is defined as the regular, unpaid provision of assistance or supervision in the
specified activities, ongoing or expected to be ongoing for at least six months, to
someone who needs this assistance because of a long-term illness, disability or old age.
Regular unpaid help within one's own household is not included in this item.
1.2.3.1 Provid ing unpaid
care outside the
household
D I S C U S S I O N continued
fulfilling needs and providing opportunities in the community, reinforce networks and
add to the richness of community life, demonstrating the importance that the various
forms of community support may have for the level of social capital in a community.
Voluntary work involves the organisation and coordination of people and resources,
through clubs, associations and organisations to assist in the provision of services and
opportunities to individuals, groups and the wider community. Voluntary organisations
provide: opportunities for participation in social, sporting, recreational, cultural and
mutual support activities; welfare services to those in need; assistance targeted to
particular components of the community such as schools through Parents and Citizens
Associations; and support and assistance to the wider community through the provision
of services such as voluntary emergency services. The majority of community support
activities included in the ABS Social Capital Framework are provided through the
mechanism of voluntary work.
It is important to note that some types of voluntary work are included as part of civic
participation in the ABS Social Capital Framework. Serving on committees and in
positions of trust in clubs, associations, and organisations is included in civic
participation due to this type of work being closely related to governance. Voluntary
work for unions, advocacy groups, or political groups are also counted as civic
participation oweing to the political nature of these groups. However, activities that are
not directly linked to the formal governance of an organisation, but may include some
administrative duties in the process of creating opportunities for participation, are
considered to be community support activities.
It is widely recognised that activities defined here as community support are important
aspects of social capital. Putnam (1996) links social capital with the connections people
have to their communities. These are partly indicated by their participation in
community support activities, which provides the basis for social interaction. In their
work on volunteering, theorists such as Bittman and Wilkinson (2002) take the position
that the level of volunteering is an indicator of social capital. They describe volunteering
as having the capacity to 'build bridges between strangers', referring to the bridging and
linking aspects of community support. Lyons (2000) recognises the importance of
voluntary participation in organisations in that they 'institutionalise social capital'. The
organisations that rely on volunteers to function provide a forum for the interaction that
builds social capital.
PO S S I B L E IN D I C A T O R S AN D DA T A I T E M S
The indicators below illustrate the concepts of community support in terms of donations
of time or money, provision of care to someone who has a long-term illness or disability,
regular unpaid assistance to someone in another household, intensity of voluntary work,
and membership or participation in community support organisations.
1.2.3 Community Support
continued
56 A B S • ME A S U R I N G SO C I A L CA P I T A L , A N A U S T R A L I A N FR A M E W O R K A N D I N D I C A T O R S • 1 3 7 8 . 0 • 2 0 0 4
C H A P T E R 4 — F R A M E W O R K E L E M E N T S A N D I N D I C A T O R S continued

INDICATORS
The proportion of people who provide unpaid care (as defined in 1.2.3.1) for someone
in the same household.
Type of unpaid help provided for someone in the same household.
DATA ITEMS
Provides unpaid help within the household
1. Yes
2. No
Type of unpaid help provided within the household: Self care
0. Not applicable
1. Yes
2. No
The equivalent indicators using the same form of data items are adopted for the
following types of care:
! Mobility
! Communication
! Health care
! Home help
1.2.3.2 Provid ing care in
the household
INDICATORS
The proportion of people who provide unpaid care for someone not in the same
household.
Type of unpaid care provided for someone not in the same household.
DATA ITEMS
Provides unpaid care outside the household
1. Yes
2. No
Type of unpaid care provided outside the household: Self care
0. Not applicable
1. Yes
2. No
The same form of data item is adopted for the following types of care:
! Mobility
! Communication
! Health care
! Home help
! Home maintenance
! Meals
! Financial assistance
! Cognitive or emotional support
! Transport.
1.2.3.1 Provid ing unpaid
care outside the
household continued
A B S • ME A S U R I N G SO C I A L CA P I T A L , A N A U S T R A L I A N FR A M E W O R K A N D I N D I C A T O R S • 1 3 7 8 . 0 • 2 0 0 4 57
C H A P T E R 4 — F R A M E W O R K E L E M E N T S A N D I N D I C A T O R S continued
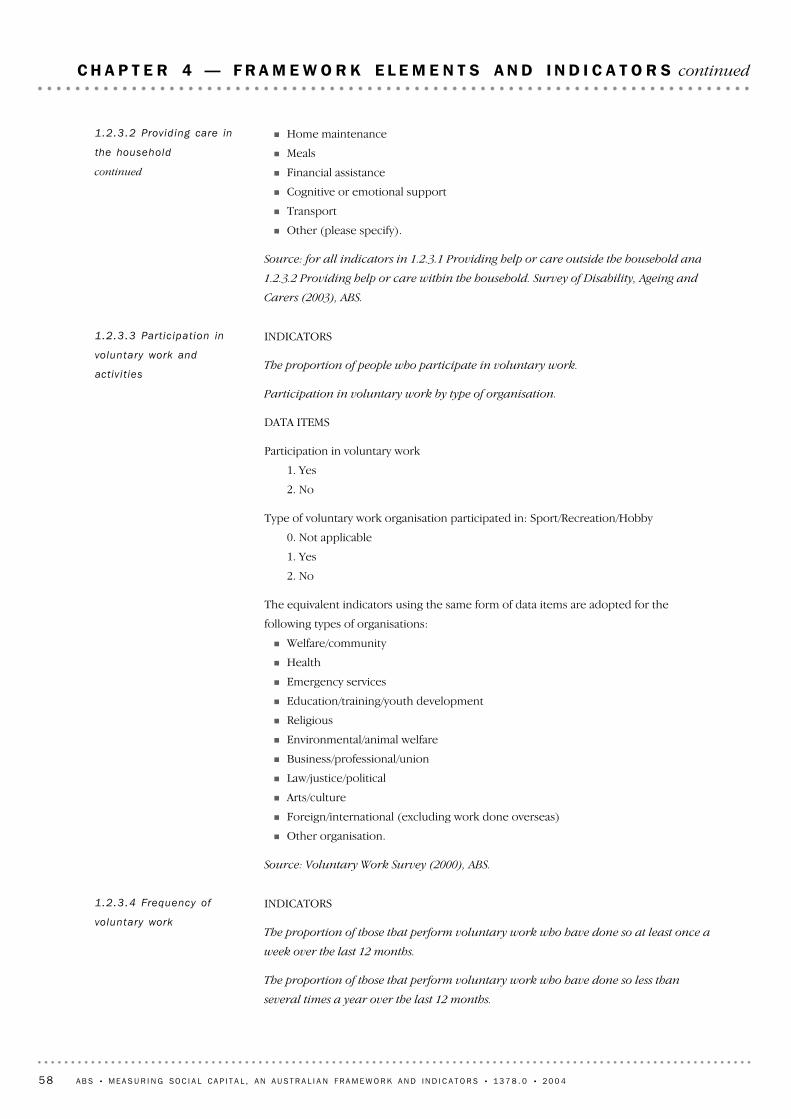
INDICATORS
The proportion of those that perform voluntary work who have done so at least once a
week over the last 12 months.
The proportion of those that perform voluntary work who have done so less than
several times a year over the last 12 months.
1.2.3.4 Frequency of
voluntary work
INDICATORS
The proportion of people who participate in voluntary work.
Participation in voluntary work by type of organisation.
DATA ITEMS
Participation in voluntary work
1. Yes
2. No
Type of voluntary work organisation participated in: Sport/Recreation/Hobby
0. Not applicable
1. Yes
2. No
The equivalent indicators using the same form of data items are adopted for the
following types of organisations:
! Welfare/community
! Health
! Emergency services
! Education/training/youth development
! Religious
! Environmental/animal welfare
! Business/professional/union
! Law/justice/political
! Arts/culture
! Foreign/international (excluding work done overseas)
! Other organisation.
Source: Voluntary Work Survey (2000), ABS.
1.2.3.3 Part ic ipat ion in
voluntary work and
activ i t ies
! Home maintenance
! Meals
! Financial assistance
! Cognitive or emotional support
! Transport
! Other (please specify).
Source: for all indicators in 1.2.3.1 Providing help or care outside the household and
1.2.3.2 Providing help or care within the household. Survey of Disability, Ageing and
Carers (2003), ABS.
1.2.3.2 Provid ing care in
the household
continued
58 A B S • ME A S U R I N G SO C I A L CA P I T A L , A N A U S T R A L I A N FR A M E W O R K A N D I N D I C A T O R S • 1 3 7 8 . 0 • 2 0 0 4
C H A P T E R 4 — F R A M E W O R K E L E M E N T S A N D I N D I C A T O R S continued
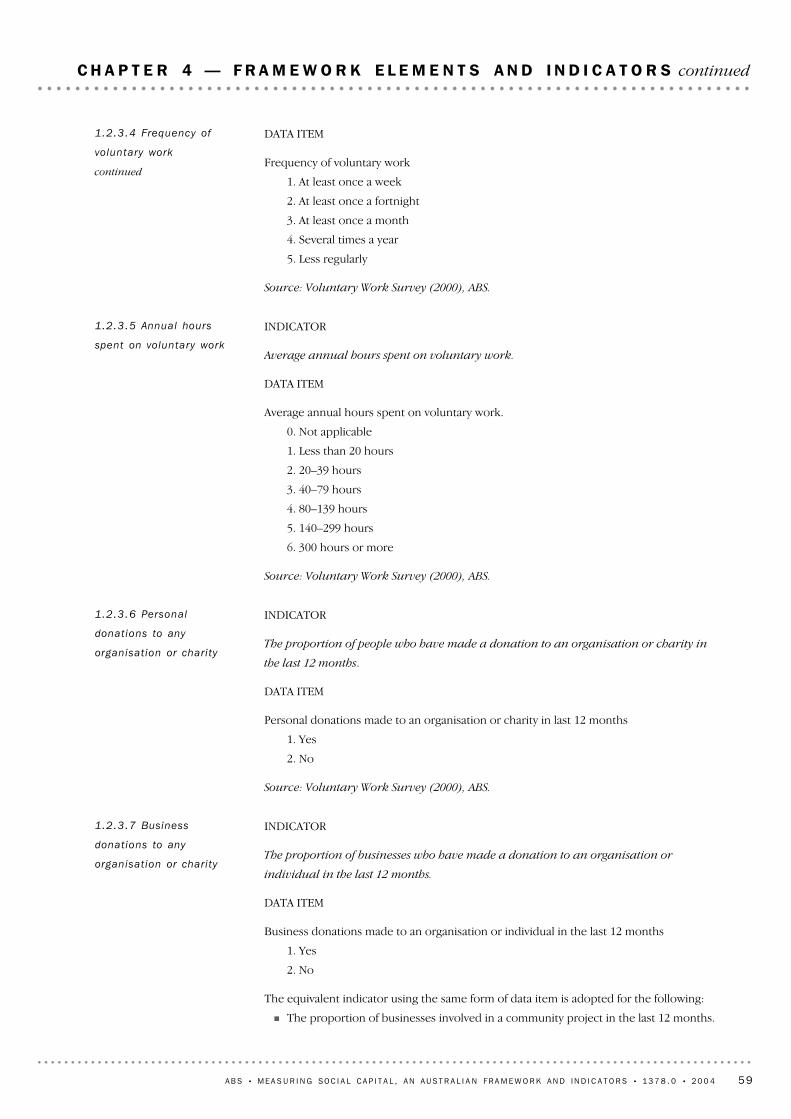
INDICATOR
The proportion of businesses who have made a donation to an organisation or
individual in the last 12 months.
DATA ITEM
Business donations made to an organisation or individual in the last 12 months
1. Yes
2. No
The equivalent indicator using the same form of data item is adopted for the following:
! The proportion of businesses involved in a community project in the last 12 months.
1.2.3.7 Business
donat ions to any
organisat ion or chari ty
INDICATOR
The proportion of people who have made a donation to an organisation or charity in
the last 12 months.
DATA ITEM
Personal donations made to an organisation or charity in last 12 months
1. Yes
2. No
Source: Voluntary Work Survey (2000), ABS.
1.2.3.6 Personal
donat ions to any
organisat ion or chari ty
INDICATOR
Average annual hours spent on voluntary work.
DATA ITEM
Average annual hours spent on voluntary work.
0. Not applicable
1. Less than 20 hours
2. 20–39 hours
3. 40–79 hours
4. 80–139 hours
5. 140–299 hours
6. 300 hours or more
Source: Voluntary Work Survey (2000), ABS.
1.2.3.5 Annual hours
spent on voluntary work
DATA ITEM
Frequency of voluntary work
1. At least once a week
2. At least once a fortnight
3. At least once a month
4. Several times a year
5. Less regularly
Source: Voluntary Work Survey (2000), ABS.
1.2.3.4 Frequency of
voluntary work
continued
A B S • ME A S U R I N G SO C I A L CA P I T A L , A N A U S T R A L I A N FR A M E W O R K A N D I N D I C A T O R S • 1 3 7 8 . 0 • 2 0 0 4 59
C H A P T E R 4 — F R A M E W O R K E L E M E N T S A N D I N D I C A T O R S continued

DE F I N I T I O N
Friendship is a relationship between persons well known to each other which involves liking
and affection, and may also involve mutual obligations such as loyalty (Jary & Jary 2000).
Friendships generally provide networks of trust, reciprocity and cooperation.
D I S C U S S I O N
Friendships may develop in a variety of settings, including, but not limited to, within
family, at work, at school, in the neighbourhood, and in clubs and organisations.
Friendships may develop in any setting in which people have regular contact and share
common interests.
Friendship is seen as an important aspect of social capital, as the number, types and
quality of relationships between people within social networks, and the shared identities
that develop, can influence the amount of support an individual has, as well as giving
access to other sources of support. Friendship may also contribute to an overall sense of
belonging, increased levels of trust and the sharing of information and introductions
within a friendship network.
1.2.4 Friendship
INDICATORS
The proportion of the population who are members of a club, organisation or
association for community support.
The proportion of the population who are members of a club, organisation or
association for community support by type of organisation.
DATA ITEMS
Membership of organisations, clubs, or associations for community support
0. Not applicable
1. Yes
2. No
Type of community support organisations, clubs, or associations member of: Service club
0. Not applicable
1. Yes
2. No
The equivalent indicators using the same form of data items are adopted for the
following community support groups:
! Children, parenting or school related group
! Humanitarian aid group
! Welfare group
! Health or disability group, self development group
! Voluntary emergency, rescue or fire services organisation.
1.2.3.8 Membership in
clubs, organisat ions or
associat ions
! The proportion of businesses that sponsored an organisation or individual in the last
12 months.
Source: Business Generosity Survey (2000–01), ABS.
1.2.3.7 Business
donat ions to any
organisat ion or chari ty
continued
60 A B S • ME A S U R I N G SO C I A L CA P I T A L , A N A U S T R A L I A N FR A M E W O R K A N D I N D I C A T O R S • 1 3 7 8 . 0 • 2 0 0 4
C H A P T E R 4 — F R A M E W O R K E L E M E N T S A N D I N D I C A T O R S continued
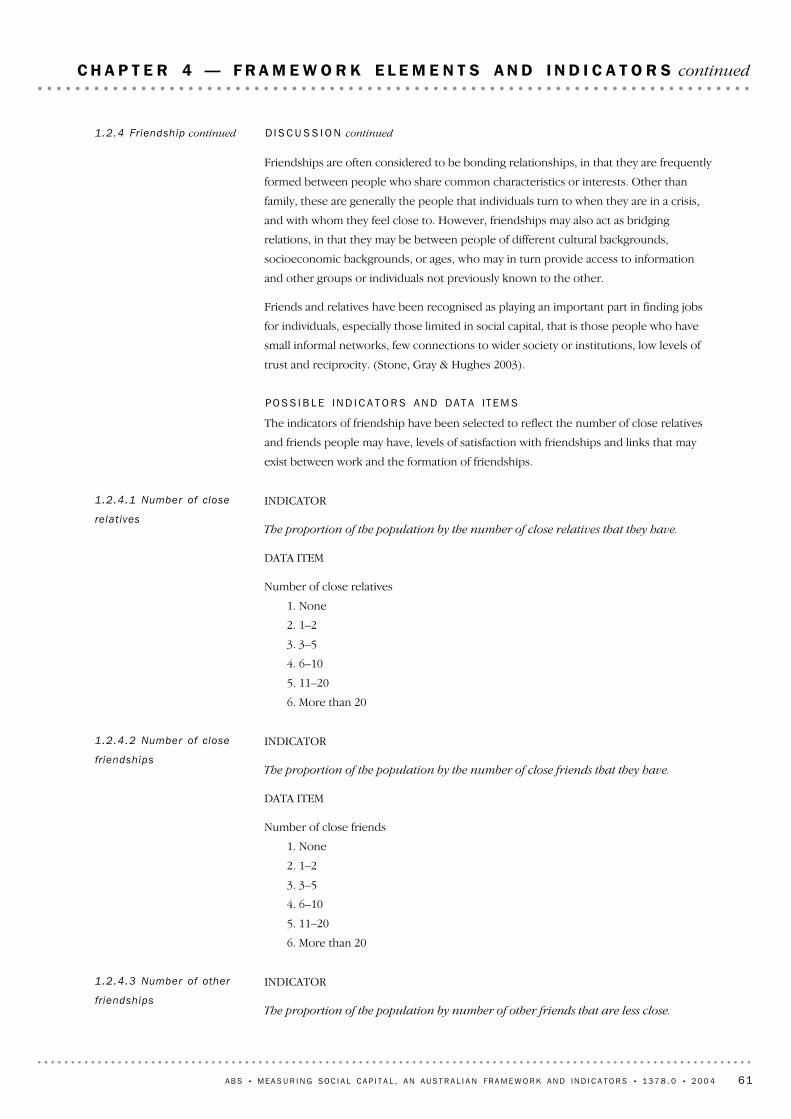
INDICATOR
The proportion of the population by number of other friends that are less close.
1.2.4.3 Number of other
fr iendships
INDICATOR
The proportion of the population by the number of close friends that they have.
DATA ITEM
Number of close friends
1. None
2. 1–2
3. 3–5
4. 6–10
5. 11–20
6. More than 20
1.2.4.2 Number of close
friendships
INDICATOR
The proportion of the population by the number of close relatives that they have.
DATA ITEM
Number of close relatives
1. None
2. 1–2
3. 3–5
4. 6–10
5. 11–20
6. More than 20
1.2.4.1 Number of close
relat ives
D I S C U S S I O N continued
Friendships are often considered to be bonding relationships, in that they are frequently
formed between people who share common characteristics or interests. Other than
family, these are generally the people that individuals turn to when they are in a crisis,
and with whom they feel close to. However, friendships may also act as bridging
relations, in that they may be between people of different cultural backgrounds,
socioeconomic backgrounds, or ages, who may in turn provide access to information
and other groups or individuals not previously known to the other.
Friends and relatives have been recognised as playing an important part in finding jobs
for individuals, especially those limited in social capital, that is those people who have
small informal networks, few connections to wider society or institutions, low levels of
trust and reciprocity. (Stone, Gray & Hughes 2003).
PO S S I B L E IN D I C A T O R S AN D DA T A I T E M S
The indicators of friendship have been selected to reflect the number of close relatives
and friends people may have, levels of satisfaction with friendships and links that may
exist between work and the formation of friendships.
1.2.4 Friendship continued
A B S • ME A S U R I N G SO C I A L CA P I T A L , A N A U S T R A L I A N FR A M E W O R K A N D I N D I C A T O R S • 1 3 7 8 . 0 • 2 0 0 4 61
C H A P T E R 4 — F R A M E W O R K E L E M E N T S A N D I N D I C A T O R S continued
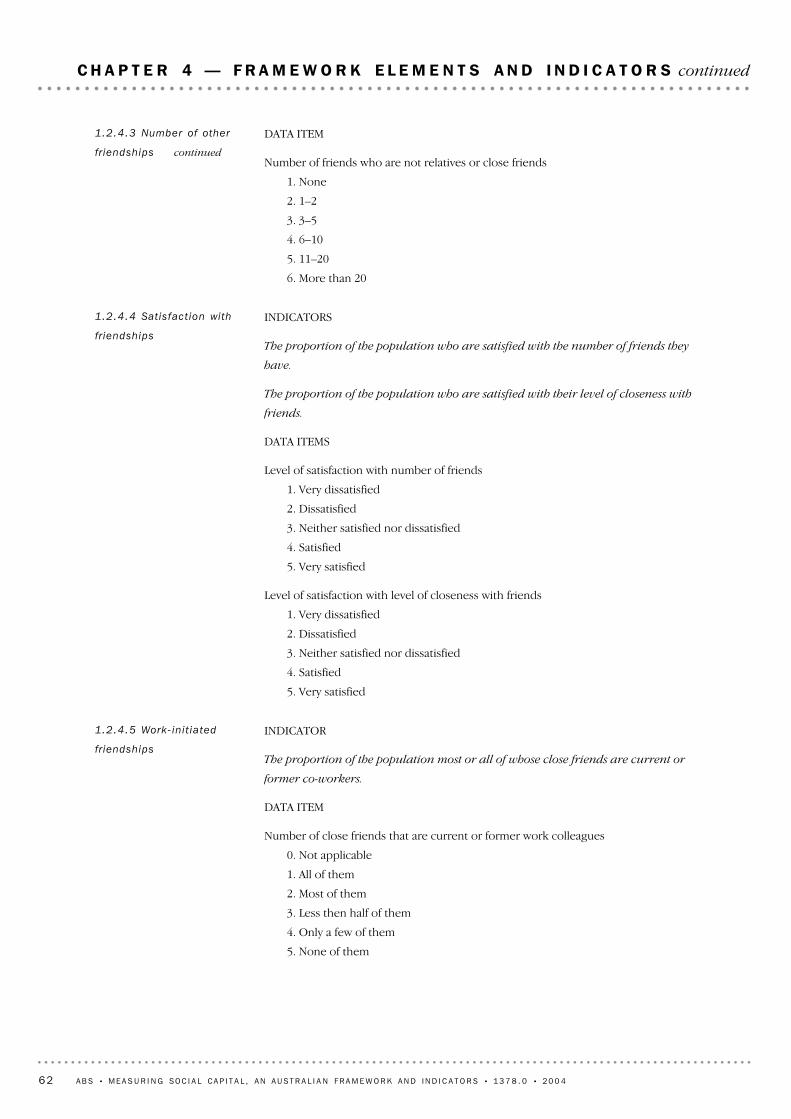
INDICATOR
The proportion of the population most or all of whose close friends are current or
former co-workers.
DATA ITEM
Number of close friends that are current or former work colleagues
0. Not applicable
1. All of them
2. Most of them
3. Less then half of them
4. Only a few of them
5. None of them
1.2.4.5 Work- ini t iated
friendships
INDICATORS
The proportion of the population who are satisfied with the number of friends they
have.
The proportion of the population who are satisfied with their level of closeness with
friends.
DATA ITEMS
Level of satisfaction with number of friends
1. Very dissatisfied
2. Dissatisfied
3. Neither satisfied nor dissatisfied
4. Satisfied
5. Very satisfied
Level of satisfaction with level of closeness with friends
1. Very dissatisfied
2. Dissatisfied
3. Neither satisfied nor dissatisfied
4. Satisfied
5. Very satisfied
1.2.4.4 Satis fact ion with
friendships
DATA ITEM
Number of friends who are not relatives or close friends
1. None
2. 1–2
3. 3–5
4. 6–10
5. 11–20
6. More than 20
1.2.4.3 Number of other
fr iendships continued
62 A B S • ME A S U R I N G SO C I A L CA P I T A L , A N A U S T R A L I A N FR A M E W O R K A N D I N D I C A T O R S • 1 3 7 8 . 0 • 2 0 0 4
C H A P T E R 4 — F R A M E W O R K E L E M E N T S A N D I N D I C A T O R S continued
DE F I N I T I O N
Economic participation is taking part in activities that are economic in nature. This includes
activities such as labour force participation and the exchange of goods and services. In the
context of social capital, it is the social aspect of these activities that is of relevance and
interest. For example, the social networks in which people engage through participation in
the labour force, or the relationships that people or businesses may have in their conduct of
business.
D I S C U S S I O N
Economic participation is the basis of many social relationships including those formed
through participation in paid work, in looking for work, and those formed during the
conduct of business. Putnam (2000) notes the importance of the workplace in providing
the opportunity to work collaboratively and cooperatively in teams, to build a sense of
community among co-workers, as a source of friendship, and a place to build and share
norms of reciprocity and mutual help. Participation in paid work also provides the
individual with the opportunity to learn new skills and improve existing skills. In this
respect, it has been suggested that the 'workplace, more than neighbourhoods or even
voluntary associations, provides a place where individuals may discuss important issues,
such as political values and current affairs' (Better together 2002).
A sustainable economic base is critical to the viability of any community. A community
generally needs an adequate range of local infrastructure including commercial
infrastructure such as shops, banks, post offices and other service providers to service its
population. The loss or reduction in the range of commercial facilities, or lack of a
sustainable economic base, in many rural localities in Australia has created many
challenges for the long-term viability of these communities.
The opportunity to participate in associational networks such as unions and business
and professional networks arises from involvement in paid work. Membership or
involvement in these types of representative organisations is an important mechanism
for participation in democracy and governance. These organisations also provide mutual
support as well as sharing of knowledge and expertise.
Social networks are drawn upon in looking for work. Granovetter (1973) noted the role
of casual acquaintances, as well as family and friends in finding jobs. More recently Stone,
Gray and Hughes (2003) have suggested that family and friends may be relied on as
sources of job search information for people who have limited involvement in or access
to paid work for finding work, whereas professional contacts are more likely to be
utilised by individuals already in paid work. These contacts are most likely to be formed
through the workplace or through business relationships. Friends and relatives may also
be used as a source of information on finances and business.
While employment may increase the number of connections that a person has,
unemployment, and particularly long-term unemployment, can lead to a decline of the
social networks an individual has and, in some cases, lead to social exclusion (Stone,
Gray & Hughes 2003). Those who are unemployed may not have access or the resources
to participate in social, civic and community activities. Exclusion from these types of
activities may also severely limit opportunities to interact with other people.
1.2.5 Economic
part ic ipat ion
A B S • ME A S U R I N G SO C I A L CA P I T A L , A N A U S T R A L I A N FR A M E W O R K A N D I N D I C A T O R S • 1 3 7 8 . 0 • 2 0 0 4 63
C H A P T E R 4 — F R A M E W O R K E L E M E N T S A N D I N D I C A T O R S continued
INDICATOR AND DATA ITEM
Labour force participation rate.
Labour force participation rate is those people participating in the labour force, that is,
either employed, or unemployed (actively looking for work and available to work),
expressed as a proportion of the total population aged 15–64 years.
The labour force participation rate can also be expressed for particular populations of
interest e.g. women.
1.2.5.1 Labour force
part ic ipat ion rate
D I S C U S S I O N continued
Workplace relationships may also facilitate the development of bridging and linking ties
through encountering a wide range of people in the workplace or as clients and
customers. Better together (2002) suggest that the workplace may be one of the more
diverse settings people may encounter. It is while working that individuals are most
likely to encounter and work closely with people from different backgrounds, or
lifestyles, and who may have differing views from their own. The workplace may also
provide introductions to people with influence or a wide range of resources.
The relationships that individuals or businesses have in their conduct of business, and
the relationships that businesses have with the community are also significant social
aspects of economic participation. OECD (2001a) identifies a range of benefits that can
stem from relationships of trust, cooperation and reciprocity that are able to be
developed in business dealings. These benefits include: decreased transaction costs
arising from negotiation, enforcement, imperfect information and unnecessary
bureaucracy; lowering of overhead costs through inter-business networks sharing
training, research and development; sharing information; and applying sanctions to
opportunistic behaviour. The sharing of knowledge and information is considered an
integral feature of a knowledge based economy. The ABS Discussion Paper: Measuring
a Knowledge-based Economy and Society — An Australian Framework
(cat. no. 1375.0) presents a range of indicators concerning knowledge networks and
flows.
Community business partnerships are a feature of current government policy in Australia
with the aim of encouraging the development of active and strong collaboration of the
community and business sectors. The Commonwealth government has established The
Prime Minister's Community Business Partnership with this aim in mind (DFaCS 2003).
Certain business structures may facilitate collective economic participation. Cooperatives
are a type of business entity, set up for a specific purpose, by a group of people wanting
to achieve a common social, economic or cultural goal. People join cooperatives to
enable collective purchase of goods or services and enjoy economies of scale by doing so
collectively.
PO S S I B L E IN D I C A T O R S AN D DA T A I T E M S
The indicators of economic participation have been selected to reflect aspects of labour
force participation, networks used in finding jobs, membership of cooperatives, access to
information on business and finance, and the social networks in which people engage
through economic participation.
1.2.5 Economic
part ic ipat ion continued
64 A B S • ME A S U R I N G SO C I A L CA P I T A L , A N A U S T R A L I A N FR A M E W O R K A N D I N D I C A T O R S • 1 3 7 8 . 0 • 2 0 0 4
C H A P T E R 4 — F R A M E W O R K E L E M E N T S A N D I N D I C A T O R S continued
INDICATOR
The proportion of the population who feel that their friends and relatives provide
helpful advice on finances and business (e.g. categories 1 and 2).
DATA ITEM
Level of helpfulness of friends for financial and business advice.
1. Very helpful
2. Helpful
3. Moderately helpful
4. Not very helpful
5. Not helpful at all
1.2.5.4 Friends and
relat ives as sources of
finance and business
information
INDICATOR
The proportion of the population with a high level of trust in their work colleagues (e.g.
categories 4 and 5).
DATA ITEM
Level of trust in work colleagues:
1. Not at all
2. Low
3. Moderate
4. High
5. Complete
1.2.5.3 Trust in work
col leagues
INDICATORS
The proportion of the population who have kept in touch with at least one previous
work colleague.
The proportion of the population by the number of previous work colleagues kept in
touch with.
DATA ITEMS
Kept in touch with previous work colleagues
1. Yes
2. No
Number of previous work colleagues kept in touch with
1. None
2. 1 to 2
3. 3 to 5
4. 6 to 9
5. 10 or more
1.2.5.2 Previous work
col leagues in current
social network
Source: Monthly Population Survey, ABS.1.2.5.1 Labour force
part ic ipat ion rate continued
A B S • ME A S U R I N G SO C I A L CA P I T A L , A N A U S T R A L I A N FR A M E W O R K A N D I N D I C A T O R S • 1 3 7 8 . 0 • 2 0 0 4 65
C H A P T E R 4 — F R A M E W O R K E L E M E N T S A N D I N D I C A T O R S continued
The following indicators also relate to economic participation and may be found in 3.1.1
Sharing support (Physical/Financial Assistance, Emotional Support and Encouragement)
and 3.2 Sharing knowledge (information and introductions)
3.1.1.3 Provision of help to work colleague
3.1.1.4 Expectation of help from a work colleague
3.2.1.2 Friends and relatives as sources of job search information.
OT H E R RE L A T E D
IN D I C A T O R S
INDICATOR
The proportion of the population who are members of bartering organisations.
DATA ITEM
Member of bartering organisation
1. Yes
2. No
1.2.5.8 Membership of
barter ing organisat ions
INDICATOR
The proportion of the population who are members of a cooperative business.
DATA ITEM
Member of a cooperative business
1. Yes
2. No
1.2.5.7 Membership of
cooperat ives
INDICATOR
The proportion of the population who are members or have participated in a union,
professional or technical association in the last 12 months.
DATA ITEM
Member or participant in union, professional or technical association
1. Yes
2. No
1.2.5.6 Membership and
part ic ipat ion in unions,
professional or technical
associat ions
INDICATOR
The proportion of the population who prefer to support local shops and businesses (e.g.
categories 1 and 2).
DATA ITEM
Level of support to local shops and businesses.
1. Strongly support
2. Support
3. Neither Support or not support
4. Do not support
5. Strongly do not support
1.2.5.5 Use of local
shops and other local
businesses
66 A B S • ME A S U R I N G SO C I A L CA P I T A L , A N A U S T R A L I A N FR A M E W O R K A N D I N D I C A T O R S • 1 3 7 8 . 0 • 2 0 0 4
C H A P T E R 4 — F R A M E W O R K E L E M E N T S A N D I N D I C A T O R S continued
DE F I N I T I O N
Network size refers to the number and variety of attachments individuals or groups may
have.
D I S C U S S I O N
Networks can range from very limited to large in size. Networks may involve relations
within the household, in the local community or neighbourhood, or global or virtual
relations, such as internet chatroom relationships, that exist over vast distances.
The number and variety of attachments individuals have may be affected by many factors,
including the setting they are born into, their socioeconomic status and an individual's
stage of life. Personality qualities also impact on the number and variety of attachments
an individual may have, as they may make interacting with others more or less easy. The
2.1 Network Size
As individuals interact, they form networks. Networks are patterns of relationships, and
also patterns of the resources brought to the relationship by participants. Potential
resources brought by participants to a relationship are their personal skills and abilities,
their economic resources, resources associated with their jobs, status, and with the other
groups to which they are connected, and, by extension, the networks and resources of
their families, friends and colleagues. Social capital exists in the relationships between
participants.
Features of network structure, therefore, influence the range and quality of resources
accessible to an individual. The size of a network often reflects the amount of investment
made in relationships and provision of support, and increases the capacity of an
individual to draw on these resources. The frequency of interaction relates to the
accessibility of these resources.
People tend to relate most closely with others who are similar in various ways —
common background, age, level of education, social status, or shared attitudes and
interests. Where everyone in a network is known to all others and actively and regularly
interact, there are likely to be higher quality personal relationships, a higher level of
trustworthiness in the network, and strongly-based obligations and expectations.
There may be a greater variety of resources, however, in networks where people do not
know everyone, or where the overlap of participants between groups is less (Granovetter
1973; Lin 2001), or where a wider variety of people is able to gain access to the group.
Higher quality information or influence may be available from relationships with people
of similar status in different institutions or fields, and with people of higher status with
greater access to influence.
The following discussion contains lists of indicators that reflect different ways of
measuring structural features of networks such as size, openess, frequency, density,
communication mode, transience/mobility and power relationships. These structural
attributes can provide information such as how open a network is to those external to
the network, how often members have contact with others in the network, and to what
extent a network may overlap with another in terms of membership. Relationships
maintained via telephone or internet are covered. Potential access to institutional
sources of knowledge or influence is included.
2 . NE T W O R K ST R U C T U R E
A B S • ME A S U R I N G SO C I A L CA P I T A L , A N A U S T R A L I A N FR A M E W O R K A N D I N D I C A T O R S • 1 3 7 8 . 0 • 2 0 0 4 67
C H A P T E R 4 — F R A M E W O R K E L E M E N T S A N D I N D I C A T O R S continued

INDICATORS
The proportion of people with an expected source of support in a crisis.
The proportion of people with an expected source of support in a crisis, by the type of
support person/group.
DATA ITEMS
Support available in time of crisis
1. Yes
2. No
Type of support available: Advice on what to do
0. Not applicable
1. Yes
2. No
The same form of data items are adopted for the following types of support:
! Emotional support
! Help out when you have a serious illness or injury
! Help in maintaining family or work responsibilities
! Provide emergency money
! Provide emergency accommodation
2.1.1 Source of support in
a cris is
D I S C U S S I O N continued
effort that individuals or groups put into building and maintaining relationships is likely
to play an important part in the size of networks.
It has been recognised that the size of social networks may affect the stocks of social
capital that exist for an individual or community. Stone (2001) states that "people with
large numbers of social ties may have high levels of bonding, bridging or linking social
capital, and those with few social ties may have little access or opportunity to invest in
social capital". The size of a network influences the range and quality of resources
accessible. Potential resources that may be brought to a relationship by participants may
include such things as skills and abilities, economic resources, resources associated with
their jobs and status, as well as access to the resources of other groups and networks
that they belong to such as family, friends and colleagues. Availability of support in a time
of crisis may also be influenced by the size of a person's network.
Network size has been seen as impacting on health. Berkman & Glass (2000), for
example, found that after controlling for initial health status, the extent of social
connectedness, that is, the degree to which individuals form close bonds with relations,
friends and acquaintances, was associated with increased life expectancy.
PO S S I B L E IN D I C A T O R S AN D DA T A I T E M S
The indicators of network size have been selected to reflect the different types of
connections that exist in an individual's social network, as well as the nature of these
connections. Indicators of network size include the availability and sources of support in
time of crisis, number of friends and relatives who live in close proximity, acquaintance
with neighbours, and personal links to institutions.
2.1 Network Size
continued
68 A B S • ME A S U R I N G SO C I A L CA P I T A L , A N A U S T R A L I A N FR A M E W O R K A N D I N D I C A T O R S • 1 3 7 8 . 0 • 2 0 0 4
C H A P T E R 4 — F R A M E W O R K E L E M E N T S A N D I N D I C A T O R S continued
INDICATOR
The proportion of people who have personal links to the legal system.
2.1.4 Links to inst i tut ions
INDICATORS
The proportion of people who know all or most of their neighbours.
The proportion of people who know few or none of their neighbours.
DATA ITEM
Level of acquaintance with neighbours
1. All
2. Most
3. Many
4. Few
5. None
2.1.3 Acquaintance with
neighbours
INDICATOR
The proportion of people who have close relatives or friends living within 30 minutes of
them.
DATA ITEM
Number of close relatives or friends living half an hour or less away
1. None
2. 1–2
3. 3–5
4. 6–9
5. 10 or more
2.1.2 Close relat ives or
fr iends who live nearby
! Provide emergency food.
Source of support available: Friend.
0. Not applicable
1. Yes
2. No
The same form of the data item is adopted for the following sources of support:
! Neighbour
! Family member
! Work colleague
! Community, charity or religious organisation
! Local council or other government service
! Health, legal or financial profession.
Source: General Social Survey (2002), ABS.
2.1.1 Source of support in
a cris is continued
A B S • ME A S U R I N G SO C I A L CA P I T A L , A N A U S T R A L I A N FR A M E W O R K A N D I N D I C A T O R S • 1 3 7 8 . 0 • 2 0 0 4 69
C H A P T E R 4 — F R A M E W O R K E L E M E N T S A N D I N D I C A T O R S continued
DE F I N I T I O N S
Frequency/intensity is how often people or groups have contact with others in their various
networks, as well as the duration of this contact.
Communication mode is the method or range of methods that individuals use in keeping in
touch with others in their networks. Modes of communication include the telephone,
face-to-face communication, mail and electronic forms of communication such as email
and chat rooms.
D I S C U S S I O N
The level and type of contact an individual has with other people is influenced by their
need for interaction, the method of communication used for contact, and the proximity
of their networks. The frequency of contact may influence the exchange of support and
other resources. Stone and Hughes (2001) refer to recent research that indicates that the
more geographically close network ties are, the more contact people are likely to have
with them, and the more likely that these ties will form a part of support networks.
2.2 Network
frequency/ intensity and
communicat ion mode
DATA ITEMS
Have personal links to at least one institution
1. Yes
2. No
Type of institution has personal link to: Legal system
1. Yes
2. No
The equivalent indicator using the same forms of data items are adopted for the
following types of institutions:
! The legal system
! A religious institution
! The police
! The media
! Unions
! Government
! Political parties
! Universities
! Business.
OT H E R RE L A T E D IN D I C A T O R S
The following indicators also relate to network size and may be found in 1.2.1 Social
participation and 1.2.5 Economic participation
1.2.1.3 Membership of clubs, organisations or associations
1.2.1.5 Number of clubs, organisations, associations or groups active in
1.2.5.2 Previous work colleagues in current social network
2.1.4 Links to inst i tut ions
continued
70 A B S • ME A S U R I N G SO C I A L CA P I T A L , A N A U S T R A L I A N FR A M E W O R K A N D I N D I C A T O R S • 1 3 7 8 . 0 • 2 0 0 4
C H A P T E R 4 — F R A M E W O R K E L E M E N T S A N D I N D I C A T O R S continued
D I S C U S S I O N continued
People have different predispositions to sociability. It is not necessarily the case that
being with others all of the time is ideal — there is an optimal balance between
interaction and solitude that varies with the person. Psychological research has found
that frequent contact with, and exposure to other individuals or groups usually leads to a
more and more positive evaluation of that person or group (Baron & Byrne 1997). This
positive evaluation is likely to lead to the development of cooperation, social support
networks and increased trust and tolerance of diversity.
Information about frequency of contact allows for analysis and exploration of the
relationship between frequency of contact and different wellbeing outcomes. It is widely
suggested that contact with others is important in providing individuals with identity,
social roles and social support mechanisms. While not all individuals seek social support,
and relationships are not always positive, where there are well functioning networks the
positive effects of social connections are well known, which may include increased
happiness, health and longevity (Stone 2003). The quality of relationships is also
influenced by the frequency and intensity of these relationships.
Face-to-face contact is perhaps the most satisfying form of social contact. Onyx (2001)
recognises the importance of face-to-face contact in the development of social capital.
She states that while electronic networks are important in maintaining connections,
people need "real, human, personal interaction for social capital to develop."
Geographic separation, particularly in a country as vast as Australia may mean that
face-to-face contact with family and friends is not always possible on a regular basis.
Telephone contact is very useful for the exchange of information, maintaining individual
relationships at a distance, and passing information around a network. Letters and
postcards are a traditional form of continuing communication with people further away,
or when people are travelling. Becoming much more common, and perhaps replacing
these more traditional communication modes, is the use of the Internet and Short
Message Service (SMS) text messaging for keeping in touch. The Internet allows people
to keep in touch with established contacts, and disseminate information simultaneously
to whole networks. Emailing and SMS may also allow for the arrangement of face-to-face
contact with others. New methods of communication may have an effect on
cross-generational communication, in the short term, as younger generations are
currently favouring and adapting to new technologies with greater alacrity than older
generations.
Through chat rooms and subscribing to or linking in with email networks, it is also
possible to establish new contacts and networks of relationships around common
interests, including support groups. Some of these may remain virtual links, while others
develop into face-to-face contacts. This form of communication is particularly important
to those who may be excluded from meeting others due to physical difficulties, child
care responsibilities, or living at remote locations. While these forms of communication
are important, they rely on readily available access to the Internet, and so may not be
available to all people or communities.
2.2 Network
frequency/ intensity and
communicat ion mode
continued
A B S • ME A S U R I N G SO C I A L CA P I T A L , A N A U S T R A L I A N FR A M E W O R K A N D I N D I C A T O R S • 1 3 7 8 . 0 • 2 0 0 4 71
C H A P T E R 4 — F R A M E W O R K E L E M E N T S A N D I N D I C A T O R S continued
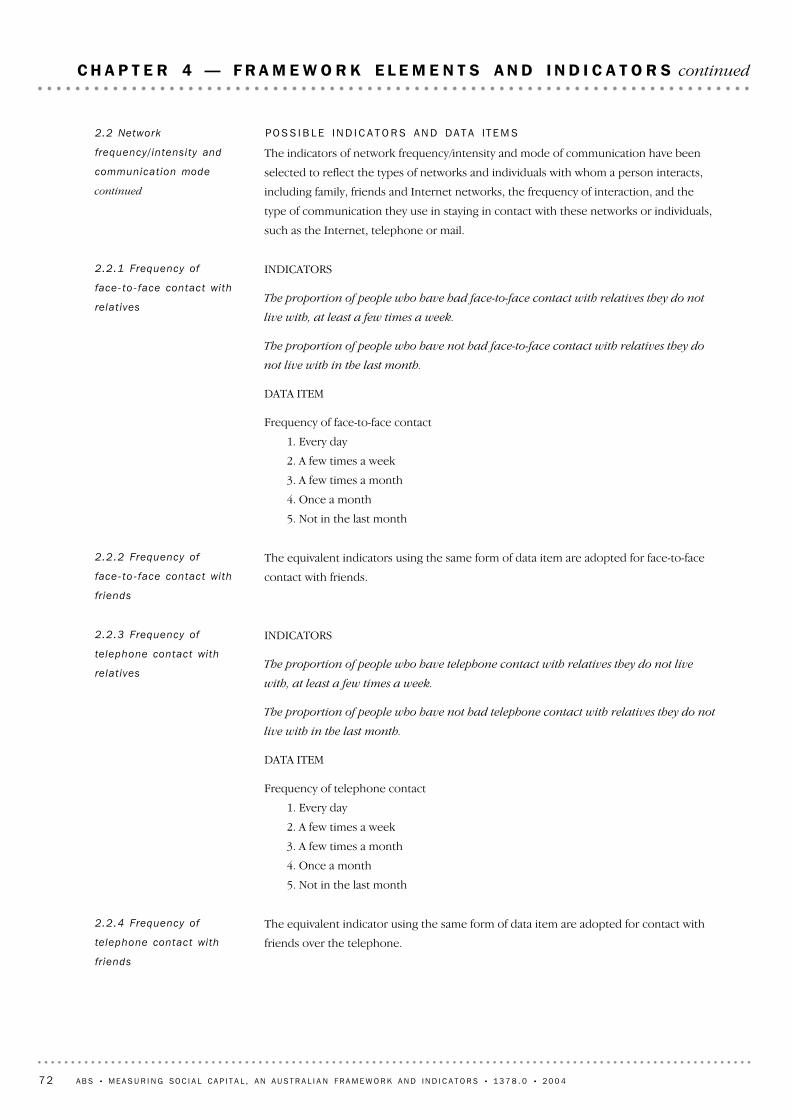
The equivalent indicator using the same form of data item are adopted for contact with
friends over the telephone.
2.2.4 Frequency of
telephone contact with
friends
INDICATORS
The proportion of people who have telephone contact with relatives they do not live
with, at least a few times a week.
The proportion of people who have not had telephone contact with relatives they do not
live with in the last month.
DATA ITEM
Frequency of telephone contact
1. Every day
2. A few times a week
3. A few times a month
4. Once a month
5. Not in the last month
2.2.3 Frequency of
telephone contact with
relat ives
The equivalent indicators using the same form of data item are adopted for face-to-face
contact with friends.
2.2.2 Frequency of
face-to-face contact with
friends
INDICATORS
The proportion of people who have had face-to-face contact with relatives they do not
live with, at least a few times a week.
The proportion of people who have not had face-to-face contact with relatives they do
not live with in the last month.
DATA ITEM
Frequency of face-to-face contact
1. Every day
2. A few times a week
3. A few times a month
4. Once a month
5. Not in the last month
2.2.1 Frequency of
face-to-face contact with
relat ives
PO S S I B L E IN D I C A T O R S AN D DA T A I T E M S
The indicators of network frequency/intensity and mode of communication have been
selected to reflect the types of networks and individuals with whom a person interacts,
including family, friends and Internet networks, the frequency of interaction, and the
type of communication they use in staying in contact with these networks or individuals,
such as the Internet, telephone or mail.
2.2 Network
frequency/ intensity and
communicat ion mode
continued
72 A B S • ME A S U R I N G SO C I A L CA P I T A L , A N A U S T R A L I A N FR A M E W O R K A N D I N D I C A T O R S • 1 3 7 8 . 0 • 2 0 0 4
C H A P T E R 4 — F R A M E W O R K E L E M E N T S A N D I N D I C A T O R S continued
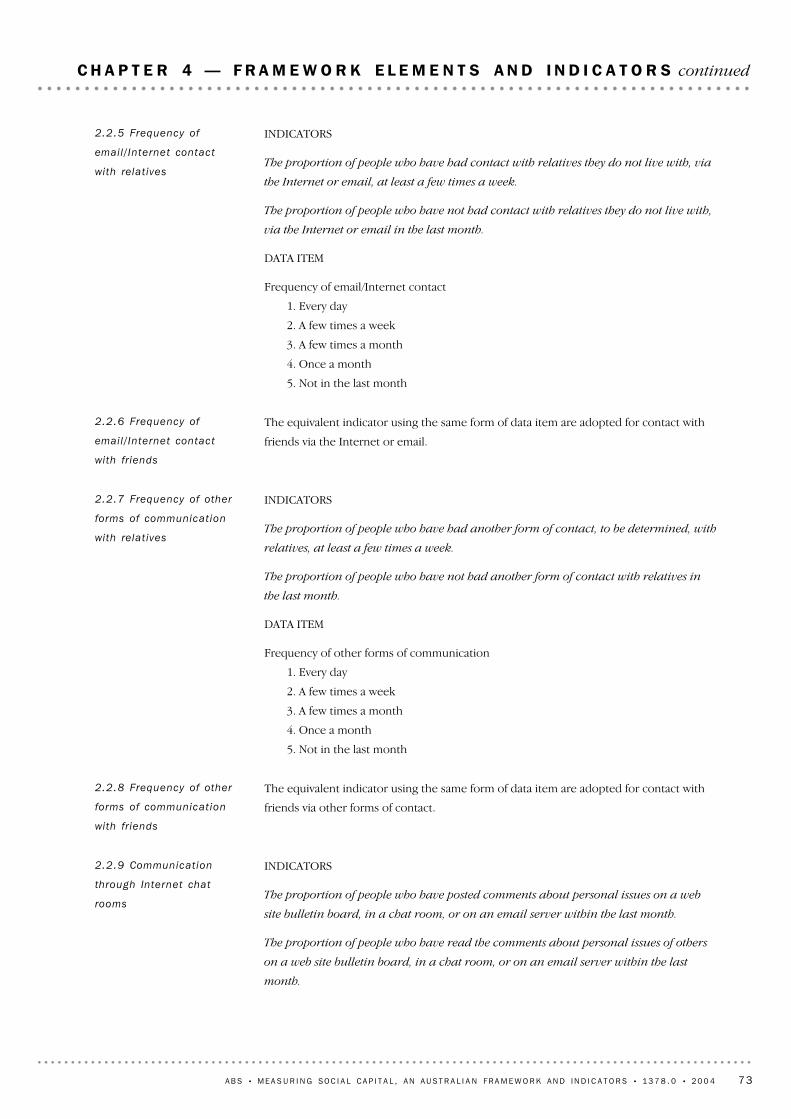
INDICATORS
The proportion of people who have posted comments about personal issues on a web
site bulletin board, in a chat room, or on an email server within the last month.
The proportion of people who have read the comments about personal issues of others
on a web site bulletin board, in a chat room, or on an email server within the last
month.
2.2.9 Communicat ion
through Internet chat
rooms
The equivalent indicator using the same form of data item are adopted for contact with
friends via other forms of contact.
2.2.8 Frequency of other
forms of communicat ion
with fr iends
INDICATORS
The proportion of people who have had another form of contact, to be determined, with
relatives, at least a few times a week.
The proportion of people who have not had another form of contact with relatives in
the last month.
DATA ITEM
Frequency of other forms of communication
1. Every day
2. A few times a week
3. A few times a month
4. Once a month
5. Not in the last month
2.2.7 Frequency of other
forms of communicat ion
with relat ives
The equivalent indicator using the same form of data item are adopted for contact with
friends via the Internet or email.
2.2.6 Frequency of
email / Internet contact
with fr iends
INDICATORS
The proportion of people who have had contact with relatives they do not live with, via
the Internet or email, at least a few times a week.
The proportion of people who have not had contact with relatives they do not live with,
via the Internet or email in the last month.
DATA ITEM
Frequency of email/Internet contact
1. Every day
2. A few times a week
3. A few times a month
4. Once a month
5. Not in the last month
2.2.5 Frequency of
email / Internet contact
with relat ives
A B S • ME A S U R I N G SO C I A L CA P I T A L , A N A U S T R A L I A N FR A M E W O R K A N D I N D I C A T O R S • 1 3 7 8 . 0 • 2 0 0 4 73
C H A P T E R 4 — F R A M E W O R K E L E M E N T S A N D I N D I C A T O R S continued
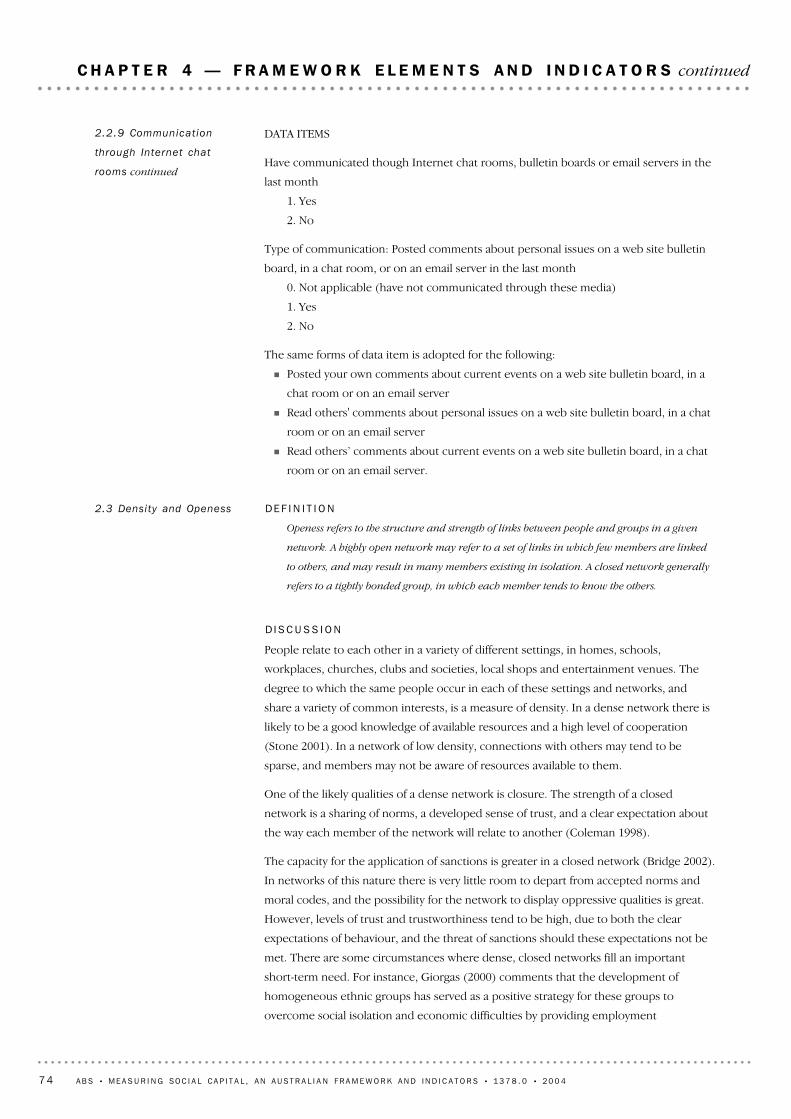
DE F I N I T I O N
Openess refers to the structure and strength of links between people and groups in a given
network. A highly open network may refer to a set of links in which few members are linked
to others, and may result in many members existing in isolation. A closed network generally
refers to a tightly bonded group, in which each member tends to know the others.
D I S C U S S I O N
People relate to each other in a variety of different settings, in homes, schools,
workplaces, churches, clubs and societies, local shops and entertainment venues. The
degree to which the same people occur in each of these settings and networks, and
share a variety of common interests, is a measure of density. In a dense network there is
likely to be a good knowledge of available resources and a high level of cooperation
(Stone 2001). In a network of low density, connections with others may tend to be
sparse, and members may not be aware of resources available to them.
One of the likely qualities of a dense network is closure. The strength of a closed
network is a sharing of norms, a developed sense of trust, and a clear expectation about
the way each member of the network will relate to another (Coleman 1998).
The capacity for the application of sanctions is greater in a closed network (Bridge 2002).
In networks of this nature there is very little room to depart from accepted norms and
moral codes, and the possibility for the network to display oppressive qualities is great.
However, levels of trust and trustworthiness tend to be high, due to both the clear
expectations of behaviour, and the threat of sanctions should these expectations not be
met. There are some circumstances where dense, closed networks fill an important
short-term need. For instance, Giorgas (2000) comments that the development of
homogeneous ethnic groups has served as a positive strategy for these groups to
overcome social isolation and economic difficulties by providing employment
2.3 Density and Openess
DATA ITEMS
Have communicated though Internet chat rooms, bulletin boards or email servers in the
last month
1. Yes
2. No
Type of communication: Posted comments about personal issues on a web site bulletin
board, in a chat room, or on an email server in the last month
0. Not applicable (have not communicated through these media)
1. Yes
2. No
The same forms of data item is adopted for the following:
! Posted your own comments about current events on a web site bulletin board, in a
chat room or on an email server
! Read others' comments about personal issues on a web site bulletin board, in a chat
room or on an email server
! Read others’ comments about current events on a web site bulletin board, in a chat
room or on an email server.
2.2.9 Communicat ion
through Internet chat
rooms continued
74 A B S • ME A S U R I N G SO C I A L CA P I T A L , A N A U S T R A L I A N FR A M E W O R K A N D I N D I C A T O R S • 1 3 7 8 . 0 • 2 0 0 4
C H A P T E R 4 — F R A M E W O R K E L E M E N T S A N D I N D I C A T O R S continued

INDICATORS
The proportion of people whose family members know each other's close friends
completely.
The proportion of people whose family members do not know each other's close friends
at all.
2.3.1 Nature of informal
networks — family and
friends
D I S C U S S I O N continued
opportunities and a sense of familial surroundings, as well as a collective sense of
identity.
Less dense networks tend to be larger and more dispersed, and also tend to be more
open. Many members may not know many others, and norms and trust levels may be
less well-established. There may not be a clear expectation of how members will or
should behave, as norms may be weak or vague, if shared values exist at all. The
application of reputations and collective sanctions which reinforce trustworthiness
require the members of the network to have knowledge of each other (Bridge, 2002)
which is often not applicable in an open network (Coleman 1998; Bridge 2002).
However, open networks allow diversity to flourish, and the range of resources available
through a group of this type is likely to be more varied.
An expanded definition of openess might also include a discussion of the barriers for
joining a group or network. A closed network maintains high barriers for entry, and may
discourage newcomers, where an open network might have relatively few barriers for
entry, be more inclusive, and actively encourage newcomers. Barriers for entry may take
the form of restrictive criteria for membership (for example; high membership fees,
required family link, educational attainment, ethnicity), geographic constraints, a
requirement of exclusivity, or may reflect personal choice. In the 1995 Boyer Lectures,
Cox commented on the opportunity of group homogeneity to lead to closure or even
potentially violent factions.
Heterogeneity of social ties may increase linkages with various networks, and therefore
provide access to a wide range of resources or opportunities (Stone, Gray & Hughes
2003). Narayan (1999) comments that cross-cutting ties between groups open up
economic opportunities to others in less powerful and excluded groups, promoting
social cohesion and social stability. While heterogeneity is important in accessing and
sharing resources between groups, Stolle (1998, cited in Stone, Gray & Hughes 2003)
recognises that this type of group structure may limit the extent to which social
relationships are characterised by high levels of trust and reciprocity due to various
differences within the groups.
Openess may be at the expense of some level of collective identity within a network.
Putnam discusses the rise of tolerance coinciding with the decrease in social
connectedness in Bowling Alone (2000). There seems to be a balance to be struck
between strong social connections and broad social cohesion, for a network to combine
collective identity with acceptance of diversity and inclusion.
PO S S I B L E IN D I C A T O R S AN D DA T A I T E M S
The following indicators look at both formal, and informal networks.
2.3 Density and Openess
continued
A B S • ME A S U R I N G SO C I A L CA P I T A L , A N A U S T R A L I A N FR A M E W O R K A N D I N D I C A T O R S • 1 3 7 8 . 0 • 2 0 0 4 75
C H A P T E R 4 — F R A M E W O R K E L E M E N T S A N D I N D I C A T O R S continued
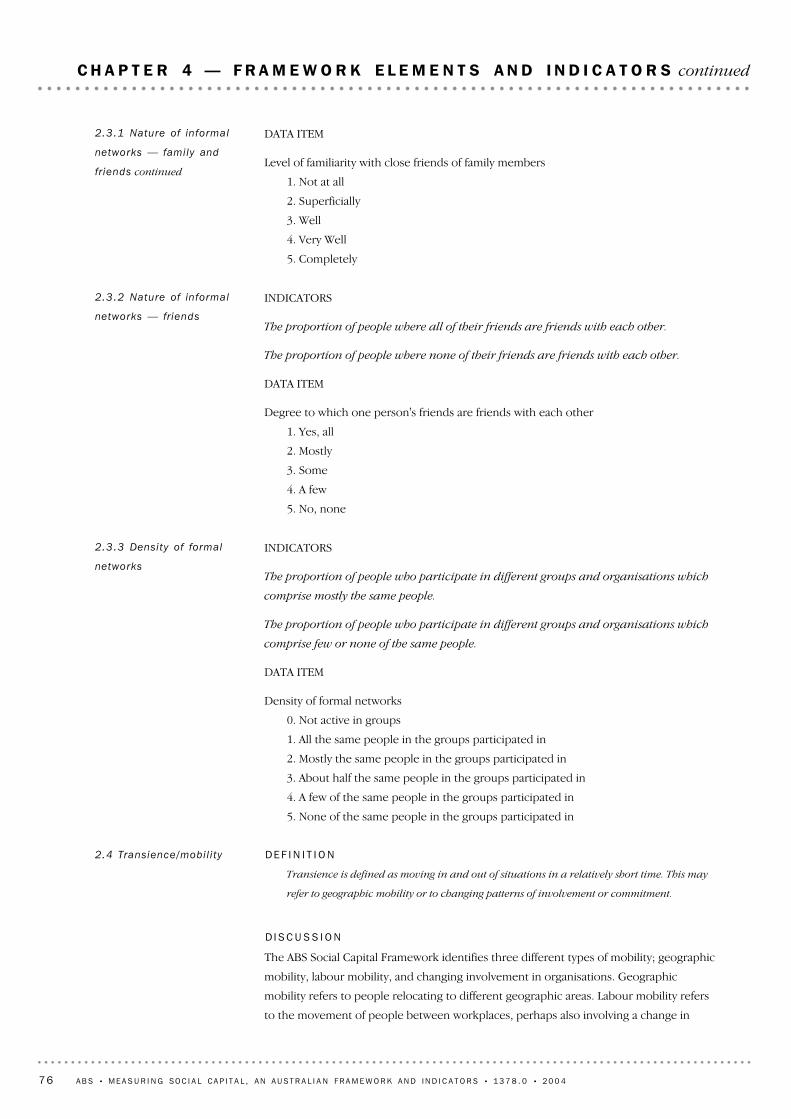
DE F I N I T I O N
Transience is defined as moving in and out of situations in a relatively short time. This may
refer to geographic mobility or to changing patterns of involvement or commitment.
D I S C U S S I O N
The ABS Social Capital Framework identifies three different types of mobility; geographic
mobility, labour mobility, and changing involvement in organisations. Geographic
mobility refers to people relocating to different geographic areas. Labour mobility refers
to the movement of people between workplaces, perhaps also involving a change in
2.4 Transience/mobi l i ty
INDICATORS
The proportion of people who participate in different groups and organisations which
comprise mostly the same people.
The proportion of people who participate in different groups and organisations which
comprise few or none of the same people.
DATA ITEM
Density of formal networks
0. Not active in groups
1. All the same people in the groups participated in
2. Mostly the same people in the groups participated in
3. About half the same people in the groups participated in
4. A few of the same people in the groups participated in
5. None of the same people in the groups participated in
2.3.3 Density of formal
networks
INDICATORS
The proportion of people where all of their friends are friends with each other.
The proportion of people where none of their friends are friends with each other.
DATA ITEM
Degree to which one person's friends are friends with each other
1. Yes, all
2. Mostly
3. Some
4. A few
5. No, none
2.3.2 Nature of informal
networks — friends
DATA ITEM
Level of familiarity with close friends of family members
1. Not at all
2. Superficially
3. Well
4. Very Well
5. Completely
2.3.1 Nature of informal
networks — family and
friends continued
76 A B S • ME A S U R I N G SO C I A L CA P I T A L , A N A U S T R A L I A N FR A M E W O R K A N D I N D I C A T O R S • 1 3 7 8 . 0 • 2 0 0 4
C H A P T E R 4 — F R A M E W O R K E L E M E N T S A N D I N D I C A T O R S continued
D I S C U S S I O N continued
geographic location. Mobility of involvement in organisations refers to the affiliation
people have with various kinds of organisations throughout their lifetime which may vary
from temporary, fluctuating, to enduring.
Geographic mobility may affect the time people have available to establish networks, as
the severing of network ties may occur when an individual or family move to a different
locality, particularly if the two localities are a considerable distance apart. Onyx and
Bullen (1997) suggest that the longer an individual lives in a community, the stronger
their ties to that community will be. A study of community participation in Surf Coast,
Victoria, conducted by the Swinburne Institute for Social Research (2002) found that
permanent residents are more likely to be active in civic affairs than others in their
community. Through active participation in civic activities, permanent residents are also
more likely to have developed relationships within the community.
There are many contributing factors to geographic mobility, a significant one being that
of housing tenure. A recent Productivity Commission Research Paper (2003) suggested a
link between home ownership and social capital formation. The suggested link relates to
the correlation between residential stability and home ownership, which together are
associated with increased levels of civic engagement. Putnam (2000) observed that those
who own their own home are more likely to be involved in community affairs than those
who rent.
Other factors that may contribute to geographic mobility include: employment status
and labour market opportunities: employment arrangements; housing affordability;
adequacy of infrastructure and services; lifecycle stages; and seasonal variations. For
example, shearers may be on the road for months on end, oil and gas platforms and
some mining towns have flyin-flyout working arrangements. Military and diplomatic
families may have different placements every few years, which may involve children
attending a number of different schools. Increasingly, people in business and
professional fields may work in a different city to their family home, for varying periods
of time. Knowledge based workers are increasingly gaining opportunities to live and
work overseas for periods of time. These opportunities, although increasing mobility,
also bring the chance to establish new networks and contacts. In addition, the increasing
reliance on technology, and the capacity to maintain relationships with the aid of
technology may lessen some of the negatives associated with mobility.
Housing affordability may mean people move out to the periphery of cities/towns where
housing tends to be cheaper. People may move to different places in synchrony with
stages in their lifecycle, from the town or city they grew up in to find work or pursue
further study, or from the place they have lived during their working life to another
location to enjoy retirement.
A particular dimension of transience and mobility is related to the changing patterns of
involvement people have with groups and organisations. Involvement in organised
groups may be transient or may be sustained over a longer period. The length of
involvement might depend on the purpose and relevance of the group, or on the level of
welcome and acceptance new members receive and their ability to feel at home. For
example, religious participation creates a stable and enduring group attachment for
many people. There is interest in whether a lasting pattern of social and civic
2.4 Transience/mobi l i ty
continued
A B S • ME A S U R I N G SO C I A L CA P I T A L , A N A U S T R A L I A N FR A M E W O R K A N D I N D I C A T O R S • 1 3 7 8 . 0 • 2 0 0 4 77
C H A P T E R 4 — F R A M E W O R K E L E M E N T S A N D I N D I C A T O R S continued
INDICATOR
The proportion of the population who have moved three times or more in the past three
years.
2.4.2 Geographic mobil i ty
INDICATOR
The proportion of the population by the length of time of residence in current locality.
DATA ITEM
Length of residence in current locality
1. Less than 1 year
2. 1 year to less than 3 years
3. 3 years to less than 5 years
4. 5 years to less than 10 years
5. 10 years or more
2.4.1 Length of residence
in current local i ty
D I S C U S S I O N continued
involvement may be developed in childhood or adolescence. In a recent radio interview,
3AW (2003) Treasurer Peter Costello expressed an interest in the role that schools may
have in developing an ethic for social and civic participation into adult life.
Fahmey (2003) studied the role of lifecycle processes in patterns of 'associational and
civic activity' which relates to differing levels and forms of social and civic involvement
throughout different stages of life. For example, parents of young children are more
likely to be involved in social activities with other young parents, and to volunteer on
committees such as a Parents and Citizens association, than the 'empty nesters' in their
40s and 50s who are more likely to be involved in 'civic organisations and professional
societies' (Putnam 2000). However, Putnam (1996) notes that it is older people who are
more likely to be engaged in the community than younger people.
The greater period of contact with a specific group, the greater the opportunity for the
development of ties within the group. However, transience between groups may allow
for a larger number of ties to be created, enhancing bridging social capital.
PO S S I B L E IN D I C A T O R S AN D DA T A I T E M S
The indicators of network transience and mobility have been selected to reflect concepts
of geographic mobility, as well as group or organisation transience and change or
stability in lifestyle patterning. The indicators examine duration of residence in local area,
levels of mobility, changes in involvements in groups or organisations, youth experiences
of mobility, and whether prior youth involvement or parental example relate to current
level of involvement.
2.4 Transience/mobi l i ty
continued
78 A B S • ME A S U R I N G SO C I A L CA P I T A L , A N A U S T R A L I A N FR A M E W O R K A N D I N D I C A T O R S • 1 3 7 8 . 0 • 2 0 0 4
C H A P T E R 4 — F R A M E W O R K E L E M E N T S A N D I N D I C A T O R S continued
INDICATOR
The proportion of the population by ranges of years involved in organisation in which
most active.
DATA ITEM
Duration of involvement in organisation
0. Not applicable
1. Less than 1 year
2. 1–2 years
3. 3–5 years
4. 6–10 years
5. More than 10 years
2.4.5 Durat ion of
involvement with
organisat ion in which
most act ive
The following two indicators examine the main organisation in which a respondent is
involved.
INDICATOR
The proportion of the population by change and stability of involvement in main
organisation.
DATA ITEM
Change in intensity of involvement with main organisation
0. Not applicable
1. Increased
2. Decreased
3. Stayed the same
2.4.4 Change in intensity
of involvement with
organisat ion in which
most act ive
INDICATOR
The proportion of the population by change and stability of involvement with
organisations.
DATA ITEM
Change in intensity of involvement with organisations
0. Not applicable
1. Increased
2. Decreased
3. Stayed the same
2.4.3 Changes in intensity
of involvement with
organisat ions
DATA ITEM
Frequency of moving
1. Not at all
2. Once
3. Twice
4. Three times
5. More than three times
2.4.2 Geographic mobil i ty
continued
A B S • ME A S U R I N G SO C I A L CA P I T A L , A N A U S T R A L I A N FR A M E W O R K A N D I N D I C A T O R S • 1 3 7 8 . 0 • 2 0 0 4 79
C H A P T E R 4 — F R A M E W O R K E L E M E N T S A N D I N D I C A T O R S continued
INDICATOR
The proportion of the population whose current residential location is similar in size to
that of their youth.
2.4.8 Chi ld/youth
background — type of
area of residence
INDICATORS
The proportion of current volunteers whose parent(s) did voluntary work when
current volunteer was a child/youth.
The proportion of non-volunteers whose parent(s) did voluntary work when current
non-volunteer was a child/youth.
DATA ITEMS
Parent(s) did voluntary work
1. Yes
2. No
3. Don't know
Volunteer status
1. Volunteer
2. Not a volunteer
3. Don't know
2.4.7 Chi ld/youth
background — parent 's
voluntary work
INDICATOR
The proportion of those currently involved in civic participation or community
support who were also involved as a child/youth.
DATA ITEMS
Participation in social, civic or community support activities as a child/youth
1. Yes
2. No
Type of participation as a child/youth: In an organised team sport
0. Not applicable
1. Yes
2. No
The same form of data items are adopted for the following:
! Belong to a youth group (such as guides, scouts, a choir)
! Do some kind of volunteer work
! Go door-to-door to raise money for a cause or organisation
! Active in student government
! Active in a religious organisation.
2.4.6 Experiences in
social, civ ic and
community support
act iv i t ies as a chi ld/youth
80 A B S • ME A S U R I N G SO C I A L CA P I T A L , A N A U S T R A L I A N FR A M E W O R K A N D I N D I C A T O R S • 1 3 7 8 . 0 • 2 0 0 4
C H A P T E R 4 — F R A M E W O R K E L E M E N T S A N D I N D I C A T O R S continued
DE F I N I T I O N
Power relationships refer to the relative positions of power between individuals, and within
or between groups, and between individuals and organisations.
D I S C U S S I O N
Power relationships have been intrinsic to social capital theory. Bourdieu's concept of
social capital emphasises the role of conflicts and power. He presents social capital as
reproducing a structure of privilege and power relationships (Bourdieu 1986).
Membership in groups, and other social relationships are able to be used in efforts to
improve the social position of individuals or groups (Siisianinen 2000).
Bourdieu's concept of power relationships and social capital is not the only way of
viewing these relationships. Other forms of power relationships are:
! linking social capital, some kind of relationship to power and influence, that enables
an increase in resources to a group
! the social dynamic within a network that establishes some people as dominant
! and the relationship Lin (2001) describes between networks, where a person in a
lower position in one network might draw valuable resources from someone higher
in another network.
Power relationships play an important role in the operation of networks and the sense of
efficacy and locus of control of different individuals and groups. Power structures can
influence the ability of communities or groups to meet the needs of all members,
particularly those who have been marginalised. Individual, group, or community locus of
control and sense of efficacy can be influenced by where these people or groups see
themselves as fitting into structures of power, as well as how much they feel they can
influence people and organisations of power. For example, individuals or groups who
2.5 Power relat ionships
INDICATOR
The proportion of the population by grouped number of times moved local area as a
child/youth.
DATA ITEM
Level of geographic mobililty as a child/youth
1. Never
2. Occasional (1–5 times)
3. Frequent (6 or more times)
2.4.9 Geographic mobil i ty
as a chi ld/youth
DATA ITEM
Type of area of residence in youth
1. Major Urban (population clusters of 100,000 or more)
2. Other Urban ( population clusters of 1,000 to 99,999)
3. Bounded Locality (200 to 999)
4. Rural Balance (remainder of state/territory)
5. Migratory
A similar set of categories for current area of residence.
2.4.8 Chi ld/youth
background — type of
area of residence continued
A B S • ME A S U R I N G SO C I A L CA P I T A L , A N A U S T R A L I A N FR A M E W O R K A N D I N D I C A T O R S • 1 3 7 8 . 0 • 2 0 0 4 81
C H A P T E R 4 — F R A M E W O R K E L E M E N T S A N D I N D I C A T O R S continued
INDICATOR
The proportion of people who know someone in an institution or organisation, by type
of organisation.
2.5.1 Contact with
organisat ions
D I S C U S S I O N continued
feel closed out of the government power structure, may feel marginalised and locked out
of decision making.
Leadership is a related concept to power relationships. Leadership has traditionally been
seen as 'the abilities, qualities and behaviour associated with the role of group leader.
This role may be conferred on individuals or groups on the basis of personal
characteristics and experience, or through tradition and/or position occupied' (Collins
Dictionary of Sociology). Leaders generally are seen as those individuals, groups or
communities that hold dominant positions within the group. Black & Hughes (2000)
recognise that this is not always the case. Leadership may also be evidenced where
individuals or groups undertake 'initiatives that stimulate and facilitate the position of
others' (Black & Hughes 2001). Mentoring is one example of this type of leadership.
Mentoring is a relationship based on a common goal. In the case of youth mentoring
programs, this goal is usually to advance the educational and personal growth of the
youth by offering support, guidance and assistance to the individual. Mentors may be
seen to be role models or leaders who, through interacting and sharing information
about themselves with other individuals or groups, pass on norms and ethics of the
community or society. Mentors provide individuals or groups with knowledge and
information about society that may provide them the opportunity to exit a powerless
situation, back into the mainstream. Sports Mentoring programs have also been used in
many cases to try to achieve this. Barnardos has developed the 'Kids+Sport' program
which matches members of the community who have an interest in sport with children
in the community. Sports Challenge is another program which has been used to
encourage children and adolescents to develop skills in communication, conflict and
anger resolution, and goal setting, as well as assisting them in developing a sense of
community belonging and trust.
Mentoring programs are the focus of a component of current social capital related policy.
The Commonwealth Department of Family and Community Services, for example,
administers Mentor Marketplace as part of their 'Stronger Families and Communities
Program'. The aims of Mentor Marketplace are to increase the mentoring opportunities
available for young people.
PO S S I B L E IN D I C A T O R S AN D DA T A I T E M S
The indicators of power relationships have been selected to reflect various aspects of
these relationships, such as contact with organisations, access to services and facilities,
and sense of efficacy.
2.5 Power relat ionships
continued
82 A B S • ME A S U R I N G SO C I A L CA P I T A L , A N A U S T R A L I A N FR A M E W O R K A N D I N D I C A T O R S • 1 3 7 8 . 0 • 2 0 0 4
C H A P T E R 4 — F R A M E W O R K E L E M E N T S A N D I N D I C A T O R S continued
INDICATOR
The proportion of people who often or always feel a lack of control over their lives.
2.5.3 Personal sense of
eff icacy
INDICATORS
The proportion of people who find accessing public services and facilities very easy, by
type of service or facility.
The proportion of people who find accessing public services and facilities very difficult,
by type of service or facility.
DATA ITEM
Level of ease in accessing public education services and facilities
1. Very easy
2. Easy
3. Neither easy nor difficult
4. Difficult
5. Very difficult
2.5.2 Percept ion of
access to publ ic services
and faci l i t ies
DATA ITEMS
Contact in State Parliament
0. Not applicable
1. Yes
2. No
The same form of data item is adopted for the following institutions and organisations:
! Members of state parliament
! Members of Federal parliament
! Ministers
! State government agencies
! Federal government agencies
! Local government agencies
! Legal system
! Trade unions
! Political parties
! Media
! Universities
! Religious/spiritual group
! School related group
! Volunteer organisation or group (e.g. Rotary)
! Service clubs
! Women's organisations (e.g. Country Women's Association)
! Rural industry organisation (e.g. AgForce, CANEGrowers)
! Landcare
! Resident or community action group
! Campaign/action group
! Local government group
! Business leaders.
2.5.1 Contact with
organisat ions continued
A B S • ME A S U R I N G SO C I A L CA P I T A L , A N A U S T R A L I A N FR A M E W O R K A N D I N D I C A T O R S • 1 3 7 8 . 0 • 2 0 0 4 83
C H A P T E R 4 — F R A M E W O R K E L E M E N T S A N D I N D I C A T O R S continued
INDICATOR
The proportion of people who have been involved in a mentoring program in the last
year, either as a mentor or recipient of mentoring.
DATA ITEM
Participation or involvement in mentoring program
1. Yes, as mentor
2. No
1. Yes, as recipient of mentoring
2. No
2.5.4 Mentor ing
DATA ITEM
Feelings of lack of control
1. Never
2. Rarely
3. Sometimes
4. Often
5. Always
2.5.3 Personal sense of
eff icacy continued
84 A B S • ME A S U R I N G SO C I A L CA P I T A L , A N A U S T R A L I A N FR A M E W O R K A N D I N D I C A T O R S • 1 3 7 8 . 0 • 2 0 0 4
C H A P T E R 4 — F R A M E W O R K E L E M E N T S A N D I N D I C A T O R S continued
DE F I N I T I O N
Physical and financial support is the informal sharing of support between individuals and
groups in an ad hoc, occasional or periodic manner and including forms of support such as
lending money or equipment, providing transport, assisting with household maintenance
tasks, or looking after someone's house or pets while they are away.
Emotional support is a form of social support in which individuals are assisted or assist
others in coping with emotions and feelings as well as in making decisions. Examples of
emotional support are listening to problems and providing advice.
Encouragement is a form of moral support and/or inspiration that may serve to instil a sense
of confidence in an individual or community, or to incite an individual or community to
action or perseverance.
D I S C U S S I O N
While voluntary work and regular informal caring are important forms of assistance, in
the ABS Social Capital Framework these are included as community support activities.
This section on sharing support examines the less regular, ad hoc physical and financial
support, rather than the more regular or formal forms of support.
All people are reliant to some extent on the support and care of others at some stage of
their lives. The support may take the form of physical, emotional or financial support,
and may be provided in times of need, or as part of daily life. Most often there is a sense
of reciprocity where support is concerned, with many people being both providers and
recipients of support.
Social support helps people to cope with stress, illness, and difficult events in their lives.
Social support can also positively impact on health. There is some evidence which
suggests that individuals who have strong social ties are more resistant to illness and
disease and may live longer. Berkman and Glass (2000) present evidence from a range of
studies in which it was found that social ties, and the emotional support that these ties
provide, influence the survival among people who have cardiovascular disease.
3.1.1 Physical / f inancial
assistance, emotional
support and
encouragement
The following discussion and indicators relate to different forms of support that people
share. These are:
Physical/financial assistance, emotional support and encouragement
Integration into the community
Common action
3.1 Sharing Support
Networks are not static objects, but dynamic relationships for a purpose, maintained by
supportive and productive interactions. Therefore it is important to include in the ABS
Social Capital Framework the transactions that occur between people within networks
and between organisations. These transactions may take the form of shared information,
introductions, physical or financial assistance and encouragement, negotiation, amongst
other things. They are actions or behaviours that contribute to the formation and
maintenance of social capital, and they represent the advantages and obligations that
network members or groups draw from social capital.
3 . NE T W O R K
TR A N S A C T I O N S
A B S • ME A S U R I N G SO C I A L CA P I T A L , A N A U S T R A L I A N FR A M E W O R K A N D I N D I C A T O R S • 1 3 7 8 . 0 • 2 0 0 4 85
C H A P T E R 4 — F R A M E W O R K E L E M E N T S A N D I N D I C A T O R S continued
INDICATORS
The proportion of the population who have been helped by a relative in the last month.
The proportion of the population who have been helped by a friend in the last month.
The proportion of the population who have been helped by a neighbour in the last
month.
3.1.1.2 Receipt of
support
INDICATORS
The proportion of the population who have provided support to a relative in the past
month.
The proportion of the population who have provided support to a friend in the past
month.
The proportion of the population who have provided support to a neighbour in the past
month.
The proportion of the population who have provided support to someone other than a
relative, friend or neighbour in the past month.
The proportion of the population who have provided support in the past month, by the
type of recipient and the type of support.
DATA ITEMS
Provision of domestic work, home maintenance work or outdoor work, to a relative.
Provision of domestic work, home maintenance work or outdoor work, to a friend.
Provision of domestic work, home maintenance work or outdoor work, to a neighbour.
Provision of domestic work, home maintenance work or outdoor work, to another
person.
0. Not applicable
1. Yes
2. No
The same forms of data items are adopted for the following forms of unpaid work;
! Provision of transport or running errands
! Provision of help with child care
! Teaching, coaching or giving practical advice
! Provision of emotional support
! Looking after their house or pet while they were away
! Provision of occasional care for a member of their family
! Providing help to a person in some other way.
3.1.1.1 Provis ion of
support
PO S S I B L E IN D I C A T O R S AN D DA T A I T E M S
The indicators of sharing support have been selected to reflect concepts of physical,
financial and emotional support. The indicators examine both provision and receipt of
assistance, assistance in the workplace, and the capacity for individuals to seek support.
3.1.1 Physical / f inancial
assistance, emotional
support and
encouragement continued
86 A B S • ME A S U R I N G SO C I A L CA P I T A L , A N A U S T R A L I A N FR A M E W O R K A N D I N D I C A T O R S • 1 3 7 8 . 0 • 2 0 0 4
C H A P T E R 4 — F R A M E W O R K E L E M E N T S A N D I N D I C A T O R S continued
INDICATOR
The proportion of the population who expect that they would receive help (of any type)
from a work colleague if needed.
DATA ITEM
Expectation of help of any type from a work colleague
0. Not applicable
1. Yes
2. No
3.1.1.4 Expectat ion of
help from a work
col league
INDICATOR
The proportion of the population who have in the past week helped a work colleague in
any way.
DATA ITEM
Provision of help to a work colleague
0. Not applicable
1. Yes
2. No
3.1.1.3 Provis ion of help
to work col league
The proportion of the population who have been helped by someone other than a
relative, friend or neighbour in the last month.
The proportion of the population who have been helped by others in the past month by
type of provider and type of support.
DATA ITEMS
Receipt of domestic work, home maintenance work or outdoor work, from a relative.
Receipt of domestic work, home maintenance work or outdoor work, from a friend.
Receipt of domestic work, home maintenance work or outdoor work, from a neighbour.
Receipt of domestic work, home maintenance work or outdoor work, from another
person.
0. Not applicable
1. Yes
2. No
The same form of data items are adopted for the following forms of unpaid work:
! Provision of transport or running errands
! Provision of help with child care
! Teaching, coaching or giving practical advice
! Provision of emotional support
! Looking after their house or pet while they were away
! Provision of occasional care for a member of their family
! Providing help to person in some other way.
3.1.1.2 Receipt of
support continued
A B S • ME A S U R I N G SO C I A L CA P I T A L , A N A U S T R A L I A N FR A M E W O R K A N D I N D I C A T O R S • 1 3 7 8 . 0 • 2 0 0 4 87
C H A P T E R 4 — F R A M E W O R K E L E M E N T S A N D I N D I C A T O R S continued
DE F I N I T I O N
Integration into the community is a process through which an individual or group is
welcomed into a community or group, and made to feel accepted and included. This process
may include introductions to channels of information, which may include social norms and
moral codes.
D I S C U S S I O N
Most people are likely to relocate to a different neighbourhood, town, city or country in
their lifetimes. In addition, as people move through different stages of the life cycle their
interests and responsibilities may change and this is reflected in the networks and
communities of interest that they become active in. Feeling welcome and comfortable in
the local neighbourhood and community, and in the groups of which people are
members or participants, contributes to satisfaction with the community that a person
lives in, and more generally, to feelings of wellbeing.
3.1.2 Integrat ion into the
community
There are various situations in which people may require help. The following indicators
examine three of these situations.
INDICATOR
The proportion of the population who would be able to raise $2,000 in a week in a time
of crisis.
DATA ITEM
Capacity to raise $2,000 within one week
1. Yes
2. No
Source: General Social Survey (2002), ABS.
INDICATOR
The proportion of the population who would be able to arrange transport if they
needed to get somewhere urgently.
DATA ITEM
Ability to arrange transport if need to get somewhere urgently
1. Yes
2. No
INDICATOR
The proportion of the population who would be able to arrange help around their
home if they were ill in bed.
DATA ITEM
Capacity to arrange help when ill in bed and need help at home
1. Yes
2. No
3.1.1.5 Capacity to seek
support
88 A B S • ME A S U R I N G SO C I A L CA P I T A L , A N A U S T R A L I A N FR A M E W O R K A N D I N D I C A T O R S • 1 3 7 8 . 0 • 2 0 0 4
C H A P T E R 4 — F R A M E W O R K E L E M E N T S A N D I N D I C A T O R S continued

Some communities do not have access to a range of facilities or services, so where this
indicator is measured in a survey, it could be prefaced with a question on the availability
of community services or facilities.
3.1.2.1 Provis ion and use
of community faci l i t ies
D I S C U S S I O N continued
Being accepted and included in the community is important for integration into the
community. The acceptance and inclusiveness of a community depends, to a large
extent, on the balance of bonding, bridging and linking ties. Communities or groups with
strong bonding ties are likely to develop a sense of identity and common purpose
(OECD 2001b). In communities with excessive bonding ties outsiders, or newcomers to
the community, can be actively excluded, creating a barrier to integration into the
community.
Group or network heterogeneity also impacts on levels of integration into the
community by influencing the levels of trust within networks, and the extent to which
trust of familiar people is converted into generalised trust of strangers. Stone and
Hughes (2002) comment that while heterogeneity of social ties encourages links among
a wide range of networks, it also may inhibit the development of trusting, reciprocal
relations because of differences.
Other barriers which may impact on integration into the community include inadequate
resources, community services and events available in the local area. If newcomers to the
community do not have adequate access to services and facilities and opportunities to
interact with others in their community, they may be unable to fully participate in the
community or develop a sense of belonging to the community.
Health can be influenced by integration into the community. The importance of social
integration to health was explored by Durkheim, in which he conceptualised integration
as referring to the attachment to social groups, maintenance of interpersonal ties, and
feelings of belonging and allegiance within social groups. Durkheim discusses the
relationship between mortality and social integration, and found that groups that were
more integrated into the community had lower suicide rates (Siahpush & Singh, 1999).
A study of the Eurobodalla region, conducted by Helen Berry of the Centre for Mental
Health Research found that integration into the community is beneficial to mental
health. This study observed that the more people participate in their communities, the
better their mental health. It was suggested that this was due to participation in the
community leading to a stronger sense of belonging, and feeling valued as a member of
the community, which in turn leads to increased trust and optimism (Centre for Mental
Health Research 2003).
PO S S I B L E IN D I C A T O R S AN D DA T A I T E M S
The indicators of integration into the community have been selected to reflect concepts
of sense of belonging, openness, and friendliness of the communities that people live in
and are active in. The indicators of integration into the community focus on use of
community facilities and resources, attendance at community events, sense of belonging
to various groups a person may be involved with, and perceptions of friendliness of the
community.
3.1.2 Integrat ion into the
community continued
A B S • ME A S U R I N G SO C I A L CA P I T A L , A N A U S T R A L I A N FR A M E W O R K A N D I N D I C A T O R S • 1 3 7 8 . 0 • 2 0 0 4 89
C H A P T E R 4 — F R A M E W O R K E L E M E N T S A N D I N D I C A T O R S continued
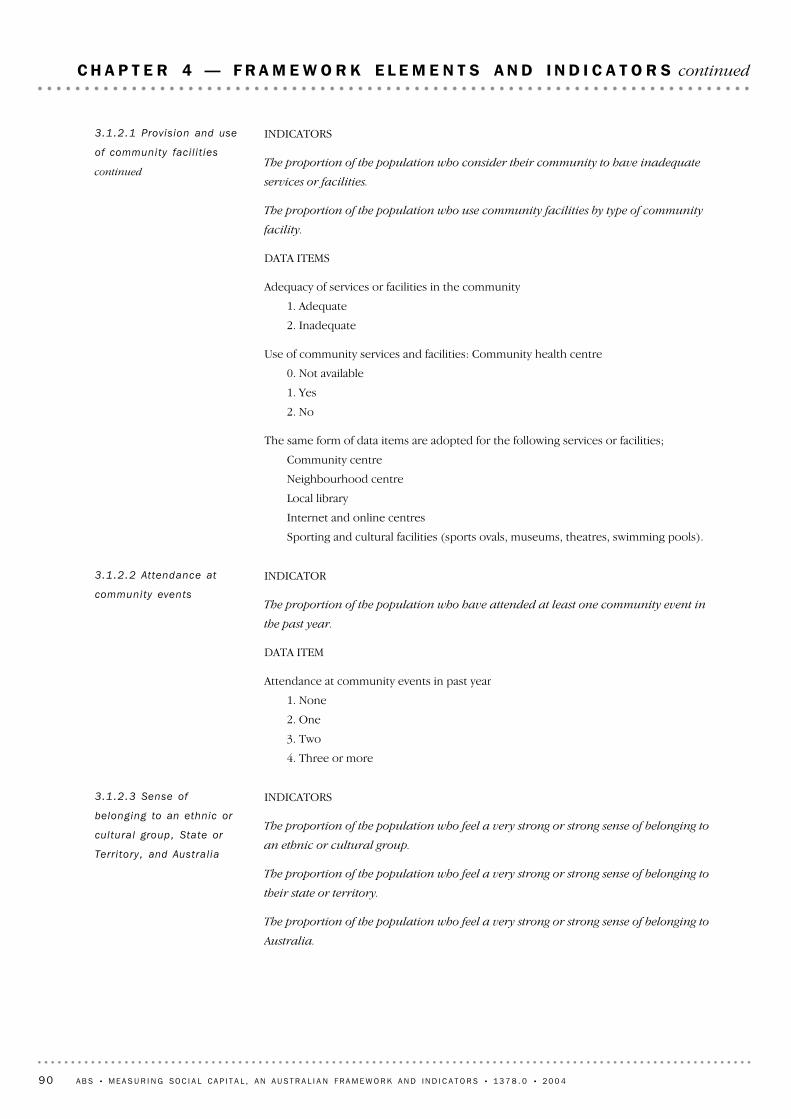
INDICATORS
The proportion of the population who feel a very strong or strong sense of belonging to
an ethnic or cultural group.
The proportion of the population who feel a very strong or strong sense of belonging to
their state or territory.
The proportion of the population who feel a very strong or strong sense of belonging to
Australia.
3.1.2.3 Sense of
belonging to an ethnic or
cultural group, State or
Terr i tory, and Austral ia
INDICATOR
The proportion of the population who have attended at least one community event in
the past year.
DATA ITEM
Attendance at community events in past year
1. None
2. One
3. Two
4. Three or more
3.1.2.2 Attendance at
community events
INDICATORS
The proportion of the population who consider their community to have inadequate
services or facilities.
The proportion of the population who use community facilities by type of community
facility.
DATA ITEMS
Adequacy of services or facilities in the community
1. Adequate
2. Inadequate
Use of community services and facilities: Community health centre
0. Not available
1. Yes
2. No
The same form of data items are adopted for the following services or facilities;
Community centre
Neighbourhood centre
Local library
Internet and online centres
Sporting and cultural facilities (sports ovals, museums, theatres, swimming pools).
3.1.2.1 Provis ion and use
of community faci l i t ies
continued
90 A B S • ME A S U R I N G SO C I A L CA P I T A L , A N A U S T R A L I A N FR A M E W O R K A N D I N D I C A T O R S • 1 3 7 8 . 0 • 2 0 0 4
C H A P T E R 4 — F R A M E W O R K E L E M E N T S A N D I N D I C A T O R S continued

DE F I N I T I O N
Common action refers to drawing on support from others to achieve an objective, for
example relating to a personal, family, workplace or community issue. It includes taking the
initiative to gather people together for a project, joining in an initiative, forming a
deputation, organising a project or a new group or taking part in these, in response to a
situation that arises.
3.1.3 Common Action
INDICATOR
The proportion of the population with a wide friendship and acquaintance network in
their local area.
DATA ITEM
Likelihood of seeing friends and acquaintances in your local area
1. Nearly always
2. Most of the time
3. Some of the time
4. Rarely or never
5. Don't know
3.1.2.5 Extent of
acquaintance and
friendship networks in
local area
INDICATOR
The proportion of the population who consider their local community a friendly place
to live.
DATA ITEM
Level of agreement that community is a friendly place to live
1. Strongly agree
2. Tend to agree
3. Neither agree nor disagree
4. Tend to disagree
5. Strongly disagree
3.1.2.4 Perception of
fr iendl iness of community
DATA ITEMS
Sense of belonging to ethnic or cultural group
1. Not strong at all
2. Not very strong
3. Moderately strong
4. Strong
5. Very strong.
The same form of data item is adopted for
! Your state or territory
! Australia
3.1.2.3 Sense of
belonging to an ethnic or
cultural group, State or
Terr i tory, and Austral ia
continued
A B S • ME A S U R I N G SO C I A L CA P I T A L , A N A U S T R A L I A N FR A M E W O R K A N D I N D I C A T O R S • 1 3 7 8 . 0 • 2 0 0 4 91
C H A P T E R 4 — F R A M E W O R K E L E M E N T S A N D I N D I C A T O R S continued
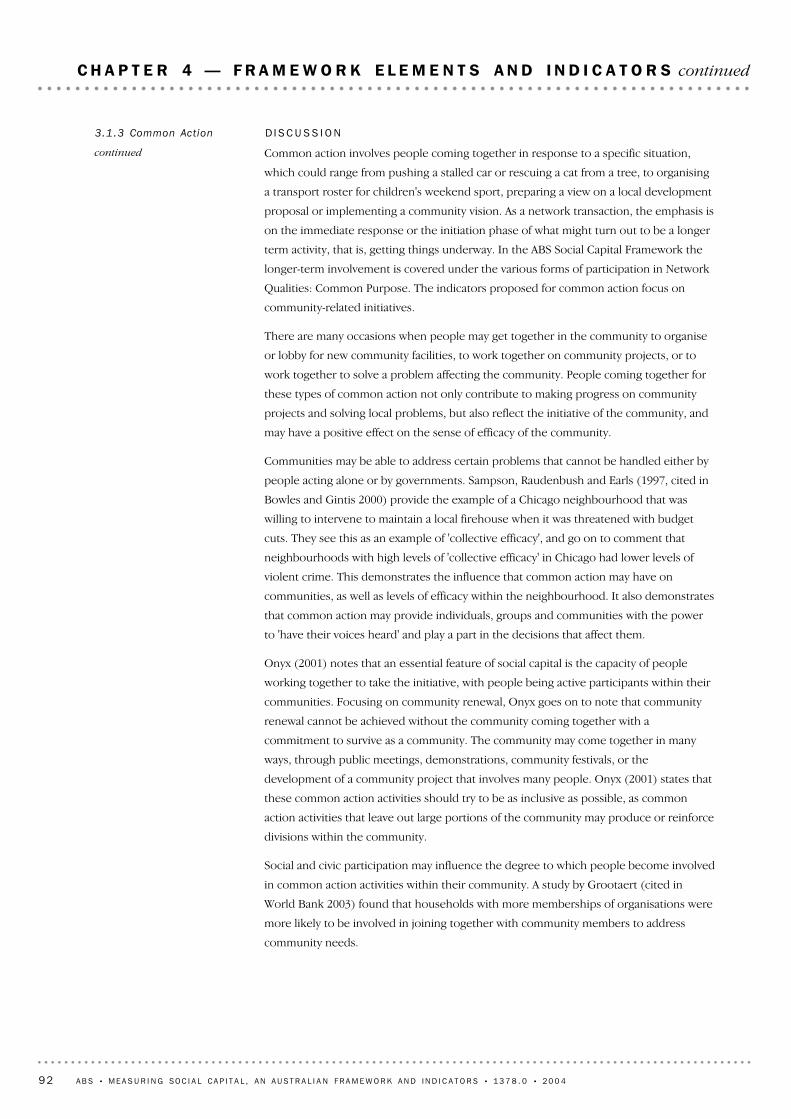
D I S C U S S I O N
Common action involves people coming together in response to a specific situation,
which could range from pushing a stalled car or rescuing a cat from a tree, to organising
a transport roster for children's weekend sport, preparing a view on a local development
proposal or implementing a community vision. As a network transaction, the emphasis is
on the immediate response or the initiation phase of what might turn out to be a longer
term activity, that is, getting things underway. In the ABS Social Capital Framework the
longer-term involvement is covered under the various forms of participation in Network
Qualities: Common Purpose. The indicators proposed for common action focus on
community-related initiatives.
There are many occasions when people may get together in the community to organise
or lobby for new community facilities, to work together on community projects, or to
work together to solve a problem affecting the community. People coming together for
these types of common action not only contribute to making progress on community
projects and solving local problems, but also reflect the initiative of the community, and
may have a positive effect on the sense of efficacy of the community.
Communities may be able to address certain problems that cannot be handled either by
people acting alone or by governments. Sampson, Raudenbush and Earls (1997, cited in
Bowles and Gintis 2000) provide the example of a Chicago neighbourhood that was
willing to intervene to maintain a local firehouse when it was threatened with budget
cuts. They see this as an example of 'collective efficacy', and go on to comment that
neighbourhoods with high levels of 'collective efficacy' in Chicago had lower levels of
violent crime. This demonstrates the influence that common action may have on
communities, as well as levels of efficacy within the neighbourhood. It also demonstrates
that common action may provide individuals, groups and communities with the power
to 'have their voices heard' and play a part in the decisions that affect them.
Onyx (2001) notes that an essential feature of social capital is the capacity of people
working together to take the initiative, with people being active participants within their
communities. Focusing on community renewal, Onyx goes on to note that community
renewal cannot be achieved without the community coming together with a
commitment to survive as a community. The community may come together in many
ways, through public meetings, demonstrations, community festivals, or the
development of a community project that involves many people. Onyx (2001) states that
these common action activities should try to be as inclusive as possible, as common
action activities that leave out large portions of the community may produce or reinforce
divisions within the community.
Social and civic participation may influence the degree to which people become involved
in common action activities within their community. A study by Grootaert (cited in
World Bank 2003) found that households with more memberships of organisations were
more likely to be involved in joining together with community members to address
community needs.
3.1.3 Common Action
continued
92 A B S • ME A S U R I N G SO C I A L CA P I T A L , A N A U S T R A L I A N FR A M E W O R K A N D I N D I C A T O R S • 1 3 7 8 . 0 • 2 0 0 4
C H A P T E R 4 — F R A M E W O R K E L E M E N T S A N D I N D I C A T O R S continued
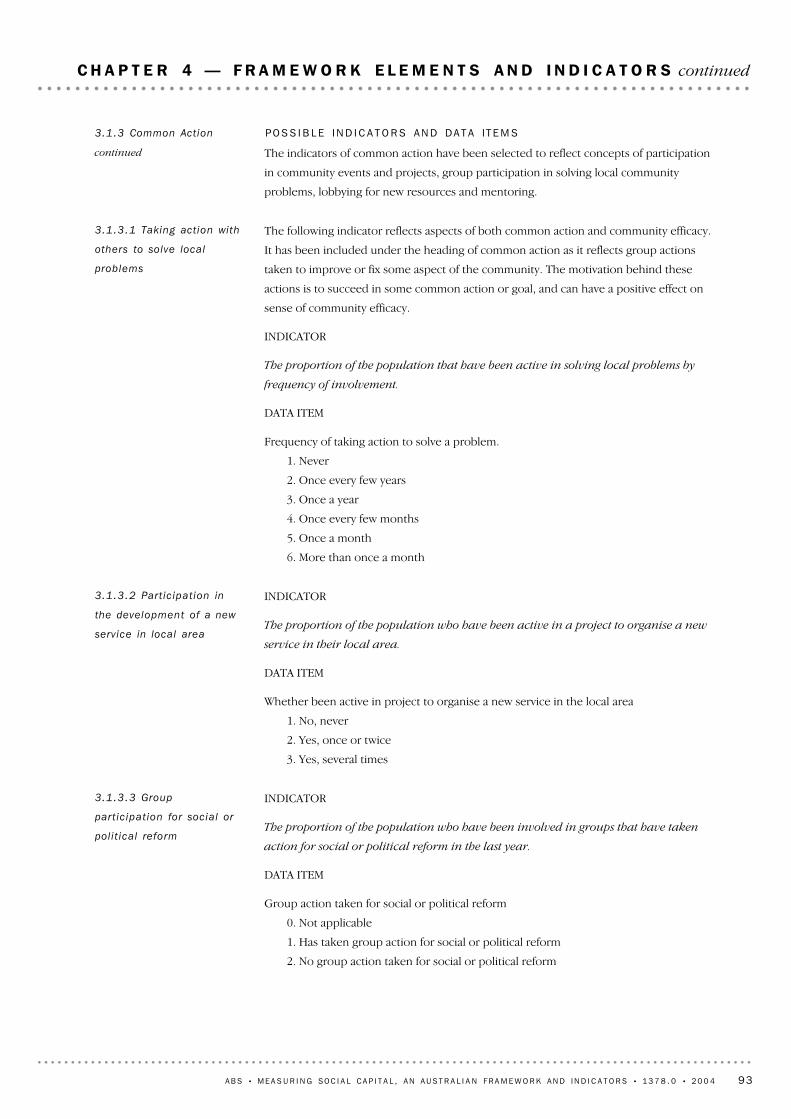
INDICATOR
The proportion of the population who have been involved in groups that have taken
action for social or political reform in the last year.
DATA ITEM
Group action taken for social or political reform
0. Not applicable
1. Has taken group action for social or political reform
2. No group action taken for social or political reform
3.1.3.3 Group
part ic ipat ion for social or
pol i t ical reform
INDICATOR
The proportion of the population who have been active in a project to organise a new
service in their local area.
DATA ITEM
Whether been active in project to organise a new service in the local area
1. No, never
2. Yes, once or twice
3. Yes, several times
3.1.3.2 Part ic ipat ion in
the development of a new
service in local area
The following indicator reflects aspects of both common action and community efficacy.
It has been included under the heading of common action as it reflects group actions
taken to improve or fix some aspect of the community. The motivation behind these
actions is to succeed in some common action or goal, and can have a positive effect on
sense of community efficacy.
INDICATOR
The proportion of the population that have been active in solving local problems by
frequency of involvement.
DATA ITEM
Frequency of taking action to solve a problem.
1. Never
2. Once every few years
3. Once a year
4. Once every few months
5. Once a month
6. More than once a month
3.1.3.1 Taking action with
others to solve local
problems
PO S S I B L E IN D I C A T O R S AN D DA T A I T E M S
The indicators of common action have been selected to reflect concepts of participation
in community events and projects, group participation in solving local community
problems, lobbying for new resources and mentoring.
3.1.3 Common Action
continued
A B S • ME A S U R I N G SO C I A L CA P I T A L , A N A U S T R A L I A N FR A M E W O R K A N D I N D I C A T O R S • 1 3 7 8 . 0 • 2 0 0 4 93
C H A P T E R 4 — F R A M E W O R K E L E M E N T S A N D I N D I C A T O R S continued
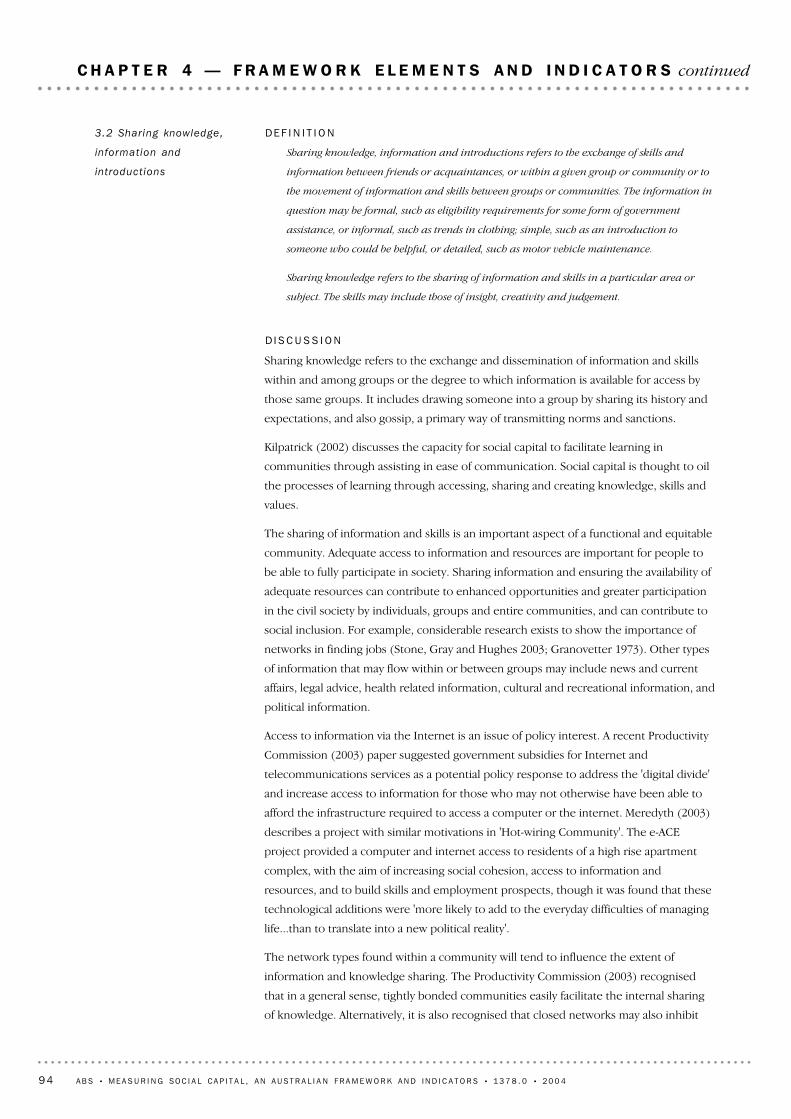
DE F I N I T I O N
Sharing knowledge, information and introductions refers to the exchange of skills and
information between friends or acquaintances, or within a given group or community or to
the movement of information and skills between groups or communities. The information in
question may be formal, such as eligibility requirements for some form of government
assistance, or informal, such as trends in clothing; simple, such as an introduction to
someone who could be helpful, or detailed, such as motor vehicle maintenance.
Sharing knowledge refers to the sharing of information and skills in a particular area or
subject. The skills may include those of insight, creativity and judgement.
D I S C U S S I O N
Sharing knowledge refers to the exchange and dissemination of information and skills
within and among groups or the degree to which information is available for access by
those same groups. It includes drawing someone into a group by sharing its history and
expectations, and also gossip, a primary way of transmitting norms and sanctions.
Kilpatrick (2002) discusses the capacity for social capital to facilitate learning in
communities through assisting in ease of communication. Social capital is thought to oil
the processes of learning through accessing, sharing and creating knowledge, skills and
values.
The sharing of information and skills is an important aspect of a functional and equitable
community. Adequate access to information and resources are important for people to
be able to fully participate in society. Sharing information and ensuring the availability of
adequate resources can contribute to enhanced opportunities and greater participation
in the civil society by individuals, groups and entire communities, and can contribute to
social inclusion. For example, considerable research exists to show the importance of
networks in finding jobs (Stone, Gray and Hughes 2003; Granovetter 1973). Other types
of information that may flow within or between groups may include news and current
affairs, legal advice, health related information, cultural and recreational information, and
political information.
Access to information via the Internet is an issue of policy interest. A recent Productivity
Commission (2003) paper suggested government subsidies for Internet and
telecommunications services as a potential policy response to address the 'digital divide'
and increase access to information for those who may not otherwise have been able to
afford the infrastructure required to access a computer or the internet. Meredyth (2003)
describes a project with similar motivations in 'Hot-wiring Community'. The e-ACE
project provided a computer and internet access to residents of a high rise apartment
complex, with the aim of increasing social cohesion, access to information and
resources, and to build skills and employment prospects, though it was found that these
technological additions were 'more likely to add to the everyday difficulties of managing
life...than to translate into a new political reality'.
The network types found within a community will tend to influence the extent of
information and knowledge sharing. The Productivity Commission (2003) recognised
that in a general sense, tightly bonded communities easily facilitate the internal sharing
of knowledge. Alternatively, it is also recognised that closed networks may also inhibit
3.2 Sharing knowledge,
information and
introduct ions
94 A B S • ME A S U R I N G SO C I A L CA P I T A L , A N A U S T R A L I A N FR A M E W O R K A N D I N D I C A T O R S • 1 3 7 8 . 0 • 2 0 0 4
C H A P T E R 4 — F R A M E W O R K E L E M E N T S A N D I N D I C A T O R S continued
INDICATORS
The proportion of people who have contacted the Commonwealth or state government
or government agencies via the Internet by purpose of contact.
The proportion of people who are interested in contacting the Commonwealth or state
government or government agencies via the Internet (e.g categories 1 and 2).
DATA ITEMS
Whether contacted Commonwealth or state government via the Internet: to express a
view on an issue or decision
0. Not applicable
1. Yes
2. No
The equivalent indicator using the same form of data item is adopted for the following:
! Be part of a consultation process on Commonwealth or state government policies or
legislation
! Find out information about government
! Conduct government transactions (e.g. paying car registration, obtaining a permit).
DATA ITEM
Interest in contacting Commonwealth or state government or government agencies via
the Internet: to express views on an issue of decision
1. Very interested
2. Interested
3. Moderately interested
4. Not very interested
5. Not interested at all
The equivalent indicator using the same form of data item is adopted for the following:
! Be part of a consultation process on Commonwealth or state government policies or
legislation
! Find out information about government
! Conduct government transactions (e.g. paying car registration, obtaining a permit).
3.2.1 Use of Internet to
contact government
D I S C U S S I O N continued
the flow of innovative information, as links outside the group, thus to new sources of
information, are limited (Flora 1998). It follows that open and diverse networks generally
have higher levels of innovation, diverse techniques, and a broader body of
knowledge (Florida et al. 2002).
PO S S I B L E IN D I C A T O R S AN D DA T A I T E M S
The indicators below have been selected to illustrate the concepts of access to
information and sources of information utilised. The indicators focus on identifying the
types of information sources that people rely on when making decisions and access to
information provided by various entities such as government, banks, and the health
system.
3.2 Sharing knowledge,
information and
introduct ions continued
A B S • ME A S U R I N G SO C I A L CA P I T A L , A N A U S T R A L I A N FR A M E W O R K A N D I N D I C A T O R S • 1 3 7 8 . 0 • 2 0 0 4 95
C H A P T E R 4 — F R A M E W O R K E L E M E N T S A N D I N D I C A T O R S continued
INDICATOR
The proportion of people who would seek advice from the Internet, newspaper, or
journal when making a life decision (e.g. buying a house, starting a course of study,
making a career change, getting married, having a child).
DATA ITEMS
Whether would seek life decision advice from Internet, newspaper, or journal.
1. Yes
2. No
The equivalent indicator using the same form of indicator and data item is adopted for:
! Within the local community
! Television
! Family/friends/work colleagues
! A professional in a relevant field (e.g. counsellor, financial adviser)
3.2.4 Source of
information to make life
decis ion
Where this indicator is measured in a survey, it could be prefaced with questions about
employment status.
INDICATOR
The proportion of the population who found out about a job, gained in the previous 12
months, through friends, relatives or company contacts.
The proportion of the population who found out about a job, gained in the previous 12
months through other methods or contacts.
DATA ITEMS
Whether prior knowledge of job being available obtained through friends, relatives or
company contacts.
1. Yes
2. No
The same form of data item is adopted for finding employment through other contacts.
Source: Survey of Job Search Experience, 2000, ABS.
3.2.3 Job search methods
Where this indicator is measured in a survey, it could be prefaced with questions on
employment status.
INDICATOR
The proportion of the population who contacted friends and relations for job search
activities.
DATA ITEM
Contacted friends and relatives for job search activities
1. Yes
2. No
Source: Survey of Job Search Experience, 2000, ABS.
3.2.2 Friends and
relat ives as sources of job
search information
96 A B S • ME A S U R I N G SO C I A L CA P I T A L , A N A U S T R A L I A N FR A M E W O R K A N D I N D I C A T O R S • 1 3 7 8 . 0 • 2 0 0 4
C H A P T E R 4 — F R A M E W O R K E L E M E N T S A N D I N D I C A T O R S continued
! Government services or agencies
! Libraries
! Advocacy and rights associations (e.g. welfare or legal rights groups)
! Religious or spiritual institution
! Other source
! Would not seek life decision advice.
3.2.4 Source of
information to make life
decis ion continued
A B S • ME A S U R I N G SO C I A L CA P I T A L , A N A U S T R A L I A N FR A M E W O R K A N D I N D I C A T O R S • 1 3 7 8 . 0 • 2 0 0 4 97
C H A P T E R 4 — F R A M E W O R K E L E M E N T S A N D I N D I C A T O R S continued

INDICATORS
The proportion of people who believe that conflicts can often be resolved through
discussion.
The proportion of people who believe that conflicts can never be resolved through
discussion.
3.3.1 Resolv ing conf l ic t
through discussion
DE F I N I T I O N
Negotiation is the process involved in conferring, bargaining, compromising or making
arrangements with other individuals or groups in order to come to terms or reach an
agreement (Collins Dictionary of Sociology). It is an important mechanism for conflict
resolution, and using negotiation to resolve problems is likely to decrease transaction costs
and lead to more satisfactory outcomes for all concerned parties.
D I S C U S S I O N
Negotiation is strongly linked to trust and transaction costs. Transaction costs are the
costs that occur in the process of social and economic exchange. These costs are
influenced by the determined level of trust that may be placed in the other party
involved in the exchange. Transaction costs involving negotiation are influenced by
factors such as: the competence of the other party in the relationship; the likelihood that
the other party will discharge their obligations, keep their promises and assume their
responsibilities; and the chances that the second party understands and adheres to
relevant social norms and role expectations, and this will not harm the interest of other
parties in the relationship (Hogan & Owen 2000). Trust is built through interaction, and
this leads to the potential to decrease transaction costs (Flora 1998).
Negotiation is also an important mechanism for conflict resolution, for conflicts of all
scales from individual, national, regional or global level disputes. Black and Hughes
(2001) recognise that some form of disagreement is inevitable in a network or
community where members take an interest in local affairs. It is the ability to manage
these disagreements and conflicts that is indicative of the health of the network or
community. Where conflicts go unresolved, and are entrenched in a community, this
may be a sign of the weakness of that community in terms of its capacity to successfully
deal and make progresss with the conflict. A community or network that is able to
successfully deal with conflict through negotiation, consultation and compromise
demonstrates a capacity for problem solving and cooperation. This is due to mechanisms
being in place that allow for the recognition and appreciation of diverse points of view,
and to reconcile them to an outcome which is satisfactory for all parties involved
through debate (Black and Hughes 2001).
PO S S I B L E IN D I C A T O R S AN D DA T A I T E M S
The indicators presented below have been selected to denote concepts of conflict
resolution and problem solving and the propensity to use negotiation in these processes.
3.3 Negot iat ion
98 A B S • ME A S U R I N G SO C I A L CA P I T A L , A N A U S T R A L I A N FR A M E W O R K A N D I N D I C A T O R S • 1 3 7 8 . 0 • 2 0 0 4
C H A P T E R 4 — F R A M E W O R K E L E M E N T S A N D I N D I C A T O R S continued
INDICATOR
The proportion of people who have taken action to attempt to solve a local problem.
DATA ITEM
Action taken to solve local problem
0. Not applicable
1. Yes
2. No
INDICATOR
3.3.4 Deal ing with local
problems
INDICATOR
The proportion of people who would be willing to seek mediation in regard to a
conflict with neighbours.
DATA ITEM
Willingness to seek mediation over neighbourhood dispute
1. No
2. Maybe
3. Yes
4. Yes, Definitely
3.3.3 Wil l ingness to seek
mediat ion
INDICATOR
Level of confidence people have in their local council/local government in managing
conflict within the community.
DATA ITEM
! Level of confidence for managing conflict in local government/council
! Not effective
! Moderately effective
! Effective
! Mostly effective
! Very effective.
The equivalent indicator using the same form of data item is adopted for the following;
! Police
! Legal system
! Ombudsman
! Democratic processes.
3.3.2 Confidence in
mechanisms for dealing
with confl ic t
DATA ITEM
Level of agreement that conflicts can be resolved by discussion
1. Never
2. Rarely
3. Sometimes
4. Often
3.3.1 Resolv ing conf l ic t
through discussion
continued
A B S • ME A S U R I N G SO C I A L CA P I T A L , A N A U S T R A L I A N FR A M E W O R K A N D I N D I C A T O R S • 1 3 7 8 . 0 • 2 0 0 4 99
C H A P T E R 4 — F R A M E W O R K E L E M E N T S A N D I N D I C A T O R S continued
The proportion of people who have taken action to attempt to solve a local problem, by
type of action.
DATA ITEMS
Action taken to solve local problem — talked to neighbours
0. Not applicable
1. Yes
2. No
The same form of data item is adopted for the following actions:
! Contacted a local politician (Commonwealth or state government)
! Contacted the appropriate organisation to deal with the problem (e.g. the police,
council)
! Attended a public meeting
! Joined an action group.
3.3.4 Deal ing with local
problems continued
10 0 A B S • ME A S U R I N G SO C I A L CA P I T A L , A N A U S T R A L I A N FR A M E W O R K A N D I N D I C A T O R S • 1 3 7 8 . 0 • 2 0 0 4
C H A P T E R 4 — F R A M E W O R K E L E M E N T S A N D I N D I C A T O R S continued

INDICATOR
The proportion of people who believe their neighbours would intervene if children were
absent from school without parental consent.
DATA ITEM
Expectation that neighbours would intervene if children were absent from school
without parental consent
1. Yes
2. No
3. Don't know
The equivalent indicator using the same form of data item is adopted for the following;
! Someone was spray painting graffiti on a local building
! Children were showing disrespect to an adult
! A fight broke out in front of their house.
3.4.1 Percept ion of
wil l ingness to intervene in
anti-social behaviour
DE F I N I T I O N
Applying sanctions is the means by which a moral code or social norm is enforced, either
positively in the form of rewards or negatively by means of punishment. Sanctions may also
be formal, such as legal penalties, or informal, such as ostracism (Jary and Jary 2000).
The operation of social sanctions is an all-pervasive factor in social relations, and they are
normally applied if the norms or values of the group or community are disobeyed or ignored.
D I S C U S S I O N
Negative sanctions are applied to those who act without regard to a set of generally
agreed upon societal 'rules'. Positive sanctions may be applied to those who observe
these rules, or exceed them.
The application of sanctions may be formal, or informal. An example of the application of
a formal negative sanction might include legal penalties such as prosecution and
imprisonment. Positive formal sanctions might include recognition in the community
through awards and accolades such as the award of the Order of Australia medal.
Informal negative sanctions may include ostracism and discrimination. Positive informal
sanctions might include social popularity and community acceptance.
The sanctions that accompany certain norms and rules are also generally agreed upon, or
may at least be predicted, which ensures that those who disregard the social norms and
moral code of the group may expect to be punished (Pretty & Ward 2001). Sanctions are
enforced by a group or community to demonstrate disapproval of behaviours considered
anti-social, or outside of group norms, or to demonstrate approval of behaviours viewed
as desirable. Sanctions generally place the interests of the collective above those of the
individual (Pretty & Ward, 2001).
PO S S I B L E IN D I C A T O R S AN D DA T A I T E M S
The indicators presented below have been selected to denote concepts of conflict
resolution and problem solving and the propensity to use negotiation in these processes.
3.4 Apply ing Sanctions
A B S • ME A S U R I N G SO C I A L CA P I T A L , A N A U S T R A L I A N FR A M E W O R K A N D I N D I C A T O R S • 1 3 7 8 . 0 • 2 0 0 4 10 1
C H A P T E R 4 — F R A M E W O R K E L E M E N T S A N D I N D I C A T O R S continued
INDICATOR
The proportion of people that would allow people with views outside of the group norm
to make a speech in their town, city or community.
DATA ITEM
Attitude to allowing views outside group norms to be expressed in town, city or
community
1. Should be allowed
2. Should not be allowed
3. Don't know.
3.4.2 Wil l ingness to allow
behaviour against norms
10 2 A B S • ME A S U R I N G SO C I A L CA P I T A L , A N A U S T R A L I A N FR A M E W O R K A N D I N D I C A T O R S • 1 3 7 8 . 0 • 2 0 0 4
C H A P T E R 4 — F R A M E W O R K E L E M E N T S A N D I N D I C A T O R S continued
DE F I N I T I O N
In the ABS Social Capital Framework, network types is a higher level classification, drawing
on and relating to many other aspects of the framework, such as trust, norms, density and
openness sharing knowledge, acceptance of diversity, and inclusiveness. These network types
are usually divided up into bonding, bridging and linking.
In the framework bonding refers to those relationships that you have with people like you. It
produces strong 'in-group' loyalty. (Woolcock 2000) Bonding ties are described as the strong
ties that develop between people of similar background and interests, usually include family
and friends, provide material and emotional support, and are more inward-looking and
protective.
In the framework bridging refers to relations with friends, associates and colleagues with
different backgrounds, for example different socioeconomic status, age, generation, race or
ethnicity. (Woolcock 2000) Bridging may also refer to those relationships where a single
person or a small number of people are members of diverse groups.
Bonding and bridging are not completely mutually exclusive. Groups from a similar
background are not similar in every respect, and may provide bridging links across, for
instance, generations or sexes or educational achievement. Conversely, in groups from
different ethnic backgrounds people may find others of the same age and sex with a common
educational background and interests.
In the framework linking refers to relations within a hierarchy of different social layers,
where power, social status and wealth are accessed by different groups (OECD 2001a).
Linking social capital involves relationships with those in authority and positions of power
and is useful for garnering resources (Stone, Gray & Hughes 2003). Relationships between the
government and communities are included here.
D I S C U S S I O N
Bonding, bridging and linking are viewed as significant aspects of social capital, and in
particular the level and balance of the different types of networks within a community
may be considered as important. Weakness or exaggeration in any of these, leading to
lack of balance between them, can be limiting to the people involved, oppressive or
dangerous to others or a threat to social harmony.
Social cohesion in part depends on a balance of bonding, bridging, and linking ties.
Social cohesion is characterised by "strong levels of trust and norms of reciprocity that
bond groups, the abundance of bridging that transgresses social divisions, and
mechanisms of conflict management (responsive democracy, an independent judiciary,
etc.) that enable just links to exist between unequal groups, including government and
communities. Therefore, social cohesion represents the presence of well-integrated
horizontal (bonding and bridging) and vertical (linking) social capital" (Cullen &
Whiteford 2001).
Strongly bonded groups in a society with no bridging between them may be very
disruptive. Strong bonding ties allow particular communities or groups to develop a
sense of identity and common purpose, without bridging ties, bonding ties may become
a basis for the pursuit of narrow interests, and can actively exclude outsiders. The Ku
Klux Klan, the Mafia and terrorist groups have all been used as examples of groups within
4 . NE T W O R K T Y P E S
4.1, 4.2, 4.3 Bonding,
Bridging and Linking
A B S • ME A S U R I N G SO C I A L CA P I T A L , A N A U S T R A L I A N FR A M E W O R K A N D I N D I C A T O R S • 1 3 7 8 . 0 • 2 0 0 4 10 3
C H A P T E R 4 — F R A M E W O R K E L E M E N T S A N D I N D I C A T O R S continued
INDICATOR
The proportion of people whose main group involvement mostly includes people who
have the same first language.
DATA ITEMS
Whether members in main group have same first language as respondent
0. Not applicable
1. All
2. Most
3. About half
4. Few
5. None
The same form of indicator and data item is adopted for the following;
! Those from an ethnic group that is visibly different
! Those with roughly the same level of education
! Those from a similar family income level
! Those in the same age group.
4.1.1 Group homogeneity
The following set of indicators relate to expressions of bonding. These include group
homogeneity and density of formal networks.
4.1 Bonding
D I S C U S S I O N continued
society that have high levels of bonding ties, but low levels of or lack of interest in
developing bridging ties. Marginalised groups experiencing income inequality may or
may not have strong bonding ties, but usually have weak bridging and linking ties.
On the other hand, strong linking networks not balanced by bridging ties may provide a
range of advantages, perhapes including less strict application of regulations or sanctions
or greater access to funding for favoured people or groups. This for the community or
society can introduce the potential for or practice of corruption. Corruption can damage
a community by eroding justice and trust, and shifting cost burdens. The exaggeration of
these types of ties can lead to a breakdown in social cohesion. For social capital to best
enhance civility and the community harmony as a whole, the existance of a balance
between these types of networks may be best.
It may also be noted that these network types may be more prominent in various life
stages or under different circumstances. For example, in childhood and old age, bonding
social capital is important to health. Bonding relationships provide opportunities for
social support and assistance, which are particularly important to health in these stages
of life. As people enter the labour market, bridging social capital becomes important for
finding employment, and employment may lead to opportunities for bridging
relationships.
PO S S I B L E IN D I C A T O R S AN D DA T A I T E M S
The indicators of network types have be selected to reflect aspects of bonding, bridging
and linking
4.1, 4.2, 4.3 Bonding,
Bridging and Linking
continued
10 4 A B S • ME A S U R I N G SO C I A L CA P I T A L , A N A U S T R A L I A N FR A M E W O R K A N D I N D I C A T O R S • 1 3 7 8 . 0 • 2 0 0 4
C H A P T E R 4 — F R A M E W O R K E L E M E N T S A N D I N D I C A T O R S continued
INDICATOR
The proportion of the population who bridge formal networks (if groups participate in
contain a few or none of the same people).
4.2.2 Density of formal
networks
INDICATOR
The proportion of the population who undertake activities with few or no people who
have the same first language.
DATA ITEMS
Whether members in main group have the same first language as respondent
0. Not applicable
1. All
2. Most
3. About half
4. Few
5. None
The equivalent indicator and the same form of data item is adopted for the following:
! Those from an ethnic group that is visibly different
! Those with roughly the same level of education
! Those from a similar family income level
! Those in the same age group.
The same indicator and data item are also found in 1.1.5.3 Group Diversity, Acceptance
of Diversity.
4.2.1 Group Diversi ty
The following set of indicators relate to expressions of bridging. These include group
diversity, heterogeneity, density of formal networks, openess of local community and low
bridging.
4.2 Bridging
INDICATORS
The proportion of the population with closed formal networks (if groups contain all the
same people).
The proportion of the population with dense formal networks (if groups contain mostly
or about half the same people).
DATA ITEM
Density of formal network
0. Not applicable
1. All
2. Most
3. About half
4. Few
5. None
4.1.2 Density of formal
networks
A B S • ME A S U R I N G SO C I A L CA P I T A L , A N A U S T R A L I A N FR A M E W O R K A N D I N D I C A T O R S • 1 3 7 8 . 0 • 2 0 0 4 10 5
C H A P T E R 4 — F R A M E W O R K E L E M E N T S A N D I N D I C A T O R S continued
INDICATORS
The proportion of people who have personal links to institutions.
The proportion of people who have personal links to institutions, by type of institution.
4.3.1 Links to inst i tut ions
The following indicator relates to links to institutions as an expression of linking.4.3 Linking
INDICATOR
The proportion of the population who have felt isolated and cut off from society in the
last year due to sexism.
DATA ITEMS
Low bridging ties due to sexism
0. Not applicable
1. Yes
2. No
The same form of indicator and data item is adopted for the following;
! Racism
! Homophobia
! Discrimination relating to disability
! Other.
4.2.4 Low bridging
INDICATOR
The proportion of the population who consider their local community to be welcoming
of newcomers.
DATA ITEM
Perception of welcoming community
1. Strongly agree
2. Agree
3. Neither agree nor disagree
4. Disagree
5. Strongly disagree
4.2.3 Openness of local
community
DATA ITEM
Density of formal networks
0. Not applicable
1. All of the same people
2. Most of the same people
3. About half of the same people
4. A few of the same people
5. None of the same people
4.2.2 Density of formal
networks continued
10 6 A B S • ME A S U R I N G SO C I A L CA P I T A L , A N A U S T R A L I A N FR A M E W O R K A N D I N D I C A T O R S • 1 3 7 8 . 0 • 2 0 0 4
C H A P T E R 4 — F R A M E W O R K E L E M E N T S A N D I N D I C A T O R S continued
INDICATOR
The proportion of the population who have felt isolated and cut off from society in the
last year, by type of reason.
DATA ITEMS
Reason for feeling isolated: Paid work
0. Not applicable
1. Yes
2. No
The same form of data item is adopted for the following:
! Child care responsibilities
! Other caring responsibilities
! Lack of own transport
! Irregular or expensive public transport
! No friends
4.4.2 Feel ings of social
isolat ion
INDICATOR
The proportion of the population with no formal networks (if not active in groups).
DATA ITEM
Whether belongs to a group
1. Yes
2. No
4.4.1 Lack of act iv i ty in
groups
The following set of indicators relate to expressions of isolation. These include lack of
activity in groups and feelings of social isolation.
4.4 Isolat ion
DATA ITEMS
Have personal links to institutions
1. Yes
2. No
Type of institution has personal link to: Legal system
1. Yes, have personal link to the legal system
2. No, do not have personal link to the legal system
The same forms of the data item is adopted for the following types of institutions:
! The legal system
! A religious institution
! The police
! The media
! Unions
! Government
! Political parties
! Universities
! Business.
4.3.1 Links to inst i tut ions
continued
A B S • ME A S U R I N G SO C I A L CA P I T A L , A N A U S T R A L I A N FR A M E W O R K A N D I N D I C A T O R S • 1 3 7 8 . 0 • 2 0 0 4 10 7
C H A P T E R 4 — F R A M E W O R K E L E M E N T S A N D I N D I C A T O R S continued
! No family
! Problems with physical access
! Other.
OT H E R RE L A T E D IN D I C A T O R S
The following indicators are additional indicators related to bonding, bridging and
linking which may be found in 1.1.5 Acceptance of diversity and inclusiveness, 2.5 Power
relationships and 3.2.1 Sharing support (Knowledge, information and introductions)
1.1.5.1 Acceptance of different lifestyles
2.5.1 Contact with organisations
3.2.1.3 Job search methods
4.4.2 Feel ings of social
isolat ion continued
10 8 A B S • ME A S U R I N G SO C I A L CA P I T A L , A N A U S T R A L I A N FR A M E W O R K A N D I N D I C A T O R S • 1 3 7 8 . 0 • 2 0 0 4
C H A P T E R 4 — F R A M E W O R K E L E M E N T S A N D I N D I C A T O R S continued
OECD suggests that the capacity to satisfy a society's needs depends on the different
types of capital available to it. The four types of capital identified in the ABS Social Capital
Framework and also reflected in the OECD framework are:
Produced economic capital — the produced means of production like machinery,
equipment and structures, but also non-production related infrastructures, non-tangible
assets, and the financial assets the provide command over current and future output
streams;
Natural capital — the renewable and non-renewable resources which enter the
production process and satisfy consumption needs, as well as environmental assets that
have amenity and productive use, and are essential for the life support system;
Human capital — the knowledge, skills, competencies and attributes embodied in
individuals that facilitate the creation of personal wellbeing.
Social capital — Networks, together with shared norms, values and understanding that
facilitate co-operation within and between groups.
A characteristic of all types of capital is that stocks depreciate over time and increase
through investment and (in some cases) natural regeneration. For all of these resources,
changes in flows take time to affect underlying stock. Another common feature of all
types of capital is that they accumulate and are restored slowly, while they can be
dissipated quickly if not used sustainably (OECD 2001b).
As noted in the discussion of the ABS Social Capital Framework in Chapter 3, the
interactions between different types of capital affect wellbeing through a variety of
different channels and produce different types of returns. The returns can be of an
economic or non-economic nature, and accrue to individuals or groups. Education for
example, increases the earnings capacity of individuals and in doing so confers a private
benefit to the individual. However, education may also impact favourably on
non-economic variables, e.g. by lowering crime rates, and in this way confer a benefit to a
wider group or society as a whole (OECD 2001b).
A further feature of capital is that the returns gained from investment in capital can
accrue to different sources:
! directly to their owners, as is the case in produced economic capital
TY P E S OF CA P I T A L
In recent years, the OECD has progressed work in the areas of human and social capital.
They have described the role of human capital and social capital in contributing to
human wellbeing, and the related policy implications OECD (2001a). The OECD has also
examined in detail the concept of sustainable development and the relevant issues and
policy implications OECD (2001b). Recognition of the complex interactions between
economic, environmental and social dimensions, and the capacity of stocks of the
different types of capital (natural; produced economic; human; and social) to fulfil the
needs current generations without compromising the capacity to fulfil the needs of
future generations are key to the concept of sustainable development, and are themes
reflected in both of these OECD publications.
The work of the OECD in the area of human and social capital, and the work describing
the linkages of the different types of capital to wellbeing and sustainable development
have been an important influence on the way in which the types of capital and the
interactions between them are presented and described in the ABS Social Capital
Framework. The following material drawn from the work of the OECD complements the
material presented in Chapter 3 of this information paper describing the types of capital
and their interactions, in providing additional detail and relevant background material.
The following paragraphs draw on the OECD perspective to provide a summary of the
different types of capital and their interactions and the role of the types of capital in
contributing to wellbeing and the goal of sustainable development.
AP P E N D I X 1 — SO C I A L AN D
OT H E R CA P I T A L S
A B S • ME A S U R I N G SO C I A L CA P I T A L , A N A U S T R A L I A N FR A M E W O R K A N D I N D I C A T O R S • 1 3 7 8 . 0 • 2 0 0 4 10 9
A P P E N D I X 1 S O C I A L A N D O T H E R C A P I T A L S

! or to other family members, as in the case of the impact of parent's education on
their children
! to the community where individuals live, for example the impact of social capital on
neighbourhood crime
! or to societies at large such as in the case of natural capital.
It is also important to note that the effects of different types of capital on human
wellbeing are mediated by political, institutional and legal arrangements (such as those
establishing property rights and enforcing contracts and obligations) and by the extent to
which these institutions are accountable and democratic (OECD 2001b).
The concept of sustainability emphasises the interactions between the environment,
economy and society, and therefore the interactions between the different types of
capital. The criteria for each dimension of sustainability are somewhat different and not
always mutually compatible in the short term.
The requirements for economic sustainability include strong and durable economic
growth, such as preserving financial stability, a low and stable inflationary environment,
and capacities to invest and innovate. Environmental sustainability focuses on
maintaining the integrity, productivity and resilience of biological and physical systems,
and preserving access to a healthy environment. Social sustainability emphasises the
importance of high employment, of safety nets capable to adapt to major demographic
and structural changes, of equity and of democratic participation in decision making
(OECD 2001b). Where these objectives are not compatible in the short term, the goal of
societies is to balance various needs, optimise wellbeing, and find solutions to deal with
the unavoidable trade offs that this process entails.
TY P E S OF CA P I T A L continued
11 0 A B S • ME A S U R I N G SO C I A L CA P I T A L , A N A U S T R A L I A N FR A M E W O R K A N D I N D I C A T O R S • 1 3 7 8 . 0 • 2 0 0 4
A P P E N D I X 1 S O C I A L A N D O T H E R C A P I T A L S continued
Organisations/departments involved: Australian Bureau of Statistics.
Social capital aspects: job linking networks, economic participation.
Other areas covered by the survey: labour force status, length of unemployment, hours
worked, occupation, family type, birthplace, underemployment, demographics.
Relevant Publication: Job Search Experience, 2000 (cat. no. 6202.0).
1.3 Labour Force Survey,
including Supplementary
survey on Job Search
Exper ience, 2000
Organisations/departments involved: Australian Bureau of Statistics, Family and
Community Services.
Social capital aspects: social participation (including IT use), social networks, social
support, fear of crime.
Other areas covered by the survey: household information, demographics, marital
status, education, employment and labour force status, transport, health, life stressors,
crime, information technology, financial stress, income, dwelling questions, assets and
liabilities.
Relevant publication: General Social Survey: Summary Results, Australia
(cat. no. 4159.0).
Contacts:
Director,
Living Standards Section
Phone: (02) 6252 6098
Email: <[email protected]>.
1.2 General Social Survey,
Austral ia, 2002
Organisations/departments involved: Australian Bureau of Statistics, Prime Minister's
Community Business Partnership (CBP).
Social capital aspects: community support — business relationships with community
organisations and individuals, donations (with no benefit), social cohesion.
Other areas covered by the survey: also covers types of activities organisations donated,
sponsored and gave business to community projects, and barriers to donating,
sponsoring and providing business to community projects.
Relevant Publication: Generosity of Australian Businesses, 2000–01 (cat. no. 8157.0),
ABS, Canberra.
Contact:
Director,
Economic Activity Surveys BSC Section
Phone: (02) 6252 5521
Email: <[email protected]>.
1 . AU S T R A L I A N SU R V E Y S
1.1 Austral ian Business
Generosity Survey 2000–01
This appendix presents information about a selected range of existing surveys that
include questions that measure different aspects of social capital. Examination of
questions from these surveys has informed our development and selection of the social
capital indicators and data items that are presented in this discussion paper. The ABS
recognises that the surveys listed here do not represent the full range of surveys that
have included questions to measure aspects of social capital.
The surveys described represent a range of surveys that have collected social capital
related information. These surveys include current ABS surveys, surveys conducted by
other national statistical agencies, collections by international statistical organisations,
surveys conducted by state government departments in Australia, and surveys conducted
by research institutions and academics, both in Australia and overseas. The ABS has not
assessed the quality of the non-ABS surveys described in this appendix.
AP P E N D I X 2 — SE L E C T E D
SO C I A L CA P I T A L SU R V E Y S
A B S • ME A S U R I N G SO C I A L CA P I T A L , A N A U S T R A L I A N FR A M E W O R K A N D I N D I C A T O R S • 1 3 7 8 . 0 • 2 0 0 4 11 1
A P P E N D I X 2 S E L E C T E D S O C I A L C A P I T A L S U R V E Y S
Organisations/departments involved: Australian Bureau of Statistics.
Social capital aspects: organisational involvement, social support, civic participation.
1.7 Voluntary Work Survey,
2000
Organisations/departments involved: Australian Bureau of Statistics.
Social capital aspects: social context of activities, time spent on social and civic activities,
unpaid work.
Other areas covered by the survey: Time spent on other activities, such as caring for
children, fitness and health, travel, technology use and paid work.
Relevant Publication: How Australians Use Their Time, 1997 (cat. no. 4153.0), ABS,
Canberra.
Contact:
Director,
Family and Community Statistics
Phone: (02) 6252 6316
Email: <[email protected]>.
1.6 Time Use Survey, 1997
Organisations/departments involved: Australian Bureau of Statistics.
Social capital aspects: social support, social participation, receipt of assistance needed,
provision of care, ability to make and maintain friendships
Other areas covered by the survey: disabling conditions, self-perceptions of health and
wellbeing, self-care, aids and assistance required or used, housing, education, assistance
needed or received, transport, employment and employment limitations, income.
Relevant Publication: Disability, Ageing and Carers: Summary of Findings,
1998 (cat. no. 4430.0), ABS, Canberra.
Contact:
Director,
Family and Community Statistics
Phone: (02) 6252 6316
Email: <[email protected]>.
1.5 Survey of Disabi l i ty ,
Ageing and Carers
Organisations/departments involved: NSW Department of Health.
Social capital aspects: social participation, voluntary work and activity, trust and
trustworthiness, physical assistance and emotional support, inclusiveness and sense of
belonging, bridging.
Other areas covered by the survey: health service use, health status, sleeping position,
breastfeeding, child nutrition, food security and hunger, immunisation, asthma,
emotional and behavioural problems, home visiting, parental support services, sun
exposure, disability, family functioning, injury, television watching, school attendance,
child care attendance, adult smoking at home or during pregnancy, demographics.
Relevant publication:
<http://www.health.nsw.gov.au/public-health/phb/NSWChildHealthSurvey2001.pdf>.
Contact:
email: <[email protected]>.
1.4 New South Wales Child
Health Survey
Contact:
Director,
Labour Force and Supplementary Surveys
Phone: (02) 6252 5489
Email: <[email protected]>.
1.3 Labour Force Survey,
including Supplementary
survey on Job Search
Exper ience, 2000 continued
11 2 A B S • ME A S U R I N G SO C I A L CA P I T A L , A N A U S T R A L I A N FR A M E W O R K A N D I N D I C A T O R S • 1 3 7 8 . 0 • 2 0 0 4
A P P E N D I X 2 S E L E C T E D S O C I A L C A P I T A L S U R V E Y S continued
Organisations/departments involved: Australian Institute of Family Studies.
Social capital aspects: trust, reciprocity, networks, social capital within and beyond the
family, provision and availability of services, fear of crime, civic practices, citizenship
values.
Other areas covered by the survey: age, gender, ethnicity, class, family functioning,
family structure, demographics, crime rate, labour force participation, income, wealth,
health.
Relevant publication: <http://www.aifs.gov.au/institute/pubs/RP27.pdf>.
Web site: <www.aifs.org.au>.
1.11 Famil ies, Social Capital
and Cit izenship Survey, 2001
Organisations/departments involved: Institute of Social Research at Swinburne
University of Technology, funded by the Australian Research Council, local governments
and universities.
Social capital aspects: civic participation, social participation, trust/trustworthiness,
sharing knowledge and information, inclusiveness and sense of belonging to community,
sense of efficacy, network structure (social anchorage), perceptions of a community,
importance of local issues and governance, community values and priorities.
Other areas covered by the survey: demographics including educational level and
occupation.
Relevant Publication:
<http://www.sisr.net/programcsp/occasionalpapers/surfcoastSurvey.PDF>.
Web site: <www.swin.edu.au>.
1.10 Community Part ic ipat ion
Survey, Surf Coast Shire,
2001
Organisations/departments involved: Department of Health and Human Services,
Tasmania, Department of Human Services, Victoria.
Social capital aspects: trust and trustworthiness, acceptance and tolerance for diversity,
physical assistance and emotional support, inclusiveness and sense of belonging, sense
of efficacy, network structure, linking.
1.9 Community Capacity
Quest ionnaire, Tasmania,
2001
Organisations/departments involved: Commonwealth Department of Health and Ageing
(DOHA), National Public Health Partnership (NPHP).
Social capital aspects: Sense of efficacy (locus of control).
Other areas covered by the survey: demographics, quality of life (mental and physical
health and feelings), health conditions, medication use, health service use, Kessler 10
scale (psychological distress), health risk factors.
Relevant web site publications:
<http://www.health.wa.gov.au/publications/documents/Designmethod.pdf>
<http://www.dhs.sa.gov.au/pehs/PROS/sercis-publications.html>.
1.8 Col laborat ive Health and
Wellbeing Survey, Austral ia
(Western Austral ia, South
Austral ia, Northern Terr i tory)
Other areas covered by the survey: demographics, information on the types of
organisations persons volunteered for, regularity of voluntary work, length of time since
first volunteered, number of organisations volunteered for.
Relevant Publication: Voluntary Work, Australia 2000 (cat. no. 4441.0).
Contact:
Director,
Family and Community Statistics
Phone: (02) 6252 6316
Email: <[email protected]>.
1.7 Voluntary Work Survey,
2000 continued
A B S • ME A S U R I N G SO C I A L CA P I T A L , A N A U S T R A L I A N FR A M E W O R K A N D I N D I C A T O R S • 1 3 7 8 . 0 • 2 0 0 4 11 3
A P P E N D I X 2 S E L E C T E D S O C I A L C A P I T A L S U R V E Y S continued
Organisations/departments involved: Victorian Department of Human Services.
Social capital aspects: social networks and support structures, social and community
participation, civic involvement and empowerment, trust in people and social
institutions and tolerance for diversity.
Other areas covered by the survey: demographics, health care use, health service issues
— access to care and propensity to seek care, nutrition, alcohol, smoking, attitudes to
smoking, asthma, blood pressure, diabetes, physical activities, self-reported health status,
health conditions.
1.16 Victor ian Populat ion
Health Survey, 2001
Organisations/departments involved: University of Technology Sydney (provided partial
funding), The Local Community Services Association of NSW, Bankstown Community
Resource Centre, Deniliquin Council for Social Development, The Harris Centre, West
Wyalong Neighbourhood Centre.
Social capital aspects: Civic participation, social participation, voluntary work and
activity, trust and trustworthiness, acceptance and tolerance for diversity, physical
assistance and emotional support, sharing knowledge and information, inclusiveness and
sense of belonging, reciprocity and altruism, sense of efficacy, network structure,
bonding, bridging.
Other areas covered by the survey: employment and socioeconomic status,
demographics.
1.15 Social Capital
Quest ionnaire, 1998
(Measuring Social Capital in
Five Communit ies in NSW,
Onyx and Bullen)
Organisations/departments Involved: Queensland Department of Premier and Cabinet,
and other Queensland Government Departments and Agencies.
Social capital aspects: Social and civic participation, community support, linking,
community confidence, applying sanctions, acceptance of diversity and inclusiveness.
Other areas covered by the survey: The QHS is an omnibus survey, therefore topics vary
considerably between surveys and within surveys. Questions submitted are based on the
requirements of the relevant department/agency.
Web site:
<http://www.oesr.qld.gov.au/views/statistics/products/surveys/qhs/qhs_fs.htm>.
1.14 The Queensland
Household Survey
Organisations/departments involved: University of Newcastle and Australian
Department of Health and Ageing.
Social capital aspects: social participation, networks, social and emotional support,
violence: trust/trustworthiness.
Other areas covered by the survey: Use of and Satisfaction With Health Care Services,
Life Stages and Key Events, Weight and Exercise.
Web site: <http://www.newcastle.edu.au/centre/wha/>.
1.13 The Austral ian
Longitudinal Study of
Women's Health
Organisations/departments involved: The Department of Public Health, Flinders
University of South Australia, and the South Australian Community Health Research Unit.
Social capital aspects: civic participation, social participation, voluntary work and
activity, trust and trustworthiness, physical assistance and emotional support, sharing
knowledge and information, inclusiveness and sense of belonging, sense of efficacy,
network structure, bonding, linking.
Other areas covered by the survey: health status, time use, demography.
Contact:
Department of Public Health,
Flinders University of South Australia
email: <[email protected]>.
1.12 Health and Part ic ipat ion
Survey, 1997 (Adelaide
Health Development and
Social Capital Project)
11 4 A B S • ME A S U R I N G SO C I A L CA P I T A L , A N A U S T R A L I A N FR A M E W O R K A N D I N D I C A T O R S • 1 3 7 8 . 0 • 2 0 0 4
A P P E N D I X 2 S E L E C T E D S O C I A L C A P I T A L S U R V E Y S continued
Organisations/departments involved: primarily National Centre for Social Research,
funded by European Commission's 5th Framework Programme, supplementary funds
from the European Science Foundation.
Social capital aspects: trust, civic participation, social participation, values, reciprocity.
Other areas covered by the survey: use of the media, demographics (sex, age,
educational level, income, martital status etc.).
2.4 European Social Survey,
2002
Organisations/departments involved: Statistics Canada
Social capital aspects: identity, social and civic participation, social networks, interaction
with society, attitudes, trust and satisfaction.
Other areas covered by the survey: demographics, family and household composition,
ethnic ancestry, place of birth, religion, socioeconomic activities, languages, family
background.
Contact:
Client Services and Dissemination
Housing, Family and Social Statistics Division
Email: <[email protected]>
Web site: <http://www.statcan.ca>.
Information from this survey will be available in September 2003.
2.3 Ethnic Diversi ty Survey,
2002, Stat ist ics Canada
Organisations/departments involved: Statistics Canada — Housing, Family and Social
Statistics Division.
Social capital aspects: social engagement, social participation, civic participation, safety,
trust and reciprocity, bridging.
Other areas covered by the survey: health, disability, cultural background, internet use,
experiences in youth, employment, educational attainment, dwelling information,
income.
Contact:
Email: <[email protected]>
Web site: <http://www.statcan.ca>.
2.2 Canadian General Social
Survey: Survey on Social
Engagement in Canada, 2003
Organisations/departments involved: Office of National Statistics, Home Office.
Social capital aspects: fear of crime, perceptions of neighbourhood, perceptions of
equality and prejudice.
Other areas covered by the survey: experiences of crime — property and personal,
security, violence at work, experience of household fires, illegal drug use, sexual
victimisation.
Contact:
SSD Project Support Branch
Email: <[email protected]>
Web site: <http://www.homeoffice.gov.uk/rds/index.htm>.
Recent British Crime Survey publications are available on the Home Office Research and
Statistics web site.
2 . IN T E R N A T I O N A L SU R V E Y S
2.1 Bri t ish Crime Survey,
2001, United Kingdom
Web site: <http://www.dhs.vic.gov.au/phd/healthsurveillance/>.1.16 Victor ian Populat ion
Health Survey, 2001 continued
A B S • ME A S U R I N G SO C I A L CA P I T A L , A N A U S T R A L I A N FR A M E W O R K A N D I N D I C A T O R S • 1 3 7 8 . 0 • 2 0 0 4 11 5
A P P E N D I X 2 S E L E C T E D S O C I A L C A P I T A L S U R V E Y S continued

Organisations/departments involved: designed by the Saguaro Seminar: Civic
Engagement in America, at the John F Kennedy School of Government, Harvard
University.
Social capital aspects: civic participation, social participation, voluntary work and
activity, trust and trustworthiness, acceptance and tolerance for diversity, physical
assistance and emotional support, sharing knowledge and information, inclusiveness and
sense of belonging, reciprocity and altruism, sense of efficacy, network structure,
bonding, bridging, linking.
Other areas covered by the survey: Draft includes some questions not included in the
survey in the introduction to the survey, health, employment status, education level,
income.
Web site: <http://www.cfsv.org/communitysurvey/>.
2.8 Social Capital Benchmark
Survey (Final and Draft
versions), 2000
Organisations/departments involved: Universities of York, Bristol and Loughborough.
Funded by the Joseph Rowntree Foundation and field work and advice undertaken by
the Office of National Statistics.
Social capital aspects: social participation, voluntary work and activity, acceptance and
tolerance for diversity, physical assistance and emotional support, inclusiveness and
sense of belonging, sense of efficacy, network structure, bonding relationships.
Over areas covered by the survey: changes over time (comparison between from when
last participated in General Household Survey), housing, health, time use, necessities of
life, finance and debt, poverty (intra-household poverty, poverty over time, absolute and
overall poverty, area deprivation, local services, crime, school, perceptions of poverty).
Web site: <http://www.bris.ac.uk/poverty/pse/>.
2.7 Mil lennium Poverty and
Social Exclusion Survey, 1999
Organisations/Departments involved: Princeton Survey Research Consultants, Pew
Research Centre.
Social capital aspects: Social participation, communication mode, networks of support,
network frequency.
Other areas covered by the survey: Time use, use of the internet, internet activities
(communication, business, commerce), basic demographics.
2.6 The Internet and Dai ly
Life, October/November 2001
Organisations/departments involved: Office of National Statistics (ONS), Health
Department Authority, United Kingdom.
Social capital aspects: views about local area, reciprocity, trust, social networks and
support.
Other areas covered by the survey: household and family information, housing tenure
and household accommodation, consumer durables including vehicle ownership,
employment, health and use of health services, smoking and drinking, marriage,
cohabitation, fertility, income, demographics.
Relevant publication:
<http://www.statistics.gov.uk/downloads/theme_social/perceptions_social_capital.pdf>.
Web site: <http://www.statistics.gov.uk/>.
2.5 General Household
Survey, 2000–01, UK
Contact:
European Social Survey,
Central Co-ordinating Team,
National Centre for Social Research,
Email: <[email protected]>
Web site: <http://www.europeansocialsurvey.org>.
2.4 European Social Survey,
2002 continued
11 6 A B S • ME A S U R I N G SO C I A L CA P I T A L , A N A U S T R A L I A N FR A M E W O R K A N D I N D I C A T O R S • 1 3 7 8 . 0 • 2 0 0 4
A P P E N D I X 2 S E L E C T E D S O C I A L C A P I T A L S U R V E Y S continued
This publication contains various indicators of social capital from a wide variety of
sources. Surveys or research project cited in this publication include: Australian
Community Survey, conducted in 1998 by Black and Hughes; Trust and Citizen
Engagement in Metropolitan Philadelphia, conducted in 1997 by the Pew Research
Center; Social Capital Household Management Survey, conducted in 1999 by Krishna and
Shrader; Social Capital Assessment Tool, also by Krishna and Shrader, developed in 1999;
Short Version of the Sense of Community Index (SCI), developed by McMillan and Chaus
in 1986; and Neighbourhood and Community Scale, developed by Glynn in 1981.
These measurement tools cover many aspects of social capital, including: civic
participation, social participation, trust and trustworthiness, acceptance and tolerance for
diversity, physical assistance and emotional support, sharing knowledge and information,
inclusiveness and sense of belonging, reciprocity and altruism, sense of efficacy, bonding
and linking.
3 . PU B L I C A T I O N S
3.1 Black, A & Hughes, P
(2001) The Identi f icat ion and
Analysis of Indicators of
Community Strength and
Outcomes
Organisations/departments involved: many research institutes, universities etc. involved
in each country. The project is guided by a steering committee representing all regions
of the world. Coordination and the distribution of WVS data is based at the Institute for
Social Research, University of Michigan.
Social capital aspects: life satisfaction, bonding, bridging, trust, civic participation, social
participation, voluntary work, tolerance for diversity, values, sense of belonging.
Other areas covered by the survey: covers a broad range of subject matter, such as work,
attitudes to life, family, social and political opinions, demographics.
2.10 World Values Survey,
2000–01
This Global Social Capital Survey, which includes questions on: groups and networks;
subjective wellbeing; political engagement; sociability and everyday social interactions;
community activities; relations with government; identity; violence and crime;
communications; and demographics, was conducted in Uganda (and a similar version in
Ghana) during 1998–99. It was designed by Deepa Narayan, Senior Advisor in the Poverty
Reduction and Economic Management Network of the World Bank.
There is currently no information available on survey methodology, response rates and
sample sizes for this survey.
2.9 World Bank Social Capital
Survey, Republ ic of Uganda,
1998–1999
A B S • ME A S U R I N G SO C I A L CA P I T A L , A N A U S T R A L I A N FR A M E W O R K A N D I N D I C A T O R S • 1 3 7 8 . 0 • 2 0 0 4 11 7
A P P E N D I X 2 S E L E C T E D S O C I A L C A P I T A L S U R V E Y S continued
Example question:
I'd like to ask you about the level of confidence you have in various institutions. For each
type of institution I name, could you tell me whether you have a great deal of
confidence, quite a lot of confidence, not very much confidence, or no confidence at all.
! The Police Force
! The Legal System and the Courts
! The Health Care System
! The school system
1.1.1.3 Inst i tut ional Trust
Example question:
Using a scale of 1 to 5, where 1 means cannot be trusted at all and 5 means can be
trusted a lot, how much do you trust each of the following groups of people?
! People in your immediate family
! People in your wider family
! Friends
! People in your neighbourhood
! People you work with or go to school with
Source: General Social Survey: Survey on Social Engagement in Canada 2003, Statistics
Canada.
1.1.1.2 Informal Trust
Example question:
Generally speaking, would you say that most people can be trusted or that you can't be
too careful in dealing with people?
! Most people can be trusted.
! Cannot be too careful with dealing with people.
Source: World Values Survey 2000–01, Institute of Social Research, University of
Michigan.
1.1.1.1 General ised Trust
The following example questions have been drawn from a range of surveys to illustrate
some possible ways of measuring trust and trustworthiness.
1.1.1 Trust and
Trustworthiness
The following example questions relate to: trust and trustworthiness; reciprocity; sense
of efficacy; cooperation; and acceptance of diversity and inclusiveness.
1 . NE T W O R K QU A L I T I E S
1.1 Norms
This appendix presents information about a selected range of existing surveys that
include questions that measure different aspects of social capital. The ABS recognises
that the surveys listed here do not represent the full range of surveys that have included
questions to measure aspects of social capital. A social capital question bank containing a
wider range of social capital related questions drawn from existing surveys was compiled
as part of the indicator development process. This question bank will soon be available
on the social capital theme page of the ABS web site.
The development of the majority of the indicators and data items presented in this
information paper has been informed by the examination of a range of existing surveys
that contain questions on social capital. These surveys include current ABS surveys,
surveys conducted by other national statistical agencies such as Statistics Canada and the
Office of National Statistics in UK, collections by international statistical organisations,
surveys conducted by state government departments in Australia, and surveys conducted
by research institutions and academics, both in Australia and overseas. Example
questions selected from these surveys for each of the framework elements are presented
in this appendix. These example questions have been provided to illustrate how some
agencies/researchers have collected such information. The ABS has not assessed the
quality of these interview questions and does not endorse the use of any of the listed
survey questions without rigorous testing in the Australian context.
I N T R O D U C T I O N
11 8 A B S • ME A S U R I N G SO C I A L CA P I T A L , A N A U S T R A L I A N FR A M E W O R K A N D I N D I C A T O R S • 1 3 7 8 . 0 • 2 0 0 4
A P P E N D I X 3 E X A M P L E QU E S T I O N S FR O M EX I S T I N G SU R V E Y S

Example question:
Do you think that most people in your local community would be willing to contribute
money and/or time to projects from which they would not receive any personal benefit?
! Will not contribute time
! Will contribute time
! Don't know/not sure.
! Will not contribute money
! Will contribute money
! Don't know/not sure.
Source: Adapted from Social Capital Household Measurement Survey, Krishna &
Shrader, 1999, cited in Black & Hughes 2001.
1.1.2.1 Perception of
reciproci ty in the community
The following example questions have been drawn from a range of surveys to illustrate
some possible ways of measuring reciprocity.
1.1.2 Reciprocity
Example question:
How safe or unsafe do you feel at home after dark?
! Very unsafe
! Unsafe
! Neither safe nor unsafe
! Safe
! Very safe
Source: General Social Survey 2002, ABS.
1.1.1.7 Feel ings of safety at
home after dark
Example question:
If you lost a wallet or purse that contained two hundred dollars, how likely is it to be
returned with the money in it if it was found:
By someone who lives close by?
By a complete stranger?
! Very likely
! Somewhat likely
! Not at all likely
! Don't know
Source: General Social Survey: Survey on Social Engagement in Canada 2003, Statistics
Canada.
Example question:
Now I'd like to ask you to what extent you think various behaviours can be justified.
Using a scale of 1 to 5, where 1 means it can never be justified, and 5 means it can always
be justified:
Do you think lying in your own interest can be justified?
Source: General Social Survey: Survey on Social Engagement in Canada 2003, Statistics
Canada.
1.1.1.4 General ised
Trustworthiness
! The Welfare System
! Federal parliament
! Banks
! Major Corporations
! Local Trade and Business people
Source: General Social Survey: Survey on Social Engagement in Canada 2003, Statistics
Canada.
1.1.1.3 Inst i tut ional Trust
continued
A B S • ME A S U R I N G SO C I A L CA P I T A L , A N A U S T R A L I A N FR A M E W O R K A N D I N D I C A T O R S • 1 3 7 8 . 0 • 2 0 0 4 11 9
A P P E N D I X 3 EX A M P L E QU E S T I O N S FR O M EX I S T I N G SU R V E Y S continued
Example question:
Level of agreement with the statement:
If there was a serious problem in this community, people would get together and solve
it.
! Strongly agree
! Agree
! Neither agree nor disagree
! Disagree
! Strongly disagree
1.1.3.1 Perceptions of
community eff icacy
The following example questions have been drawn from a range of surveys to illustrate
some possible ways of measuring sense of efficacy.
1.1.3 Sense of Eff icacy
Example question:
Level of agreement with the statement:
I feel a responsibility to make a contribution to the community I live in.
I feel a responsibility to make a contribution, but not necessarily to the community
where I live.
! Strongly agree
! Agree
! Neither agree nor disagree
! Disagree
! Strongly disagree.
Source: Adapted from The Social Capital Benchmark Survey Draft, 2000, John F
Kennedy School of Government, Harvard University.
The adaption is the inclusion of scaled response categories.
1.1.2.3 Att i tude towards
contr ibut ing to the community
Example question:
In the last three months have you
! Personally signed a cheque donating money to any of these types of organisations?
! Personally used a credit card to donate money to any of these types of organisations?
! Personally given a cash donation to any of these types of organisations?
! Personally donated money in other form to ant of these types of organisations?
(Donations exclude the purchasing of goods and raffle tickets, but includes doorknocks
and sponsoring walkathons etc.)
! Yes
! No
Source: Survey of Voluntary Work, 2000, ABS.
Example question:
These are examples of the types of organisations or groups that people may do voluntary
work for.
In the last 12 months, did you do do any unpaid voluntary work for one of these types of
organisations?
! Yes
! No
Source: Survey of Voluntary Work, 2000, ABS.
1.1.2.2 Donating time or
money
This adaption in response categories is to allow the split of the contribution of
time/money.
1.1.2.1 Perception of
reciproci ty in the community
continued
12 0 A B S • ME A S U R I N G SO C I A L CA P I T A L , A N A U S T R A L I A N FR A M E W O R K A N D I N D I C A T O R S • 1 3 7 8 . 0 • 2 0 0 4
A P P E N D I X 3 EX A M P L E QU E S T I O N S FR O M EX I S T I N G SU R V E Y S continued
Example question:
If public officals asked everyone to conserve water or electricity because of some
emergency, such as severe drought, how likely is it that people in your community
would cooperate?
! Very likely
! Likely
! Neither/depends
1.1.4.1 Cooperat ion in
conservat ion of water
resources and electr ic i ty
The following example questions have been drawn from a range of surveys to illustrate
some possible ways of measuring cooperation.
1.1.4 Cooperat ion
Example question:
Thinking now about your own local community in Surf Coast Shire, how would you rate
it on the item below?
It's an active community, people do things and get involved in local issues and activities.
Scale from Very poor to very good
Source: Community Participation Survey, Surf Coast Shire 2001, Institute for Social
Research, Swinburne University of Technology.
1.1.3.5 Perception of Eff icacy
Example question:
Thinking now about your own local community in Surf Coast Shire, how would you rate
it on the item below?
People have opportunities to participate in the decisions made by their local
government.
Scale from Very poor to very good
Source: Community Participation Survey, Surf Coast Shire 2001, Institute for Social
Research, Swinburne University of Technology.
1.1.3.4 Efficacy in local
decision making
Example question:
In the past year, have you taken any of the following actions to solve a local problem?
! Talked to neighbours about it
! Contacted a local politician
! Contacted the appropriate organisation to deal with the problem eg police, council
! Attended a public meeting
! Joined an action group
Source: Health and Participation Survey 1997, Department of Public Health, Flinders
University of South Australia.
1.1.3.3 Personal /community
eff icacy
Example question:
Level of agreement with the statement:
Generally speaking, how much do you feel that you can influence things that are
happening in your local community?
Scale from 1 (not at all) to 5 (a great deal).
Source: Community Participation Survey, Surf Coast Shire 2001, Institute for Social
Research, Swinburne University of Technology.
1.1.3.2 Sense of personal
eff icacy in the community
Source: Adapted from Neighbourhood Sense of Community Scale, cited in The
identification and analysis of indicators of community strength and outcomes (Black
& Hughes, 2001).
The adaption is to provide scaled response categories.
1.1.3.1 Perceptions of
community eff icacy
continued
A B S • ME A S U R I N G SO C I A L CA P I T A L , A N A U S T R A L I A N FR A M E W O R K A N D I N D I C A T O R S • 1 3 7 8 . 0 • 2 0 0 4 12 1
A P P E N D I X 3 EX A M P L E QU E S T I O N S FR O M EX I S T I N G SU R V E Y S continued
Example question:
Would you say that Australia's cultural life is generally enriched or undermined by people
coming to live here from other countries?
! Strongly agree
! Agree
! Neutral
! Disagree
! Strongly disagree.
Source: Adapted from the European Social Survey, 2000.
The adaption is the inclusion of named scaled response categories.
1.1.5.2 Support for Cultural
Diversi ty
Example question:
Do you enjoy living among people of different lifestyles?
! No, not at all
! Not often
! Sometimes
! Yes, definitely.
Source: Victorian Population Health Survey 2001, Originally from Social Capital
Questionnaire, Measuring Social Capital in Five Communities in NSW, 1998, J Onyx &
P Bullen.
1.1.5.1 Acceptance of
dif ferent li festy les
The following example questions have been drawn from a range of surveys to illustrate
some possible ways of measuring acceptance of diversity and inclusiveness.
1.1.5 Acceptance of Diversi ty
and Inclusiveness
Example question:
Please tell me for each of the following statements whether you think it can be justified,
never justified or something in between.
! Claiming government benefits to which you are not entitled
! Avoiding a fare on public transport
! Cheating on taxes if you have a chance
! Someone accepting a bribe in the course of their duties.
Source: World Values Survey 2000–01, Institute of Social Research, University of
Michigan.
1.1.4.4 Att i tude to social and
civ ic cooperat ion
Example question:
Level of agreement with the following statement
There is strong local support for community events, such as show days and festivals.
! Strongly agree
! Agree
! Neither agree nor disagree
! Disagree
! Strongly disagree.
Source: Adapted from the Community Capacity Questionnaire 2001, Tasmanian
Department of Health and Human Services.
The adaption is the inclusion of a five point named response scale.
1.1.4.2 Support for
community events
! Unlikely
! Very unlikely
! Don't know.
Source: The Social Capital Community Benchmark Survey Final Version 2000, John F
Kennedy School of Government, Harvard University.
1.1.4.1 Cooperat ion in
conservat ion of water
resources and electr ic i ty
continued
12 2 A B S • ME A S U R I N G SO C I A L CA P I T A L , A N A U S T R A L I A N FR A M E W O R K A N D I N D I C A T O R S • 1 3 7 8 . 0 • 2 0 0 4
A P P E N D I X 3 EX A M P L E QU E S T I O N S FR O M EX I S T I N G SU R V E Y S continued

The following example questions relate to: social particpation; civic particpation;
community support; friendship; and economic participation.
1.2 Common Purpose
Example question:
Do you feel that negative attitudes towards yourself or other people, because of cultural
or ethnic background is increasing, decreasing or staying the same in your
neighbourhood?
! Increasing
! Decreasing
! Staying the same.
Source: The Queensland Household Survey 2001, Queensland Department of Premier
and Cabinet.
1.1.5.5 Perception of change
in negative att i tudes toward
cultural diversi ty
Example question:
Have you seen or experienced any negative attitudes towards yourself or other people,
because of cultural or ethnic background?
! Yes
! No
Where have you seen or experienced negative attitudes?
! At work
! At school/university/TAFE
! In the community
! In the media
! Private opinions/family/friends
! Transport/taxis
! Public events
! Government services
! Real estate agents/private businesses
! Hotels/clubs
! Other.
Source: The Queensland Household Survey 2001, Queensland Department of Premier
and Cabinet.
1.1.5.4 Expressions of
negative behaviours toward
cultural diversi ty
Example question:
(Suite of questions related to the organisation that people are most active in)
Thinking of all of the people you met through this organisation...
How many have the same mother tongue as you?
How many come from an ethnic group that is visibly different from you?
How many are the same sex as you?
How many have roughly the same level of education as you?
How many are from a similar family income level as you?
How many are in the same age group as you?
! All
! Most
! About half
! A Few
! None.
Source: General Social Survey: Survey on Social Engagement in Canada 2003, Statistics
Canada.
1.1.5.3 Group diversi ty
A B S • ME A S U R I N G SO C I A L CA P I T A L , A N A U S T R A L I A N FR A M E W O R K A N D I N D I C A T O R S • 1 3 7 8 . 0 • 2 0 0 4 12 3
A P P E N D I X 3 EX A M P L E QU E S T I O N S FR O M EX I S T I N G SU R V E Y S continued
Example question:
In the past 12 months, were you a member of or a participant in:
! A trade union or professional organisation
! A political party or group
! A sports or recreation organisation (such as hockey league, health club, golf club)
! A cultural, education or hobby organisation (such as theatre group, book club or
bridge club)
! A religious affiliated group (such as church youth group or choir)
! A school group, neighbourhood, civic or community association (such as PTA,
alumni, block parents, neighbourhood watch)
! A service club or fraternal organisation (such as Kiwanis, Knights of Columbus, The
Legion)
! Any other type of organisation.
1.2.1.3 Membership in clubs,
organisat ions or associat ions
Example question:
Which of the following factors is important in preventing you from doing these activities?
! Not interested
! Can't afford to
! Fear of burglary, vandalism or personal attack
! Lack of time due to child caring responsibilities
! Lack of time due to other caring responsibilities
! Too sick, old or disabled
! Lack of time due to paid work
! No vehicle/poor public transport
! No one to go with (social)
! Feel unwelcome (due to disability, cultural difference, gender, age, etc.)
! None of these
Source: Millennium Poverty and Social Exclusion Questionnaire 1999, Townsend
Centre for International Poverty Research, University of Bristol, UK.
1.2.1.2 Barr iers to social
part ic ipat ion
Example question:
In the last three months, did you participate in any of the following activities?
! Recreation group/ cultural group activities
! Community or special interest group activities
! Religious or spiritual activities
! Sport or physical activities
! Visited library, museum, or art gallery
! Went out to a restaurant/cafe/bar/club
! Attended sporting event as spectator
! Visited park/botanic gardens, zoo or theme park
! Cinema, theatre or concert
! Doing continuing education courses or classes
! Internet chatroom activities
! Visiting friends or being visited by friends
! Going out with a group of friends.
Source: Adapted from General Social Survey 2002, ABS.
The adaption has been to add some activities to the response category list. These
additional categories would need to be tested.
1.2.1.1 Part ic ipat ion in social
act iv i t ies
The following example questions have been drawn from a range of surveys to illustrate
some possible ways of measuring social participation.
1.2.1 Social Part ic ipat ion
12 4 A B S • ME A S U R I N G SO C I A L CA P I T A L , A N A U S T R A L I A N FR A M E W O R K A N D I N D I C A T O R S • 1 3 7 8 . 0 • 2 0 0 4
A P P E N D I X 3 EX A M P L E QU E S T I O N S FR O M EX I S T I N G SU R V E Y S continued
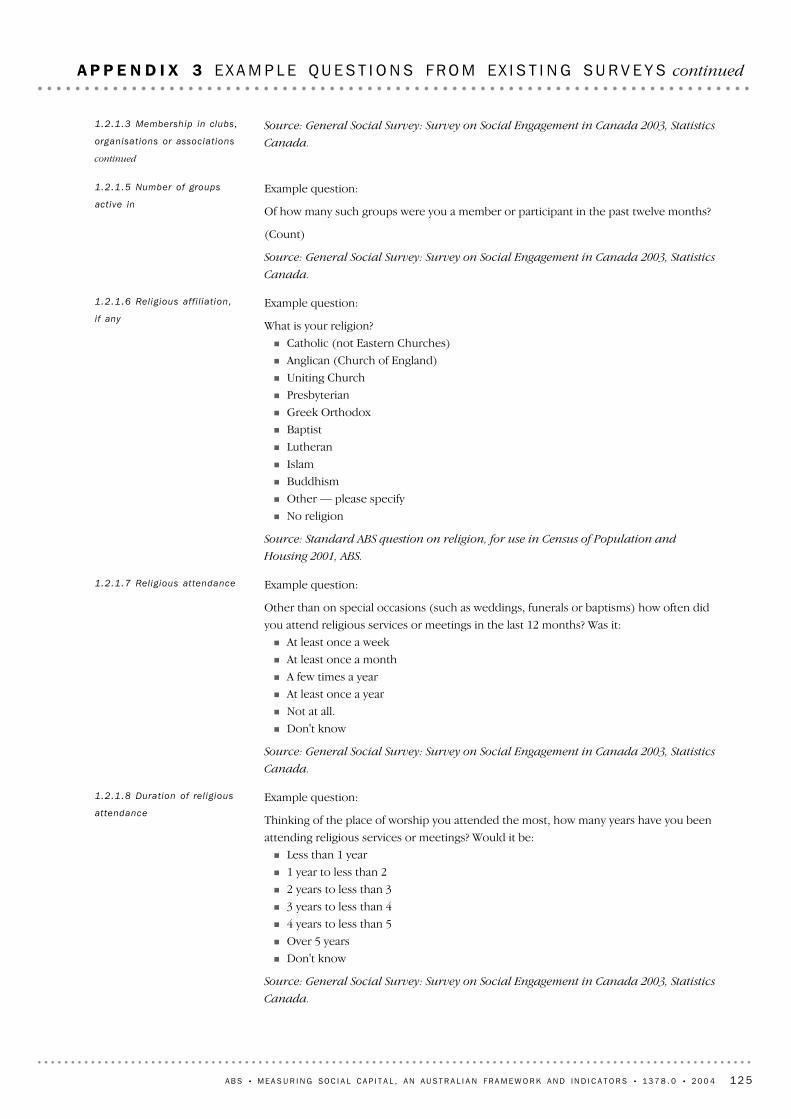
Example question:
Thinking of the place of worship you attended the most, how many years have you been
attending religious services or meetings? Would it be:
! Less than 1 year
! 1 year to less than 2
! 2 years to less than 3
! 3 years to less than 4
! 4 years to less than 5
! Over 5 years
! Don't know
Source: General Social Survey: Survey on Social Engagement in Canada 2003, Statistics
Canada.
1.2.1.8 Durat ion of rel ig ious
attendance
Example question:
Other than on special occasions (such as weddings, funerals or baptisms) how often did
you attend religious services or meetings in the last 12 months? Was it:
! At least once a week
! At least once a month
! A few times a year
! At least once a year
! Not at all.
! Don't know
Source: General Social Survey: Survey on Social Engagement in Canada 2003, Statistics
Canada.
1.2.1.7 Rel igious attendance
Example question:
What is your religion?
! Catholic (not Eastern Churches)
! Anglican (Church of England)
! Uniting Church
! Presbyterian
! Greek Orthodox
! Baptist
! Lutheran
! Islam
! Buddhism
! Other — please specify
! No religion
Source: Standard ABS question on religion, for use in Census of Population and
Housing 2001, ABS.
1.2.1.6 Relig ious aff i l iat ion,
if any
Example question:
Of how many such groups were you a member or participant in the past twelve months?
(Count)
Source: General Social Survey: Survey on Social Engagement in Canada 2003, Statistics
Canada.
1.2.1.5 Number of groups
act ive in
Source: General Social Survey: Survey on Social Engagement in Canada 2003, Statistics
Canada.
1.2.1.3 Membership in clubs,
organisat ions or associat ions
continued
A B S • ME A S U R I N G SO C I A L CA P I T A L , A N A U S T R A L I A N FR A M E W O R K A N D I N D I C A T O R S • 1 3 7 8 . 0 • 2 0 0 4 12 5
A P P E N D I X 3 EX A M P L E QU E S T I O N S FR O M EX I S T I N G SU R V E Y S continued
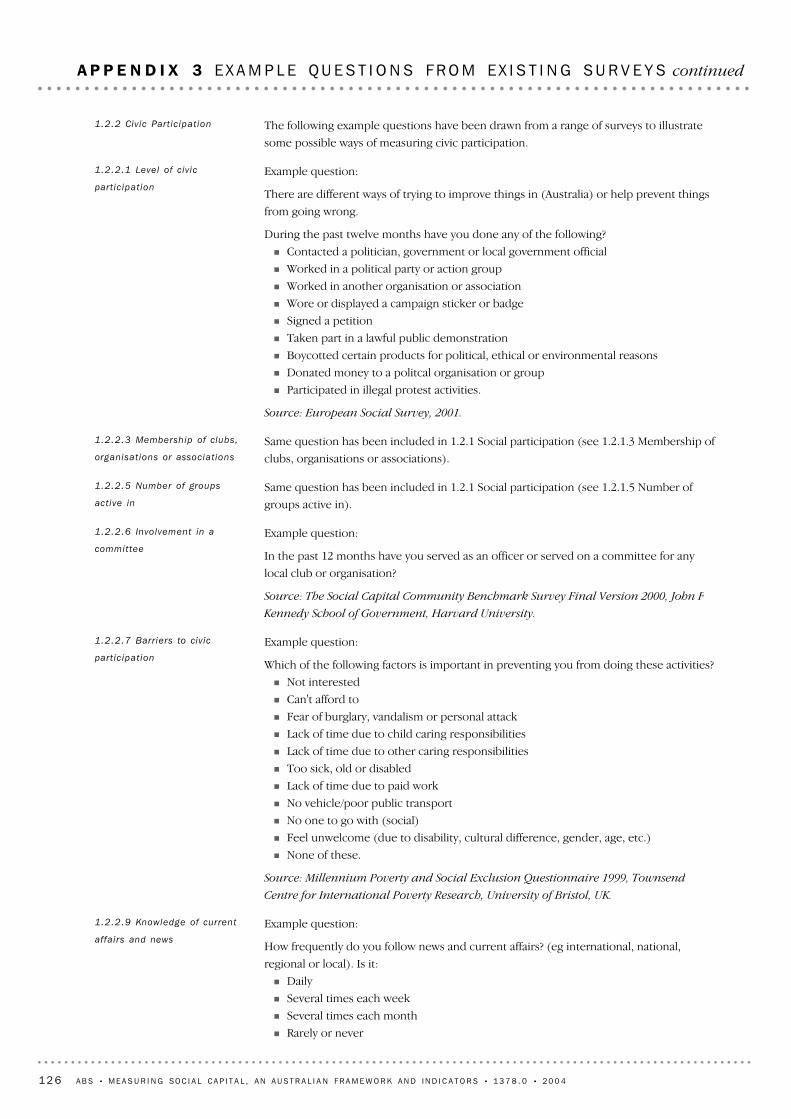
Example question:
How frequently do you follow news and current affairs? (eg international, national,
regional or local). Is it:
! Daily
! Several times each week
! Several times each month
! Rarely or never
1.2.2.9 Knowledge of current
affairs and news
Example question:
Which of the following factors is important in preventing you from doing these activities?
! Not interested
! Can't afford to
! Fear of burglary, vandalism or personal attack
! Lack of time due to child caring responsibilities
! Lack of time due to other caring responsibilities
! Too sick, old or disabled
! Lack of time due to paid work
! No vehicle/poor public transport
! No one to go with (social)
! Feel unwelcome (due to disability, cultural difference, gender, age, etc.)
! None of these.
Source: Millennium Poverty and Social Exclusion Questionnaire 1999, Townsend
Centre for International Poverty Research, University of Bristol, UK.
1.2.2.7 Barr iers to civ ic
part ic ipat ion
Example question:
In the past 12 months have you served as an officer or served on a committee for any
local club or organisation?
Source: The Social Capital Community Benchmark Survey Final Version 2000, John F
Kennedy School of Government, Harvard University.
1.2.2.6 Involvement in a
committee
Same question has been included in 1.2.1 Social participation (see 1.2.1.5 Number of
groups active in).
1.2.2.5 Number of groups
act ive in
Same question has been included in 1.2.1 Social participation (see 1.2.1.3 Membership of
clubs, organisations or associations).
1.2.2.3 Membership of clubs,
organisat ions or associat ions
Example question:
There are different ways of trying to improve things in (Australia) or help prevent things
from going wrong.
During the past twelve months have you done any of the following?
! Contacted a politician, government or local government official
! Worked in a political party or action group
! Worked in another organisation or association
! Wore or displayed a campaign sticker or badge
! Signed a petition
! Taken part in a lawful public demonstration
! Boycotted certain products for political, ethical or environmental reasons
! Donated money to a politcal organisation or group
! Participated in illegal protest activities.
Source: European Social Survey, 2001.
1.2.2.1 Level of civ ic
part ic ipat ion
The following example questions have been drawn from a range of surveys to illustrate
some possible ways of measuring civic participation.
1.2.2 Civ ic Part ic ipat ion
12 6 A B S • ME A S U R I N G SO C I A L CA P I T A L , A N A U S T R A L I A N FR A M E W O R K A N D I N D I C A T O R S • 1 3 7 8 . 0 • 2 0 0 4
A P P E N D I X 3 EX A M P L E QU E S T I O N S FR O M EX I S T I N G SU R V E Y S continued
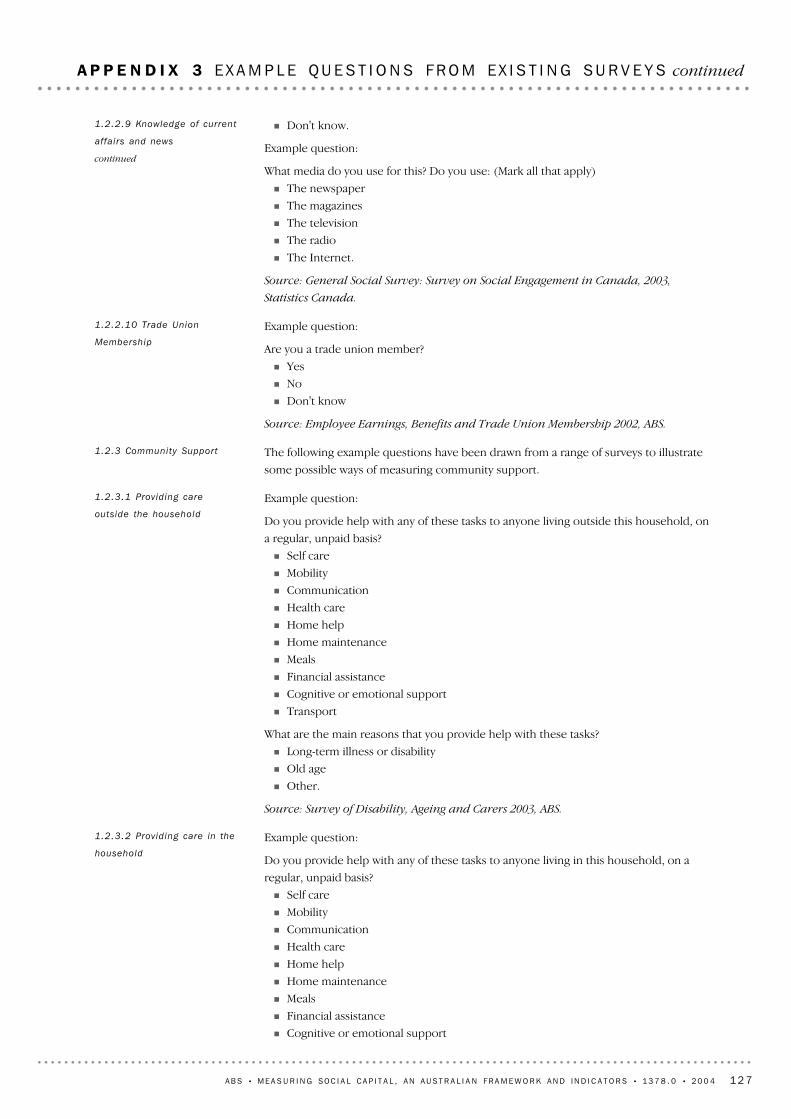
Example question:
Do you provide help with any of these tasks to anyone living in this household, on a
regular, unpaid basis?
! Self care
! Mobility
! Communication
! Health care
! Home help
! Home maintenance
! Meals
! Financial assistance
! Cognitive or emotional support
1.2.3.2 Providing care in the
household
Example question:
Do you provide help with any of these tasks to anyone living outside this household, on
a regular, unpaid basis?
! Self care
! Mobility
! Communication
! Health care
! Home help
! Home maintenance
! Meals
! Financial assistance
! Cognitive or emotional support
! Transport
What are the main reasons that you provide help with these tasks?
! Long-term illness or disability
! Old age
! Other.
Source: Survey of Disability, Ageing and Carers 2003, ABS.
1.2.3.1 Providing care
outside the household
The following example questions have been drawn from a range of surveys to illustrate
some possible ways of measuring community support.
1.2.3 Community Support
Example question:
Are you a trade union member?
! Yes
! No
! Don't know
Source: Employee Earnings, Benefits and Trade Union Membership 2002, ABS.
1.2.2.10 Trade Union
Membership
! Don't know.
Example question:
What media do you use for this? Do you use: (Mark all that apply)
! The newspaper
! The magazines
! The television
! The radio
! The Internet.
Source: General Social Survey: Survey on Social Engagement in Canada, 2003,
Statistics Canada.
1.2.2.9 Knowledge of current
affairs and news
continued
A B S • ME A S U R I N G SO C I A L CA P I T A L , A N A U S T R A L I A N FR A M E W O R K A N D I N D I C A T O R S • 1 3 7 8 . 0 • 2 0 0 4 12 7
A P P E N D I X 3 EX A M P L E QU E S T I O N S FR O M EX I S T I N G SU R V E Y S continued
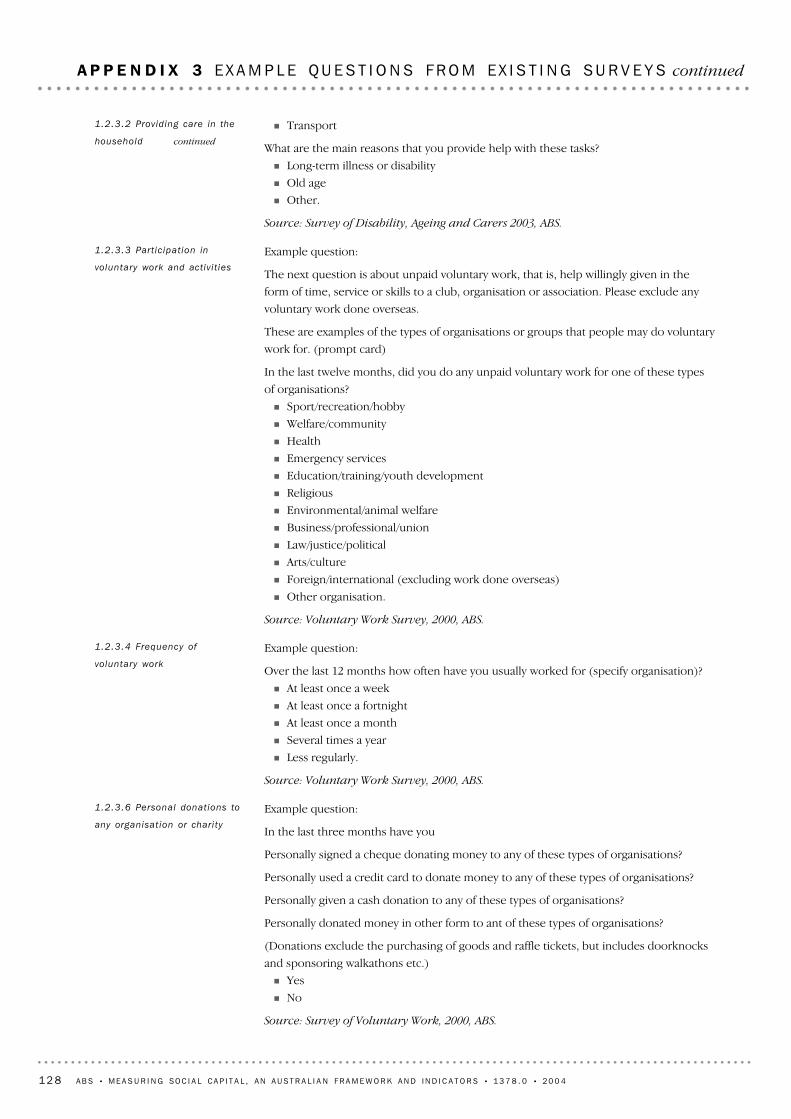
Example question:
In the last three months have you
Personally signed a cheque donating money to any of these types of organisations?
Personally used a credit card to donate money to any of these types of organisations?
Personally given a cash donation to any of these types of organisations?
Personally donated money in other form to ant of these types of organisations?
(Donations exclude the purchasing of goods and raffle tickets, but includes doorknocks
and sponsoring walkathons etc.)
! Yes
! No
Source: Survey of Voluntary Work, 2000, ABS.
1.2.3.6 Personal donations to
any organisat ion or char i ty
Example question:
Over the last 12 months how often have you usually worked for (specify organisation)?
! At least once a week
! At least once a fortnight
! At least once a month
! Several times a year
! Less regularly.
Source: Voluntary Work Survey, 2000, ABS.
1.2.3.4 Frequency of
voluntary work
Example question:
The next question is about unpaid voluntary work, that is, help willingly given in the
form of time, service or skills to a club, organisation or association. Please exclude any
voluntary work done overseas.
These are examples of the types of organisations or groups that people may do voluntary
work for. (prompt card)
In the last twelve months, did you do any unpaid voluntary work for one of these types
of organisations?
! Sport/recreation/hobby
! Welfare/community
! Health
! Emergency services
! Education/training/youth development
! Religious
! Environmental/animal welfare
! Business/professional/union
! Law/justice/political
! Arts/culture
! Foreign/international (excluding work done overseas)
! Other organisation.
Source: Voluntary Work Survey, 2000, ABS.
1.2.3.3 Part ic ipat ion in
voluntary work and activ i t ies
! Transport
What are the main reasons that you provide help with these tasks?
! Long-term illness or disability
! Old age
! Other.
Source: Survey of Disability, Ageing and Carers 2003, ABS.
1.2.3.2 Providing care in the
household continued
12 8 A B S • ME A S U R I N G SO C I A L CA P I T A L , A N A U S T R A L I A N FR A M E W O R K A N D I N D I C A T O R S • 1 3 7 8 . 0 • 2 0 0 4
A P P E N D I X 3 EX A M P L E QU E S T I O N S FR O M EX I S T I N G SU R V E Y S continued
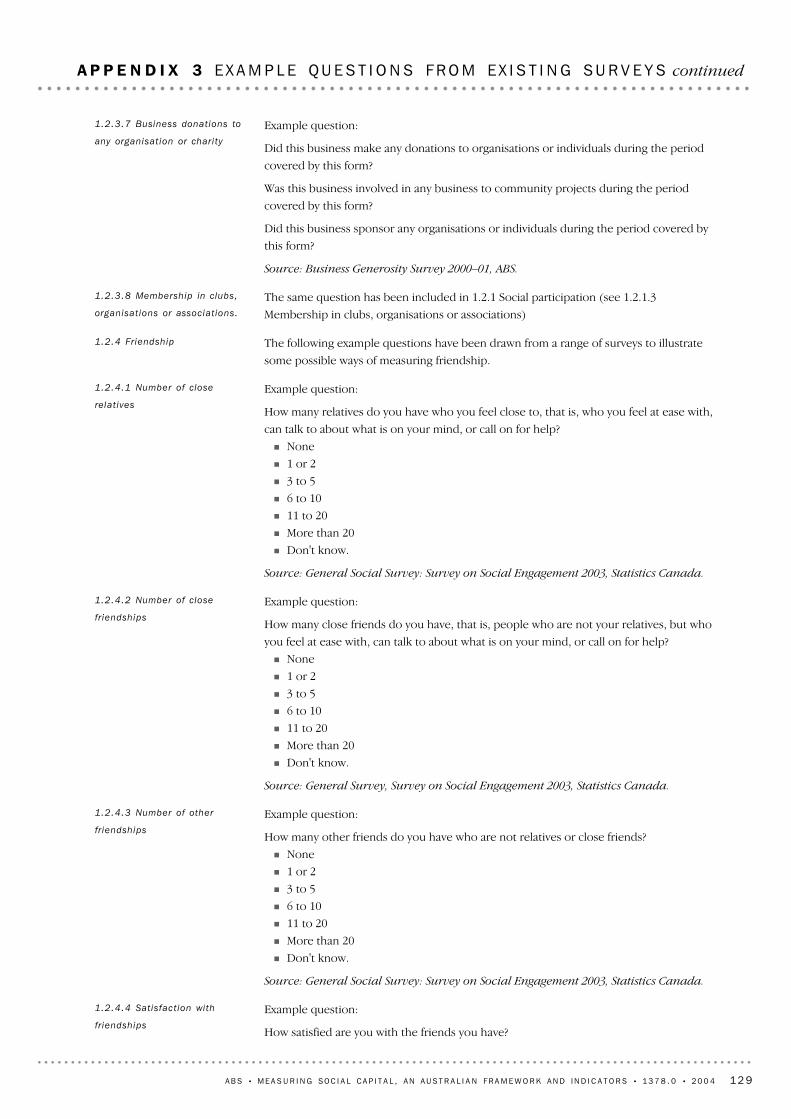
Example question:
How satisfied are you with the friends you have?
1.2.4.4 Satisfact ion with
fr iendships
Example question:
How many other friends do you have who are not relatives or close friends?
! None
! 1 or 2
! 3 to 5
! 6 to 10
! 11 to 20
! More than 20
! Don't know.
Source: General Social Survey: Survey on Social Engagement 2003, Statistics Canada.
1.2.4.3 Number of other
fr iendships
Example question:
How many close friends do you have, that is, people who are not your relatives, but who
you feel at ease with, can talk to about what is on your mind, or call on for help?
! None
! 1 or 2
! 3 to 5
! 6 to 10
! 11 to 20
! More than 20
! Don't know.
Source: General Survey, Survey on Social Engagement 2003, Statistics Canada.
1.2.4.2 Number of close
fr iendships
Example question:
How many relatives do you have who you feel close to, that is, who you feel at ease with,
can talk to about what is on your mind, or call on for help?
! None
! 1 or 2
! 3 to 5
! 6 to 10
! 11 to 20
! More than 20
! Don't know.
Source: General Social Survey: Survey on Social Engagement 2003, Statistics Canada.
1.2.4.1 Number of close
relat ives
The following example questions have been drawn from a range of surveys to illustrate
some possible ways of measuring friendship.
1.2.4 Friendship
The same question has been included in 1.2.1 Social participation (see 1.2.1.3
Membership in clubs, organisations or associations)
1.2.3.8 Membership in clubs,
organisat ions or associat ions.
Example question:
Did this business make any donations to organisations or individuals during the period
covered by this form?
Was this business involved in any business to community projects during the period
covered by this form?
Did this business sponsor any organisations or individuals during the period covered by
this form?
Source: Business Generosity Survey 2000–01, ABS.
1.2.3.7 Business donations to
any organisat ion or char i ty
A B S • ME A S U R I N G SO C I A L CA P I T A L , A N A U S T R A L I A N FR A M E W O R K A N D I N D I C A T O R S • 1 3 7 8 . 0 • 2 0 0 4 12 9
A P P E N D I X 3 EX A M P L E QU E S T I O N S FR O M EX I S T I N G SU R V E Y S continued
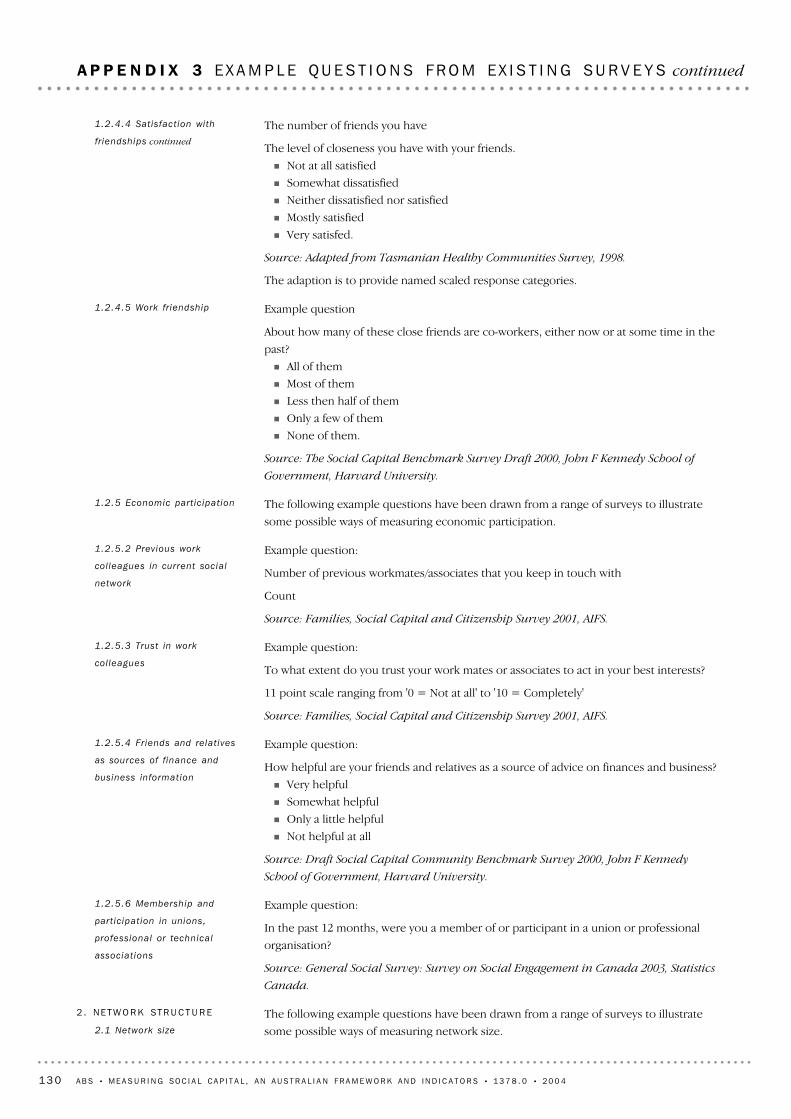
The following example questions have been drawn from a range of surveys to illustrate
some possible ways of measuring network size.
2 . NE T W O R K ST R U C T U R E
2.1 Network size
Example question:
In the past 12 months, were you a member of or participant in a union or professional
organisation?
Source: General Social Survey: Survey on Social Engagement in Canada 2003, Statistics
Canada.
1.2.5.6 Membership and
part ic ipat ion in unions,
professional or technical
associat ions
Example question:
How helpful are your friends and relatives as a source of advice on finances and business?
! Very helpful
! Somewhat helpful
! Only a little helpful
! Not helpful at all
Source: Draft Social Capital Community Benchmark Survey 2000, John F Kennedy
School of Government, Harvard University.
1.2.5.4 Friends and relat ives
as sources of finance and
business information
Example question:
To what extent do you trust your work mates or associates to act in your best interests?
11 point scale ranging from '0 = Not at all' to '10 = Completely'
Source: Families, Social Capital and Citizenship Survey 2001, AIFS.
1.2.5.3 Trust in work
col leagues
Example question:
Number of previous workmates/associates that you keep in touch with
Count
Source: Families, Social Capital and Citizenship Survey 2001, AIFS.
1.2.5.2 Previous work
col leagues in current social
network
The following example questions have been drawn from a range of surveys to illustrate
some possible ways of measuring economic participation.
1.2.5 Economic part ic ipat ion
Example question
About how many of these close friends are co-workers, either now or at some time in the
past?
! All of them
! Most of them
! Less then half of them
! Only a few of them
! None of them.
Source: The Social Capital Benchmark Survey Draft 2000, John F Kennedy School of
Government, Harvard University.
1.2.4.5 Work fr iendship
The number of friends you have
The level of closeness you have with your friends.
! Not at all satisfied
! Somewhat dissatisfied
! Neither dissatisfied nor satisfied
! Mostly satisfied
! Very satisfed.
Source: Adapted from Tasmanian Healthy Communities Survey, 1998.
The adaption is to provide named scaled response categories.
1.2.4.4 Satisfact ion with
fr iendships continued
13 0 A B S • ME A S U R I N G SO C I A L CA P I T A L , A N A U S T R A L I A N FR A M E W O R K A N D I N D I C A T O R S • 1 3 7 8 . 0 • 2 0 0 4
A P P E N D I X 3 EX A M P L E QU E S T I O N S FR O M EX I S T I N G SU R V E Y S continued
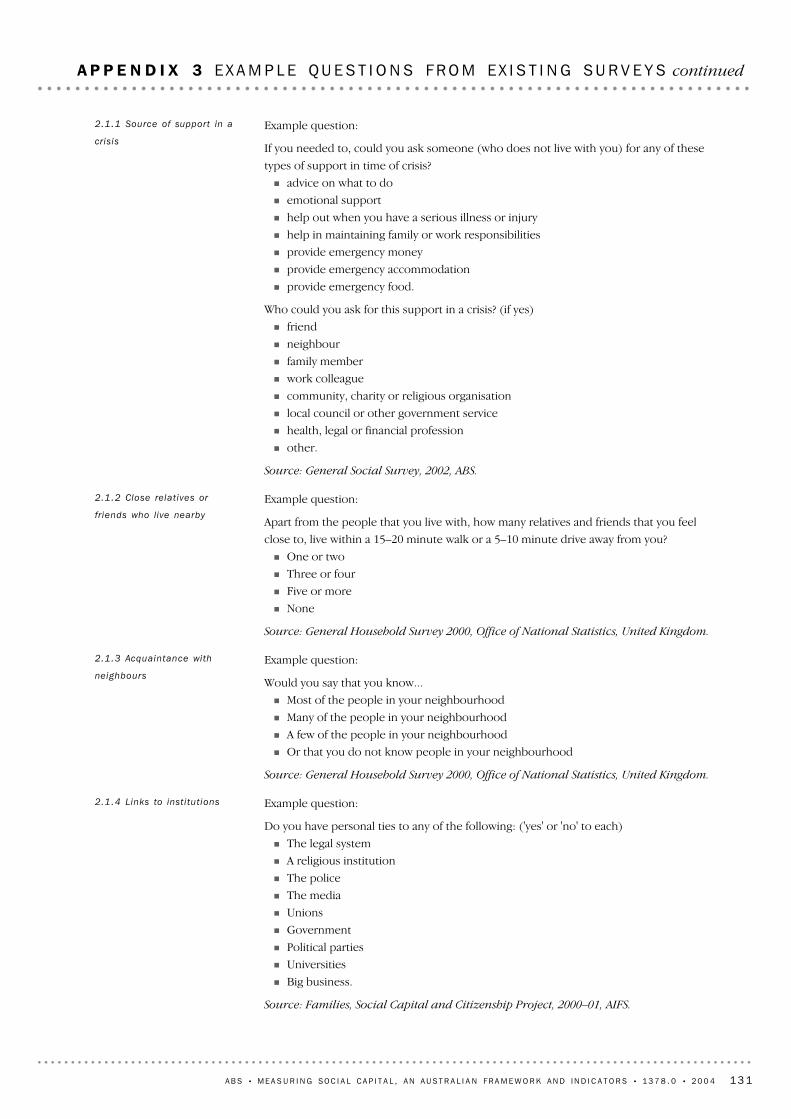
Example question:
Do you have personal ties to any of the following: ('yes' or 'no' to each)
! The legal system
! A religious institution
! The police
! The media
! Unions
! Government
! Political parties
! Universities
! Big business.
Source: Families, Social Capital and Citizenship Project, 2000–01, AIFS.
2.1.4 Links to inst i tut ions
Example question:
Would you say that you know...
! Most of the people in your neighbourhood
! Many of the people in your neighbourhood
! A few of the people in your neighbourhood
! Or that you do not know people in your neighbourhood
Source: General Household Survey 2000, Office of National Statistics, United Kingdom.
2.1.3 Acquaintance with
neighbours
Example question:
Apart from the people that you live with, how many relatives and friends that you feel
close to, live within a 15–20 minute walk or a 5–10 minute drive away from you?
! One or two
! Three or four
! Five or more
! None
Source: General Household Survey 2000, Office of National Statistics, United Kingdom.
2.1.2 Close relat ives or
fr iends who live nearby
Example question:
If you needed to, could you ask someone (who does not live with you) for any of these
types of support in time of crisis?
! advice on what to do
! emotional support
! help out when you have a serious illness or injury
! help in maintaining family or work responsibilities
! provide emergency money
! provide emergency accommodation
! provide emergency food.
Who could you ask for this support in a crisis? (if yes)
! friend
! neighbour
! family member
! work colleague
! community, charity or religious organisation
! local council or other government service
! health, legal or financial profession
! other.
Source: General Social Survey, 2002, ABS.
2.1.1 Source of support in a
cris is
A B S • ME A S U R I N G SO C I A L CA P I T A L , A N A U S T R A L I A N FR A M E W O R K A N D I N D I C A T O R S • 1 3 7 8 . 0 • 2 0 0 4 13 1
A P P E N D I X 3 EX A M P L E QU E S T I O N S FR O M EX I S T I N G SU R V E Y S continued
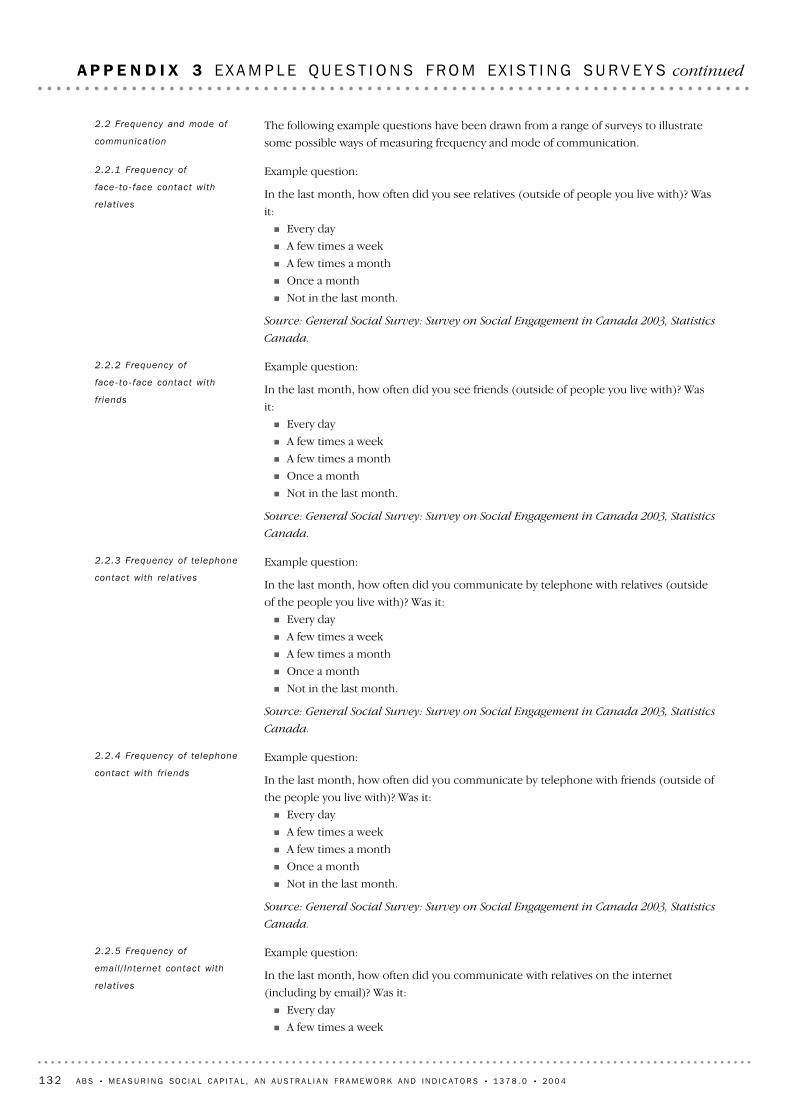
Example question:
In the last month, how often did you communicate with relatives on the internet
(including by email)? Was it:
! Every day
! A few times a week
2.2.5 Frequency of
email / Internet contact with
relat ives
Example question:
In the last month, how often did you communicate by telephone with friends (outside of
the people you live with)? Was it:
! Every day
! A few times a week
! A few times a month
! Once a month
! Not in the last month.
Source: General Social Survey: Survey on Social Engagement in Canada 2003, Statistics
Canada.
2.2.4 Frequency of telephone
contact with fr iends
Example question:
In the last month, how often did you communicate by telephone with relatives (outside
of the people you live with)? Was it:
! Every day
! A few times a week
! A few times a month
! Once a month
! Not in the last month.
Source: General Social Survey: Survey on Social Engagement in Canada 2003, Statistics
Canada.
2.2.3 Frequency of telephone
contact with relat ives
Example question:
In the last month, how often did you see friends (outside of people you live with)? Was
it:
! Every day
! A few times a week
! A few times a month
! Once a month
! Not in the last month.
Source: General Social Survey: Survey on Social Engagement in Canada 2003, Statistics
Canada.
2.2.2 Frequency of
face-to-face contact with
fr iends
Example question:
In the last month, how often did you see relatives (outside of people you live with)? Was
it:
! Every day
! A few times a week
! A few times a month
! Once a month
! Not in the last month.
Source: General Social Survey: Survey on Social Engagement in Canada 2003, Statistics
Canada.
2.2.1 Frequency of
face-to-face contact with
relat ives
The following example questions have been drawn from a range of surveys to illustrate
some possible ways of measuring frequency and mode of communication.
2.2 Frequency and mode of
communicat ion
13 2 A B S • ME A S U R I N G SO C I A L CA P I T A L , A N A U S T R A L I A N FR A M E W O R K A N D I N D I C A T O R S • 1 3 7 8 . 0 • 2 0 0 4
A P P E N D I X 3 EX A M P L E QU E S T I O N S FR O M EX I S T I N G SU R V E Y S continued
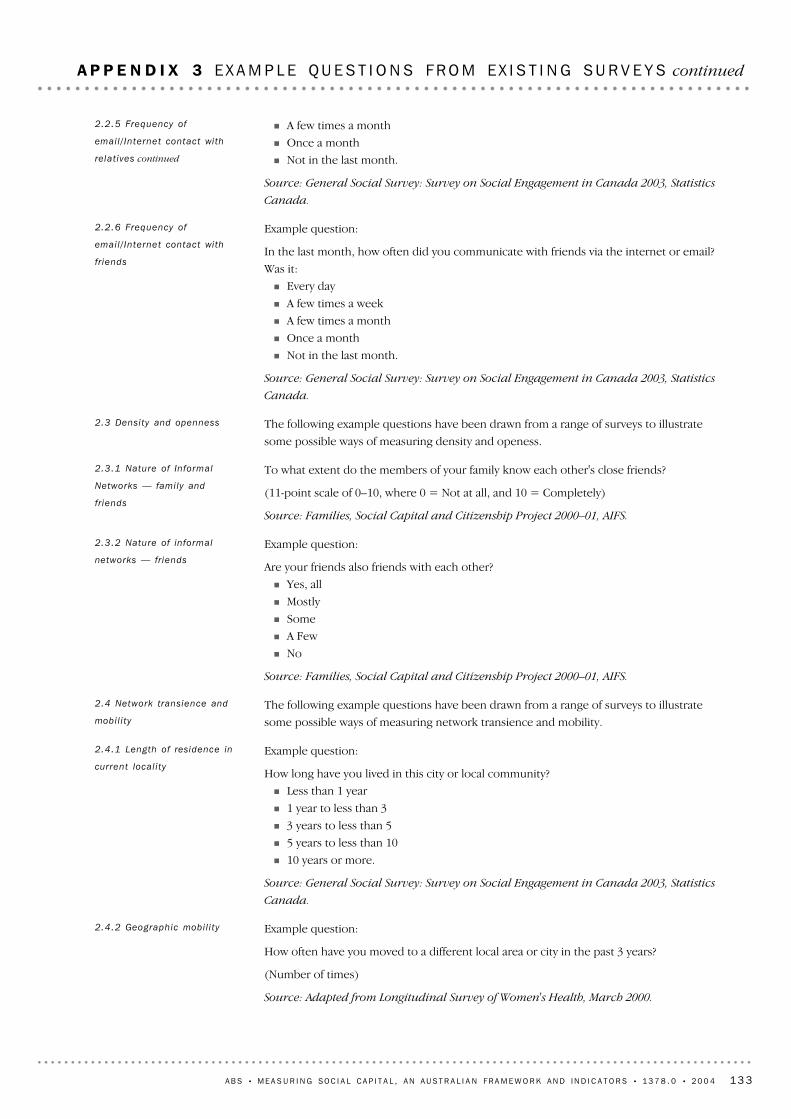
Example question:
How often have you moved to a different local area or city in the past 3 years?
(Number of times)
Source: Adapted from Longitudinal Survey of Women's Health, March 2000.
2.4.2 Geographic mobi l i ty
Example question:
How long have you lived in this city or local community?
! Less than 1 year
! 1 year to less than 3
! 3 years to less than 5
! 5 years to less than 10
! 10 years or more.
Source: General Social Survey: Survey on Social Engagement in Canada 2003, Statistics
Canada.
2.4.1 Length of residence in
current local i ty
The following example questions have been drawn from a range of surveys to illustrate
some possible ways of measuring network transience and mobility.
2.4 Network transience and
mobi l i ty
Example question:
Are your friends also friends with each other?
! Yes, all
! Mostly
! Some
! A Few
! No
Source: Families, Social Capital and Citizenship Project 2000–01, AIFS.
2.3.2 Nature of informal
networks — fr iends
To what extent do the members of your family know each other's close friends?
(11-point scale of 0–10, where 0 = Not at all, and 10 = Completely)
Source: Families, Social Capital and Citizenship Project 2000–01, AIFS.
2.3.1 Nature of Informal
Networks — family and
fr iends
The following example questions have been drawn from a range of surveys to illustrate
some possible ways of measuring density and openess.
2.3 Density and openness
Example question:
In the last month, how often did you communicate with friends via the internet or email?
Was it:
! Every day
! A few times a week
! A few times a month
! Once a month
! Not in the last month.
Source: General Social Survey: Survey on Social Engagement in Canada 2003, Statistics
Canada.
2.2.6 Frequency of
email / Internet contact with
fr iends
! A few times a month
! Once a month
! Not in the last month.
Source: General Social Survey: Survey on Social Engagement in Canada 2003, Statistics
Canada.
2.2.5 Frequency of
email / Internet contact with
relat ives continued
A B S • ME A S U R I N G SO C I A L CA P I T A L , A N A U S T R A L I A N FR A M E W O R K A N D I N D I C A T O R S • 1 3 7 8 . 0 • 2 0 0 4 13 3
A P P E N D I X 3 EX A M P L E QU E S T I O N S FR O M EX I S T I N G SU R V E Y S continued
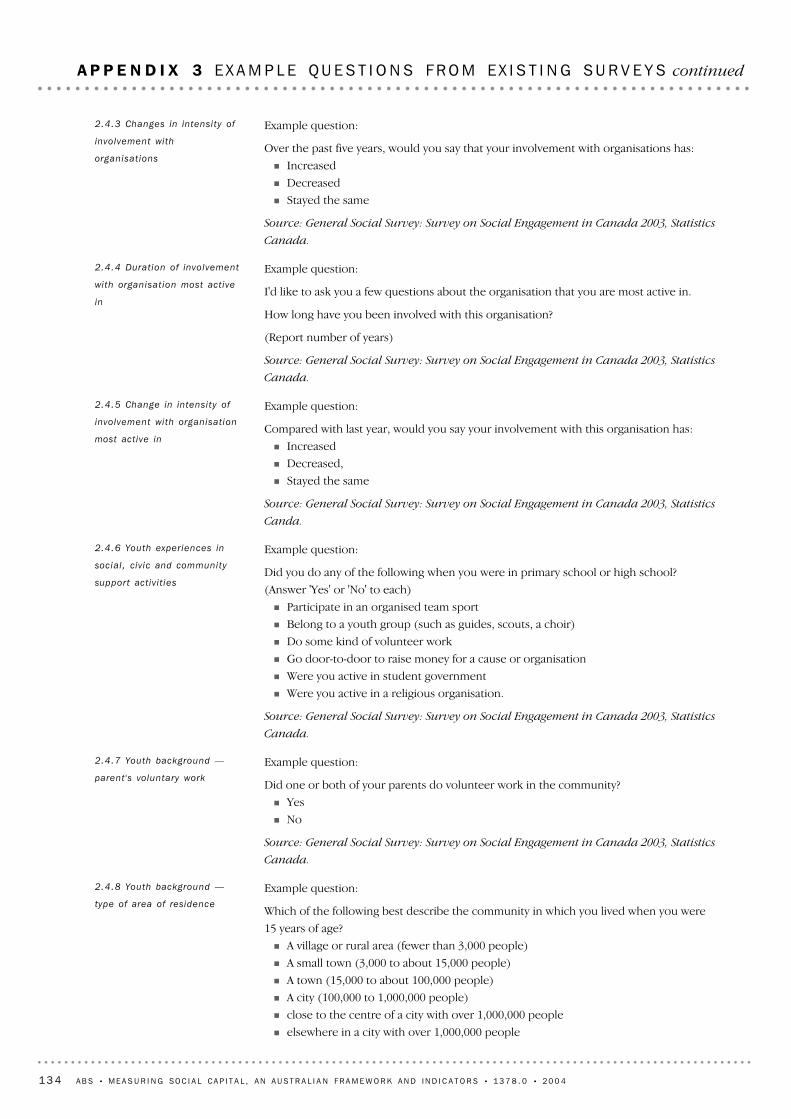
Example question:
Which of the following best describe the community in which you lived when you were
15 years of age?
! A village or rural area (fewer than 3,000 people)
! A small town (3,000 to about 15,000 people)
! A town (15,000 to about 100,000 people)
! A city (100,000 to 1,000,000 people)
! close to the centre of a city with over 1,000,000 people
! elsewhere in a city with over 1,000,000 people
2.4.8 Youth background —
type of area of residence
Example question:
Did one or both of your parents do volunteer work in the community?
! Yes
! No
Source: General Social Survey: Survey on Social Engagement in Canada 2003, Statistics
Canada.
2.4.7 Youth background —
parent 's voluntary work
Example question:
Did you do any of the following when you were in primary school or high school?
(Answer 'Yes' or 'No' to each)
! Participate in an organised team sport
! Belong to a youth group (such as guides, scouts, a choir)
! Do some kind of volunteer work
! Go door-to-door to raise money for a cause or organisation
! Were you active in student government
! Were you active in a religious organisation.
Source: General Social Survey: Survey on Social Engagement in Canada 2003, Statistics
Canada.
2.4.6 Youth exper iences in
social , civic and community
support activ i t ies
Example question:
Compared with last year, would you say your involvement with this organisation has:
! Increased
! Decreased,
! Stayed the same
Source: General Social Survey: Survey on Social Engagement in Canada 2003, Statistics
Canda.
2.4.5 Change in intensity of
involvement with organisat ion
most active in
Example question:
I'd like to ask you a few questions about the organisation that you are most active in.
How long have you been involved with this organisation?
(Report number of years)
Source: General Social Survey: Survey on Social Engagement in Canada 2003, Statistics
Canada.
2.4.4 Durat ion of involvement
with organisat ion most active
in
Example question:
Over the past five years, would you say that your involvement with organisations has:
! Increased
! Decreased
! Stayed the same
Source: General Social Survey: Survey on Social Engagement in Canada 2003, Statistics
Canada.
2.4.3 Changes in intensity of
involvement with
organisat ions
13 4 A B S • ME A S U R I N G SO C I A L CA P I T A L , A N A U S T R A L I A N FR A M E W O R K A N D I N D I C A T O R S • 1 3 7 8 . 0 • 2 0 0 4
A P P E N D I X 3 EX A M P L E QU E S T I O N S FR O M EX I S T I N G SU R V E Y S continued
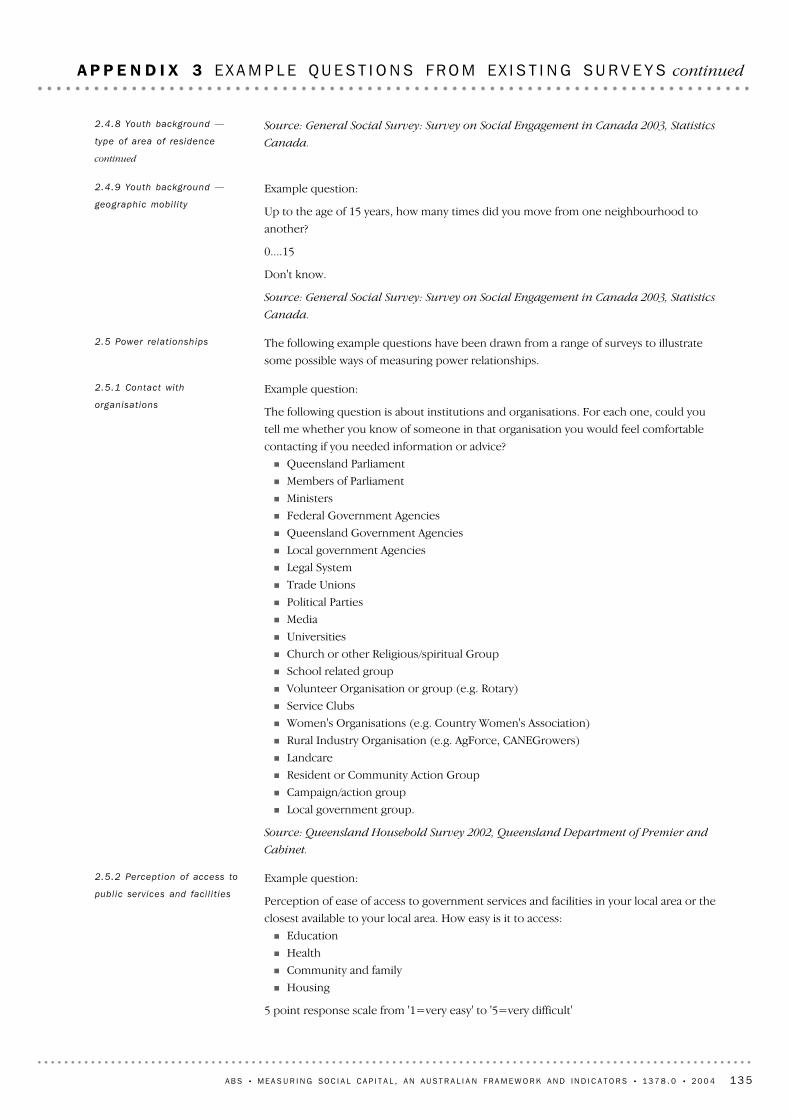
Example question:
Perception of ease of access to government services and facilities in your local area or the
closest available to your local area. How easy is it to access:
! Education
! Health
! Community and family
! Housing
5 point response scale from '1=very easy' to '5=very difficult'
2.5.2 Percept ion of access to
publ ic serv ices and faci l i t ies
Example question:
The following question is about institutions and organisations. For each one, could you
tell me whether you know of someone in that organisation you would feel comfortable
contacting if you needed information or advice?
! Queensland Parliament
! Members of Parliament
! Ministers
! Federal Government Agencies
! Queensland Government Agencies
! Local government Agencies
! Legal System
! Trade Unions
! Political Parties
! Media
! Universities
! Church or other Religious/spiritual Group
! School related group
! Volunteer Organisation or group (e.g. Rotary)
! Service Clubs
! Women's Organisations (e.g. Country Women's Association)
! Rural Industry Organisation (e.g. AgForce, CANEGrowers)
! Landcare
! Resident or Community Action Group
! Campaign/action group
! Local government group.
Source: Queensland Household Survey 2002, Queensland Department of Premier and
Cabinet.
2.5.1 Contact with
organisat ions
The following example questions have been drawn from a range of surveys to illustrate
some possible ways of measuring power relationships.
2.5 Power relat ionships
Example question:
Up to the age of 15 years, how many times did you move from one neighbourhood to
another?
0....15
Don't know.
Source: General Social Survey: Survey on Social Engagement in Canada 2003, Statistics
Canada.
2.4.9 Youth background —
geographic mobi l i ty
Source: General Social Survey: Survey on Social Engagement in Canada 2003, Statistics
Canada.
2.4.8 Youth background —
type of area of residence
continued
A B S • ME A S U R I N G SO C I A L CA P I T A L , A N A U S T R A L I A N FR A M E W O R K A N D I N D I C A T O R S • 1 3 7 8 . 0 • 2 0 0 4 13 5
A P P E N D I X 3 EX A M P L E QU E S T I O N S FR O M EX I S T I N G SU R V E Y S continued
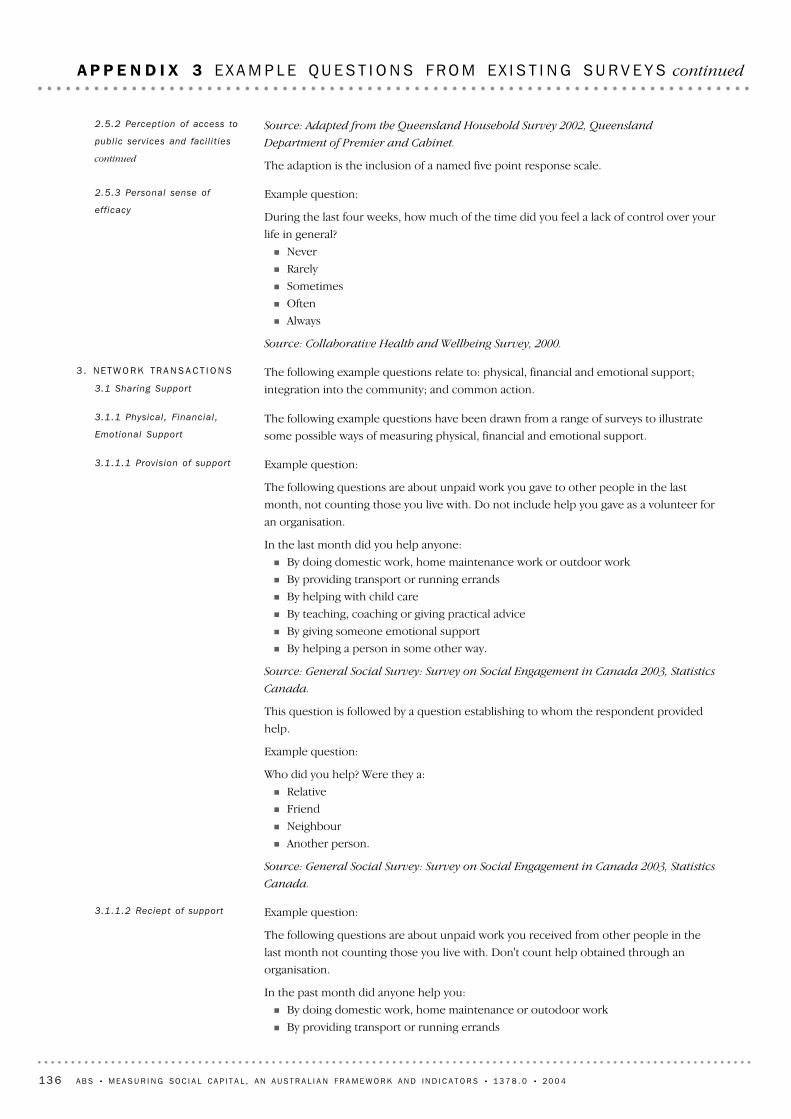
Example question:
The following questions are about unpaid work you received from other people in the
last month not counting those you live with. Don't count help obtained through an
organisation.
In the past month did anyone help you:
! By doing domestic work, home maintenance or outodoor work
! By providing transport or running errands
3.1.1.2 Reciept of support
Example question:
The following questions are about unpaid work you gave to other people in the last
month, not counting those you live with. Do not include help you gave as a volunteer for
an organisation.
In the last month did you help anyone:
! By doing domestic work, home maintenance work or outdoor work
! By providing transport or running errands
! By helping with child care
! By teaching, coaching or giving practical advice
! By giving someone emotional support
! By helping a person in some other way.
Source: General Social Survey: Survey on Social Engagement in Canada 2003, Statistics
Canada.
This question is followed by a question establishing to whom the respondent provided
help.
Example question:
Who did you help? Were they a:
! Relative
! Friend
! Neighbour
! Another person.
Source: General Social Survey: Survey on Social Engagement in Canada 2003, Statistics
Canada.
3.1.1.1 Provis ion of support
The following example questions have been drawn from a range of surveys to illustrate
some possible ways of measuring physical, financial and emotional support.
3.1.1 Physical, Financial,
Emotional Support
The following example questions relate to: physical, financial and emotional support;
integration into the community; and common action.
3 . NE T W O R K TR A N S A C T I O N S
3.1 Sharing Support
Example question:
During the last four weeks, how much of the time did you feel a lack of control over your
life in general?
! Never
! Rarely
! Sometimes
! Often
! Always
Source: Collaborative Health and Wellbeing Survey, 2000.
2.5.3 Personal sense of
eff icacy
Source: Adapted from the Queensland Household Survey 2002, Queensland
Department of Premier and Cabinet.
The adaption is the inclusion of a named five point response scale.
2.5.2 Percept ion of access to
publ ic serv ices and faci l i t ies
continued
13 6 A B S • ME A S U R I N G SO C I A L CA P I T A L , A N A U S T R A L I A N FR A M E W O R K A N D I N D I C A T O R S • 1 3 7 8 . 0 • 2 0 0 4
A P P E N D I X 3 EX A M P L E QU E S T I O N S FR O M EX I S T I N G SU R V E Y S continued
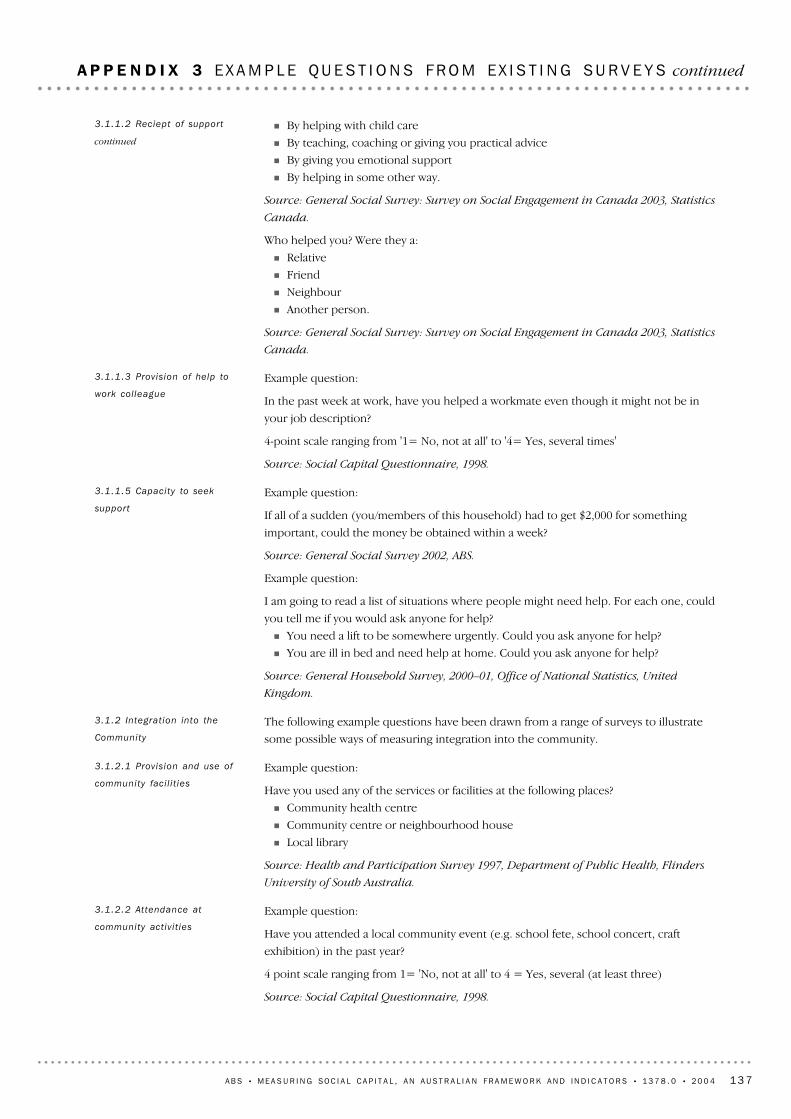
Example question:
Have you attended a local community event (e.g. school fete, school concert, craft
exhibition) in the past year?
4 point scale ranging from 1= 'No, not at all' to 4 = Yes, several (at least three)
Source: Social Capital Questionnaire, 1998.
3.1.2.2 Attendance at
community act iv i t ies
Example question:
Have you used any of the services or facilities at the following places?
! Community health centre
! Community centre or neighbourhood house
! Local library
Source: Health and Participation Survey 1997, Department of Public Health, Flinders
University of South Australia.
3.1.2.1 Provis ion and use of
community faci l i t ies
The following example questions have been drawn from a range of surveys to illustrate
some possible ways of measuring integration into the community.
3.1.2 Integrat ion into the
Community
Example question:
If all of a sudden (you/members of this household) had to get $2,000 for something
important, could the money be obtained within a week?
Source: General Social Survey 2002, ABS.
Example question:
I am going to read a list of situations where people might need help. For each one, could
you tell me if you would ask anyone for help?
! You need a lift to be somewhere urgently. Could you ask anyone for help?
! You are ill in bed and need help at home. Could you ask anyone for help?
Source: General Household Survey, 2000–01, Office of National Statistics, United
Kingdom.
3.1.1.5 Capacity to seek
support
Example question:
In the past week at work, have you helped a workmate even though it might not be in
your job description?
4-point scale ranging from '1= No, not at all' to '4= Yes, several times'
Source: Social Capital Questionnaire, 1998.
3.1.1.3 Provis ion of help to
work col league
! By helping with child care
! By teaching, coaching or giving you practical advice
! By giving you emotional support
! By helping in some other way.
Source: General Social Survey: Survey on Social Engagement in Canada 2003, Statistics
Canada.
Who helped you? Were they a:
! Relative
! Friend
! Neighbour
! Another person.
Source: General Social Survey: Survey on Social Engagement in Canada 2003, Statistics
Canada.
3.1.1.2 Reciept of support
continued
A B S • ME A S U R I N G SO C I A L CA P I T A L , A N A U S T R A L I A N FR A M E W O R K A N D I N D I C A T O R S • 1 3 7 8 . 0 • 2 0 0 4 13 7
A P P E N D I X 3 EX A M P L E QU E S T I O N S FR O M EX I S T I N G SU R V E Y S continued
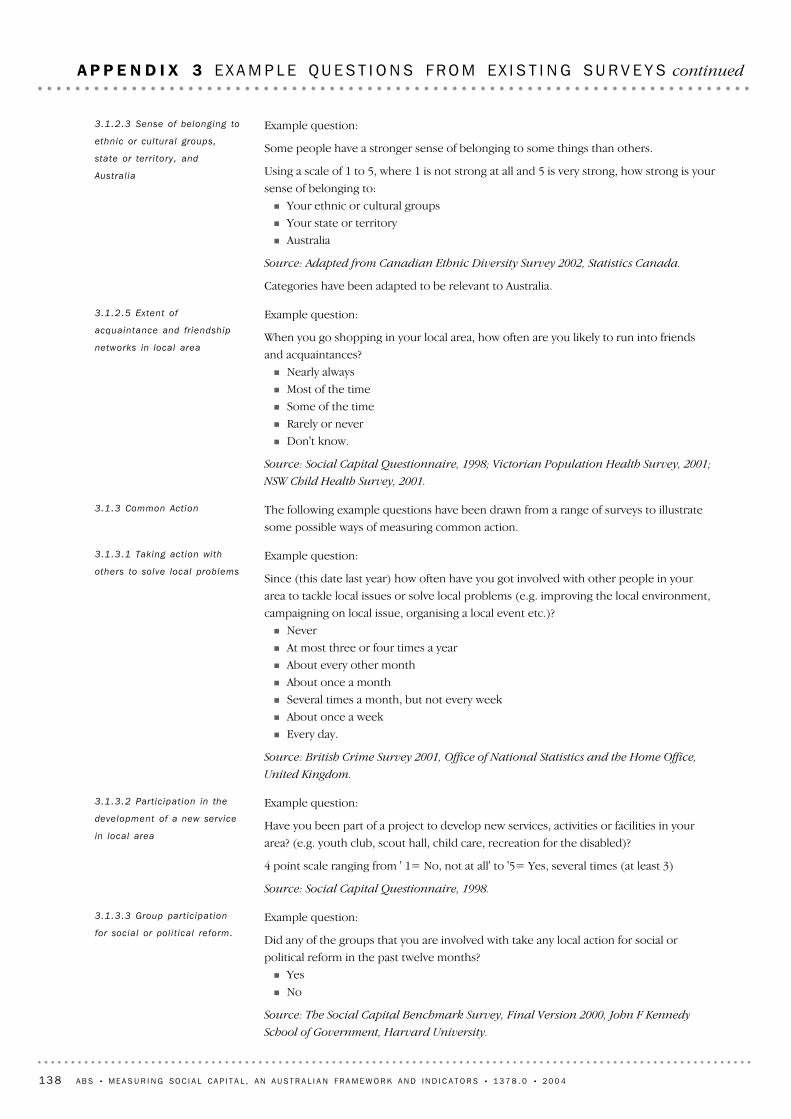
Example question:
Did any of the groups that you are involved with take any local action for social or
political reform in the past twelve months?
! Yes
! No
Source: The Social Capital Benchmark Survey, Final Version 2000, John F Kennedy
School of Government, Harvard University.
3.1.3.3 Group part ic ipat ion
for social or pol i t ical reform.
Example question:
Have you been part of a project to develop new services, activities or facilities in your
area? (e.g. youth club, scout hall, child care, recreation for the disabled)?
4 point scale ranging from ' 1= No, not at all' to '5= Yes, several times (at least 3)
Source: Social Capital Questionnaire, 1998.
3.1.3.2 Part ic ipat ion in the
development of a new serv ice
in local area
Example question:
Since (this date last year) how often have you got involved with other people in your
area to tackle local issues or solve local problems (e.g. improving the local environment,
campaigning on local issue, organising a local event etc.)?
! Never
! At most three or four times a year
! About every other month
! About once a month
! Several times a month, but not every week
! About once a week
! Every day.
Source: British Crime Survey 2001, Office of National Statistics and the Home Office,
United Kingdom.
3.1.3.1 Taking act ion with
others to solve local problems
The following example questions have been drawn from a range of surveys to illustrate
some possible ways of measuring common action.
3.1.3 Common Act ion
Example question:
When you go shopping in your local area, how often are you likely to run into friends
and acquaintances?
! Nearly always
! Most of the time
! Some of the time
! Rarely or never
! Don't know.
Source: Social Capital Questionnaire, 1998; Victorian Population Health Survey, 2001;
NSW Child Health Survey, 2001.
3.1.2.5 Extent of
acquaintance and fr iendship
networks in local area
Example question:
Some people have a stronger sense of belonging to some things than others.
Using a scale of 1 to 5, where 1 is not strong at all and 5 is very strong, how strong is your
sense of belonging to:
! Your ethnic or cultural groups
! Your state or territory
! Australia
Source: Adapted from Canadian Ethnic Diversity Survey 2002, Statistics Canada.
Categories have been adapted to be relevant to Australia.
3.1.2.3 Sense of belonging to
ethnic or cultural groups,
state or terr i tory, and
Austral ia
13 8 A B S • ME A S U R I N G SO C I A L CA P I T A L , A N A U S T R A L I A N FR A M E W O R K A N D I N D I C A T O R S • 1 3 7 8 . 0 • 2 0 0 4
A P P E N D I X 3 EX A M P L E QU E S T I O N S FR O M EX I S T I N G SU R V E Y S continued
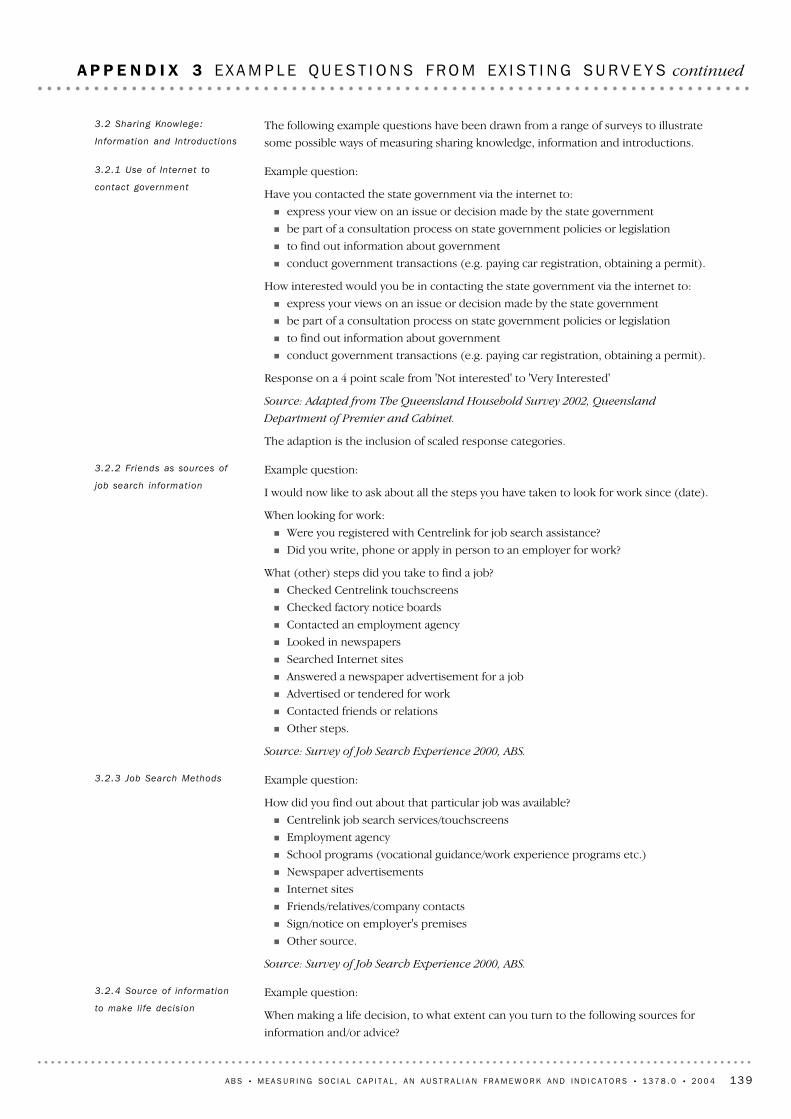
Example question:
When making a life decision, to what extent can you turn to the following sources for
information and/or advice?
3.2.4 Source of informat ion
to make li fe decision
Example question:
How did you find out about that particular job was available?
! Centrelink job search services/touchscreens
! Employment agency
! School programs (vocational guidance/work experience programs etc.)
! Newspaper advertisements
! Internet sites
! Friends/relatives/company contacts
! Sign/notice on employer's premises
! Other source.
Source: Survey of Job Search Experience 2000, ABS.
3.2.3 Job Search Methods
Example question:
I would now like to ask about all the steps you have taken to look for work since (date).
When looking for work:
! Were you registered with Centrelink for job search assistance?
! Did you write, phone or apply in person to an employer for work?
What (other) steps did you take to find a job?
! Checked Centrelink touchscreens
! Checked factory notice boards
! Contacted an employment agency
! Looked in newspapers
! Searched Internet sites
! Answered a newspaper advertisement for a job
! Advertised or tendered for work
! Contacted friends or relations
! Other steps.
Source: Survey of Job Search Experience 2000, ABS.
3.2.2 Friends as sources of
job search information
Example question:
Have you contacted the state government via the internet to:
! express your view on an issue or decision made by the state government
! be part of a consultation process on state government policies or legislation
! to find out information about government
! conduct government transactions (e.g. paying car registration, obtaining a permit).
How interested would you be in contacting the state government via the internet to:
! express your views on an issue or decision made by the state government
! be part of a consultation process on state government policies or legislation
! to find out information about government
! conduct government transactions (e.g. paying car registration, obtaining a permit).
Response on a 4 point scale from 'Not interested' to 'Very Interested'
Source: Adapted from The Queensland Household Survey 2002, Queensland
Department of Premier and Cabinet.
The adaption is the inclusion of scaled response categories.
3.2.1 Use of Internet to
contact government
The following example questions have been drawn from a range of surveys to illustrate
some possible ways of measuring sharing knowledge, information and introductions.
3.2 Sharing Knowlege:
Information and Introduct ions
A B S • ME A S U R I N G SO C I A L CA P I T A L , A N A U S T R A L I A N FR A M E W O R K A N D I N D I C A T O R S • 1 3 7 8 . 0 • 2 0 0 4 13 9
A P P E N D I X 3 EX A M P L E QU E S T I O N S FR O M EX I S T I N G SU R V E Y S continued
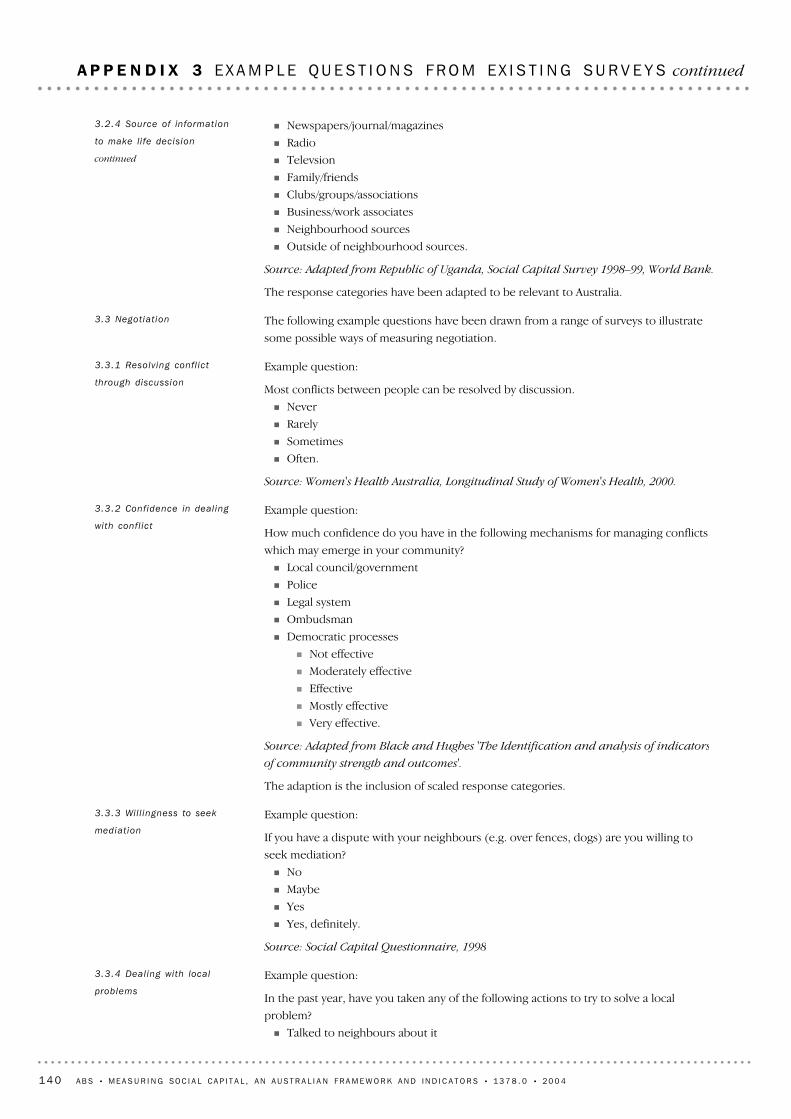
Example question:
In the past year, have you taken any of the following actions to try to solve a local
problem?
! Talked to neighbours about it
3.3.4 Deal ing with local
problems
Example question:
If you have a dispute with your neighbours (e.g. over fences, dogs) are you willing to
seek mediation?
! No
! Maybe
! Yes
! Yes, definitely.
Source: Social Capital Questionnaire, 1998
3.3.3 Wil l ingness to seek
mediat ion
Example question:
How much confidence do you have in the following mechanisms for managing conflicts
which may emerge in your community?
! Local council/government
! Police
! Legal system
! Ombudsman
! Democratic processes
! Not effective
! Moderately effective
! Effective
! Mostly effective
! Very effective.
Source: Adapted from Black and Hughes 'The Identification and analysis of indicators
of community strength and outcomes'.
The adaption is the inclusion of scaled response categories.
3.3.2 Confidence in deal ing
with confl ict
Example question:
Most conflicts between people can be resolved by discussion.
! Never
! Rarely
! Sometimes
! Often.
Source: Women's Health Australia, Longitudinal Study of Women's Health, 2000.
3.3.1 Resolv ing confl ict
through discussion
The following example questions have been drawn from a range of surveys to illustrate
some possible ways of measuring negotiation.
3.3 Negotiat ion
! Newspapers/journal/magazines
! Radio
! Televsion
! Family/friends
! Clubs/groups/associations
! Business/work associates
! Neighbourhood sources
! Outside of neighbourhood sources.
Source: Adapted from Republic of Uganda, Social Capital Survey 1998–99, World Bank.
The response categories have been adapted to be relevant to Australia.
3.2.4 Source of informat ion
to make li fe decision
continued
14 0 A B S • ME A S U R I N G SO C I A L CA P I T A L , A N A U S T R A L I A N FR A M E W O R K A N D I N D I C A T O R S • 1 3 7 8 . 0 • 2 0 0 4
A P P E N D I X 3 EX A M P L E QU E S T I O N S FR O M EX I S T I N G SU R V E Y S continued
Example question:
Level of agreement with statement.
My local community is friendly towards newcomers.
! Strongly agree
! Agree
! Neither agree nor disagree
! Disagree
! Strongly disagree
Source: Community Capacity Questionnaire 2001, Tasmanian Department of Health
and Human Services.
4.2.3 Openess of local
community
Same as question for 4.1.1 Group homogeneity.
Same as for question 4.1.2 Density of formal networks.
4.2.1 Group heterogeneity
The following example questions have been drawn from a range of surveys to illustrate
some possible ways of measuring bridging.
4.2 Bridging
Same question as for 1.1.5.3 Group Diversity.4.1.1 Group homogenetity
The following reference is to an example question which has been used to measure
bonding.
4.1 Bonding
The following example questions relate to: bonding; bridging; and linking.4 . NE T W O R K TY P E S
Example question:
There are always some people whose ideas are considered bad or dangerous by other
people. If such a person wanted to make a speech in your (city/town/community),
should he/she be allowed to speak, or not?
Source: Adapted from General Social Survey, National Opinion Research Centre.
This generic example question has been adapted from a series of highly specific
questions.
3.4.2 Wil l ingness to al low
behaviour against norms
Example question:
Do you think your neighbours would intervene if:
! Children were wagging (absent without parental consent)
! Someone was spray-painting graffiti on a local building
! Children were showing disrespect to an adult
! A fight broke out in front of their house.
! A local service e.g. ambulance was threatened with closure.
Source: Queensland Household Survey 2000, Queensland Department of Premier and
Cabinet.
3.4.1 Percept ion of
wil l ingness to intervene in
anti-social behaviour
The following example questions have been drawn from a range of surveys to illustrate
some possible ways of measuring applying sanctions.
3.4 Apply ing Sanct ions
! Contacted a local politician
! Contacted the appropriate organisation to deal with the problem (e.g. the police,
council)
! Attended a public meeting
! Joined an action group.
Source: Health and Participation Survey 1997, Department of Public Health, Flinders
University of South Australia.
3.3.4 Deal ing with local
problems continued
A B S • ME A S U R I N G SO C I A L CA P I T A L , A N A U S T R A L I A N FR A M E W O R K A N D I N D I C A T O R S • 1 3 7 8 . 0 • 2 0 0 4 14 1
A P P E N D I X 3 EX A M P L E QU E S T I O N S FR O M EX I S T I N G SU R V E Y S continued
Same as for question 4.2.4 Low bridging.4.4.2 Feel ings of social
isolat ion
Same as for question 4.1.2 Density of formal networks.4.4.1 Act iv i ty in groups
The following reference is to an example question that has been used to measure
isolation.
4.4 Isolat ion
Same question as for 2.1.4 Links to institutions.4.3.1 Links to inst i tut ions
The following reference is to an example question which has been used to measure
linking.
4.3 Linking
Example question:
Have there been times in the past year when you have felt isolated and cut off from
society for any of the following reasons?
! Paid work
! Child care responsibilities
! Other caring responsibilities
! Lack of own transport
! Irregular or expensive public transport
! No friends
! No family
! Problems with physical access
! Sexism
! Racism
! Homophobia
! Discrimination relating to disability
! Other
! None of these.
Source: Millennium Poverty and Social Exclusion Questionnaire 1999, Office of
National Statistics, United Kingdom.
4.2.4 Low bridging
14 2 A B S • ME A S U R I N G SO C I A L CA P I T A L , A N A U S T R A L I A N FR A M E W O R K A N D I N D I C A T O R S • 1 3 7 8 . 0 • 2 0 0 4
A P P E N D I X 3 EX A M P L E QU E S T I O N S FR O M EX I S T I N G SU R V E Y S continued
This category includes groups providing activities relating to arts, culture, and education,
and promoting interest in these activities. Examples are groups and organisations related
to visual arts, performing arts, literature, music, museums, libraries, galleries, zoos and
aquariums, adult and continuing education.
Participation in arts, culture or education groups are considered as social participation.
2 Arts, culture, or educat ion
groups or organisat ions
This category includes sporting clubs and associations, which promote, organise and
administer the provision of general or sport specific competitions and related activities in
the community, for example netball clubs, soccer clubs, cricket clubs, cycling clubs and
swimming clubs. This category also includes clubs and associations that promote and
organise other recreational activities in the community such as bushwalking and fishing.
This category does not include sports social clubs such as those commonly associated
with football. These are included in the category 'social clubs'.
SO C I A L PA R T I C I P A T I O N
1 Sport ing or recreat ion
groups or organisat ions
14 Children, parenting or school related groups (community support)
15 Services clubs (community support)
16 Humanitarian aid groups (community support)
17 Welfare groups (community support)
18 Health or disability groups, self development groups (community support)
19 Voluntary emergency, rescue or fire services organisations (community support)
The following section provides a description of each category in the typology and a
discussion of whether it best fits within social participation, civic participation or
community support based on what is perceived to be the primary function of the groups
in that category. There is a recognition that most groups and organisations have multiple
functions and engage in a range of activities, and that it is difficult to be prescriptive
about the implicit nature of participation entailed by membership of the group. The
social participation, civic participation and community support label is an attempt to
broadly categorise the type of participation.
Community support
7 A trade union, professional organisation or technical association (civic participation)
8 Political parties (civic participation)
9 Civic or community groups or organisations (civic participation)
10 Environment or animal welfare groups (civic participation)
11 Human and civil rights groups (civic participation)
12 Body corporate or tenants associations (civic participation)
13 Consumer organisations (civic participation)
Civic part ic ipat ion
1 Sporting or recreation groups or organisations (social participation)
2 Arts, culture, or education groups or organisations (social participation)
3 Craft or hobby groups or organisations (social participation)
4 Religious or spiritual groups or organisations (social participation)
5 Social clubs (social participation)
6 Ethnic or multicultural clubs, or organisations (social participation)
Social part ic ipat ion
The categories in the suggested draft typology for the ABS Social Capital Framework are
as follows:
I N T R O D U C T I O N
A B S • ME A S U R I N G SO C I A L CA P I T A L , A N A U S T R A L I A N FR A M E W O R K A N D I N D I C A T O R S • 1 3 7 8 . 0 • 2 0 0 4 14 3
A P P E N D I X 4 GR O U P A N D O R G A N I S A T I O N T Y P O L O G Y
This category includes all political parties in operation in Australia. Political parties can be
considered to be associations that exist with the aim of gaining and exercising political
power, through electoral means. Political parties in Australia do not have to be
registered, but qualify for certain rights and entitlements if they are registered. Examples
of political parties in Australia include: The Australian Democrats; The Australian Greens;
The Australian Labor Party; and The Liberal Party of Australia.
Political parties are considered to fit within civic participation. Active membership of a
political party is a way of having a role in the type of government elected and possibly
even contributing to policy directions.
8 Poli t ical part ies
This category includes trade unions in any industry, as well as professional associations
that exist to promote and represent the interests of, and regulate and safeguard specific
professional occupation or industry groups. Examples of organisations that fit within this
category include: Community and Public Sector Union, state Farmer's Federations,
Australian Medical Association and the Royal Australian Institute of Architects.
Trade unions, professional organisations or technical associations are considered to most
closely fit within civic participation. While they may offer support for members the
primary function of these organisations may be considered to be representing the
interests of occupation and industry groups, usually to government.
C I V I C PA R T I C I P A T I O N
7 A trade union, professional
organisat ion or technical
associat ion
This category includes groups and organisations that promote social and cultural
understanding between people of various countries and historical backgrounds. This
includes multicultural social clubs such as an Italo-Australian club, and groups and
organisations that promote interest in the languages and culture of particular countries
such as Alliance Francaise.
In the ABS Social Capital Framework ethnic or multicultural clubs or organisations are
considered to fit most closely within social participation. This is because the primary
purpose of these groups is the provision of social and educational activities aimed at
promoting understanding of different cultures, with opportunities for social participation
in this context.
6 Ethnic or mult icul tural
clubs, or organisat ions
This category includes clubs and organisations that are established to provide a social
amenity for their members generally with facilities such as restaurants and bars. Clubs
such as Tradespersons clubs and Football supporters clubs are included in this category.
5 Social clubs
This category includes organisations promoting religious beliefs and administering
religious services, rituals, retreats and other spiritual practices and includes: churches,
mosques, synagogues, temples, shrines, seminaries, monasteries, convents and similar
religious institutions. These organisations often have related organisations and auxiliary
or adjunct activities or groups such as youth groups and choirs. This category also
includes newer forms of spiritual groups such as transcendental meditation groups and
Falung Gong.
Religious or spiritual groups or organisations are considered to most closely fit within
social participation as the main purpose is the facilitation of participation in common
worship or spiritual practices. It is recognised that they also have significant community
support functions. Where these are embodied in an organisation with a separate name,
such as the Brotherhood of St Lawrence or the St Vincent de Paul Society, these
organisations would be categorised to community support.
4 Rel igious or spir i tual groups
or organisat ions
The category includes craft and hobby groups such as: computer game groups;
patchwork and lacemaking groups; woodwork groups; furniture restoration groups; pet
and animal breed clubs; birdwatching groups; chess clubs; bridge clubs; cooking and
cake decorating groups; sewing and knitting groups; model train, boat and plane clubs;
car enthusiast clubs; and gardening clubs.
3 Craft or hobby groups or
organisat ions
14 4 A B S • ME A S U R I N G SO C I A L CA P I T A L , A N A U S T R A L I A N FR A M E W O R K A N D I N D I C A T O R S • 1 3 7 8 . 0 • 2 0 0 4
A P P E N D I X 4 GR O U P A N D O R G A N I S A T I O N T Y P O L O G Y continued

This category includes clubs that are developed with a focus on fellowship, service and
contributing to community life through working for the wider social benefit of society.
These clubs are generally involved in programs or the provision or services. Examples of
these programs and services include: international assistance projects such as recycling
of eyeglasses for use in other countries and establishing water treatment programs;
15 Services clubs
This category includes groups and organisations that are involved with schools such as
Parents and Citizens Associations and school tuck shops, groups that relate to providing
support or services in relation to parenting responsibilities such as Nursing Mothers'
Associations, Parent Effectiveness Groups, Sole Parent Support Groups, and Playgroups.
Children, parenting or school related groups are considered to most closely fit within
community support. This is because the function of these types of groups is to provide
support including mutual support networks to parents and children.
CO M M U N I T Y SU P P O R T
14 Chi ldren, parenting or
school related groups
This category includes groups and organisations which represent the interests of
consumer groups such as motor vehicle associations and the Australian Consumer
Association.
Consumer organisations are classified to civic participation. The primary purpose of
these groups is to provide representation for consumers.
13 Consumer organisat ions
This category includes groups and organisations that provide body corporate or tenant's
governance functions in housing estates, or provide a representative forum for tenants.
Body corporates and tenants associations are considered to most closely fit within civic
participation as their purpose is the governance of housing estates, or a representative
function for tenants.
12 Body corporate and
tenants associat ions
This category includes groups that promote and protect, represent, monitor, report on,
and campaign for human and civil rights. This category includes groups with a universal
interest in human rights such as Amnesty International and Human Rights Watch, and
groups with an interest in the rights of specific constituent groups such as gay and
lesbian rights lobby groups, women's rights lobby groups, and civil liberties groups.
Human and civil rights groups or organisations are considered to fit most closely within
civic participation. This is because the primary purpose of these groups often requires
political activity to defend or change policies.
11 Human and civ i l rights
groups
This category includes groups and organisations that promote and provide services in
environmental conservation, pollution control and prevention, environmental education
and health, and animal protection and welfare. Landcare, RSPCA, The Humane Society,
and The Wilderness Society fit within this category.
In the ABS Social Capital Framework, environment or animal welfare groups are
considered to fit most closely with civic participation. The reason for this is that these
groups and organisations have as their primary function the representation and
promotion of the rights and interest of animals and the environment, entities that are
unable to represent themselves. This involves representations to government or working
with government in the provision of services.
10 Environment or animal
welfare groups
This category includes community groups and organisations whose purpose is to
facilitate the communication of community concerns to government or to otherwise
participate in governance. Organisations such as community councils, residents' action
groups and Neighbourhood Watch are included in this category.
Civic or community groups or organisations are considered to fit most closely within
civic participation as their main purpose is as a forum for interaction with government or
government institutions such as police.
9 Civic or community groups
or organisat ions
A B S • ME A S U R I N G SO C I A L CA P I T A L , A N A U S T R A L I A N FR A M E W O R K A N D I N D I C A T O R S • 1 3 7 8 . 0 • 2 0 0 4 14 5
A P P E N D I X 4 GR O U P A N D O R G A N I S A T I O N T Y P O L O G Y continued
This category includes groups and organisations involved in search and rescue, fire and
emergency services and disaster relief. Organisations such as Voluntary Fire Brigades,
Voluntary Emergency Services and Voluntary Search and Rescue Associations fit within
this category.
Because of their services to the community, rescue or fire services organisations are
classified to community support.
19 Voluntary emergency,
rescue or fire serv ices
organisat ions
This category includes specific health conditions support groups, health promotion
groups such as the Cancer Council, Heart Foundation and the Alzheimers Association,
12 step groups such as Alcoholics Anonymous, disability support groups, eating disorder
groups and Quit Smoking Groups.
Health or disability groups, and self development groups are considered to most closely
fit within community support. The primary purpose of these groups is the provision of
support networks and research and educational services to individuals and groups in the
community.
18 Health or disabi l i ty
groups, self development
groups
This category includes groups and organisations providing services to the general
community and specific target groups. This includes those groups and organisations
providing material assistance, personal care and advice such as Lifeline, the Smith Family,
Brotherhood of St Lawrence, Legacy, Royal Blind Societies and Meals on Wheels.
As a result of these service activities, welfare groups are classified to community support.
17 Welfare groups
This category includes groups and organisations whose purpose is to provide relief and
development, usually but not always international in focus. These organisations generally
provide relief during emergencies such as floods, wars and earthquakes as well as
promoting welfare and engaging in longer term development projects abroad. World
Vision and Care Australia are examples of humanitarian aid groups.
Humanitarian aid groups are classified to community support. The primary purpose of
these groups is to provide services to the community (usually the broader global
community) in the form of disaster relief and development projects.
16 Humanitar ian aid groups
domestic projects and programs such as the provision of student hostels and aged care
facilities; and providing crisis, disaster and emergency relief. This category includes
organisations such as Rotary, Apex, Lions and Country Women's Associations.
Although friendship and fellowship and social activities are a strong element of the
culture of these types of organisations, they appear in their public information to place a
primary emphasis on community service. They have therefore been classified to
community support.
15 Services clubs continued
14 6 A B S • ME A S U R I N G SO C I A L CA P I T A L , A N A U S T R A L I A N FR A M E W O R K A N D I N D I C A T O R S • 1 3 7 8 . 0 • 2 0 0 4
A P P E N D I X 4 GR O U P A N D O R G A N I S A T I O N T Y P O L O G Y continued
Generalised trust refers to trust that individuals have toward other people in general.Generalised trust
Formal networks are those that occur within the context of social or civic groups,organisations, or associations.
Formal network
Family functioning refers to how well families are doing and the impact that changes inthe social, economic and cultural environments in which families live have on their levelsof functioning (Zubrick et al. 2000).
Family functioning
A voluntary transfer of funds made in the preceeding 12 months by a person, on anindividual not a business basis. The donor should not have received any benefit inreturn. Excludes purchases of goods and raffle tickets but includes door-knocks andsponsoring walkathons etc.
Donations
A shorthand term for the social divide created where certain sections of groups orcommunities have access to Information Technology infrastructure and knowledge, andothers do not. This has implications for equity of access to information andopportunities.
Digital Divide
A dense network is one in which network members overlap and know one another(Stone, Gray & Hughes, 2003).
Dense network
Corruption is the behaviour of private individuals or public officials who deviate from setresponsibilities and use their position of power in order to serve private ends and secureprivate gains. Such behaviour can have long-term effects including social polarisation,lack of respect for human rights and diversion of funds intended for development andessential services — securing private gains for some parts of society whilst being harmfulfor others, and therefore impacting on social capital. (Lebanon Anti-Corruption InitativeReport, 1999, in the United Nations Office for Drug Control and Crime Prevention, 2002,<http://www.undcp.org/corruption.html>).
Corruption
A cooperative is a type of legal entity, set up for a specific purpose, by a group of peoplewanting to achieve a common social, economic or cultural goal. Cooperatives are foundin a variety of industries including child care, publishing, housing, travel, agriculture,research and development, labour hire, finance and tourism.
Co-operatives are founded on principles including voluntary association and openmembership, democratic control by members, limited interest on capital and equitabledivision of surplus. Specific legislation governs the operation of co-operatives in eachstate.
Cooperatives
Community resilience refers to the capacity of a community to cope with change, whilstmaintaining community identity. It may refer to the ability of a community to withstandor recover from loss or adversity, or to absorb and include a changing population.
Community resilience
Community breakdown refers to an amalgam of social problems, which may include alack of community resilience, conflict and crime, corruption, social exclusion, diminishedlocus of control, reduced family functioning, and lack of confidence in the community toachieve goals.
Community breakdown
A fellow member of a profession, staff, or academic faculty <www.yourdictionary.com>.Colleague
A closed network is one in which social relations exist between and among all parties(Coleman 1988).
Closed network
Informal assistance in terms of help or supervision with one or more of a range ofspecified activities, ongoing or expected to be ongoing for six months or more, topersons who need the assistance because of a disability or long-term health condition, orbecause they are elderly (i.e. aged 60 years and over).
Care
Barter and barter economy: A form of economic exchange and a related form ofeconomy in which goods are exchanged for goods rather than for money. (Jary and Jary2000)
Barter and barter economy
A B S • ME A S U R I N G SO C I A L CA P I T A L , A N A U S T R A L I A N FR A M E W O R K A N D I N D I C A T O R S • 1 3 7 8 . 0 • 2 0 0 4 14 7
G L O S S A R Y
Any institution which may be owned and controlled by a private body, not controlled bythe general government sector. May be divided into the commercial sector and thenonprofit sector.
Non-Government
A social network is a set of people or groups of people, with some pattern of interactionsor ties between them (Scott 2000).
Network
The renewable and non-renewable resources which enter the production process andsatisfy consumption needs, as well as environmental assets that have amenity andproductive use, and are essential for the life support system.
Natural capital
A mentor is a wise and trusted advisor and helper to an inexperienced person. Amentoring relationship fosters caring and supporting relationships; encouragesindividuals to develop to their full potential; helps an individual to develop his/her visionfor the future; and helps develop active community partnerships.<http://www.tlt.its.psu.edu/suggestions/mentor/definition.html>.
Mentor
An individual's, group or community beliefs about whether the outcome of their actionsare dependent on what they do (internal) or are determined by events outside theirpersonal control (external).
Locus of control
For any group, the labour force expressed as a percentage of the civilian population aged15 years and over in the same group.
Labour force participation rate
Institutional trust refers to levels of trust that individuals may have in the honesty,openness and fair dealing of a range of societal institutions, such as government, police,hospitals, and the courts. It also refers to confidence in the capacity of these institutionsto take reasonable actions in the administration of their duties, which enhances the easeof acceptance of the results of these actions.
Institutional trust
Informal trust refers to trust that individuals may have towards people in their socialnetwork, such as family members, friends, neighbours, work colleagues, and fellowmembers or participants in the clubs and organisations they belong to or participate in.
Informal trust
Informal networks are those that occur outside of any formal social or civic groups,organisations, or associations. This includes friendships between individuals and familymembers.
Informal network
Human capital refers to the productive capacity of a human being, 'the knowledge, skills,competencies and attributes embodied in individuals which facilitate the creation ofpersonal, social and economic wellbeing'. This includes skills and abilities, and also thehealth status, values (such as honesty and self-reliance) and personality characteristics(such as optimism, self-confidence, perseverance and friendliness) that enable the skillsand abilities to be used effectively.
Human capital
Homogeneity refers to cultural, social, biological, or other similarities within a group.Homogeneity
Heterogeneity refers to cultural, social, biological, or other differences within a group.Heterogeneity
A legal entity, which is established by legislation, regulation or governmentadministrative action; financed mainly from taxation or government transfers; exerciseslegislative, judicial, or other government authority over other units within a given area;and mainly provides its services free or at economically insignificant prices.
Generally, the government sector is divided into three subsectors representing threelevels of government (central, state and local). In Australia, the corresponding levels ofgovernment are described as national, state/territory and local. (Standard EconomicSector Classifications of Australia (SESCA), 2002, cat. no. 1218.0)
Government
Method or system of government or management.Governance
14 8 A B S • ME A S U R I N G SO C I A L CA P I T A L , A N A U S T R A L I A N FR A M E W O R K A N D I N D I C A T O R S • 1 3 7 8 . 0 • 2 0 0 4
G L O S S A R Y continued
A state of health or sufficiency in all aspects of life.Wellbeing
A volunteer is someone who willingly gave unpaid help, in the form of time, service orskills, through an organisation or group (Voluntary Work 2000). Voluntary work activitiesare those activities which are performed for community organisations without pay (TimeUse 1997).
Voluntary work
Social exclusion is a form of social disadvantage encompassing economic andnon-economic factors. Excluded individuals and groups are separated from institutionsand wider society, and consequently from both rights and duties. (Jary and Jary 2000).
Social exclusion
Networks, together with shared norms, values and understandings which facilitatecooperation within and among groups. (OECD 2001a)
Social capital
Sense of belonging refers to having a relationship of affinity to a community, sharingvalues, identity and feelings of commitment, and being accepted by others.
Sense of belonging
The produced means of production like machinery, equipment and structures, but alsonon-production related infrastructures, non-tangible assets, and the financial assets theprovide command over current and future output streams.
Produced economic capital
An open network may refer to a group in which members know only a small number, ifany, of the other members; it may also refer to a number of groups linked loosely withone or a very few members in common, acting as bridges.
Open network
An organisation or group is any body with a formal structure. It may be as large as anational charity or as small as a local book club. Purely ad hoc, informal and temporarygatherings of people do not constitute an organisation. (Voluntary Work Survey 2000,ABS).
Organisation or group
Standards or rules that regulate behaviour in a social setting (Collins Dictionary ofSociology). They are shared values and accepted behaviours and expectations that mayexist within networks, and which serve to enhance the functioning of networks. Theseinclude, but are not limited to, trust, reciprocity, cooperation, and acceptance ofdiversity. These norms and values provide the basis for rules and sanctions that governpeople's behaviour, as well as reducing transaction costs.
Norms
Legal or social entities created for the purpose of producing goods or services whosestatus does not permit them to be a source of income, profit or other financial gain forthe units that establish, control or finance them (Non-Profit Institutions SatelliteAccount, 1999–2000).
Non-profit Institutions (NPIs)
A legal entity that: is created for the purpose of producing goods and services for themarket; may be a source of profit or other financial gain to its owner(s); and iscollectively owned by shareholders who have the authority to appoint directorsresponsible for its general management. (Standard Economic Sector Classifications ofAustralia (SESCA), 2002, cat. no. 1218.0).
Commercial/corporation
A B S • ME A S U R I N G SO C I A L CA P I T A L , A N A U S T R A L I A N FR A M E W O R K A N D I N D I C A T O R S • 1 3 7 8 . 0 • 2 0 0 4 14 9
G L O S S A R Y continued
3AW (2003), The Hon Peter Costello MP, Interview with Neil Mitchell. Available [online]:
<http://www.treasurer.gov.au/tsr/content/transcripts/2003/077.asp>.
Australian Bureau of Statistics (2000), Voluntary Work, Australia, cat. no. 4441.0, ABS,
Canberra.
Australian Bureau of Statistics (2001), Measuring Australia's Progress, cat. no. 1370.0,
ABS, Canberra.
Australian Bureau of Statistics (2001), Measuring Wellbeing: Frameworks for Australian
Social Statistics, cat. no. 4160.0, ABS, Canberra.
Australian Bureau of Statisitics (2002), Discussion Paper: Measuring a Knowledge-based
Economy and Society — An Australian Framework, cat. no. 1375.0, ABS
Canberra.
Australian Bureau of Statisitics (2002b), Discussion Paper: Social Capital and Social
Wellbeing, ABS. Available [online] <http://www.abs.gov.au>.
Australian Bureau of Statistics (2003), Australian Social Trends, cat. no. 4102.0, ABS,
Canberra.
Baron, R & Byrne, D (1997), Social Psychology, Allyn and Bacon, London.
Barnes, JA (1954), Class and committees in a Norwegian island parish, Human Relations,
7:39–58. (Cited in Berkman & Glass, 2000).
Baum, F, Palmer, C, Modra, C, Murray, C, & Bush, R (2000), Chapter 10: Families, social
capital and health, in Social Capital and Public Policy in Australia ed. Winter,
I, Australian Institute of Family Studies, Melbourne.
Bush, R & Baum, F (2001), Chapter 13: Health, inequities, community and social capital,
in The Social Origins of Health and Wellbeing, eds Eckersley, R, Dixon, J &
Douglas, B Camridge University Press, Cambridge.
Beauvais, C and Jenson, J (2002), Social Cohesion, Updating the State of the Research,
paper for the Department of Canadian Heritage, Quebec.
Becker, GS (1964/1993), Human Capital, University of Chicago Press, Chicago. (Cited in
Lin 2002).
Berger-Schmitt, R & Noll, H-H (2000), Conceptual Framework and Structure of a
European System of Social Indicators, EuReporting Working Paper No. 9.,
Subproject 'European System of Social Indicators'. Mannhiem: Centre for Survey
Research and Methodology (ZUMA), Social Indicators Department.
Berkman, LF & Glass, T (2000), Social Integration, Social Networks, Social Support, and
Health in Social Epidemiology, eds Berkman, L & Kawachi, I, Oxford University
Press, New York pp. 137–173.
Better Together (2002), Work and Social Capital, Saguaro seminar on civic engagement
in America, John F. Kennedy School of Government, Harvard University,
Cambridge MA. Available [online] <www.bettertogether.org/pdfs/wor.pdf>.
Bittman, M & Wilkinson, J (2002), Volunteering: The Human Face of Democracy. SPRC
Discussion Paper No. 114. The Social Policy Research Centre, University of New
South Wales, Sydney.
Black, A & Hughes, P (2001), The Identification and analysis of indicators of
community strength and outcomes: Occasional Paper Number 3,
Commonwealth Department of Family and Community Services: Canberra.
Bott, E (1957), Family and Social Network, Tavistock Press, London (Cited in Berkman
and Glass, 2000).
RE F E R E N C E
15 0 A B S • ME A S U R I N G SO C I A L CA P I T A L , A N A U S T R A L I A N FR A M E W O R K A N D I N D I C A T O R S • 1 3 7 8 . 0 • 2 0 0 4
B I B L I O G R A P H Y
Bourdieu, P (1986), 'The Forms of Capital' in Handbook of Theory and Research for the
Sociology of Education, ed. Richardson, J, Greenwood Press, New York (also
discussed extensively in Lin (2001).
Bowles, S, & Gintis, H (2000), Social Capital and Community Governance, University of
Massachusetts. Available [online]
<http://www.santafe.edu/sfi/publications/Working-Papers/01-01-003.pdf>.
Bridge, G (2002), The Neighbourhood and Social Networks, CNR Paper 4, Centre for
Neighbourhood Research. Available [online]:
<http://www.neighbourhoodcentre.org.uk/research/cnrpaperspdf/
cnr4pap.pdf>.
Bullen, P, & Onyx, J (1998), Measuring Social Capital in Five Communities in NSW:
Overview of a study. Available [online] <www.map1.com.au/A2.htm>.
Bush, R & Baum, F (2001), Chapter 13: Health, inequalities, communities and social
capital, in The Social Origins of Health and Well-being, eds. Eckersley, R, Dixon,
J, & Douglas, B Cambridge University Press, Cambridge.
Butcher, J, Labone, E, Howard, P (2003), Universities, Social Reconstruction and
Efficacy for Community Engagement, Paper presented at the 2nd International
InsideOut Conference on Higher Education and Community Engagement.
Queensland. Available [online]:
<http://www.uq.edu.au/insideout/pdfs/butcherlabonehoward.pdf>.
Caldwell, P, & Cox, E (2000), Chapter 3: Making Social Policy, in Social Capital and
Public Policy in Australia, ed. Winter, I, Australian Institute of Family Studies,
Melbourne, pp. 43–72.
Centre for Mental Health Research (2003), Current Affairs and Mental Health: The
Eurobodalla Study. Australian National University, Canberra. Available [online]:
<http://www.anu.edu.au/cmhr/pdf/CMHRCurrentAffairs&MentalHealth.pdf>.
Coleman, J (1988), Social Capital in the Creation of Human Capital, American Journal of
Sociology, vol. 94, pp 94–120.
Connor, S & Brink, S (1999), Understanding the Early Years, Community Impacts on
Child Development, Working paper W-99-6E, Applied Research Branch,Strategic
Policy, Human Resources Development, Canada.
Cox, E (1995), A Truly Civil Society: 1995 Boyer Lectures. ABC Books, Sydney.
Cox, E (2000), Community and Social Audit Manual, University of Technology, Sydney.
Cullen, M & Whiteford, H (2001), The Interrelations of Social Capital with Health and
Mental Health, Department of Health and Aged Care, Australia.
Department of the Parliamentary Library (2002), Political Trust and Social Capital in
Australia, Research Note No. 12, 2001–02. Available [online]:
<http://www.aph.gov.au/library/pubs/rn/2001-02/02rn12.pdf>.
Department of Family and Community Services (2003), Available [online]:
<http://www.facs.gov.au>.
Drislane, R & Parkinson, G Online Dictionary of Social Sciences. Available [online]:
<http://bitbucket.icaap.org/>.
Fahmey, E (2003) Civic Capacity, Social Exclusion & Political Participation in Britain:
Evidence from the 1999 Poverty & Social Exclusion Survey. Political Studies
Association Annual Conference, University of Leicester. Available [online]:
<http://www.psa.ac.uk/cps/2003/Eldin%20Fahmy.pdf>.
RE F E R E N C E continued
A B S • ME A S U R I N G SO C I A L CA P I T A L , A N A U S T R A L I A N FR A M E W O R K A N D I N D I C A T O R S • 1 3 7 8 . 0 • 2 0 0 4 15 1
B I B L I O G R A P H Y continued
Falk, I (2001), Human and Social Capital: A case study of conceptual colonisation,
CRLRA Discussion Paper D8, Center for Research and Learning in Regional
Australia. Available
[online]:<http://www.crlra.utas.edu.au/files/discussion/2001/D8-2001.pdf>.
Flora, J (1998), Social capital and communities of place: Presidential Address, Rural
Sociology, Vol 63, no. 4, pp. 481–506. Available [online]:
<http://www.worldbank.org/poverty/scapital/library/flora1.pdf>.
Florida, R, Cushing, R, Gates, G (2002), When Social Capital Stifles Innovation, in
Harvard Business Review, August, 2002.
Fukuyama, F (1999) Social Capital and Civil Society, IMF Conference on Second
Generation Reforms. Available [online]:
<http://www.imf.org/external/pubs/ft/seminar/1999/reforms/fukuyama.htm>.
Garner,CL & Raudenbush, SW (1991), Neighbourhood Effects on Educational
Attainment: A Multilevel Analysis, Sociology of Education, 64:251:262.
Giorgas, D (2000), Community Formation and Social Capital in Australia, Paper
presented to the 7th Australian Institute of Family Studies Conference, July,
Sydney. Available [online]: <http://www.aifs.org.au/institute/afrc7/giorgas.pdf>.
Granoveter, M (1973), The Strength of Weak Ties, American Journal of Sociology,
no. 78, pp. 1360–1380.
Grimes, K (2003), To Trust is Human, in New Scientist, 10th May, 2003.
Hall, M, Knighton, T, Reed, P, Bussiere, P, McRae, D, Bowen, P (2000), Caring
Canadians: Highlights from the 1997 National Survey of Giving, Volunteering
and Participating, Catalogue no. 71-542-XIE, Statistics Canada, Ottawa.
Hogan, D & Owen, D (2000), Chapter 4: Social Capital, Active Citizenship, and Political
Equality in Australia, in Social Capital and Public Policy in Australia ed.
Winter, I. Australian Institute of Family Studies, Melbourne.
Industry Commission (1993), 'Chapter 4: Regional Mobility of Labour', in Impediments to
Regional Industry Adjustment, Australian Government Publishing Service,
Canberra.
Jary, D & Jary, J (2000), Collins Dictionary of Sociology, Harper Collins Publishers:
Glasgow.
Kilpatrick, S. (2002). Learning and Building Social Capital in a Community of Family Farm
Businesses, International Journal of Lifelong Education,
vol. 21, no. 5, pp. 446–464.
Kohen, DE, Hertzman, C, Brooks-Gunn, J (1998), Neighbourhood Influences on
Children's School Readiness, Working paper W-98-15E Applied Research
Branch, Strategic Policy, Human Resources Development, Canada.
Lawrence, C (2003) Ideas to Save our Withering Democracy, Speech delivered at public
lecture at the University of Western Australia, August 7th 2003. Available
[online]: <http:www.smh.com.au/2003/08/07/1060145791873.html>.
Lin, N (2001), Social Capital: A Theory of Social Structure and Action, Cambridge
University Press, UK.
Lyons, M (2000), Chapter 7: Non-profit Organisations, Social Capital and Social Policy in
Australia, in Social Capital and Public Policy in Australia, ed. Winter, I,
Australian Institute of Family Studies, Melbourne.
Meredyth, D (2003), Hot-wiring Community, presented at Social Inclusion: Australian
Social Policy Conference, University of New South Wales, Sydney.
RE F E R E N C E continued
15 2 A B S • ME A S U R I N G SO C I A L CA P I T A L , A N A U S T R A L I A N FR A M E W O R K A N D I N D I C A T O R S • 1 3 7 8 . 0 • 2 0 0 4
B I B L I O G R A P H Y continued
Narayan, D (1999), Bonds and Bridges: Social Capital and Poverty, World Bank,
Washington DC. Available [online]:
<http://www.worldbank.org/poverty/scapital/library/narayan.pdf>.
Office of Drugs and Crime, UN (1999), 'Lebanon Anti-Corruption Initiative Report', in The
United Nations Office for Drug Control and Crime Prevention', Available
[online]: <http://www.undcp.org/corruption.html>.
OECD (2001a), The Wellbeing of Nations: The Role of Human and Social Capital,
Education and Skills. OECD Centre for Educational Research and Innovation,
Paris, France.
OECD (2001b) Sustainable Development: Critical Issues. OECD, Paris, France.
Onyx, J (2001), Community Renewal and Social Capital: Key Note Address from the
Community Technology Centres conference, December 3, 2001. Available
[online]: <http://www.ctc.nsw.gov.au/static/Onyx.doc>.
Onyx, J & Bullen, P (1997), Measuring Social Capital in Five Communities in NSW: An
Analysis, Working Paper No. 41, Centre for Australian Community Organisations
and Management, University of Technology, Sydney.
Pretty, J & Ward, H. (2001), Social Capital and the Environment, in World
Development, Oxford, vol. 29, no. 2.
Productivity Commission (2003), Social Capital: Reviewing the Concept and its Policy
Implications, Research Paper, AusInfo, Canberra.
Pusey, M (2003), The Experience of Middle Australia: The Dark Side of Economic
Reform, Cambridge University Press, Cambridge.
Putnam, RD (1993a), The Prosperous Community in The American Prospect, vol. 4 no.
13 Available [online] <http://www.prospect.org/print/V4/13/putnam-r.html>.
Putnam, RD (1993b), Making Democracy Work, Civic Traditions in Modern Italy.
Princeton University Press, Princeton, New Jersey.
Putnam, RD (1995), Bowling Alone: America's Declining Social Capital, Journal of
Democracy 6, January.
Putnam, RD (1996), The Strange Disappearance of Civic America, in The American
Prospect, vol 7, no. 24. Available [online]:
<http://www.prospect.org/print/V7/24/putnam-r.html>.
Putnam, RD (2000), Bowling Alone: The Collapse and Revival of American Community,
Simon & Schuster: New York.
Saguaro Seminar (2001) Executive Summary, The Social Capital Community
Benchmark Survey, Available [online]:
<http://www.ksg.harvard.edu/saguaro/communitysurvey/docs/
exec_summ.pdf>.
Salvaris, M (2000), Community and Social Indicators: How Citizens can measure
progress. Institute for Social Research, Swinburne University of Technology,
Melbourne.
Scott, J (2000), Social Network Analysis: A Handbook, 2nd Edition, Sage Publications,
London.
Siahpush, M & Singh, G (1999), Social integration and mortality, Australian and New
Zealand Journal of Public Health, 23 (6), pp. 571–577.
RE F E R E N C E continued
A B S • ME A S U R I N G SO C I A L CA P I T A L , A N A U S T R A L I A N FR A M E W O R K A N D I N D I C A T O R S • 1 3 7 8 . 0 • 2 0 0 4 15 3
B I B L I O G R A P H Y continued
Siisianinen, M (2000), Two Concepts of Social Capital: Bourdieu vs. Putnam, Paper
presented at ISTR Fourth International Conference "The Third Sector: For What
and for Whom?" July, Dublin. Available
[online]:<http://www.jhu.edu/~istr/conferences/dublin/workingpapers/siisiaine
n.pdf>.
Stone, W (2001), Measuring social capital: Towards a theoretically informed
measurement framework for researching social capital in family and
community life. Research paper No. 24, Australian Institute of Family Studies,
Melbourne.
Stone, W (2003), Ageing, Social Capital and Social Support: submission by the
Australian Institute of Family Studies to the House of Representatives
Committee on Ageing. AIFS, Melbourne.
Stone, W, Gray, M, Hughes, J (2003), Social Capital at Work: how family, friends and
civic ties relate to labour market outcomes, AIFS, Melbourne.
Stone, W, & Hughes, J (2001), Sustaining Communities: An empirical investigation of
social capital in regional Australia. Paper presented to SEGRA 2001 Fifth
National Conference. Available [online]:
<http://www.aifs.org.au/institute/pubs/papers/stone4.html>.
Stone, W, & Hughes, J (2002), Social Capital: Empirical meaning and measurement
validity. Research Paper No. 27, Australian Institute of Family Studies,
Melbourne.
Swinbourne Institute for Social Research (2002), Community Participation and
Planning in Surf Coast. Available [online]:
<http://www.sisr.net/programcsp/occasionalpapers/surfcoast/.html>.
United Nations Development Programme (UNDP) (2003), Human Development Report.
Universal Declaration of Human Rights. Available [online]:
<http://www.un.org/Overview/rights.html>.
Vinod, T et al. (1999), Development in the Balance: Equality and Sustainability at
Century's End, World Bank Institute, Washington, DC.
Vogel, J, Amna, E, Munck, I, Hall, L (2003), Associational Life in Sweden: General
Welfare, Social Capital, Training in Democracy. Statistics Sweden, Living
Conditions Report no. 101, an abridged version of the Swedish language report
(no. 98).
Wei, H (2001), Measuring the Stock of Human Capital for Australia, Paper presented at
the 30th Conference of Economists, Perth, Australia.
Woolcock, M (1998), Social capital and economic development: toward a theoretical
synthesis and policy framework, Theory and Society; 27 pp. 151–208.
Woolcock, M (2000), Social Capital and Its Meanings, Canberra Bulletin of Public
Administration, no. 98, pp. 17–19.
World Bank (2002), Module in Civic Participation in National Governance. Available
[online]:
<http://www.worldbank.org/wbi/communityempowerment/Modules/National_
Governance.html>.
World Bank (2003), The Social Capital Assessment Tool — Social Capital and Collective
Action. Available [online]: <http://www.iris.umd.edu/socat/topics/collact.htm>.
Zubrick, S, Williams, A, Silburn, S, Vimpani, G (2000), Indicators of Social and Family
Functioning, Department of Family and Community Services, Canberra.
RE F E R E N C E continued
15 4 A B S • ME A S U R I N G SO C I A L CA P I T A L , A N A U S T R A L I A N FR A M E W O R K A N D I N D I C A T O R S • 1 3 7 8 . 0 • 2 0 0 4
B I B L I O G R A P H Y continued

Subscription Services, ABS, GPO Box 2796Y,Melbourne Vic 3001
POST
03 9615 7848FAX
1300 366 323PHONE
ABS subscription services provide regular, convenient andprompt deliveries of ABS publications and products as theyare released. Email delivery of monthly and quarterlypublications is available.
W H Y N O T S U B S C R I B E ?
Client Services, ABS, GPO Box 796, Sydney NSW 2001POST
1300 135 211FAX
1300 135 070PHONE
Data already published that can be provided within fiveminutes will be free of charge. Our information consultantscan also help you to access the full range of ABSinformation—ABS user pays services can be tailored toyour needs, time frame and budget. Publications may bepurchased. Specialists are on hand to help you withanalytical or methodological advice.
I N F O R M A T I O N S E R V I C E
For the latest figures for National Accounts, Balance ofPayments, Labour Force, Average Weekly Earnings,Estimated Resident Population and the Consumer PriceIndex call 1900 986 400 (call cost 77c per minute).
DIAL-A-STATISTIC
For current and historical Consumer Price Index data, call1902 981 074 (call cost 77c per minute).
CPI INFOLINE
A range of ABS publications is available from public andtertiary libraries Australia-wide. Contact your nearest libraryto determine whether it has the ABS statistics you require,or visit our web site for a list of libraries.
LIBRARY
www.abs.gov.au the ABS web site is the best place tostart for access to summary data from our latestpublications, information about the ABS, advice aboutupcoming releases, our catalogue, and Australia Now—astatistical profile.
INTERNET
F O R M O R E I N F O R M A T I O N . . .
© Commonwealth of Australia 2004Produced by the Australian Bureau of Statistics
ISBN 0 642 47937 22137800001031
RRP $10.00
13
78
.0"
•IN
FO
RM
AT
IO
N
PA
PE
R:
ME
AS
UR
IN
G
SO
CI
AL
CA
PI
TA
L,
AN
A
US
TR
AL
IA
N
FR
AM
EW
OR
K
AN
D
IND
IC
AT
OR
S•
20
04