Embed Size (px)
Citation preview

AN AUTOMATED AND INTEGRATED MONITORING PROGRAM FOR DIAMOND VALLEY LAKE IN
CALIFORNIA
19 – 22 March 2001 Orange, California, USA K-1
AN AUTOMATED AND INTEGRATED MONITORINGPROGRAM FOR DIAMOND VALLEY LAKE IN CALIFORNIA
Michael A. Duffy, Chris Hill, and Cecilia WhitakerMetropolitan Water District of Southern California, Glendora, California, U.S.A.
Adam Chrzanowski, James Lutes, and Geoffrey BastinDepartment of Geodesy and Geomatics Engineering
University of New Brunswick, Fredericton, New Brunswick, Canada
Abstract
The Metropolitan Water District of Southern California has constructed a new reservoir,
Diamond Valley Lake, near Hemet, California. This project includes three large earth/rock
dams of 2.9 km, 3.2 km and 0.8 km lengths, up to 85 m high, enclosing a valley approximately
7.2 km long and 3.2 km wide. When filling is complete, the reservoir will hold over 986 million
cubic metres of water.
A plan was developed to monitor the effects of reservoir and dam loads on the dams and their
foundations to ensure that any adverse conditions that develop during operation, and especially
during initial filling, are detected as soon as possible. Since Diamond Valley Lake is located in
a seismically active area, the dam deformation monitoring (DDM) program is supplemented by
an on-site GPS area monitoring network that is connected to the continuously operating (GPS)
reference stations (CORS) of Southern California crustal motion monitoring system.
The DDM plan, in addition to routine visual inspection, consists of:
• geotechnical monitoring instrumentation consisting of piezometers, strong motion
accelerographs, weirs, inclinometers, and extensometers, supported by the Automated
Data Acquisition System (ADAS);
• a real-time GPS monitoring system; and,
• an automated terrestrial geodetic monitoring system consisting of eight permanently
installed robotic total stations and an array of 228 prisms mounted on the faces of the
monitored structures.
The geodetic DDM system detects displacements larger than 10 mm at the 95% confidence
level. The total stations are remotely operated and automatically collect three-dimensional
positioning data on a set time schedule from which displacements are determined and plotted.
The collection and analysis of the geodetic data is accomplished in a fully automatic mode by
DIMONS software developed at the University of New Brunswick.
The automatic monitoring system has been fully operational since October 2000.
OPENING SESSION AND KEYNOTE PRESENTATION
K-2 The 10th FIG International Symposium on Deformation Measurements
1. Introduction
1.1 Overview of the Project
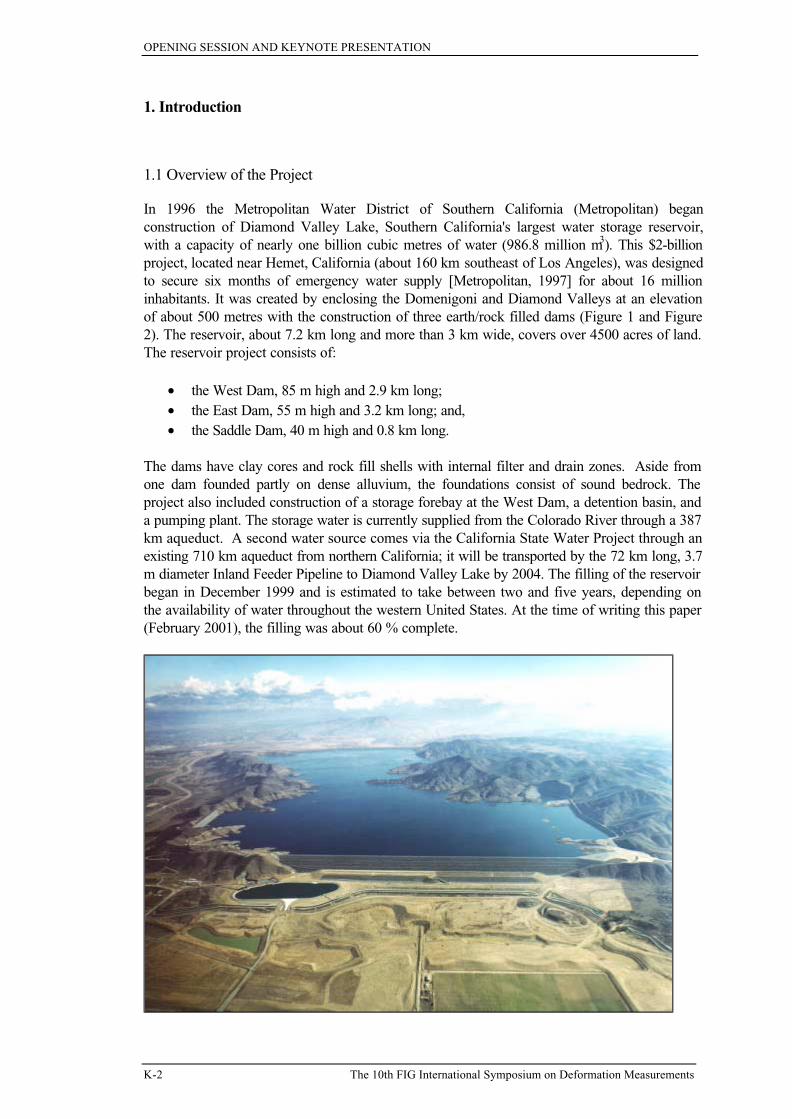
In 1996 the Metropolitan Water District of Southern California (Metropolitan) began
construction of Diamond Valley Lake, Southern California's largest water storage reservoir,
with a capacity of nearly one billion cubic metres of water (986.8 million m3). This $2-billion
project, located near Hemet, California (about 160 km southeast of Los Angeles), was designed
to secure six months of emergency water supply [Metropolitan, 1997] for about 16 million
inhabitants. It was created by enclosing the Domenigoni and Diamond Valleys at an elevation
of about 500 metres with the construction of three earth/rock filled dams (Figure 1 and Figure
2). The reservoir, about 7.2 km long and more than 3 km wide, covers over 4500 acres of land.
The reservoir project consists of:
• the West Dam, 85 m high and 2.9 km long;
• the East Dam, 55 m high and 3.2 km long; and,
• the Saddle Dam, 40 m high and 0.8 km long.
The dams have clay cores and rock fill shells with internal filter and drain zones. Aside from
one dam founded partly on dense alluvium, the foundations consist of sound bedrock. The
project also included construction of a storage forebay at the West Dam, a detention basin, and
a pumping plant. The storage water is currently supplied from the Colorado River through a 387
km aqueduct. A second water source comes via the California State Water Project through an
existing 710 km aqueduct from northern California; it will be transported by the 72 km long, 3.7
m diameter Inland Feeder Pipeline to Diamond Valley Lake by 2004. The filling of the reservoir
began in December 1999 and is estimated to take between two and five years, depending on
the availability of water throughout the western United States. At the time of writing this paper
(February 2001), the filling was about 60 % complete.

AN AUTOMATED AND INTEGRATED MONITORING PROGRAM FOR DIAMOND VALLEY LAKE IN
CALIFORNIA
19 – 22 March 2001 Orange, California, USA K-3
Figure 1. Oblique view of the Diamond Valley Lake.
1.2 Performance Monitoring Program
A program of performance monitoring has been established in order to confirm that the dams
and foundations are functioning as intended. The principal aspects to this are the seepage
performance and deformation of the dams, as a result of the water load on the structures.

OPENING SESSION AND KEYNOTE PRESENTATION
K-4 The 10th FIG International Symposium on Deformation Measurements
The seepage performance of the dams is monitored using piezometers, which measure water
pressure inside the structure and with seepage weirs, which measure seepage water at certain
points downstream of the structures. The deformation performance of the dams and
foundations is measured using settlement gages, inclinometers, and survey monuments on the
surface of the structures. The response of the dams to earthquake loading will be measured
using accelerographs located on natural ground downstream of the dams, and on abutments
and crests of the dams.
1.3 Geotechnical Monitoring Program
The geotechnical instrumentation includes the seepage monitoring instruments (piezometers and
seepage weirs), and local deformation instruments (settlement gages, inclinometers, and
accelerographs).
Vibrating wire type piezometers were embedded in the fine-grained core zone of the dam to
measure pore water pressures in this zone. The levels of pore water pressures in the core
zone can be critical to embankment stability during construction, when pore water pressure
builds up as embankment fill is placed above. In addition, pressures in the alluvial foundation
were measured to assure that high pore pressures in this zone would not create slope instability
for the partially constructed dams.
Open well and Casagrande piezometers were installed in the coarser pervious zones
Figure 3. Typical distribution of the instruments in one of the dam cross

AN AUTOMATED AND INTEGRATED MONITORING PROGRAM FOR DIAMOND VALLEY LAKE IN
CALIFORNIA
19 – 22 March 2001 Orange, California, USA K-5
downstream of the core. These piezometers allow monitoring of the performance of the
impervious zones and foundation cutoffs, as well as the performance of the free-draining
downstream zones. Anomalous behavior of these piezometers might be indicative either of an
unexpected increase in seepage quantity through the impervious zones, or of the inability of the
drainage zones to carry the seepage, either of which may be an indication of developing
problems.
Seepage weirs have been installed downstream of the dams. The seepage weirs do not
measure all the seepage that passes through the dams or foundation, but the quantity of
seepage measured in the weirs, and the rate of change of the seepage quantity, provides an
indicator whether the dams and foundations are performing properly. In addition, the weirs are
fitted with turbidimeters that measure the seepage turbidity. Turbid seepage is an indicator that
fine-grained particles are showing up in the seepage, and would be an indicator of potential
problems developing internally.
The geotechnical instrumentation array includes 189 piezometers, 15 strong motion
accelerographs, 3 inclinometers, 74 settlement sensors, 4 fixed embankment extensometers and
16 weirs. The instruments have been grouped mainly along selected cross-sections of the three
dams. Figure 3 shows a typical distribution of the instruments in one of the dam cross-sections.
1.4 Geodetic Monitoring Program
The geodetic monitoring plan was developed to monitor the response of the dams and
foundations to the gravitational load of the dam and reservoir to ensure that any adverse
conditions that develop during operation, and especially during initial filling, are detected as
soon as possible.
The area of Diamond Valley Lake is located only a few miles south of the San Jacinto fault, a
tributary fault to the San Andreas fault, within the interaction zone between the North
American and Pacific tectonic plates. Therefore, in designing the dam deformation monitoring
surveys one had to consider not only loading effects of the reservoir and gravitational
settlement of the dams but also effects of earth crustal movements in this seismically active
area. Thus, in order to be able to discriminate between various factors affecting the integrity of
the dams, the local dam monitoring schemes must be supplemented by a geodetic network to
monitor the stability of the ridgelines and mountain slopes around the reservoir. The area
geodetic control network has been connected to the existing regional GPS network of
continuously operating reference stations (CORS) of the Southern California Integrated GPS
Network (SCIGN), which monitors the earth crust movements [Bock et al., 1997]. Thus the
monitoring scheme comprises:
1. The local Dam Deformation Monitoring (DDM) system (the local geotechnicalDDM system and the local geodetic DDM system).
2. The on-site GPS area control network for monitoring the stability of the areasurrounding the reservoir and for checking and updating positions of DDMreference stations.
3. The regional GPS control network connecting DDM and on-site area geodeticmonitoring systems with the CORS stations of SCIGN.
The local geodetic DDM information is required as a part of a Metropolitan Safety of Dams
report to the California Division of Safety of Dams (DSOD) within the Department of Water

OPENING SESSION AND KEYNOTE PRESENTATION
K-6 The 10th FIG International Symposium on Deformation Measurements
Resources. The DSOD requires monitoring of all facilities that are under their jurisdiction.
According to the existing state approved programs, the Diamond Valley Lake structures have
been monitored weekly, beginning with the construction of the first berm and continued
throughout the duration of the earthen dam construction period. The same monitoring
frequency will continue during the initial filling period of the reservoir over the course of several
years. Monitoring will then be reduced to quarterly surveys for a period of 5 years, or until the
structures are stabilized, and then probably reduced to twice yearly in accordance with a State
approved monitoring program for these facilities.
This paper, after a general overview of the monitoring scheme, gives details on the design,
installation, and evaluation of a fully automated geodetic DDM system.
2. Overview of the Deformation Monitoring Scheme
2.1 Regional and On-site Area Monitoring Networks
The regional control network of the monitoring scheme includes four continuously operating
GPS stations that are part of the CORS system of 250 such stations monitoring crustal motion
of the continental plates in southern California. Two of the CORS stations are located on the
project site, one near the northwest quadrant and one at the southeast quadrant of the reservoir
(Figure 2). The two remaining stations are several kilometres away. These continuously
operating GPS receivers are administered by SCIGN, a collaboration of scientists (from Scripps
Institution of Oceanography’s Orbit and Permanent Array Center (SOPAC) in La Jolla,
California; the United States Geological Survey’s (USGS) Pasadena Office; and the Jet
Propulsion Laboratory in La Canada, California) studying crustal motion and earthquakes.
SCIGN handles all data processing and analysis of the system and posts daily geodetic positions
for all stations on the Internet. By utilizing this CORS system for the regional control, one is
able to discriminate between the effects of regional crustal motion and on-site area deformation
due to local causes.

AN AUTOMATED AND INTEGRATED MONITORING PROGRAM FOR DIAMOND VALLEY LAKE IN
CALIFORNIA
19 – 22 March 2001 Orange, California, USA K-7
The on-site area control network consists of sixteen standard survey monuments situated on
the two ridgelines surrounding the reservoir (Figure 2). These monuments were initially tied
horizontally to California’s High Precision Geodetic Network (HPGN) NAD83, Zone 6, Epoch
1991.35, and have National Geodetic Survey (NGS) first order elevations established with
respect to the North American Vertical Datum of 1988 (NAVD88). These monuments act
both as a network to monitor stability of the surrounding hills that may be affected by the
increasing load as the water level rises in the enclosed valley, and as area control points for
monitoring the stability of the reference stations of the local geodetic DDM system from which
displacements of object points on the faces of the dams are determined. Utilizing these methods
to monitor the reference monuments of the DDM will avoid contamination of the local dam
displacement measurements with non-structurally related settlement or movement such as
regional slipping and creep.
The initial horizontal positioning of the area control points (HPGN monuments) wasperformed with dual frequency GPS receivers (Trimble 4000Sse and Trimble 4000Ssi) ina static mode using 30 to 60 minute sessions. The duration of the observation sessionswas designed to give relative error ellipses smaller than 10 mm at the 95% confidencelevel. These static sessions were processed together with data downloaded from the fourCORS stations. A least squares network adjustment was performed to obtain geodeticpositions for the sixteen control monuments and for about 30 reference stations of thelocal geodetic DDM system. The network will be measured every year, or after anymajor seismic event. Relative displacements between the two ridgelines that encircle thereservoir, and stability of observing stations and reference points of the local geodeticDDM system, will be determined from the network analysis. The accuracy of the GPSpositioning of the RTS points is summarized in Table 1.
2.2 Local Geodetic
Optimization of accuracy and cost of the geodetic DDM system has been paramount inthe design of the monitoring scheme. Detection of horizontal and vertical displacementslarger than 10 mm at the 95% confidence level, with respect to local reference points,was accepted as the accuracy criterion in designing the DDM scheme. Thus the
Table 1. Accuracy of initial GPS positioning of RTS points
95% Error EllipsesRTS Point Location
a [mm] b [mm]
RTS2 (pt.1760) West Dam 5 4
RTS3 (pt. 1740) West Dam 4 3
RTS4 (pt. 1720) West Dam 5 4
RTS5 (pt. 2720) Saddle Dam 7 5
RTS7 (pt. 3720) East Dam 10 6
RTS8 (pt. 3740) East Dam 5 3
RTS9 (pt. 3760) East Dam 5 3
RTS10 (pt. 3780) East Dam 5 3

OPENING SESSION AND KEYNOTE PRESENTATION
K-8 The 10th FIG International Symposium on Deformation Measurements
maximum semi-axes of the standard error ellipses of a single horizontal positioningshould not exceed 2.9 mm (calculated as 10/2.45√2) and standard deviation of a singlevertical positioning should not exceed 3.6 mm (calculated as 10/1.96√2). To achieve thisaccuracy in a reasonably economical way is not a trivial task. Various geodetictechniques and various configurations of the monitoring scheme were compared andanalyzed for their accuracy and cost. The use of manually operated precision totalstations was compared to the use of robotic total stations (RTS), and the use of GPS withboth manual static and real-time kinematic (RTK) modes of operation. Use of active GPSstations in a continuous mode of operation, use of laser alignment systems, and variouscombinations of the above techniques have also been analyzed. Aside from monitoringtechniques, other factors had to be considered as well, namely: the restriction of humanaccess to the dams after an earthquake, the need for continuous monitoring in emergencysituations, and assurance to the public that the dams are continuously monitored forsafety.
The analysis led to a conclusion that the optimal monitoring scheme should be based mainly on
the use of permanently installed robotic total stations with automatic target recognition and
passive prisms permanently installed on the crests and downstream faces of the dams. This
system has been combined with five continuously operating RTK GPS monitoring stations on
the dam crests, which act as a real-time alarm, and the aforementioned geotechnical
instrumentation. The only data that is collected manually by field survey personnel is from
surveys on the upstream side of the three dams, performed only immediately prior to water
inundation. After the reservoir is full, these monuments will be monitored only as the water
level and schedules allow. Despite the comparatively high initial investment for a system based
on robotic total stations ($1.3-million), about $1.5-million total cost savings over the first five
years of operation will be experienced by Metropolitan. This does not include the number of
other safety advantages previously mentioned.
Leica TCA1800S total stations with automatic target recognition and with a specially calibrated
EDM component were selected as the robotic total stations for the project. They offer standard
deviation of distance measurements of √(1mm)2+(2ppm)
2 and angle measurements (one set in
average atmospheric conditions) of 1.5" [Leica, 1996]. In order to meet the positioning
accuracy criteria, the maximum distances to the object prisms and number of repeated surveys
in each survey campaign had to be optimized as discussed in more detail in the following
sections.
3. Design and Installation of the Geodetic DDM System
3.1 Effect of the Accuracy Criteria on the Design
Selecting the total number of robotic total stations and object prisms was a compromise
between required accuracy and cost. The maximum spacing between the total stations is
limited by the above mentioned accuracy criteria. For example, an angle error of 1.5" will
produce a linear positioning error of 7.2 mm at a distance of 1000 m, even if all other sources
of error (e.g., atmospheric refraction) could be eliminated. To meet the requirement of
obtaining standard error ellipses smaller than 2.9 mm, it was decided to keep the maximum
distances from the total stations to the object prisms at less than 500 m. The angles were to be
observed in a minimum of two sets of direct and reverse measurements to obtain a standard
deviation of observations of 1.1". As far as the distance measurements were concerned, the

AN AUTOMATED AND INTEGRATED MONITORING PROGRAM FOR DIAMOND VALLEY LAKE IN
CALIFORNIA
19 – 22 March 2001 Orange, California, USA K-9
specified EDM instrument accuracy easily satisfied the positional accuracy criteria. These two
components resulted in the desired horizontal positioning error of 2.7 mm at 500 m distances.
Even if the average air temperature would be known only to ±5°C (producing an error of 5
PPM in the observed distance) the positional error in the direction of the observed distance
would be only 2.5 mm over a distance of 500 m. Therefore, from the point of view of random
observation errors, the maximum distances from the total station to the object prisms could be
500 m.
3.2 Effects of Atmospheric Refraction
It was realized that in the semi-arid and generally very hot climate conditions at Diamond
Valley Lake, systematic errors of atmospheric refraction could produce unacceptably large
positioning errors. For example, a constant gradient of temperature across the line of sight of
only 0.1°C/m could produce a positioning error of 10 mm over a distance of 500 m
[Chrzanowski, 1989; Chrzanowski, 1999]. Therefore, in designing the survey procedures,
minimization and randomization of the refraction effects was a major concern.
It was thought, during the design phase of the project, that the minimization of the refraction
effects could be achieved by designing the total station location as high above the ground as
possible (a minimum of 1.5 m) and far from any side obstacles. Observations were also
scheduled to be made during the time of day with the least refraction effects.
In the summer of 1996, Metropolitan performed extensive test surveys with a Leica TCA total
station in similar environmental conditions as those expected at Diamond Valley Lake.
Systematic effects of atmospheric refraction became quite obvious. It was originally thought
that if the surveys were always conducted in the early morning hours, between 3 a.m. and 5
a.m., the effects of refraction on the determination of displacements could become negligibly
small. If those effects became significant at Diamond Valley Lake, the only economical option
would be to randomize the refraction effects by re-observing the vertical and horizontal angles
over two or three nights, in several sets that would be spread each night over 3-4 hours.
A possibility of installing instrumentation for measurements of gradients of temperature and
applying corrections to the observed directions was also considered [Chrzanowski, 1999] but
would have significantly increased the cost of the project.
Another possible way to reduce atmospheric refraction effects on angle measurements was to
add more total stations to the observation scheme to shorten the maximum observation
distances. Since the error of refraction is proportional to the square of the distance, by
shortening the distances to 250 m, one could reduce the refraction effect by a factor of four.
This option, however, was discarded due to its high cost. It was finally decided to keep the
maximum distances to the targets less than 500 m. The actual results of the monitoring surveys
would be evaluated after two to three months of system operation, with the possibility of
introducing modifications to the observation scheme.
3.3 Design of the Configuration of the Monitoring Network
By accepting 500 m as the maximum allowable distance between an RTS and its targets on a
dam face, the monitoring scheme includes eight permanently mounted RTSs (Figure 2), 228
object targets (prisms) mounted on concrete pillar monuments (Figure 4), and five continuously
operational GPS monitoring stations on the crests of the dams (Figure 2). The DDM station

OPENING SESSION AND KEYNOTE PRESENTATION
K-10 The 10th FIG International Symposium on Deformation Measurements
array has been designed to keep all distance measurements at 500 m or less. Three reference
back sight targets were installed and included into the observation scheme at each RTS. One of
the reference targets serves as the main orientation reference and the others are used as
control points for monitoring the stability of the RTS station and the main reference target.
Some of the reference points are common for two neighboring RTSs. Figure 5 shows, as an
example, locations of total stations, reference targets and object prisms at the West Dam.
Similar configurations were designed at the other structures.
Figure 4. Pillar monuments with the target prisms.
The West Dam and East Dam have three and four permanently mounted robotic total stations,
respectively, and two GPS monitoring stations each. The Saddle Dam has one permanently
mounted robotic total station and one GPS monitoring station. The fill portion of the detention
basin is monitored by the two southerly East Dam RTSs. The forebay is monitored using the
northerly West Dam total station. The target monument spacing is 152 m (500 ft) on each of
the dam berms, at the toe of the dams, on the crest of the forebay, and on the crest of the
detention basin. The monument spacing is 76 m (250 ft) on the crest of the dams.
All 360 upstream and downstream survey monuments were installed by January 2000.The radio communication and computer systems were installed and operating by mid-September 2000. With the completion of all eight total station shelters, the three dams,forebay and detention basin have been automatically monitored since mid-October2000.

AN AUTOMATED AND INTEGRATED MONITORING PROGRAM FOR DIAMOND VALLEY LAKE IN
CALIFORNIA
19 – 22 March 2001 Orange, California, USA K-11
Figure 5. Observation scheme at the West Dam.
3.4 Meteorological Equipment
The meteorological sensor module ENV-50-HUM from Sensor/Metrics, Inc. was selected for
measurements of temperature, barometric pressure, and relative humidity for the reduction of
EDM data at each RTS location. The module has a durable weatherproof case that is easily
mounted on poles, beams, or rooftops. It provides temperature measurements between –40°C
and +50°C with an accuracy of ±0.5°C, barometric pressure between 930 mb and 1070 mb
with ±2 mb accuracy, and humidity between 0% and 100% RH with ±5% accuracy. It can be
connected to any PC or modem to collect and display real-time data. The module sensors were

OPENING SESSION AND KEYNOTE PRESENTATION
K-12 The 10th FIG International Symposium on Deformation Measurements
tested and calibrated at the University of New Brunswick (UNB). The software to interface
with the meteorological sensors was developed by UNB. For this project, the modules have
been equipped with two temperature sensors, one for measurement of the internal temperature
of the RTS shelter, and another for measurement of the outside air temperature for distance
reductions.
3.5 Design and Construction of Observation Shelters
Each RTS with its computer equipment, meteorological sensors, communication radio, and
power supply are housed in an observation shelter (Figure 6). The observation shelters were
designed to be small (10 ft x 10 ft) square buildings with windows on all sides. The
configuration of the windows provides a view of all the monuments to be observed from each
total station. The windows are dual pane glass with a 14% gray tint to help reduce the heat
inside the structures. A heat conveyance fan on the insulated roof of the structures draws
cooler air in from vents at the bottom of the structure. Windows are approximately 6 ft high to
allow for a line of sight to points on top of the dam.
Figure 6. RTS observation shelter.
Calculations and laboratory tests at UNB have shown that distance measurements at Diamond
Valley Lake will have errors of +6.4 mm to +7.8 mm, depending on the incidence angle of the
electromagnetic signal on the glass panel, while the line of sight in direction measurements will
be shifted from 0 mm at an incidence angle of 0° to 3 mm at an incidence angle of 40°. Since
the glass errors are constant for repeated sightings to object prisms, their effect cancels out in
the determination of target displacements.
Due to the remote locations of the structures, all equipment is run by DC power from solar
panels located adjacent to the shelters. The solar panels charge three batteries that can supply
power to all the equipment for five days without recharging. Solar power allows for an

AN AUTOMATED AND INTEGRATED MONITORING PROGRAM FOR DIAMOND VALLEY LAKE IN
CALIFORNIA
19 – 22 March 2001 Orange, California, USA K-13
independent station and communication network that does not rely on other utilities in times of
emergency.
The foundation of the shelters was designed according to the geology of each location to
provide good structural stability. The pillar that each RTS is mounted on is monolithic with the
foundation of the structure. A GPS antenna can be mounted to a structural support on the roof
of each shelter (Figure 7), directly above the center of the instrument using an optical plummet
so that the stability of the foundation/pillar can be monitored by the annual area GPS control
surveys (see Section 2.1 above). In addition, three levelling benchmarks are installed on each
foundation slab to monitor vertical stability and tilting, if needed.
3.6 Geodetic Data Communication Network
Each total station requires a dedicated computer for the
remote access capability, for controlling functions of the
total station, and for data storage. This computer
configuration consists of an industrial computer (capable of
operating at 55°C), an Ethernet card, surge protection,
external rebooter, and remote monitoring and accessing
software. The computer is a Pentium 233Mhz computer
sealed from dust and insects in a metallic case with two
internal cooling fans. The computers are mounted to the
southerly, shaded, wall of each shelter to protect them
from direct sunlight. The computer has multiple serial ports
for directly connecting both the total station and the
meteorological sensors. A Compaq server was installed
on-site at a small air-conditioned building just south of the
new pumping plant known as the Radial Gate Structure
(RadGat) to act as the data backup and processing hub. This is the entry point to and from the
Metropolitan Wide Area Network.
Data communication and remote access between the on-site PCs running the total stations and
the Metropolitan computer network has been accomplished using 17 BreezeCom spread
spectrum radios, creating a wireless LAN system covering over 15 square miles at the site.
Each shelter has one Station Adapter (SA) radio with a small antenna aimed at the closest
Access Point (AP) radio using a whip antenna. The five AP radios are situated on the three
dam crests to act as wireless hubs and perform relay functions between the eight shelter radios
and the four Workgroup Bridge (WB) radios. The four WB radios provide connectivity for the
longer distance data transfers (from two to six miles) that require larger parabolic grid
antennas.
3.7 DIMONS Software for Automatic Data Collection and Processing
All functions of RTSs, remote data collection, and automatic processing are controlled by
DIMONS (Displacement Monitoring System) software developed at UNB in cooperation with
A. Chrzanowski & Associates, a consulting company in Canada. Details on DIMONS are
given in another paper of this symposium [Lutes at al., 2001]. Here, only the main
characteristics of DIMONS and its application to the Diamond Valley Lake project are given.
Figure 7. Choke ring antenna on observation shelter roof.

OPENING SESSION AND KEYNOTE PRESENTATION
K-14 The 10th FIG International Symposium on Deformation Measurements
1. DIMONS is made up of several key components, each handling specific tasks related to
project management, data collection, and analysis. Every component must be set up on all
computers which will be used in the monitoring surveys.
2. Every RTS and meteorological sensor module must be controlled by a host computer.
Each host computer may be accessed directly or via a network connection.
3. DIMONS can handle the collection and processing of data collected by any number of
RTSs. Each RTS, set up on a survey point, makes observations of distances, horizontal
directions and vertical angles to a set of survey points with target prisms. These target
points include object stations (which are expected to possibly move over time) and
reference stations (which are expected to remain stable over time).
4. The core of the system is the database, where most defining parameters of a monitoring
project are stored. A separate database is maintained for each project defined on the
system. The Windows system registry is used by DIMONS to store settings required to
access the databases
5. Observation sequences, as stored in the database, may be initiated manually by a user at
any time, or programmed to execute at any time. The Windows task scheduling service is
used to trigger all automated observations.
6. Data collected during observation sessions is stored on the host that controls the data
collection. This data may be transferred to a central computer, again manually or by a
predefined schedule.
7. All observations are processed for direction station adjustments, EDM meteorological
corrections, and calculation of survey point coordinates. In addition, DIMONS will
perform an iterative weighted similarity transformation (IWST) to detect any instabilities in
the fixed reference survey points [Chen et al., 1990].
4. Automated Collection and Processing of the DDM Data
4.1 Initial Positioning of RTSs and Reference Points
Horizontal positions of all 8 RTS stations and their main reference points were obtained from
the initial survey campaign (October 2000) of the on-site area GPS network as described in
Section 2.1 above. The coordinates of each RTS were obtained by including into the on-site
area network GPS receivers centered above the RTS pillars. They will be checked once each
year or after any significant seismic event. Determination of the absolute vertical elevations,
initially needed on the DDM system, was accomplished by geodetic levelling from the first
order benchmarks located along two highways at the east and west ends of the project.
4.2 Monitoring Surveys
Though initial coordinates of all RTSs have been determined in the coordinate system of the
on-site area network, each RTS survey point with its set of observed object and reference
survey points are treated in the displacement monitoring process as an independent local
network in its own local coordinate system. The displacements of any object target point are
AN AUTOMATED AND INTEGRATED MONITORING PROGRAM FOR DIAMOND VALLEY LAKE IN
CALIFORNIA
19 – 22 March 2001 Orange, California, USA K-15
computed based on its movement with respect to the RTS point and the reference target
points. Because of the distorting effects of the glass windows on the lines of sight, a rigorous
relationship between the local coordinate systems of individual RTS sub-networks is difficult.
Nevertheless, the differences are negligibly small in calculating displacements of the targets,
which may be observed from two different RTS stations.
The eight total stations are linked to a computer system network that automatically and
remotely controls all functions using the DIMONS software. This allows for remote power-up
(especially useful in emergencies), remote download, and real-time measurement as needed.
The system operates on a set time schedule (currently, two cycles of observation sets per day,
at 4 am and 12 noon) that automatically activates the RTS and the observation process. The
total stations are programmed to collect a prescribed number of sets of observed horizontal and
vertical directions and distances to all or selected sub-group of reference and object targets.
Measurements of air temperature (both internal and external), barometric pressure and
humidity at each total station are automatically recorded and used for distance reductions.
When collection of the observation data in the given cycle is complete, the system automatically
shuts down and is basically “on-call” until the next scheduled power-up. In the case of
emergency, the DDM can be activated by designated Safety of Dams or Survey personnel via
the Metropolitan Wide-Area Network or any of the automated monitoring systems within the
aforementioned ADAS.
All RTS procedures can be controlled from a Metropolitan office that is connected to the
Metropolitan Wide Area Network by a remote link through pcAnywhere. The remote controls
include scheduling the remote power-up, giving commands for the measurements of selected
angles and distances, and establishing the number of sets of measurements in a given cycle of
observations. The data collection, downloading of raw data, backup of files, and processing of
raw data is performed automatically within the DIMONS software.
A set of tolerance criteria must be defined. This includes the minimum and maximum number
of sets to perform, and the maximum allowable value of residuals from the station adjustments.
Currently, a minimum of two sets of observations are collected in each cycle. If any of the
residuals of the station adjusted directions exceeds 3″, additional sets are taken.
4.3 Data Processing
After a full cycle of data has been collected, the raw distances are first corrected for the RTS
and target additive constants, and for any RTS scale bias. Next, the measured atmospheric
conditions are used to perform a velocity correction on the distances. After this, the sets of
observations are combined using a least squares set adjustment. Finally, the combined
observations are corrected for the effect of instrument and target heights above the survey
points. The field observations are now reduced mark-to-mark and ready for use in coordinate
calculations.
Mark-to-mark reduced observations are used to calculate coordinates for all of the observed
points. The coordinates of one fixed point and the azimuth to one of the targets are used to
define the coordinate system. These computed coordinates are considered preliminarycoordinates because they have not been screened for the possible effect of any unstable
reference points.
A subset of the observed points is indicated to be a set of reference (stable) points by the
user. The computed preliminary coordinates are then compared to the coordinates obtained
OPENING SESSION AND KEYNOTE PRESENTATION
K-16 The 10th FIG International Symposium on Deformation Measurements
from a specified base cycle , and a check is performed to determine whether any of the
reference points show significant movement. This step is known as unstable point detection,
and is an important part of the overall computations. The IWST of displacements [Chen et al.
1990] is used in the identification of the unstable reference points.
Finally, coordinates of all stable reference points (including the RTS point if identified as being
stable) are treated as constrained stations in the calculation of the final coordinates of the
object points.
After final point coordinates have been computed for an observation cycle, it is useful to
generate a displacement plot. The displacement plot can reveal deformation trends, and is a
useful diagnostic tool to determine whether the computed displacements are significant in a
statistical sense.
There may be locations where observations are made from more than one RTS. In this case,
the location is denoted by more than one survey point and target. In this manner, a named
target point has its position determined in more than one coordinate system. The displacements
of the location as computed from a pair of measurement cycles may be compared for the
purpose of accuracy evaluation of the monitoring system (see Section 6.1)
5. Emergency Response Plan
The on-site CORS, the GPS object stations and the RTSs are linked to an Automatic Data
Acquisition System (ADAS), designed by consultants for Metropolitan, for the geotechnical
instrumentation data collection. If a movement over a certain tolerance is picked up by the GPS
monitoring system, or if any of the geotechnical instruments monitored through the ADAS
exceeded expected limits, the DDM total stations are programmed to automatically turn on and
start monitoring the dams. This provides near instantaneous response time, particularly
important in case of a seismic event.
The emergency power-up may occur in several ways. There are four methods of alarming built
into the operations of the instrumentation of the dams. ADAS has the capability to send an
alarm if a preset tolerance for any of the designated instruments is exceeded. The instrument
types integrated into the alarming system will be the five GPS object stations on the crests of
the dams, strong motion accelerographs, seepage flow meters, and the facility operators system
known as SCADA. The DDM system of total stations, linked to the ADAS system and
capable of receiving these alarm notifications, will be automatically powered up upon receipt of
notification. The total stations of the DDM system can also be remotely powered on by
Metropolitan staff using any PC on the Metropolitan computer network, through the data
communication system, or from home with proper access privileges.
Within the first day after an event, a GPS static survey will be started to verify positions of the
eight RTSs and their back sight reference points. This survey will be completed with eight
geodetic receivers, utilizing the four CORS stations, five active GPS object stations, and
manually collected GPS data on the RTSs and reference points of the DDM system. Receivers
will be connected to the antennas on the observation shelters, while special brackets have been
designed to attach GPS antennas above the prisms located on the main back sight reference
points. RTS observations to the back sight reference points can also be added to the analysis of
the network stability.

AN AUTOMATED AND INTEGRATED MONITORING PROGRAM FOR DIAMOND VALLEY LAKE IN
CALIFORNIA
19 – 22 March 2001 Orange, California, USA K-17
The second day after an event, GPS measurements will be manually collected on the sixteen
onsite (ridgelines) control monuments along with the four CORS stations. By the second day
after an event new coordinates of the CORS stations (as determined and posted by SCIGN)
will be available and analysis of the first day of GPS will be completed. At this point in time,
one will be able to compare new positions of the RTSs and reference back sights with the
previous positions very precisely.
By the third day after an event, one should be able to complete the analysis that will verify the
geodetic positions of all the DDM RTSs and back sights, the HPGN onsite monuments and the
GPS object stations. This information will be compared with previous positions to determine if
there are any significant displacements of any of these monuments. This information will then
be used to identify any unstable reference and onsite ridgeline points and perform deformation
trend analysis using the IWST of the displacements [Chen et al., 1990]. The trend analysis will
be followed by integrated deformation modelling [Chrzanowski et al., 1991] of the dams and
surrounding area using both geodetic and geotechnical data.
6. Preliminary Evaluation of the RTS Monitoring Results
6.1 Overall Accuracy of RTS Monitored Displacements
The automatic DDM system has been fully operational since October 9, 2000. At thetime of writing this report, about three months of data became available. During thattime, no irregular behaviour of the three dams has been noticed. This preliminaryevaluation of the accuracy of the DDM system is limited to data collected by the eightRTSs.
In order to randomise effects of atmospheric refraction, the observation cycles havebeen separated by several hours, to occur during both day and night. Initially, thesystem was programmed to perform observations in three cycles per day (4 am, 12noon, 8 pm), three days per week. Since January 15, 2001, after initial evaluation ofrefraction effects, the program of observations has been changed to collect data in twocycles per day (4 am, 12 noon), 5 days per week. For reporting purposes, weeklyaverages of the coordinates of each point are computed from the results of individualcycles. It is planned to revise the schedule after a full evaluation of the system duringthe summer of 2001, when the performance will be tested in the hot weather conditions.
The preliminary accuracy evaluation of the DDM system has been based on comparingdisplacements of those points that are observed simultaneously from two neighbouringRTSs. There are 4 double-observed targets at the West Dam and 6 at the East Dam.Figure 8 shows the West Dam point with targets 1079 and 7079, observed from TS3 andTS2.
The differences of double-observed displacements may be treated as true errors. Bytaking a sufficiently large sample of the true errors of differences, one may estimatestandard deviation of the single (in our case the weekly averaged) observation from:
• = • •(Di
2)/2n (1)

OPENING SESSION AND KEYNOTE PRESENTATION
K-18 The 10th FIG International Symposium on Deformation Measurements
where n is the total number of examined pairs of observations, and Di are differences ofindividual double observations.
A sample of 8 weeks of observations of ten double points taken between December 4,2000 and January 29, 2001 has been used in the evaluation. Following the tolerancerequirement of detecting displacements of 10 mm or larger, the tolerance for thedifference of two independently determined displacements is 14 mm (calculated as10•2). Analysis of the behaviour of dN, dE, and dH components (based on weeklyaverages) for ten double points has shown that:
1. Of 216 double observations, three differences (all dH components) exceeded the14 mm tolerance.
2. Three dH components exceeded, with differences of 15 mm, 19 mm, and 21mm.3. 98% of determined displacements fall within the designed tolerance.
Figure 8. Example of a double-observed point.
Following from Equation (1) and the 216 available observations to double points, thestandard deviations of single displacement components (based on weekly averages),became:
•dN = 1.3 mm; •dE = 2.5 mm; •dH = 4.5 mm.
This is a very good result, considering that the double observed points are located at themarginal distances (340 m to 500 m from RTSs) of the networks. Since the doubletargets are located either at the toes or at the crests of the dams, the lines of sight to thosepoints are either close to the ground or along the faces of the dams, thus beingmaximally exposed to large gradients of temperature. One may expect, therefore, thatthe overall accuracy of displacements of all other points should be either equal to orbetter than the accuracy of the double-observed points.
AN AUTOMATED AND INTEGRATED MONITORING PROGRAM FOR DIAMOND VALLEY LAKE IN
CALIFORNIA
19 – 22 March 2001 Orange, California, USA K-19
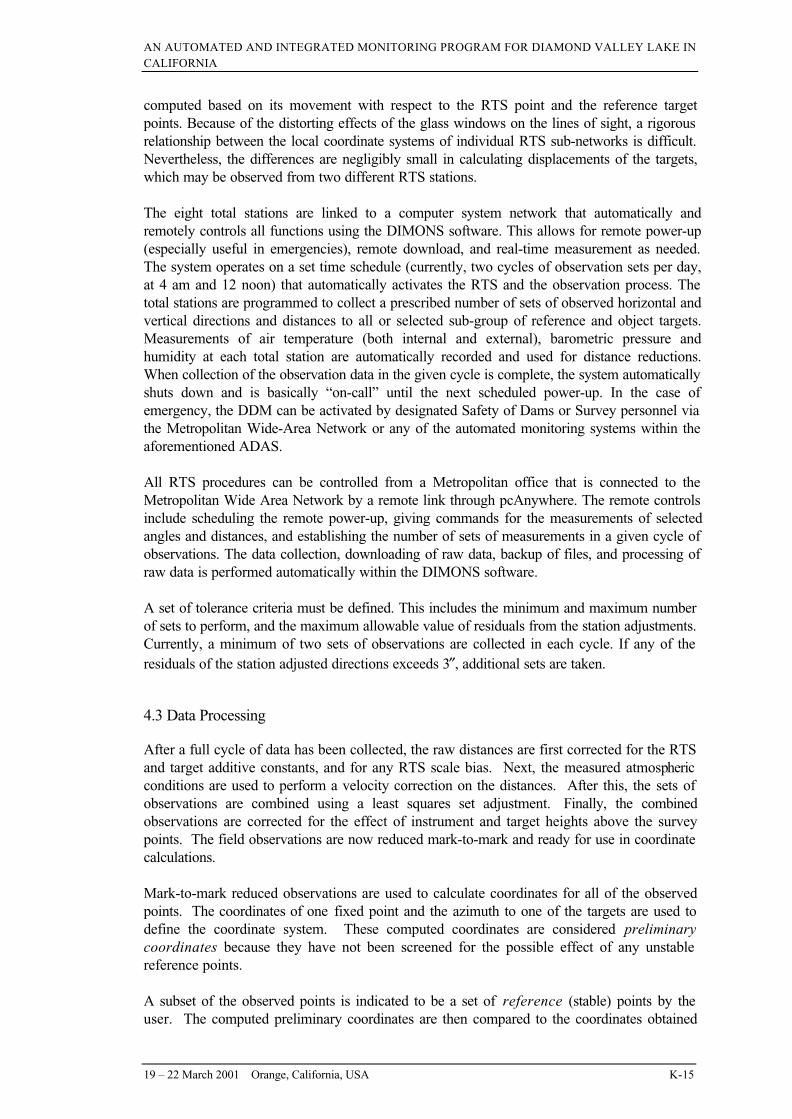
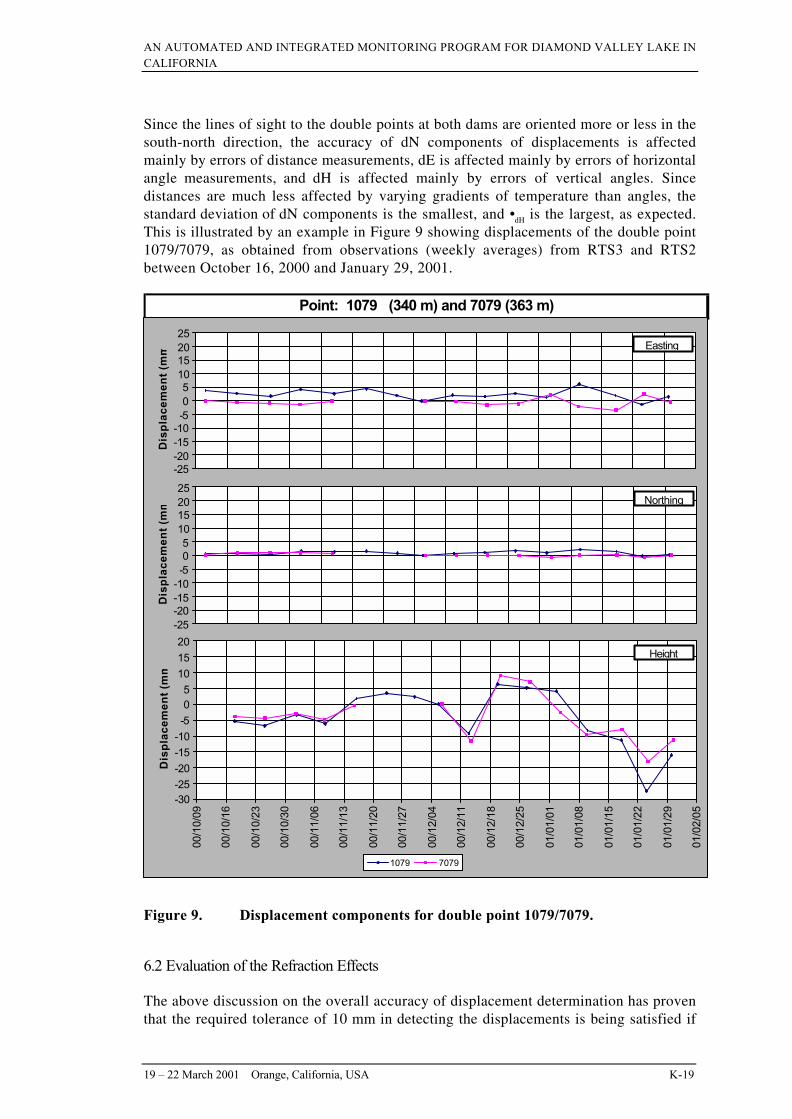
Since the lines of sight to the double points at both dams are oriented more or less in thesouth-north direction, the accuracy of dN components of displacements is affectedmainly by errors of distance measurements, dE is affected mainly by errors of horizontalangle measurements, and dH is affected mainly by errors of vertical angles. Sincedistances are much less affected by varying gradients of temperature than angles, thestandard deviation of dN components is the smallest, and •dH is the largest, as expected.This is illustrated by an example in Figure 9 showing displacements of the double point1079/7079, as obtained from observations (weekly averages) from RTS3 and RTS2between October 16, 2000 and January 29, 2001.
Point: 1079 (340 m) and 7079 (363 m)
-25-20-15-10-505
10152025
Dis
pla
ce
me
nt
(mm
-25-20-15-10-505
10152025
Dis
pla
ce
me
nt
(mm
-30-25-20-15-10-505
101520
00/1
0/09
00/1
0/16
00/1
0/23
00/1
0/30
00/1
1/06
00/1
1/13
00/1
1/20
00/1
1/27
00/1
2/04
00/1
2/11
00/1
2/18
00/1
2/25
01/0
1/01
01/0
1/08
01/0
1/15
01/0
1/22
01/0
1/29
01/0
2/05
Dis
pla
ce
me
nt
(mm
1079 7079
Easting
Northing
Height
Figure 9. Displacement components for double point 1079/7079.
6.2 Evaluation of the Refraction Effects
The above discussion on the overall accuracy of displacement determination has proventhat the required tolerance of 10 mm in detecting the displacements is being satisfied if

OPENING SESSION AND KEYNOTE PRESENTATION
K-20 The 10th FIG International Symposium on Deformation Measurements
10 cycles of early morning and noon observations per week are averaged. Preliminaryresults show, however, that the accuracy of individual cycles is strongly affected bysystematic errors caused by varying temperature gradients. Estimation of the accuracy ofindividual cycles of observations may be of importance in the emergency case whenone would be interested in a determination of the displacements immediately after anunusual event such as earthquake or after an unscheduled cycle of observationstriggered by the alarm system of the Emergency Response Plan.
As expected, the strongest refraction effects occur along the lines of sight that are low tothe ground or along the dam face. The smallest effect is on the lines of sight from RTSsto the top of the dam. The lines from RTS3 to 1079 and from RTS3 to1064 (see Figure8) have been used as an illustration of the two extreme cases. The line RTS3-1079, of atotal length of 340 m, runs almost horizontally about 1.5 m above ground. The lineRTS3-1064, of a total length of 276 m, goes steeply up to the top of the dam with aheight difference of 70 m, thus having the average vertical clearance above the face ofthe dam of several metres. Figures 10 and 11 show the time series of daily changes ofheight at 4 am and 12 noon for points 1079 and 1064 respectively. The two examplesindicate that:
1. In both cases, the noon observations seem to give more consistent results thanthe observations at 4 am.
2. The height changes of point 1079 may reach 50 mm over a few days timeinterval (assuming that no actual deformation takes place) when observing at 4am and 20 mm when observing at noon, while the maximum height changes atpoint 1064 may reach 20 mm during the 4 am observations and 8 mm during thenoon observations.
3. The weekly averages of 4 am vs. 12 noon observations to point 1079 show asystematic bias of about 30 mm. There is no significant bias between 4 am and12 noon results at pt. 1064.
-50
-40
-30
-20
-10
0
10
20
30
40
50
00/1
0/09
00/1
0/16
00/1
0/23
00/1
0/30
00/1
1/06
00/1
1/13
00/1
1/20
00/1
1/27
00/1
2/04
00/1
2/11
00/1
2/18
00/1
2/25
01/0
1/01
01/0
1/08
01/0
1/15
01/0
1/22
01/0
1/29
01/0
2/05
Date
Dis
pla
ce
me
nt
(mm
12 noon 4 am 12 noon (avg) 4 am (avg)

AN AUTOMATED AND INTEGRATED MONITORING PROGRAM FOR DIAMOND VALLEY LAKE IN
CALIFORNIA
19 – 22 March 2001 Orange, California, USA K-21
Figure 10. Comparison of 4 am and 12 noon height determinations for point1079.
One may conclude from Figure 10 that in extreme conditions, the atmospheric refractionmay introduce errors of up to 50 mm in the determination of displacements from asingle cycle of observations taken always at the same time of the day, and up to 70 mmdifference between displacements determined at noon and at 4 am. In the case of point1079, one may show that the systematic bias of 30 mm over the distance of 340 mcorresponds to a change in the vertical gradient of temperature (dT/dH) of 0.6°C/mbetween 4 am and 12 noon. This is a realistic value and agrees very well with results ofinvestigations conducted some years ago at UNB [Chrzanowski, 1989]. One shouldemphasize that the given results correspond to the cool months at Diamond Valley Lake.During that time, the temperatures at noon ranged from 25°C in October to 13°C inJanuary, and the temperatures at 4 am ranged from 12°C in October to 5°C in January.One may expect significantly larger effects during the summer months. For the timebeing, one may accept that, in the emergency situation, the displacements determinedfrom only one cycle of observations will have errors ranging between 10 mm to 70 mmdepending on the location of the point with respect to the observing RTS and dependingon the time of the day.
-50
-40
-30
-20
-10
0
10
20
30
40
50
00/1
0/09
00/1
0/16
00/1
0/23
00/1
0/30
00/1
1/06
00/1
1/13
00/1
1/20
00/1
1/27
00/1
2/04
00/1
2/11
00/1
2/18
00/1
2/25
01/0
1/01
01/0
1/08
01/0
1/15
01/0
1/22
01/0
1/29
01/0
2/05
Date
Dis
pla
ce
me
nt
(mm
12 noon 4 am 12 noon (avg) 4 am (avg)
Figure 11. Comparison of 4 am and 12 noon height determinations for point1064.
The DDM system with its daily observations supplies a wealth of material for studies of
atmospheric refraction effects. Additional evaluation and optimization of the DDM system will
be performed during the summer of 2001.

OPENING SESSION AND KEYNOTE PRESENTATION
K-22 The 10th FIG International Symposium on Deformation Measurements
7. Conclusions
In October, 2000, the fully automated system for monitoring structural dam deformations at
Diamond Valley Lake has been successfully implemented and supplies reliable weekly
information on the displacements of targeted points within the required tolerance of 10 mm at
the 95% confidence level.
The selected instrumentation and DIMONS software have met all the requirements and
expectations of the project.
Effects of atmospheric refraction are being randomized and well controlled by taking
observations at 4 am and 12 noon and by averaging 10 cycles of weekly observations for the
final determination of displacements. Optimal scheduling of observations will be reviewed
during the summer months when final evaluation of the effects of refraction will be made.

AN AUTOMATED AND INTEGRATED MONITORING PROGRAM FOR DIAMOND VALLEY LAKE IN
CALIFORNIA
19 – 22 March 2001 Orange, California, USA K-23
Acknowledgment
We would like to thank all the Metropolitan field staff for their dedicated effort atmonitoring the reservoir during its construction and early filling prior to implementationof the automated system. Your months of precise field work to accurately define baseline measurements for this new system will not soon be forgotten.
References
Bock, Y., et al (1997). “Southern California Permanent GPS Geodetic Array:Continuous measurements of regional crustal deformation between the 1992Landers and 1994 Northridge earthquakes.” J. Geophysical Research, Vol. 102,#B8, pp. 18013-18033.
Chen, Y.Q., A. Chrzanowski, and J.M.Secord (1990). “A strategy for the analysis of thestability of reference points in deformation surveys.” CISM Journal, Vol. 44,No. 2, Summer, pp. 39-46.
Chrzanowski, A., Chen Yong-qi, J.M. Secord, and A. Szostak-Chrzanowski (1991).“Problems and solutions in the integrated monitoring and analysis of damdeformations.” CISM Journal ACSGC Vol. 45, No. 4., pp. 547-560.
Chrzanowski, A., Y.Q. Chen, P. Romero, J.M. Secord (1986). “Integration of geodeticand geotechnical deformation surveys in the geosciences.” Tectonophysics 130(1986), pp. 369-383.
Chrzanowski, A. (1999). “Effects of atmospheric refraction on monitoring verticaldisplacements.” Report submitted to the Metropolitan Water District of S.California, 12 pp.
Chrzanowski, A. (1989). “Implementation of trigonometric height traversing in geodeticlevelling of high precision.” Techn. Report No. 42, Dept. of Geodesy andGeomatics Eng., U.N.B,. 102 pp.
Duffy, M. A., C. Whitaker (1998) “Design of a Robotic Monitoring System for theEastside Reservoir in California.” ACSM Conference, Baltimore, Md. March 2-4,1998, Vol. 1, pp. 34-44.
Leica (1996). “TCS1800 Producer Inspection Certificate - Article #639974/415 datedJune 12, 1996.” Leica Geosystems AG, CH-9435 Heerbrugg (Switzerland).
Lutes, J., A. Chrzanowski, G. Bastin, C. Whitaker (2001).”DIMONS Software forautomatic data collection and automatic deformation analysis.” 10th Int. Symp.on Deformation Measurement, Proceedings (in press).
Metropolitan Public Affairs Division (1997). “Eastside Reservoir Project at a Glance.”Metropolitan Water District (Metropolitan) of Southern California, Los Angeles,California, USA. (http://www.Metropolitan.dst.ca.us/pa/docs/pa.htm).