Embed Size (px)
Citation preview
Catlin Re Switzerland Ltd
AN AXA GROUP COMPANY
Financial Condition Report
Year Ended
December 31, 2018

Contents
Directors' statement 3
Management summary 4
A. Business activities 11
A.1 Strategy, objectives and business segments 11
A.2 Group information and group related transactions 11
A.3 Shareholder 13
A.4 Major branches 13
A.5 External auditor 13
A.6 Significant unusual events 13
B. Business performance 14
B.1 Underwriting result 14
B.2 Investment income and expenses 15
B.3 Other income and expenses 18
C. Corporate governance and risk management 19
C.1 Corporate governance 19
C.2 Risk Management 23
C.3 Internal control system 27
D. Risk profile 29
D.1 Insurance risk 29
D.2 Market risk 32
D.3 Credit risk 34
D.4 Operational risk 36
D.5 Other material risks 38
D.6 Off-balance-sheet risks 41
D.7 Risks transferred to special purpose vehicles 41
D.8 Risk concentrations 41
E. Valuation 43
E.1 Assets 44
E.2 Provisions for insurance obligations 46
E.3 Provisions for other liabilities 47
E.4 Risk margin 47
F. Capital management 48
F.1 Goals, strategy and time horizon for capital planning 48
F.2 Structure and quality of equity capital reported in the annual report 48
F.3 Difference between statutory and solvency net assets 49
G. Solvency 50
G.1 Solvency model 50
G.2 Target capital 50
G.3 Breakdown of risk-bearing capital 53
G.4 Solvency ratio 53
Glossary 54
Appendices 55
1 Quantitative template "Performance solo reinsurance" 56
2 Quantitative template "Market-consistent balance sheet solo" 57
3 Quantitative template "Solvency solo" 58
4 Audited annual financial statements and report of the statutory auditor 59

Directors' statement
The Board of Directors acknowledge their responsibility for ensuring that this Financial Condition Report has beenproperly prepared in all material respects in accordance with FINMA regulations. The Board is satisfied that:
(a) throughout the financial year disclosed in this report, Catlin Re Switzerland Ltd has complied in all material respectswith the requirements of the FINMA regulations as applicable to the Company; and
(b) it is reasonable to believe that, at the date of the publication of this report, the Company has continued to comply,and will continue to comply in future.
This report was discussed and reviewed at the Board Meeting held in Zurich on 15 April 2019 and signed off on April 30,2019.
By order of the Board
Andreas Weber Rhic Webb
Chairman of the Board Director
April 30, 2019 April 30, 2019
3

Management summary
General remarks
This report should be read in conjunction with the Company’s audited financial statements for the year ended December31, 2018 disclosed in appendix 4.
Unless otherwise stated, all amounts in this report are presented in Swiss Francs which is the reporting currency of thefinancial statements of Catlin Re Switzerland Ltd.
Due to the capitalisation and the business environment in which the Company primarily operates, US Dollar is the currencyfor capital modelling and the Swiss Solvency Test. As such numbers reported in sections E, F and G are predominantlypresented in US Dollars.
Amounts shown in this report generally are rounded to the nearest million, with the consequence that the rounded amountsmay not add up to the rounded total in all cases.
On September 12, 2018, the XL Group Ltd ("XL") completed its previously announced merger with AXA SA (“AXA”). As aresult of the merger, the Company’s ultimate owner was XL for the period until September 12, 2018, and after that becameAXA. XL is domiciled in Bermuda and AXA is domiciled in France. AXA will publish its Group Financial Condition Report byJune 3, 2019, and a copy will be available on the AXA website (https://www.axa.com/). Any references to AXA group refer toAXA SA together with its direct and indirect subsidiaries.
As a result of the merger, a new division AXA XL was formed comprising the legacy XL companies and certain existing AXAcompanies. This new division AXA XL is the property, casualty, and specialty division of AXA comprising global insuranceand reinsurance companies that provide property, casualty and specialty products to industrial, commercial andprofessional firms, insurance companies and other enterprises on a worldwide basis. Catlin Re Switzerland Ltd is part of theAXA XL Division.
Business activities
The Company is part of the AXA XL Division within AXA and became a member of the AXA Group during 2018 as describedfurther in the section 'significant unusual events'. AXA XL, through its operating carriers, is a global insurance andreinsurance group of companies and other enterprises situated around the world.
AXA XL’s operating entities underwrite both insurance and reinsurance business within its Property and Casualty (P&C)business segment. The P&C segment is structured into two segments; Insurance and Reinsurance with Insurance furtherdivided into Global Lines, International and North America. AXA XL underwrites across all the platforms available to bestservice both brokers and clients.
Catlin Re Switzerland Ltd ("CRCH", "Catlin Re" or "the Company"), domiciled in Zurich, Switzerland, operates as a multi-lineproperty, casualty and specialty reinsurance company and as one of AXA XL's main Intra-Group Reinsurance ("IGR") carriers.
The Company underwrites property, casualty and specialty classes of reinsurance in Continental Europe, Latin Americaand the Middle East as well as trade credit, surety and political risk reinsurance on a global basis. The Company offers itsclients excess of loss, pro-rata and facultative reinsurance business through reinsurance brokers and a network of Divisionoffices. The Company prudently manages reinsurance obligations through controlled risk taking, clear accountability andstrong underwriting discipline. Through its Bermuda Branch, the Company also underwrites property, casualty, crop andstructured risks on a global basis. The needs of the Central and South American, Brazilian and the Caribbean reinsurancemarkets are served through local offices in Colombia and Brazil as well as a binder agreement with an AXA XL US office inMiami. In particular, the Company offers short-tail multi-peril property reinsurance as well as casualty, crop, accident &health, marine and other lines of reinsurance. Brazil business is written both through Catlin Re Switzerland on an admittedbasis as well as through the fully owned subsidiary XL Resseguros Brasil S.A.
4

The assumed Intra-Group Reinsurance quota share contracts with North American AXA XL entities were not renewed for2018, any unearned risk exposures as at December 31, 2017, were returned to the ceding company. Incepting May 1, 2018,Catlin Re engaged with XLRA through an excess of loss agreement covering tail Nat Cat and Terrorism risks.
On November 19, 2018, the Company's rating along with other AXA XL core legal entities was upgraded from 'A+' to 'AA-'with stable outlook from S&P mainly driven by the strategic fit and core operation to the AXA Group. Additionally the ratingfrom A.M. Best was upgraded from 'A' to 'A+' stable during the year.
On March 1, 2019, regulatory approval was obtained from the Bermuda Monetary Authority ("BMA") for the creation of anew AXA XL company called Seaview Re Ltd ("Seaview Re") domiciled in Hamilton, Bermuda. Seaview Re in turn is a subsidiaryof a Delaware domiciled holding company called Seaview Re Holdings Inc ("Seaview Holdings"). On March 5, 2019, USD 475mwas contributed from Catlin Re to Seaview Holdings by way of asset transfer, whereby Seaview Holdings will be a wholly-owned subsidiary of Catlin Re.
Further details of the Company's business activities are provided in section A.
Business performance
The 2018 trading environment continued to be competitive across most lines of business with some rate increases in loss-affected lines following the HIMM events as well as the California wildfires. Clients have continued to diversify their portfoliosand optimize reinsurance purchases to preserve underwriting margin and maintain adequate returns on capital. Despitethe competitive trading environment, the Company was able to leverage AXA XL's enhanced market position and financialstrength to create new opportunities. The Company continues to seek selective opportunities and its consistentunderwriting strategy remains attractive to its customer base.
The 2018 loss ratio of 66% is reflective of two key items 1) large loss activity on the current accident year, including HurricaneMichael, the California Wildfires, a large surety claim and worse than expected loss activity on a Crop Account, and 2) adverseprior year development on North America NY Contractors, North America Construction and North America Excess andSurplus Casualty, mainly impacting "Casualty" line in the following table. The total net adverse prior year development forthe year was CHF 29m.
The Company generated CHF 1,700m of gross premium written in 2018 and a combined ratio of 105%.
5

CHF millions
Gross premium Net premium Acquisition cost2018 written earned ratio Loss ratio Combined ratio
Personal accident 9 5 49% 82 % 131 %
Health — — —% — % — %
Motor 66 58 28% 88 % 116 %
Marine, aviation, transport 7 6 18% 328 % 346 %
Property 1,383 1,087 39% 61 % 100 %
Casualty 2 13 51% 450 % 502 %
Miscellaneous 231 168 42% 51 % 93 %
Total 2018 1,700 1,336 39% 66 % 105 %
Gross premium Net premium Acquisition cost2017 written earned ratio Loss ratio Combined ratio
Personal accident 21 42 30% 71 % 101 %
Health 14 13 34% 65 % 99 %
Motor 145 182 26% 98 % 124 %
Marine, aviation, transport 117 199 33% 81 % 113 %
Property 1,478 1,199 34% 92 % 126 %
Casualty 694 1,245 32% 59 % 91 %
Miscellaneous 229 191 36% 49 % 85 %
Total 2017 2,698 3,070 33% 75 % 108 %
Change (998) (1,734) 6% (9)% (3)%
Personal accident Health
Motor Marine, aviation, transport
Property Casualty
Miscellaneous
Gross premium written by FINMA line of business
2,000
1,500
1,000
500
0
CH
Fm
illio
ns
2018 2017
9 21— 1466145
7117
1,3831,478
2
694
231 229
6
Further details of the Company's performance are provided in section B and the Annual Financial Statements in appendix4. Also refer to AXA's Annual Report for the year ended December 31, 2018 for additional information on the AXA Group'sperformance.
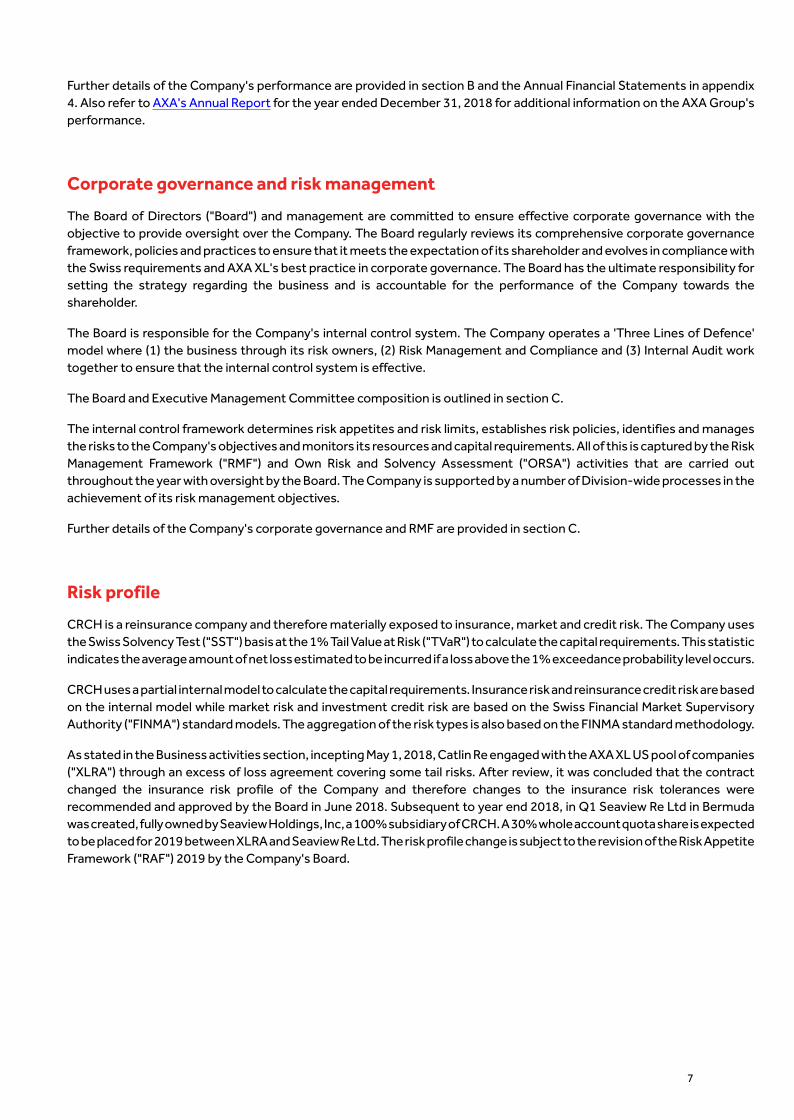
Corporate governance and risk management
The Board of Directors ("Board") and management are committed to ensure effective corporate governance with theobjective to provide oversight over the Company. The Board regularly reviews its comprehensive corporate governanceframework, policies and practices to ensure that it meets the expectation of its shareholder and evolves in compliance withthe Swiss requirements and AXA XL's best practice in corporate governance. The Board has the ultimate responsibility forsetting the strategy regarding the business and is accountable for the performance of the Company towards theshareholder.
The Board is responsible for the Company's internal control system. The Company operates a 'Three Lines of Defence'model where (1) the business through its risk owners, (2) Risk Management and Compliance and (3) Internal Audit worktogether to ensure that the internal control system is effective.
The Board and Executive Management Committee composition is outlined in section C.
The internal control framework determines risk appetites and risk limits, establishes risk policies, identifies and managesthe risks to the Company's objectives and monitors its resources and capital requirements. All of this is captured by the RiskManagement Framework ("RMF") and Own Risk and Solvency Assessment ("ORSA") activities that are carried outthroughout the year with oversight by the Board. The Company is supported by a number of Division-wide processes in theachievement of its risk management objectives.
Further details of the Company's corporate governance and RMF are provided in section C.
Risk profile
CRCH is a reinsurance company and therefore materially exposed to insurance, market and credit risk. The Company usesthe Swiss Solvency Test ("SST") basis at the 1% Tail Value at Risk ("TVaR") to calculate the capital requirements. This statisticindicates the average amount of net loss estimated to be incurred if a loss above the 1% exceedance probability level occurs.
CRCH uses a partial internal model to calculate the capital requirements. Insurance risk and reinsurance credit risk are basedon the internal model while market risk and investment credit risk are based on the Swiss Financial Market SupervisoryAuthority ("FINMA") standard models. The aggregation of the risk types is also based on the FINMA standard methodology.
As stated in the Business activities section, incepting May 1, 2018, Catlin Re engaged with the AXA XL US pool of companies("XLRA") through an excess of loss agreement covering some tail risks. After review, it was concluded that the contractchanged the insurance risk profile of the Company and therefore changes to the insurance risk tolerances wererecommended and approved by the Board in June 2018. Subsequent to year end 2018, in Q1 Seaview Re Ltd in Bermudawas created, fully owned by Seaview Holdings, Inc, a 100% subsidiary of CRCH. A 30% whole account quota share is expectedto be placed for 2019 between XLRA and Seaview Re Ltd. The risk profile change is subject to the revision of the Risk AppetiteFramework ("RAF") 2019 by the Company's Board.
7
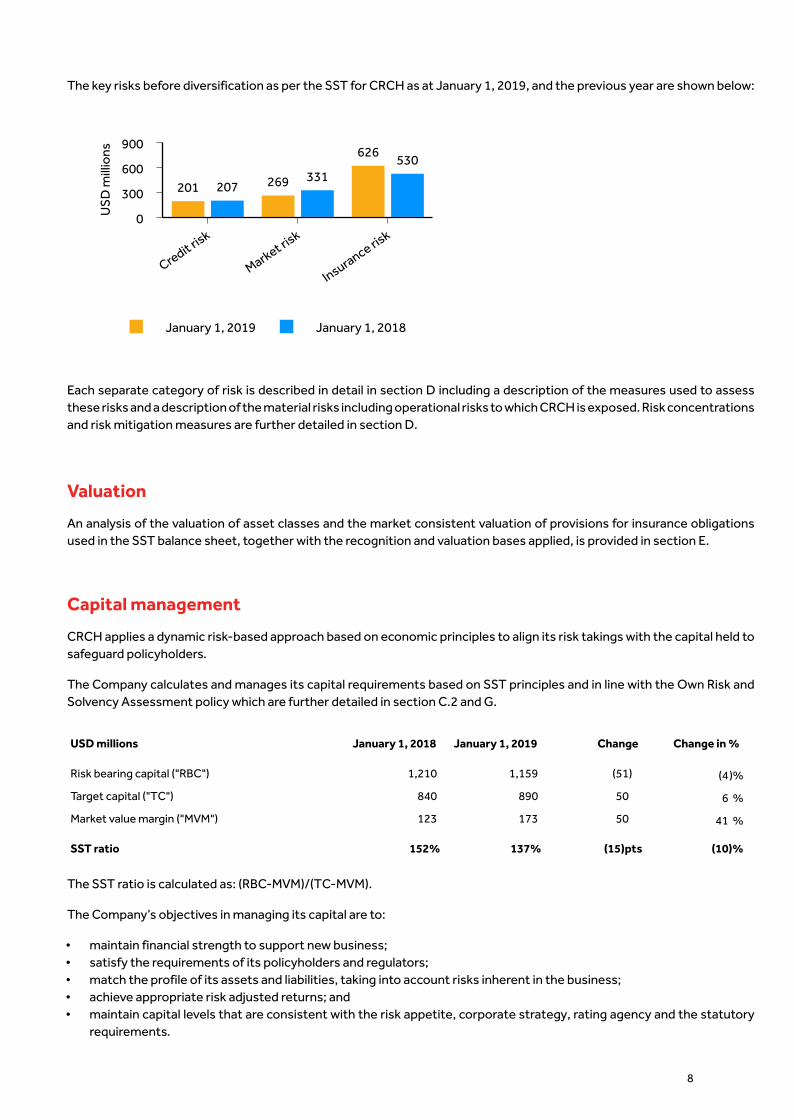
The key risks before diversification as per the SST for CRCH as at January 1, 2019, and the previous year are shown below:
January 1, 2019 January 1, 2018
900
600
300
0US
Dm
illio
ns
Credit risk
Market risk
Insurance risk
201 269
626
207331
530
Each separate category of risk is described in detail in section D including a description of the measures used to assessthese risks and a description of the material risks including operational risks to which CRCH is exposed. Risk concentrationsand risk mitigation measures are further detailed in section D.
Valuation
An analysis of the valuation of asset classes and the market consistent valuation of provisions for insurance obligationsused in the SST balance sheet, together with the recognition and valuation bases applied, is provided in section E.
Capital management
CRCH applies a dynamic risk-based approach based on economic principles to align its risk takings with the capital held tosafeguard policyholders.
The Company calculates and manages its capital requirements based on SST principles and in line with the Own Risk andSolvency Assessment policy which are further detailed in section C.2 and G.
USD millions January 1, 2018 January 1, 2019 Change Change in %
Risk bearing capital ("RBC") 1,210 1,159 (51) (4)%
Target capital ("TC") 840 890 50 6 %
Market value margin ("MVM") 123 173 50 41 %
SST ratio 152% 137% (15)pts (10)%
The SST ratio is calculated as: (RBC-MVM)/(TC-MVM).
The Company’s objectives in managing its capital are to:
• maintain financial strength to support new business; • satisfy the requirements of its policyholders and regulators; • match the profile of its assets and liabilities, taking into account risks inherent in the business; • achieve appropriate risk adjusted returns; and • maintain capital levels that are consistent with the risk appetite, corporate strategy, rating agency and the statutory
requirements.
8

Solvency
Section G provides information on the models used for the SST calculations with further breakdowns of the target capitalas at January 1, 2019. Seaview Re is included within the 2019 results on a consolidated basis.
The following chart shows a break-down of the SST target capital into the relevant categories as defined by FINMA:
January 1, 2019
1,200
1,000
800
600
400
200
0
-200
-400
US
Dm
illio
ns
Technical result
Financial result
Credit risk
Market risk
Insurance riskMVM
Scenarios
Diversification
Target capital
(163) (30)
201
269
626
173 9
(194)
890
January 1, 2018
1,300
1,100
900
700
500
300
100
-100
-300
US
Dm
illio
ns
Technical result
Financial result
Credit risk
Market risk
Insurance riskMVM
Scenarios
Diversification
Target capital
(67) (17)
207
331
530123 10
(279)
840
9
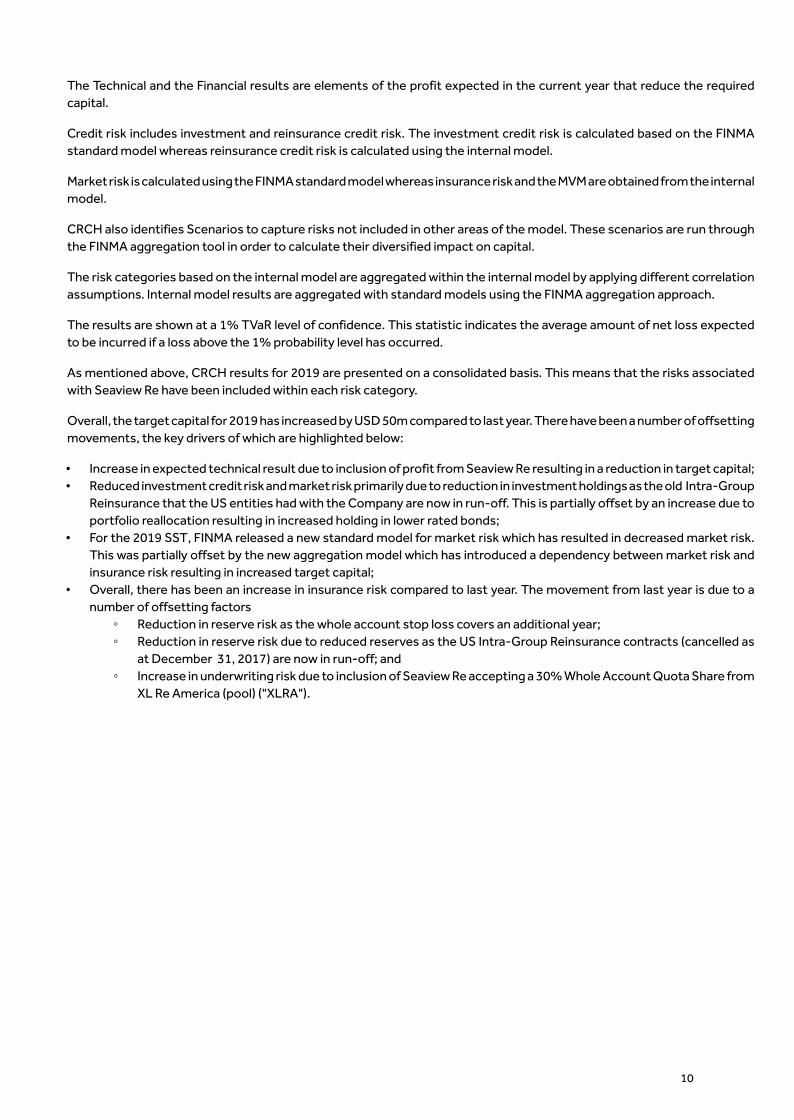
The Technical and the Financial results are elements of the profit expected in the current year that reduce the requiredcapital.
Credit risk includes investment and reinsurance credit risk. The investment credit risk is calculated based on the FINMAstandard model whereas reinsurance credit risk is calculated using the internal model.
Market risk is calculated using the FINMA standard model whereas insurance risk and the MVM are obtained from the internalmodel.
CRCH also identifies Scenarios to capture risks not included in other areas of the model. These scenarios are run throughthe FINMA aggregation tool in order to calculate their diversified impact on capital.
The risk categories based on the internal model are aggregated within the internal model by applying different correlationassumptions. Internal model results are aggregated with standard models using the FINMA aggregation approach.
The results are shown at a 1% TVaR level of confidence. This statistic indicates the average amount of net loss expectedto be incurred if a loss above the 1% probability level has occurred.
As mentioned above, CRCH results for 2019 are presented on a consolidated basis. This means that the risks associatedwith Seaview Re have been included within each risk category.
Overall, the target capital for 2019 has increased by USD 50m compared to last year. There have been a number of offsettingmovements, the key drivers of which are highlighted below:
• Increase in expected technical result due to inclusion of profit from Seaview Re resulting in a reduction in target capital;• Reduced investment credit risk and market risk primarily due to reduction in investment holdings as the old Intra-Group
Reinsurance that the US entities had with the Company are now in run-off. This is partially offset by an increase due toportfolio reallocation resulting in increased holding in lower rated bonds;
• For the 2019 SST, FINMA released a new standard model for market risk which has resulted in decreased market risk.This was partially offset by the new aggregation model which has introduced a dependency between market risk andinsurance risk resulting in increased target capital;
• Overall, there has been an increase in insurance risk compared to last year. The movement from last year is due to anumber of offsetting factors
◦ Reduction in reserve risk as the whole account stop loss covers an additional year;◦ Reduction in reserve risk due to reduced reserves as the US Intra-Group Reinsurance contracts (cancelled as
at December 31, 2017) are now in run-off; and◦ Increase in underwriting risk due to inclusion of Seaview Re accepting a 30% Whole Account Quota Share from
XL Re America (pool) ("XLRA").
10
A. Business activities
11
A.1 Strategy, objectives and business segments
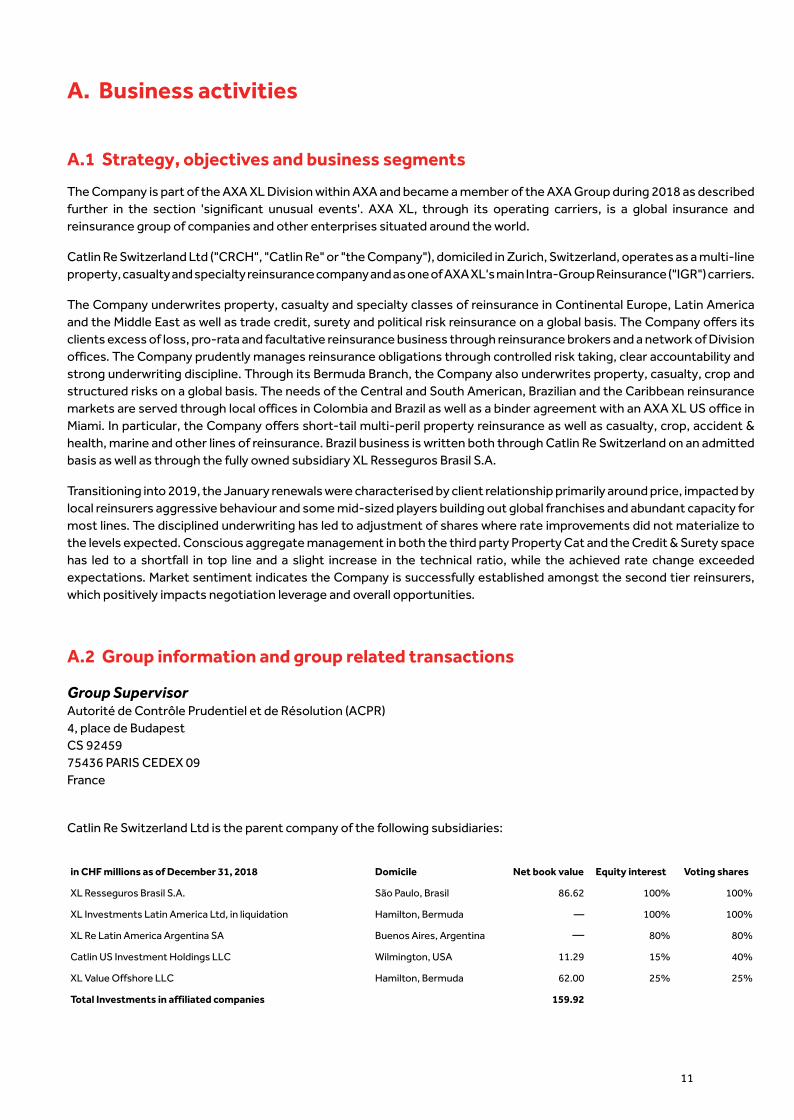
The Company is part of the AXA XL Division within AXA and became a member of the AXA Group during 2018 as describedfurther in the section 'significant unusual events'. AXA XL, through its operating carriers, is a global insurance andreinsurance group of companies and other enterprises situated around the world.
Catlin Re Switzerland Ltd ("CRCH", "Catlin Re" or "the Company"), domiciled in Zurich, Switzerland, operates as a multi-lineproperty, casualty and specialty reinsurance company and as one of AXA XL's main Intra-Group Reinsurance ("IGR") carriers.
The Company underwrites property, casualty and specialty classes of reinsurance in Continental Europe, Latin Americaand the Middle East as well as trade credit, surety and political risk reinsurance on a global basis. The Company offers itsclients excess of loss, pro-rata and facultative reinsurance business through reinsurance brokers and a network of Divisionoffices. The Company prudently manages reinsurance obligations through controlled risk taking, clear accountability andstrong underwriting discipline. Through its Bermuda Branch, the Company also underwrites property, casualty, crop andstructured risks on a global basis. The needs of the Central and South American, Brazilian and the Caribbean reinsurancemarkets are served through local offices in Colombia and Brazil as well as a binder agreement with an AXA XL US office inMiami. In particular, the Company offers short-tail multi-peril property reinsurance as well as casualty, crop, accident &health, marine and other lines of reinsurance. Brazil business is written both through Catlin Re Switzerland on an admittedbasis as well as through the fully owned subsidiary XL Resseguros Brasil S.A.
Transitioning into 2019, the January renewals were characterised by client relationship primarily around price, impacted bylocal reinsurers aggressive behaviour and some mid-sized players building out global franchises and abundant capacity formost lines. The disciplined underwriting has led to adjustment of shares where rate improvements did not materialize tothe levels expected. Conscious aggregate management in both the third party Property Cat and the Credit & Surety spacehas led to a shortfall in top line and a slight increase in the technical ratio, while the achieved rate change exceededexpectations. Market sentiment indicates the Company is successfully established amongst the second tier reinsurers,which positively impacts negotiation leverage and overall opportunities.
A.2 Group information and group related transactions
Group SupervisorAutorité de Contrôle Prudentiel et de Résolution (ACPR) 4, place de Budapest CS 92459 75436 PARIS CEDEX 09France
Catlin Re Switzerland Ltd is the parent company of the following subsidiaries:
in CHF millions as of December 31, 2018 Domicile Net book value Equity interest Voting shares
XL Resseguros Brasil S.A. São Paulo, Brasil 86.62 100% 100%
XL Investments Latin America Ltd, in liquidation Hamilton, Bermuda — 100% 100%
XL Re Latin America Argentina SA Buenos Aires, Argentina — 80% 80%
Catlin US Investment Holdings LLC Wilmington, USA 11.29 15% 40%
XL Value Offshore LLC Hamilton, Bermuda 62.00 25% 25%
Total Investments in affiliated companies 159.92

in CHF millions as of December 31, 2017 Domicile Net book value Equity interest Voting shares
XL Resseguros Brasil S.A. São Paulo, Brasil 86.12 100 % 100 %
XL Investments Latin America Ltd, in liquidation Hamilton, Bermuda — 100 % 100 %
XL Re Latin America Argentina SA Buenos Aires, Argentina — 80 % 80 %
Catlin US Investment Holdings LLC Wilmington, USA 11.29 15 % 40 %
XL Value Offshore LLC Hamilton, Bermuda 41.23 25 % 25 %
Total Investments in affiliated companies 138.64
The increase in the book value for XL Value Offshore LLC is driven by capital contributions amounting to CHF 25m and animpairment of CHF 5m.
CRCH's position as of December 31, 2018, within the legal structure of the Group can be seen from the chart below:
Axa SA100%France
XL Group Ltd100%
Bermuda
XLIT Ltd100%
Cayman
EXEL Holdings Ltd100%
Cayman
XL Bermuda Ltd100%
Bermuda
Green Holdings Ltd100%
Bermuda
Catlin Insurance Company Ltd100%
Bermuda
Catlin Luxembourg S.à r.l100%
Luxembourg
Catlin Re Switzerland Ltd
Switzerland
Material related party transactions
The Company has a whole account stop loss agreement in place with XL Bermuda Ltd ("XLB"). The Company also makesregular payments to XL Group companies in respect of services provided to the Company. The Company regularly purchasesor sells financial investments from and to other Group companies. During 2018, the Company received a USD 20m capitalcontribution from Green Holdings Ltd, a fully owned Group company. Save for the above, there were no transactions withthe Company's direct or indirect shareholders, with persons who exercise a significant influence on the Company or withmembers of the Board which are deemed material. The Company actively monitors all related party transactions.
12
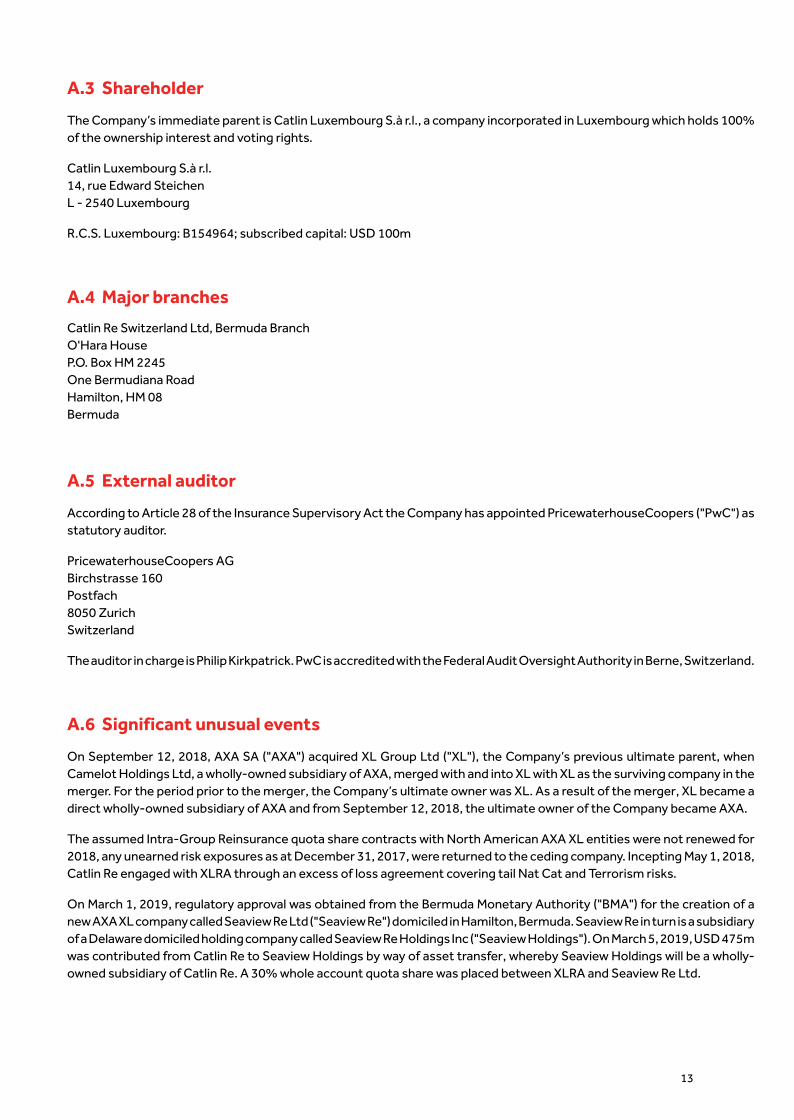
A.3 Shareholder
The Company’s immediate parent is Catlin Luxembourg S.à r.l., a company incorporated in Luxembourg which holds 100%of the ownership interest and voting rights.
Catlin Luxembourg S.à r.l. 14, rue Edward SteichenL - 2540 Luxembourg
R.C.S. Luxembourg: B154964; subscribed capital: USD 100m
13
A.4 Major branches
Catlin Re Switzerland Ltd, Bermuda Branch O'Hara HouseP.O. Box HM 2245One Bermudiana RoadHamilton, HM 08Bermuda
A.5 External auditor
According to Article 28 of the Insurance Supervisory Act the Company has appointed PricewaterhouseCoopers ("PwC") asstatutory auditor.
PricewaterhouseCoopers AG Birchstrasse 160Postfach8050 ZurichSwitzerland
The auditor in charge is Philip Kirkpatrick. PwC is accredited with the Federal Audit Oversight Authority in Berne, Switzerland.
A.6 Significant unusual events
On September 12, 2018, AXA SA ("AXA") acquired XL Group Ltd ("XL"), the Company’s previous ultimate parent, whenCamelot Holdings Ltd, a wholly-owned subsidiary of AXA, merged with and into XL with XL as the surviving company in themerger. For the period prior to the merger, the Company’s ultimate owner was XL. As a result of the merger, XL became adirect wholly-owned subsidiary of AXA and from September 12, 2018, the ultimate owner of the Company became AXA.
The assumed Intra-Group Reinsurance quota share contracts with North American AXA XL entities were not renewed for2018, any unearned risk exposures as at December 31, 2017, were returned to the ceding company. Incepting May 1, 2018,Catlin Re engaged with XLRA through an excess of loss agreement covering tail Nat Cat and Terrorism risks.
On March 1, 2019, regulatory approval was obtained from the Bermuda Monetary Authority ("BMA") for the creation of anew AXA XL company called Seaview Re Ltd ("Seaview Re") domiciled in Hamilton, Bermuda. Seaview Re in turn is a subsidiaryof a Delaware domiciled holding company called Seaview Re Holdings Inc ("Seaview Holdings"). On March 5, 2019, USD 475mwas contributed from Catlin Re to Seaview Holdings by way of asset transfer, whereby Seaview Holdings will be a wholly-owned subsidiary of Catlin Re. A 30% whole account quota share was placed between XLRA and Seaview Re Ltd.
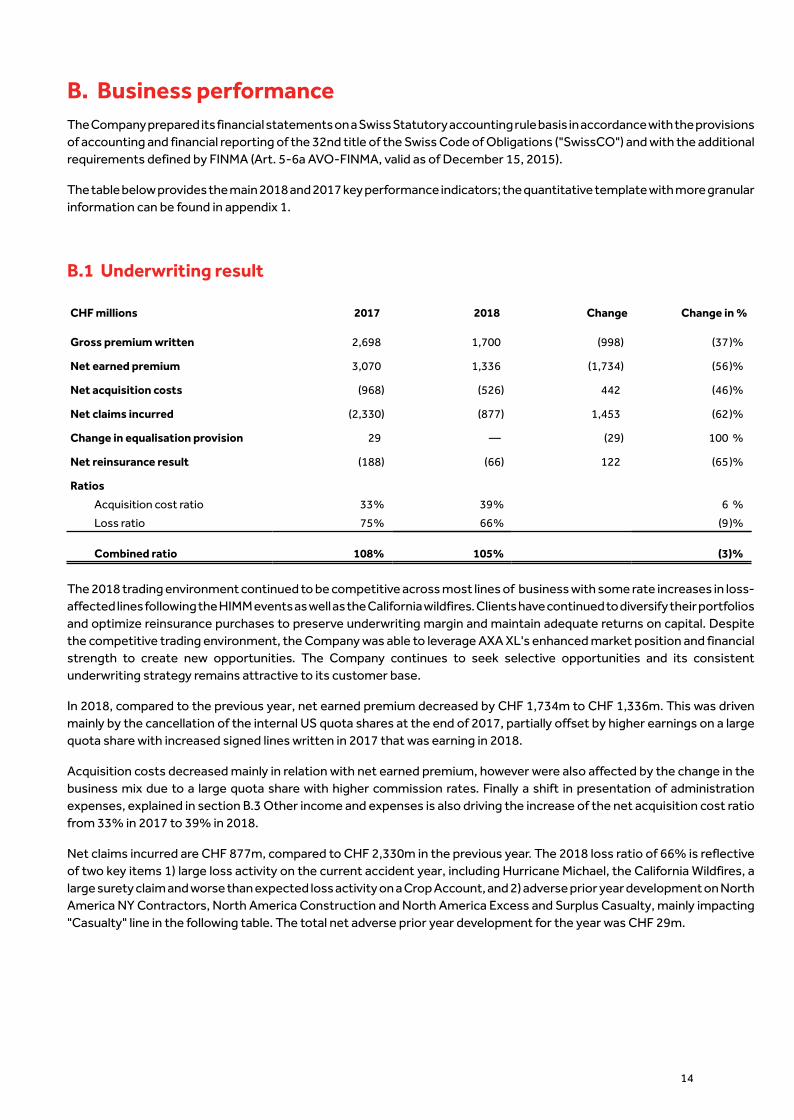
B. Business performanceThe Company prepared its financial statements on a Swiss Statutory accounting rule basis in accordance with the provisionsof accounting and financial reporting of the 32nd title of the Swiss Code of Obligations ("SwissCO") and with the additionalrequirements defined by FINMA (Art. 5-6a AVO-FINMA, valid as of December 15, 2015).
The table below provides the main 2018 and 2017 key performance indicators; the quantitative template with more granularinformation can be found in appendix 1.
14
B.1 Underwriting result
CHF millions 2017 2018 Change Change in %
Gross premium written 2,698 1,700 (998) (37)%
Net earned premium 3,070 1,336 (1,734) (56)%
Net acquisition costs (968) (526) 442 (46)%
Net claims incurred (2,330) (877) 1,453 (62)%
Change in equalisation provision 29 — (29) 100 %
Net reinsurance result (188) (66) 122 (65)%
Ratios
Acquisition cost ratio 33% 39% 6 %
Loss ratio 75% 66% (9)%
Combined ratio 108% 105% (3)%
The 2018 trading environment continued to be competitive across most lines of business with some rate increases in loss-affected lines following the HIMM events as well as the California wildfires. Clients have continued to diversify their portfoliosand optimize reinsurance purchases to preserve underwriting margin and maintain adequate returns on capital. Despitethe competitive trading environment, the Company was able to leverage AXA XL's enhanced market position and financialstrength to create new opportunities. The Company continues to seek selective opportunities and its consistentunderwriting strategy remains attractive to its customer base.
In 2018, compared to the previous year, net earned premium decreased by CHF 1,734m to CHF 1,336m. This was drivenmainly by the cancellation of the internal US quota shares at the end of 2017, partially offset by higher earnings on a largequota share with increased signed lines written in 2017 that was earning in 2018.
Acquisition costs decreased mainly in relation with net earned premium, however were also affected by the change in thebusiness mix due to a large quota share with higher commission rates. Finally a shift in presentation of administrationexpenses, explained in section B.3 Other income and expenses is also driving the increase of the net acquisition cost ratiofrom 33% in 2017 to 39% in 2018.
Net claims incurred are CHF 877m, compared to CHF 2,330m in the previous year. The 2018 loss ratio of 66% is reflectiveof two key items 1) large loss activity on the current accident year, including Hurricane Michael, the California Wildfires, alarge surety claim and worse than expected loss activity on a Crop Account, and 2) adverse prior year development on NorthAmerica NY Contractors, North America Construction and North America Excess and Surplus Casualty, mainly impacting"Casualty" line in the following table. The total net adverse prior year development for the year was CHF 29m.
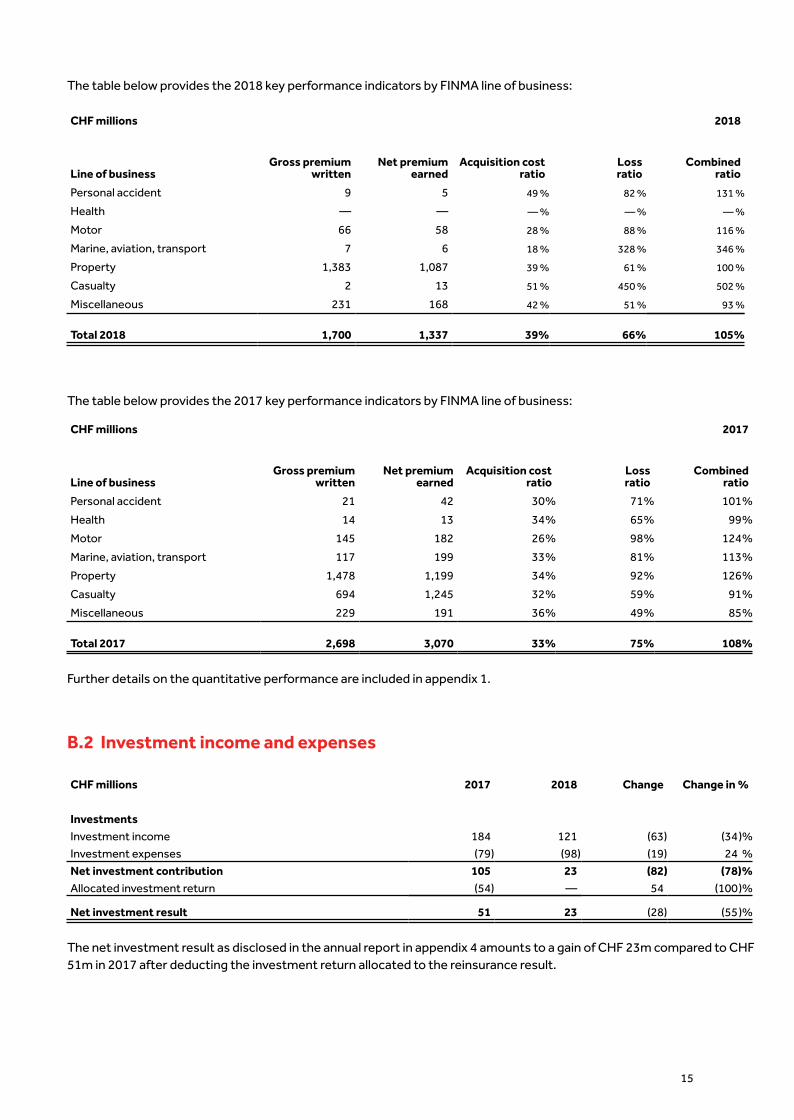
The table below provides the 2018 key performance indicators by FINMA line of business:
CHF millions
Line of businessGross premium
writtenNet premium
earnedAcquisition cost
ratioLossratio
2018
Combinedratio
Personal accident 9 5 49 % 82 % 131 %
Health — — — % — % — %
Motor 66 58 28 % 88 % 116 %
Marine, aviation, transport 7 6 18 % 328 % 346 %
Property 1,383 1,087 39 % 61 % 100 %
Casualty 2 13 51 % 450 % 502 %
Miscellaneous 231 168 42 % 51 % 93 %
Total 2018 1,700 1,337 39% 66% 105%
The table below provides the 2017 key performance indicators by FINMA line of business:
CHF millions
Line of businessGross premium
writtenNet premium
earnedAcquisition cost
ratioLossratio
2017
Combinedratio
Personal accident 21 42 30% 71% 101%
Health 14 13 34% 65% 99%
Motor 145 182 26% 98% 124%
Marine, aviation, transport 117 199 33% 81% 113%
Property 1,478 1,199 34% 92% 126%
Casualty 694 1,245 32% 59% 91%
Miscellaneous 229 191 36% 49% 85%
Total 2017 2,698 3,070 33% 75% 108%
Further details on the quantitative performance are included in appendix 1.
15
B.2 Investment income and expenses
CHF millions 2017 2018 Change Change in %
InvestmentsInvestment income 184 121 (63) (34)%
Investment expenses (79) (98) (19) 24 %
Net investment contribution 105 23 (82) (78)%Allocated investment return (54) — 54 (100)%
Net investment result 51 23 (28) (55)%
The net investment result as disclosed in the annual report in appendix 4 amounts to a gain of CHF 23m compared to CHF51m in 2017 after deducting the investment return allocated to the reinsurance result.
The allocated investment return was the calculated interest generated on the investment covering the technical provisionsand represents a reallocation from the net investment result to the underwriting result. The interest rate reflected thecurrency-weighted average yield on five-year government bonds. In 2018, the reallocation to the underwriting result wasno longer performed to better comply with the minimum disclosure requirements as set out by FINMA.
The Company did not record any gains or losses directly in shareholder's equity.
16
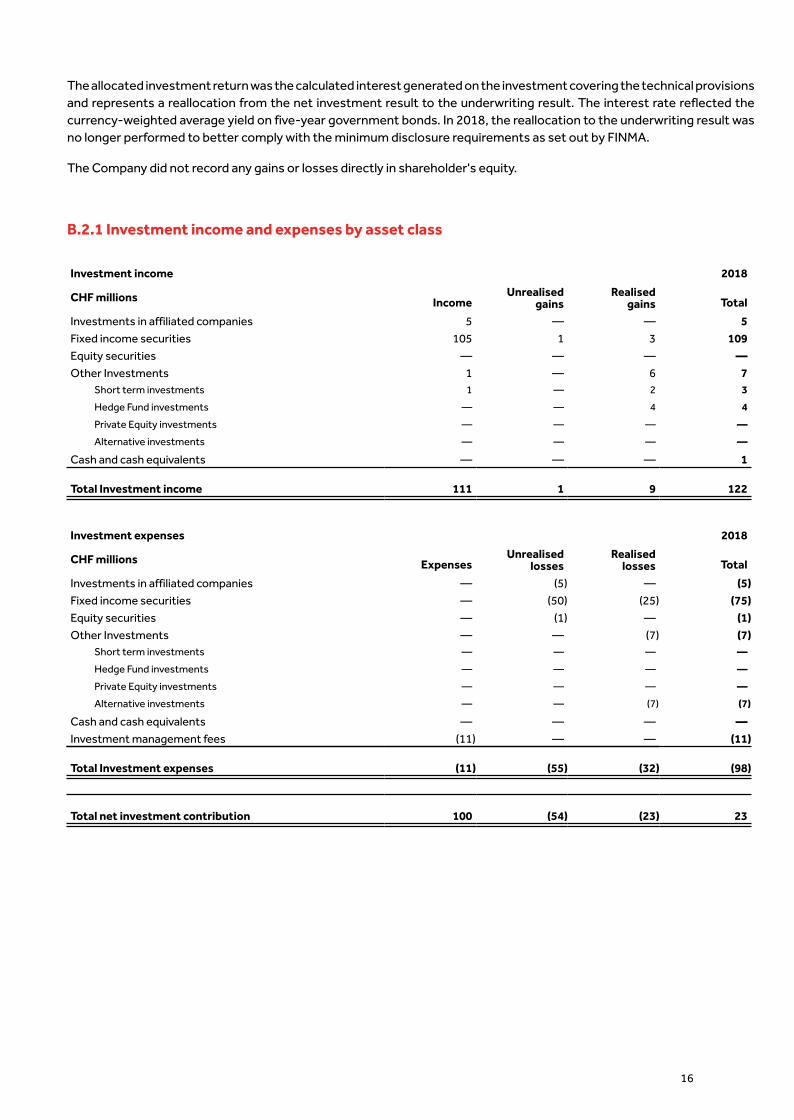
B.2.1 Investment income and expenses by asset class
Investment income 2018
CHF millions IncomeUnrealised
gainsRealised
gains Total
Investments in affiliated companies 5 — — 5Fixed income securities 105 1 3 109Equity securities — — — —Other Investments 1 — 6 7
Short term investments 1 — 2 3
Hedge Fund investments — — 4 4
Private Equity investments — — — —
Alternative investments — — — —
Cash and cash equivalents — — — 1
Total Investment income 111 1 9 122
Investment expenses 2018
CHF millions ExpensesUnrealised
lossesRealised
losses Total
Investments in affiliated companies — (5) — (5)Fixed income securities — (50) (25) (75)Equity securities — (1) — (1)Other Investments — — (7) (7)
Short term investments — — — —
Hedge Fund investments — — — —
Private Equity investments — — — —
Alternative investments — — (7) (7)
Cash and cash equivalents — — — —Investment management fees (11) — — (11)
Total Investment expenses (11) (55) (32) (98)
Total net investment contribution 100 (54) (23) 23
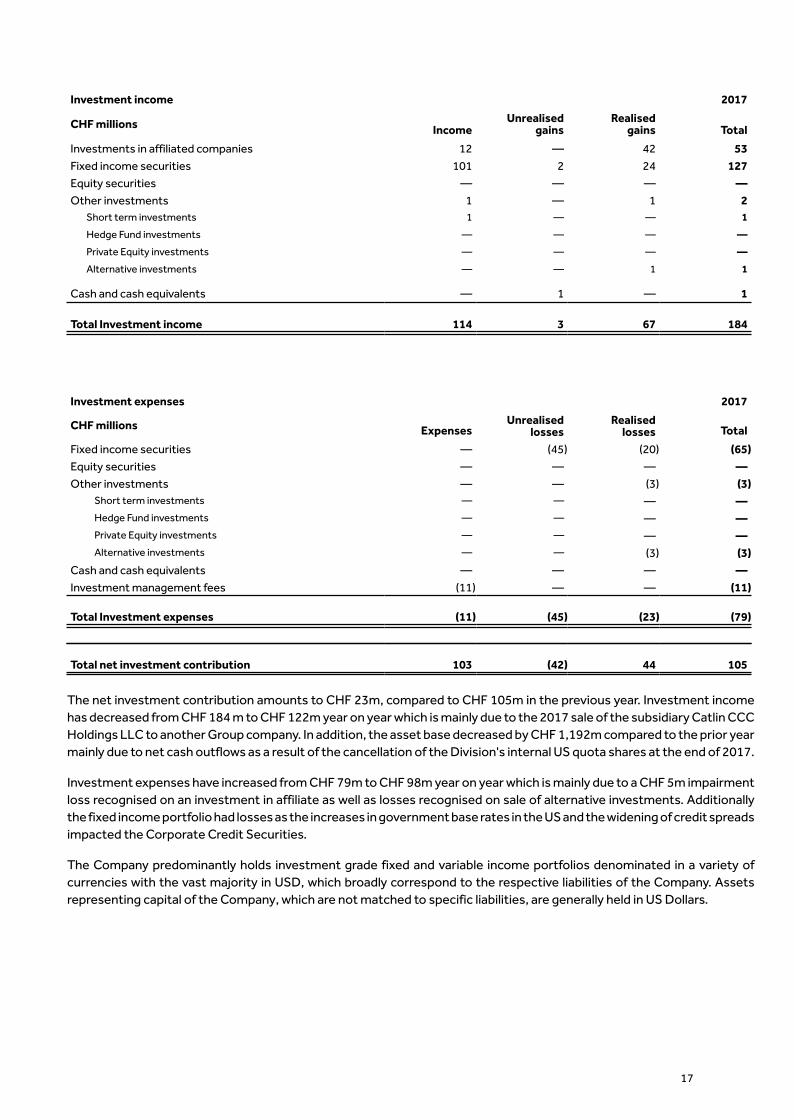
Investment income 2017
Unrealised RealisedCHF millions Income gains gains Total
Investments in affiliated companies 12 — 42 53Fixed income securities 101 2 24 127Equity securities — — — —Other investments 1 — 1 2
Short term investments 1 — — 1
Hedge Fund investments — — — —
Private Equity investments — — — —
Alternative investments — — 1 1
Cash and cash equivalents — 1 — 1
Total Investment income 114 3 67 184
Investment expenses 2017
CHF millions ExpensesUnrealised
lossesRealised
losses Total
Fixed income securities — (45) (20) (65)Equity securities — — — —Other investments — — (3) (3)
Short term investments — — — —Hedge Fund investments — — — —Private Equity investments — — — —Alternative investments — — (3) (3)
Cash and cash equivalents — — — —Investment management fees (11) — — (11)
Total Investment expenses (11) (45) (23) (79)
Total net investment contribution 103 (42) 44 105
The net investment contribution amounts to CHF 23m, compared to CHF 105m in the previous year. Investment incomehas decreased from CHF 184 m to CHF 122m year on year which is mainly due to the 2017 sale of the subsidiary Catlin CCCHoldings LLC to another Group company. In addition, the asset base decreased by CHF 1,192m compared to the prior yearmainly due to net cash outflows as a result of the cancellation of the Division's internal US quota shares at the end of 2017.
Investment expenses have increased from CHF 79m to CHF 98m year on year which is mainly due to a CHF 5m impairmentloss recognised on an investment in affiliate as well as losses recognised on sale of alternative investments. Additionallythe fixed income portfolio had losses as the increases in government base rates in the US and the widening of credit spreadsimpacted the Corporate Credit Securities.
The Company predominantly holds investment grade fixed and variable income portfolios denominated in a variety ofcurrencies with the vast majority in USD, which broadly correspond to the respective liabilities of the Company. Assetsrepresenting capital of the Company, which are not matched to specific liabilities, are generally held in US Dollars.
17

B.3 Other income and expenses
CHF millions 2017 2018 Change Change in %
Interest income — 16 16 — %
Interest expense (1) (2) (1) 100 %
Other income 34 — (34) (100)%
Administration and other expenses (84) — 84 (100)%
Allocated operating costs 44 — (44) (100)%
Foreign exchange (32) 2 34 (100)%
Total other income and expenses (39) 16 55 (141)%
Interest income of CHF 16m is mainly comprised of interest earned on funds withheld which in the prior year was includedin the investment income (CHF 5m in 2017).
Administration and other expenses amounted to CHF 84m in 2017. In 2018, Administration and other expenses amount toCHF 73m and are disclosed in the Gross acquisition costs and administration expenses line item. The allocation of operatingcosts to the reinsurance business was no longer performed in 2018 (CHF 44m in 2017). These changes have been appliedto better comply with the minimum disclosure requirements as set out by FINMA.
The foreign exchange gain of CHF 2m (2017: CHF 32m loss) arises from foreign currency transactions incurred in each ofthe Company's business units and the revaluation of monetary assets and liabilities denominated in foreign currencies intothe functional currencies at the period end rates. Revaluation gains and losses are deemed realised and recorded in theincome statement. Each business unit with a different functional currency from the Company's Statutory reporting currencyis translated to Swiss Francs; resulting unrealised gains are deferred and recorded under the balance sheet line item provisionfor currency fluctuation. Unrealised losses from translation are either offset against the provision for currency fluctuationor recorded in the income statement. In 2018, unrealised translation losses in the amount of CHF 5m have been recordedagainst the provision for currency fluctuation (2017: CHF 21m).
18
C. Corporate governance and risk management
19
C.1 Corporate governance
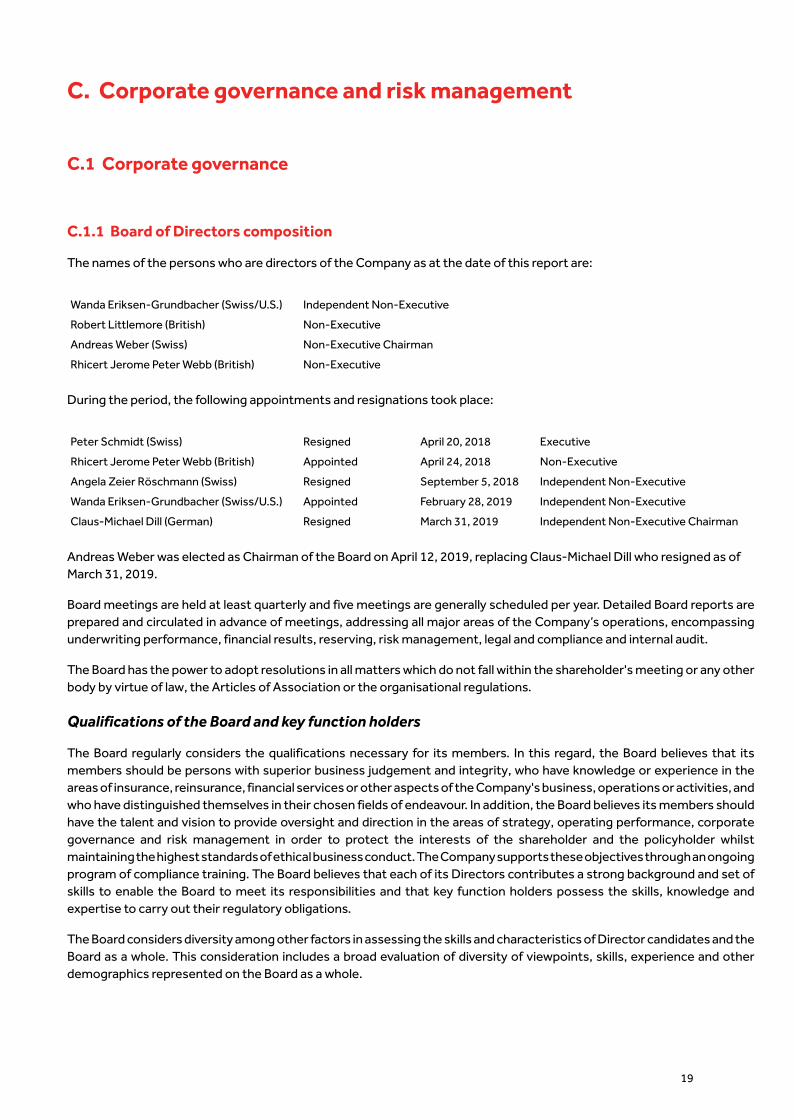
C.1.1 Board of Directors composition
The names of the persons who are directors of the Company as at the date of this report are:
Wanda Eriksen-Grundbacher (Swiss/U.S.) Independent Non-Executive
Robert Littlemore (British) Non-Executive
Andreas Weber (Swiss) Non-Executive Chairman
Rhicert Jerome Peter Webb (British) Non-Executive
During the period, the following appointments and resignations took place:
Peter Schmidt (Swiss) Resigned April 20, 2018 Executive
Rhicert Jerome Peter Webb (British) Appointed April 24, 2018 Non-Executive
Angela Zeier Röschmann (Swiss) Resigned September 5, 2018 Independent Non-Executive
Wanda Eriksen-Grundbacher (Swiss/U.S.) Appointed February 28, 2019 Independent Non-Executive
Claus-Michael Dill (German) Resigned March 31, 2019 Independent Non-Executive Chairman
Andreas Weber was elected as Chairman of the Board on April 12, 2019, replacing Claus-Michael Dill who resigned as ofMarch 31, 2019.
Board meetings are held at least quarterly and five meetings are generally scheduled per year. Detailed Board reports areprepared and circulated in advance of meetings, addressing all major areas of the Company’s operations, encompassingunderwriting performance, financial results, reserving, risk management, legal and compliance and internal audit.
The Board has the power to adopt resolutions in all matters which do not fall within the shareholder's meeting or any otherbody by virtue of law, the Articles of Association or the organisational regulations.
Qualifications of the Board and key function holders
The Board regularly considers the qualifications necessary for its members. In this regard, the Board believes that itsmembers should be persons with superior business judgement and integrity, who have knowledge or experience in theareas of insurance, reinsurance, financial services or other aspects of the Company's business, operations or activities, andwho have distinguished themselves in their chosen fields of endeavour. In addition, the Board believes its members shouldhave the talent and vision to provide oversight and direction in the areas of strategy, operating performance, corporategovernance and risk management in order to protect the interests of the shareholder and the policyholder whilstmaintaining the highest standards of ethical business conduct. The Company supports these objectives through an ongoingprogram of compliance training. The Board believes that each of its Directors contributes a strong background and set ofskills to enable the Board to meet its responsibilities and that key function holders possess the skills, knowledge andexpertise to carry out their regulatory obligations.
The Board considers diversity among other factors in assessing the skills and characteristics of Director candidates and theBoard as a whole. This consideration includes a broad evaluation of diversity of viewpoints, skills, experience and otherdemographics represented on the Board as a whole.

C.1.2 Executive Committee composition
The Executive Committee ("ExCo") is composed of the following members:
Peter Schmidt (Swiss) Chief Executive Officer and Chief Underwriting OfficerBenno Schaffhauser (Swiss) Chief Financial OfficerJonathan Gale (British) Principal representative of Bermuda Branch
There were no changes in the Executive Committee composition during 2018.
Further information on the Executive Committee can be found in section C.1.3 below.
20
C.1.3 General information corporate governance
Corporate governance provides the framework through which:
• Objectives and strategy of the Company are set, and the means of attaining those objectives and monitoringperformance are determined;
• Roles and responsibilities of the Board and senior management are described;• At an operational level, policies are set, risk management is developed and carried out, and the business is operated on
a day to day basis;• The activities and behaviour are aligned with the expectation that Board, management and staff will operate in a prudent
and sound manner, and in compliance with applicable laws and regulations; and• The interests of policyholders, beneficiaries and reinsurance claimants are protected.
Essential elements of the corporate governance incorporate its corporate values, i.e. respect, ethics, teamwork andexcellence.
The Board has ultimate responsibility for directing the strategy of the business; setting the Company's risk appetites; andthe implementation and maintenance of an effective corporate governance framework for the Company. The keycomponents of this framework are discussed below. The Company’s framework is designed to demonstrate the Board’sand management’s commitment to effective governance; and to meet the requirements of the FINMA circular 2017/2'Corporate Governance - Insurers' that applies to the Company.
The Board is satisfied that the Company's system of governance is appropriate and effective, taking into account the nature,scale and complexity of the risks inherent in the Company's business.
The system of governance applies to the Company and its Bermuda Branch and offices.
This section provides details of the Company’s management structure along with roles and responsibilities and committees.

Board
Executive Committee Risk ManagementCommittee
Line Management(Claims, Actuarial, Finance,
Operations etc.)
First LineDay to day management of
risk including risk owners
RiskManagement Compliance
Second LineOversight and challenge of risk taking
Frameworkfor Internal
Controls(FIC)
InternalAudit
Third LineIndependent Assurance
The Board seeks to ensure that the operations of the Company are conducted within a framework of prudent and effectivecontrols that enables effective risk management and conformity with the applicable legal and regulatory requirements. TheBoard sets the risk appetites for the Company. Management are responsible for monitoring risks against risk appetite andfor escalating any risks that breach risk appetite to the Board.
Internal controls
The Company operates a ‘Three Lines of Defence’ approach to ensure effective and robust day to day governance is inplace. The Operational line, or the ‘first line of defence’, starts with the employees, who are tasked with identifying andmanaging risk on a day to day basis as part of their roles. They are supported by the ‘second line of defence’, which is madeup of oversight functions - specifically Risk Management and Compliance. These functions have responsibility foroverseeing and challenging day to day management, control and reporting of risks. The Risk oversight functions areindependent of management and individuals with responsibility for taking on risk exposures. The Internal Audit Functionprovides the ‘third line of defence’ which provides independent assessment of the effectiveness of the Company's systemof internal control and reports to the Board.
In addition, the Company operates a Framework for Internal Control (“FIC”) process which provides assurance on thecontrols around financial reporting; further details are included in Section C.3.1.
Executive Committee
The Executive Committee is responsible for the development and implementation of the strategy for the Company. Thisincludes assessment of the performance of the business to ensure risks associated with the strategy and its implementationare understood and managed with action taken to mitigate those risks and challenges in line with the risk appetite of theCompany. The Board has approved the Risk Management Framework (RMF) and has charged day to day monitoring of it tothe RMC, which reports to the ExCo.
21
Risk Management Committee
The RMC oversees the RMF of the Company, including those risks emanating from regions outside of which it is operating.Its role is to:
• Monitor all material risks associated with the strategic direction of the Company's business;• Advise the Board on the effectiveness of strategies and policies with respect to maintaining both ORSA and SST capital
which are adequate to cover the risks of the Company; and• Provide review and challenge to the Company's RMF including risk strategy, risk appetites, stress testing, and risk
oversight arrangements.
The Board has approved a RMF and has charged day to day monitoring of it to the RMC, which reports to the Board and ExCo.The RMC is supported in its functions by the local Risk Manager ("RM") who has responsibility for the Company’s riskmanagement function.
22
C.1.4 Key Risk functions
The Company's Risk Management, Compliance, Internal Audit and Actuarial functions are the key functions in its systemof governance. Holders of key functions are authorised to operate free from influences which may compromise their abilityto undertake their duties in an objective, fair and independent manner.
Each of these key function holders:
• Operates under the ultimate responsibility of, and reports to the Board as appropriate; • Cooperates with the other functions, where appropriate, in carrying out their roles, but operates independently; • Is able to communicate, at their own initiative, with any staff member and has the necessary authority, resources and
expertise and unrestricted access to all relevant information necessary to carry out their responsibilities; and • Promptly reports to the Board any significant issues arising in their area of responsibility.
Key function holders co-operate with each other but operate independently. Individuals carrying out the Internal Auditfunction do not assume any responsibility for any other function.
The Company has in place written policies in relation to its key functions. Further information on these functions is containedwithin sections C.2 (Risk Management), C.2.3 (Compliance) and C.3.2 (Internal Audit). The implementation of key functionswithin the Company is explained below.
Risk Management
The Company's Risk Management function is responsible for maintaining and monitoring the effectiveness of theCompany’s risk management system. The Company’s Risk Manager ("RM") plays a key role in the operation of the RMC. TheRM is a member of the RMC, which reports to the Board. Further information about the Risk Management function is setout in section C.2.
Compliance
The Compliance function is responsible for promoting a robust compliance culture in the Company, advising on all regulatorycompliance matters affecting the Company and the identification and assessment of compliance risk. The ComplianceOfficer ("CO") reports to the Board and has direct access to the Chairman of the Board. The Compliance Officer also reportsto the RMC on a regular basis. Further information about the Compliance function is set out in section C.2.3.
Internal Audit
The Head of Internal Audit ("HoIA") leads the Company's Internal Audit function, supported by AXA XL's Internal AuditDepartment. The HoIA is responsible for evaluating the adequacy and effectiveness of the Company's internal controlsystem and other elements of the system of governance. Their key responsibilities are set out in the Internal Audit policy.The HoIA reports directly to the Board. Further information about the Internal Audit function is set out in section C.3.2.

Other critical and important functions
In addition to the above, the Board has identified Underwriting, Claims Management, Finance and Investment Managementas functions which are of specific importance to the sound and prudent management of the Company. The ChiefUnderwriting Officer, Claims Manager and Chief Financial Officer are responsible for ensuring that their respective activitiesare aligned to the risk appetites of the Company. These functions report to the Board either directly or through the CEO.The Investment Management function is in-sourced from an AXA XL Group company called XL Group Investments Ltd("XLGIL").
23
C.2 Risk Management
C.2.1 Risk management framework
The Company faces strategic, financial and operational risks related to, among others: underwriting activities, financialreporting, changing macroeconomic conditions, investment, reserving, changes in laws or regulations, informationsystems, business interruption and fraud. An enterprise view of risk is required to identify and manage the consequencesof these common risks and risk drivers on the Company's profitability, capital strength and liquidity which are managed bythe Enterprise Risk Management ("ERM") function who implement the Risk Management Framework.
The RMF is reviewed by the RMC and recommended for approval by the Board, at least annually. The RMF would be reviewedmore regularly if the Company was subject to a major change in regulatory requirements, strategy or organisationalstructure. Due to the formation of Seaview Re, the Company's RAF, which is a component of the RMF, will be revised in linewith the risk profile changes in 2019.
The aim of the RMF is to:
• Support business objectives and strategy; • Provide management information to facilitate the identification and understanding of material risks including related
mitigants; • Contribute to the Company's overall internal control framework by helping to manage the inherent complexity within
the business; and• Support regulatory risk management requirements.
The key components of the RMF are as follows:
The RMC meets quarterly and oversees the implementation and embedding of the RMF and monitoring of Companyperformance against risk appetite. The RMC has responsibility for capital monitoring and makes recommendations andescalates any issues to the Board, related to risk and capital management. The RMC ensures that material and emergingrisks are identified and reported and that appropriate arrangements are in place to manage and mitigate those riskseffectively. The Company's stress testing framework and outputs are reviewed by the RMC and support understanding ofthe risk profile.
Risk Strategy
The risk management strategy is overseen by the Board and supports the delivery of the overall business strategy. Tosupport the Board, the Company has an appointed RM, supported by the AXA XL RM team and the RMC to oversee moredetailed risk management activity and the Board approved risk appetites.
The risk management strategy is to ensure that risk is considered alongside reward in setting the Company's strategic andbusiness objectives. The strategy is articulated in the RMF and risk policies and is achieved by incorporating risk processes,information and decisions in the day to day running of the business.
The Company's strategy involves taking on risk in order to generate return. Risks are selected and controlled or traded offthrough the risk strategy that focuses on:
• Retaining risk within an approved risk appetite that is consistent with the Company's strategic objectives, withappropriate levels of capital held by the Company;
• A diversified portfolio of underwriting and financial markets risks; • Managing excessive aggregation risk via a limit framework; • Exercising consistency and transparency of risk management and control across the entity; • Risk mitigation on key underwriting and financial market risks to protect capital from the impact of extreme events;
and • Risk reporting to the RMC, ExCo, Board and other stakeholders (e.g. regulators).
Risk Appetite
The Company's RAF is a key dimension to the risk management strategy and is used to provide governance for setting newmonitoring requirements as well as reviewing and updating existing risk appetite statements, tolerances and limits so thatthese are aligned with business and risk management strategies. The Company's RAF focuses on regulatory capital at risk,tolerances to risks from material individual events (e.g. natural catastrophes, realistic disaster scenarios ("RDS") that crossmultiple lines of business etc.), liquidity standards, tolerance to specific investment related risks and operational losses.The Board approved risk appetites and risk tolerances were reviewed during 2018 and it was determined that all statementsand tolerances were appropriate to allow the Company to execute the 2019 business plan. Subsequent to year end 2018,in Q1 Seaview Re Ltd in Bermuda was created, fully owned by Seaview Holdings, Inc, a 100% subsidiary of CRCH. A 30%whole account quota share is expected to be placed for 2019 between XLRA and Seaview Re Ltd. This subsidiary will resultin a materially higher risk profile of the Company at January 1, 2019 as compared to 2018 and compelled the Company'sBoard to review its RAF for 2019.
The risk strategy and risk appetite frameworks are supported by the following:
• Risk governance sets out a clear and cost effective organisational structure for risk management, including clear rolesand responsibilities. As part of the Risk Governance Framework the Company operates a ‘Three Lines of Defence’governance structure, at a functional level as well as at a management committee level;
• Risk policies document the Company's approach to the management of each category of risk to which the Companyis exposed;
• Risk definition and categorisation provides a common taxonomy and language for risk to allow for categorisation ofall risks in a way which facilitates links between the business, risk management processes and Internal Capital Model("ICM");
• Risk cycle and processes are the approach taken to top down, bottom up and process led risk identification,quantification and management and control;
• Risk-based decision making ('use test'): The results of the ORSA and the insights gained in the ORSA process are takeninto account for a range of business decisions;
24
• Risk Management information and reporting, including ORSA production ensuring timely and accurate informationis reviewed in line with the governance structure;
• Skills, resources and risk culture. Organisational learning. Change management governance - All enable a maturerisk culture throughout the Company.
Risk Management Information and Reporting
A risk dashboard is presented quarterly to the RMC. The dashboard measures the status against risk appetite statementsand the associated monitoring triggers and limits using the latest output from the business, the ICM, and SST. The dashboardincludes information related to the monitoring against all of the Company's material risk categories. Highlights from thedashboard including performance against appetite and limits are reported to the Board through the risk reporting.
25
C.2.2 Own risk and solvency assessment
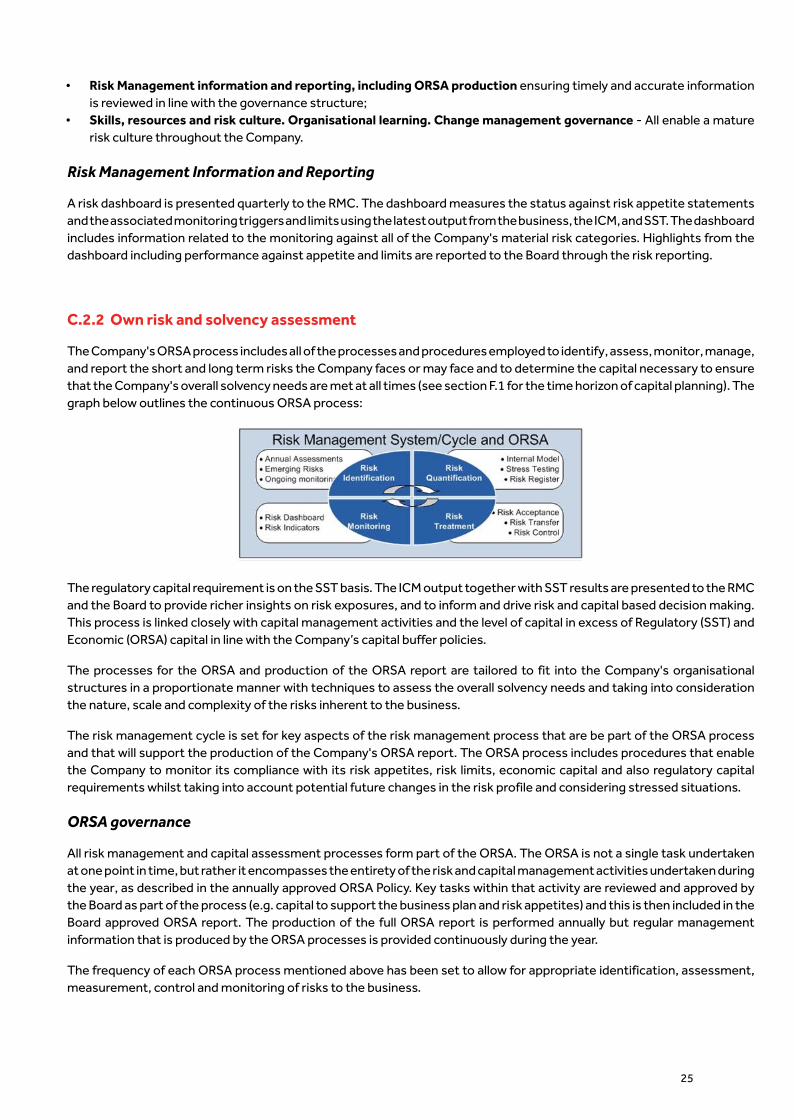
The Company's ORSA process includes all of the processes and procedures employed to identify, assess, monitor, manage,and report the short and long term risks the Company faces or may face and to determine the capital necessary to ensurethat the Company's overall solvency needs are met at all times (see section F.1 for the time horizon of capital planning). Thegraph below outlines the continuous ORSA process:
The regulatory capital requirement is on the SST basis. The ICM output together with SST results are presented to the RMCand the Board to provide richer insights on risk exposures, and to inform and drive risk and capital based decision making.This process is linked closely with capital management activities and the level of capital in excess of Regulatory (SST) andEconomic (ORSA) capital in line with the Company’s capital buffer policies.
The processes for the ORSA and production of the ORSA report are tailored to fit into the Company's organisationalstructures in a proportionate manner with techniques to assess the overall solvency needs and taking into considerationthe nature, scale and complexity of the risks inherent to the business.
The risk management cycle is set for key aspects of the risk management process that are be part of the ORSA processand that will support the production of the Company's ORSA report. The ORSA process includes procedures that enablethe Company to monitor its compliance with its risk appetites, risk limits, economic capital and also regulatory capitalrequirements whilst taking into account potential future changes in the risk profile and considering stressed situations.
ORSA governance
All risk management and capital assessment processes form part of the ORSA. The ORSA is not a single task undertakenat one point in time, but rather it encompasses the entirety of the risk and capital management activities undertaken duringthe year, as described in the annually approved ORSA Policy. Key tasks within that activity are reviewed and approved bythe Board as part of the process (e.g. capital to support the business plan and risk appetites) and this is then included in theBoard approved ORSA report. The production of the full ORSA report is performed annually but regular managementinformation that is produced by the ORSA processes is provided continuously during the year.
The frequency of each ORSA process mentioned above has been set to allow for appropriate identification, assessment,measurement, control and monitoring of risks to the business.
C.2.3 Compliance function
The compliance function is responsible for advising the Company’s management and Board on compliance with applicablelaws, regulations and administrative provisions adopted in accordance with local laws and regulations, and on the impactof changes in the legal and regulatory environment applicable to AXA XL’s operations. The compliance function providesexpertise, advice and support to various departments of the Company to assess situations and compliance matters, analyzecompliance risk and contribute to design solutions to mitigate those risks to which the Company is exposed.
The compliance function manages a wide range of compliance related matters including (i) regular reporting on significantcompliance and regulatory matters to senior management and to regulators, (ii) financial crime matters (which include anti-corruption, anti-bribery, anti-money laundering programs as well as international sanctions/embargo compliance), (iii) dataprivacy, (iv) employee Compliance & Ethics Guide, and (v) the monitoring of compliance and regulatory risks.
The Company’s compliance function undertakes an annual Compliance Risk Assessment to identify the most significantcompliance risks to which the business is exposed. Based on this assessment, an Annual Compliance Plan is developed.
The compliance activities are articulated around a number of Group Standards and Policies which set the minimumrequirements expected to be covered by AXA XL (e.g. Compliance, Anti-Money Laundering, Sanctions, Anti-Bribery). Thecompliance function has adapted the Group requirements and developed local policies to align with the relevant laws andregulations in the jurisdiction in which the Company operates and conducts business.
On a quarterly basis the Company’s compliance function reports directly to the Board on significant compliance matters.These include major regulatory changes that have compliance implications, results of the Compliance Risk Assessment,the Annual Compliance Plan, remediation plans and any other significant issues that require escalation.
26
C.2.4 Material changes in risk management
There were no material changes to the risk management function in 2018.

C.3 Internal control system
27
C.3.1 Framework for Internal Controls
The Company's ‘Three Lines of Defence’ approach, as described in section C.1.3, ensures that effective and robust day today governance is in place. The Internal Audit function provides independent assessment of the effectiveness of theCompany's system of internal control.
In addition, assurance on the controls around financial reporting is provided by AXA XL's Framework for Internal Controls("FIC") function. This function provides reasonable assurance that financial reporting is reliable and compliant withapplicable laws and regulations and provides comfort over the completeness, accuracy and appropriateness of data.
The Framework for Internal Controls function is committed to promoting a robust internal financial control framework forthe RMC, Executive Management and external stakeholders to rely on for financial and regulatory reporting purposes.
FIC’s core strategic objectives include:
• Conducting an effective and efficient assessment of the design and operating effectiveness of internal controls overfinancial reporting;
• Identifying areas in which the inherent risk of financial misstatement is high so that management can address theserisks before they manifest themselves in an actual misstatement;
• Providing the Audit function and Executive Management with conclusions as to the effectiveness of internal controlsover financial reporting; and
• Adding value by helping management promote a robust control environment.
The FIC function performs an annual assessment of the control framework which includes: risk identification, riskassessment and planning, documenting business processes, evaluation and validation of key risks and controls, and issuemanagement.
C.3.2 Internal Audit function
The objectives of the Internal Audit function are to provide assurance that the Company's network of risk management,internal control, and governance processes, as designed and represented by management, is adequate and functioning ina manner to ensure:
• Risks are appropriately identified and managed; • Internal accounting and operating controls are adequate and operating effectively; • Financial, managerial, operating and technology systems information is appropriate, accurate, reliable, and timely; • Compliance with Company policies, standards, procedures, code of conduct and applicable country laws and
regulations; • Resources are acquired economically, used efficiently, and adequately protected; • Programs, plans, and objectives are achieved; • Quality and continuous improvement are fostered in the Company's control processes; • Significant legislative or regulatory issues impacting the Company are recognized and addressed properly; and • Achievement of the Company's strategic objectives.

C.3.2.1 Internal Audit independence
To provide for the independence of the Internal Audit Department, the Head of Internal Audit for the Company reports tothe AXA XL Chief Audit Executive and to the Company's Board. Since finalization of the acquisition by AXA in September2018, the Chief Audit Executive for AXA XL also functionally reports through to AXA’s Global Head of Audit, who reports tothe AXA Group Audit Committee Chairman. Activities performed by Internal Audit do not relieve management of theirassigned responsibilities. Internal Audit has no authority over, or responsibility for, activities audited. Internal Audit will
avoid activities that are not audit functions and that may be perceived to impair audit objectivity.
The Internal Audit Department complies with the International Standards for the Professional Practice of Internal Auditingof The Institute of Internal Auditors ("IIA"). The Standards apply to individual internal auditors and internal audit activities.
All internal auditors are accountable for conforming to the Standards related to individual objectivity, proficiency and dueprofessional care.
The IIA has also established a Code of Ethics which covers basic principles of the internal auditing practice.
Internal Audit has a responsibility to conduct itself so that its good faith and integrity are not open to question.
28
C.3.2.2 Internal Audit work-plan
To most effectively execute the Internal Audit Department’s mission, the audit plan is risk-based and is focused on the keybusiness risks relevant to the Company.
The Annual Risk Assessment process is coordinated with PricewaterhouseCoopers (external auditors) and Framework ofInternal Controls to review the corporate-wide integrated audit universe of business functions, risks, processes andcontrols, as well as with other assurance functions within the Integrated Internal Control Framework, including compliance- monitoring and testing of key compliance risks; and first line underwriting and claims assurance activities (e.g. IndependentUnderwriting Review, Claims Quality Assurance, Delegated Underwriting Governance, and Claims Delegated AuthorityGovernance). Risk assessment includes discussions with management and all designated functions and processes withinthe audit universe are risk assessed based on changing business conditions, the evolving operating environment andassociated risks, among other risk criteria. The Company receives an overall risk rating as well as ratings for each of the fourcomponents of COSO’s ERM Framework (Strategic, Operations, Reporting and Compliance), which are used to produce arisk based annual audit plan. During each year, the audit universe is subject to ongoing risk assessment to identify significantchanges to the universe and risk ratings, which can result in changes to the annual audit plan. The Company’s annual auditplan, along with any key changes to it, are reported to the Company's Board for approval.
All audits are performed and documented in accordance with the IIA Standards.
C.3.2.3 Internal Audit engagement process
The Internal Audit engagement process is set out below:
• Engagement planning: The objectives of this phase are to refine the scope of internal audit activities for theengagement; identify which business processes, systems and controls will be evaluated; determine which techniqueswill be used; manage expectations; and coordinate with FIC (and/or any other assurance providers) and external auditors.
• Risk and control evaluation: The objective of this phase is to understand the business process, the key controls andthe primary risks associated with the business process.
• Fieldwork and testing: The auditor will determine whether the controls supporting the audit objectives are adequatelydesigned and effective through the gathering of audit evidence.
• Reporting: This phase provides a well-supported opinion on the controls in place, provides value addedrecommendations and identifies opportunities to improve the internal control environment.
• Follow-up and closure: The objective of this phase is to monitor the outstanding audit recommendations and agreed-upon audit issue resolutions to ensure their timely implementation.

29
D. Risk profileRisk governance requires that the Company can comprehensively articulate the profile/universe of its risks over which itsgovernance processes operates. To this end, the Company has an agreed approach to the definition and categorisation ofrisks.
The risk universe outlines the major risk categories that the Company has determined it is exposed to:
Insurance Risk Market Risk Credit Risk OperationalRisk Liquidity Risk ALM Risk Strategic Risk
Credit risk includes investment credit risk and reinsurance credit risk. Investment credit risk, market risk and asset-liability-management risk ("ALM", included within market risk) are modelled using the FINMA standard models. Insurance risk andreinsurance credit risk are modelled within the internal model. These are all combined to produce the regulatory capitalrequirement. Liquidity risk, operational risk and strategic risk are not included within the regulatory capital requirement,however, these are monitored on a regular basis.
The risk limit change is subject to the revision of the RAF 2019 by the Company's Board due to the recent changes withrespect to Seaview Re. Using July 1, 2018 exposures, the Company’s largest natural catastrophe exposures are SouthAmerican Earthquake and North American Earthquake and man-made perils such as Systemic Financial Institution ("FI")Loss. However, after taking into account exposures from Seaview Re, North Atlantic Windstorm is expected to increase insignificance.
Reserve risk is a significant driver of insurance risk and hence target capital. This risk is driven by simultaneous deteriorationin held reserves impacting multiple lines of business.
On November 19, 2018, the Company's rating along with other AXA XL core legal entities was upgraded from 'A+' to 'AA-'with stable outlook from S&P mainly driven by the strategic fit and core operation to the AXA Group. Additionally the ratingfrom A.M. Best was upgraded from 'A' to 'A+' stable during the year.
D.1 Insurance risk
Risk definition
Insurance risk is defined using the following categories:
Component Definition
Underwriting risk
Underwriting risk derives from insurance and reinsurance policies written for the current period andalso from unearned exposure from prior periods. The risk is that the corresponding premium will beinsufficient to cover future claims and other costs or more generally that the underwritingprofitability from this tranche of business will be less than expected; Underwriting risk includes man-made catastrophe events and natural catastrophe events.
Reserve risk
Reserve risk relates to policy liabilities (corresponding to business written in prior periods where theexposure has already been earned at the opening balance sheet date) being insufficient to cover thecost of claims and associated expenses until the time horizon for the solvency assessment.Additional risks are that the timing or amount of actual claims pay outs do not align with the timingor amounts of the estimated claims pay outs and that there are changes in the valuation of themarket value margin (risk margin) during the time horizon for solvency assessment.
Lapse risk
Lapse risk is the risk of loss, or of adverse change in the value of insurance future profits, resultingfrom changes in the level or volatility of the rates of policy lapses, terminations, renewals andsurrenders. This includes policies where an assumption has been made about renewal that may notbe warranted based on past experience either in terms of actual treaties or underlying policiesissued and renewable.
Risk identification
Underwriting and loss experience is reviewed regularly for, among other things, loss trends, emerging exposures, changesin the regulatory or legal environment as well as the efficacy of policy terms and conditions. Underwriting risk is alsoidentified through:
• Business planning - Analysis is undertaken of the underwriting portfolio, exposures, loss experience and changes tothe external environment (including market cycle, economic environment) to identify any changes to the insurance riskprofile for the forthcoming period of the budget / business plan;
• Underwriting processes - Each individual contract written is assessed, by the underwriting process (which is subjectto granular underwriting guidelines and escalation authorities) for the nature and level of insurance risk that it brings tothe business including consideration of the exposure by nature of the limit, the risks insured, the location of the risksand other underwriting criteria;
• Reserving and claims process - On an ongoing basis, claims trends are monitored and analysed for any indications ofchange in the nature of the underlying insurance risk;
• Risk reporting and monitoring process - Through these processes, the Company quantifies existing risks and alsoidentifies new risks;
• RDS and other scenarios;• Emerging risk process (see also section D.4); and • Independent underwriting peer reviews - conducted on a risk based approach by the Underwriting Governance team.
Risk mitigation
Reinsurance purchases
The Company participates in the AXA XL managed outwards third party reinsurance risk transfer programme to supportthe Company's underwriting strategy within risk appetite and to ensure efficient use of capital. Business ceded varies bylocation and line of business based on a number of factors, including market conditions. The goals of the outwardsreinsurance risk transfer programme include reducing exposure on individual risks, protecting against catastrophic risks,maintaining acceptable capital ratios and enabling the writing of additional business. The overall goal of the programme isto reduce volatility and enhance overall capital efficiency.
The adequacy of the AXA XL reinsurance strategy as a protection mechanism for the Company is considered and approvedby the Company Board as part of the annual business planning process, and the impact of that strategy is monitoredquarterly by both the RMC and Board.
As of January 1, 2017, the Company purchased an Intra-Group Reinsurance Whole Account Stop Loss ("WASL") cover of a15% loss ratio in excess of a 75% loss ratio on a losses occurring basis, with an event cap of USD 500m. The contract wasrenewed for both January 1, 2018, and January 1, 2019, with identical terms.
Actuarial function
To mitigate the risk of large changes of reserves from one period to the next which are not due to external but to internalfactors such as human errors, the reserving process performed by the Actuarial Function is highly structured and strictlydefined and controlled and includes several layers of oversight.
Rate adequacy
Underwriters are supported by dedicated teams of claims personnel and pricing actuaries. Premiums are set and adjustedbased, in large part, on the underlying perceived risk of the reinsured relative to the other risks in that group. The ratingmethodology used for reinsureds seeks to set premiums in accordance with claims potential. Underwriting guidelines andpolicy forms differ by product offering as well as by legal jurisdiction.
30

Underwriting authorities and guidelines
All underwriters are assigned individual underwriting authorities with the objective of preserving the capital base andcontrolling earnings volatility. Authorities within the business units are delegated through the underwriting managementstructure and the annual review of underwriting limits is part of the business planning process. Authorities are also set inline with agreed risk appetites and risk tolerances for material individual events, RDS that cross multiple lines of businessand from risks related to some or all of the above that may occur concurrently.
The Company underwrites and prices most risks individually following a review of the exposure and in accordance with itsunderwriting guidelines. The Company seeks to meet its clients' needs while controlling its exposure both on a portfoliobasis and on individual reinsurance contracts through terms and conditions, policy limits and sub-limits, attachment pointsand ceded reinsurance arrangements on certain types of risks.
Risk monitoring
On a quarterly basis catastrophe exposures are measured and monitored and reported to the RMC and Board. RDS areproduced twice a year and monitored and reported to the RMC and Board as outlined in section C.1.3.
In relation to event risk management, net underwriting risk tolerances are established for the individual largest events inthe risk profile. These are captured through risk reporting to the RMC and Board and monitored as part of the RAF. Thefollowing outlines the Company's underwriting risk appetite statements:
Risk type CRCH Risk appetite statement
Underwriting risk- The 1% TVaR per event limits (occurrence exceedance probability) for the key Natural CatastrophePerils approved by the Board. - Board approved limits for key RDS.
The Company monitors prior year development on its held reserves on an ongoing basis. The Company has enhanced itsrisk monitoring processes by developing a set of triggers on its key risks (including reserve risk).
For further information regarding the monitoring of insurance risk through the RMF and RAF, please see section C.2.1.
Stress testing
There is an embedded stress testing framework that is used to understand possible impacts of major risks, includingunderwriting and reserving risks. These impacts include the earnings, underwriting, investments, liquidity and capitalimplications of low frequency, high severity events. For underwriting risks the main stress tests approaches used covernatural catastrophe peril exposure results production and RDS production as outlined below.
Test type Reason performed
Natural Catastrophe reporting To monitor Nat Cat exposures against risk appetite
RDS reporting To monitor non-Nat Cat exposures against risk appetite and to assist in the setting of overall risklimits
Natural catastrophe exposure and RDS exposure results are used to monitor exposure to the defined scenarios and monitorcompliance with underwriting risk tolerances and limits. RDS are produced at least twice per year to understand theCompany's exposure to defined non-Nat Cat scenarios, which have been designed by experts and cover both short andlong tail lines of business and cross class event exposures. The RMC (and Board) are informed of results of stress testsperformed via risk dashboards and the ORSA report throughout the year where discussions and challenge whether theresults fall within relevant approved risk tolerances and limits.
The Company undertakes a range of extreme events intended to stress the capital position. Considering the 1% TVaRunderwriting risk, the key natural catastrophe exposures for the Company at July 1, 2018, include South AmericanEarthquake and North American Earthquake. The 1% TVaR exposure is measured on a per event net occurrence exceedance
31
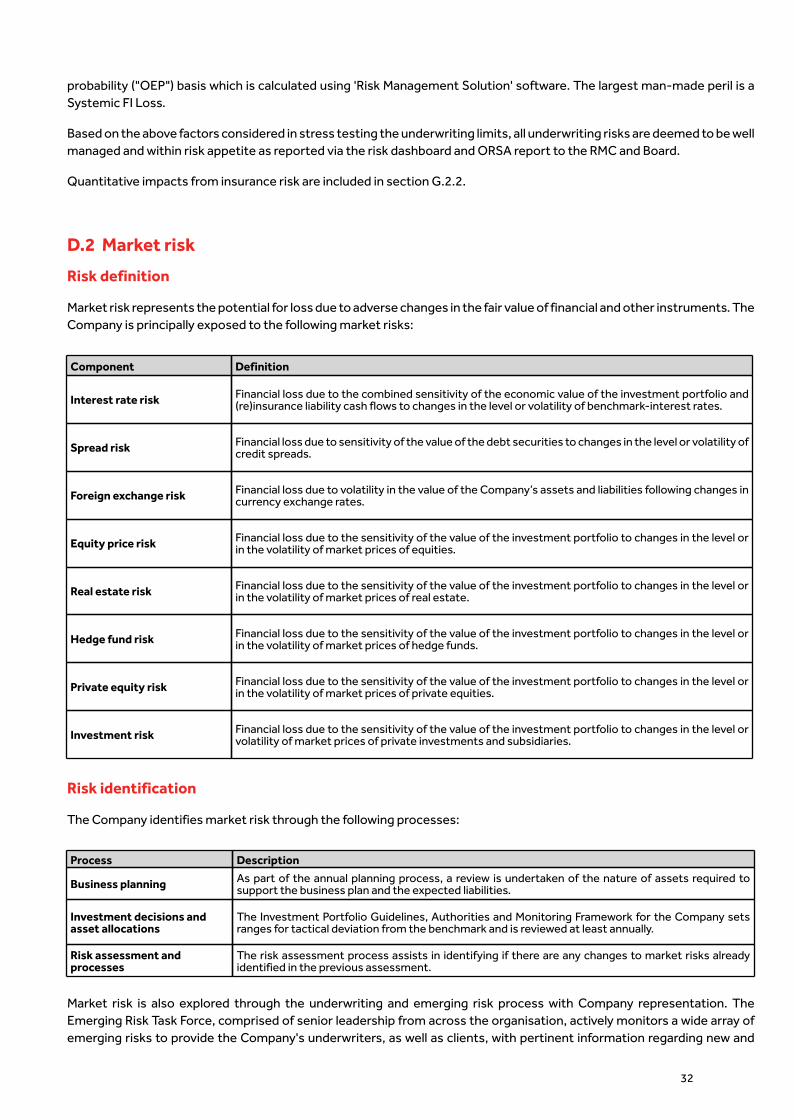
probability ("OEP") basis which is calculated using 'Risk Management Solution' software. The largest man-made peril is aSystemic FI Loss.
Based on the above factors considered in stress testing the underwriting limits, all underwriting risks are deemed to be wellmanaged and within risk appetite as reported via the risk dashboard and ORSA report to the RMC and Board.
Quantitative impacts from insurance risk are included in section G.2.2.
32
D.2 Market risk
Risk definition
Market risk represents the potential for loss due to adverse changes in the fair value of financial and other instruments. TheCompany is principally exposed to the following market risks:
Component Definition
Interest rate risk Financial loss due to the combined sensitivity of the economic value of the investment portfolio and(re)insurance liability cash flows to changes in the level or volatility of benchmark-interest rates.
Spread risk Financial loss due to sensitivity of the value of the debt securities to changes in the level or volatility ofcredit spreads.
Foreign exchange risk Financial loss due to volatility in the value of the Company’s assets and liabilities following changes incurrency exchange rates.
Equity price risk Financial loss due to the sensitivity of the value of the investment portfolio to changes in the level orin the volatility of market prices of equities.
Real estate risk Financial loss due to the sensitivity of the value of the investment portfolio to changes in the level orin the volatility of market prices of real estate.
Hedge fund risk Financial loss due to the sensitivity of the value of the investment portfolio to changes in the level orin the volatility of market prices of hedge funds.
Private equity risk Financial loss due to the sensitivity of the value of the investment portfolio to changes in the level orin the volatility of market prices of private equities.
Investment risk Financial loss due to the sensitivity of the value of the investment portfolio to changes in the level orvolatility of market prices of private investments and subsidiaries.
Risk identification
The Company identifies market risk through the following processes:
Process Description
Business planning As part of the annual planning process, a review is undertaken of the nature of assets required tosupport the business plan and the expected liabilities.
Investment decisions andasset allocations
The Investment Portfolio Guidelines, Authorities and Monitoring Framework for the Company setsranges for tactical deviation from the benchmark and is reviewed at least annually.
Risk assessment andprocesses
The risk assessment process assists in identifying if there are any changes to market risks alreadyidentified in the previous assessment.
Market risk is also explored through the underwriting and emerging risk process with Company representation. TheEmerging Risk Task Force, comprised of senior leadership from across the organisation, actively monitors a wide array ofemerging risks to provide the Company's underwriters, as well as clients, with pertinent information regarding new and
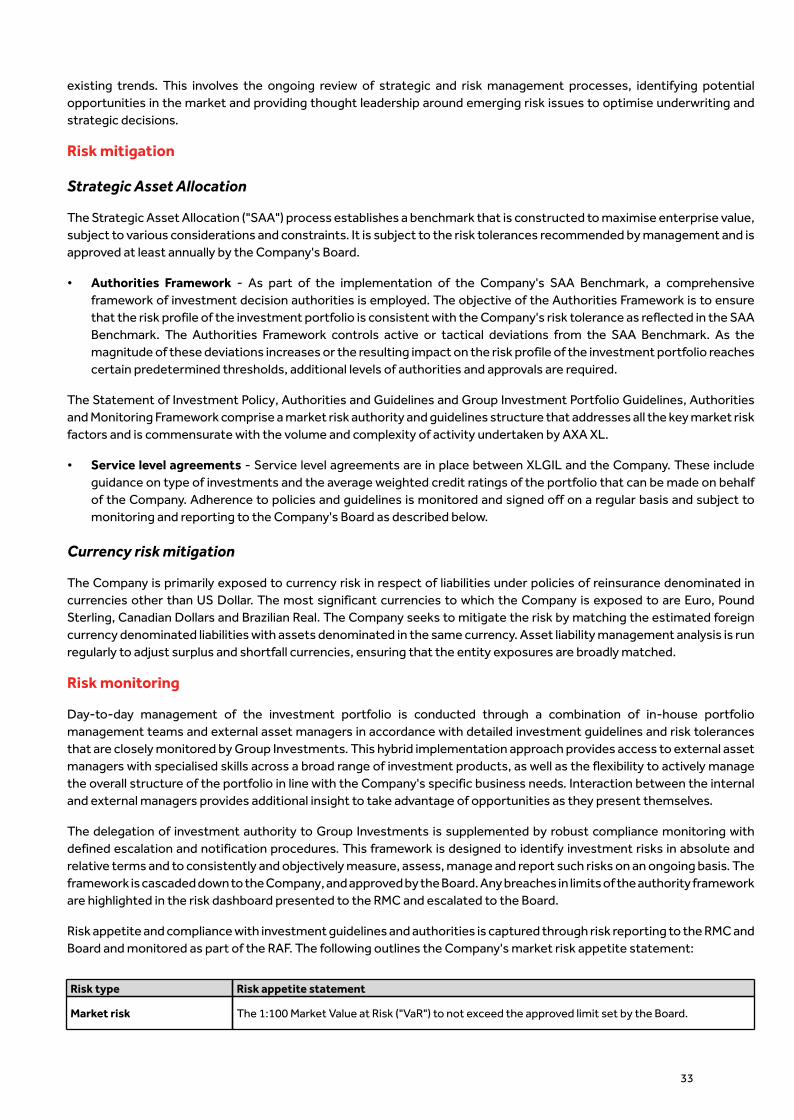
existing trends. This involves the ongoing review of strategic and risk management processes, identifying potentialopportunities in the market and providing thought leadership around emerging risk issues to optimise underwriting andstrategic decisions.
Risk mitigation
Strategic Asset Allocation
The Strategic Asset Allocation ("SAA") process establishes a benchmark that is constructed to maximise enterprise value,subject to various considerations and constraints. It is subject to the risk tolerances recommended by management and isapproved at least annually by the Company's Board.
• Authorities Framework - As part of the implementation of the Company's SAA Benchmark, a comprehensiveframework of investment decision authorities is employed. The objective of the Authorities Framework is to ensurethat the risk profile of the investment portfolio is consistent with the Company's risk tolerance as reflected in the SAABenchmark. The Authorities Framework controls active or tactical deviations from the SAA Benchmark. As themagnitude of these deviations increases or the resulting impact on the risk profile of the investment portfolio reachescertain predetermined thresholds, additional levels of authorities and approvals are required.
The Statement of Investment Policy, Authorities and Guidelines and Group Investment Portfolio Guidelines, Authoritiesand Monitoring Framework comprise a market risk authority and guidelines structure that addresses all the key market riskfactors and is commensurate with the volume and complexity of activity undertaken by AXA XL.
• Service level agreements - Service level agreements are in place between XLGIL and the Company. These includeguidance on type of investments and the average weighted credit ratings of the portfolio that can be made on behalfof the Company. Adherence to policies and guidelines is monitored and signed off on a regular basis and subject tomonitoring and reporting to the Company's Board as described below.
Currency risk mitigation
The Company is primarily exposed to currency risk in respect of liabilities under policies of reinsurance denominated incurrencies other than US Dollar. The most significant currencies to which the Company is exposed to are Euro, PoundSterling, Canadian Dollars and Brazilian Real. The Company seeks to mitigate the risk by matching the estimated foreigncurrency denominated liabilities with assets denominated in the same currency. Asset liability management analysis is runregularly to adjust surplus and shortfall currencies, ensuring that the entity exposures are broadly matched.
Risk monitoring
Day-to-day management of the investment portfolio is conducted through a combination of in-house portfoliomanagement teams and external asset managers in accordance with detailed investment guidelines and risk tolerancesthat are closely monitored by Group Investments. This hybrid implementation approach provides access to external assetmanagers with specialised skills across a broad range of investment products, as well as the flexibility to actively managethe overall structure of the portfolio in line with the Company's specific business needs. Interaction between the internaland external managers provides additional insight to take advantage of opportunities as they present themselves.
The delegation of investment authority to Group Investments is supplemented by robust compliance monitoring withdefined escalation and notification procedures. This framework is designed to identify investment risks in absolute andrelative terms and to consistently and objectively measure, assess, manage and report such risks on an ongoing basis. Theframework is cascaded down to the Company, and approved by the Board. Any breaches in limits of the authority frameworkare highlighted in the risk dashboard presented to the RMC and escalated to the Board.
Risk appetite and compliance with investment guidelines and authorities is captured through risk reporting to the RMC andBoard and monitored as part of the RAF. The following outlines the Company's market risk appetite statement:
Risk type Risk appetite statement
Market risk The 1:100 Market Value at Risk ("VaR") to not exceed the approved limit set by the Board.
33
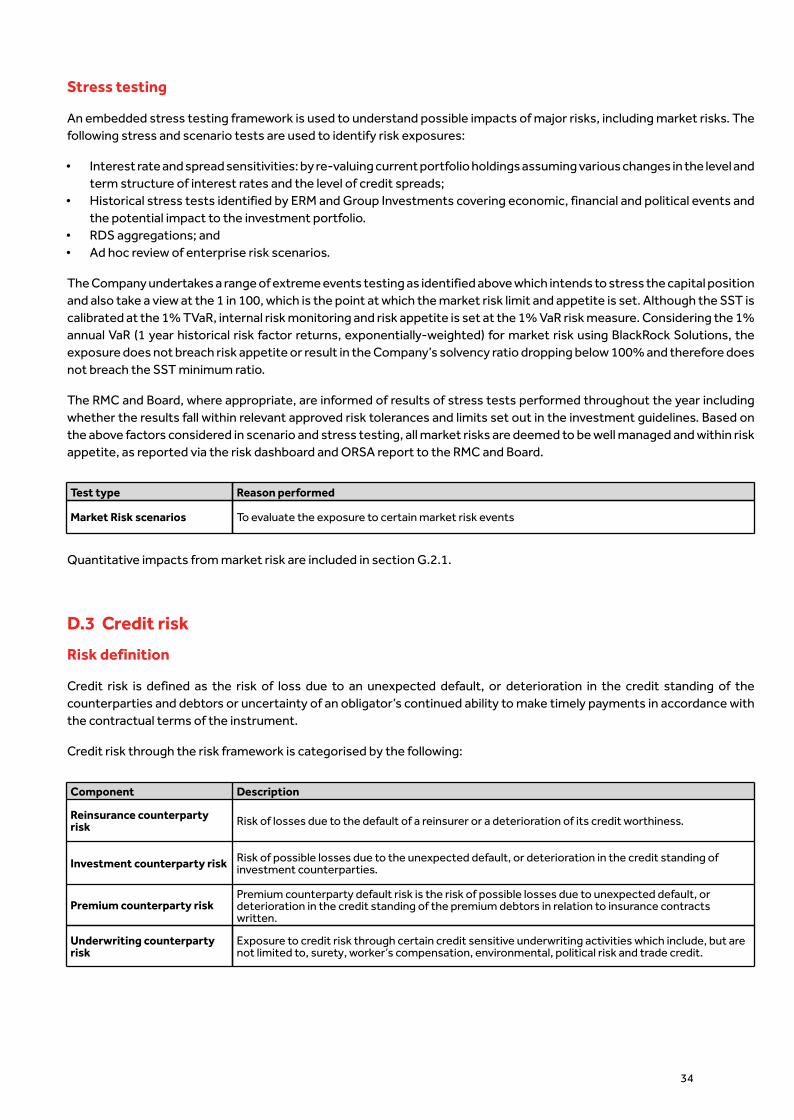
Stress testing
An embedded stress testing framework is used to understand possible impacts of major risks, including market risks. Thefollowing stress and scenario tests are used to identify risk exposures:
• Interest rate and spread sensitivities: by re-valuing current portfolio holdings assuming various changes in the level andterm structure of interest rates and the level of credit spreads;
• Historical stress tests identified by ERM and Group Investments covering economic, financial and political events andthe potential impact to the investment portfolio.
• RDS aggregations; and • Ad hoc review of enterprise risk scenarios.
The Company undertakes a range of extreme events testing as identified above which intends to stress the capital positionand also take a view at the 1 in 100, which is the point at which the market risk limit and appetite is set. Although the SST iscalibrated at the 1% TVaR, internal risk monitoring and risk appetite is set at the 1% VaR risk measure. Considering the 1%annual VaR (1 year historical risk factor returns, exponentially-weighted) for market risk using BlackRock Solutions, theexposure does not breach risk appetite or result in the Company’s solvency ratio dropping below 100% and therefore doesnot breach the SST minimum ratio.
The RMC and Board, where appropriate, are informed of results of stress tests performed throughout the year includingwhether the results fall within relevant approved risk tolerances and limits set out in the investment guidelines. Based onthe above factors considered in scenario and stress testing, all market risks are deemed to be well managed and within riskappetite, as reported via the risk dashboard and ORSA report to the RMC and Board.
Test type Reason performed
Market Risk scenarios To evaluate the exposure to certain market risk events
Quantitative impacts from market risk are included in section G.2.1.
34
D.3 Credit risk
Risk definition
Credit risk is defined as the risk of loss due to an unexpected default, or deterioration in the credit standing of thecounterparties and debtors or uncertainty of an obligator’s continued ability to make timely payments in accordance withthe contractual terms of the instrument.
Credit risk through the risk framework is categorised by the following:
Component Description
Reinsurance counterpartyrisk Risk of losses due to the default of a reinsurer or a deterioration of its credit worthiness.
Investment counterparty risk Risk of possible losses due to the unexpected default, or deterioration in the credit standing ofinvestment counterparties.
Premium counterparty riskPremium counterparty default risk is the risk of possible losses due to unexpected default, ordeterioration in the credit standing of the premium debtors in relation to insurance contractswritten.
Underwriting counterpartyrisk
Exposure to credit risk through certain credit sensitive underwriting activities which include, but arenot limited to, surety, worker’s compensation, environmental, political risk and trade credit.
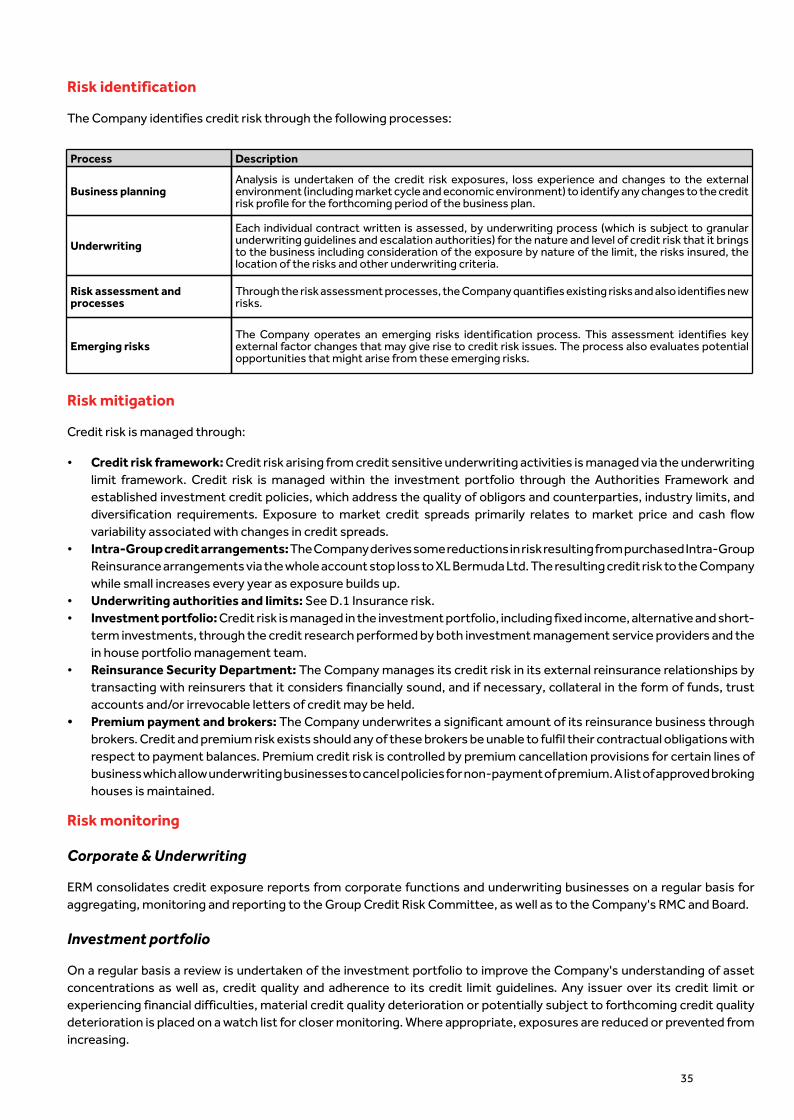
Risk identification
The Company identifies credit risk through the following processes:
Process Description
Business planningAnalysis is undertaken of the credit risk exposures, loss experience and changes to the externalenvironment (including market cycle and economic environment) to identify any changes to the creditrisk profile for the forthcoming period of the business plan.
Underwriting
Each individual contract written is assessed, by underwriting process (which is subject to granularunderwriting guidelines and escalation authorities) for the nature and level of credit risk that it bringsto the business including consideration of the exposure by nature of the limit, the risks insured, thelocation of the risks and other underwriting criteria.
Risk assessment andprocesses
Through the risk assessment processes, the Company quantifies existing risks and also identifies newrisks.
Emerging risksThe Company operates an emerging risks identification process. This assessment identifies keyexternal factor changes that may give rise to credit risk issues. The process also evaluates potentialopportunities that might arise from these emerging risks.
Risk mitigation
Credit risk is managed through:
• Credit risk framework: Credit risk arising from credit sensitive underwriting activities is managed via the underwritinglimit framework. Credit risk is managed within the investment portfolio through the Authorities Framework andestablished investment credit policies, which address the quality of obligors and counterparties, industry limits, anddiversification requirements. Exposure to market credit spreads primarily relates to market price and cash flowvariability associated with changes in credit spreads.
• Intra-Group credit arrangements: The Company derives some reductions in risk resulting from purchased Intra-GroupReinsurance arrangements via the whole account stop loss to XL Bermuda Ltd. The resulting credit risk to the Companywhile small increases every year as exposure builds up.
• Underwriting authorities and limits: See D.1 Insurance risk. • Investment portfolio: Credit risk is managed in the investment portfolio, including fixed income, alternative and short-
term investments, through the credit research performed by both investment management service providers and thein house portfolio management team.
• Reinsurance Security Department: The Company manages its credit risk in its external reinsurance relationships bytransacting with reinsurers that it considers financially sound, and if necessary, collateral in the form of funds, trustaccounts and/or irrevocable letters of credit may be held.
• Premium payment and brokers: The Company underwrites a significant amount of its reinsurance business throughbrokers. Credit and premium risk exists should any of these brokers be unable to fulfil their contractual obligations withrespect to payment balances. Premium credit risk is controlled by premium cancellation provisions for certain lines ofbusiness which allow underwriting businesses to cancel policies for non-payment of premium. A list of approved brokinghouses is maintained.
Risk monitoring
Corporate & Underwriting
ERM consolidates credit exposure reports from corporate functions and underwriting businesses on a regular basis foraggregating, monitoring and reporting to the Group Credit Risk Committee, as well as to the Company's RMC and Board.
Investment portfolio
On a regular basis a review is undertaken of the investment portfolio to improve the Company's understanding of assetconcentrations as well as, credit quality and adherence to its credit limit guidelines. Any issuer over its credit limit orexperiencing financial difficulties, material credit quality deterioration or potentially subject to forthcoming credit qualitydeterioration is placed on a watch list for closer monitoring. Where appropriate, exposures are reduced or prevented fromincreasing.
35
Stress testing
There is an embedded stress testing framework that is used to understand possible impacts of major risks, including creditrisks. Stress tests and scenario analysis are undertaken to monitor exposure to the defined scenarios that allows monitoringof exposure to credit risks. These scenarios help to understand potential losses to ensure that the Company is prepared towithstand projected losses from these events, including ensuring that there is adequate capital, and liquidity to managethrough the event and maintain the Company as a going concern. Based on the factors considered in scenario and stresstesting, all credit risks are deemed to be well managed.
The quantitative impacts from credit risk are included in section G.2.3.
36
D.4 Operational risk
Risk definition
The Company defines operational risk as the risk of loss, resulting from inadequate or failed internal controls and / orprocesses, or from people and systems, or from external events. In line with business objectives, the Company does nottake on operational risk with a view to achieving enhanced return. Rather, it accepts operational risk as a consequence ofwriting reinsurance business and having operations to support the writing of that business. Impacts of the AXA transitionhave been actively monitored by the RMC through 2018 and will continue to be monitored throughout 2019.
Risk identification
Operational risk is identified through the following processes:
Process Description
Annual risk assessment A risk register is maintained of the material risks faced by the Company. On an annual basis (or moreoften if needed) an assessment is performed for the risks on the risk register.
Consultation regarding newregulations
When the regulatory authorities announce potential changes to the regulatory environment (such asnew rules and regulations) the Legal and Compliance team is responsible for reviewing the proposedchanges and for highlighting any increase in regulatory risk that might arise.
When new financial reporting regulations are announced, the CFO is responsible for reviewing theproposed changes and for highlighting any increase in regulatory risk that might arise.
Business planning Any changes to the operational risk environment that arise as a result of the business planning (suchas entry into new territories) must be identified and accounted for during the planning process.
Ongoing operationsFunction heads and risk owners are responsible for identifying any new (or changed) risks during thenormal course of business, and notifying the policy owners so any required changes to the risk registercan be implemented.
Emerging risksThe Company benefits from a Group wide emerging risks identification process which capturesemerging risks. This assessment identifies key external factor changes that may give rise to operationalrisk issues.
Internal loss dataThe Company benefits from a Group process which collects data relating to operational risk losses andnear misses on a quarterly basis. The data collected is used, among other things, to track incidents,identify key risk indicators and to validate and challenge operational risk quantification.
External loss data The Company benefits from a Group process which purchases historical loss data from an externalprovider. Large events from this database are used to identify new emerging risks.
As a result from the annual risk assessment, the following ranking occurred for top operational risks in 2018:
• Investment data quality issue, data entry error, coding error, incomplete or not timely• Intentionally circumventing underwriting limits• Contracts intentionally modified by unauthorised employee• Reserving data quality issues, data entry error, coding error, incomplete or not timely• Non compliance with other regulation and legislation - Compliance

Conclusion: All risks were deemed to be within acceptable levels with appropriate controls in place.
As a result from the process of internal loss data/near misses gathering, there were no losses with significant financialimpact.
Risk mitigation
The Company’s operational risk policy and risk register details the controls in place that mitigate specific risks. The natureof the controls (e.g. preventative or detective; manually operated or automatic) and the strength of control exercised arein line with the 'three line of defence' model in section C.1.3 and based upon the:
• Potential severity of the risk; • Frequency of the risk occurring; • Cost of implementing controls relative to the significance of the risk; and • Appetite and tolerance for the risk.
Purchase of insurance
It is recognised that while the Company may buy insurance with the aim of reducing the monetary impact of certainoperational risk events (e.g. physical damage), non-monetary impacts may remain (including impact on the Company’sreputation). This is considered in the risk assessment process and risk register.
The risks are monitored and managed through the risk framework and the operational loss event reporting process.
Based on the above factors considered in scenario and stress testing, all operational risks are deemed to be well managedand within risk appetite, as reported via the risk dashboard and ORSA report to the RMC and Board.
Risk monitoring
Risk appetite is captured through risk reporting to the RMC and Board and monitored as part of the RAF. The followingoutlines the Company's operational risk appetite statement:
Risk type Risk appetite statement
Operational riskEmployees should conduct themselves in accordance with the Company’s Code of Conduct.Employees will conduct the Company's business in such a way as to comply with laws andregulations. The Company will comply with the RMF.
Stress testing
To support the identification and quantification of operational risks within the business and to help parameterise the internalmodel, the Company has a stress and scenario testing framework.
The stress testing includes multiple operational risk scenarios which are evaluated over multiple return periods for eachscenario.
In addition, CRCH has a Business Continuity Management ("BCM") plan and policy in place. The BCM program is focused onmitigating business disruption risk and provides the guidance and framework to ensure continuation of essential operationsin the event of a business disruption or threat of one. A Swiss Crisis Management Team is in place which meets at least twicea year to discuss existing and emerging risks.
37
D.5 Other material risks
38
D.5.1 Liquidity risk
Risk definition
Liquidity risk is defined as the inability to meet cash and collateral posting obligations when they come due. Liquidity riskarises from three principal areas: operating, financing and investing cash flows. The RMF addresses how the Companymanages liquidity both under a normal and a stressed environment.
Risk identification
The Company identifies liquidity risk through the following processes:
Process Description
Stress testing Stressing known and forecasted liquidity positions, downgrade triggers, collateral demands and cashflows by legal entity to cover a 1:100 Nat Cat loss over a twelve month horizon.
Treasury Treasury has responsibility to identify and monitor concentration risk of cash at banks, along withfunding requirements.
Risk assessment andprocesses
Through the risk assessment processes, the Company quantifies existing risks and also identifies newrisks.
For the Company, liquidity risk is mainly driven by the following factors:
• Significant exposure to natural catastrophes;• Ring-fencing of assets supporting existing liabilities; and• Collateralisation requirements mainly in connection with its writing of US reinsurance business.
The Company has the necessary resources available to meet its stressed liquidity requirements. This includes its ability tohave access, with Group consent, to the Group's USD 750m unsecured credit facility.
Risk mitigation
One of the principal objectives of liquidity risk management is to ensure that there is readily available access to funds withwhich to settle large or multiple unforeseen claims. It is generally expected that positive cash flow from operations(underwriting activities and investment income) will be sufficient to cover cash outflows under most future loss scenarios.
Cash requirements include all possible claims on cash from policyholders, shareholders and operations. Some of these cashoutflows are scheduled while others are known with much less certainty. The goal is to ensure sufficient liquidity in the assetportfolio, together with secured external cash sources, to provide for timely payment of potential cash demands underboth normal business conditions and under extreme conditions resulting from unforeseen events over a 12 month horizon.
Liquidity risk is managed through:
• Investment portfolio liquidity - The annual SAA process determines the structure of the benchmark that maximisesthe value of the Company subject to risk tolerance and other constraints. The key output of the SAA process is aninvestment portfolio benchmark, which takes into account management’s risk tolerance, liability cash flows, businessplan, peer analysis and regulatory considerations.
• Asset Liability Management ("ALM") - See section D.5.2 for further details of the ALM framework.• Special funding clauses - The major source of liquidity risk within underwriting contracts is the provision of rating
triggers, which are common practice. These triggers typically necessitate the cancellation of the policy and the returnof the cedant’s unearned premium in the event of being downgraded below a certain rating level, which has the potentialto be a material liquidity event when aggregated. There are controls in place to ensure that there is appropriateauthorisation for the inclusion of a downgrade clause in a contract.

Risk monitoring
The Treasury department serves as the focal point for liquidity monitoring, drawing on the expertise of other internalfunctions, as well as managing cash held at bank accounts covering day to day cash requirements, typically referred to asoperating cash. Operating cash balances, together with cash managed within the investments portfolio, comprise theprimary sources of liquidity with the Company as well as the access to the AXA XL's notional cash pool facility.
Risk appetite is captured through risk reporting to the RMC and Board and monitored as part of the RAF. The followingoutlines the Company's Liquidity risk appetite statement:
Risk type Risk appetite statement
Liquidity risk Ensure there are sufficient liquid assets to fund all obligations in the event that ratings downgradetriggers are hit following a pre-defined stress scenario.
Risk appetite links directly to the stress testing framework outlined below.
Stress testing
There is an embedded stress testing framework that is used to understand possible impacts of major risks, including liquidityrisks. A stressed liquidity analysis report is prepared on a quarterly basis by Treasury, which includes the Company’s ownview of the stressed sources and uses of liquidity. The analysis includes actual and forecasted stressed liquidity positions,downgrade triggers, collateral demands, market values in our investment portfolio and cash flows for the Company.
Based on the above factors considered in scenario and stress testing, all liquidity risks are deemed to be well managed andwithin risk appetite, as reported via the risk dashboard and ORSA report to the RMC and Board.
39
D.5.2 Asset liability mismatch risk
Risk definition
Asset liability mismatch risk arises directly from a mismatch between assets and liabilities due to changes in market andcredit risks, liquidity and foreign exchange and also arises from events affecting both asset and liability values.
In particular, two market risks influence both assets and liabilities and are hence key drivers of risk:
Component Definition
Interest rate and spread riskand asset composition risk
A mismatch between asset composition and maturities and the profile of liability cash flows createseconomic risks from changes in benchmark interest rates, spreads and asset values. This is due tochanges in the nominal mark-to-market ("MTM") value of assets not exactly offsetting changes inthe nominal economic value (net-present value) of liability cash flows.
Inflation risk
Differences in the inflation sensitivity of investments, liability and debt cash flows create a risk tounexpected changes in different types of inflation (consumer price index, wage, etc.). This is due tochanges in the real MTM value of assets not offsetting changes in the real economic value (net-present value) of liability cash flows.
Foreign exchange (“FX”) risk is also a key consideration under asset liability mismatch risk which was outlined in sectionD2 Market risk. FX risk arises from mismatches in the currency denomination of assets relative to financial liabilities.
Risk identification
The following outlines the processes used to identify asset liability mismatch risk:
Process Description
Business planningAs part of the annual strategic planning process, a review is undertaken of the nature (quality,duration, currency and liquidity) of assets required to support the business plan and the expectedliabilities.
Investment decisions andasset allocation
The Investment Portfolio Guidelines, Authorities and Monitoring Framework sets ranges for tacticaldeviation from the benchmark and is reviewed annually in conjunction with the SAA process asoutlined in C2 Market Risk.
Risk assessment andprocesses
The risk assessment processes assists in identifying if there are any changes to ALM risks fromthose that had been identified in the previous risk assessment.
Risk monitoring
The Company controls asset liability mismatch risk through:
• Asset Liability Management analysis - The Company conducts detailed ALM analyses to match the average durationof its liabilities with appropriate assets.
• Investment authorities and guidelines - Board approved market risk authority and guidelines are in place that addressall the key market risk factors and are commensurate with the volume and complexity of activity undertaken by theCompany.
• Reserving process controls - Among the key drivers of the Company's reserve risks are inflation, correlation acrosslines of business, legislative and regulatory changes, loss trend movements, timing and reporting changes at underlyingceding companies, and the excess nature of exposures in certain lines including non-proportional reinsurance.
Stress testing
The Company uses scenario testing as one method to assess asset liability mismatch risk exposures. CRCH undertakes anumber of stress tests covering historical events and hypothetical scenarios to understand the impact of such scenariosto the investment portfolio.
40
D.5.3 Strategic Risk
A strategic risk is the risk that a negative impact (current or prospective) on earnings or capital, material at the Group level,arises from a lack of responsiveness to industry changes or adverse business decisions regarding:
• Significant changes in footprint, including through mergers and acquisitions; • Product offering and client segmentation; and• Distribution model (channel mix including alliances/partnerships, multi-access and digital distribution).
Given the nature of strategic risks, there is no capital charge assessment but rather a strong strategic risk managementframework in place in order to assess, anticipate and mitigate these risks.
D.6 Off-balance-sheet risks
The Company is committed to an operating lease agreement until September 30, 2019, as a lessee of office space.Management decided to consolidate Zurich offices whereby Catlin Re’s office space was vacated during 2016. In 2017 theZurich office was sublet. The difference between the remaining lease obligations less the sub-rental income was fullyexpensed in the 2017 fiscal year in the administration and other expenses line item. As a result, the Company is not exposedto any further non-cancellable future obligations as per the balance sheet date.
The Company has access to unsecured and secured letter of credit facilities to support its reinsurance business. As atDecember 31, 2018, unsecured irrevocable letters of credit in the amount of CHF 44m (2017: CHF 122m) have beenissued under these facilities.
These letters of credit are used to secure the reserves ceded to the Company under certain reinsurance contracts.
41
D.7 Risks transferred to special purpose vehicles ("SPV")
CRCH is one of three investors in XL Value Offshore LLC, along with two other fully owned affiliates of AXA. Administrativematters between XLGIL, as investment manager, and XL Value Offshore are detailed in the LLC agreement and theInvestment Management Services Agreement.
This structure allows the Company to better diversify its investments within the former Special Situations Portfolio byindirectly participating in all underlying securities of the SPV. The membership in the SPV does not materially impact theresults of the SST as a look-through is applied on the underlying securities that are modelled within Market Risk.
CRCH discloses the SPV as investments in affiliated companies in its statutory financial statements. It is valued at the lowerof cost or market value. The book value of the SPV as per December 31, 2018, amounts to CHF 62m and can be seen insection A.2 Group information and group related transactions.
D.8 Risk concentrations
Assets
Catlin Re has an extensive set of processes and controls in respect of its investment portfolio which include continuousportfolio monitoring to ensure that concentration to issuers, countries and industries do not exceed its stated risk appetite.
Corporate and Government bonds account for 67% of the total investment portfolio, with approximately USD 1,381m ofthe invested assets being corporate bonds, the largest exposure to a single issuer is approximately USD 33m.
The Company uses the FINMA Standard Model to model the credit risk of its invested assets. Credit risk in respect of theoutwards reinsurance is modelled using the internal model (section G.2.2).
A portion of assets are held as Funds at Lloyd’s (“FAL”). The funds withheld exposure to CRCH was reduced to zero in 2018as the underlying internal quota share was settled for the one remaining open year of account. The FAL decreased byapproximately CHF 20m during 2018, and is expected to reduce to zero in 2019.
Catlin Re has limited external retroceded business and most material third-party agreements are collateralised.
Liabilities
Underwriting risk concentrations are included in the 'threat' scenarios process which explicitly takes into accountunderwriting risk concentrations that cross multiple lines of business. Natural catastrophe losses are modelled usingexternal vendor models such as RMS. The output from the vendor models is examined using other proprietary tools whichsimulate losses for these threats. Section G.2.2 provides more details.

Management of risk concentrations
The Company seeks to manage its asset and liability exposures within a robust, but flexible RAF. Details around the toolsused to reduce risk and of the processes used to monitor the ongoing effectiveness are described in section C.2.1.
Legal entity risk limits and tolerances are aligned to the AXA XL limits, where applicable, through the budget process andlocal underwriting governance. The net aggregate amount is translated through to underwriters as a series of individuallimits on both individual risks or normal maximum lines ("NML's") and foreseeable maximum accumulations on a peroccurrence basis, gross of reinsurance. Individual risks and threats are managed within agreed limits.
42
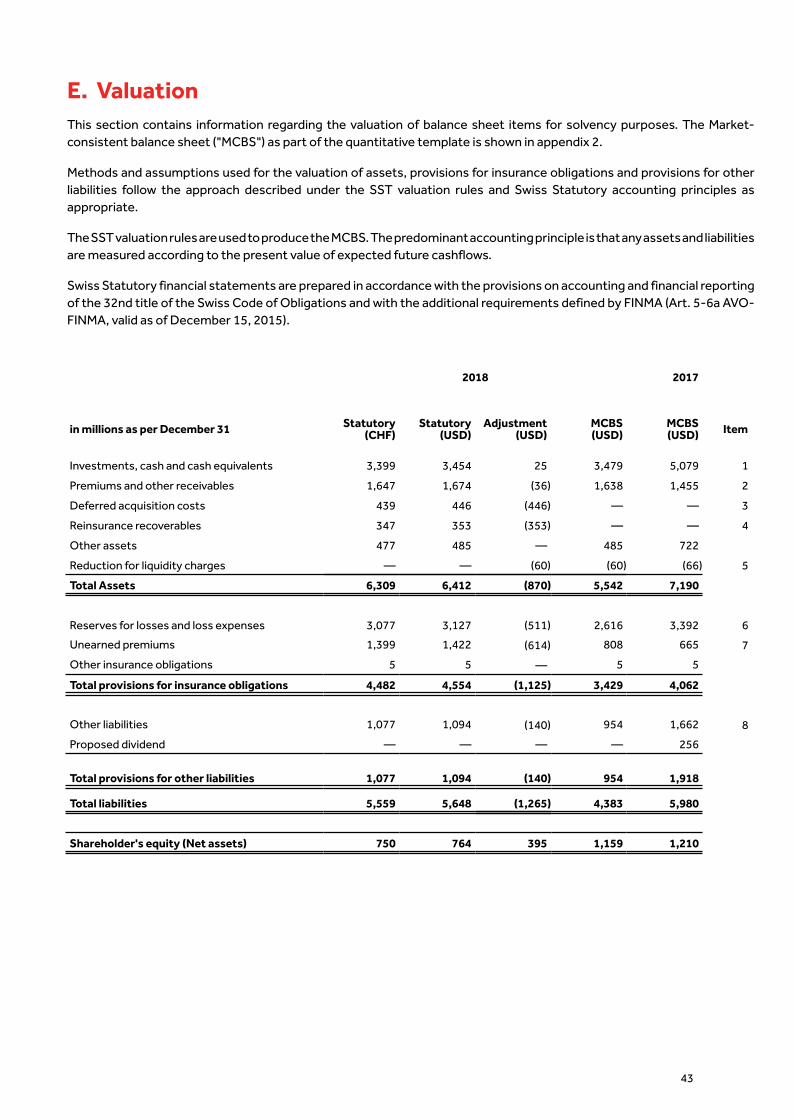
E. ValuationThis section contains information regarding the valuation of balance sheet items for solvency purposes. The Market-consistent balance sheet ("MCBS") as part of the quantitative template is shown in appendix 2.
Methods and assumptions used for the valuation of assets, provisions for insurance obligations and provisions for otherliabilities follow the approach described under the SST valuation rules and Swiss Statutory accounting principles asappropriate.
The SST valuation rules are used to produce the MCBS. The predominant accounting principle is that any assets and liabilitiesare measured according to the present value of expected future cashflows.
Swiss Statutory financial statements are prepared in accordance with the provisions on accounting and financial reportingof the 32nd title of the Swiss Code of Obligations and with the additional requirements defined by FINMA (Art. 5-6a AVO-FINMA, valid as of December 15, 2015).
in millions as per December 31 Statutory (CHF)
2018
Statutory Adjustment(USD) (USD)
MCBS(USD)
2017
MCBS(USD) Item
Investments, cash and cash equivalents 3,399 3,454 25 3,479 5,079 1
Premiums and other receivables 1,647 1,674 (36) 1,638 1,455 2
Deferred acquisition costs 439 446 (446) — — 3
Reinsurance recoverables 347 353 (353) — — 4
Other assets 477 485 — 485 722
Reduction for liquidity charges — — (60) (60) (66) 5
Total Assets 6,309 6,412 (870) 5,542 7,190
Reserves for losses and loss expenses 3,077 3,127 (511) 2,616 3,392 6
Unearned premiums 1,399 1,422 (614) 808 665 7
Other insurance obligations 5 5 — 5 5
Total provisions for insurance obligations 4,482 4,554 (1,125) 3,429 4,062
Other liabilities 1,077 1,094 (140) 954 1,662 8
Proposed dividend — — — — 256
Total provisions for other liabilities 1,077 1,094 (140) 954 1,918
Total liabilities 5,559 5,648 (1,265) 4,383 5,980
Shareholder's equity (Net assets) 750 764 395 1,159 1,210
43
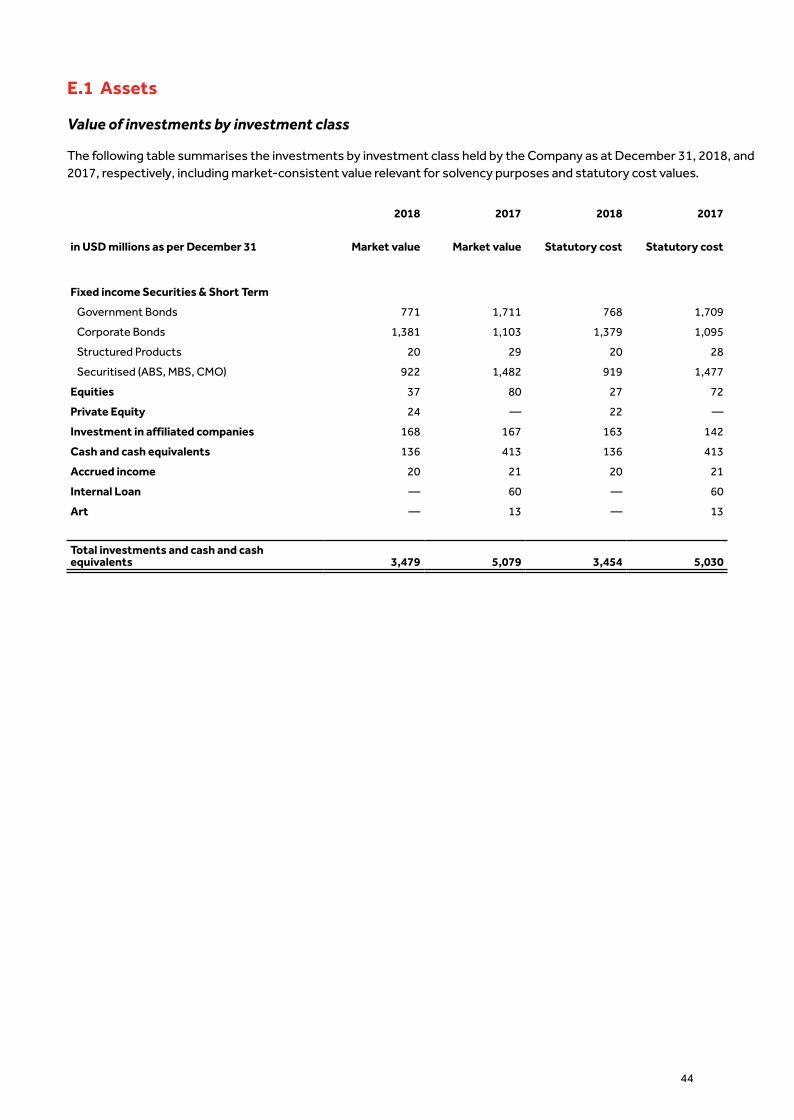
E.1 Assets
Value of investments by investment class
The following table summarises the investments by investment class held by the Company as at December 31, 2018, and2017, respectively, including market-consistent value relevant for solvency purposes and statutory cost values.
2018 2017 2018 2017
in USD millions as per December 31
Fixed income Securities & Short Term
Market value Market value Statutory cost Statutory cost
Government Bonds 771 1,711 768 1,709
Corporate Bonds 1,381 1,103 1,379 1,095
Structured Products 20 29 20 28
Securitised (ABS, MBS, CMO) 922 1,482 919 1,477
Equities 37 80 27 72
Private Equity 24 — 22 —
Investment in affiliated companies 168 167 163 142
Cash and cash equivalents 136 413 136 413
Accrued income 20 21 20 21
Internal Loan — 60 — 60
Art — 13 — 13
Total investments and cash and cashequivalents 3,479 5,079 3,454 5,030
44
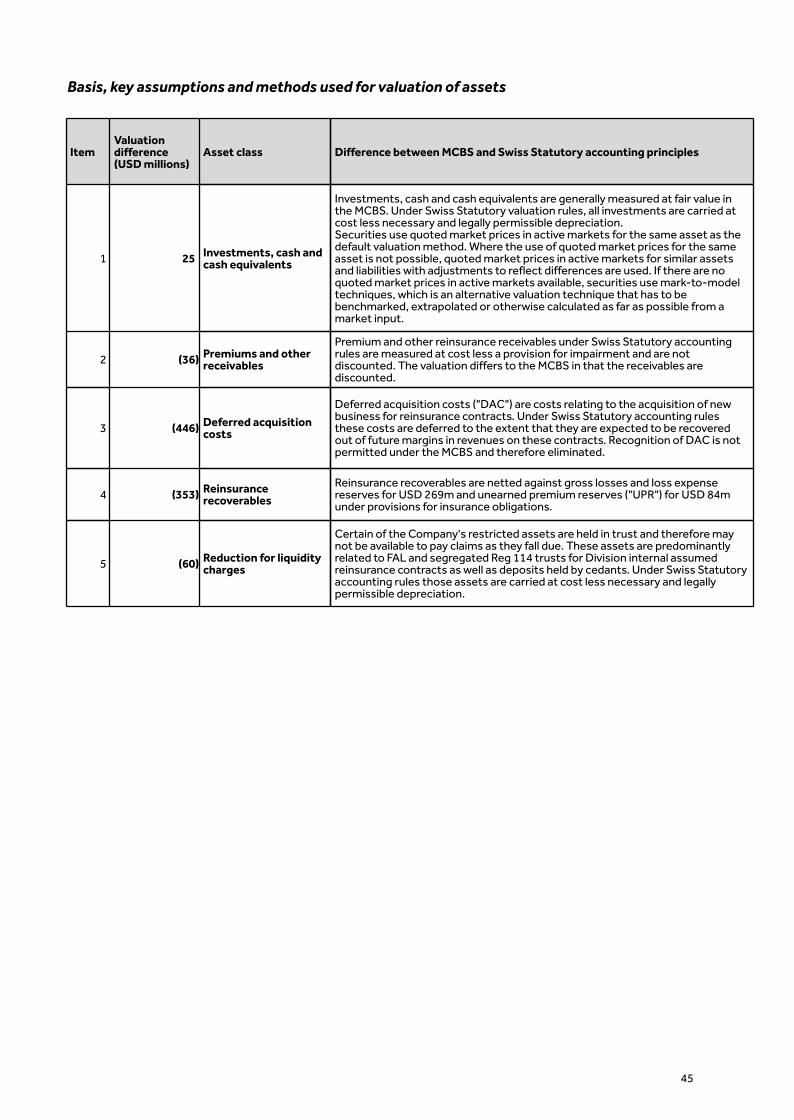
Basis, key assumptions and methods used for valuation of assets
ItemValuationdifference(USD millions)
Asset class Difference between MCBS and Swiss Statutory accounting principles
1 25 Investments, cash andcash equivalents
Investments, cash and cash equivalents are generally measured at fair value inthe MCBS. Under Swiss Statutory valuation rules, all investments are carried atcost less necessary and legally permissible depreciation.Securities use quoted market prices in active markets for the same asset as thedefault valuation method. Where the use of quoted market prices for the sameasset is not possible, quoted market prices in active markets for similar assetsand liabilities with adjustments to reflect differences are used. If there are noquoted market prices in active markets available, securities use mark-to-modeltechniques, which is an alternative valuation technique that has to bebenchmarked, extrapolated or otherwise calculated as far as possible from amarket input.
2 (36) Premiums and otherreceivables
Premium and other reinsurance receivables under Swiss Statutory accountingrules are measured at cost less a provision for impairment and are notdiscounted. The valuation differs to the MCBS in that the receivables arediscounted.
3 (446) Deferred acquisitioncosts
Deferred acquisition costs ("DAC") are costs relating to the acquisition of newbusiness for reinsurance contracts. Under Swiss Statutory accounting rulesthese costs are deferred to the extent that they are expected to be recoveredout of future margins in revenues on these contracts. Recognition of DAC is notpermitted under the MCBS and therefore eliminated.
4 (353) Reinsurancerecoverables
Reinsurance recoverables are netted against gross losses and loss expensereserves for USD 269m and unearned premium reserves ("UPR") for USD 84munder provisions for insurance obligations.
5 (60) Reduction for liquiditycharges
Certain of the Company's restricted assets are held in trust and therefore maynot be available to pay claims as they fall due. These assets are predominantlyrelated to FAL and segregated Reg 114 trusts for Division internal assumedreinsurance contracts as well as deposits held by cedants. Under Swiss Statutoryaccounting rules those assets are carried at cost less necessary and legallypermissible depreciation.
45
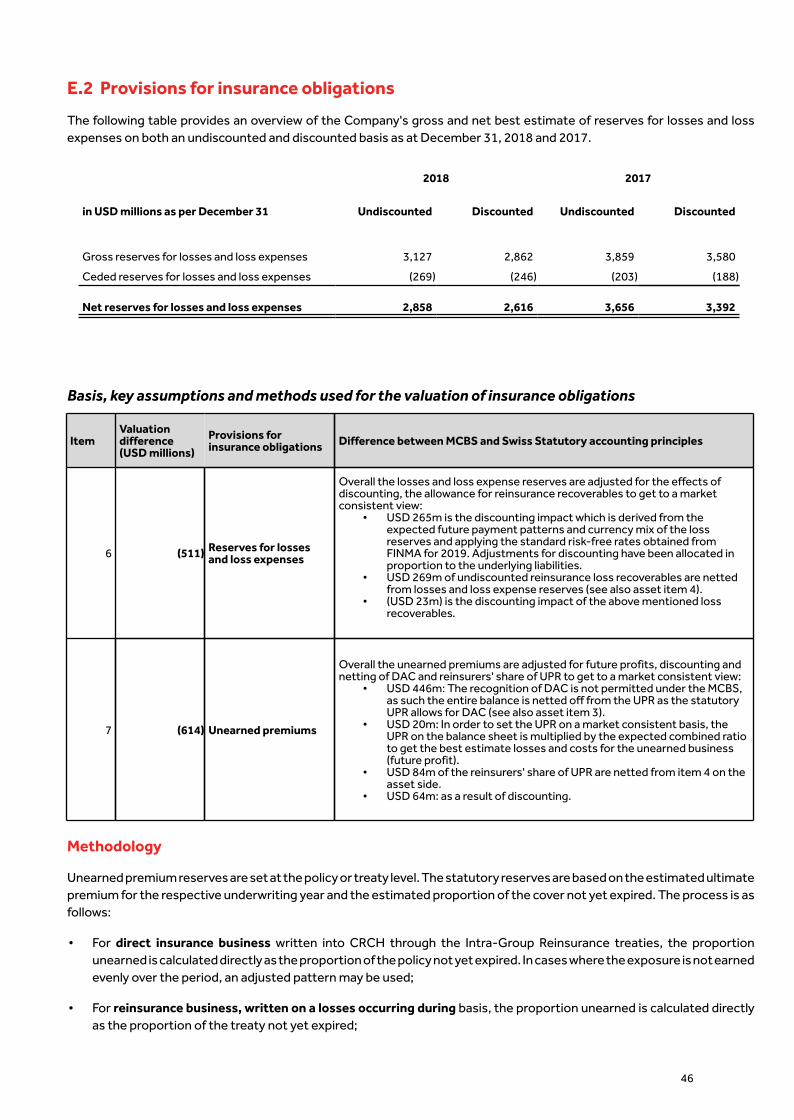
E.2 Provisions for insurance obligations
The following table provides an overview of the Company's gross and net best estimate of reserves for losses and lossexpenses on both an undiscounted and discounted basis as at December 31, 2018 and 2017.
2018 2017
in USD millions as per December 31 Undiscounted Discounted Undiscounted Discounted
Gross reserves for losses and loss expenses 3,127 2,862 3,859 3,580
Ceded reserves for losses and loss expenses (269) (246) (203) (188)
Net reserves for losses and loss expenses 2,858 2,616 3,656 3,392
Basis, key assumptions and methods used for the valuation of insurance obligations
ItemValuation Provisions fordifference(USD millions) insurance obligations Difference between MCBS and Swiss Statutory accounting principles
6 (511) Reserves for lossesand loss expenses
Overall the losses and loss expense reserves are adjusted for the effects ofdiscounting, the allowance for reinsurance recoverables to get to a marketconsistent view:
• USD 265m is the discounting impact which is derived from theexpected future payment patterns and currency mix of the lossreserves and applying the standard risk-free rates obtained fromFINMA for 2019. Adjustments for discounting have been allocated inproportion to the underlying liabilities.
• USD 269m of undiscounted reinsurance loss recoverables are nettedfrom losses and loss expense reserves (see also asset item 4).
• (USD 23m) is the discounting impact of the above mentioned lossrecoverables.
7 (614) Unearned premiums
Overall the unearned premiums are adjusted for future profits, discounting andnetting of DAC and reinsurers' share of UPR to get to a market consistent view:
• USD 446m: The recognition of DAC is not permitted under the MCBS,as such the entire balance is netted off from the UPR as the statutoryUPR allows for DAC (see also asset item 3).
• USD 20m: In order to set the UPR on a market consistent basis, theUPR on the balance sheet is multiplied by the expected combined ratioto get the best estimate losses and costs for the unearned business(future profit).
• USD 84m of the reinsurers' share of UPR are netted from item 4 on theasset side.
• USD 64m: as a result of discounting.
Methodology
Unearned premium reserves are set at the policy or treaty level. The statutory reserves are based on the estimated ultimatepremium for the respective underwriting year and the estimated proportion of the cover not yet expired. The process is asfollows:
• For direct insurance business written into CRCH through the Intra-Group Reinsurance treaties, the proportionunearned is calculated directly as the proportion of the policy not yet expired. In cases where the exposure is not earnedevenly over the period, an adjusted pattern may be used;
• For reinsurance business, written on a losses occurring during basis, the proportion unearned is calculated directlyas the proportion of the treaty not yet expired;
46
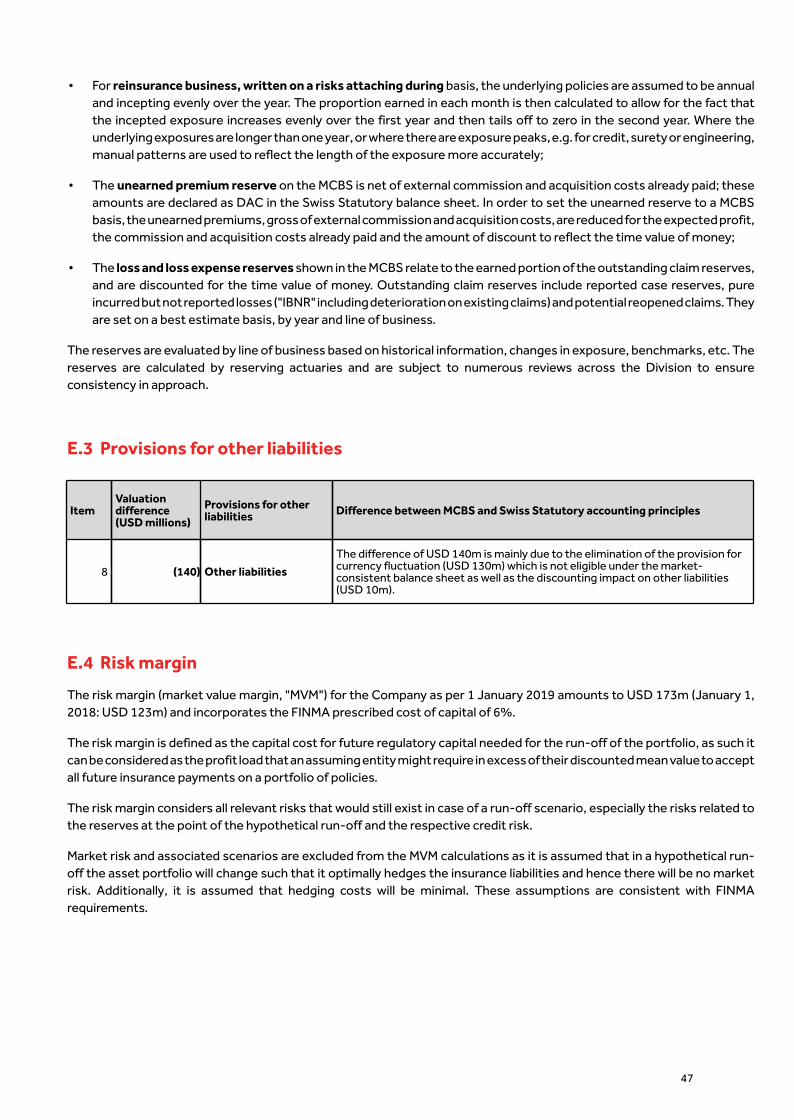
• For reinsurance business, written on a risks attaching during basis, the underlying policies are assumed to be annualand incepting evenly over the year. The proportion earned in each month is then calculated to allow for the fact thatthe incepted exposure increases evenly over the first year and then tails off to zero in the second year. Where theunderlying exposures are longer than one year, or where there are exposure peaks, e.g. for credit, surety or engineering,manual patterns are used to reflect the length of the exposure more accurately;
• The unearned premium reserve on the MCBS is net of external commission and acquisition costs already paid; theseamounts are declared as DAC in the Swiss Statutory balance sheet. In order to set the unearned reserve to a MCBSbasis, the unearned premiums, gross of external commission and acquisition costs, are reduced for the expected profit,the commission and acquisition costs already paid and the amount of discount to reflect the time value of money;
• The loss and loss expense reserves shown in the MCBS relate to the earned portion of the outstanding claim reserves,and are discounted for the time value of money. Outstanding claim reserves include reported case reserves, pureincurred but not reported losses ("IBNR" including deterioration on existing claims) and potential reopened claims. Theyare set on a best estimate basis, by year and line of business.
The reserves are evaluated by line of business based on historical information, changes in exposure, benchmarks, etc. Thereserves are calculated by reserving actuaries and are subject to numerous reviews across the Division to ensureconsistency in approach.
47
E.3 Provisions for other liabilities
ItemValuationdifference(USD millions)
Provisions for otherliabilities Difference between MCBS and Swiss Statutory accounting principles
8 (140) Other liabilities
The difference of USD 140m is mainly due to the elimination of the provision forcurrency fluctuation (USD 130m) which is not eligible under the market-consistent balance sheet as well as the discounting impact on other liabilities(USD 10m).
E.4 Risk margin
The risk margin (market value margin, "MVM") for the Company as per 1 January 2019 amounts to USD 173m (January 1,2018: USD 123m) and incorporates the FINMA prescribed cost of capital of 6%.
The risk margin is defined as the capital cost for future regulatory capital needed for the run-off of the portfolio, as such itcan be considered as the profit load that an assuming entity might require in excess of their discounted mean value to acceptall future insurance payments on a portfolio of policies.
The risk margin considers all relevant risks that would still exist in case of a run-off scenario, especially the risks related tothe reserves at the point of the hypothetical run-off and the respective credit risk.
Market risk and associated scenarios are excluded from the MVM calculations as it is assumed that in a hypothetical run-off the asset portfolio will change such that it optimally hedges the insurance liabilities and hence there will be no marketrisk. Additionally, it is assumed that hedging costs will be minimal. These assumptions are consistent with FINMArequirements.

F. Capital managementThis section provides a view of capital management activities in the Company, its capital management methods and thestructure, amount and quality reported in the annual report. Under the SST, capital is referred to as the excess of assetsover liabilities in the MCBS as reported in appendix 2.
48
F.1 Goals, strategy and time horizon for capital planning
The basic objective of capital management is to maintain, at all times, sufficient risk bearing capital to cover the targetcapital. The Company allocates capital efficiently to achieve appropriate risk adjusted returns and facilitate the business,and strives to maintain capital levels that are consistent with the risk appetite, corporate strategy, rating agency and thestatutory requirements.
The Company monitors capital triggers on an ongoing basis and the Board is informed frequently on material events thatcould potentially and materially change the Company's capital position.
The business plan, which forms the base for the ORSA, contains a three year projection of funding requirements and thishelps identify future funding actions. As part of long term capital planning the Company also performs a high level five-yearstrategic business plan to review capital adequacy as part of the Company's and the AXA XL's business initiatives.
There have been no changes to CRCH's capital management objectives during the year.
The Company currently maintains a level of capital in excess of regulatory (SST) and economic (ORSA) capital in line withthe Company’s capital buffer policies. Due to the Company’s definitions of economic capital there are no materialdifferences in use between ORSA and regulatory capital. There is an AXA XL capital management framework in place whichsets out capital management principles for major regulated subsidiaries, including the Company. This includes both a targetbuffer to the Company's requirements as well as the process around capital injections and distributions.
F.2 Structure and quality of equity capital reported in the annual report
The following table provides an overview of the shareholder's equity as reported in the audited statutory financialstatements:
CHF millions as of December 31 2017 2018 Change Change in %
Common stock 100 100 — — %
Legal capital reserves from capital contribution 883 633 (250) (28)%
Legal profit reserves 203 45 (158) (78)%
Profit / (loss) for the financial year (178) (28) 150 (84)%
Total shareholder's equity 1,009 750 (258) (26)%
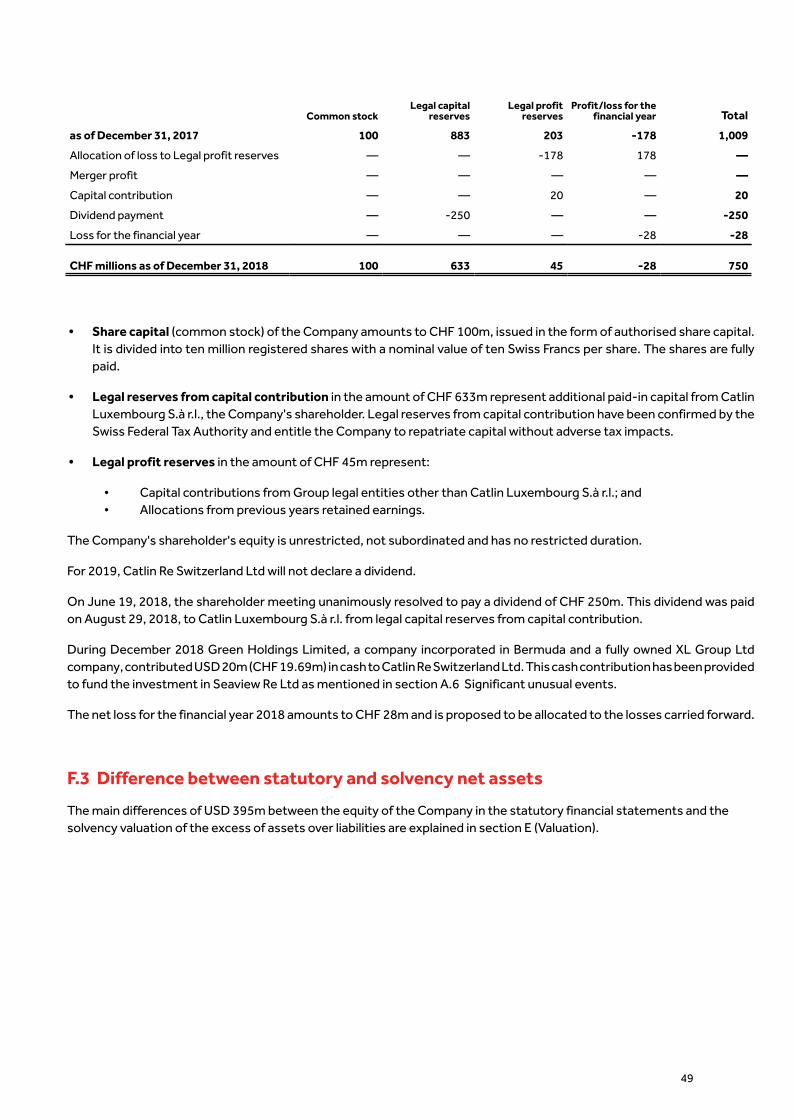
Common stockLegal capital
reservesLegal profit
reservesProfit/loss for the
financial year Total
as of December 31, 2017 100 883 203 -178 1,009
Allocation of loss to Legal profit reserves — — -178 178 —
Merger profit — — — — —
Capital contribution — — 20 — 20
Dividend payment — -250 — — -250
Loss for the financial year — — — -28 -28
CHF millions as of December 31, 2018 100 633 45 -28 750
• Share capital (common stock) of the Company amounts to CHF 100m, issued in the form of authorised share capital.It is divided into ten million registered shares with a nominal value of ten Swiss Francs per share. The shares are fullypaid.
• Legal reserves from capital contribution in the amount of CHF 633m represent additional paid-in capital from CatlinLuxembourg S.à r.l., the Company's shareholder. Legal reserves from capital contribution have been confirmed by theSwiss Federal Tax Authority and entitle the Company to repatriate capital without adverse tax impacts.
• Legal profit reserves in the amount of CHF 45m represent:
• Capital contributions from Group legal entities other than Catlin Luxembourg S.à r.l.; and• Allocations from previous years retained earnings.
The Company's shareholder's equity is unrestricted, not subordinated and has no restricted duration.
For 2019, Catlin Re Switzerland Ltd will not declare a dividend.
On June 19, 2018, the shareholder meeting unanimously resolved to pay a dividend of CHF 250m. This dividend was paidon August 29, 2018, to Catlin Luxembourg S.à r.l. from legal capital reserves from capital contribution.
During December 2018 Green Holdings Limited, a company incorporated in Bermuda and a fully owned XL Group Ltdcompany, contributed USD 20m (CHF 19.69m) in cash to Catlin Re Switzerland Ltd. This cash contribution has been providedto fund the investment in Seaview Re Ltd as mentioned in section A.6 Significant unusual events.
The net loss for the financial year 2018 amounts to CHF 28m and is proposed to be allocated to the losses carried forward.
49
F.3 Difference between statutory and solvency net assets
The main differences of USD 395m between the equity of the Company in the statutory financial statements and thesolvency valuation of the excess of assets over liabilities are explained in section E (Valuation).

G. SolvencyThe information provided in section E (Valuation) and section G (Solvency) are identical to the information submitted toFINMA as part of the 2019 SST reporting, subject to regulatory review by FINMA.
50
G.1 Solvency model
Catlin Re Switzerland has estimated its capital requirements for market risk and investment credit risk using the FINMAstandard model while the internal model is used in order to determine the insurance risk and reinsurance credit risk for the2019 SST.
Any deviations in the methodology have been considered and allowed for in order to ensure that the internal modelcalculations are consistent with the methodology used in the SST standard calculations. During 2018, FINMA released anew market risk standard model and aggregation model which has been used within the 2019 SST.
The parameterisation is carried out based on detailed analysis of the underlying business.
Since inception, FINMA has granted annual approval to Catlin Re regarding the use of the model for the following year'ssubmission. In October 2018, FINMA granted the Company the use of its existing model for the 2019 SST i.e. the samemodel as that used for the previous year's SST submission.
A large part of Catlin Re’s risks arise from its reinsurance of other companies within AXA XL. The internal model has beendeveloped such that it explicitly captures all material risks to AXA XL and its material legal entities.
The internal model is an in-house developed legacy XL model that captures the material aspects of insurance risk andreinsurance credit risk for Catlin Re. As the Company invests in standard assets with minimal special features, we believethe standard models for market risk and investment credit risks are appropriate and they capture these risk categories.
G.2 Target capital
The following table shows a decomposition of the target capital into the relevant categories as defined by FINMA:
USD millions January 1, 2018 in % January 1, 2019 in %
Technical result (67) (6)% (163) (15)%
Financial result (17) (2)% (30) (3)%
Credit Risk 207 18 % 201 19 %
Market Risk 331 30 % 269 25 %
Insurance risk 530 47 % 626 58 %
Market Value Margin (“MVM”) 123 11 % 173 16 %
Scenarios 10 1 % 9 1 %
Total before diversification 1,119 100 % 1,085 100 %
Diversification (279) (194)
Target Capital 840 890
The Technical and the Financial results are elements of the profit expected in the current year that reduce the requiredcapital.
Credit risk includes investment and reinsurance credit risk.
Insurance risk and the MVM are obtained from the internal model.
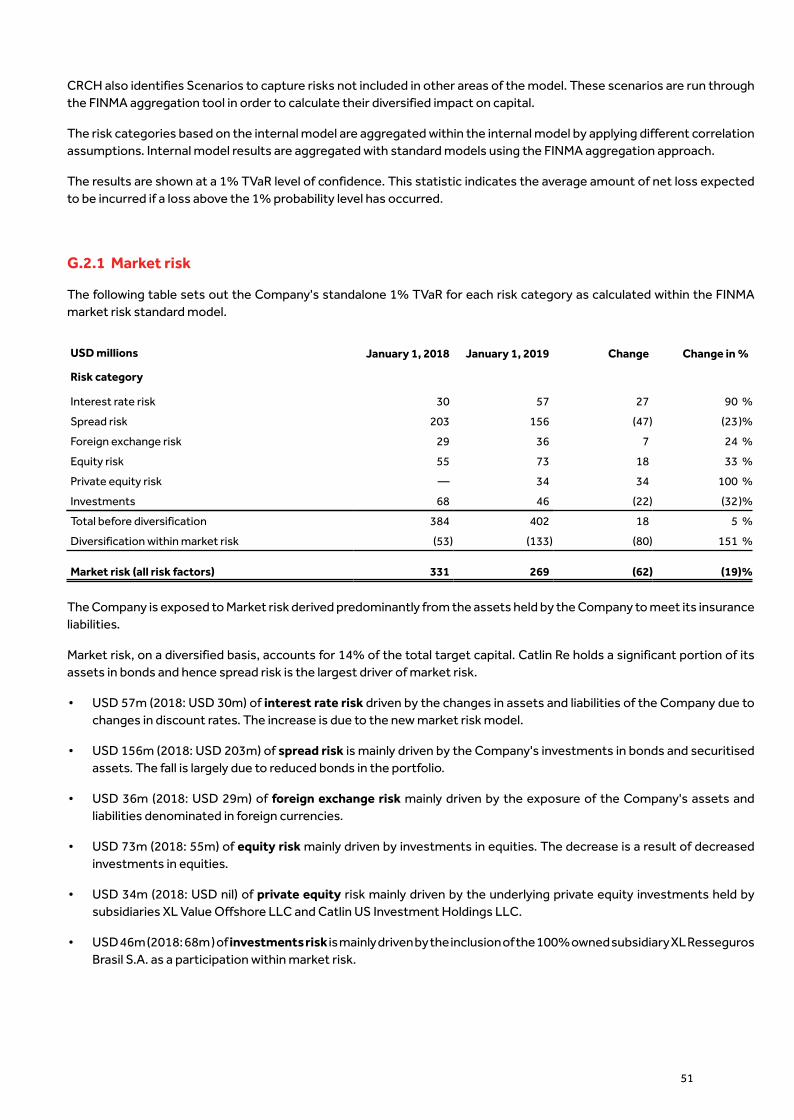
CRCH also identifies Scenarios to capture risks not included in other areas of the model. These scenarios are run throughthe FINMA aggregation tool in order to calculate their diversified impact on capital.
The risk categories based on the internal model are aggregated within the internal model by applying different correlationassumptions. Internal model results are aggregated with standard models using the FINMA aggregation approach.
The results are shown at a 1% TVaR level of confidence. This statistic indicates the average amount of net loss expectedto be incurred if a loss above the 1% probability level has occurred.
51
G.2.1 Market risk
The following table sets out the Company's standalone 1% TVaR for each risk category as calculated within the FINMAmarket risk standard model.
USD millions
Risk category
January 1, 2018 January 1, 2019 Change Change in %
Interest rate risk 30 57 27 90 %
Spread risk 203 156 (47) (23)%
Foreign exchange risk 29 36 7 24 %
Equity risk 55 73 18 33 %
Private equity risk — 34 34 100 %
Investments 68 46 (22) (32)%
Total before diversification 384 402 18 5 %
Diversification within market risk (53) (133) (80) 151 %
Market risk (all risk factors) 331 269 (62) (19)%
The Company is exposed to Market risk derived predominantly from the assets held by the Company to meet its insuranceliabilities.
Market risk, on a diversified basis, accounts for 14% of the total target capital. Catlin Re holds a significant portion of itsassets in bonds and hence spread risk is the largest driver of market risk.
• USD 57m (2018: USD 30m) of interest rate risk driven by the changes in assets and liabilities of the Company due tochanges in discount rates. The increase is due to the new market risk model.
• USD 156m (2018: USD 203m) of spread risk is mainly driven by the Company's investments in bonds and securitisedassets. The fall is largely due to reduced bonds in the portfolio.
• USD 36m (2018: USD 29m) of foreign exchange risk mainly driven by the exposure of the Company's assets andliabilities denominated in foreign currencies.
• USD 73m (2018: 55m) of equity risk mainly driven by investments in equities. The decrease is a result of decreasedinvestments in equities.
• USD 34m (2018: USD nil) of private equity risk mainly driven by the underlying private equity investments held bysubsidiaries XL Value Offshore LLC and Catlin US Investment Holdings LLC.
• USD 46m (2018: 68m ) of investments risk is mainly driven by the inclusion of the 100% owned subsidiary XL RessegurosBrasil S.A. as a participation within market risk.

G.2.2 Insurance risk
The following table sets out the breakdown of the one-year insurance risk for CRCH into its components.
USD millions January 1, 2018 January 1, 2019 Change Change in %
1-year underwriting risk 211 379 168 80 %
1-year reserve risk 440 412 (28) (6)%
Total before diversification 651 792 141 22 %
Diversification impact within insurance risk (121) (165) (44) 36 %
1-year insurance-technical risk 530 626 96 18 %
Insurance risk is the largest driver of capital for the Company accounting for approximately 66% of the total capitalrequirement on a diversified basis with underwriting risk contributing 31% to the total target capital while reserve riskcontributes 35%.
Underwriting risk
Underwriting risk reflects the volatility measured on a one-year time horizon of losses earned after December 31, 2018,allowing for one year of new business. This is made up of the portion of the 2018 (and prior) underwriting years not earnedby December 31, 2018, and new policies anticipated to be written that attach to the 2019 underwriting year and are earnedin 2019.
Underwriting risk has increased by USD 168m compared to last year. This increase is largely due to the new 30% wholeaccount quota share ceded to Seaview Re, a subsidiary of Catlin Re.
Approximately 76% of the total underwriting risk arises from low frequency, high severity threat events, estimated usingthe internal model that can lead to simultaneous losses from a number of lines of business and policies at the same time.Third-party reinsurance contracts mitigate the impact of these events substantially, but net of reinsurance their effect isstill significant to the Company. These events include natural catastrophe losses and man-made events. A list of the largestthreats to the Company is included in section D.1.
Reserve risk
Reserve risk reflects the volatility measured on a one-year time horizon of losses earned before December 31, 2018. Mostof the volatility arising from reserve risk is not related to a given specific event, but reflects the potential for many differentareas to deteriorate at the same time. In particular it is influenced by the volume of reserves held at any given time, andhence casualty business is a key constituent.
The largest driver of reserve risk is the assumed Intra-Group Reinsurance of other companies within AXA XL.
Reserve risk has reduced by USD 28m compared to the previous year. With effect December 31, 2017, the Intra-Groupcontracts that the Company had with the pooled US entities were cancelled with these contracts now being in run-off. Asa result, there has been a reduction in the reserves held due to claims payments which has resulted in reduced reserve risk.
52
G.2.3 Other components
Expected insurance-technical result: The expected insurance-technical result for underwriting year 2019 is USD163m (2018: USD 67m) on a discounted basis. The increase compared to last year is mainly driven by Seaview Re, a newlyformed subsidiary of Catlin Re that writes a 30% whole account quota share with XL Re America (pool).
Expected financial result: The financial result of USD 30m for 2019 (2018: USD 17m) is directly calculated by the FINMAstandard model by applying factors to investment types. These factors represent the expected return above risk free yields.
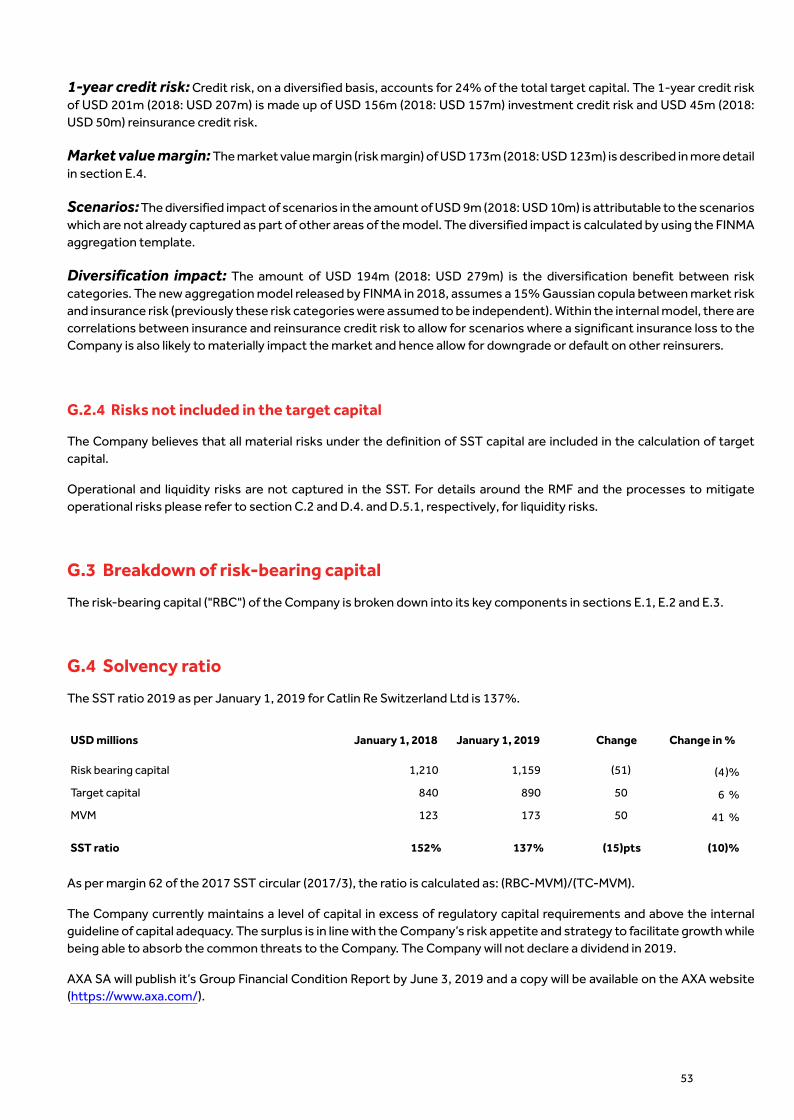
1-year credit risk: Credit risk, on a diversified basis, accounts for 24% of the total target capital. The 1-year credit riskof USD 201m (2018: USD 207m) is made up of USD 156m (2018: USD 157m) investment credit risk and USD 45m (2018:USD 50m) reinsurance credit risk.
Market value margin: The market value margin (risk margin) of USD 173m (2018: USD 123m) is described in more detailin section E.4.
Scenarios: The diversified impact of scenarios in the amount of USD 9m (2018: USD 10m) is attributable to the scenarioswhich are not already captured as part of other areas of the model. The diversified impact is calculated by using the FINMAaggregation template.
Diversification impact: The amount of USD 194m (2018: USD 279m) is the diversification benefit between riskcategories. The new aggregation model released by FINMA in 2018, assumes a 15% Gaussian copula between market riskand insurance risk (previously these risk categories were assumed to be independent). Within the internal model, there arecorrelations between insurance and reinsurance credit risk to allow for scenarios where a significant insurance loss to theCompany is also likely to materially impact the market and hence allow for downgrade or default on other reinsurers.
53
G.2.4 Risks not included in the target capital
The Company believes that all material risks under the definition of SST capital are included in the calculation of targetcapital.
Operational and liquidity risks are not captured in the SST. For details around the RMF and the processes to mitigateoperational risks please refer to section C.2 and D.4. and D.5.1, respectively, for liquidity risks.
G.3 Breakdown of risk-bearing capital
The risk-bearing capital ("RBC") of the Company is broken down into its key components in sections E.1, E.2 and E.3.
G.4 Solvency ratio
The SST ratio 2019 as per January 1, 2019 for Catlin Re Switzerland Ltd is 137%.
USD millions January 1, 2018 January 1, 2019 Change Change in %
Risk bearing capital 1,210 1,159 (51) (4)%
Target capital 840 890 50 6 %
MVM 123 173 50 41 %
SST ratio 152% 137% (15)pts (10)%
As per margin 62 of the 2017 SST circular (2017/3), the ratio is calculated as: (RBC-MVM)/(TC-MVM).
The Company currently maintains a level of capital in excess of regulatory capital requirements and above the internalguideline of capital adequacy. The surplus is in line with the Company’s risk appetite and strategy to facilitate growth whilebeing able to absorb the common threats to the Company. The Company will not declare a dividend in 2019.
AXA SA will publish it’s Group Financial Condition Report by June 3, 2019 and a copy will be available on the AXA website(https://www.axa.com/).
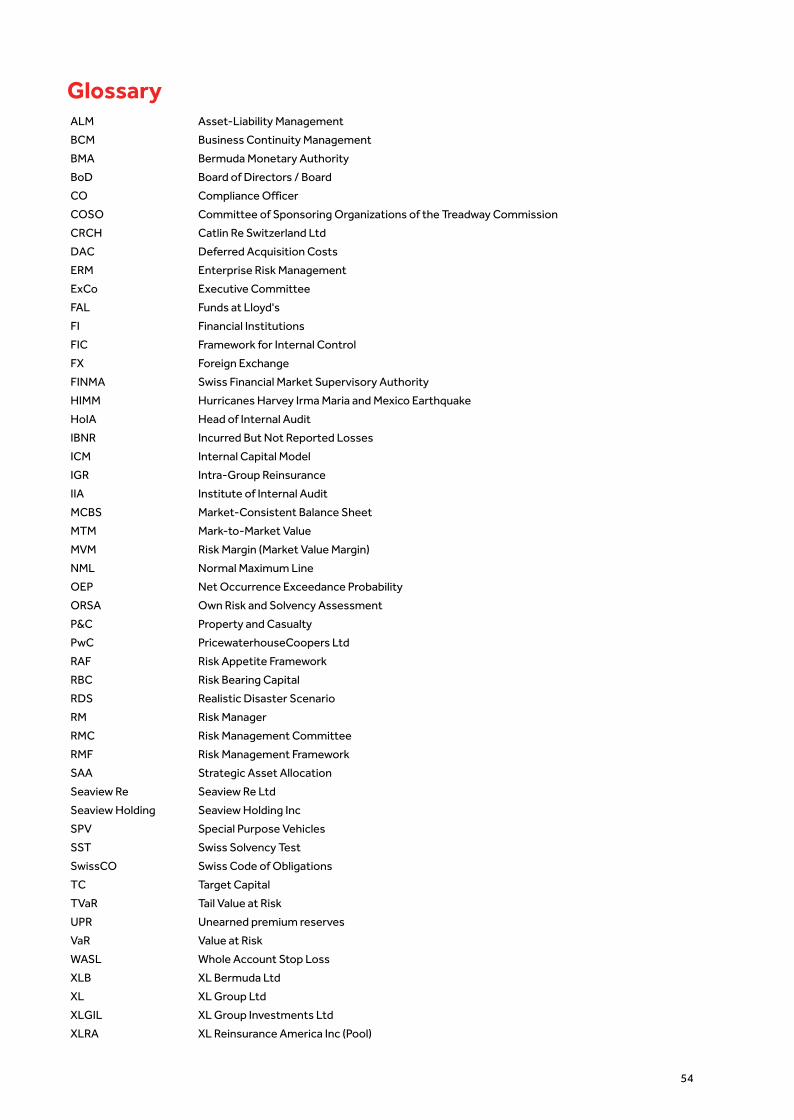
GlossaryALM Asset-Liability Management
BCM Business Continuity Management
BMA Bermuda Monetary Authority
BoD Board of Directors / Board
CO Compliance Officer
COSO Committee of Sponsoring Organizations of the Treadway Commission
CRCH Catlin Re Switzerland Ltd
DAC Deferred Acquisition Costs
ERM Enterprise Risk Management
ExCo Executive Committee
FAL Funds at Lloyd's
FI Financial Institutions
FIC Framework for Internal Control
FX Foreign Exchange
FINMA Swiss Financial Market Supervisory Authority
HIMM Hurricanes Harvey Irma Maria and Mexico Earthquake
HoIA Head of Internal Audit
IBNR Incurred But Not Reported Losses
ICM Internal Capital Model
IGR Intra-Group Reinsurance
IIA Institute of Internal Audit
MCBS Market-Consistent Balance Sheet
MTM Mark-to-Market Value
MVM Risk Margin (Market Value Margin)
NML Normal Maximum Line
OEP Net Occurrence Exceedance Probability
ORSA Own Risk and Solvency Assessment
P&C Property and Casualty
PwC PricewaterhouseCoopers Ltd
RAF Risk Appetite Framework
RBC Risk Bearing Capital
RDS Realistic Disaster Scenario
RM Risk Manager
RMC Risk Management Committee
RMF Risk Management Framework
SAA Strategic Asset Allocation
Seaview Re Seaview Re Ltd
Seaview Holding Seaview Holding Inc
SPV Special Purpose Vehicles
SST Swiss Solvency Test
SwissCO Swiss Code of Obligations
TC Target Capital
TVaR Tail Value at Risk
UPR Unearned premium reserves
VaR Value at Risk
WASL Whole Account Stop Loss
XLB XL Bermuda Ltd
XL XL Group Ltd
XLGIL XL Group Investments Ltd
XLRA XL Reinsurance America Inc (Pool)
54

Appendices to the Financial Condition Report 2018
55
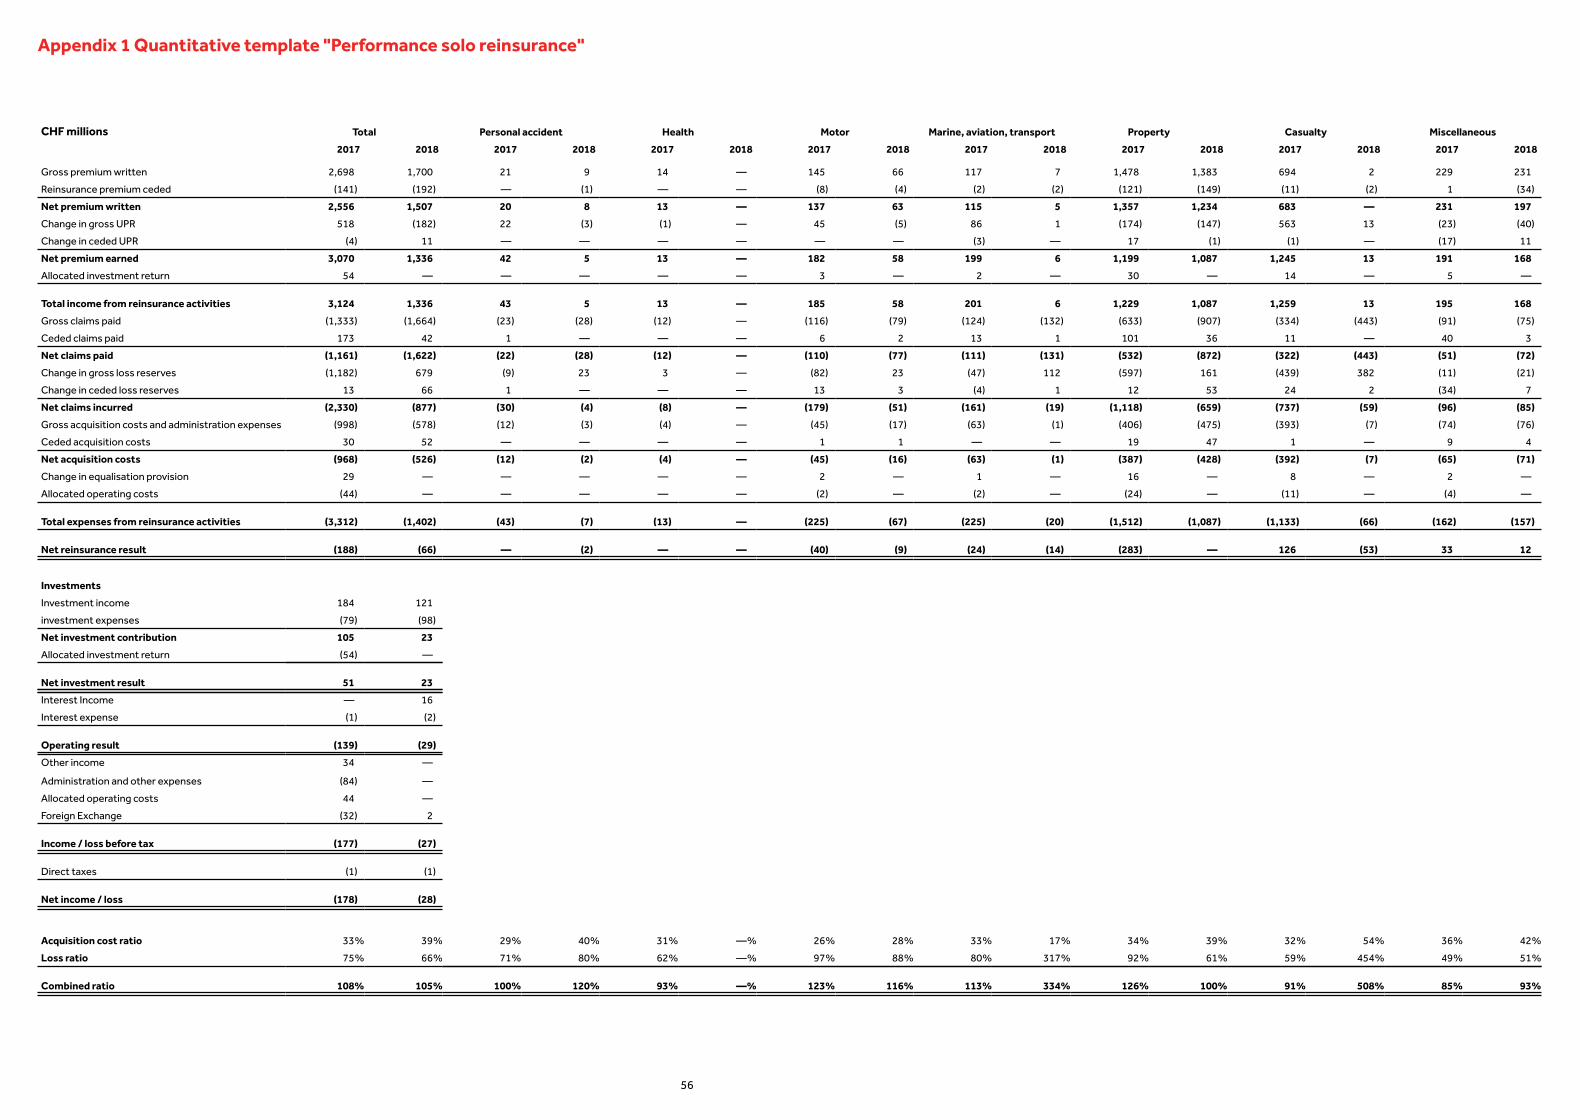
Appendix 1 Quantitative template "Performance solo reinsurance"
CHF millions Total
2017 2018
Personal accident
2017 2018
Health
2017 2018
Motor
2017 2018
Marine, aviation, transport
2017 2018
Property
2017 2018
Casualty
2017 2018
Miscellaneous
2017 2018
Gross premium written 2,698 1,700 21 9 14 — 145 66 117 7 1,478 1,383 694 2 229 231
Reinsurance premium ceded (141) (192) — (1) — — (8) (4) (2) (2) (121) (149) (11) (2) 1 (34)
Net premium written 2,556 1,507 20 8 13 — 137 63 115 5 1,357 1,234 683 — 231 197
Change in gross UPR 518 (182) 22 (3) (1) — 45 (5) 86 1 (174) (147) 563 13 (23) (40)
Change in ceded UPR (4) 11 — — — — — — (3) — 17 (1) (1) — (17) 11
Net premium earned 3,070 1,336 42 5 13 — 182 58 199 6 1,199 1,087 1,245 13 191 168
Allocated investment return 54 — — — — — 3 — 2 — 30 — 14 — 5 —
Total income from reinsurance activities 3,124 1,336 43 5 13 — 185 58 201 6 1,229 1,087 1,259 13 195 168
Gross claims paid (1,333) (1,664) (23) (28) (12) — (116) (79) (124) (132) (633) (907) (334) (443) (91) (75)
Ceded claims paid 173 42 1 — — — 6 2 13 1 101 36 11 — 40 3
Net claims paid (1,161) (1,622) (22) (28) (12) — (110) (77) (111) (131) (532) (872) (322) (443) (51) (72)
Change in gross loss reserves (1,182) 679 (9) 23 3 — (82) 23 (47) 112 (597) 161 (439) 382 (11) (21)
Change in ceded loss reserves 13 66 1 — — — 13 3 (4) 1 12 53 24 2 (34) 7
Net claims incurred (2,330) (877) (30) (4) (8) — (179) (51) (161) (19) (1,118) (659) (737) (59) (96) (85)
Gross acquisition costs and administration expenses (998) (578) (12) (3) (4) — (45) (17) (63) (1) (406) (475) (393) (7) (74) (76)
Ceded acquisition costs 30 52 — — — — 1 1 — — 19 47 1 — 9 4
Net acquisition costs (968) (526) (12) (2) (4) — (45) (16) (63) (1) (387) (428) (392) (7) (65) (71)
Change in equalisation provision 29 — — — — — 2 — 1 — 16 — 8 — 2 —
Allocated operating costs (44) — — — — — (2) — (2) — (24) — (11) — (4) —
Total expenses from reinsurance activities (3,312) (1,402) (43) (7) (13) — (225) (67) (225) (20) (1,512) (1,087) (1,133) (66) (162) (157)
Net reinsurance result (188) (66) — (2) — — (40) (9) (24) (14) (283) — 126 (53) 33 12
Investments
Investment income 184 121
investment expenses (79) (98)
Net investment contribution 105 23
Allocated investment return (54) —
Net investment result 51 23
Interest Income — 16
Interest expense (1) (2)
Operating result (139) (29)
Other income 34 —
Administration and other expenses (84) —
Allocated operating costs 44 —
Foreign Exchange (32) 2
Income / loss before tax (177) (27)
Direct taxes (1) (1)
Net income / loss (178) (28)
Acquisition cost ratio 33% 39% 29% 40% 31% —% 26% 28% 33% 17% 34% 39% 32% 54% 36% 42%
Loss ratio 75% 66% 71% 80% 62% —% 97% 88% 80% 317% 92% 61% 59% 454% 49% 51%
Combined ratio 108% 105% 100% 120% 93% —% 123% 116% 113% 334% 126% 100% 91% 508% 85% 93%
56

Appendix 2 Quantitative template "Market-consistent balance sheet solo"
USD millions January 1, 2018 January 1, 2019 Delta
Real estate
Shareholdings
Fixed-income securities
Loans
Equities
Other investments
—
167
4,325
60
80
34
—
168
3,094
—
61
20
—
1
(1,231)
(60)
(19)
(14)Market-consistent
value ofinvestments
Collective investment schemes
Alternative investments
—
—
—
—
—
—
Other investments 34 20 (14)
Total investments 4,666 3,343 (1,323)
Financial investments from unit-linked lifeinsurance — — —
Receivables from derivative financialinstruments — — —
Cash and cash equivalents 413 136 (277)
Market-consistentReceivables from insurance business 1,455 1,638 183
value of otherassets
Other receivables — — —
Other assets 656 425 (231)
Total other assets 2,524 2,199 (325)
Total market-consistent value of
assets7,190 5,542 (1,648)
Best estimateliabilities (BEL)
Best estimate of provisions for insuranceliabilities 4,319 3,778 (541)
Inward reinsurance: non-life insurancebusiness 4,319 3,778 (541)
Reinsurers' share of best estimate ofprovisions for insurance liabilities (257) (353) (96)
Outward reinsurance: non-life insurancebusiness (257) (353) (96)
Market-consistentvalue of other
liabilities
Non-technical provisions 1,662 958 (704)
Interest-bearing liabilities — — —
Liabilities from derivative financialinstruments — — —
Deposits retained on ceded reinsurance — — —
Liabilities from insurance business — — —
Other liabilities 256 — (256)
Total BEL plusmarket-consistent
value of otherliabilities
5,980 4,383 (1,597)
Market-consistent value of assets minustotal from BEL plus market-consistent valueof other liabilities
1,210 1,159 (51)
57
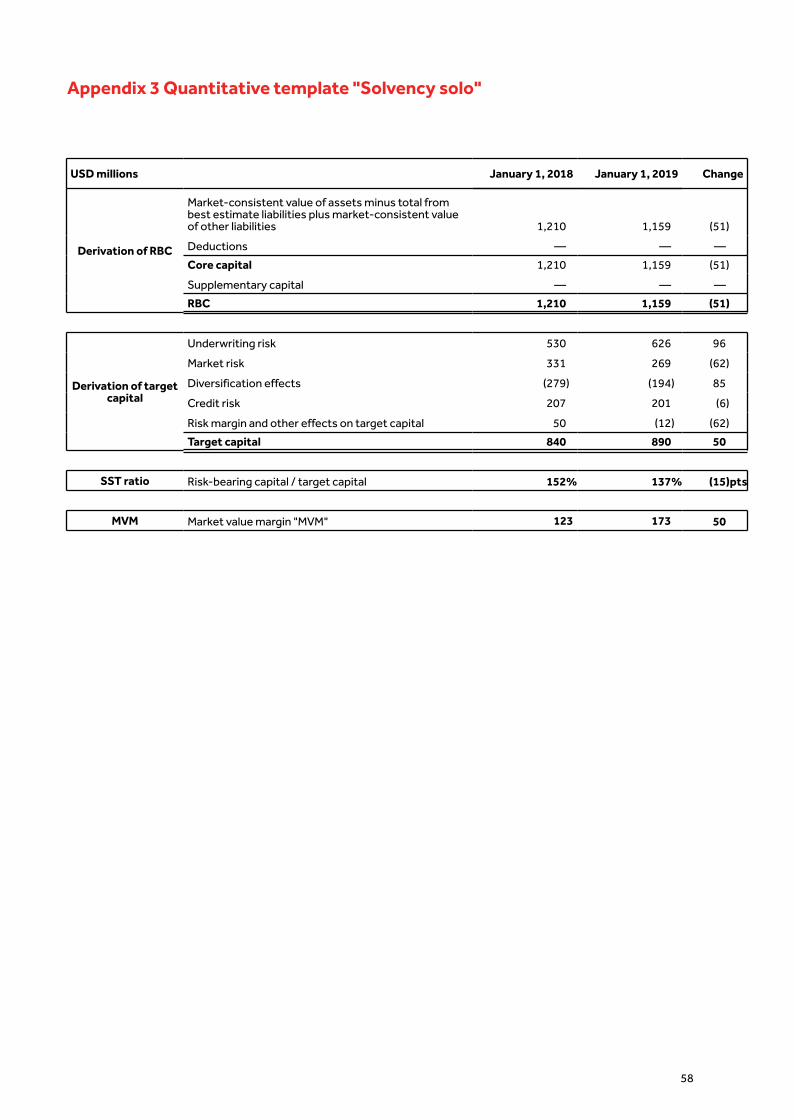
Appendix 3 Quantitative template "Solvency solo"
USD millions January 1, 2018 January 1, 2019 Change
Derivation of RBC
Market-consistent value of assets minus total frombest estimate liabilities plus market-consistent valueof other liabilities
Deductions
1,210
—
1,159
—
(51)
—
Core capital
Supplementary capital
1,210
—
1,159
—
(51)
—
RBC 1,210 1,159 (51)
SST ratio Risk-bearing capital / target capital 152% 137% (15)pts
Derivation of targetcapital
Underwriting risk 530 626 96
Market risk 331 269 (62)
Diversification effects (279) (194) 85
Credit risk 207 201 (6)
Risk margin and other effects on target capital 50 (12) (62)
Target capital 840 890 50
MVM Market value margin "MVM" 123 173 50
58

Appendix 4 Audited annual financial statements and report of the statutory auditor
59

Catlin Re Switzerland Ltd AN AXA SA GROUP COMPANY
Annual Report 2018
PricewaterhouseCoopers AG, Birchstrasse 160, Postfach, CH-8050 Zürich, Switzerland Telefon: +41 58 792 44 00, Telefax: +41 58 792 44 10, www.pwc.ch
PricewaterhouseCoopers AG is a member of the global PricewaterhouseCoopers network of firms, each of which is a separate and independent legal entity.
Report of the statutory auditorto the General Meeting of Catlin Re Switzerland Ltd
Zürich
Report of the statutory auditor on the financial statements
As statutory auditor, we have audited the accompanying financial statements of Catlin Re Switzerland Ltd, which comprise the balance sheet, income statement and notes, for the year ended 31 December 2018.
Board of Directors’ responsibility The Board of Directors is responsible for the preparation of the financial statements in accordance with the requirements of Swiss law and the company’s articles of incorporation. This responsibility includes designing, implementing and maintaining an internal control system relevant to the preparation of finan-cial statements that are free from material misstatement, whether due to fraud or error. The Board of Di-rectors is further responsible for selecting and applying appropriate accounting policies and making ac-counting estimates that are reasonable in the circumstances.
Auditor’s responsibility Our responsibility is to express an opinion on these financial statements based on our audit. We con-ducted our audit in accordance with Swiss law and Swiss Auditing Standards. Those standards require that we plan and perform the audit to obtain reasonable assurance whether the financial statements are free from material misstatement.
An audit involves performing procedures to obtain audit evidence about the amounts and disclosures in the financial statements. The procedures selected depend on the auditor’s judgment, including the assess-ment of the risks of material misstatement of the financial statements, whether due to fraud or error. In making those risk assessments, the auditor considers the internal control system relevant to the entity’s preparation of the financial statements in order to design audit procedures that are appropriate in the cir-cumstances, but not for the purpose of expressing an opinion on the effectiveness of the entity’s internal control system. An audit also includes evaluating the appropriateness of accounting policies used and the reasonableness of accounting estimates made, as well as evaluating the overall presentation of the finan-cial statements. We believe that the audit evidence we have obtained is sufficient and appropriate to pro-vide a basis for our audit opinion.
Opinion In our opinion, the financial statements for the year ended 31 December 2018 comply with Swiss law and the company’s articles of incorporation.

Report on other legal requirements
We confirm that we meet the legal requirements on licensing according to the Auditor Oversight Act (AOA) and independence (article 728 CO and article 11 AOA) and that there are no circumstances incom-patible with our independence.
In accordance with article 728a paragraph 1 item 3 CO and Swiss Auditing Standard 890, we confirm that an internal control system exists which has been designed for the preparation of financial statements ac-cording to the instructions of the Board of Directors.
We further confirm that the proposed appropriation of available earnings complies with Swiss law and the company’s articles of incorporation. We recommend that the financial statements submitted to you be ap-proved.
PricewaterhouseCoopers AG
Philip Kirkpatrick Ireen Ranneberg
Audit expert Auditor in charge
Audit expert
Zürich, 24 April 2019
Enclosures:
• Financial statements (balance sheet, income statement and notes)
• Proposed appropriation of the available earnings
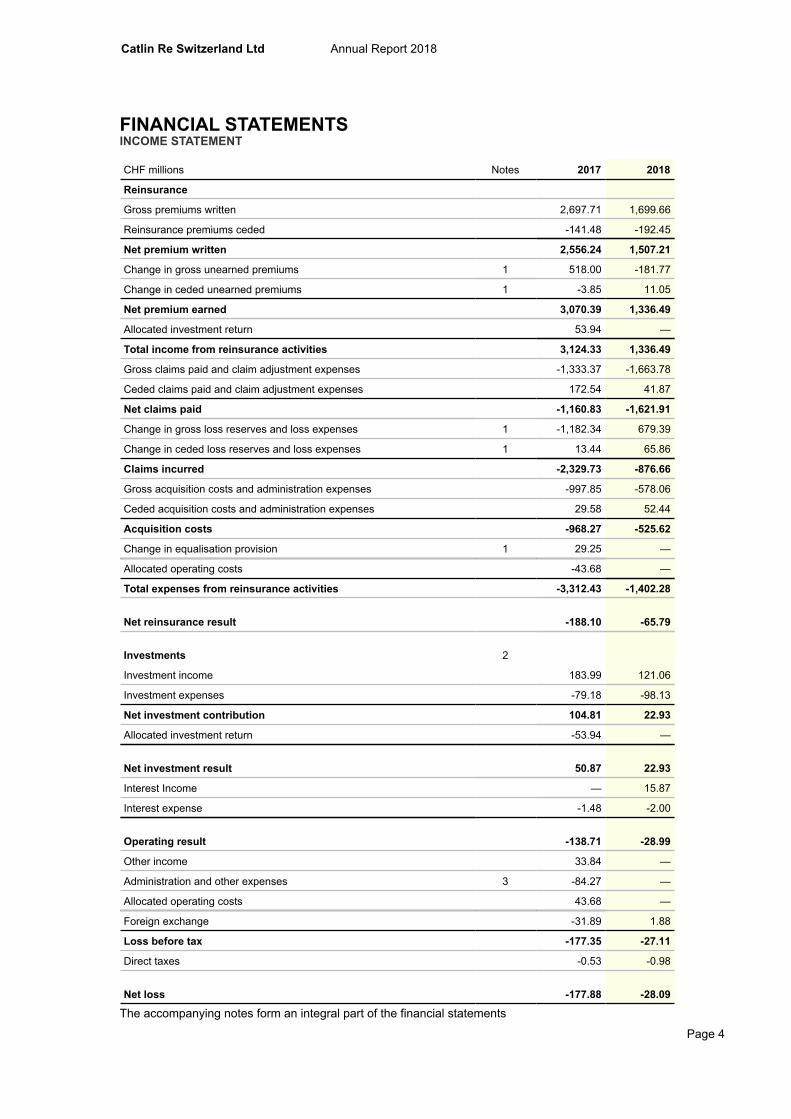
Catlin Re Switzerland Ltd Annual Report 2018
FINANCIAL STATEMENTSINCOME STATEMENT
Page 4
CHF millions Notes 2017 2018
Reinsurance
Gross premiums written 2,697.71 1,699.66
Reinsurance premiums ceded -141.48 -192.45
Net premium written 2,556.24 1,507.21
Change in gross unearned premiums 1 518.00 -181.77
Change in ceded unearned premiums 1 -3.85 11.05
Net premium earned 3,070.39 1,336.49
Allocated investment return 53.94 —
Total income from reinsurance activities 3,124.33 1,336.49
Gross claims paid and claim adjustment expenses -1,333.37 -1,663.78
Ceded claims paid and claim adjustment expenses 172.54 41.87
Net claims paid -1,160.83 -1,621.91
Change in gross loss reserves and loss expenses 1 -1,182.34 679.39
Change in ceded loss reserves and loss expenses 1 13.44 65.86
Claims incurred -2,329.73 -876.66
Gross acquisition costs and administration expenses -997.85 -578.06
Ceded acquisition costs and administration expenses 29.58 52.44
Acquisition costs -968.27 -525.62
Change in equalisation provision 1 29.25 —
Allocated operating costs -43.68 —
Total expenses from reinsurance activities -3,312.43 -1,402.28
Net reinsurance result -188.10 -65.79
Investments
Investment income
2
183.99 121.06
Investment expenses -79.18 -98.13
Net investment contribution 104.81 22.93
Allocated investment return -53.94 —
Net investment result 50.87 22.93
Interest Income — 15.87
Interest expense -1.48 -2.00
Operating result -138.71 -28.99
Other income 33.84 —
Administration and other expenses 3 -84.27 —
Allocated operating costs 43.68 —
Foreign exchange -31.89 1.88
Loss before tax -177.35 -27.11
Direct taxes -0.53 -0.98
Net loss -177.88 -28.09
The accompanying notes form an integral part of the financial statements

Catlin Re Switzerland Ltd Annual Report 2018
FINANCIAL STATEMENTS
BALANCE SHEET
As of December 31
Page 5
Assets
CHF millions Notes 2017 2018
Investments
Investment in affiliated companies 12 138.64 159.92
Fixed income securities 3,956.61 2,972.51
Equity securities 25.96 26.11
Other Investments 316.49 86.98
Short term investments 260.31 66.15
Hedge Funds Investments 22.37 —
Private Equity Investments 22.01 20.83
Alternative investments 11.80 —
Total investments 4,437.70 3,245.52
Funds withheld 9 436.67 446.80
Cash and cash equivalents 403.66 133.64
Reinsurer's share in technical provisions 5 273.71 347.38
Tangible assets 0.03 —
Deferred acquisition costs 423.16 438.64
Premiums and other receivables from reinsurance, net of bad debts 4 1,008.56 1,200.52
Other receivables 764.79 476.59
Other assets 0.37 0.82
Accrued income 20.89 19.47
Total assets 7,769.54 6,309.38
The accompanying notes form an integral part of the financial statements.
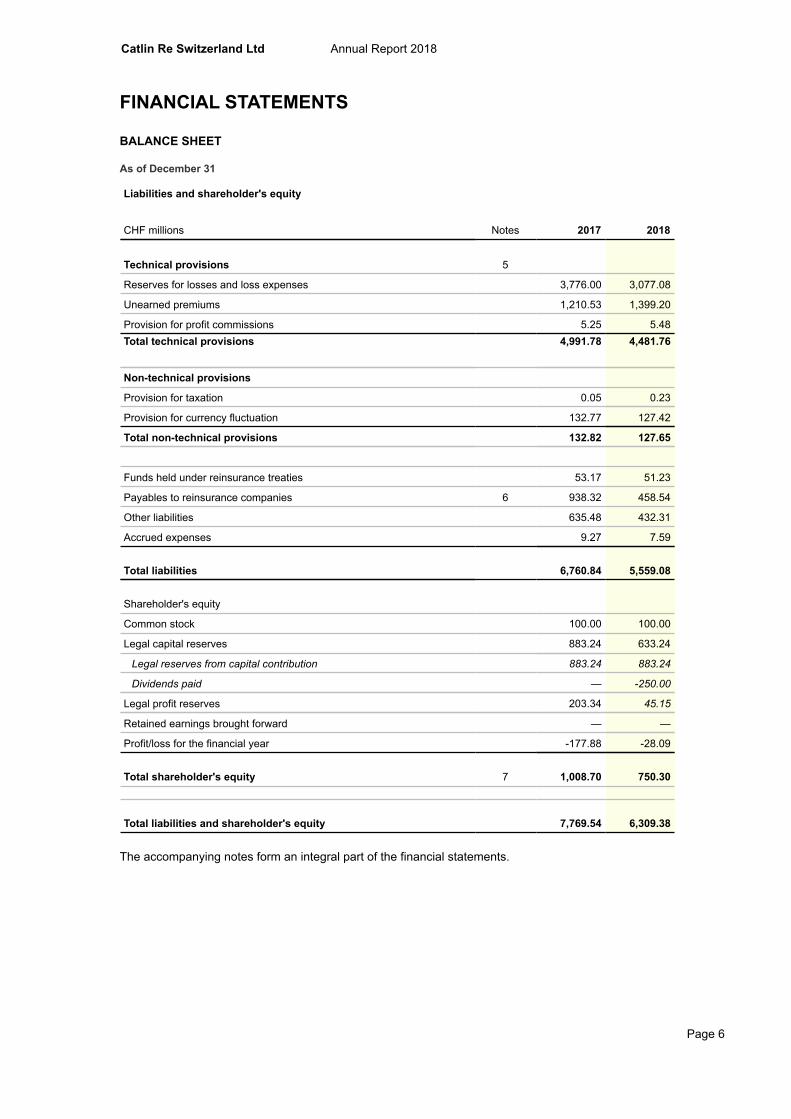
Catlin Re Switzerland Ltd Annual Report 2018
FINANCIAL STATEMENTS
BALANCE SHEET
As of December 31
Page 6
Liabilities and shareholder's equity
CHF millions Notes 2017 2018
Technical provisions 5
Reserves for losses and loss expenses 3,776.00 3,077.08
Unearned premiums 1,210.53 1,399.20
Provision for profit commissions 5.25 5.48Total technical provisions 4,991.78 4,481.76
Non-technical provisions
Provision for taxation 0.05 0.23
Provision for currency fluctuation 132.77 127.42
Total non-technical provisions 132.82 127.65
Funds held under reinsurance treaties 53.17 51.23
Payables to reinsurance companies 6 938.32 458.54
Other liabilities 635.48 432.31
Accrued expenses 9.27 7.59
Total liabilities 6,760.84 5,559.08
Shareholder's equity
Common stock 100.00 100.00
Legal capital reserves 883.24 633.24
Legal reserves from capital contribution 883.24 883.24
Dividends paid — -250.00
Legal profit reserves 203.34 45.15
Retained earnings brought forward — —
Profit/loss for the financial year -177.88 -28.09
Total shareholder's equity 7 1,008.70 750.30
Total liabilities and shareholder's equity 7,769.54 6,309.38
The accompanying notes form an integral part of the financial statements.
Catlin Re Switzerland Ltd Annual Report 2018
NOTES TO THE FINANCIAL STATEMENTS
SIGNIFICANT ACCOUNTING PRINCIPLES Basis of preparation
The financial statements of Catlin Re Switzerland Ltd ("Catlin Re" or the "Company"), domiciled in Zurich, Switzerland, are prepared in accordance with Swiss Company Law. The 2018 financial year comprises the accounting period from January 1 to December 31, 2018. The prior period was from January 1 to December 31, 2017.
These financial statements have been prepared in accordance with the provisions on accounting and financial reporting of the 32nd title of Swiss Code of Obligations and with the additional requirements defined by FINMA (Art. 5-6a AVO-FINMA, valid as of December 15, 2015).
Use of estimates in the preparation of annual accounts
The preparation of the annual accounts requires management to make significant estimates and assumptions that affect the reported amounts of assets, liabilities, income and expenses as well as the related disclosures. Actual results could differ significantly from the estimates.
Foreign currency translation
Foreign currency transactions incurred in each of the Company's business units are revalued into the functional currency using average exchange rates applicable to the period in which the transactions take place. Foreign exchange gains and losses resulting from the settlement of such transactions and from revaluation at the period end of monetary assets and liabilities denominated in foreign currencies are deemed realised exchange gains and losses and recorded in the income statement.
Each business unit with a different functional currency different from the Company's statutory reporting currency Swiss Francs is translated as follows:
– income and expenses at the monthly average rates of exchange; and– assets and liabilities at exchange rates prevailing at the balance sheet date; and– resulting unrealised exchange losses either offset against the provision for currency fluctuation or recorded in
the income statement. Unrealised exchange gains are deferred and recorded as a separate line item on the balance sheet.
All assets and liabilities arising from reinsurance contracts are treated as monetary items. At each period end foreign currency monetary items are revalued and translated using the closing rate (including unearned premiums and deferred acquisitions costs). Non-monetary items measured at historical cost are translated using the exchange rate at the date of the transaction.
Unrealised losses from translation are either offset against the provision for currency fluctuation or recorded in the income statement.
Investments
The following assets are carried at cost less necessary and legally permissible depreciation:– Investments in affiliated companies– Fixed income securities– Equity Securities– Other investments, such as
Page 7
Short term investmentsHedge fund investmentsPrivate equity investments Alternative investments (art)
Short-term investments are composed of instruments with original maturities of more than 90 days and less than one year from the date of purchase.
The valuation rules prescribed by Swiss Financial Market Supervisory Authority FINMA are followed whereby all investments are valued individually.
Catlin Re Switzerland Ltd Annual Report 2018
Funds at Lloyd's
Business written in Lloyd’s by Syndicate 2003 is supported by Funds at Lloyd’s ("FAL"). Part of Catlin Re’s investment portfolio has been put under the control of the Society of Lloyd’s in support of Catlin Syndicate Limited’s Lloyd’s business. The amount of and compensation for providing FAL support is determined as part of the Intra-Group Reinsurance contract between Catlin Re and Catlin Syndicate Limited.
Tangible assets
Tangible assets are carried at cost less individually scheduled straight-line depreciation over their useful lives. Items of minor value are not capitalised.
Funds withheld
Funds withheld are balances held by cedants in respect of open reinsurance contracts. In the case of the Intra-Group Reinsurance contract with Catlin Syndicate Limited, no payments were made until a year of account was closed three years after the start of the year of account. This is to mirror the fact that premiums net of claims and commissions received by the Syndicate were held in trust until the year of account was closed.
Reinsurer’s share in technical provisions
Reinsurer’s share in technical provisions includes the balances due from reinsurance companies for paid and unpaid losses and loss expenses that will be recovered from reinsurers, based on contracts in force.
The technical provisions pertaining to retroceded business are determined or estimated according to the contractual agreement and the underlying gross business data per treaty.
Deferred acquisition costs
Deferred acquisition costs principally consist of commissions and other external variable costs directly connected with the acquisition or renewal of existing reinsurance contracts. Deferred acquisition costs represent the proportion of commission incurred which corresponds to the element of the premium that is unearned on the related contracts. Deferred acquisition costs are capitalised in accordance with the business plan submitted to FINMA.
Other assets and other receivables
Other assets are carried at nominal value after deduction of known credit risks, and if applicable, less necessary and legally permissible depreciation.
Technical provisions
The technical provisions are valued in accordance with the following principles:
A liability is established for unpaid losses and loss expenses when insured events occur. The liability is based on the expected ultimate cost of settling the claims. The reserves for losses and loss expenses include: (1) case reserves for known but unpaid claims as at the balance sheet date, including any potential deterioration on existing estimates; (2) incurred but not reported reserves ("IBNR") for claims where the insured event has occurred but has not been reported to Catlin Re as at the balance sheet date; and (3) loss adjustment expense reserves for the expected handling costs of settling the claims.
The estimation of the necessary claim reserves requires the use of informed estimates and judgements and as such are subject to considerable uncertainty. Reserves for losses and loss expenses are based on the analysis of the historical amounts reported by the ceding companies together with other relevant information. The methods and assumptions chosen follow generally accepted actuarial principles.
The equalisation provision is established to ensure the recommended statutory technical provisions equal or exceed the market consistent value of technical provisions.
Premiums written relating to future periods are stated as unearned premiums and are calculated by statistical methods. The accrual of commission is determined correspondingly and is reported in the line item “Deferred acquisition costs”.
Provisions for profit commissions are to cover instances where the commission is dependent on the claim experience of the contract, e.g. sliding scale or profit commission, so that an additional liability is due in excess of the commission already incurred or, in the case where the loss experience is worse than expected, a rebate of commission is due.
Page 8

Catlin Re Switzerland Ltd Annual Report 2018
Non-technical provisions
Provision for taxation contains taxes for the financial year.
Provision for currency fluctuation comprises of unrealised foreign exchange gains from the translation of assets and liabilities from the business units functional currencies to the reporting currency Swiss Francs.
Funds held under reinsurance treaties
Funds held under reinsurance treaties mainly contain cash deposits withheld from retrocessionaires, which are stated at redemption value.
Payables to reinsurance companies
Payables to reinsurance companies are held at redemption value.
Allocated investment return
The allocated investment return contains the calculated interest generated on the investment covering the technical provisions. The interest rate reflected the currency-weighted average yield on five-year government bonds. For 2018, the reallocation to the underwriting result was no longer performed to better comply with the minimum disclosure requirements as set out by FINMA.
Interest income
Other interest income is mainly comprised of interest earned on funds withheld which have been disclosed in prior year within the investment income.
Operating costs
Until 2017, Administration and other expenses were allocated to the reinsurance business and investment result on an imputed basis. For 2018, the reallocation to the underwriting result was no longer performed to better comply with the minimum disclosure requirements as set out by FINMA and administration expenses are now disclosed within the Gross acquisition costs and administration expenses line item.
Direct taxes
Direct taxes relate to the financial year and include income and capital tax.
Page 9
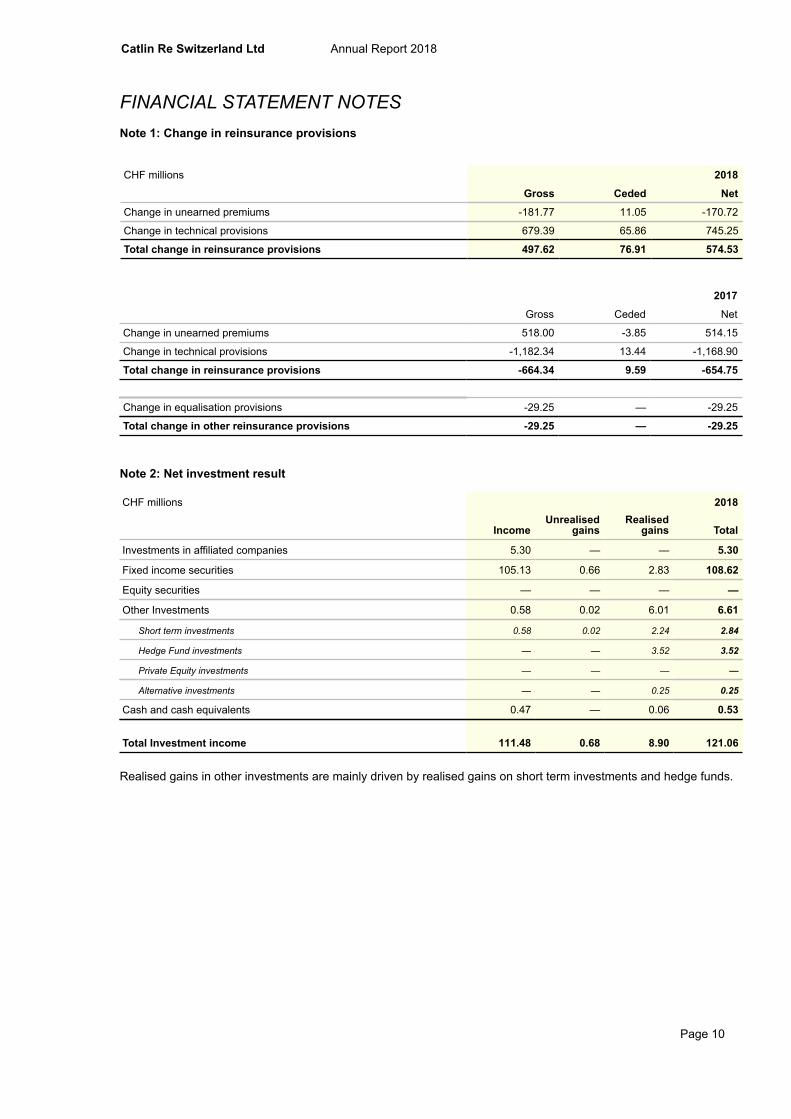
Catlin Re Switzerland Ltd Annual Report 2018
FINANCIAL STATEMENT NOTESNote 1: Change in reinsurance provisions
Page 10
CHF millions
Gross Ceded
2018
Net
Change in unearned premiums -181.77 11.05 -170.72
Change in technical provisions 679.39 65.86 745.25
Total change in reinsurance provisions 497.62 76.91 574.53
Gross Ceded
2017
Net
Change in unearned premiums 518.00 -3.85 514.15
Change in technical provisions -1,182.34 13.44 -1,168.90
Total change in reinsurance provisions -664.34 9.59 -654.75
Change in equalisation provisions -29.25 — -29.25
Total change in other reinsurance provisions -29.25 — -29.25
Note 2: Net investment result
CHF millions
IncomeUnrealised
gainsRealised
gains
2018
Total
Investments in affiliated companies 5.30 — — 5.30
Fixed income securities 105.13 0.66 2.83 108.62
Equity securities — — — —
Other Investments 0.58 0.02 6.01 6.61
Short term investments 0.58 0.02 2.24 2.84
Hedge Fund investments — — 3.52 3.52
Private Equity investments — — — —
Alternative investments — — 0.25 0.25
Cash and cash equivalents 0.47 — 0.06 0.53
Total Investment income 111.48 0.68 8.90 121.06
Realised gains in other investments are mainly driven by realised gains on short term investments and hedge funds.
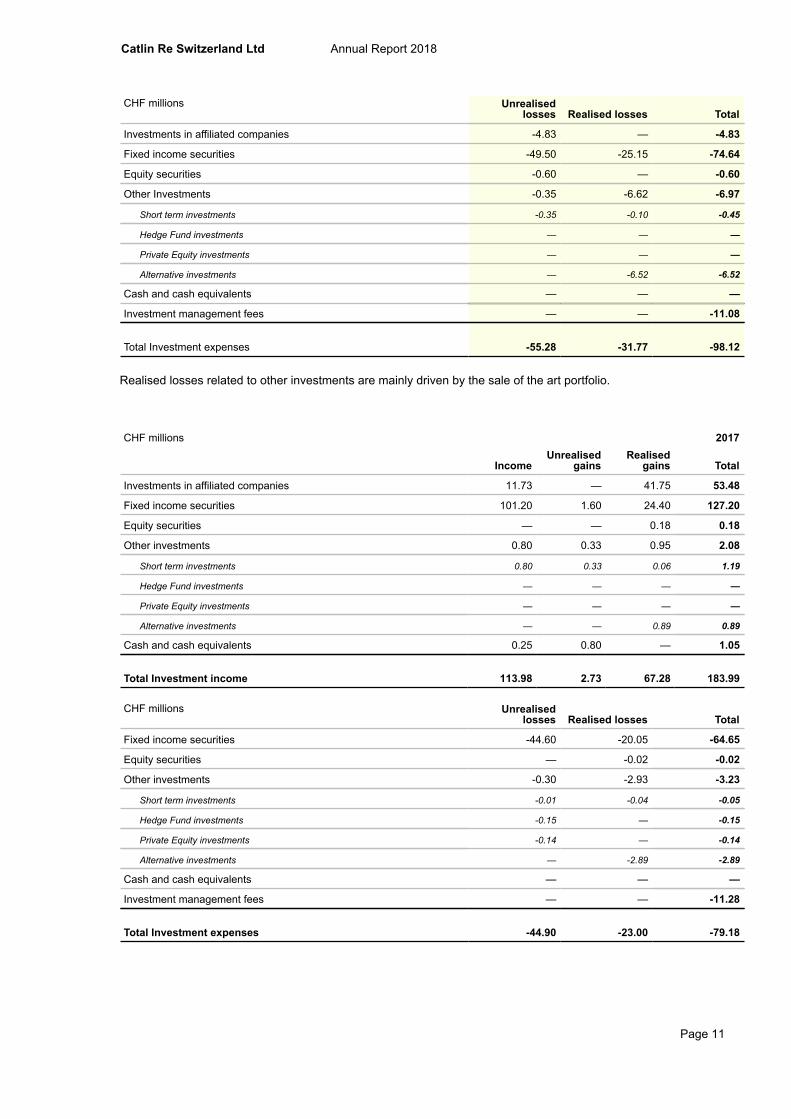
Catlin Re Switzerland Ltd Annual Report 2018
Page 11
CHF millions Unrealisedlosses Realised losses Total
Investments in affiliated companies -4.83 — -4.83
Fixed income securities -49.50 -25.15 -74.64
Equity securities -0.60 — -0.60
Other Investments -0.35 -6.62 -6.97
Short term investments -0.35 -0.10 -0.45
Hedge Fund investments — — —
Private Equity investments — — —
Alternative investments — -6.52 -6.52
Cash and cash equivalents — — —
Investment management fees — — -11.08
Total Investment expenses -55.28 -31.77 -98.12
Realised losses related to other investments are mainly driven by the sale of the art portfolio.
CHF millionsUnrealised Realised
Income gains gains
2017
Total
Investments in affiliated companies 11.73 — 41.75 53.48
Fixed income securities 101.20 1.60 24.40 127.20
Equity securities — — 0.18 0.18
Other investments 0.80 0.33 0.95 2.08
Short term investments 0.80 0.33 0.06 1.19
Hedge Fund investments — — — —
Private Equity investments — — — —
Alternative investments — — 0.89 0.89
Cash and cash equivalents 0.25 0.80 — 1.05
Total Investment income 113.98 2.73 67.28 183.99
CHF millions Unrealisedlosses Realised losses Total
Fixed income securities -44.60 -20.05 -64.65
Equity securities — -0.02 -0.02
Other investments -0.30 -2.93 -3.23
Short term investments -0.01 -0.04 -0.05
Hedge Fund investments -0.15 — -0.15
Private Equity investments -0.14 — -0.14
Alternative investments — -2.89 -2.89
Cash and cash equivalents — — —
Investment management fees — — -11.28
Total Investment expenses -44.90 -23.00 -79.18

Catlin Re Switzerland Ltd Annual Report 2018
Note 3: Administration and other expenses
Administration and other expenses amounted to CHF 84m in 2017, thereof CHF 0.30m are related to audit fees.In 2018, Administration and other expenses amount to CHF 73m and are disclosed in Gross acquisition costs and administration expenses to be more in line with minimum disclosure requirements (AVO-FINMA). Thereof CHF 0.31mare related to audit fees.
Note 4: Premiums and other receivables from reinsurance
Page 12
CHF millions 2017 2018
Receivables from agents and brokers 895.61 1,144.31
Receivables from reinsurance companies 112.95 56.21
Total premiums and other receivables from reinsurance 1,008.56 1,200.52
The Company does not write direct business with policyholders. Most business is generated through agents and brokers.
Note 5: Net technical provisions
CHF millions
Gross Ceded
2017
Net Gross Ceded
2018
Net
Reserves for losses and loss expenses 3,776.00 -199.31 3,576.69 3,077.08 -264.86 2,812.22
Unearned premiums 1,210.53 -74.40 1,136.13 1,399.20 -82.52 1,316.68
Provisions for profit commissions 5.25 — 5.25 5.48 — 5.48
Total net technical provisions 4,991.78 -273.71 4,718.07 4,481.76 -347.38 4,134.38
Net technical provisions have decreased from CHF 3,577m to CHF 2,812m mainly due to the cancellation of the internal US based quota share agreements at the end of 2017 and corresponding claims settlements throughout 2018. Unearned premiums increased mainly due to a higher signed line on a large corporate quota share.
Note 6: Payables to reinsurance business
CHF millions 2017
Payables to agents and brokers —
Payables to reinsurance companies 938.32
Total payables to reinsurance companies 938.32
2018
165.51
293.03
458.54
The decrease of the overall payables to reinsurance companies is a result of settlements in 2018 due to the cancellation of the internal US based quota share agreements. Most external business is generated through agents and brokers.

Catlin Re Switzerland Ltd Annual Report 2018
Note 7: Shareholder’s equity rollforward
Page 13
CHF millionsCommon
stockLegal capital Legal profit
reserves reserves
Profit/loss forthe financial
year Total
as of 31 December 2017 100.00 883.24 203.34 -177.88 1,008.70
Allocation of loss to Legal profit reserves — — -177.88 177.88 —
Capital contribution — — 19.69 — 19.68
Dividend payment — -250.00 — — -250.00
Loss for the financial year — — — -28.09 -28.09
as of 31 December 2018 100.00 633.24 45.15 -28.09 750.30
Share capital of the Company amounts to CHF 100m that is fully paid-in. It is divided into ten million registered shares with a nominal value of ten Swiss Francs per share. During December 2018 Green Holdings Limited, a company incorporated in Bermuda and a fully owned AXA XL company, contributed USD 20m (CHF 19.69m) in cash to Catlin Re. The contributor acquired no rights as shareholder of Catlin Re. On June 19, 2018, the shareholder's meeting unanimously resolved to pay a dividend of CHF 250m. This dividend was paid on 29 August, 2018, to Catlin Luxembourg S.à r.l. from legal capital reserves from capital contribution.
Note 8: Contingent liabilities
The Company is committed to an operating lease agreement until September 30, 2019, as a lessee of office space. Management decided to consolidate Zurich offices whereby Catlin Re’s office space was vacated during 2016. In 2017 the Zurich office was sublet. The difference between the remaining lease obligations less the sub-rental income was fully expensed in the 2017 fiscal year in the administration and other expenses line item. As a result, the Company is not exposed to any further non-cancellable future obligations as per the balance sheet date.
The Company has access to unsecured and secured letter of credit facilities to support its reinsurance business. As at December 31, 2018, unsecured irrevocable letters of credit in the amount of CHF 44m (2017: CHF 122m) have been issued under these facilities.
These letters of credit are used to secure the reserves ceded to the Company under certain reinsurance contracts.
Note 9: Funds withheld
Funds withheld of CHF 447m (2017: CHF 437m) represent deposits held by cedants, of which nil (2017: CHF 208m) are deposits held by Intra-Group ceding companies. The increase in external funds withheld is mainly driven by an increased signed line on a large corporate quota share contract.
Note 10: Restricted assets
In certain markets, the Company is required to maintain assets in accounts pledged for the benefit of ceding companies. These requirements are generally promulgated in the statutory regulations of the individual jurisdictions.
The Company also has investments in segregated portfolios to provide collateral for certain bank letters of credit issued for the benefit of ceding companies.
In connection with the Intra-Group Reinsurance of the Syndicate business, the Company also provides Funds at Lloyd's in support of Catlin Syndicate Limited’s business at Lloyd’s. In connection with the terminated US Intra-Group Reinsurance business, the Company has investments held in portfolios to fulfill Reg 114 Trust fund requirements.

Catlin Re Switzerland Ltd Annual Report 2018
The total value of these restricted assets by category as at December 31, 2018 and 2017 are as follows:
Page 14
CHF millions 2017 2018
Fixed income securities 3,015.83 2,035.09
Short term investments 135.30 66.15
Cash and cash equivalents 301.35 27.84
Accrued income and other receivables 15.03 11.34
Total restricted assets 3,467.51 2,140.42
Note 11: Claims on and obligations towards AXA XL Group companies
CHF millions
Assets
2017 2018
Premiums and other receivables from reinsurance — 11.73
Funds withheld 208.31 —
Other receivables 526.54 351.01
Liabilities
Payables to reinsurance companies 717.92 231.06
Other liabilities 336.49 328.99
Note 12: Investments in affiliated companies
in CHF millions as of 31 December 2018 City, Country Net book value Equity interest Voting shares
XL Resseguros Brasil S.A. São Paulo, Brasil 86.62 100% 100%
XL Investments Latin America Ltd, inliquidation Hamilton, Bermuda — 100% 100%
XL Re Latin America Argentina SA Buenos Aires, Argentina — 80% 80%
Catlin US Investment Holdings LLC Wilmington, USA 11.29 15% 40%
XL Value Offshore LLC Hamilton, Bermuda 62.00 25% 25%
Total Investments in affiliated companies 159.92
in CHF millions as of 31 December 2017 City, Country Net book value Equity interest Voting shares
XL Resseguros Brasil S.A. São Paulo, Brasil 86.12 100% 100%XL Investments Latin America Ltd, inliquidation Hamilton, Bermuda — 100% 100%
XL Re Latin America Argentina SA Buenos Aires, Argentina — 80% 80%
Catlin US Investment Holdings LLC Wilmington, USA 11.29 15% 40%
XL Value Offshore LLC Hamilton, Bermuda 41.23 25% 25%
Total Investments in affiliated companies138.64
The increase in the book value for XL Value Offshore LLC is driven by capital contributions amounting to CHF 25m and an impairment of CHF 5m.

Catlin Re Switzerland Ltd Annual Report 2018
Note 13: Staff
The average number of full time equivalents employed by the Company for 2018 and 2017 is more than 10 but less than 50.
Note 14: Subsequent events
On March 1, 2019, regulatory approval was obtained from the Bermuda Monetary Authority ("BMA") for the creation of a new AXA XL company called Seaview Re Ltd ("Seaview Re") domiciled in Hamilton, Bermuda. Seaview Re in turn is a subsidiary of a Delaware domiciled holding company called Seaview Re Holdings Inc ("Seaview Holdings"). On March 5, 2019, USD 475m was contributed from Catlin Re to Seaview Holdings by way of asset transfer, whereby Seaview Holdings will be a wholly-owned subsidiary of Catlin Re.
There have been no other further material events between December 31, 2018 and the date of this report which are required to be disclosed.
Page 15

Catlin Re Switzerland Ltd Annual Report 2018
APPROPRIATION OF EARNINGS
The Board of Directors will propose at the Annual Shareholder Meeting to be held in Zurich on June 18, 2019 to allocate the loss of the financial year of CHF 28.09m to retained earnings:
Page 16
in CHF 2017
Retained earnings balance brought forward from the prior year —
Loss for the financial year -177,878,221
Allocation to Legal profit reserves 177,878,221
Retained earnings after allocation —
2018
—
-28,085,955
—
-28,085,955


![AXA Equitable Life Insurance Company, et al. - SEC.gov · SECURITIES AND EXCHANGE COMMISSION [Release No. IC -30373; File No. 812- 14036] AXA Equitable Life Insurance Company, et](https://img.pdfslide.net/doc/110x75/5af4c9137f8b9a95468e6a56/axa-equitable-life-insurance-company-et-al-secgov-and-exchange-commission-release.jpg)