Embed Size (px)
Citation preview

NBER WORKING PAPER SERIES
SECTORAL JOB CREATION ANDDESTRUCTION RESPONSES
TO OIL PRICE CHANGES
Steven J. DavisJohn Haltiwanger
Working Paper 7095http://www.nber.org/papers/w7095
NATIONAL BUREAU OF ECONOMIC RESEARCH1050 Massachusetts Avenue
Cambridge, MA 02138April 1999
An early version of this paper was presented at the conference on "International Energy Security: EconomicVulnerability to Oil Price Shocks," sponsored by the Department of Energy and the Department of State and held inWashington, DC on October 3-4, 1996. We thank the conference participants and especially the organizers, Inja Paikand Don Jones, for helpful comments. Michael Horvath, our discussant at the NBER Economic Fluctuations Meetingin July 1997, provided especially careful and detailed comments on an earlier draft. Other useful commentscamefrom conference and seminar participants at the NBER, the American Economics Association, the AmericanPetroleum Institute, Cambridge University, the Federal Reserve Bank of Kansas City, Georgetown University, MIT,Notre Dame, Princeton, University of Chicago, University of Missouri, University of Pennsylvania, UniversityCollege London, and Vanderbilt University. We also thank Pete Klenow for supplying data on product durability.Cathy Buffington, Lucia Foster, and Andrew Figura provided excellent research assistance. The authors gratefullyacknowledge research support by the Department of Energy and the National Science Foundation. The viewsexpressed herein are those of the authors and do not necessarily reflect the views of the National Bureau of EconomicResearch or of the Bureau of the Census.
n 1999 by Steven J. Davis and John Haltiwanger. All rights reserved. Short sections of text, not to exceed twoparagraphs, may be quoted without explicit permission provided that full credit, including © notice, is given to thesource.

Sectoral Job Creation and DestructionResponses to Oil Price ChangesSteven J. Davis and John HaltiwangerNBER Working Paper No. 7095April 1999
ABSTRACT
We study the effects of oil price changes and other shocks on the creation and destruction
of U.S. manufacturing jobs from 1972 to 1988. We find that oil shocks account for about 20-25
percent of the cyclical variability in employment growth under our identifying assumptions, twice
as much as monetary shocks. Employment growth shows a sharply asymmetric response to oil price
ups and downs, in contrast to the prediction of standard equilibrium business cycle models. The
two-year employment response to an oil price increase rises (in magnitude) with capital intensity,
energy intensity, and product durability. Job destruction shows much greater short-run sensitivity
to oil and monetary shocks than job creation in every sector with the clear exception ofyoung, small
plants. Oil shocks also generate important reallocative effects. For example, we estimate that job
reallocation rose by 11 percent of employment over 3-4 years inresponse to the 1973 oil shock.
More than 80 percent of this response reflects greater job reallocation activity within manufacturing.
Steven J. Davis John HaltiwangerGraduate School of Business Department of EconomicsUniversity of Chicago University of MarylandChicago, IL 60637 College Park, MD 20742and NBER and [email protected] haltg1ue.umd.edu

I. Introduction
We study the effects of oil price changes and other shocks on the creation and destruc-
tion of jobs in the U.S. manufacturing sector. Our study provides a richer characterization
of sectoral job creation and destruction dynamics than previous research, and it produces
new evidence related to the role of oil shocks in economic fluctuations. The evidence speaks
to several questions: Through what transmission mechanisms do oil shocks influence ag-
gregate and sectoral employment? How does the economy's dynamic response to oil shocks
differ from its response to monetary shocks? How do the job creation and destruction re-
sponses to oil shocks vary among industries and among sectors that differ by capital and
energy intensity in production, age of production facilities, size of employer, and durability
of final product? How many manufacturing jobs are created and destroyed in response to
oil price shocks, and over what time span?
Our empirical analysis exploits quarterly measures of sectoral job creation and de-
struction rates from 1972 to 1988. The detailed sectoral measures reflect tabulations of
the plant-level data in the Longitudinal Research Datafile (LRD), as described in Davis,
Haltiwanger and Schuh (1996). The sectoral detail enables us to better evaluate the role
of oil shocks and helps discriminate among alternative interpretations of the apparent re-
sponses to oil shocks. For example, interpretations that stress the coincident behavior of
monetary policy suggest a different pattern of sectoral responses than interpretations that
stress the reallocative effects of oil shocks. The decomposition of sectoral employment
changes into job creation and destruction components also helps interpret the response to
oil shocks. A concrete example serves to develop this point and motivate our study.
Consider the impact of oil price shocks on the U.S. automobile industry. The OPEC oil
price shock of 1973 increased the demand for small, fuel-efficient cars and simultaneously
reduced the demand for larger cars. American automobile companies were poorly situated
1

to respond to this shock, because their capital stock and work force were primarily directed
toward the production of large cars. Consequently, capacity utilization and output fell in
the wake of the oil price shock, even though a handful of plants equipped to produce small
cars operated at peak capacity, as documented by Bresnahan and Ramey (1993). This
aspect of the auto industry's response to the 1973 oil price shock is difficult to discern and
analyze with the aggregated data typically brought to bear on business cycle analysis. Even
detailed industry-level data on output and employment will likely obscure the magnitude
and nature of reallocative activity triggered by the shock.
The oil price shock adversely affected the closeness between the desired and actual
characteristics of factor inputs in the auto industry along several dimensions. First, much
of the physical capital in the auto industry was dedicated to the production of larger rather
than smaller cars. Second, U.S. auto workers had accumulated skills that were specialized
in the production of particular models, and these tended to be larger vehicles. Third,
many auto workers laid off from large-car plants could not take up employment at small-
car plants without a costly relocation. Fourth, the dealership network and sales force of
the U.S. auto industry had evolved under an era of thriving large-car sales, and they were
probably better suited to market, distribute and service larger cars. Fifth, the knowledge
base and the research and design personnel at U.S. auto companies were specialized in
engineering larger cars. The development of smaller, more fuel-efficient cars required a
costly and time-consuming reorientation of the knowledge base and the development of
new skills by research and design personnel.
These remarks suggest how factor specialization and reallocation frictions led to re-
duced output and employment in the auto industry in the wake of the first OPEC oil
price shock. Similar remarks could be fashioned for many other industries. Coupled with
the magnitude and widespread impact of oil price shocks over the past twenty-five years,
2

these remarks also suggest how oil price shocks could cause large aggregate fluctuations
by upsetting established patterns of production. Several previous studies investigate the
hypothesis that oil price shocks drove large aggregate fluctuations in this way, but previous
work lacks the sectoral detail on job creation and destruction that we exploit.'
Based on aggregated data alone, the output decline experienced by the auto industry
in the wake of the 1973 oil price shock might appear to be driven entirely by the coincident
behavior of monetary policy or other events. Bresnahan and Ramey's analysis of plant-level
data undercuts this interpretation and illustrates the usefulness of a more disaggregated
approach. Our study exploits sectoral job creation and destruction measures tabulated
from plant-level data to investigate the channels through which oil shocks affect sectoral
and aggregate outcomes. Our approach is similar in spirit to that of Bresnahan and Ramey
(1993), but we bring to bear a different econometric framework and a much more extensive
data set.
Our framework is designed to evaluate the importance of oil price shocks, and the
channels through which they drive economic fluctuations, while simultaneously incorpo-
rating a role for observable indicators of monetary policy shocks and a variety of unobserved
common and sector-specific disturbances. We use the framework to help assess whether oil
shocks affect employment via aggregate or allocative channels. By "aggregate channels"
we refer to the potential output, income transfer and sticky wage effects stressed by tradi-
tional macroeconomic analyses (described in Mork, 1994) and to the effects of oil shocks
1See, e.g., Davis (1985), Loungani (1986), Mork (1989) and Mork, Olsen and Mysen (1994).
Hamilton's (1988) model of reallocation frictions is motivated by the apparent impact of
oil price shocks on aggregate economic activity. See Bohi (1989), Mork (1994) and the
conclusion to this paper for references to other work on whether oil price shocks drive
aggregate fluctuations by upsetting established patterns of production.
3

in aggregative models with imperfectly competitive product markets (e.g., Rotemberg and
Woodford (1996)).2 By "allocative channels" we refer to the aspects of oil price changes
that alter the closeness of the match between the desired and the actual distributions of
labor and capital inputs, as in the auto industry example.
To assess whether oil price shocks operate primarily through aggregate or allocative
channels, we exploit the decomposition of employment changes into job creation and de-
struction components. An important virtue of the decomposition is that the allocative
and aggregate effects of an oil price shock induce qualitatively different job creation and
destruction dynamics. For example, the unfavorable aggregate aspects of an oil price
rise reduce creation and increase destruction, whereas the allocative aspects increase both
creation and destruction. This qualitative difference serves as one means for assessing
which type of mechanism dominates the linkage between oil price shocks and economic
fluctuations.
By including measures of the magnitude and direction of oil price movements in our
econometric models, we obtain a second means for assessing how oil shocks operate. In
particular, we compare the dynamic employment and job flow responses associated with
positive oil price shocks to the responses associated with negative price shocks.3 If oil price
shocks matter primarily because they alter the closeness of the match between the desired
and actual distribution of factor inputs, then employment responds to the magnitude of
the price change, irrespective of the direction of change. Alternatively, if oil price shocks
2Mork and Hall (1980), Finn (1991), Kim and Loungani (1992) and Rotemberg and Wood-
ford (1996) capture several of the effects operating through "aggregate channels" in explicit,
dynamic equilibrium models.3This aspect of our approach builds on an idea previously exploited by Davis (1985),
Loungani (1986), Mork (1989), Mork, Olsen and Mysen (1994) and others.
4

matter primarily because they shift aggregate labor supply or labor demand as in Kim and
Loungani (1992), Rasche and Tatom (1977, 1981) and Rotemberg and Woodford (1996),
then employment responds roughly symmetrically to positive and negative oil price shocks.
To carry out our investigations, we estimate sectoral vector autoregressions (VARs)
that contain common and sector-specific variables. We specify the VARs so that the oil
and monetary shocks and two unobserved common shocks are identical across sectors, but
we allow the estimated shock response functions to differ freely across sectors. We also
allow for two sector-specific shocks in each VAR. The resulting econometric model can be
interpreted as a constrained panel VAR that simultaneously exploits the time-series data
for all sectors while allowing for multiple common and sector-specific shocks.
The next section describes the data, highlights prominent aspects of job creation and
destruction behavior, and summarizes how the level and cyclical behavior of job flows
relate to sectoral characteristics. Section III articulates our econometric framework and
spells out our identifying assumptions. We apply the econometric framework in Section
IV to evaluate the relative importance of the various shocks and to estimate dynamic
response functions. We find a larger role for oil shocks than monetary shocks in our
sample period, much greater short-run sensitivity of destruction than creation to both
monetary and oil shocks, sharply asymmetric responses to oil price ups and downs, and
pronounced differences among sectors in the size of shock responses.
These response differences prompt an investigation into which sectoral characteristics
matter for sensitivity to the shocks. We pursue this matter in Section V by relating shock
response functions for about 450 detailed manufacturing industries to observable industry
characteristics. We find that the cumulative two-year employment response to a positive
oil price shock rises sharply (in magnitude) with capital intensity and product durability. It
rises with energy intensity over the lower two-thirds of the energy intensity distribution and
5

then flattens out. The cumulative two-year employment response to an adverse monetary
shock is typically modest, but it rises with product durability and with the fraction of
employment at young plants.
We quantify the number of jobs created and destroyed in response to typical oil and
monetary shocks in section VI. According to our point estimates, a unit standard deviation
positive oil shock triggers the destruction of an extra 290,000 production worker jobs and
the creation of an extra 30,000 jobs in the first two years after the shock. A unit standard
deviation adverse monetary shock triggers the destruction of an extra 150,000 jobs and
the creation of 10,000 fewer jobs over two years. After four years, the net employment
response to a unit positive oil shock is only 60,000 fewer jobs, but the gross reallocation
response amounts to 410,000 jobs or more than 3 percent of employment. This sizable
gross job reallocation response points to important allocative effects of oil shocks.
Section VII draws together our main findings and sets forth several conclusions.
II. Data Description
A. Measurement and Basic Facts: Sectoral Job Flows
For data on sectoral job flows, we tabulate quarterly job creation and destruction time
series from the LRD following Davis, Haltiwanger and Schuh (1996). These tabulations
reflect plant-level changes in the number of employed production workers in the middle
month of each quarter. We express job flows as rates by dividing by the simple average of
current and previous-period employment, and we remove seasonality using sector-specific
seasonal dummies.
We consider several sectoral classification schemes: (i) detailed industry, defined by 20
two-digit or 450 four-digit SICs; (ii) energy intensity, defined by deciles of the employment-
weighted plant-level distribution of energy costs as a percent of shipments value; (iii)
6

capital intensity, defined by quintiles of the employment-weighted 4-digit industry-level
distribution of capital per production worker; (iv) product durability, defined in terms of
the 4-digit industry-level product depreciation rates for consumer goods in Bils and Klenow
(1998); and (v) establishment size-age categories, defined in terms of employment level and
years since first manufacturing employment. Classifications (i) and (ii) are drawn directly
from our earlier work with Schuh, and (iii)-(v) are newly tabulated series for this paper.4
Table 1 provides summary statistics for sectoral job flows, and Figures 1 display
the quarterly time series. A key feature of the data is the large magnitude of gross job
flows. On average over the 1972:2-1988:4 period, the number of newly destroyed (newly
created) manufacturing production worker jobs equals 5.5 (5.2) percent of employment
per quarter — an average quarterly job reallocation rate of 10.7 percent. We interpret this
large magnitude to mean that the economy continually adjusts to a stream of allocative
disturbances that cause a reshuffling of employment opportunities across locations. Table
1 makes clear that large-scale job reallocation occurs within detailed industries and sectors
as well.
Looking across industries, the average quarterly job reallocation rate ranges from 7.4
4Major revisions to the 4-digit SIC were implemented in 1987. We spliced the 4-digit data
across the 1986-1987 breakpoint using the concordance described in Barteisman and Gray
(1996). For energy (capital) intensity, we grouped plants into deciles (quintiles) on a yearly
basis. We measure establishment size as the simple average of current and previous-period
employment. See the Appendix to Davis, Haltiwanger and Schuh (1996) for a detailed
treatment of measurement procedures. The Bils-Klenow depreciation measure is available
for 106 four-digit industries, 40 of which are in SIC 20 (Food and Kindred Products). Rela-
tive to most other manufacturing industries, the food industries exhibit high average rates
of creation and destruction and considerably more high-frequency (seasonal) variation.
7
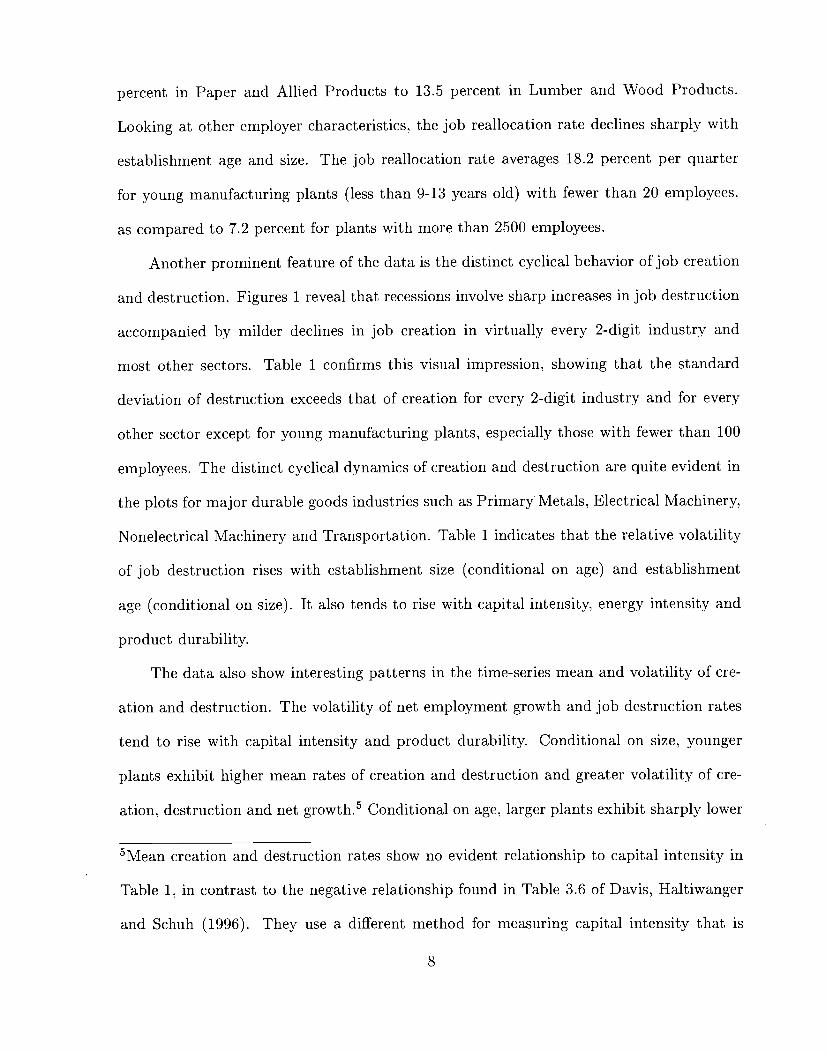
percent in Paper and Allied Products to 13.5 percent in Lumber and Wood Products.
Looking at other employer characteristics, the job reallocation rate declines sharply with
establishment age and size. The job reallocation rate averages 18.2 percent per quarter
for young manufacturing plants (less than 9-13 years old) with fewer than 20 employees.
as compared to 7.2 percent for plants with more than 2500 employees.
Another prominent feature of the data is the distinct cyclical behavior of job creation
and destruction. Figures 1 reveal that recessions involve sharp increases in job destruction
accompanied by milder declines in job creation in virtually every 2-digit industry and
most other sectors. Table 1 confirms this visual impression, showing that the standard
deviation of destruction exceeds that of creation for every 2-digit industry and for every
other sector except for young manufacturing plants, especially those with fewer than 100
employees. The distinct cyclical dynamics of creation and destruction are quite evident in
the plots for major durable goods industries such as Primary Metals, Electrical Machinery,
Nonelectrical Machinery and Transportation. Table 1 indicates that the relative volatility
of job destruction rises with establishment size (conditional on age) and establishment
age (conditional on size). It also tends to rise with capital intensity, energy intensity and
product durability.
The data also show interesting patterns in the time-series mean and volatility of cre-
ation and destruction. The volatility of net employment growth and job destruction rates
tend to rise with capital intensity and product durability. Conditional on size, younger
plants exhibit higher mean rates of creation and destruction and greater volatility of cre-
ation, destruction and net growth.5 Conditional on age, larger plants exhibit sharply lower
5Mean creation and destruction rates show no evident relationship to capital intensity in
Table 1, in contrast to the negative relationship found in Table 3.6 of Davis, Haltiwanger
and Schuh (1996). They use a different method for measuring capital intensity that is
8

average rates of creation and destruction. Interestingly, controlling for age, net employ-
ment growth is an increasing function of employer size.
B. Oil Price and Money-Credit Measures
In earlier work on the driving forces behind fluctuations in manufacturing job creation
and destruction (Davis and Haltiwanger, 1996), we considered four indicators of shocks to
monetary policy or credit intermediation: a credit mix variable, measured as the ratio of
bank loans to the sum of bank loans and commercial paper; the federal funds rate; the
term spread between the 10-year constant maturity government bond rate and the federal
funds rate; and the quality spread between the six-month commercial paper rate and the
six-month treasury bill rate. Each measure is featured in one or more recent papers that
investigate the impact of monetary policy and credit market conditions on the economy.6
We found that all four variables generated similar results and yielded considerable pre-
dictive power for total manufacturing rates of job creation and destruction. The quality
spread and credit mix variables yielded virtually identical results, and they showed greater
predictive power for creation and destruction rates than the other two measures. In view
of our earlier findings, we focus on the quality spread variable in this paper. We think
of this variable as potentially informative about shocks to monetary policy and credit
intermediation and, as a shorthand, refer to it as SPREAD.
Recent work by Hooker (1996a) and Hamilton (1996a) raises questions about the
appropriate measure of oil price shocks. Hamilton argues for an oil shock measure that
filters out both price declines and price increases that merely offset recent past declines. In
superior for cross-sectional comparisons but less suitable for time-series analysis than the
measure used in this paper.6See Bernanke and Blinder (1992), Friedman and Kuttner (1992), Kashyap, Stein and
Wilcox (1993), and Stock and Watson (1989).
9
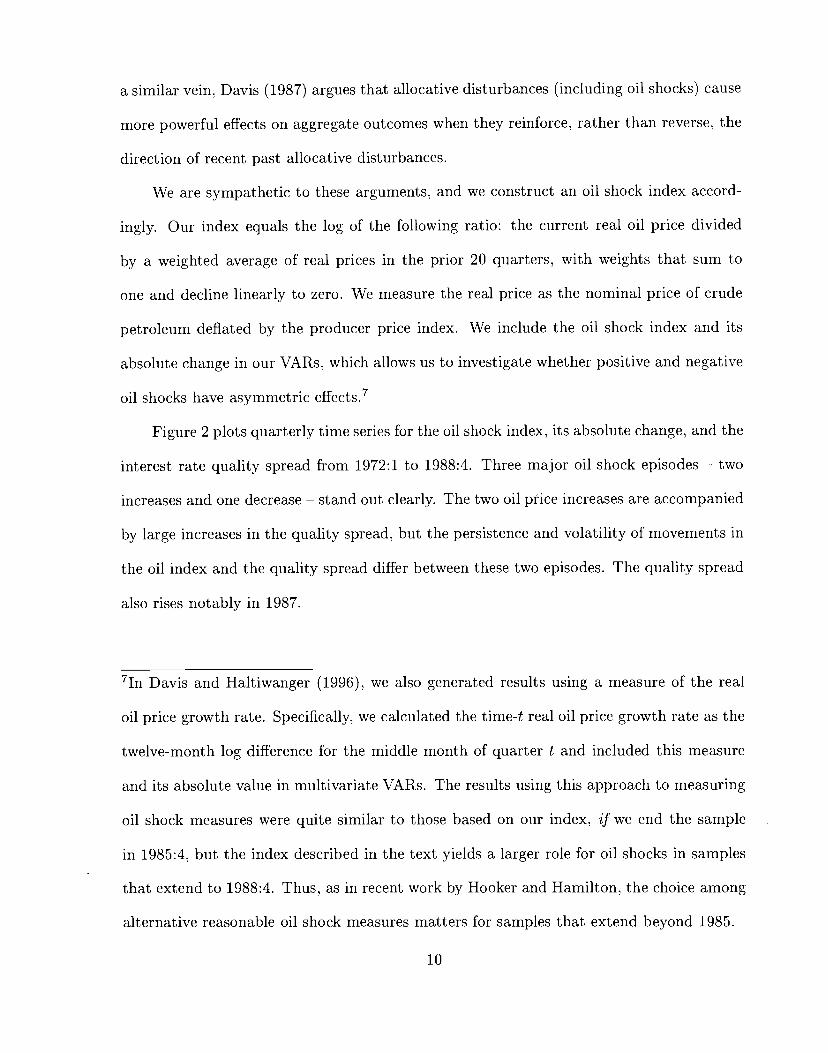
a similar vein, Davis (1987) argues that allocative disturbances (including oil shocks) cause
more powerful effects on aggregate outcomes when they reinforce, rather than reverse, the
direction of recent past allocative disturbances.
We are sympathetic to these arguments, and we construct an oil shock index accord-
ingly. Our index equals the log of the following ratio: the current real oil price divided
by a weighted average of real prices in the prior 20 quarters, with weights that sum to
one and decline linearly to zero. We measure the real price as the nominal price of crude
petroleum deflated by the producer price index. We include the oil shock index and its
absolute change in our VARs, which allows us to investigate whether positive and negative
oil shocks have asymmetric effects.7
Figure 2 plots quarterly time series for the oil shock index, its absolute change, and the
interest rate quality spread from 1972:1 to 1988:4. Three major oil shock episodes — two
increases and one decrease — stand out clearly. The two oil price increases are accompanied
by large increases in the quality spread, but the persistence and volatility of movements in
the oil index and the quality spread differ between these two episodes. The quality spread
also rises notably in 1987.
71n Davis and Haltiwanger (1996), we also generated results using a measure of the real
oil price growth rate. Specifically, we calculated the time-t real oil price growth rate as the
twelve-month log difference for the middle month of quarter t and included this measure
and its absolute value in miiltivariate VARs. The results using this approach to measuring
oil shock measures were quite similar to those based on our index, if we end the sample
in 1985:4, but the index described in the text yields a larger role for oil shocks in samples
that extend to 1988:4. Thus, as in recent work by Hooker and Hamilton, the choice among
alternative reasonable oil shock measures matters for samples that extend beyond 1985.
10

III. Econometric Specification and Identification
Consider a seven-variable linear stochastic system for a particular sector. Let
Y = [OIL,ABS, TPOS, TNEG, SPREAD, POS, NEG]' be a vector that contains
time-t values of the oil shock index, its absolute change, the manufacturing job creation
and destruction rates, the interest rate quality spread, and the sectoral job creation and
destruction rates, respectively. We assume that Yt has a linear moving average (MA)
representation in terms of innovations to structural disturbances, given by
= B(L)Et, B(O) = B0, (1)
where B(L) is an infinite-order matrix lag polynomial, and where €mt, Eat, €rt, 1ct' pt, nt]'I
is a vector of white noise structural innovations. The elements of t correspond to time-t
values of innovations to the two oil disturbances, two unspecified common disturbances,
the SPREAD disturbance, and two sector-specific disturbances, respectively.
When we estimate a VAR on Y, we do not immediately recover the matrix lag poly-
nomial, B(L), or the vector of structural innovations, . Instead, the estimated VAR
yields
Yt = D(L)j, D(O) = I, (2)
where D(L) is an infinite-order matrix lag polynomial implied by the estimated coefficients
in the VAR representation of Yt, and where Tlt = tOt, mt, at, rt, ct,pt, nt]' is the vector of
reduced-form innovations. The elements of Tlt correspond to time-t values of reduced-form
innovations to the two oil variables, the manufacturing job creation and destruction rates,
the SPREAD variable, and the sectoral job creation and destruction rates, respectively.
Comparing (1) and (2) implies Ift = Bo€ and B(L) D(L)B0, so that full knowledge
of B0 would allow us to recover estimates of both B(L) and the structural innovations
from the estimated VAR parameters. We could then proceed to evaluate the role played
11

by the various shocks as driving forces behind movements in sectoral job creation and
destruction. Of course, the time-series data on do not provide full knowledge of B0. so
that identification requires additional, a priori information.
We partially identify the structural response functions B(L) and the structural inno-
vations by placing restrictions on certain elements of B0, D(L) and the contemporaneous
covariance matrix of €. With respect to D(L), we assume
d(l) = d(l) = 0, for all 1, and i = o, m, a, r, c, (3)
where d(1) denotes the ij element at lag I of D(L). In other words, we do not allow
sector-specific variables (sectoral job creation and destruction rates) to affect variables in
the system that are common to all sectors.
The zero restrictions on D(L) mean that our estimated systems are more accurately
described as near VARs rather than fully symmetric VARs. In combination with our
restrictions on B0, this near-VAR specification implies that the oil, SPREAD and un-
specified common shocks, mt, Eat, Ert, €itl, are identical across sectors. At the same
time, our specification allows the response functions B(L) to freely vary across sectors.
Hence, we can relate sectoral differences in the shock response functions to observed sec-
toral characteristics.
Suppressing time subscripts, we next present our restrictions on B0:
E + bomEm (4.a)
m = bmofo + m (4.b)
a = baofo + bamfm + a + barEr (4.c)
= broCo + brmfm + bra€a + (4.d)
c = b0€0 + bcm€m + bca€a + bcrfr + (4.e)
p = b0€0 + bpm€m + bpa€a + bprer + + Ep + (4.f)
12

ii bno€o + bnm€m + bnafa + bnrEr + + + €. (4,g)
Lastly, we place three sets of restrictions on the contemporaneous covariance matrix:
COV(Eot, €) = COV(Emt, €) = 0, j = a, r, c,p, n, (5.a)
cov(€at, €) = cov(€rt, Eat) 0, (5.b)
cov(€t, €t) = cov(€t,€) = 0 j = a, r, c. (5.c)
Assumptions (4) and (5) impose a block recursive structure with four blocks: (i) two
oil variables, (ii) total manufacturing job creation and destruction, (iii) SPREAD, and
(iv) sectoral job creation and destruction. The block recursive nature of the system suffices
to identify the contribution of each block of shocks to fluctuations in total and sectoral job
creation and destruction. We do not attempt to achieve identification within blocks, except
for our efforts to isolate the magnitude and direction aspects of the oil shock structural
response functions.
We take the oil innovations and m to be exogenous in our near-VAR systems, as
described by the zero restrictions in equations (4.a) and (4.b) and the covariance restriction
(5.a). These assumptions are sufficient to estimate the joint contribution of the oil shocks
to the forecast-error variances of all variables in the system.
The unspecified common disturbances a and r capture the components of the
reduced-form innovations to total manufacturing job creation and destruction that are
orthogonal to the oil innovations. In Davis and Haltiwanger (1996), we interpret the Ea
and r shocks as reflecting unobserved aggregate and allocative disturbances that affect
the pace of job creation and destruction. The identification strategies we develop in that
paper could be implemented here to achieve identification within block (ii) (and likewise
within block (iv)). However, strategies for identification within blocks (ii) and (iv) play
no role in the inferences we draw in this paper.
Equation (4.e) identifies the structural money-credit innovation as the component of
13
the reduced-form SPREAD innovation that is orthogonal to innovations in the oil vari-
ables and the total job creation and destruction rates. This assumption reflects the view
that movements in monetary policy and SPREAD variables often respond in a passive,
systematic manner to developments in the real side of the economy. The inclusion of the
term in (4.e) allows for the possibility that some innovations in the SPREAD variable
reflect exogenous monetary policy events or other shocks to the intermediation process.
The last two equations in (4) pertain to the sectoral job creation and destruction rates.
We allow all common disturbances to contemporaneously affect sectoral job creation and
destruction. In addition, we include two unspecified sectoral shocks, and €,, that we do
not separately identify.
In closing this section, we stress four appealing features of our specification and iden-
tifying assumptions. First, our approach allows for multiple observed and unobserved
shocks. Second, our approach identifies common oil and money-credit shocks that hit all
sectors, while allowing the shock response functions to vary freely across sectors. Third,
our specifications do not prejudge the issue of whether oil shocks influence manufacturing
and sectoral employment through allocative or aggregate channels. Instead, we rely on
the estimated shock response functions to investigate whether positive and negative oil
price shocks have symmetric effects on employment growth, and to investigate whether oil
shocks increase both creation and destruction.
Finally, the sectoral near-VAR systems that we estimate separately can be reinter-
preted as a constrained panel VAR that simultaneously uses the time-series data for all
sectors. By including lagged values of manufacturing creation and destruction in each
sectoral equation, it is as though we included sectoral creation and destruction rates as
regressors and constrained their coefficients to be proportional to sectoral size.8 Thus, we
8Our discussant, Michael Horvath, pursued this issue by augmenting our panel VARs to
14

can think of our econometric framework as a collection of distinct near VARs, one for each
sector, or as a constrained panel VAR that we estimate one seven-equation block at a
time. However, our estimation procedure does not constrain the weighted sum of sectoral
creation and destruction responses to equal the total responses. In practice, violations of
this adding up constraint are usually small.
IV. Sectoral Creation and Destruction Responses
A. Summary of Variance Decompositions
We estimated the sectoral VAR systems on quarterly data from 1973:2 to 1988:4 using
four lags of each variable. Table 2 summarizes the contribution of each block of shocks
to the variance of the 8-step ahead forecast error for sectoral rates of employment growth
and gross job flows. The table entries are employment-weighted average contributions to
the forecast-error variance for the indicated sectoral classification schemes. For example,
the entry in the first row and column reports that oil shocks account for 22 percent of the
variance in the 8-step ahead forecast error of the employment growth rate in the average
2-digit industry.
Oil shocks account for 18-25 percent of the variance in the employment growth across
alternative sectoral classifications. The classification by plant-level energy intensity yields
the largest average contribution of oil shocks to net employment growth, job reallocation
and job destruction. Indeed, 40 percent of the variance in job reallocation is accounted for
by oil shocks when we group plants by energy intensity. This result indicates that much
allow industry-level creation and destruction rates to enter into the common subsystem. He
found that this relaxation of our constrained specification did not greatly alter the pattern
of impulse response functions. Another interesting approach would be to use input-output
shares to place structure on sectoral linkages in a constrained panel VAR.
15

of the job reallocation response to oil shocks occurs within energy-intensity categories.
SPREAD shocks contribute, on average, between 6 and 12 percent of the forecast-error
variance in employment growth. The largest average contributions of SPREAD shocks arise
for sectoral classifications by capital intensity and plant age-size characteristics.
The unspecified common and sector-specific shocks account for most of the forecast-
error variability in net and gross job flow rates. Common shocks are especially important
for the energy-intensity classifications, and sector-specific shocks are especially important
for the 4-digit industry and product durability breakdowns.
The results in Table 2 make clear that each block of shocks plays a nontrivial role
in accounting for the variability of net and gross job flows. The results also show, not
surprisingly, that the relative importance of each category of shocks varies somewhat across
the sectoral classification schemes. In what follows, we focus on the dynamic response to the
observable oil and SPREAD shocks. The unspecified common and sector-specific shocks
capture the many other, unobserved shocks that influence employment and job flows.
B. The Dynamic Response to Oil Shocks
We first characterize the dynamic effects of oil shocks on total manufacturing employ-
ment growth and gross job flows. Recall that each sectoral near-VAR system contains a
common symmetric subsystem (the two oil variables, total manufacturing job creation and
destruction, and the SPREAD variable). Figure 3 displays the oil and SPREAD shock
response functions implied by the common subsystem.9 We focus here on oil price shocks
and defer a discussion of SPREAD shocks to the next section.
9The specification and identifying assumptions that underlie Figure 3 are identical to the
ones that underlie Figure 10 in Davis and Haltiwanger (1996). Our earlier paper uses a
longer sample that begins in 1960. Happily, Figure 3 is similar to the corresponding figure
in the earlier paper.
16

To generate response functions for positive and negative oil price shocks, we simulta-
neously perturb the two structural oil innovations, and Em. We perturb E up or down
by one standard deviation, and we perturb m by an amount that satisfies the identity link-
ing the oil shock index to its absolute change. We then trace out the response functions
implied by the MA representation of the structural VAR.'0
Figure 3 shows a large adverse response to a positive oil price shock and very little
response to a negative one. Destruction rises sharply and employment growth declines in
the aftermath of a positive oil shock, while job creation declines modestly Peak responses
occur four quarters following the shock and involve an employment growth rate nearly one
percentage point below the baseline value.
The upper right panel of Figure 3 isolates the effects of the absolute change component
of an oil shock. The response pattern fits the profile of an "allocative disturbance" in
three respects. First, the short-run employment response is negative, with a peak response
at four steps that accounts for about 40 percent of the peak response to an oil price
increase. Second, the longer term employment response is approximately zero. In fact,
cumulating the first 16 response coefficients for net employment growth yields a long
run employment response of only -.05 percent.1' Third, the longer term job reallocation
'°In principle, the MA representation that underlies the oil shock response functions in
Figure 3 depends on assumptions about bmo, born and cov(f0, Em). It turns out, however,
that reduced-form innovations in the oil shock index and its absolute change are not highly
correlated (corr(o,m) = —.17), 50 that assumptions about these structural parameters
matter little. In practice, we derive the MA representation by placing the oil index ahead
of its absolute change in the causal ordering; i.e., we set born = cov(E0, Em) 0."Since we calculate employment growth as creation minus destruction, we are effectively
measuring the growth rate as 2x/(x + Xt_i), where x denotes the level of employment.
17

response is nontrivial. Cumulating the first 16 response coefficients indicates that the
absolute change component of a unit size oil shock causes the reallocation of 0.63 percent
of all manufacturing jobs.
These results suggest that oil shocks influence manufacturing activity through a mix-
ture of aggregate and allocative effects. The employment effects roughly cancel out in
response to an oil price decrease, because the allocative and aggregate aspects of the shock
work in opposite directions. The short-run employment effects are large and negative in
response to an oil price increase, because the two aspects of the shock work in the same
direction. The longer term employment response is small for any oil price shock, in line
with the view that the economy eventually adjusts fully to the relative price change.
We also examined the sectoral creation and destruction responses to oil shocks for
all 51 detailed sectors listed in Table 1. In the interests of brevity, we display impulse
response functions for selected sectors in Figure 4 and summarize other results. (A full set
of sectoral reults is available upon request from the authors.)
The detailed results reveal short-run employment declines in response to unanticipated
oil price increases in almost every sector. In half of the sectors, the cumulative decline
seven quarters after a unit standard deviation positive shock to the price of oil exceeds 2
percent of employment.
The sign pattern of the separate creation and destruction responses is also noteworthy.
The cumulative effect of a positive oil shock is typically to increase both job destruction and
creation in the two years after the shock. This response pattern points to the reallocative
consequences of oil shocks, and it indicates that these effects operate within sectors, as we
This growth rate measure is identical to the log change up to a second-order Taylor series
expansion, which means that we can safely sum response function coefficients to obtain
the cumulative response.
18

have defined them.
Another interesting result involves the relative magnitudes of the short-run destruction
and creation responses. With the exception of young plants with fewer than 20 employ-
ees, the magnitude of the two-year sectoral destruction response is larger — and usually
much larger — than the corresponding creation response. Figure 4 clearly illustrates the
greater short-run sensitivity of job destruction to oil shocks. Apparel, Rubber and Plastics.
Furniture, Primary Metals and Transportation Equipment are among the industries with
especially large job destruction responses to oil shocks. In addition, while the relationships
are not always monotonic, the results suggest that the asymmetric response of destruction
is greater the more energy and capital intensive is the production process and the more
durable is the output good.
To examine the statistical significance of the point estimates, we computed Monte
Carlo standard errors for the cumulative creation and destruction responses. Only one
sector (Food) exhibits a cumulative creation response at seven steps (after the shock) that
exceeds two standard errors. In contrast, the cumulative step-7 job destruction reponses
exceed two standard errors for more than a third of the sectors including total manufactur-
ing, Food, Rubber and Plastics, Primary Metals, Fabricated Metals and Transportation
Equipment. Other sectors with statistically significant cumulative destruction responses
include the most energy intensive group, the most capital intensive group and large, mature
plants.
In another exercise, we compared the actual path of employment growth to the coun-
terfactual path generated by feeding the contemporaneous and seven lagged values of the
realized oil shocks through the MA representation of the structural VAR. This exercise re-
vealed a clear role for oil shocks as a major driving force behind fluctuations in particular
sectors and in certain historical episodes such as the prominent sector-specific fluctuations
19

in the 1985 to 1988 period. The results of this exercise also indicate that oil shocks played
an important role in the deep employment decline of the early 1980s, but that they do not
explain the prolonged nature of the contraction. The oil-shock counterfactual generates
sectoral employment growth rates that typically turn up in 1982, which fits the experience
of a few sectors such as Apparel, the bottom energy class and the top durability class
but is sharply at odds with the continued contraction in many sectors such as Rubber and
Plastics, Electrical Machinery, Primary Metals, Transportation Equipment, the top energy
class, and the top capital class.
C. The Dynamic Response to SPREAD Shocks
Returning to Figure 3, we see that job destruction rises and job creation falls in the
aftermath of a spread shock. The peak employment growth response occurs 3 quarters after
the shock, and its size is about half as large as for a unit positive oil shock. The longer
term employment and reallocation responses to the spread shock are modest. At step 15,
the cumulative response is an employment decline of -.48 percent and the reallocation of
1.53 percent of manufacturing jobs.
Figure 4 shows displays dynamic responses to SPREAD shocks for selected sectors.
The full set of (unreported) results show show that two-thirds of all sectors exhibit opposite
signs for the step-7 cumulative creation and destruction responses to SPREAD shocks. This
sign pattern contrasts with the pattern for oil shocks, in which two-thirds of the cumulative
creation and destruction responses showed the same sign. Thus, the results suggest that
SPREAD shocks have less of a (within-sector) reallocative character than oil shocks.
In another respect, however, the SPREAD shock response functions are similar to
the oil shock response functions: the magnitude of the short run response is typically
larger for destruction than creation. Twenty percent of the cumulative step-7 destruction
responses to a SPREAD shock differ from zero by more than two standard errors, but
20

none of the creation responses do. This aspect of the oil and SPREAD shock response
dynamics mirrors the greater cyclical volatility of job destruction that stands out clearly
in the time-series plots of the raw data (Figures 1).
Two other aspects of the SPREAD shock response results are noteworthy. First,
relatively large SPREAD shock responses occur for Rubber and Plastics, most durable
goods industries (especially Electrical Machinery), and younger plants. Second, young,
small plants exhibit response dynamics that differ greatly from other sectors. For these
plants, a SPREAD shock triggers little change in job destruction and a comparatively large
decline in job creation (Figure 4). In this regard, recall from Table 1 that young, small
plants are one of the few sectors that exhibit large cyclical fluctuations in job creation
relative to job destruction. This pattern in the raw data carries over to the estimated
response functions as relatively greater shock sensitivity of job creation.
In other unreported results, we considered a variety of alternative specfications involv-
ing monetary and credit variables. First, we experimented with the Federal Funds Rate
as an alternative indicator of monetary and credit conditions. Second, we allowed positive
and negative SPREAD shocks to have asymmetric effects in like manner to our treatment
of oil shocks. Third, we placed SPREAD first in the five-variable common subsystem.
The main character of our results was not affected by these specification changes, but a
few findings are worth mentioning. First, alternative treatments of SPREAD have virtually
no impact on the results for oil shocks. Second, the impulse response functions depicted
in Figure 3 are qualitatively similar for all of these alternative specifications. Third, using
the SPREAD variable leads to a somewhat larger role for monetary-credit shocks than the
Federal Funds Rate. Fourth, the results show weak evidence of asymmetric responses to
positive and negative SPREAD shocks (with larger responses to positive shocks). Fifth, the
quantitative importance of the SPREAD shock is sligtly higher when SPREAD is placed
21

first in the VAR subsystem. Given that our main results do not seem unduly sensitive to
these specification issues, we continue to focus on our baseline specification.
V. Which Sectoral Characteristics Matter?
The preceding results identify particular sectors that exhibit unusually large or small
shock responses, but the one-way and two-way classification schemes make it difficult to dis-
cern how the response depends on sectoral characteristics. For example, SPREAD shocks
generate bigger employment responses in several durable goods industries, which tend to
be dominated by large, mature plants. SPREAD shocks also generate bigger responses
among smaller and, especially, younger plants. Each finding has a ready interpretation,
but together they strongly suggest that the results confound the effects of multiple sectoral
characteristics.
In this section, we adopt an approach that allows us to control simultaneously for
multiple sectoral characteristics that potentially influence the response to SPREAD and
oil shocks. We implement our approach in three steps. First, we estimate near-VAR
systems for approximately 450 4-digit manufacturing industries over the 1972 to 1988
period. Second, using the same identifying assumptions as before, we estimate the shock
response functions for each 4-digit industry. Third, we regress cumulative responses on
industry-level measures of (average) energy intensity, capital intensity, plant size, plant
age and product durability. The cross-industry variation in these measures and the large
number of 4-digit industries provide leverage for disentangling the roles of the multiple
characteristics that influence the shock response functions.
We construct measures of 1972-1988 average industry-level characteristics as follows.
Using the Bartelsman-Gray (1995) NBER Productivity database, we measure energy in-
tensity as the ratio of energy costs to total shipments and capital intensity as capital
22

per production worker in 1987 dollars. We summarize the industry-level size distribution
by the coworker log, defined as the employment-weighted mean of the log of plant-level
employment. To summarize the age distribution of plants, we use the fraction of industry-
level employment at mature plants (more than 9-13 years old). We calculate the coworker
log and the mature plant fraction directly from plant-level data in the LRD. Some of our
regressions also make use of the Bils-Kienow product durability measure, which is available
for 106 industries.
Table 3 summarizes the statistical significance of the characteristics iii explaining in-
dustry variation in the step-7 cumulative response of the employment growth rate and the
step-15 cumulative response of the excess job reallocation rate.'2 The underlying regres-
sions contain cubic polynomials in the energy, capital, size and age measures. Panel A
shows that, with respect to oil shocks, the energy, capital and size variables are statis-
tically significant at the 5 percent level in accounting for the cross-industry variation in
the cumulative employment response. The capital and age variables account for signifi-
cant variation in the cumulative reallocation response. With respect to SPREAD shocks,
the capital and age variables are statistically significant for the cumulative employment
response, and the energy and age variables are significant for the cumulative reallocation
response.
Since the regression specifications are nonlinear in variables, we display the fitted
relationships in Figures 5A and SB. Each panel plots the fitted employment and excess
reallocation relationship from the 10th to the 90th percentiles of the indicated regressor,
while evaluating the other regressors at medians. The line atop the horizontal axis provides
'2The excess reallocation rate is the gross job reallocation rate minus the absolute value
of the net employment growth rate. The excess reallocation response equals the smaller
(in magnitude) of the job creation and destruction responses, multiplied by two.
23

additional information about the distribution of the regressor.
The oil shock response functions now show several clear patterns. The cumulative
employment decline triggered by a unit positive oil shock rises sharply from 1.3 percent-
age points at the 10th percentile of the capital intensity distribution to 2.5 percentage
points at the 90th percentile. The oil-shock employment decline also rises with energy's
cost share over the lower two-thirds of the energy distribution. Industries with mid-sized
plants exhibit relatively small employment responses to oil shocks. In addition, the excess
reallocation response to oil price shocks is dramatically higher in more capital intensive
industries, and it is also higher in industries with many young plants.
The SPREAD shock responses show less evidence of important variation with mea-
sured sectoral characteristics. The only noteworthy effect involves the plant age variable.
The cumulative 7-step employment decline triggered by a unit positive SPREAD shock
is about 1 percentage point for an industry with 92% of employment in mature plants,
as compared to about 1.7 percentage points for an industry with 64% of employment in
mature plants.
Younger plants are likely to be disproportionately owned by younger firms, and
younger firms may have less access to capital markets. In this light, our findings of greater
employment responses among younger plants to SPREAD shocks recalls earlier work by
Gertler and Gilchrist (1994), Kashyap, Lamont and Stein (1994) and others that finds
greater sensitivity to monetary shocks among small firms. These studies develop evidence
that greater sensitivity among small firms arises because of their more limited access to
capital markets. Our findings are consistent with this interpretation, but we regard the
plant age measure as a very crude proxy for access to capital markets. A careful assessment
of the reasons for greater sensitivity among young plants, and the possible role of capital
market imperfections in job creation and destruction dynamics, awaits further research.
24

We re-estimated the cumulative response regressions for the 106-industry subsample.
adding a cubic polynomial in the Bils-Kienow durability measure. Since capital intensity
proved to be the most important sectoral characteristic in the full sample, we focus on the
role of durability and capital intensity in the subsample.
Figure 6 displays the fitted relationships for the 106-industry subsample. The cumu-
lative employment response to oil shocks is even more sensitive to capital intensity than
in the full sample: the step-7 employment decline is almost 3 percentage points greater
at the 90th percentile of the capital intensity distribution (for the subsample) than at the
10th percentile. Unreported results reveal that the greater role for capital intensity in the
SPREAD shock response functions arises from a different sample, not from conditioning
on product durability. The differences between Figures 5 and 6 in the cumulative response
functions for job reallocation also arise from sample differences.
Turning to the role of product durability, Figure 6 shows a strong effect on the cumu-
lative employment responses to both shocks. Nondurable goods (depreciation rates of 1)
show an oil-shock employment response of about -1 percent, as compared to -2.8 percent
at the 90th percentile of the durability distribution. There is a similar range of variation
in the cumulative employment responses to SPREAD shocks, with larger responses by
industries that produce more durable goods. These results are very much in line with the
findings and analysis in Bus and Klenow (1998).
VI. How Many Jobs Are Created and Destroyed in Response to the Shocks?
We now quantify the number of jobs created and destroyed in response to oil and
monetary shocks. We focus on three questions: How large is the medium-term (1-2 years)
employment response to the shocks? How large is the longer term (4 years) excess job
reallocation response? How is the longer term reallocation response apportioned among
25

employment shifts out of manufacturing, employment shifts between sectors within man-
ufacturing, and reallocation within manufacturing sectors?
Table 4 speaks to the first two questions. According to Panel A. the cumulative em-
ployment response to a unit standard deviation positive oil price shock is tiny at step 3 but
exceeds 2 percent of production worker employment at step 7. Almost all of the employ-
ment decline between steps 3 and 7 reflects an increase in gross job destruction. Over the
next 8 steps, cumulative job destruction declines slightly, while cumulative creation rises
from near zero to 1.4 percent of employment. Hence, net job loss is a modest -0.5 percent
at step 15, but the cumulative reallocation response exceeds 3 percent of all manufacturing
production worker positions (more than 410,000 jobs).
The large job reallocation response at step 15, coupled with a modest change in
the level of employment, is evidence that the longer term response to oil shocks shows
up mostly as the reallocation of labor (and presumably capital). But the medium-term
response involves significant declines in the level of employment, because the destruction
of existing jobs 1-2 years after the shock mostly precedes the creation of new jobs 2-4 years
after the shock.
Comparing Panels A and B reveals a noteworthy asymmetry in the responses to
positive and negative oil price shocks. The cumulative impact on net employment growth
at 7 steps is very modest (less than .2 percent) for a negative oil shock, whereas a positive
shock of equal magnitude yields a cumulative employment decline of more than 2 percent.
Cumulating the responses for steps 0 to 15, a unit positive shock induces an increase in
excess job reallocation of almost 3 percent of jobs whereas a unit negative shock induces
a decrease of 1.4 percent. This finding does not support the hypothesis that only the size
of relative price changes matters for the long run job reallocation responses.
One possible interpretation is that the aggregate aspect of positive and negative oil
26
shocks trigger asymmetric job reallocation responses. For example, in the search equilib-
rium model of Mortensen (1994), a negative aggregate shock pushes jobs with low match
quality across a destruction threshold and into the pooi of unemployed workers, who even-
tually form new matches and participate in new job creation. A positive aggregate shock.
in contrast, does not trigger a wave of destruction and subsequent creation, because it
reduces the reservation match quality below which job destruction occurs. This type of
nonlinearity in the creation and destruction effects of aggregate shocks fits the asymmetric
response of excess reallocation to positive and negative oil shocks in Table 4.
Panel C in Table 4 reports the estimated effects of the largest oil-shock episode in
our sample. Using the innovations for the 1973:4-1973:1 oil-price changes in the estimated
VAR, panel C reports estimated cumulative responses. This oil-shock episode has very
large estimated effects on employment and job reallocation activity. The cumulative em-
ployment decline at step 7 is almost 8 percent, but it diminishes to about 2 percent at 15
steps. The cumulative response of excess job reallocation at 15 steps is (11.05— —2.24 =)
9.8 percent of employment.
Panel D in Table 4 shows that SPREAD shocks generate more rapid creation and
destruction responses than oil shocks and less evidence of reallocative effects. At step 3,
a unit standard deviation positive SPREAD shock yields a cumulative creation decline of
.3 percent and a cumulative destruction increase of .5 percent. At step 7, the SPREAD
shock generates a small decline in job creation and a cumulative job destruction increase
of 1.1 percent.
Panel E reports the estimated effects of the largest SPREAD shock in our sample
period, the 1979:3-79:4 period. This period is commonly associated with a significant con-
traction in monetary policy. This particular episode involves a step-7 cumulative employ-
ment decline of more than 3 percent. At 15 steps, the cumulative employment response is
27

a more modest -1.3 precent, and the cumulative excess reallocation response is 2.7 percent
of employment.
Table 5 shows that the largest oil and monetary shocks in our sample induced large
temporary employment declines and large permanent increases in job reallocation. Because
of the modest number of major shocks in our sample, the standard errors on the cumulative
responses are quite large, especially at 15 steps. Hence, readers with strong prior views may
not be greatly swayed by these results. But, taken at face value, the results point to major
longer term reallocative consequences of oil and monetary shocks that were associated with
large medium-term downturns in aggregate measures of economic activity.
Turning to the third question posed at the beginning of this section, Table 5 apportions
the job reallocation response among between-sector and within-sector components. The
first column shows the estimated step-15 cumulative job reallocation response generated
by the employment-weighted average of the sectoral responses. The remaining columns
are generated from the decomposition,
SUMm1g = NETmfg + [ NETs - NETmfg] + [ SUM8 - NETS], (6)
where SUM denotes job reallocation, NET denotes net employment change, and the
subscripts index sectors. The first term on the right side of (6) is the overall change in
manufacturing employment; the second term captures between-sector employment shifts
within manufacturing; and the third term equals the sum of excess job reallocation within
sectors. Columns 2-4 in Table 5 show the fraction of the job reallocation response accounted
for by these three terms.
About 15-17% of the estimated job reallocation response to a positive oil shock arises
from the estimated decline in manufacturing employment except for classifications by cap-
ital intensity (4%) and plant age and size (28%). Excess job reallocation within sectors
28

accounts for two-thirds or more of the total job reallocation response, except for the highly
detailed 4-digit industry classification and, more surprisingly, the breakdown by plant age
and size. Almost 30% of the job reallocation response is accounted for by employment
shifts among our 11 size-age categories. In contrast, and rather remarkably, employment
shifts among sectors defined in terms of capital intensity and energy intensity account for
virtually none of the estimated job reallocation response.
The change in overall manufacturing employment accounts for one-third to more than
half the job reallocation response to SPREAD shocks, depending on sectoral classifica-
tion scheme. The role of within-sectoral excess reallocation is correspondingly smaller for
SPREAD shocks, as compared to a positive oil shock. In other words, SPREAD shocks
generate smaller reallocative effects than a positive oil shock.
VII. Summary and Conclusions
We organize our main findings and conclusions under several headings:
DESCRIPTIVE CHARACTERIZATION OF GROSS JOB FLOWS
Gross job flows are large in every sector we consider, averaging 10.7% of employment
per quarter. Job destruction shows much greater cyclical variation than job creation in
almost every sector. The clear exceptions, accounting for 7 percent of manufacturing
employment, are young plants (less than 9-13 years old) with fewer than 100 employees.
In addition, the relative volatility of job destruction tends to rise with capital intensity,
product durability, and plant age and size.
ASYMMETRIC SHOCK RESPONSE OF CREATION AND DESTRUCTION
Both oil and monetary shocks generate much greater short-run responses in job de-
struction than job creation in almost every sector. One plausible explanation for the
greater volatility of job destruction and its greater sensitivity to common shocks is a rising
29

short-run supply schedule for new capital goods. Caballero and Hammour (1994) develop
this point, and Goolsbee (1996a,b) provides evidence that the short-run supply price of
capital goods rises steeply. Campbell and Fisher (1998) develop a different theory that ex-
plains how certain forms of employment adjustment costs can make job destruction more
sensitive to shocks that job creation. Search frictions in labor markets provide another
candidate explanation for this asymmetry (Mortensen, 1994).
THE IMPORTANCE OF OIL SHOCKS
Oil price shocks account for about 20-25% of the variance in 2-year-ahead forecast
errors for manufacturing employment growth under our identifying assumptions, about
twice as much as monetary shocks. The largest oil shock in our sample (1973:3-1973:4)
caused an estimated eight percent decline in manufacturing employment within two years.
ASYMMETRIC EMPLOYMENT RESPONSE TO OIL PRICE UPS AND DOWNS
Employment growth declines sharply following a large oil price increase but changes
little following a large oil price decrease. A unit standard deviation positive oil shock leads
to a cumulative two-year employment decline of about 2 percent, ten times bigger than
the estimated response to the same size negative oil shock.
Several other studies, most based on different econometric specifications and identi-
fying assumptions, also conclude that oil price increases have larger effects on aggregate
or regional activity than oil price decreases. See Mork (1989), Mory (1993), Lee, Ni and
Ratti (1995), Davis and Haltiwanger (1996), Hamilton (1996b), Hooker (1996b) and Davis,
Loungani and Mahidhara (1997). In light of this work, we view the evidence for asymmetric
responses to oil price ups and downs as well established (for the United States).
WHICH CHARACTERISTICS MATTER FOR SHOCK RESPONSE SIZE?
The employment sensitivity to a positive oil shock rises sharply with capital intensity
30

and product durability. It also rises with energy's share of total costs over the lower two-
thirds of the energy cost distribution. The magnitude of the two-year employment response
to monetary shocks rises sharply with product durability. It also rises with the fraction of
employment in young plants.
REALLOCATIVE CONSEQUENCES OF OIL SHOCKS
Our results point to important reallocative consequences of oil price shocks. For exam-
ple, we estimate that the 1973:3 - 1973:4 oil shock episode caused job reallocation activity
to rise by an amount equal to 11 percent of employment over the following 15 quarters.
More than 80% of this reallocation response reflects greater excess job reallocation within
manufacturing.
In separate work, Davis, Loungani and Mahidhara (1997) find that oil shocks have
been a major driving force behind regional employment and unemployment fluctuations
in the United States since 1972. The cross-state dispersion of cyclical unemployment rose
sharply in the aftermath of each major oil shock in 1973-74, 1979-80 and 1986.
OIL SHOCKS AND FLUCTUATIONS: WHAT IS THE STORY?
Most equilibrium business cycle models (as reviewed in Cooley, 1995) fail to offer any
explanation for the sharply asymmetric response to oil price ups and downs. Two excep-
tions are Atkeson and Kehoe's (1994) analysis of energy intensity choice in a model with
differentiated putty-clay capital goods and Hamilton's (1988) analysis of labor market real-
location frictions in a multi-sector model.'3 Equilibrium models with reallocation frictions
'3Although not directed to the study of oil shocks per Se, several other dynamic equilibrium
models with reallocation frictions readily suggest insights into the asymmetric response to
oil price ups and downs. See, for example, Davis and Haltiwanger (1990), Mortensen and
Pissarides (1994), Phelan and Trejos (1999) and Ljungqvist and Sargent (1998)
31

offer the promise of simultaneously explaining (i) the asymmetric aggregate response to
oil price ups and downs, (ii) the magnitude of the medium-term aggregate response to oil
shocks, (iii) the large-scale job reallocation activity triggered by large oil price increases,
and (iv) the large role of oil shocks in regional unemployment fluctuations.
Research to date has not pinned down the precise nature of the reallocation frictions
that influence the aggregate response to oil price changes and other shocks. Do the frictions
mainly involve worker reallocation, capital reallocation, or the development of new orga-
nization capital to facilitate business expansion and entry? How important are relocation
costs, human capital acquisition, rigidities in the employment relationship, unemployment
insurance, and the appropriability of specific investments?14
Lastly, we emphasize that oil shock response magnitudes vary systematically with
observable sectoral characteristics, in some respects sharply. This response heterogeneity
is another challenge to business cycle modeling and a useful source of information for
assessing model performance.
14There are vast literatures that bear on these questions, directly or tangentially. The
broad empirical significance of worker reallocation costs is well established, but see Hall
(1995) for a treatment that emphasizes aggregate implications. On capital reallocation
costs, see Ramey and Shapiro (1996). On organization capital and its cost of adjustment,
see Prescott and Visscher (1980). On job creation and destruction dynamics in models
that highlight the effects of incentive problems 111 the employment relationship and the
appropriability of specific investments, see Ramey and Watson (1996) and Caballero and
Hammour (1996), respectively. On the effects of unemployment insurance in a search
economy subject to reallocation shocks, see Ljungqvist and Sargent (1998).
32

References
Atkeson Andrew and Patrick Kehoe (1994) "Putty Clay Capital and Energy," NBER
Working Paper No. 4833, August 1994.
Barteisman, Eric and Wayne Gray, 1996, "The NBER Manufacturing Productivity
Database," mimeo.
Bernanke, Ben S. and Alan S. Blinder, 1992, "The Federal Funds Rate and the Chan-
nels of Monetary Transmission," American Economic Review, 8, (September), 901-921.
Bus, Mark and Pete Kienow, 1998, "Using Consumer Theory to Test Competing
Business Cycle Models," Journal of Political Economy, 106, no. 2 (April), 233-261.
Bohi, Douglas R., 1989, Energy Price Shocks and Macroeconomic Performance, Wash-
ington, D.C.: Resources for the Future.
Bresnahan, Timothy F. and Valerie A. Ramey, 1993, "Segment Shifts and Capacity
Utilization in the U.S. Automobile Industry," American Economic Review, May, 213-218.
Caballero, Ricardo and Mohamed Hammour, 1994, "The Cleansing Effect of Reces-
sions," American Economic Review, 8, 1350-1368.
Caballero, Ricardo and Mohamed Hammour, 1996, "On the Timing and Efficiency of
Creative Destruction" Quarterly Journal of Economics, 111,, no. 3 (August), 805-852.
Campbell, Jeffrey R. and Jonas D.M. Fisher, 1998, "Aggregate Employment Fluc-
tuations with Microeconomic Asymmetries," unpublished manuscript, University ofRochester.
Cooley, Thomas F., 1995, editor, Frontiers of Business Cycle Research, Princeton,
New Jersey: Princeton University Press.
Davis, Steven J., 1985, Allocative Disturbances, Aggregate Disturbances, and Unem-
ployment Fluctuations, unpublished Ph.D. thesis, Brown University.
Davis, Steven J., 1987, "Fluctuations in the Pace of Labor Reallocation" Carnegie-
Rochester Conference Series on Public Policy, 27, 335-402.
Davis, Steven J. and John Haltiwanger, 1990, "Gross Job Creation and Destruction:
Microeconomic Evidence and Macroeconomic Implications," NBER Macroeconomics An-
nual, V, 123-168.
33

Davis, Steven J. and John Haltiwanger, 1996, "Driving Forces and Employment Fluc-
tuations," NBER working paper no. 5775.
Davis, Steven J., John Haltiwanger, and Scott Schuh, 1996, Job Creation and De-
structio n, Cambridge, Massachusetts: MIT Press.
Davis, Steven, Prakash Loungani and Ramamohan Mahidhara, 1997, "Regional La-
bor Fluctuations: Oil Shocks, Military Spending, and Other Driving Forces," Board of
Governors of the Federal Reserve System, International Finance Discussion Paper 578.
Finn, Mary G., 1991, "Energy Price shocks, Capacity Utilization and Business Cycle
Fluctuations" Institute for Empirical Macroeconomics Discussion Paper No. 50, Federal
Reserve Bank of Minneapolis.
Friedman, Benjamin M. and Kenneth N. Kuttner, 1992, "Money, Income, Prices, and
Interest Rates," American Economic Review, 82, no. 3 (June), 472-492.
Gertler, Mark and Simon Gilchrist, 1994, "Monetary Policy, Business Cycles and the
Behavior of Small Manufacturing Firms," Quarterly Journal of Economics, 109, no. 2
(May 1994), 309-340.
Goolsbee, Austan, 1996a, "The Incidence of Investment Tax Subsidies: To the Workers
Go the Spoils?" working paper, University of Chicago, September.
Goolsbee, Austan, 1996b, "Investment Tax Incentives, Prices and the Supply of Cap-
ital Goods," working paper, University of Chicago, December.
Hall, Robert E., 1995, "Lost Jobs" Brookings Papers on Economic Activity, 1: 1995,
221-273.
Hamilton, James D., 1988, "A Neoclassical Model of Unemployment and the Business
Cycle," Journal of Political Economy, 96, no. 3 (June), 593-617.
Hamilton, James D., 1996a, "This is What Happened to the Oil Price —Macroeconomy
Relationship," Journal of Monetary Economics, Journal of Monetary Economics, 38, no.
2 (October) 215-222.
Hamilton, James D., 1996b, "Analysis of the Transmission of Oil Price Shocks
Through the Macroeconomy," working paper, University of California, San Diego.
Hooker, Mark, 1996a, "What Happened to the Oil Price — Macroeconomy Relation-
ship?," Journal of Monetary Economics, 38, no. 2 (October) 195-213.
34

Hooker, Mark, 1996b, "Exploring the Robustness of the Oil Price-Macroeconomy
Relationship: Empirical Specifications and the Role of Monetary Policy," working paper,
Wellesley College.
Kashyap, Anil K., Owen A. Lamont and Jeremy C. Stein, 1994 "Credit Conditions
and the Cyclical Behavior of Inventories," Quarterly Journal of Economics, 109, no. 3
(August), 565-592.
Kashyap, Anil, Jeremy Stein and David W. Wilcox, 1993, "Monetary Policy and
Credit Conditions: Evidence from the Composition of External Finance," American Eco-
nomic Review, 83, no. 1 (March), 78-98.
Kim, In-Moo and Prakash Loungani, 1992, "The Role of Energy in Real Business
Cycle Models," Journal of Monetary Economics, 9, no. 2 (April), 173-189.
Lee, Kiseok, Shawn Ni and Ronald A. Ratti, 1995, "Oil Shocks and the Macroeconomy:
The Role of Price Variability," The Energy Journal, 16, no. 4, 39-56.
Loungani, Prakash, 1986, "Oil Price Shocks and the Dispersion Hypothesis," Review
of Economics and Statistics, (August), 536-539.
Ljungqvist, Lars and Thomas J. Sargent, 1998, "The European Unemployment
Dilemma," Journal of Political Economy, 106, no. 3 (June), 514-550.
Mork, Knut A., 1989, "Oil and the Macroeconomy When Prices Go Up and Down:
An Extension of Hamilton's Results," Journal of Political Economy, 97. no. 3 (June),
740-744.
Mork, Knut A., 1994, "Business Cycles and the Oil Market," The Energy Journal, 15
(special issue), 15-38.
Mork, Knut A. and Robert E. Hall, 1980, "Energy Prices, Inflation, and Recession,
1974-75" The Energy Journal, 1, no. 3, 31-63.
Mork, Knut A., Oystein Olsen and Hans Terje Mysen, 1994, "Macroeconomic Re-
sponses to Oil Price Increases and Decreases in Seven OECD Countries," Energy Journal,
15, no. 4, 19-35.
Mortensen, Dale T., 1994, "The Cyclical Behavior of Job and Worker Flows," Journal
of Economic Dynamics and Control, 18 (November), 1121-1142.
Mortensen, Dale T. and Christopher Pissarides, 1994, "Job Creation and Destruction
35

in the Theory of Unemployment," Review of Economic Studies, 61, 397-415.
Mory, Javier F., 1993, "Oil Prices and Economic Activity: Is the Relationship Asym-
metric?" The Energy Journal, 14, no. 4, 151-161.
Phelan, Chris and Alberto Trejos, 1999, "The Aggregte Effects of Sectoral Realloca-
tions," forthcoming in the Journal of Monetary Economics.
Prescott, Edward C. and Michael Visscher, 1980, "Organization Capital," Journal of
Political Economy, 88, no. 3, 446-461.
Ramey, Garey and Joel Watson, 1996, "Contractual Fragility, Job Destruction and
Business Cycles," working paper, University of California, San Diego.
Ramey, Valerie and Matthew Shapiro, 1996, "Sectoral Mobility of Capital: A Case
Study of an Aerospace Firm," working paper, University of California, San Diego.
Rasche, R.H. and J.H. Tatom, 1977, "Energy Resources and Potential GNP" Federal
Reserve Bank of St. Louis Review, 59, (June), 10-24.
Rasche, R.H. and J.H. Tatom, "Energy Price Shocks, Aggregate Supply, and Monetary
Policy: The Theory and International Evidence," Carnegie-Rochester Conference Series
on Public Policy, 14.
Rotemberg, Julio J. and Michael Woodford, 1996 "Imperfect Competition and the
Effects of Energy Price Increases on Economic Activity," Journal of Money, Credit and
Banking, 28, no. 4, part 1 (November), 549-577.
Stock, James H. and Mark W. Watson, (1989) "New Indexes of Coincident and Lead-
ing Economic Indicators," NBER Macroeconomics Annual, IV, 351-394.
36

Table 1. Quarterly Job Flow Rates by Sector
Summary Statistics, 1972:2 to 1988:4
Panel A
. Total Manufacturing
Panel B. Nondurables Manufacturing Industries
Employment
Share
St. Dev.
Mfg.
Mean Job
Mean Job
Emp.
Creation
Destruction
Share
Rate
Rate
100.0
5.2
5.5
St. Dev.
of
Creation
Rate
0 . 8
7
St. Dev. of
Destruction
Rate
1.45
St. Dev. of
Employment
Growth Rate
1.92
Mean Job
Mean Job
of
St. Dev. of
St. Dev. of
Creation Destruction Creation Destruction Employment
Rate
Rate
Rate
Rate
Growth Rate
8.2
9.0
9.0
1.35
5.3
3.5
4.1
0.84
7.8
5.4
6.3
1.31
3.8
3.6
3.8
0.70
5.2
4.5
4.5
0.72
4.0
3.6
4.0
0.76
0.7
3.9
4.3
1.31
4.2
5.4
5.3
1.18
1.4
4.8
6.1
1.23
Panel C
. Durables Manufacturing Industries
INDUSTRY
Food Products
Textile Mill Products
Apparel and Other Textiles
Paper and Allied Products
Printing and Publishing
Chemicals and Allied Products
Petroleum and Coal Products
Rubber and Plastics
Leather Products
Lumber and Wood Products
Furniture and Fixtures
Stone-Clay--Glass Products
Primary Metals
Fabrictated Metals
Nonelectrical Machinery
Electrical Machinery
Transportation Equipment
Instruments and Related Products
Miscellaneous Manufacturing
1.37
1 .44
1.50
1.18
1.09
1.05
1.70
2 .
02
1.84
INDUSTRY
1.54
1.90
2.30
1.57
1.30
1.39
2 .11
2.70
2.56
Employment
Share
Mean Job
Creation
Rate
St. Dev.
Mean Job
Destruction
Rate
of
Creation
Rate
St. Dev. of
Destruction
Rate
4.1
2.9
3.4
6.0
8.7
10.3
9.2
9.5
2.8
2.2
St. Dev. of
Employment
Growth Rate
6.6
5.1
5.3
3.7
5.3
4.9
4.7
5.5
4.2
6.7
6.9
5.3
5.7
4.6
5.6
5.3
4.9
5.7
4.2
7.1
1.68
1 . 1
7 1.
04
1.30
1 .
14
1 .02
1 .08
1.58
1.04
1.33
2.40
1.81
1.58
2 .64
1.74
2 .0
2 1.
92
2.73
1.26
1.64
3 .13
2.45
2 .1
7 3 .49
2 .40
2.68
2.65
3 .
52
1.
85
2.38

Panel D. Energy Intensity Deciles (Energy Costs as Percent of Shipments Value)
St. Dev.
ANNUAL
DEPRECIATION
RATE
St. Dev. of
Employment
Growth Rate
Number of
4-digit SIC
I ndu s tries
Mfg.
Mean Job
Mean Job
of
St. Dev. of
St. Dev. of
ENERGY
Emp.
Creation
Destruction
Creation
Destruction
Employment
INTENSITY
Share
Rate
Rate
Rate
Rate
Growth Rate
0.0 —
0.4
10.0
6.3
5.9
1.22
1.49
2.05
0.4 —
0.6
10.0
5.
5 5.5
0.88
1.41
1.77
0.6 —
0.8
10.0
5.2
5.2
0.88
1.39
1.88
0.8 —
1.0
10.0
5.0
5.2
0.82
1.52
1.95
1.0 —
1.3
10.0
5.
1 5.
3 0.94
1.42
1.93
1.3
— 1.
6 10
.0
5.1
5.4
0.97
1.
52
2.06
1.
6 —
2.
1 10
.0
5.3
5.7
0.98
1.
55
2.02
2.
1 —
2.
9 10
.0
5.2
5.8
0.99
1.
60
2.10
2.
9 —
5.
3 10
.0
5.1
5.8
0.88
1.
65
2.07
5.
3+
10.0
4.
4 5.
5 1.
00
1.80
2.
40
Panel E. Capital Intensity (of Industry) Quintiles
Mean Job
Creation
Rate
CAPITAL
INTENS ITY
0.0
—
24.8
24
.8 —
34
.3
34.3
— 44
.8
44.8
—
70.9
70
.9+
Mt g.
Emp.
Share
20.0
20
.0
20.0
20
.0
20.0
Mean Job
Destruction
Rate
5.9
5.0
5.2
5.9
5.5
St. Dev.
of
Creation
Rate
0.99
1.00
0.88
1
. 17
1.
24
5.4
5.0
5.1
5.6
4.9
Panel F. Durability of Final Product Classes
St. Dev. of
Destruction
Rate
1.34
1.31
1.
49
1.97
1.
94
St. Dev. of
Employment
Growth Rate
1.81
1.82
1.96
2
.44
2 .6
7
St. Dev.
Mfg.
Mean Job
Mean Job
of
St. Dev. of
Emp.
Creation
Destruction
Creation
Destruction
Share
Rate
Rate
Rate
Rate
1
11.1
7.
5 7.
5 1.
09
1.19
1.
29
54
.37
- .5
9 4.
1 4.
3 5.
2 0.
92
1.42
1.
98
11
.14
—
.33
4.2
5.1
6.0
1.35
1.
69
2.32
10
.1
0 —
.1
3 4.
9 6.
7 7.
1 2.
12
3.70
4.
67
13
(minus autos)
3.3
4.9
5.4
1.14
1.66
2.33
12
.04
—
.09
2.7
5.3
5.8
1.16
2.
03
2.67
19

Panel G
. Mature Manufacturing Plants (At Least 9-13 Years Old)
St. Dev.
Mfg.
Mean Job
Mean Job
of
St. Dev. of
St. Dev. of
Emp.
Creation
Destruction
Creation
Destruction
Employment
EMPLOYEES
Share
Rate
Rate
Rate
Rate
Growth Rate
Fewer Than 20
2.4
5.4
9.9
1.64
2.86
2.75
20 —
99
12.0
5.6
7.0
1.11
1.53
1.86
100 —
249
14.2
5.
2 6.
1 0.
88
1.46
1.86
250 —
499
13.7
4.8
5.3
0.81
1.36
1.79
500 —
2,49
9 22.3
3.7
4.1
0.70
1.35
1.79
2,500+
13.5
3.6
3.8
1.12
1.92
2.56
Panel H. Young Manufacturing Plants (Less Than 9-13 Years Old)
St. Dev.
Mfg.
Mean Job
Mean Job
of
St. Dev. of
St. Dev. of
Emp.
Creation
Destruction
Creation
Destruction
Employment
EMPLOYEES
Share
Rate
Rate
Rate
Rate
Growth Rate
Fewer Than 20
2.8
7.9
10.3
3.89
3.09
4.46
20 —
99
7.6
7.9
7.3
2.20
1.76
2.70
100 —
249
5.2
7.4
6.0
1.65
1.67
2.56
250 —
499
3.1
6.6
5.1
1.34
1.58
2.48
500 —
2,49
9 3.1
6.2
4.4
1.56
1.49
2.52
Notes:
The data are seasonally adjusted by removing quarterly fixed effects from the sectoral job creation
and destruction rates.
Employment shares are averages for the 1972 to 1988 period.
The cutoff
between young and mature plants varies by year, as described in -section 7.3.1 of the appendix to Davis,
Haltiwanger and Schuh (1996) .
S
ee
the
text
fo
r a fuller definition of the energy intensity deciles,
the capital intensity quintiles and the product durability quintiles.
Sources: (1) Panels A-D: Davis, Haltiwanger and Schuh (1996).
(2) Panels E-H: authors' tabulations from the LRD.

Table 2: Summary of Variance Decompositions
Contribution of Shocks to 8-Step Ahead Forecast Error Variance
Panel A. Employment-Weighted Average Contribution to Net Employment Growth
Sectoral Oil Common SPREAD Sector-SpecificClassification Shocks Shocks Shocks Shocks
2-digit Industry 0.22 0.33 0.11 0.344-digit Industry 0.22 0.24 0.10 0.44Energy Intensity 0.25 0.49 0.06 0.20Capital Intensity 0.22 0.41 0.12 0.26Durability 0.18 0.24 0.10 0.49Age/Size Class 0.20 0.37 0.12 0.31
Panel B. Employment-Weighted Average Contribution to Job Reallocation
Sectoral Oil Common SPREAD Sector-SpecificClassification Shocks Shocks Shocks Shocks
2-digit Industry 0.26 0.27 0.11 0.364-digit Industry 0.23 0.22 0.10 0.46Energy Intensity 0.40 0.32 0.12 0.17Capital Intensity 0.26 0.28 0.08 0.39Durability 0.30 0.21 0.07 0.43Age/Size Class 0.26 0.28 0.14 0.32
Panel C. Employment-Weighted Average Contribution to Job Creation
Sectoral Oil Common SPREAD Sector-SpecificClassification Shocks Shocks Shocks Shocks
2-digit Industry 0.16 0.34 0.11 0.524-digit Industry 0.18 0.22 0.10 0.75Energy Intensity 0.08 0.52 0.10 0.32Capital Intensity 0.12 0.35 0.12 0.47Durability 0.17 0.22 0.10 0.65Age/Size Class 0.13 0.27 0.11 0.50
Panel D. Employment-Weighted Average Contribution to Job Destruction
Sectoral Oil Common SPREAD Sector-SpecificClassification Shocks Shocks Shocks Shocks
2-digit Industry 0.26 0.30 0.11 0.334-digit Industry 0.23 0.24 0.10 0.42Energy Intensity 0.35 0.42 0.07 0.16Capital Intensity 0.26 0.35 0.09 0.29Durability 0.27 0.23 0.08 0.43Age/Size Class 0.26 0.37 0.12 0.24
Notes: (1) Table entries report weighted average values of percentagecontributions to eight-step forecast error variances, where weights equal1972-1988 sectoral shares of manufacturing employment. (2) The resultsreflect estimates of seven-variable near VARs, one for each sector, andthe identification assumptions described in the text. (3) Manufacturingand sectoral rates of job creation (P05) and job destruction (NEG) ratesare seasonally adjusted prior to estimation.

Table 3. Summary Statistics for Industry-Level Shock Response Regressions
Dependent Variables: Cumulative 7-Step Employment Responses andCumulative 15-step Excess Reallocation Responses
A. Full Sample (N_—47), Cubic SpecificationOil Shock SPREAD Shock
Employment Reallocation Employment Reallocationp-value for:
Cubic in Log(Energy Share) .017 .218 .868 .001Cubic in Log(Capital Per Worker) .000 .000 .000 .500Cubic in Coworker Log .030 .583 .173 .195Cubic in Mature Plant Fraction .900 .000 .008 .000
R-bar Squared .094 .096 .065 .121
B. Limited Sample (N=106), Cubic SpecificationOil Shock SPREAD Shock
Employment Reallocation Employment Reallocationp-value for:
Cubic in Log(Energy Share) .151 .164 .737 .504Cubic in Log(Capital Per Worker) .030 .533 .884 .314Cubic in Coworker Log .311 .434 .291 .695Cubic in Product Depreciation Rate .000 .355 .000 .889Cubic in Mature Plant Fraction .000 .165 .520 .000
R-bar Squared .330 .155 .321 .160
C. Limited Sample (N_—106), Linear SpecificationOil Shock SPREAD Shock
Employment Reallocation Employment Reallocationp-value for:
Log(Energy Share) .138 .830 .394 .040Log(Capital Per Worker) .000 .036 .481 .338Coworker Log .579 .530 .065 .126Product Depreciation Rate .000 .864 .000 .709Mature Plant Fraction .020 .010 .616 .003
R-bar Squared .230 .047 .350 .075
Notes:We regressed the estimated industry-level cumulative responses to oil and SPREAD
shocks on the indicated industry characteristics. The Product Depreciation Rate is avail-able for 106 industries that produce consumer goods. See the text for full decriptions ofthe variables.

Table 4: Job Creation and Destruction Responsesto Various Oil and Credit Shocks
Based on 5 Variable VAR
A. Impact of Positive Standard Deviation Oil Shock
B. Impact of Negative Standard Deviation Oil Shock
C. Impact of 1973:4-1974:1 Oil Shock
D. Impact of Positive Standard Deviation Credit Shock
E. Impact of 1979:3-1979:4 Credit Shock
Effectafter — Job JobQuarters Creation std Destruction std
NetEmploymentChange
Jobstd Reallocation std
Effectafter — Job JobQuarters Creation std Destruction std
NetEmployment
Change
3 0.10 (.26) 0.33 (.50) -0.23 (.57)7 0.14 (.58) 2.33 (.86) -2.19 (1.0)
11 1.03 (.89) 2.11 (1.2) -1.08 (1.3)15 1.36 (1.3) 1.85 (1.6) -0.49 (1.5)
Job
Effect
0 .44
2.483 . 143.20
after Job Job Employment—Quarters Creation std Destruction std Change
Net
3 -0.32 (.24) 0.08 (.45) -0.40 (.51)7 -0.34 (.51) -0.51 (.70) 0.18 (.83)
11 -0.45 (.76) -1.00 (.99) 0.55 (1.1)15 -0.71 (1.0) -1.10 (1.3) 0.39 (1.2)
-0 .24-0.85-1.45-1.81
Effectafter — JobQuarters Creation
3 0.077 -0.36
11 2.8115 4.41
Jobstd Reallocation
Job Employment JobChange std Reallocation
(.55)(1.1)(1.7)(2.5)
std
(.50)(.89)(1.4)(2.0)
std
(1.2)(3.2)(5.5)(8.4)
Effect Netafter — Job Job Employment JobQuarters Creation std Destruction std Change std Reallocation std
3 -0.30 (.11) 0.54 (.24) -0.84 (.27) 0.24 (.25)7 -0.10 (.29) 1.02 (.46) -1.12 (.53) 0.92 (.55)
11 0.30 (.47) 1.07 (.67) -0.77 (.72) 1.37 (.91)15 0.52 (.67) 1.01 (.86) -0.48 (.81) 1.53 (1.3)
std Destruction std
Net
(.51)(1.7)(2.9)(4.2)
0 .42
7.617.676 . 64
(1.1)(2.7)(4.2)(5.7)
-0.35-7.97-4.86-2.24
(1.3)(3.1)(4.7)(5.6)
0.497.2510.4911.05
3 -0.57 (.22) 1.00 (.50) -1.58 (.57) 0.43 (.52)7 -0.42 (.68) 2.63 (1.1) -3.05 (1.3) 2.20 (1.3)
11 0.64 (1.2) 2.95 (1.7) -2.32 (1.8) 3.59 (2.2)15 1.37 (1.7) 2.71 (2.2) -1.34 (2.1) 4.08 (3.3)

Table 5Decomposition of Job Reallocation Response to Oil and SPREAD Shocks
A. Cumulative Response toat Step
Unit Standard Deviation Positive Oil Shock15
Share from
SectoralClassification
JobReallocation
Share fromShifts inand outof Mfg
ShiftsBetweenSectorsin Mfg
Share fromShiftsWithinSectors
SectoralClassification
Total Mfg2-digit Industry4-digit IndustryEnergy IntensityCapital IntensityAge/Size Class
JobReallocation
200934228756226889232607202089255124
Share fromShifts inand outof Mfg.
0.3160.4820.3880.2770 .5520.283
Share fromShifts
BetweenSectorsin Mfg.
0.0000.0490.2390 .1160.0200.318
Share fromShiftsWithinSectors
0.6840.4690.3740.6070.4280.399
Notes: See notes to Table 2.
Total Mfg 398864 0.155 0.000 0.8452-digit Industry 429763 0.153 0.175 0.6724-digit Industry 413953 0.146 0.400 0.455Energy Intensity 369307 0.170 0.047 0.783Capital Intensity 431418 0.040 0.055 0.904Age/Size Class 308831 0.279 0.292 0.429
B. Response to Unit Standard Deviation Positive SPREAD Shockat Step 15

Figure 1(A) — Job Creation and Destruction Rates, Nondurables
Rood Products8.2 percent of MIg Employment
2 272 74 76 78 80 82 84 86 88 90 7Year
Rubber or,d Plastics4 percent of Mfg. Employment
0
8
72 74 76 78 80 82 84 86
Apparel and Other Textile7.8 percent of Mfç Emp loymert
72 74 76 78 80 82 84Year
Printing and Pubhshng5.2 percent of Mtg. Employment
'2 74 76 78 80 82 84 86 88 90Y.0r
Petroleum and Cool Products0.7 percent of Mtg. Employment
V.aLeather Products
1.4 percent of Ufg Emp I oyment
14
12
10
8
6
4
74 76 78 80 82 84 86 88 90Year
Textile Mill Products.3 percent of Mfg. Employment
12
10
14
12
10
8
6
4
YeaPaper and Allied Products
14
12
10
8
86 88 90
'2 74 76
Chemicals ond Allied Products14 4.0 percent of Mfg. Employment
6
4
2
12
10
8
6
4
12
14
10
H4.2
14
12
10
8
6
4
2—90 72
Year88
Note: The solid (dashed) line is job destruction (creation)
74 76 78 50 82 84 86Ye or
88 9O

12
10
8
6
272 74 76 78 BO82 84 86 88 90
Fobricoted Metal Products8.7 percent of Mfq Eraployreerrt
12
10
8
74 76 78 80 82 84 86 88 go 7 2Veer
EectricaI Machinery9.2 percent of Mtg. Ereploymerrt
Note: The solid (dashed) line is job destruction (creation)
14
12
10
8
64
Figure 1(B) — Job Creation and Destruction Rates, DurablesLumber and Wood Products Purrriture and E0r.res
4.1 percent of Mig. Employment 14 29 percent of MIp Eec oyme'i
12
10
8
4
14
72 74 76 78 80 82 84 86 88 90Ye or
Stone—Clay—Gloss Products3 percent of Mfg . Employmerrt
72 74 76 78 80 82 84 86 88 90
Pnmory Metal lnoustnes6.0 percent of M p. Enrp I oyrrrerr 1
2
14
12
10
8
6
4
2
76 78Veer
Nonelectrical Machinery10.3 percent of Mf9 Emp loymnent
84 86 88 90
72
6
4
12
10
8
6
4
74 76 78 80 82 84 86Year
Tronsportation Equipmentpercent of Ufy . Employment14
12
10
88 90
2 74 76 78 80 82 84 86Year
instruments and Reoted Products2,8 percent of Mfg. Employment
12
10
88 90
14
76 78 80 82Year
Miscellaneous Manufacturing2.2 percent of Mtg. Ernp I oyrnent
12
10
8
82 84 86 88
4
290 72 74 76 78 80 82 84
Yeo86 88 90

12
1
72 74 76 78 80 82 84 86 88Year
Eigth Energy Class0.6 Energy/Sh pmerlts Percent 0.8
72 74 76 78 80 82 84 86Year
Sixth Energy Class1.0 Energy/Sh iprnents Percent a 1.3
2 2747678808284;68j 90Fourth Energy Class
121.6 Energy/Shipments Percent 2.1
78 80 82 84 86 88 90 72Year
Second Energy Class2.9 Energy/Shipments Percent a 5.3
80 82 84 86 88 90 72Year
YearSeventh Energy Class
0.8 Errergy/Sr ipments Percent 1.0
74 76 76 80 82 84 86 88 90Year
Fifth Energy Class1.3 Energy/Shipments Percent 1.6
V.a rThird Energy Class
2.1 a Energy/Shipments Percent a 2.9
Note: The solid (dashed) line Is job destruction (creation)
8
6
Figure 1(C) — Job Creation and Destruction Rates, Energy Intensity DecilesTenth Energy Class Nr,th Energy ClassEner gy/Sh pments Percent a 0 4
120.4 a Enerçy/Sh pererrts Pe cent C
10
8
8
10
12
10
12
10
8
6
4
6
4
2—90 72
12
10
8
66
74 76 78 80 82 84 66 88 90
4
288 90 72
12
10
8
6
4
274 76 78 80 82 84 86 88 90
12
IC
8
6
4
72
10
8
6
4
2
12
10
8
6
4
74 76 74 76 78 80 82 84 86 88 90Year
Top Energy Class53 a Energy/Shipments Percent12
IC
8
6
4
72 74 76 78Year
74 76 78 80 82 84 86 88 90

12
Fourth f</L Quintile24.8 Capitol per Worker 34.3
12
Figure 1(D) — Job Creation and Destruction Rates, Capital Intensity and ProductDurability
Bottom K/L Quintile NOnCrobleSCop tol per Worker < 24.8
14 Deprec o1 i or Rote =
10
6
6 \.iv
10
8
6
4
90 72
121
10
a
74 76 78 80 82 8' 96 82 90
Fourth Durability Class0.37 beprec 01 or Rote 0 50
2 74 76 78 80 82 84 86 88 90Year
Third K/L Quintile34.3 Capitol per Worker a 44.814
12
10
8
4
27
14
12
10
8
6
4
72 74 76 78 80 82 84 86 88 90Year
Thrrd Durobility Class0.14 a Deprecrotiorr Rote a 0.3314
12
10
8
4
2 _________72 742 7 4 76 78 80 82 84 86 8 8 90
YearSecond K/L Quintile
44.8 a Capital per Worker <70 9
76 78 80 82 84Yec,
Second Durability Class0.10 a Depreciot or Rate a 13
86 88 90
72
20
18
16
14
12
10
a
6
4
Cop i to14
12
74 76 78 80 82 84Year
Top K/L DecileI per Worker '70.9
86 88 90
10
S
6
76 78 BO 82 84 86 88 90Year
Top Durability Class0.04 a Deprecioton Rate 0.09
72 74 76 78 60 82 84 86 88 90Year Year
Note: The solid (dashed) line is job destruction (creation)
S

Figure 1(E) - Job Creation and Destruction Rates, Young Plants
<20 Employees2. nercent of Mfç. Employment
20—99 Emooyeeo12 0 percent of flc Enrp ovme
72 88 90
16
12
10
8
6
4
272
16
14
12
10
8
6
4
2—72
74 76 78 80 82 84 86 88 90
Year
250—499 Employees
13 7 percent of Mfç. niployment
74 76 78 80 82 84 86
Year100—249 Employees
14.2 percent of Mfg. Eniployrnent16
14
12
10
8
6
2
88 90 74 76 78 80 82 84Year
2500+ Employees13.5 percent of Mfq. Employment
86 88 90
16
14
12
10
8
6
72 74 76 78 80 82 84 86
Year
500—2499 Employees22.3 percent of Mfg. Employment
16
14
12
10
8
4
2. .
76 78 80 82 84 86 88 90 72 74 76 78 80 82 84 86 88 90Year Year
The solid (dashed) line is job destruction (creation)
72 74
Note:

2 74 76 78 80 82 84
Year
100—249 Employees5.2 percent of Mfg. Employment
86 88 90
Figure 1(F) — Job Creation and Destruction Rates, Mature Plants
<20 Employees 20—99 Empiovees7.6 percent of Mfc Ernp laymen:
1 4
12
10
8
2
72 74 76 78 80 82 84 86 88 90Year
250—499 Employees
163.1 percent of MIg. Employment
14
12
19,0Year
16
14
12
10
8
6
2
16
14
12
10
8
6
2-72
16
14
12
10
8
6
74 76 78 80 82 84Year
500—2499 Employees2.4 percent of MIg. Employment
86 88 90
72 74
Note:
76 78 80 82 84 86 88 90Year
The solid (dashed) line is job destruction (creation)

78: 1 81:1 84: 1 87:1
3.5
3
2.5 Dci)
2C,)>I —
I.'.,
0.5
0
Oil Index Abs Chg (Oil Index) — Quality Spread
Figure 2
0.3
0.2
0.1
U)
-0.2
-0.3
-0.4
Oil Indices and Quality Spread
4
/\JI\ f\
V
72:1 75:1
/11 / 1/I
-0.5

Fig
ure
3:
Impu
lse
Res
pons
e F
unct
ions
for
Tot
al M
anuf
actu
ring,
F
ive
— V
aria
ble
VA
R S
ubsy
stem
R
espo
nse
to Unit Standard Deviation Positive Oil Shock
Response to Unit St. Dev. Oil Shock: Absolute Change Effect Only
0.8
0.6
0.4
Response to Unit Standard Deviation Negative Oil Shock
0.8
0.6
0.4
-0.2
-0.4
-0,6
—0.8
0
1
2 3
4
NEC
NET
'''
PO
S
Response to Unit Standard Deviation SPREAD Shock
0.8
06
—0.
2
—0.
4
-0.6
-0 8
NE
C
NE
T '''
PU
S
0
1
2
3
4
5
6
7
8 9
10
11
12
19
14
15
0.2
0,0
0.2
—0.
4
-0.6
—0.
8
—1.
0
—0.
—0.
7 8
9 10
11
12
13
14
15
Step
s
—0.
NEC
NET
PUS
—1.
0
Step
s
02
00
10
10
12
10
14
15
0,0
-1.0
5
6 7
8 9
10
11
12
19
14
10
-1
0
Step
s St
eps

Figure 4 — Impulse Response Functions, Selected Sectors
1.10.80.50.2
—0, 1
—o
—o
—1.
—1.
RUBBER AND PLASTICSResponse to Un t Poe t ye Of I Shock
APPAREL AND TEXTILESResponse to Unit Postfve CI Shocv
Response to Unit SPREAD Shock
2 4 6 8Steps
NEC —NET P0510 12 14 16
1.4
1.1
0.0.5
0.2—0.1
—0. 4
—0.7
—1.0
-1.3—1.6
1.4
080.5
—0.4
—0.7
—1.0
1.1080.5
6
—1
8 10Steps
12 14
Response to Unit SPREAD Shock
16 2 6
1.4
teps10 12
1.1
4
—0. 1
—0
—o
—1
—1.—
0.8
16
0.5
2
0.2
—0. 1
—0 .4
—0 . 7
—1.0
—1.3
6 8Steps
10 12 14 16
ELECTRICAL MACHINERYResponse to Unit Posit ye Oil Shock
1.41.1
NONELEOTRICAL MACHINERYResponse to Unit Positive Ci Shock
0.8
0.50.
—0.
—0
—0.
0 8
—1.
10 12
—1.
14—1.
I eps
1.4
1.1
0.80.50.2
—0.1
—0 . 4
—0 . 7
—1.0—1.3—1.6
Steps
Response to Unit SPREAD Shock
/ N
----NEC —NET POS
Response to Unit SPREAD Shock
2 4 6 8 10 12 14 16Steps
—1.3
—1.6 NEC —NET POS1 2 4 6 8 10 12 14 16
Steps

1.4
0.8
0.5
0.2—0 . 1
—0 4—0 7—1.0—1.3
—1.6
Figure 4 — Impulse Response Functions, Selected Sectors
1.4
110.8
0.50.2
—c . 1
—0.4—0.7
—1.0
-1.3
-1.6
0
0.
—0
—0
—0.
—1
—1
RIMARY METALSResponse to Un I Pos t vs 0 Shock
1.4
1,10.8
0.0.
—0
—0.
—0.
—1
—1
—1
TRANSPORTACN EQJEMNResponse to unit Post ye 0' 0y
4
08050.2
—0 1
—0. 4
—0.7
—1.0
—1.3
-1.65 10 12 14 16
Step
/NED —NF
0 2 4 6 8 10 12 14 16Steps
Response to Us t SPREAD ShoceResponse to Unit SPREAD Shock
:.:::. :.:
- - -.
—NET POS
I eps8 10 12 14 161 2 4 6 8 10 12 14 16
Steps
NONDURABLES (Per Bs—KIenow)Response to Unit Posit ye Di I Shock
NEC —NET Pflc
TOP DURABILITY CLASSResponse to Unit Positive Oil Shock
1.
0.
1.41.10.80.50.2
—0,1
—0. 4
—0.7
—1.0
—1.3
—1.6
1.41.1'0.80.50.2
—0.1
—0. 4
—0.7—1,0
—1.3—1.6
Steps8 tO 12 14
Response to Unit SPREAD Shock
0 2 4 6 8 to 12 14 16Steps
Response to Unit SPREAD Shock
NEC —N,ET :POS2 4 6 8 tO 12 14
Steps
16
141,1080.50.2
—o
—o
—0 7
—1.0
—t 3—1.6 EG NET P05
16 1 2 4 6 8 10 12 14 16Steps

0.8
0.5
0.
—0.
—0
—0
—1
—1.
—1
Figure 4 — Impulse Response Functions, Selected Sectors
0.5
0.2
—0 . 1
—0.4—0.7—1.0
—1.3
Response to Unit SPREAD Shock Response to Un t SPREAD Shock
NEG —NET POS2 4 6 8 10 12 14 16
Steps
1.4
LOWEST ENERGY SHARE DECLEResponse to Un t Pos t ye Oi Shock
1411
TOP ENERGY SHARE DEC!LResponse to Unit Pos t vs C I Sbcc
0.80.50.
—c
—0
—0.
—1
—1.
2 4 6 8 10 12 14 16 0 2 4 6 8 10 12 14Steps Steps
1.4
0.80.50.2
—0 , 1
—0 .4
—0. 7
—1.0—1.3—1.6 -
0
16
1.41.10.80.50.2
—0.1
—0 .4
—0.7
—1.0-1 .—1.6•--—NEG —NET PUS
2 4 6 8 10-
12 14 6
Steps
BOTTOM (K/L) QUINTILEResponse to Unit Posit ye 0 i Shock
1.1.10.8
1.
TOP (K/L) QLJINTILEResponse to Unit Posit ye Oi Shock
6Steps
8
—0
—0
—1
—1
—110 12 14 16 2
1.41.10.80. 50.2
—0.1
—0 . 4
—o . 7
—1.0—1.3—1.6
108
Step
Response to Unit SPREAD Shock
12
Response to Unit SPREAD Shock
-----NFG —NET PUS
14 16
1.10
0
C
—0. 1
—C
—0
—1
—1
—1,0 2 4 6 8 10 12 14 16
Steps
S
2Steps
8

Figure 4 — Impulse Response Functions, Selected Sectors
MAT'JRE PLANTS, 250—499 EMpLOYEESRespoise to Un I Pos t ye 0 Shock
o . 8H
o 5j
—1 6
1.0.0.0.
—0.1
—0
—0
—1
—1
—1
0.5
0.2
—0. 1
—0 .4
—0
—1
—1.
—1
2 4 6 8
Steps
4
2500— MCYEResponse to n Pon ye C S-cc
0 5
—1.3
0 5-
0 2-
—0. 1
—0 4
8
Steps
—c 7
—1.0
—1.3
—i 60
7i1
°OS
1.41.10.80.50.2
—0.1
—0 - 4
-0.7
—1.0
—1.0
-1.6
1.4
110.8
IC 12 14 6
Response to Un t SPREAD Shock
NEC, —NET Poc
Response to Unit S°PEAD Shocy
0 2 4 6 8 10 12 14 16Steps
YOUNG PLANTS, 20—99 EMPLOYEESResponse to Un t Pos live Oil Shock
2 4 6 8 10 12 14Steps
6
141 1
YOUNG PLANTS, 250—499 EMPLOYEESResponse to Unit Positive Oil Shock
0.8
0.5
0.2—o . 1
—0.4
—0 . 7
—1.0
—1.3
8 10 12Step
Response to Unit SPREAD Shock
14 16 0 4
1.1
1.41.10.8
0.2—0. 1
—0 .4
—0 - 7
—1.0
—1.3
—1.6
6 10 12 14
Steps
Response to Unit SPREAD Shock
NEG —NET
0.80.502
—0 1
—0 4
—0 7
—1.0—1 3
—1.60 2 4 6 8 10 12 14 16
Steps
NED —NET POc0 2 4 6 8 1 0 12 14 16
St eps

0.0
—0.
5 -4
.5
-4
0 —
3.5
—3.
0 2.
3 In
dust
ry Mean of log(Energy Share)
Fig
ure
5(A
).
Cum
ulat
ive
Res
pons
e to
Uni
t S
t. D
ev.
Pos
itive
Oil
Sho
ck
By
Ene
rgy
Inte
nsity
in
Prod
uctio
n NET
-3.0
-2.5
—2.
0
-1.5
-1.0
—0.
5 —5.
0
Net
Gro
wth
Rat
e at
Ste
p 7
(Sol
id)
and
Exc
ess
Rea
lloca
tion
Rat
e at
Ste
p 15
(D
ashe
d)
By
Capital Intensity in Production
EX NET
EX
3.3 -3
.0
3 5
3.0
3 0
—2.
5
By Plant Size
NET
-3.0
—2.5
—2.
0
3.0
0.5
4.0
4 5
Indu
stry
Mean of log(Capital Per Worker)
By Plant Age
EX NET
3,5 -3
.0
3.0
-2.5
2.5
-2.0
2,
0
1.5
-1.5
1.0
-1.0
05
0.0
-0,5
50
55
60
65
7.
0 75
80
8.
5
Indu
stry
Mean of logiCoworker Mean)
The 'ine atop the horizontal axis shows percentiles 10 25 50 75
060
0 65
0.
70
0 75
0.
30
0 80
0
90
Indu
stry
Fraction of Employment in Mature Plants
snd 90. Other regressors are evaluated at medians.

Fig
ure
5(B
).
Cum
ulat
ive
Res
pons
e to
Uni
t S
t. 0e
v. P
ositi
ve S
PR
EA
D S
hock
N
et G
row
th R
ate
at S
tep
7 (S
olid
) an
d E
xces
s R
eallo
catio
n R
ate
at S
tep
15 (
Das
hed)
B
y Energy Intensity in Production
By Capital Intensity in Production
NET
EX NET
EX
-] .
0 3.
5 -3
.0
3.0
5 0
-2.5
-2
.5
2.5
2.5
—2
0 —
2.0
2.0
2.0
1.5
1 5
-1,5
—
1 5
-1.0
:
-
1
-0,5
__
____
____
____
____
____
____
____
____
____
____
____
____
____
____
____
____
____
____
____
____
____
____
____
0.
0 -0
.5 ,
0.0
-5.0
-4
5 -4
0 -3
5 -3
.0
25
30
3.5
4,0
45
5,0
Indu
stry
Mean of log)Energy Share)
Industry Mean of log(Capital Per Worker)
By Plant Size
By Plant Age
NET
EX NET
EX
-3.0
3.5
-3
0 0.
5
3.0
-25
-2.5
-
2.5
2 5
-2
0 -2
.0
2.0
2.0
I
-1.0
—
-1,0
..,,
-05
____
____
____
____
____
____
____
____
____
____
____
____
____
____
____
____
____
____
____
____
__
0.0
-0.5
__
____
____
____
____
____
____
____
____
____
____
____
____
____
____
____
___
5.0
5.5
6 0
6.5
'0
0 5
5.0
8.5
0,60
5.
65
0.70
0
75
0 80
0
80
32
Indu
stry
Mean of log)Coworker Mean)
Industry Fraction of Employment in Mature Plants
Th line atop the horizontal axis shows percentiles 10 25 50
75
and
90. Other regressors are evaluated at mediang -

NE
T
-3.0
Fig
ure
6.
Cum
ulat
ive
Res
pons
e to
Uni
t S
t. D
ev.
Pos
itive
Oil
Sho
ck
By
Cap
ital
Inte
nsity
in
Pro
duct
ion
2.0
2.9
3.0
3 5
4
0
Industry Mean of log(Capital
Per Worker)
Cum
ulat
ive
Res
pons
e to
Uni
t S
t. D
ev.
Pos
itive
SP
RE
AD
Sho
ck
By
Capital Intensity in Production
2.0
2.5
3.0
3.5
4.0
4.5
5.9
Industry Mean of log(Capital
Per Worker)
0.1
02
0.0
0.4
55
35
03
dR
0.9
15
Annual Rate of Depreciation
-2.5
—2.0
—1 5
-1,0
-0,5
0.0 1.3
EX
-2
NE
T
-3,0
4.5
5.0
By Durability of Output
EX
NE
T
F 4
3.0
-2.5
—2.0
0
—1.5
—1
0
-0.5
—3
EX NET
4 —3.0
-2.5
—2
0
o
-1 5
-1.0
-0
5
-4
0.0 0,0
By Durability of Output
—1.
0.5
0.0-
/
0.0
—1
0.1
EX
-2
0.2
0.9
0.4
0.5
06
0.7
0.8
1.0
Annual Rate of Depreciation
F.stnimatned frnm
1(06
-indu
stry
9m
nIp
cOntnining eilo-Mlpncw anrhi1itnv mP60ur
0,9