Embed Size (px)
Citation preview
International Journal of Research in Business Studies and Management
Volume 5, Issue 10, 2018, PP 30-47
ISSN 2394-5923 (Print) & ISSN 2394-5931 (Online)
International Journal of Research in Business Studies and Management V5 ● I10 ● 2018 30
An Econometric Model for Small and Medium Sized
Enterprises Growth in India
Dr. Manoj Kumar
Professor & H.O.D., Mechanical Engineering and BBA Programme, Echelon Institute of Technology
Jasana, Manjhawali Road, Kabulpur, Faridabad, Haryana 121101, India
*Corresponding Author: Dr. Manoj Kumar, Professor & H.O.D., Mechanical Engineering and BBA
Programme, Echelon Institute of Technology Jasana, Manjhawali Road, Kabulpur, Faridabad,
Haryana 121101, India.
INTRODUCTION
This paper explores the main determinants of
growth in small and medium sized enterprises
(SMEs) in India. The important role of SMEs for
the economic development of India has recently
been attracting the attention of academics and
policymakers. For example, some recent studies
(see Markovics, 2005 and Lesáková, 2009)
emphasize the role of innovation as a factor of
increased competitiveness of small and medium
enterprises in India. For India, SMEs represent a
substantial part of their economy, are a major
contributor to the growth of GDP through the
creation of new businesses and jobs; this is why
Indian governments pay increased attention to
small businesses and try to create an environment
that will be beneficial for their development.
According to the Indian definition, small
enterprises are those who have less than fifty
employees and annual turnover less than
10,000,000 Rupees. Medium enterprises are
defined as ones having less than 250 employees
and a turnover less than 50,000,000 Rupees. By
annual turnover the Indian Commission (IC)
means income from sales and services without
VAT and other indirect taxes. SMEs contribute
significantly to the economic growth of both
developed and developing countries and insight
into how they prosper is worthy of investigation.
Small and medium firms have been the primary
source of employment creation worldwide over
the last two decades. At the same time access to
financing continues to be one of the most
significant challenges for the creation, survival
and growth of SMEs. Thus, increased attention
has been paid to the key factors determining
SMEs’ growth and success. While a significant
amount of research has been done on the
determinants of growth in large firms, much less
is known in regard to SMEs, especially
manufacturing SMEs, given that their growth and
prosperity are potentially subjected to different
constraints and contingencies related to their
specificity as business organizations (Raymond
et al., 2005). The specific characteristics that
fundamentally distinguish SMEs from large
enterprises relate to their environment, structure,
strategy and decision making process; but also
relate to their flexibility, proximity to markets,
and quickness to react and reorient themselves.
This paper investigates the impact of economy-
wide factors (gross domestic product, inflation
ABSTRACT
The purpose of this paper is to explore the main determinants of growth in small and medium sized
enterprises (SMEs) in India. The empirical research has suggested that firm growth is determined not only
by the traditional characteristics of size and age but also by other firm-specific factors such as indebtedness,
internal financing, future growth opportunities, process and product innovation, and organisational
changes. No empirical evidence has been provided so far on which of these determining factors are
associated with SMEs growth and performance in India. Using a panel dataset of 560 fast growing small
and medium enterprises from India we find evidence that firm size and age can explain to a large extend the
growth in SMEs in India. Firm specific characteristics such as short-term liquidity, future growth
opportunities, internally generated funds, and factor productivity are found to be important factors in
determining a firm’s growth and performance. Economy-wide factors such as inflation and corporate
income tax rate (but not gross domestic product) seem to have a significant effect on SMEs growth in India
Keywords: Small and Medium Enterprise, Growth, Panel Data Analysis.

An Econometric Model for Small and Medium Sized Enterprises Growth in India
31 International Journal of Research in Business Studies and Management V5 ● I10 ● 2018
and tax rate) and firm specific characteristics
(age, size, internal finance, capital structure,
growth opportunities, liquidity, and factor
productivity) on the growth of small and medium
sized enterprises in India. Using a panel data
analysis for a set of 560 fast growing SMEs in
India, we find that firm growth is related not only
to the traditional determinants of age and size but
also to other specific characteristics associated
with its financial structure and productivity. For
example, short-term liquidity, future growth
opportunities, internally generated funds, and
factor productivity are found to be important
factors in determining a firm’s growth and
performance. Economy-wide variables such as
inflation and corporate income tax rate also seem
to be relevant determinants of SMEs growth.
The rest of the paper is organized as follows: the
next section outlines our conceptual framework
and summarise the findings of the research
literature on the determinants of SME growth.
The econometric model and the data panel analysis
are presented in section 3. Here we also discuss the
econometric results from the panel regressions.
Some concluding remarks are offered in the final
section.
LITERATURE REVIEW
In India, small and medium sized enterprises
account for over 99 per cent of all enterprises.
Furthermore, 91 percent of these enterprises are
micro-firms with less than 10 workers (OECD,
2009). Given their importance in all economies,
SMEs’ growth is essential for economic recovery
and development.
Many different theories have attempted to
identify the main factors underlying firm growth.
They can be divided into two main schools: the
first addresses the influence of firm size and age
on growth, while the second deals with the
influence of variables such as strategy,
organization and the characteristics of the firm’s
owners/managers. In fact, a huge number of
studies have been devoted to examining the
relationship between the growth and size of
firms. For example, Evans (2007) examines the
effects of firm size and age on growth using data
on manufacturing firms in the United States.
Although several previous studies had supported
Gibrat’s law that hypothesizes that growth is
independent of size, Evans (2007) find that firm
growth decreases with firm size and age.
However, the empirical literature has suggested
that firm growth is determined not only by the
traditional characteristics of size and age but also
by other firm-specific characteristics. For
example, Heshmati (2001) finds that the degree
of indebtedness positively affects sales growth
using data on Swedish micro and small firms,
while Becchetti, & Trovato (2012) document the
effect of external finance on firm growth in the
Italian manufacturing industry, apart from the
traditional determinates of age and size. Elston
(2012) provides evidence that cash flow has an
impact on the growth of firms listed in the Neuer
Market of Germany, even when controlling for
firm size and age. In a recent study Morone, &
Testa (2008) investigate a sample of 2,600 Italian
SMEs to find that, on average, young firms are
morelikely to experience positive growth;
moreover, turnover growth is positively
associated with firms’ size, processinnovation,
product innovation and organisational changes.
In contrast, marketing innovation does not
considerablyaffect Italian SMEs growth.
In the conventional framework of firm
growthanalysis, financing of growthis
investigated through the growth-size-profitability
relationships. A considerable body of literature
deals with thisquestion, analysing the
relationship between the growth and the financial
structure of the firm. If all firms had complete
access to capital markets, external funds would
provide a perfect substitute for internal capital,
which implies that a firm’s financial structure is
irrelevant to investment and growth. It is often
argued, however, that firms face difficulties in
financing from external sources due to
asymmetric information problems in capital
markets. In fact, a number of studies on capital
market imperfections have examined the impact
of financial constraints on investment decisions
and firm growth. For example, Fazzariet al.
(2008) argue that financial constraints in capital
markets affect investment, and emphasized that
the link between financial constraints and
investment varies by type of firm. Audretsch, &
Elston (2012) assert that financial constraints
may be more severe as firm size decreases.
In a more recent study, Wagenvoort (2003) uses
financial data for more than 200,000 European
manufacturingand construction firms, and finds
that European SMEs’ suffer froma structural
finance problem that hinders their growth. In
particular, it is observed that financial constraints
tend to hamper the growth of small and very
small firms and to be lesssevere for medium-
sized enterprises. Other empirical studies (e.g.,
Becchetti, & Trovato, 2012; Carpenter, &
Petersen, 2012) have confirmed that the
An Econometric Model for Small and Medium Sized Enterprises Growth in India
International Journal of Research in Business Studies and Management V5 ● I10 ● 2018 32
constrained availability of finance affects small
firm growth. Even though smaller firms seek to
achieve minimum efficient scale, they are more
likely to be unable to obtain sufficient capital
from external sources in order to expand their
businesses. In particular, under the present
dismal economic conditions, internal finance
may have a greater impact on the growth of
SMEs.
It is often argued that SMEs are, in contrast to
large firms, informationalmore opaque, have on
average higher growth rates, are financiallymore
constrained, and are more dependent on bank
loans when outside financingis needed. For a
bank, the limited information available about the
SME increasesthe risk associated with providing
financing, which induces the bank to reduce
loanmaturity and increase the interest rate. To
optimize loan conditions, SMEs havean incentive
to build a relationship with their bank(s) in order
to minimize theinformation asymmetry.The
association between bank debt maturity and
relationshiplending is widely investigated (see
Ortiz-Molina, &Penas, 2004 for US firms, and
Hernández-Cánovas, &Koëter-Kant, 2008 for
EU firms). For example, Hernández-Cánovas, &
Koëter-Kant (2008) find that, after controllingfor
firm-specific characteristics such as size, age,
debt and financial situation,close firm-bank
relationships increase the likelihood of obtaining
longer-termbank loans. However, once they
allow cross-country heterogeneity to influence
the results,the empirical evidence shows that
bank relationship lending and its effect on bank
loan maturityfor European SMEs is impacted by
country-specific factors.
The research on firm growth finds that high
growth tends to be associated with a firm’s
entrepreneurial behavior. Thus, growth tends to
be considered a logicalconsequence of
innovative, pro-active and risk-taking behavior
on the part of the firm, asthese are the
dimensions which define an entrepreneurial
orientation (EO).The relationshipbetween the EO
of the firm and its performance has been
thoroughly investigatedfrom both a conceptual
(see Lumpkin,& Dess, 2016) and an
empiricalpoint of view (Lumpkin,& Dess, 2011;
Wiklund,& Shepherd,2005).A recent study by
Wiklund et al. (2009) claims that entrepreneurial
orientation of a company is essential for the
flexibility and quick decision making of a small
company. They believe that the general tendency
in today’s business environment is the shortening
of product and business model life cycles.
Consequently, the future profit streams from
existing operations are uncertain and businesses
need to constantly seek out new opportunities.
Therefore, they may benefit from adopting an
‘entrepreneurial strategic orientation’.
Moreno, & Casillas (2008) find that EO and
growth are positively related, although
theirrelationship is complex. They assert that the
propensity for innovation is the dimension of EO
thatexercises the greatest influence on the type of
expansion strategy used by the firm, encouraging
the development of new products-technologies
relationship through a strategicbehavior; these
strategic behaviors are the principal driving force
behind growth. Along with them, the conditions
of the environment (highly dynamic and not
veryhostile) and the availability of resources
favor the rapid growth of the firm.Freel, &
Robson (2004) employa large-sample of SMEs,
located inScotland and in Northern England, and
find apositive relationship between novel product
innovation and growth inemployment and, for
manufacturing firms, at least in the short term, a
negativerelationship between product innovation
(both incremental and novel) andgrowth in sales
or productivity. By contrast, growing sales and
productivity appearpositively associated with
incremental process introductions in service
firms.
A large group of studies has focused on the main
determinants of SME’s capital structure and the
extent to which variations in capital structure
between industries are due to industry effects or
variations in the determinants of capital structure
from industry to industry (see Hall et al., 2006
for UK, and Sogorb-Mira, 2005 for Spain).
Thornhill et al. (2004) find a strong
correlationbetween capital structure and
knowledge intensity. In contrast, growth histories
are notobvious determinants of financial
structure. Results also suggest that leverage
strategies aremore apparent in low-knowledge
industries, in firms with higher expectations of
futureperformance, and in businesses with more
balanced financial structures.
Some empirical studies associate growth in
SMEs with the personal characteristics of their
owners and the environment in which they
operate. For example, an early study of Miller
(2018) focuses on the effect of the environment
in which a company operates on the company’s
strategy. He affirms that different external
environments require different strategies
matched with complementary internal
environments and structures in order to promote
success. For example, the strategy of innovative

An Econometric Model for Small and Medium Sized Enterprises Growth in India
33 International Journal of Research in Business Studies and Management V5 ● I10 ● 2018
differentiation is most likely to be pursued in
uncertain environments and correlates with the
use of technocrats and liaison devices. The
strategy of cost leadership is associated with
stable and predictable environments and is
correlated with the use of control. The right
choice of both strategy and environment in which
to implement strategy predetermines firm
growth. A study by Reuber, & Fischer (1997)
examines the effects of the management team’s
international experience on the international
growth of a SME. They find that it is not for how
long a firm has been selling in foreign markets,
but rather, for how long the firm delayed before
selling in foreign markets. SMEs that are
managed by internationally experienced teams
are likely to delay less. Experience with, and
knowledge of foreign markets make it more
likely that decision-makers will consider
mechanisms to sell outside the domestic market
early on and less likely that they will set up
routines based on a purely domestic perspective.
Two main conclusions for the choice of
explanatory variables to be used in the
empiricalanalysis emerge from the preceding
discussion. First, in order to better understand the
determinants of SMEs’ growth in transition
economies,it is crucial to specify an empirical
model that allows for a combination of
traditional firm characteristics (such as size and
age) and more specific determiningfactors (e.g.,
total assets, leverage, internally generated funds,
future growth opportunities, and factor
productivity).All of these variables are closely
related to the theoretical models that explain
growth in SMEs.Second, CEE countries are far
from being homogeneous and both the level of
development and growth of SMEs differacross
transition economies. Hence, another key
question relates the macroeconomic conditions in
the CEE countries with firm growth, and
searches for economy-wide factors (e.g., gross
domestic product, interest rates, inflation, and tax
rates) that may explain SMEs growth in these
countries. In order to address these questions we
develop a set of hypotheses and employ both the
Generalized Method of Moments (GMM) and
the fixed effects specifications to test them.
EMPIRICAL ANALYSIS AND RESULTS
This study aims to fill in the gap in the current
debate on the determinants of growth in SMEs in
India. Our analysis is based on cross-sectional,
panel data analysis of a set of small and medium
sized companies from India. In this paper we
explore whether and to what extend the main
finding of the research literature - that growth in
SMEs can be explained by both traditional and
specific firm characteristics – holds also for
transition economies. To answer this question we
develop the following research hypotheses:
Hypothesis 1: In line with previous research, we
argue that the growth in manufacturing and
service SMEs in India is associated with the
traditional firm characteristics of size and age.
Hypothesis 2: A number of other firm specific
characteristics related to SMEs in India such as
leverage, capital structure, internal finance and
productivity efficiency should also play a major
role in explaining the growth in these firms.
Hypothesis3: Small and medium sized
enterprises grow faster in an economy with
greater growth opportunities. So, macroeconomic
factors such as gross domestic product, inflation
and corporate income tax rate will have a
significant effect on SMEs growth in India.
Data Set
In this research we have adopted the Indian
Commission’s SME definition. The sample of
SMEs considered in our study has been extracted
from The Federation of Indian Chambers of
Commerce and Industry (FICCI) database and
includes 5,000 companies from India.
Specifically, we have selected companies that
meet the following criteria: (i) an annual growth
rate in revenues (or assets) of at least 10 per cent
averaged over the sample period (2014 – 2018);
(ii) number of employees not less than 10, that is,
micro enterprises are excluded from the sample;
(iii) at least 5 years of existence as a business
entity, (iv) positive net worth and/or positive net
income in at least 3 years of the observation
period; and (v) not included in a bankruptcy
process. The information obtained was carefully
screened, refined and cases with errors in the
accountingdata or missing values for some of the
variables over the sample period, were
eliminated. Thus, the dataset has beenrestricted
to the observations that embody all theessential
variables available, and to those variables that
have a complete record over the period
ofexamination. As a result, the definitive number
of firms that makes up our sample amounts to
560 for which we have full accounting data over
the period 2014 – 2018, resulting in 2,800
observations balanced panel data.
Geographical distribution of sample firms by
age, size and sector is shown in Table 1. The data
shows that 11.3 per cent of all firms in the
sample are small enterprises and 88.8 per cent

An Econometric Model for Small and Medium Sized Enterprises Growth in India
International Journal of Research in Business Studies and Management V5 ● I10 ● 2018 34
are medium enterprises. With regard to the age
structure of our sample, we observe that nearly
15 per cent of all SMEs are younger enterprises
(with 5 to 10 years of existence), while 10.7 per
cent can be classified as older firms (with more
than 20 years of existence). The average number
of years of existence for the whole sample is 16.
It is worth noting that the selected firmsare
representative of SMEs from Indiaand
theireconomic sectors.As the data in Table 1
show, manufacturing, wholesale and retail trade,
and construction prevail over otherindustries
(40.5 per cent, 21.6 per cent and 9.6 per cent,
respectively), whereas companies from services
sector such as financial intermediation and hotels
and restaurants, account for less than 1 per cent
of the whole sample of small and medium firms.
Thus, a selection bias problem may exist in our
panel data set.
Table1. Distribution of sample firms by size, age and sector
Total
Size
Micro (< 10 employees) n/a
Small (< 50 employees) 63
Medium (< 250 employees) 497
Total: 560
Age
< 5 years n/a
5 -10 years 84
10 - 20 years 416
> 20 years 60
Total: 560
Sector
Agriculture, Fishing& Mining 45
Construction 54
Financial Intermediation 2
Hotels and Restaurants 6
Manufacturing 227
Public Administration, Education, Health and Social Work 7
Real Estate, Renting and Business Activities 41
Transport, Storage and Communication 23
Utilities 19
Wholesale and Retail Trade 121
Other 15
Total: 560
Dependent Variable
There is little agreement in the existing literature
onhow to measure growth, and scholars have
used avariety of different measures. These
measuresinclude, for example, growth of sales,
employees, assets, profit, equity, and others
(seeDavidsson, & Wiklund, 2010). Moreover, the
time span, over which growth isanalyzed in the
literature, varies considerably, andranges from
one to several years. Also, growth hasbeen
measured in absolute or relative terms. Perhaps
the most common means of operationalizing firm
growth isthrough relatively objective and
measurable characteristics – such as growth
insales turnover, total assets and employment
growth. These measures are relatively
uncontroversial(methodologically) and data tend
to be easily available, increasing thescope for
cross-study comparability(Freel, & Robson,
2004). In this study we use three growth models
to examine more accurately the effect of the
explanatory variables on a firm’s growth and
performance – growth in sales revenues,
employment and total assets.
Explanatory Variables
In this study we have selected several variables
that the empirical literature (see Honjo, &
Haranda, 2006; Wiboonchutikula, 2002;
Wiklund et al., 2009; Sogorb-Mira, 2005; Hall et
al., 2010 and 2006; Garcıa-Teruel, & Martınez -
Solano, 2008, Beck et al., 2015) suggests are
important growth determinants.Table 2 shows
summarized description of the dependent and
explanatory variables used in the empirical
analysis and their expected impact on firm
growth.
In general, a positive and predictable
macroeconomic environment will create greater
growth opportunities for SMEs. Thus, we expect
growth in real GDP per capita (RGDP_G) used
as proxy for the level of economic activity to be

An Econometric Model for Small and Medium Sized Enterprises Growth in India
35 International Journal of Research in Business Studies and Management V5 ● I10 ● 2018
positively correlated with a firm’s growth.
Similarly, a significantinflation effect will be
observed to reflect the fact that firm growth in
sales and assets is measured innominal terms.
Thus, a positive correlation between this variable
(INFL) and firm growth is expected. Many
SMEs in transition economies report that the
existing economy-wide financing and
institutional obstacles such as high interest rates,
limited access to export finance and long-term
loans, high income tax rates, heavy bureaucracy
and corruption, constrain their growth (Beck et
al., 2015). To investigate whether or not some of
these obstacles affect the firm growth we
introduce in our analysis statutory tax rate as a
proxy for tax burden on businesses in these
countries. We expect a negative correlation
between this variable (TAX_RATE) and a firm’s
potential for growth.
As explained in Section 2, a number of firm
specific characteristics such as internal finance,
capital structure, leverage, production efficiency,
future growth opportunities, age and size, may
help explain the growth in small and medium
sized enterprises. Our approach in this paper is to
relate firm growth not only with the traditional
determinants of age and size but also to other
determinants associated with a firm’s financial,
organizational and managerial characteristics. As
already discussed, it is difficult for SMEs to
access capital markets, and financial constraints
are more binding for SMEs. Therefore, internal
finance plays an important role in achieving the
growth of SMEs by overcoming financial
constraints. In order to capture the influence of
internally generated capital on firm growth a
variable (CASH FLOW) is constructed.
According to hierarchy theory (Myers, &Majluf,
2014)firms prefer to fund themselves with
resources generated internally before resortingto
the market. In these circumstances, firms with
large cash flows will grow faster, and thus a
positive correlation between cash flow and firm
growth is expected.
Table2. Dependent and explanatory variables
Variable Definition Explanation Expecte
d Sign
Dependant Variables
Op_Reven Change in Operating Revenues, proxy
for growth (in Rupees, thousands)
Difference between the logarithms of firm’s
revenues in periods t and t - 1
Tot_Assets Change inTotal Assets, proxy for
growth (in Rupees, thousands)
Difference between the logarithms of firm’s
total assets in periods t and t - 1
Explanatory Variables
A. Macroeconomic Variables
Rgdp_G Real GDP per capita, proxy for the level
of economic activity (in per cent)
Growth rate of real GDP per capita in period t +
Infl Inflation, proxy forthe level of future
real activity(in per cent)
Log difference of the consumerprice indexin
period t
+
Tax_Rate Statutory tax rate, proxy for tax burden
on business(in per cent)
Statutory corporate income tax ratein period t -
B. Firm-Specific Variables
Tot_Assets Total Assets, proxy for firm size(in
Rupees, thousands)
Difference between the logarithms of firm’s
total assets in periods t and t - 1
+
Inta_Assets Intangible Assets/Total Assets, proxy
for future growth opportunities
Difference between the ratio of intangible to
total assets in periods t and t - 1
-
Cur_Ratio Current Ratio, proxy for short-term
liquidity
Difference between the ratio of current assets
to current liabilities in periods t and t - 1
+
Lever Total Debt/Total Asset, proxy for a
firm’s degree of leverage
Difference between the ratio of total debt to
total assets in periods t and t - 1
-/+
Cap_Prod Operating Revenues/Tangible Assets,
proxy for capital productivity
Difference between the ratio of operating
revenues to tangible assets in periods t and t -
1
+/-
Lab_Prod Operating Revenues/Number of
Employees, proxy for labor productivity
Difference between the ratio of operating
revenues to number of employees in periods t
and t - 1
+
Cf_Ratio (Pre-tax income + Depreciation)/Total As
sets, proxy for internally generated capital
Difference between the firm’s cash flow in
periods t and t - 1
+
Employe Number of employees, proxy for firm
size
Difference between the logarithms of firm’s
size in periods t and t - 1
+
Age Number of years of existence Logarithm of firm’s age (number of years of -

An Econometric Model for Small and Medium Sized Enterprises Growth in India
International Journal of Research in Business Studies and Management V5 ● I10 ● 2018 36
existence) in period t
Owner The type of the ownership of a firm –
publicly-traded vs. privately-held
A dummy variable that takes on value of 1 for
firms which are public entities or 0 otherwise.
+
Sector The type of sector a firm operates in
(manufacturing or services)
A dummy variable that takes on value of 1 for
firms from services sector or 0 otherwise.
-
In addition, capital structure is different among
SMEs, and leverage may be related to firm
growth. In fact, Leung, & Yu (2016) found that
there is a negative relationship between growth
and leverage. In our study the variable that
proxies for a firm’s capital structure
(LEVERAGE) is taken as the ratio of total debt
to total assets and the expected relation to
growth is negative. Since small firms usually
have a higher proportion of current liabilities in
their capital structure compared to large firms, a
firm capability to sustain short-term liquidity is
another relevant determinant of its growth. In
order to capture this relation a variable
(CUR_RATIO) is constructed by taking the
ratio of current assets to current liabilities. It
might be expected that firms that are able to
maintain higher liquidity levels will face less
severe financing constraints. So, we expect
current liquidity to be positively associated with
growth.
Following Hall et al. (2006)a variable that
captures the effect of future growth
opportunities (INT_ASSETS) is constructed by
taking the ratio of intangible assets to total
assets. Intangible assets include research and
development expenditure, trademarks, patents
and copyrights. As these are investments with
long-term payoffs one may expect that the
greater the share of intangible assets in a firm’s
total assets, the smaller the growth in its
operating revenues. So, the expected relation
between these two variables should be negative.
Two well-known determinants – the absolute
value of total assets (TOT_ASSETS) and
number of employees (EMPLOYE) – are
included as size variables in order to test for
scale effects in the relation to growth and firm
size. The empirical evidence shows that the
larger the firm (in terms of assets or number of
employees) the greater its potential to grow
(Wiklund, & Shepherd, 2005). Thus, we expect
the firm’s size to be positively correlated with
its performance. Following Wiboonchutikula
(2002) we estimate growth in SMEs using
different productivity factors as incremental
explanatory variables - the capital productivity
(output/capital) and the labor productivity
(output/labor). These two variables
(CAP_PRODUCT and LAB_PRODUCT) not
only present the basic operational structure of a
firm but also allow us to examine the
association between the efficiency of a firm
operations and its growth potential. We expect
that these two variables may have different
effects on growth in small and in medium-sized
firms.
Businesses of different size and age may exhibit
different organizational and environmental
characteristics, which in turn may influence
performance. Thesame is true for firms
indifferent industries. Therefore, additional firm
specific characteristics are included as
explanatory variables in our analysis to capture
these effects.A dummy variable (OWNER) to
proxy for the ownership (that is, publicly-traded
vs. privately-held) allows us examine the effect
of ownership on SME’s performance. It is
argued that publicly-traded firms can more
easily access external funds than privately-held
firms. Therefore, firm growth may be different
between publicly-traded and privately-held
firms. Age is defined as the number of years a
firm has been operating in the market (since the
date of incorporation) and is expected to have a
negative relation with firm growth. Thus, we
suggest that younger firms are likely to grow
faster than older ones. Finally, in order to
represent the business environment in which a
firm operates – manufacturing or services sector
in our case - a dummy variable (SECTOR) that
takes on value of 1 for firms from services
sector or 0 otherwise is employed. We expect
firms operating in services sector to have larger
growth potential than those in the manufacturing
sector.
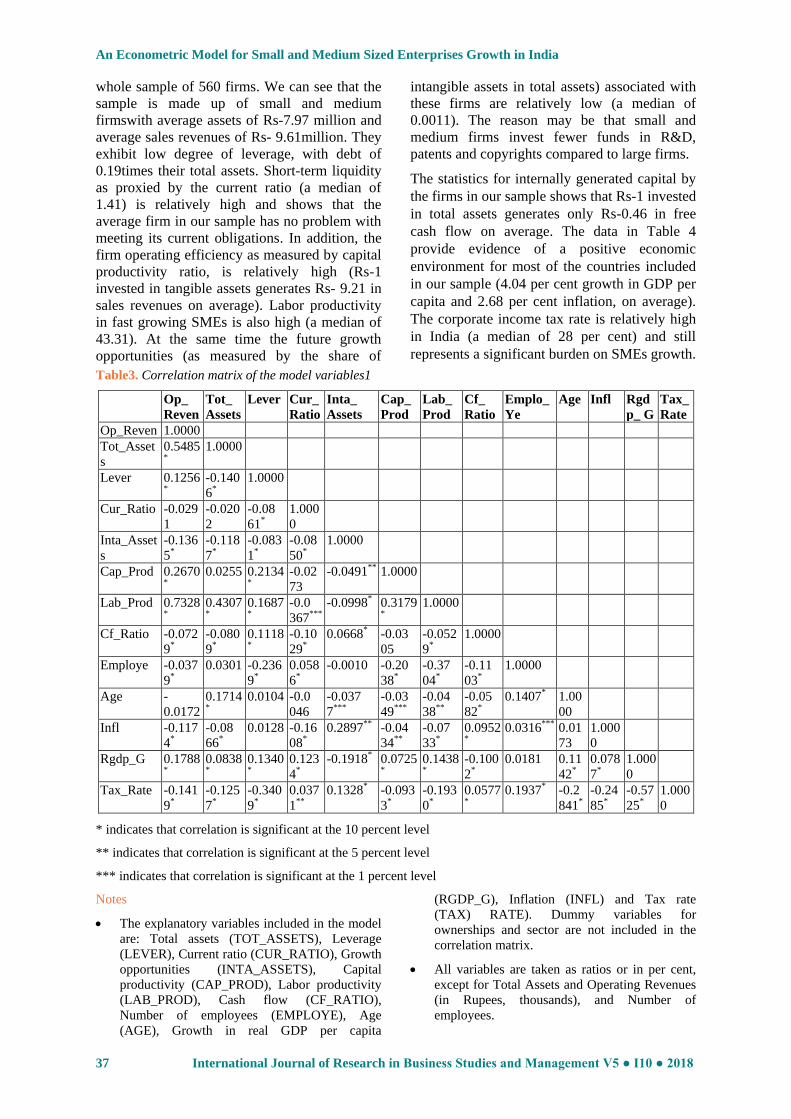
The correlationmatrix of dependent and
explanatory variables is presented in Table 3
and is used to examine the possible degree of
collinearity among variables.The table shows
that the two most highly correlated variables are
operating revenues and labor productivity (a
coefficient of 0.7328). As we observe in Table
3, the correlation coefficients are not sufficiently
large to cause collinearity problems in the
regressions and are statistically significant at the
usual levels of significance. To mitigate the
problem with possible multicollinearity we
gradually exclude the variables that are expected
to be highly correlated with the rest (in this case,
TOT_ASSETS, LAB_PROD and TAX_RATE).
Table 4 presents summary statistics for the
An Econometric Model for Small and Medium Sized Enterprises Growth in India
37 International Journal of Research in Business Studies and Management V5 ● I10 ● 2018
whole sample of 560 firms. We can see that the
sample is made up of small and medium
firmswith average assets of Rs-7.97 million and
average sales revenues of Rs- 9.61million. They
exhibit low degree of leverage, with debt of
0.19times their total assets. Short-term liquidity
as proxied by the current ratio (a median of
1.41) is relatively high and shows that the
average firm in our sample has no problem with
meeting its current obligations. In addition, the
firm operating efficiency as measured by capital
productivity ratio, is relatively high (Rs-1
invested in tangible assets generates Rs- 9.21 in
sales revenues on average). Labor productivity
in fast growing SMEs is also high (a median of
43.31). At the same time the future growth
opportunities (as measured by the share of
intangible assets in total assets) associated with
these firms are relatively low (a median of
0.0011). The reason may be that small and
medium firms invest fewer funds in R&D,
patents and copyrights compared to large firms.
The statistics for internally generated capital by
the firms in our sample shows that Rs-1 invested
in total assets generates only Rs-0.46 in free
cash flow on average. The data in Table 4
provide evidence of a positive economic
environment for most of the countries included
in our sample (4.04 per cent growth in GDP per
capita and 2.68 per cent inflation, on average).
The corporate income tax rate is relatively high
in India (a median of 28 per cent) and still
represents a significant burden on SMEs growth.
Table3. Correlation matrix of the model variables1
Op_
Reven
Tot_
Assets
Lever Cur_
Ratio
Inta_
Assets
Cap_
Prod
Lab_
Prod
Cf_
Ratio
Emplo_
Ye
Age Infl Rgd
p_ G
Tax_
Rate
Op_Reven 1.0000
Tot_Asset
s
0.5485*
1.0000
Lever 0.1256*
-0.140
6*
1.0000
Cur_Ratio -0.029
1
-0.020
2
-0.08
61*
1.000
0
Inta_Asset
s
-0.136
5*
-0.118
7*
-0.083
1*
-0.08
50*
1.0000
Cap_Prod 0.2670*
0.0255 0.2134*
-0.02
73
-0.0491** 1.0000
Lab_Prod 0.7328*
0.4307*
0.1687*
-0.0
367***
-0.0998* 0.3179*
1.0000
Cf_Ratio -0.072
9*
-0.080
9*
0.1118*
-0.10
29*
0.0668* -0.03
05
-0.052
9*
1.0000
Employe -0.037
9*
0.0301 -0.236
9*
0.058
6*
-0.0010 -0.20
38*
-0.37
04*
-0.11
03*
1.0000
Age -
0.0172
0.1714*
0.0104 -0.0
046
-0.037
7***
-0.03
49***
-0.04
38**
-0.05
82*
0.1407* 1.00
00
Infl -0.117
4*
-0.08
66*
0.0128 -0.16
08*
0.2897** -0.04
34**
-0.07
33*
0.0952*
0.0316*** 0.01
73
1.000
0
Rgdp_G 0.1788*
0.0838*
0.1340*
0.123
4*
-0.1918* 0.0725*
0.1438*
-0.100
2*
0.0181 0.11
42*
0.078
7*
1.000
0
Tax_Rate -0.141
9*
-0.125
7*
-0.340
9*
0.037
1**
0.1328* -0.093
3*
-0.193
0*
0.0577*
0.1937* -0.2
841*
-0.24
85*
-0.57
25*
1.000
0
* indicates that correlation is significant at the 10 percent level
** indicates that correlation is significant at the 5 percent level
*** indicates that correlation is significant at the 1 percent level
Notes
The explanatory variables included in the model
are: Total assets (TOT_ASSETS), Leverage
(LEVER), Current ratio (CUR_RATIO), Growth
opportunities (INTA_ASSETS), Capital
productivity (CAP_PROD), Labor productivity
(LAB_PROD), Cash flow (CF_RATIO),
Number of employees (EMPLOYE), Age
(AGE), Growth in real GDP per capita
(RGDP_G), Inflation (INFL) and Tax rate
(TAX) RATE). Dummy variables for
ownerships and sector are not included in the
correlation matrix.
All variables are taken as ratios or in per cent,
except for Total Assets and Operating Revenues
(in Rupees, thousands), and Number of
employees.

An Econometric Model for Small and Medium Sized Enterprises Growth in India
International Journal of Research in Business Studies and Management V5 ● I10 ● 2018 38
Table4. Summary statistics (total sample)
Variable Obs. Mean Median St. Dev. Minimum Maximum
OP_REVEN 2800 9,614.92 6,159.0 15,474.61 0 295,404
TOT_ASSETS 2800 7,969.02 4,716.5 11,310.25 32 133,779
LEVER 2800 0.1921 0.1509 0.1754 0 0.9635
CUR_RATIO 2800 1.8109 1.4076 1.5104 0 10.0
INTA_ASSETS 2656 0.0344 0.0011 0.1215 0 .9740
CAP_PROD 2651 9.21 3.4336 27.34 0 489.93
LAB_PROD 2800 121.88 43.312 265.11 0 6,713.73
CF_RATIO 2653 0.4632 0.1264 2.77 -0.315 106.01
EMPLOYE 2800 126.09 150 58.62 10 250
AGE 2800 13.82 11.0 11.20 1.8 99.1
RGDP_G 2800 4.04 4.2 1.44 1.2 9.3
INFL 2800 2.68 2.4 2.88 -0.1 41
TAXRATE 2800 26.29 28 4.72 10 31
Notes
The explanatory variables included in the model
are: Total assets (TOT_ASSETS), Leverage
(LEVER), Current ratio (CUR_RATIO), Growth
opportunities (INTA_ASSETS), Capital
productivity (CAP_PROD), Labor productivity
(LAB_PROD), Cash flow (CF_RATIO), Number
of employees (EMPLOYE), Age (AGE), Growth
in real GDP per capita (RGDP_G), Inflation
(INFL) and Tax rate (TAX_RATE). Dummy
variables for ownerships and sector are not
included in the summary statistics.
Econometric Model and Empirical Results
The structure of our data set allows us to usea
panel data methodology for our
empiricalresearch. This type of analysis can
control firmheterogeneity, and reduce
collinearity among thevariables that are
contemplated (Arellano, &Bover, 2018).
Likewise, this technique enables usto eliminate
the potential biases in the resultingestimates due
to correlation between unobservableindividual
effects and the explanatory variablesincluded in
the model. Our panel datamodel may be
represented as follows:
Growthit = 0 + 1(Tot_Assetsit) + 2(Leverit) +
3(Cur_Ratioit) + 4(Inta_Assetsit) +
5(Cap_Prodit) + 6(Lab_Prodit) +
7(CF_Ratioit) + 8(Employeit) + 9(Ageit) +
10(Inflt) + 11(RGDPt) + 12(Tax_Ratet)+13(
Dummyi)+it
(1)
where Growthit is defined as the difference
between the logarithms of firm i’s sales
revenues in periods t and t-1 (see Honjo, &
Haranda, 2006). The other two measures of
growth used in the regression model (1) are the
percentage change in total assets and in number
of employees. Variables Tot_Assetsit,
CF_Ratioit and Employeit represent firm i’s size,
cash flow (normalized by total assets) and
number of employees in period t, respectively.
Variables Leverit, Cur_Ratioit, Inta_Assetsit,
Cap_Prodit and Lab_Prodit, represent capital
structure, short-term liquidity, future growth
opportunities, and capital and labor productivity
of firm i in period t, respectively. Variable Ageit
is the logarithm of the number of years of
existence of firm i in period t. The variables
Inflt, RGDPt and Tax_ratet represent inflation
rate, growth in real gross domestic product and
income tax rate, respectively, in period t.
Variables for ownership and sector are proxied
by dummy variables that take on a value of 1 if
the stated condition holds or 0 otherwise.
We estimate the parameters in equation (1)
using the fixed effects estimator. To test the
hypothesis regarding the absence of correlation
between the unobservable specific effects and
the explanatory variables, and thereby, to
consider the individual effects as random or
fixed, we useHausman’s (2018) specification
test. Its outcome enables us to reject the
hypothesis regardingthe absence of correlation
between theunobservable effects and the
explanatory variablesand, thereby, we consider
the individualeffects as fixed.
In addition tothe fixed and random effects
models we employ identical specifications using
Generalized Method of Moments (GMM)
proposed by Arellano, &Bond (2011).The
results for panel regressions are presented in
Tables 5 through 8. We run the benchmark
model (1) for several different specifications
(see Table 5). Both TOT_ASSETS and
EMPLOYE variables are used as proxy for firm
size. A variable that is highly correlated with the
rest of the explanatory variables is LAB_PROD.
To mitigate the problem with possible
multicollinearity this variable is excluded from

An Econometric Model for Small and Medium Sized Enterprises Growth in India
39 International Journal of Research in Business Studies and Management V5 ● I10 ● 2018
the rest of our model specifications (see Models
4 through 7). The explanatory power of our
model is very high (the within R2 is between 47
and 67 per cent for all model specifications)
taking into account the fact that we use panel
data. The results in Table 5 show that, in line
with previous empirical studies, the impact of
firm size (as measured by the absolute value of
total assets, TOT_ASSETS) on growth, is
positive and statistically significant at 1 per
cent, for all model specifications. We also
support the Wiklund, & Shepherd (2005)
finding that firm size as proxied by the number
of employees (EMPLOYE) has also a strong
explanatory power (see Models 1 through 7).
Surprisingly, the estimated coefficient of
liquidity variable (CUR_RATIO) is statistically
insignificant for all model specifications, except
for Model 4. Thus, we have to reject the
hypothesis that firms with more growth
opportunities will keep higherliquidity levelsand
thus will face less severe financing constraints.
Contrary to our expectations the degree of
leverage (as measured by the ratio of total debt
to total assets) a firm uses has no significant
effect on its growth in sales, for all model
specifications. This result doesn’t support the
findings of some recent empirical studies that
SMEs rely on internally generated funds for
assets growth but need access to external capital
to support their growth in sales (see Honjo,
&Haranda, 2006). The empirical results in Table
5 show that the larger the investments in R&D,
patents and copyrights, the smaller the growth in
sales revenues; the estimated coefficients of
growth opportunities variable (INTA_ASSETS)
are negative and strongly significant at 1 and 5
per cent, except for model specification 2. This
result is difficult to explain but we may assume
that although SMEs invest in R&D and other
intangible assets, their impact on current growth
is negative as these are investments with no
immediate but long term payoffs.
The two variables that proxy for a firm’s
productive efficiency (CAP_PROD and
LAB_PROD) show strong explanatory power in
all model specifications; the estimated
coefficients are both positive and statistically
significant at 1 per cent (see Models 1 through
7). We have to read this result with caution as
LAB_PROD variable is significantly correlated
with both sales revenues and capital
productivity (see Table 3). In relation to a firm’s
capability to generate internally capital
Audretsch, &Elston (2002) finds that small and
medium sized firms appear to be more
financially constrained using data on German
firms, while Honjo, &Haranda (2006) find no
such evidence using a sample of Japanese firms.
In our study we find evidence for a relatively
strong and positive relation between a firm’s
cash flow and its sales growth (see Models 1, 2
and 4). When LAB_PROD variable drops from
our analysis, the estimated coefficients of
CF_RATIO variable remain strongly significant
at 1 per cent level of significance. This result
provides further evidence in support of the
hypothesis that internal finance has strong
influence on sales growth, particularly of
younger SMEs, that are more financially
constrained. If it is true, more funds and support
are required for the growth of younger firms
(Honjo, &Haranda, 2006).
The data in Table 5 show that both INFL and
TAX_RATE variables are statistically
significant at 1 per cent and with the expected
signs, whereas RGDP_G variable has no effect
on firm growth. A significantinflation effect
most likely reflects the fact that firm sales
growth is given innominal terms. The negative
effect of TAX_RATE indicates that high levels
of corporate income tax rate in India are
perceived as a significant obstacle for SMEs
growth. As GDP variable is not significant, the
taxrate may be capturing other specific
characteristics. When we drop the
macroeconomic variables from model (1) the
data in Table 5 show that all of the firm-specific
variables (except LEVER) are statistically
significant at 1 per cent and with the expected
signs (see Model 4). As expected, the estimated
coefficients of AGE variable are negative and
statistically significant at the usual levels (see
Models 1 through 4). The two dummies used as
proxies for ownership and the sector a firm
operates drop from the fixed effect
specifications but appear to be statistically
insignificant in other (random effects)
specifications. Thus, we cannot provide
evidence in support of the hypothesis that
growth in manufacturing and service SMEs in
India is strongly associated with firm specific
characteristics such as ownership and industry
sector.

An Econometric Model for Small and Medium Sized Enterprises Growth in India
International Journal of Research in Business Studies and Management V5 ● I10 ● 2018 40
Table5. Operating revenues panel regressions (2014 – 2018), Total Sample
Explanatory
variables
Model 1 Model 2 Model 3 Model 3a Model 4 Model 5 Model 6 Model 7
Fixed
effects
Fixed
effects
Fixed
effects
Random
effects
Fixed
effects
Fixed
effects
Fixed
effects
Fixed
effects
TOT_ASSETS 0.524*** 0.376*** 0.740***
(0.000) (0.000) (0.000)
LEVER 0.050 0.005 -0.016 -0.100 0.083 0.014
(0.540) (0.942) (0.839) (0.542) (0.355) (0.875)
CUR_RATIO 0.009 0.001 -0.011 0.229*** 0.019* -0.010 -0.010
(0.318) (0.983) (0.184) (0.000) (0.054) (0.287) (0.287)
INTA_ASSETS -0.779*** -0.292 -0.415* -3.582*** -1.306*** -0.673 ** -0.676 ** -0.716 **
(0.004) (0.249) (0.100) (0.000) (0.000) (0.025) (0.024) (0.016)
CAP_PROD 0.002*** 0.002*** 0.001** 0.003*** 0.005*** 0.005*** 0.005*** 0.005***
(0.001) (0.005) (0.026) (0.006) (0.000) (0.000) (0.000) (0.000)
LAB_PROD 0.001*** 0.001*** 0.001*** 0.002***
(0.000) (0.000) (0.000) (0.000)
CF_RATIO 0.040** 0.035** 0.011 0.050*** 0.069*** 0.032** 0.033** 0.030**
(0.023) (0.030) (0.502) (0.000) (0.002) (0.039) (0.046) (0.048)
EMPLOYE 0.564*** 0.432*** 0.456*** 0.389*** 0.324*** 0.181*** 0.181*** 0.178***
(0.000) (0.000) (0.0000 (0.000) (0.000) (0.000) (0.000) (0.000)
AGE -0.042 -0.053* -0.048 -0.005** -0.226*** -0.049 -0.048 -0.050
(0.262) (0.074) (0.127) (0.032) (0.000) (0.161) (0.168) (0.156)
INFL 0.106*** 0.125*** 0.110*** 0.132*** 0.132*** 0.133***
(0.000) (0.000) (0.000) (0.000) (0.000) (0.000)
RGDP_G -0.017
(0.311)
TAX_RATE -0.102*** -0.064*** -0.080*** -0.083*** -0.075*** -0.075*** -0.076***
(0.000) (0.000) (0.000) (0.000) (0.000) (0.000) (0.000)
SECTOR (dropped) (dropped) (dropped)
OWNER (dropped) (dropped) (dropped)
R-squared (within) 0.625 0.673 0.655 0.491 0.471 0.538 0.537 0.542
Number of
observations
1440 1440 1440 1999 1440 1440 1440 1440
P-value for
Hausman test5
0.000
Notes
Model 1 - excluding INFL variable; Model 2 –
excluding RGDP_G variable; Model 3 –
excluding TOT_ASSETS and RGDP_G
variables; Model 4 – excluding all
macroeconomic variables; Model 5 – excluding
TOT_ASSETS, LAB_PRODand RGDP_G
variables; Model 6 –excluding LEVER variable;
Model 7 – excluding CUR_RATIO variable, and
3a – Random effects.
All variables except dummies and ratios are in
logs.
*, **, and *** represent significance at 10, 5, and
1 percent, respectively. All regressions include
source country dummies to control for source
country effects.
P-values in brackets.
The null hypothesis for the Hausman test is that
the difference in coefficients between fixed
effects and random effects specifications is not
systematic. Thus a small p-value (<0.05) suggests
the rejection of the random effects specification.
Table6. Total assets panel regressions (2014 – 2018), Total Sample
Explanatory
variables
Model 1 Model 2 Model 3 Model 3a Model 4 Model 5 Model 6 Model 7
Fixed
effects
Fixed
effects
Fixed
effects
Random
effects
Fixed
effects
Fixed
effects
Fixed
effects
Fixed
effects
OP_REVEN 0.212*** 0.176*** 0.233***
(0.000) (0.000) (0.000)
LEVER 0.045 0.026 0.058 -0.189*** 0.049 0.058 0.057 0.060
(0.352) (0.589) (0.222) (0.002) (0.313) (0.232) (0.238) (0.216)
CUR_RATIO -0.030*** -0.031*** -0.033*** 0.072*** -0.029*** -0.033*** -0.033*** -0.034***

An Econometric Model for Small and Medium Sized Enterprises Growth in India
41 International Journal of Research in Business Studies and Management V5 ● I10 ● 2018
(0.000) (0.000) (0.000) (0.000) (0.000) (0.000) (0.000) (0.000)
INTA_ASSETS -0.310* -0.214 -0.170 -1.089*** -0.411** -0.215 -0.214
(0.105) (0.254) (0.400) (0.000) (0.032) (0.290) (0.294)
CAP_PROD -0.001*** -0.001*** -0.001*** 0.001*** -0.001*** -0.001* -0.001* -0.001*
(0.010) (0.007) (0.000) (0.002) (0.002) (0.076) (0.075) (0.079)
LAB_PROD -0.000 0.000 0.001*** 0.001***
(0.970) (0.536) (0.000) (0.000)
CF_RATIO 0.075*** 0.071*** 0.100*** 0.070*** 0.084*** 0.095*** 0.095*** 0.094***
(0.000) (0.000) (0.000) (0.000) (0.000) (0.000) (0.000) (0.000)
EMPLOYE 0.002 -0.013 0.044 0.164*** 0.001 -0.017
(0.929) (0.653) (0.126) (0.000) (0.971) (0.535)
AGE -0.051*** -0.034** -0.032* -0.002*** 0.023** -0.030* -0.029* -0.033*
(0.010) (0.047) (0.071) (0.002) (0.014) (0.100) (0.101) (0.067)
INFL 0.022*** 0.043*** 0.035*** 0.046*** 0.044*** 0.046***
(0.000) (0.000) (0.000) (0.000) (0.000) (0.000)
RGDP_G 0.014
(0.124)
TAX_RATE -0.025*** -0.021*** -0.028*** -0.015*** -0.029*** -0.029*** -0.031***
(0.000) (0.001) (0.000) (0.000) (0.000) (0.000) (0.000)
SECTOR (dropped) (dropped) (dropped) (dropped)
OWNER (dropped) (dropped) (dropped) (dropped)
R-squared
(overall)
0.310 0.330 0.317 0.565 0.332 0.299 0.2967 0.299
Number of
observations
1440 1440 1500 2059 1440 1500 1500 1505
P-value for
Hausman test5
0.000
Notes
Model 1 - excluding INFL variable; Model 2 –
excluding RGDP_G variable; Model 3 –
excluding OP_REVEN and RGDP_G variables;
Model 4 – excluding all macroeconomic
variables; Model 5 – excluding OP_REVEN,
LAB_PROD and RGDP_G variables; Model 6 –
excluding EMPLOYE variable; Model 7 –
excluding INTA_ASSETS variable, and 3a –
Random effects.
All variables except dummies and ratios are in
logs.
*, **, and *** represent significance at 10, 5, and
1 percent, respectively. All regressions include
source country dummies to control for source
country effects.
P-values in brackets.
The null hypothesis for the Hausman test is that
the difference in coefficients between fixed
effects and random effects specifications is not
systematic. Thus a small p-value (<0.05) suggests
the rejection of the random effects specification.
To account for unobservable specific effects in
our model we run also random effects
specification (see Model 3a). The random
effects specificationwould allow us to estimate
the impact of time-invariant variables on growth
and actually provide moreefficient estimates if
the specific effects are not correlated with the
other explanatoryvariables. The Hausman test
shows that we have to reject the random effects
specifications (p-value is less than 0.05).
Thereby, we consider the individualeffects as
fixed. In order to check the model variables for
stationary we use Fisher test for panel unit root
based on an augmented Dickey-Fuller test. The
goal is to show that the variables in the model
we use are time invariant, i.e. there is no
dependence of their values on the time trend.
The p-values of the Fisher tests show that all the
variables are independent of time and we can
conclude that the panel data is stationary.
Next, we run our model specifications using
growth in firm’s total assets as dependant
variable and sales revenues as explanatory
variable. The results are shown in Table 6.
Whereas it is not found that size variable
(EMPLOYE) is significantly related to firm
growth, it is obvious that firm capability to
generate internally capital (as measured by its
cash flow) plays an important role in explaining
the growth in its assets. The estimated
coefficients of CF_RATIO variable are with
positive signs; thus we may propose that growth
in tangible assets is predominantly financed
with internally generated funds rather than
through external sources (LEVER variable is
statistically insignificant in all model
specifications). The effect of short-term
liquidity (CUR_RATIO) on firm growth is very

An Econometric Model for Small and Medium Sized Enterprises Growth in India
International Journal of Research in Business Studies and Management V5 ● I10 ● 2018 42
strong and negative, for all model specifications.
This finding suggests that firms with better
investment opportunities will choose to maintain
lower liquidity in order to support their current
growth. As expected LAB_PROD variable
shows a positive, statistically significant effect
on growth (see Model 3); at the same time
CAP_PROD variable is negatively related to a
firm’s growth. When labor productivity variable
is excluded from our analysis, the effect of
capital productivity (output/capital) becomes
marginally statistically significant (see Models 4
through 7).
The other two variables (OP_REVEN and
INTA_ASSETS) have the expected signs and
are statistically significant at the usual levels of
1 and 10 per cent; when OP_REVEN variable is
excluded from our analysis, the effect of future
growth opportunities become statistically
insignificant (see Models 5 and 6). The variable
that proxies for AGE is negative and statistically
significant for all model specifications, which
further supports our hypothesis that younger
firms are more likely to grow faster than older
ones. As expected, macroeconomic variables
(except for RGDP_G) show a significant effect
on firm growth. The Hausmantest (see Model
3a) shows that we have to reject the random
effects specifications (p-value is less than 0.05
in both cases). Thereby, we consider the
individualeffects as fixed.
In previous models we have observed and
corrected for a correlation between residuals of
order one. Yet, this does not exclude the
possibility for a correlation of higher order,
which would be an evidence of some dynamic
relationship between the variables in the model.
For that purpose, we need a linear dynamic
panel-data model that includes lag of the
dependent variable as explanatory variable and
that contains unobserved panel-level effects,
fixed or random. The Generalized Method of
Moments (GMM) is a suitable choice for that
kind of models, which yields consistent
estimators. GMM is a generalization of the
classical Method of Moments.
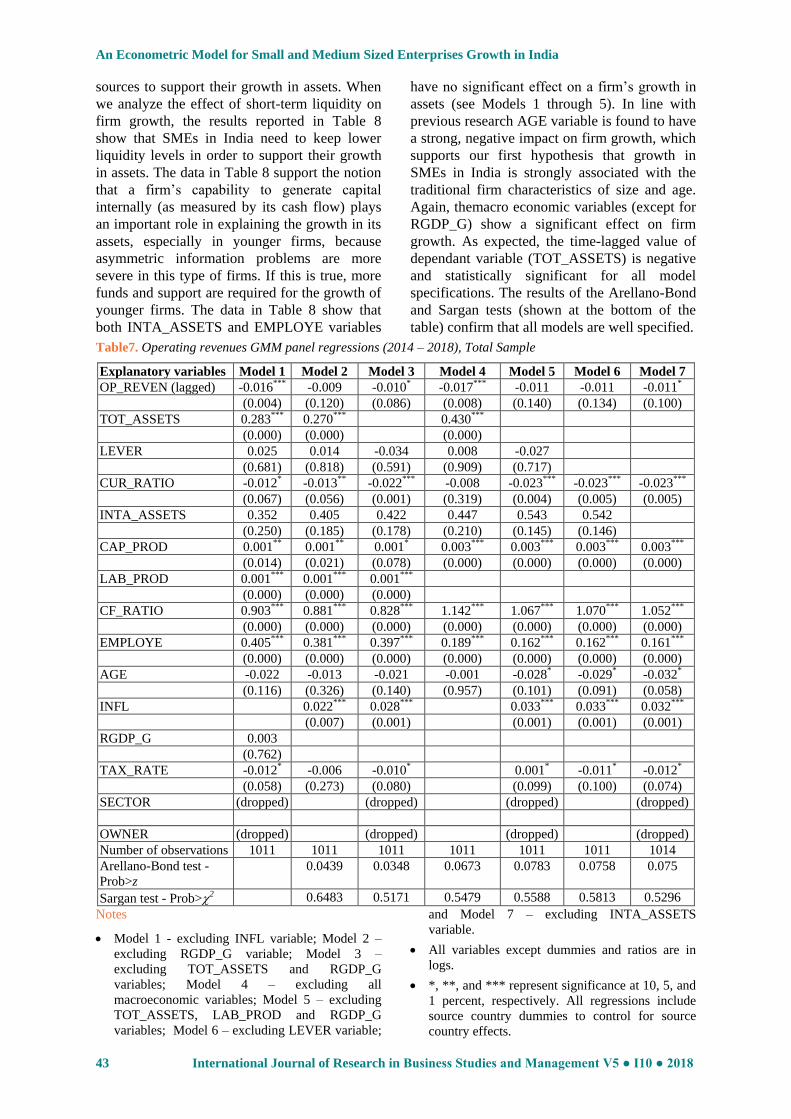
The results are presented in Tables 7 and 8. As
expected the time-lagged value of dependant
variable (OP_REVEN) is negative and
statistically significant for the most of the model
specifications. The data in Table 7 show that
leverage (as measured by that ratio of total debt
to total assets) has no significant effect on a
firm’s growth in sales (the estimated
coefficients of LEVER variable are positive and
statistically insignificant for all model
specifications). Thus, we may argue that for
SMEs in India external finance has less
influence than internally generated funds on a
firm’s potential to grow. This finding is
empirically supported by the fact that a firm’s
capability to generate internally capital (as
measured by its cash flow) is positively
correlated with its growth in sales (see Models 1
through 7). Contrary to our expectations, short-
term liquidity is found to have a negative impact
on growth in sales revenues (all estimated
coefficients except for Model 4 are statistically
significant at 1 per cent). As mentioned earlier,
this finding suggests that firms with better
investment opportunities will choose to maintain
lowerliquidity in order to support their potential
for growth.
Both TOT_ASSETS and EMPLOYE variables
show strong explanatory power in all model
specifications. The estimated results are
consistent with those of the recent empirical
studies (see e.g., Wiklund, & Shepherd, 2005)
that find a positive relation between firm growth
and size (as measured by its total assets or
number of employees). As expected, both
productivity factors (CAP_PROD and
LAB_PROD) show strong explanatory power in
all model specifications. The only two variables
that seem to have no significant effect on firm
growth are intangible assets as proxy for future
growth opportunities, and age (see Models 1
through 4). When LAB_PROD variable is
excluded from our analysis for reasons
explained above the estimated coefficients of
AGE variable become marginally statistically
significant at 10 per cent (see Models 5 through
7). As expected, the two macroeconomic
variables (TAX_RATE and INFL) show a
statistically significant effect on firm growth.
The results of the Arellano-Bond and Sargan
tests (shown at the bottom of the table) confirm
that all models are well specified.
When total assets are used as dependent variable
in our regression analysis we obtain similar
results to those in Table 6. Firm specific
variables such as OP_REVEN, CAP_PROD,
LAB_PROD, and CF_RATIO are statistically
significant at 1 per cent and have the expected
signs. The relation between a firm’s degree of
leverage and its growth is weak (all estimated
coefficients are marginally statistically
significant at 10 per cent and positive), which
result is almost consistent with our hypothesis
that SMEs in India use predominantly internal
An Econometric Model for Small and Medium Sized Enterprises Growth in India
43 International Journal of Research in Business Studies and Management V5 ● I10 ● 2018
sources to support their growth in assets. When
we analyze the effect of short-term liquidity on
firm growth, the results reported in Table 8
show that SMEs in India need to keep lower
liquidity levels in order to support their growth
in assets. The data in Table 8 support the notion
that a firm’s capability to generate capital
internally (as measured by its cash flow) plays
an important role in explaining the growth in its
assets, especially in younger firms, because
asymmetric information problems are more
severe in this type of firms. If this is true, more
funds and support are required for the growth of
younger firms. The data in Table 8 show that
both INTA_ASSETS and EMPLOYE variables
have no significant effect on a firm’s growth in
assets (see Models 1 through 5). In line with
previous research AGE variable is found to have
a strong, negative impact on firm growth, which
supports our first hypothesis that growth in
SMEs in India is strongly associated with the
traditional firm characteristics of size and age.
Again, themacro economic variables (except for
RGDP_G) show a significant effect on firm
growth. As expected, the time-lagged value of
dependant variable (TOT_ASSETS) is negative
and statistically significant for all model
specifications. The results of the Arellano-Bond
and Sargan tests (shown at the bottom of the
table) confirm that all models are well specified.
Table7. Operating revenues GMM panel regressions (2014 – 2018), Total Sample
Explanatory variables Model 1 Model 2 Model 3 Model 4 Model 5 Model 6 Model 7
OP_REVEN (lagged) -0.016*** -0.009 -0.010* -0.017*** -0.011 -0.011 -0.011*
(0.004) (0.120) (0.086) (0.008) (0.140) (0.134) (0.100)
TOT_ASSETS 0.283*** 0.270*** 0.430***
(0.000) (0.000) (0.000)
LEVER 0.025 0.014 -0.034 0.008 -0.027
(0.681) (0.818) (0.591) (0.909) (0.717)
CUR_RATIO -0.012* -0.013** -0.022*** -0.008 -0.023*** -0.023*** -0.023***
(0.067) (0.056) (0.001) (0.319) (0.004) (0.005) (0.005)
INTA_ASSETS 0.352 0.405 0.422 0.447 0.543 0.542
(0.250) (0.185) (0.178) (0.210) (0.145) (0.146)
CAP_PROD 0.001** 0.001** 0.001* 0.003*** 0.003*** 0.003*** 0.003***
(0.014) (0.021) (0.078) (0.000) (0.000) (0.000) (0.000)
LAB_PROD 0.001*** 0.001*** 0.001***
(0.000) (0.000) (0.000)
CF_RATIO 0.903*** 0.881*** 0.828*** 1.142*** 1.067*** 1.070*** 1.052***
(0.000) (0.000) (0.000) (0.000) (0.000) (0.000) (0.000)
EMPLOYE 0.405*** 0.381*** 0.397*** 0.189*** 0.162*** 0.162*** 0.161***
(0.000) (0.000) (0.000) (0.000) (0.000) (0.000) (0.000)
AGE -0.022 -0.013 -0.021 -0.001 -0.028* -0.029* -0.032*
(0.116) (0.326) (0.140) (0.957) (0.101) (0.091) (0.058)
INFL 0.022*** 0.028*** 0.033*** 0.033*** 0.032***
(0.007) (0.001) (0.001) (0.001) (0.001)
RGDP_G 0.003
(0.762)
TAX_RATE -0.012* -0.006 -0.010* 0.001* -0.011* -0.012*
(0.058) (0.273) (0.080) (0.099) (0.100) (0.074)
SECTOR (dropped) (dropped) (dropped) (dropped)
OWNER (dropped) (dropped) (dropped) (dropped)
Number of observations 1011 1011 1011 1011 1011 1011 1014
Arellano-Bond test -
Prob>z
0.0439 0.0348 0.0673 0.0783 0.0758 0.075
Sargan test - Prob>2 0.6483 0.5171 0.5479 0.5588 0.5813 0.5296
Notes
Model 1 - excluding INFL variable; Model 2 –
excluding RGDP_G variable; Model 3 –
excluding TOT_ASSETS and RGDP_G
variables; Model 4 – excluding all
macroeconomic variables; Model 5 – excluding
TOT_ASSETS, LAB_PROD and RGDP_G
variables; Model 6 – excluding LEVER variable;
and Model 7 – excluding INTA_ASSETS
variable.
All variables except dummies and ratios are in
logs.
*, **, and *** represent significance at 10, 5, and
1 percent, respectively. All regressions include
source country dummies to control for source
country effects.

An Econometric Model for Small and Medium Sized Enterprises Growth in India
International Journal of Research in Business Studies and Management V5 ● I10 ● 2018 44
P-values in brackets.
For Arellano-Bond test Ho is: no autocorrelation.
Rejecting the null hypothesis (p-value <0.05) of
no serial correlation at order one in the first-
differenced errors does not imply that the model
is misspecified. Rejecting the null hypothesis at
higher orders implies that the moment conditions
are not valid.
For Sargan test Ho is: over identifying restrictions
are valid. If p-value >0.05, we confirm the null
hypothesis that the over identifying restrictions
are valid. Rejecting the null hypothesis implies
that we need to reconsider our model or our
instruments.
Table8. Total assets GMM panel regressions (2014 – 2018), Total Sample
Explanatory
variables
Model 1 Model 2 Model 3 Model 4 Model 5 Model 6 Model 7 Model 8
TOT_ASSETS
(lagged)
-0.047*** -0.039*** -0.036*** -0.038*** -0.035*** -0.035*** -0.035*** -0.033***
(0.000) (0.000) (0.000) (0.000) (0.001) (0.001) (0.001) (0.001)
OP_REVEN 0.186*** 0.179*** 0.222***
(0.000) (0.000) (0.000)
LEVER 0.073 0.065 0.080* 0.075 0.083* 0.082* 0.083* 0.078*
(0.131) (0.173) (0.104) (0.120) (0.096) (0.101) (0.098) (0.101)
CUR_RATIO -0.031*** -0.031*** -0.035*** -0.029*** -0.036*** -0.036*** -0.036*** -0.036***
(0.000) (0.000) (0.000) (0.000) (0.000) (0.000) (0.000) (0.000)
INTA_ASSETS -0.032 -0.016 0.056 -0.066 0.083 0.080
(0.901) (0.951) (0.835) (0.802) (0.762) (0.770)
CAP_PROD -0.001*** -0.001*** -0.001** -0.001*** -0.001 -0.001 -0.001
(0.004) (0.005) (0.021) (0.006) (0.410) (0.396) (0.416)
LAB_PROD 0.001 0.001 0.001***
(0.152) (0.128) (0.000)
CF_RATIO 0.325*** 0.334*** 0.194*** 0.346*** 0.129* 0.128* 0.134* 0.139**
(0.000) (0.000) (0.006) (0.000) (0.069) (0.071) (0.058) (0.049)
EMPLOYE -0.016 -0.029 0.045 -0.030 -0.015
(0.591) (0.331) (0.118) (0.235) (0.569)
AGE -0.043*** -0.038*** -0.039*** 0.004 -0.040*** -0.039*** 0.043*** -0.042***
(0.000) (0.001) (0.001) (0.571) (0.001) (0.001) (0.000) (0.000)
INFL 0.012** 0.018*** 0.020*** 0.019*** 0.019*** 0.019***
(0.044) (0.004) (0.002) (0.003) (0.002) (0.002)
RGDP_G 0.002
(0.815)
TAX_RATE -0.021*** -0.016*** -0.018*** -0.019*** -0.019*** -0.020*** -0.020***
(0.000) (0.001) (0.000) (0.000) (0.000) (0.000) (0.000)
SECTOR (dropped) (dropped) (dropped)
OWNER (dropped) (dropped) (dropped)
Number of
observations
1097 1097 1097 1097 1097 1097 1097
Arellano-Bond
test - Prob>z
0.0000 0.0000 0.0000 0.0000 0.0000 0.0000 0.0000
Sargan test -
Prob>2
0.0378 0.0725 0.0567 0.0820 0.0980 0.1042 0.1145
Notes
Model 1 - excluding INFL variable; Model 2 –
excluding RGDP_G variable; Model 3 –
excluding OP_REVEN and RGDP_G variables;
Model 4 – excluding all macroeconomic
variables; Model 5 – excluding OP_REVEN,
LAB_PROD and RGDP_G variables; Model 6 –
excluding EMPLOYE variable; Model 7 –
excluding INTA_ASSETS variable, and Model 8
– excluding CAP_PROD variable.
All variables except dummies and ratios are in
logs.
*, **, and *** represent significance at 10, 5, and
1 percent, respectively. All regressions include
source country dummies to control for source
country effects.
P-values in brackets.
For Arellano-Bond test Ho is: no autocorrelation.
Rejecting the null hypothesis (p-value <0.05) of
no serial correlation at order one in the first-
differenced errors does not imply that the model
is misspecified. Rejecting the null hypothesis at
higher orders implies that the moment conditions
are not valid.

An Econometric Model for Small and Medium Sized Enterprises Growth in India
45 International Journal of Research in Business Studies and Management V5 ● I10 ● 2018
For Sargan test Ho is: over identifying restrictions
are valid. If p-value >0.05, we confirm the null
hypothesis that the over identifying restrictions
are valid. Rejecting the null hypothesis implies
that we need to reconsider our model or our
instruments
CONCLUSION
This paper investigates the impact of economy-
wide factors (gross domestic product, inflation,
and tax rate) and firm specific characteristics
(age, size, internal finance, capital structure,
future growth opportunities, liquidity, and factor
productivity) on the growth of small and
medium sized enterprises. Using a panel data
analysis for a set of 560 fast growing SMEs in
India, we find that firm growth is related not
only to the traditional determinants of age and
size but also to other specific characteristics
associated with its financial structure and
productivity. One may argue that small and
medium sized enterprises grow faster in an
economy with better growth opportunities.
Although this is true in general, we don’t find
evidence for a strong correlation between
growth in GDP per capita and firm growth.
Maybe its effect is captured by other
macroeconomic variables such as inflation and
tax rate, which show strong explanatory power
in our analysis. The negative effect of tax rate
indicates that the existing high levels of
corporate income tax rate in India are still an
important obstacle for SMEs growth. In line
with previous research, we find that firm size as
measured by its total assets tend to increase
sales revenues. At the same time, the growth in
the number of employees in these firms has a
marginal impact on their growth in assets.
Further, we find that future growth opportunities
have a negative impact on growth of small and
medium-sized firms; this result is difficult to
explain but we may assume that although SMEs
invest in R&D and other intangible assets, their
impact on current growth is negative as these
are investments with no immediate but long
term payoffs.
Another important finding is that SMEs in India
rely heavily on internally generated funds to
support their growth in sales but also need
access to external capital to support their asset
growth. Thus, we may conclude that firms with
large cash flows will grow faster. Contrary to
our expectations, short-term liquidity is found to
have a negative impact on growth in both sales
revenues and assets. This finding suggests that
firms with better investment opportunities will
choose to maintain lower liquidity in order to
support their current growth. The empirical
results show that both capital and labor
productivity are strongly related to SMEs’
growth (both in sales and assets). This means
that improved factor productivity will generate
larger growth in these firms. In line with
previous empirical studies, age is found to be a
relevant determinant of firm growth; thus we
provide further evidence that younger firms are
more likely to grow faster than older ones. Type
of ownership (that is, whether a firm is publicly-
or privately-held) and the sector a firm operates
(in our case, manufacturing or services), are
both found to have no significant impact on firm
growth.
Our results are relevant for policy makers and
firm managers of SMEs in India. The evidence
shows that small and medium firms in India still
rely on internally generated sources to support
their growth and find it very difficult to
obtainexternal finance. Thus,the governments in
India need to pay an increased attention to the
small and medium enterprises and try to create
an environment that will be beneficial for SME
development. Further, a better understanding of
how firm-specific characteristics impact local
firms’ growth can help managers engage in
more efficient investment decisions related to
their capital structure in order to lower the cost
of capital. Increasing capital and labor
productivity and investing more funds in
research and development (or making a more
efficient use of them) will help SMEs in India
improve their competitiveness and thus, enhance
their growth potential.
Unfortunately, the research does have some
limitations. The most notable one is related to
the lack of complete data for some proxy
variables (e.g., short- and long-term debt) or
variables that provide information for the
educational background and international
experience of SME managers. These variables
are not included in the analysis. The analysis
will benefit if more SMEs with full data record
from different industries are included in the
sample as macroeconomic factors and
firmcharacteristics. This will also require using
a control group (e.g., slower growing or no
growing firms) to compare with faster growing
firms. Finally, the role of public policy and
different legal and institutional obstacles in
explaining SMEs growth in India needs to be
further explored. This would be a step further in
our research.

An Econometric Model for Small and Medium Sized Enterprises Growth in India
International Journal of Research in Business Studies and Management V5 ● I10 ● 2018 46
REFERENCES
[1] Arellano, M., & Bover, O.,2018. ‘La
econometrıґa de datos de panel’,
Investigaciones Econoґmicas 14(1), 3-45.
[2] Arellano, M., & Bond, S., 2011. ‘Some tests of
specification for panel data: Monte Carlo
evidence and an application to employment
equations’, Review of EconomicStudies 58(2),
277-97.
[3] Audretsch, D. B., &Elston J. A., 2012. ‘Does firm
size matter? Evidence on the impact of liquidity
constraints on firm investment behavior in
Germany’, International Journal of Industrial
Organization 20(1), 1-17.
[4] Ayyagari, M., Beck, T., & Demirgüç-Kunt, A.,
2017. ‘Small and medium enterprises across the
globe’, Small Business Economics 29(4), 415-
434.
[5] Becchetti, L., &Trovato, G.,2012.‘The
determinants of growth for small and medium
sized firms: the role of the availability of
external finance’, Small Business Economics
19(4), 291-306.
[6] Beck, T., Demirgüç-Kunt, A., & Maksimovic,
V., 2015. ‘Financial and legal constraints to
growth: does firm size matter?’, The Journal of
Finance Vol. 25(1), 137-177.
[7] Cagliano, R. K., & Spina, G., 2012. ‘A
comparison of practice-performance models
between small Manufacturers and
subcontractors’, International Journal of
Operations and Production Management
22(12), 1367–1388.
[8] Carpenter R. E., & Petersen B. C., 2012. ‘Is the
growth of small firms constrained by internal
finance?’, Review of Economics and Statistics
84(2), 298-309.
[9] Davidsson, P., & Wiklund, J., 2010.
‘Conceptual and empirical challenges in the
study of firm growth’, in D. Sexton & H.
Landström (ed.), The Blackwell handbook of
entrepreneurship, Oxford, MA: Blackwell, 26–
44.
[10] Elston, J. A., 2012. ‘An examination of the
relationship between firm size, growth and
liquidity in the Neuer Market’, Econometrica
38(2), 874–882.
[11] Evans D. S., 2007.‘The relationship between
firm growth, size and age: estimates for 100
manufacturing industries’, The Journal of
Industrial Economics 35(4), 567-581.
[12] Fazzari S. M., Hubbard R. G., & Petersen B.
C.,2008. ‘Financing constraints and corporate
investment’, Brookings Papers of Economic
Activity 8(1), 141-195.
[13] Freel, M. S., & Robson, P. J.A., 2004. ‘Small
firm innovation, growth and performance’,
International Small Business Journal 22(6),
561–575.
[14] Hall, G., Hutchinson, P., & Michaelas, N.,
2010. ‘Industry Effects on the Determinants of
Unquoted SMEs’ Capital Structure’,
International Journal of the Economics of
Business 7(3), 297- 312.
[15] Hall, G., Hutchinson, P., & Michaelas, N.,
2006.‘East and West: differences in SME
capital structure between former Soviet-bloc
and non Soviet-bloc European countries’,
Proceeding of a conference on the international
comparisons in the financing of SMEs,
Warwick Business School, The United
Kingdom, 4-5 April, 268-275.
[16] Hausman, J. A., 2018. ‘Specification tests in
econometrics’, Econometrica 46(1), 1251–
1271.
[17] Hernández-Cánovas, G., & Koëter-Kant, J.,
2008. ‘Debt maturity and relationship lending:
an analysis of European SMEs’, International
Small Business Journal 26(5), 595-617.
[18] Heshmati, A., 2001. ‘On the growth of micro
and small firms: evidence from Sweden’, Small
Business Economics 17(3), 213-228.
[19] Honjo, Y., & Harada, N., 2006. ‘SME policy,
financial structure and firm growth: evidence
from Japan’, Small Business Economies 27(4),
289-300.
[20] Garcıa-Teruel, P. J., & Martınez-Solano, P.,
2008. ‘On the Determinants of SME cash
holdings: evidence from Spain’, Journal of
Business Finance and Accounting 35(1)and (2),
127–149.
[21] Lesáková, L., 2009. ‘Innovations in small and
medium enterprises in Slovakia’, Acta
Polytechnica Hungarica 6(3), 23-34.
[22] Leung S. F., &Yu S., 2016. ‘On the choice
between sample selection and two-part
models’, Journal of Econometrics 72(1-2), 197-
229.
[23] Lumpkin, G. T., & Dess, G. G.,2016.
‘Clarifying the entrepreneurial orientation
construct and linking it to performance’,
Academy of Management Review 21(1), 135–
172.
[24] Lumpkin, G. T., & Dess, G. G., 2011. ‘Linking
two dimensions of entrepreneurial orientation
to firm performance: The moderating role of
environment and industry life cycle’, Journal of
Business Venturing 16(5), 429-451.
[25] Markovics, K., 2005. ‘Competitiveness of
domestic small and medium enterprises in the
European Union’, European Integration Studies
1, 13-24.
[26] Miller, D., 2018. Relating Porter’s business
strategies to environment and structure:
analysis and performance implications’,

An Econometric Model for Small and Medium Sized Enterprises Growth in India
47 International Journal of Research in Business Studies and Management V5 ● I10 ● 2018
Academy of Management Journal 31(2), 280-
308.
[27] Moreno, A. M., & Casillas J. C., 2008.
‘Entrepreneurial orientation and growth of
SMEs: a causal model’, Entrepreneurship
Theory and Practice 32(3), 507-528.
[28] Morone, P., & Testa, G., 2008. ‘Firms growth,
size and innovation – an investigation into the
Italian manufacturing sector’, Economics of
Innovation and New Technology 17(4), 311–
329.
[29] Myers, S. C., &Majluf, N. S.,2014. ‘Corporate
financing and investment decisions when firms
have information that investors do not have’,
Journal of Financial Economics 13(2), 187-221.
[30] OECD, 2009. The impact of the global crisis on
SME and entrepreneurship financing and policy
responses. Centre for Entrepreneurship, SMEs
and Local Development, OECD, Paris.
[31] Ortiz-Molina, H., & Penas, M. F., 2004.
‘Lending to small businesses: the role of loan
maturity in addressing information problems’,
Electronic Markets 8(1), 98–106.
[32] Ozkan, A., & Ozkan, N., 2004. ‘Corporate cash
holdings: an empirical investigation of UK
companies’, Journal of Banking and Finance
28(9), 2103–2134.
[33] Pelham, A. M., & Wilson, D. T., 2016.‘A
longitudinal study of the impact of market
structure, firm structure, strategy, and market
orientation culture on dimensions of smallfirm
performance’, Journal of the Academy of
Marketing Science 24(1), 27-43.
[34] Raymond, L., Bergeron, F., & Blili, S., 2005.
‘The assimilation of E-business in
manufacturing SMEs: determinants and effects
on growth and internationalization’, Electronic
Markets 15(2), 106–118.
[35] Reuber, R., & Fischer, E., 1997. ‘The influence
of the management team’s international
experience on the internationalization behaviors
of SMEs’, Journal of International Business
Study 28(4), 807-825.
[36] Sarno, D., 2008. ‘Capital structure and growth
of the firms in the backward regions of the
South Italy’, Applied Financial Economics
18(10), 821-833.
[37] Sogorb-Mira, F., 2005. ‘How SME uniqueness
affects capital structure: evidence from a 1994–
1998 Spanish data panel’, Small Business
Economics 25(5), 447–457.
[38] Storey, D., 1994. Understanding the small
business sector. London: Routledge.
[39] Timmons, J.A., 1994. New venture creation:
entrepreneurship for the 21st century. McGraw-
Hill/Burr Ridge, Ill: Irwin.
[40] Thornhill, S., Gellatly, G., & Riding, A., 2004.
‘Growth history, knowledge intensity and
capital structure in small firms’, Venture
Capital 6(1), 73-89.
[41] Wagenvoort, R., 2003. ‘Are finance constraints
hindering the growth of SMEs in Europe?’,
Journal of Business Venturing 18(2), 51–91.
[42] Wiboonchutikula, P., 2002.‘Small and medium
enterprises in Thailand: recent trends’, Small
Business Economics 18(1-3), 213-226.
[43] Wiklund, J., & Shepherd, D. A., 2005.
‘Entrepreneurial orientation and small business
performance: a configurational approach’,
Journal of Business Venturing 20(1), 71–91.
[44] Wiklund, J., Holger, P., & Shepherd D. A.,
2009. ‘Building an integrative model of small
business growth’, Small Business Economics
32(4), 351–374.
Citation: Dr. Manoj Kumar “An Econometric Model for Small and Medium Sized Enterprises Growth in
India ". International Journal of Research in Business Studies and Management, vol 5, no. 10, 2018, pp. 30-
47.
Copyright: © 2018 Manoj Kumar. This is an open-access article distributed under the terms of the Creative
Commons Attribution License, which permits unrestricted use, distribution, and reproduction in any
medium, provided the original author and source are credited.