Embed Size (px)
Citation preview

ij.~lii] . . GIANNINI. FOUNDATION
OF AGRICULTURAL '"'---!~ UNIVERSITY OFf----l-----1--'
ECONOMICS _..___-'--_ CALIFORl\llA
An Economic Analysis of the California Thoroughbred Racing Indushy
Harold 0. Cartei;. Lawrence E. Shepard, and Marilyn Whitney
DIVISION OF AGRICULTURE AND NATURAL RESOURCES CALIFORNIA AGRICULTURAL EXPERIMENT ST A TION

AN ECONOMIC ANALYSIS OF THE CALIFORNIA THOROUGHBRED RACING INDUSTRY
Principal Investigators:
Harold 0. Carter Lawrence E. Shepard Marilyn D. Whitney Professor Professor Assistant Professor
Project Coordinators: Contributor:
Kathryn Blackman Perry Poe Rex K. Craft Research Assistant
Research Assistants
Department of Agricultural Economics University of California, Davis
ACKNOWLEDGEMENTS
This report on the California Thoroughbred horse racing industry represents the first phase of a comprehensive economic study of the California horse industry. We wish to acknowledge the encouragement, cooperation and generous financial support of the following organizations necessary for carrying out the study:
California Horsemen's Benevolent and Protective Association California Thoroughbred Breeders Association Bay Meadows Racing Association Del Mar Thoroughbred Oub Hollywood Park Operating Company Los Angeles Turf Club Oak Tree Racing Association Pacific Racing Association
We extend special thanks to the many horse breeders, trainers and owners for completing questionnaires and providing valuable background information important to the study. Personnel in the office of the California Horse Racing Board were helpful in providing data necessary for the analysis of the Racing Associations.
Insightful and constructive comments on preliminary drafts of this report were provided by Professor James Ahem, California State University, San Luis Obispo; Will E. Cummings, Managing Director, Christiansen/ Cummings Associates, Inc., and two anonymous reviewers.
Dr. Carole Nuckton provided editorial support and contributed in many ways to the project. John Woolcott handled budgetary matters and staff coordination. Pauline Ljubi skillfully and patiently worked with multiple authors in preparation of the manuscript. Kim Yasuda prepared the final copy.

TABLE OF CONTENTS
Acknowledgements ......................................................................................... , ............................................................... i ·. Executive Summary................................................................................................................................................ viii
Chapter 1. Introduction ........................................................................................................................................... 1
Literature Review .......................................................................................................................... 1
Overview of Industry .................................................................................................................... 2
Chapter 2. The Horse Sector ................................................................................................................................... 4
Prior Research on the Horse Industry ........................................................................................ 4
Organization and Economic Structure ....................................................................................... 6
Economic Profile of the Horse Sector, 1989 ............................................................................. 15
Summary and Conclusions ................... , ............................................................................... : .... 35
Chapter 3. Racing Associations ............................................................................................................................ 37
Prior Research on Racing Associations .................................................................................... 37
Organization and Economic Structure ..................................................................................... 38
Economic Contribution of the Thoroughbred Associations ...; .............................................. 44
Summary and Conclusions ........................................................................................................ 54
Chapter 4. The Demand for Thoroughbred Racing in California ................................................................ 56
Prior Research on Economic Determinants of Racing Demand ........................................... 56
Graphical Overview of Factors Affecting Demand for
California Thoroughbred Racing ....................................................................................... 59
Empirical Analysis of the Demand for Thoroughbred Racing in California ...................... 67
Regression Results and Statistical Analysis ............................................................................. 69
Summary and Policy Implications ............................................................................................ 76
Chapter 5. Total Economic Impact of the Thoroughbred Racing Industry on State and Local Economies
Government Revenues ................................................................................................................ 79
Industry Revenues ....................................................................................................................... 80
Indirect Economic Impact ........................................................................................................... 80
Employment and Cash Aow ...................................................................................................... 81
Investment .................................................................................................................................... 83
Summary and Conclusions ........................................................................................................ 83
ii

TABLE OF CONTENTS (cont.)
Appendices:
A-1 through A-3. Survey Forms .................................................................................................... 84
B-1. Appraisal (Executive Summary) ......................................................................................... 124
C-1 through C-3. Data Behind Figures (Chapters 2-5) ............................................................. 129
D-1. A Note on Elasticities ......................................................................................................... 139
iii

FIGURES
I'
Figure 1-1. The ~alifornia Thoroughbred Racing Industry Flowchart ............................................................. 2
Figure 2-1. Organization of the Horse Sector ....................................................................................................... 5
Figure 2-2. The Race Horse Production Process ................................................................................................... 6
Figure 2-3. Designated Geographic Regions for the Thoroughbred Industry in California ......................... 7
Figure 2-4. Number of Racing Days for Major Thoroughbred Race Meetings (A) and Fair Race Meetings (B) in Northern and Southern California, 1953-1989 ............................................. 9
Figure 2-5. Number of Foals Registered with the Jockey Club in the Top Three States {A) and in the United States and Canada (B), 1965-1988 .................................................................... , ................... 11
Figure 2-6. Total Purse Money Paid for Major Race Meetings in Northern and Southern California in Nominal DoHars (A) and Real Dollars (B), 1953-1988 ................................................................... 12
Figure 2-7. Average Purse Per Race for Major Race Meetings in Northern and Southern California in Nominal Dollars (A) and Real Dollars (B), 1953-1988 ................................................................... 14
Figure 2-8. Total Incentive Awards Paid to California Horse People, in Nominal and Real Dollars, 1970-1989 ............................................................................................................................... 15
Figure 2-9. Value of Horses Sold Through Public Auctions and Claiming Races in California, 1983-1989 .......................................................................................................................... 16
Figure 2-10. Cash Flow in Horse Sector ................................................................................................................ 23
Figure 3-1. Structure of Three Major Thoroughbred Racing Organizations .................................................. 40
Figure 3-2. Location of Satellite Wagering Facilities in California, 1989 ........................................................ 43
Figure 3-3. Total Pari-Mutuel Revenue Retained by Major Thoroughbred Racing Associations, Nominal and Real Dollars, 1965-1989 .................................................................. : ........................... 44
Figure 3-4. Total and On-Track Attendance, 1953-1989 .................................................................................... 45
Figure 3-5. Approximate Breakdown of Association Revenue, California, 1989 .......................................... 47
Figure 3-6. Pari-Mutuel Revenue Retained by Major Thoroughbred Racing Associations Per Day, Nominal and Real Dollars, 1965-1989 .............................................................................................. 47
Figure 3-7. Approximate Breakdown of California Association Expenditures (A) and Breakdown of the Category "Other" (B), 1989 ..................................................................................................... 48
iv
FIGURES (cont.)
Figure4-1. Total Handle, Nominal and Real Dollars, California, 1953-1989 ............................................... ,. 59
Figure4-2. On-Track Handle, Nominal and Real Dollars, California, 1953-1989 ......................................... 60
Figure 4-3. Total and On-Track Attendance, California, 1953-1989 ................................................................ 61
Figure 4-4. On-Track Handle Per Patron, Nominal and Real Dollars, California, 1953-1989 ..................... 61
Figure 4-5. California Population, 1953-1989 ...................................................................................................... 62
Figure4-6. California Per Capita Attendance, 1953-1989 ................................................................................. 62
Figure4-7. Racing Days On-Track (A) and Off-Track (B), California, 1953-1989 ......................................... 63
Figure 4-8. Annual California Lottery Sales, 1985-1989 .................................................................................... 64
Figure4-9. On-Track Handle Per Day, Nominal and Real Dollars, California, 1953-1989 .......................... 65
Figure 4-10. Real Income Per Capita, California, 1953-1989 ............................................................................... 65
Figure 4-11. Effective Takeout Rate, California, 1953-1989 ................................................................................ 66
Figure 4-12. Takeout Rates on Conventional and Exotic Bets, California, 1968-1989 ..................................... 66
v

TABLES
Table 2-L Average Daily Purse Lead~rs, California Thoroughbred Tracks, 1988 ...................................... 13
Table 2-2. 'Estimated Year Round Average Number of Horses in Training, California, 1989 ................... 17
Table 2-3. Estimated Average Number of Thoroughbred Breeding Stock and Young Horses in California, 1989 ................................................................................................................................... 18
Table 2-4. Estimated Number of Hired Employees and Average Monthly Base Pay at California Tracks and Major Training Centers, 1989 ........................................................................................ 19
Table 2-5. Estimated Number of Professionals or Self-Employed at California Tracks and Major Training Centers, 1989 ........................................................................................................................ 20
Table 2-6. Number of Thoroughbred Active Licenses by Occupational Group in California, 1989 ......... 20
Table 2-7. Estimated Number of Persons Employed and Average Monthly Salaries for Thoroughbred Farms and Ranches in California, 1989 ................................................................. 21
Table 2-8. Summary of Estimated Total Employment in the California Thoroughbred Horse Sector, 1989 ........................................................................................................................................... 22
Table 2-9. Estimated Average Daily Training Rates and Average Daily Lay Up/Tum Out Rates in California, 1989 .................................................................................................................................... 24
Table 2-10. Estimated Owner Aggregate Expenditures for Thoroughbred Horses in Training at California Race Tracks and Major Training Centers, 1989 ........................................................... 24
Table 2-11. Estimated Aggregate Payments Made by Owners of Thoroughbred Racing Stock to Farms and Ranches in California, 1989 ............................................................................................ 25
Table 2-12. Estimated Aggregate Expenditures (Other Than Training and Board) by Owners of Thoroughbred Racing Stock Kept on Farms and Ranches in California, 1989 .......................... 25
Table 2-13. Estimated Aggregate Thoroughbred Trainer Expenditures in California, 1989 ....................... 26
Table 2-14. Net Cash Flow to California Trainers, 1989 .................................................................................... 27
Table 2-15. Average Per Day Board, Breaking, and Training Rates for Thoroughbred Farms and Ranches in California, 1989 ............................................................................................................... 27
Table 2-16. Estimated Aggregate Payments Made by Owners of Thoroughbred Breeding Stock and Young Horses to Farms and Ranches in California, 1989 ............................................................. 28
Table 2-17. Estimated Aggregate Expenditures (Other than Board) Made by Owners of Thoroughbred Breeding Stock and Young Horses in California, 1989 .................................................................. 29
Table 2-18. Estimated Aggregate Expenditures Made by California Thoroughbred Farms and Ranches, 1989 ....................................................................................................................................... 29
Table 2-19A. Summary of Estimated Cash Flows in the California Thoroughbred Horse Sector, 1989 ....... 30
Table 2-19B. S~mmary of Estimated Cash Flows in the California Thoroughbred Horse Sector, 1989 ....... 31
Table 2-19C. Summary of Estimated Cash.Flows in the California Thoroughbred Horse Sector, 1989 ....... 31
Table 2-20. Estimated Average Market Value of Thoroughbred Horses in California by Region and_ Their Estimated Total Value, 1989 .................................................................................................... 32
vi

TABLES (cont.)
Table 2-21. Estimated Average Market Value of Thoroughbred Horses Stabled at California Race Tracks by Region and Their Estimated Total Value, 1989 ............................................................ 32
Table 2-22 Land in Thoroughbred Farms and Ranches in California, 1989 .................................................. 33
Table 2-23 Estimated Market Value of Thoroughbred Farm and Ranch Assets in California, 1989 ......... 33
Table 2-24 Summary of Key Results from Chapter 2 ............ ; ........................................................................... 34
Table 3-1. Summary Information on Major California Thoroughbred Tracks, 1989 ................................. 39
Table 3-2. Summary Statistics on Satellite Wagering Facilities in California, 1985-1989 ........................... 42
Table 3-3. Aggregate Revenues and Expenses for the Six Major Thoroughbred Racing Associations in California, 1989 ............................................................................................................................... 46
Table 3-4. Estimated Payments to Governments by California Thoroughbred Racing Associations, 1989 ............................................................................................................................... 49
Table 3-5. Handle, Attendance, and Racing Days by Association, California, 1989 ................................... 49
Table 3-6. Handle Per Patron; Average Daily Handle and Attendance, by Association, California, 1989 .................................................................................................................................... 50
Table 3-7. Estimated Employment in the Association Subsector, California, 1989 ..................................... 51
Table 3-8. Aggregate Returns and Adjusted Returns from Racing to California Thoroughbred Associations, 1987-1989 ...................................................................................................................... 52
Table 4-1. Definitions of Variables ...................................................................................................................... 69
Table 4-2. Estimated Demand for On-track Attendance and Pari-Mutuel Wagering at Major California Thoroughbred Race Tracks, 1953-1989 ......................................................................... 70
Table4-3. Estimated Demand for Attendance and Pari-Mutuel Wagering at Major California Thoroughbred Race Tracks and Satellite Facilities, Statewide Data, 1953-1989 ....................... 71
Table4-4. Determinants of Variables for Track-Specific Econometric Model ............................................. 73
Table4-5. Estimated Demand for Pari-Mutuel Betting at Major California Thoroughbred Race Tracks, Track-Specific Data, 1970-1988 ............................................................................................ 74
Table 5-1. Estimated Government Revenues From the California Thoroughbred Horse Racing Industry, 1989 .:........................................................... : ........................................................................ 79
Table5-2. Estimated Revenues of the California Thoroughbred Horse Racing Industry, 1989 ................ 80
Table 5-3. Estimated Employment in the California Thoroughbred Horse Racing Industry, 1989 .......... 81
Table 5-4. Estimated Payments for Goods and Services by the California Thoroughbred Horse Racing Industry, 1989 ...................................................................................................................................... 82
Table5-5. Estimated Investment in the California Thoroughbred Horse Racing Industry, 1989 ............. 82
vii

Executive Summary
This report has two broad objectives. The first is to examine California's Thoroughbred horse racing industry and determine its economic impact on state apd local economies. The second objective involves exploring state regulatory aspects of the racing industry, assessing its profitability, investigating the factors influencing the demand for racing, and addressing related policy issues facing the industry.
This is a particularly pertinent time to study the Thoroughbred industry inCalifornia. The legalization of parimutuel wagering on horse racing in California in 1933 fostered the growth and development of a large and diverse Thoroughbred racing industry. However, in recent years the racing industry has faced serious challenges, including increased competition from other spectator sports and the introduction of the state lottery. In addition, the authorization of simulcast wagering represents a significant structural change for the industry. Further change is imminent as the racing associations face rising pressure for the development of their real estate assets. The interplay ofsuch forces promises to shape, and perhaps to radically alter, the Thoroughbred racing industry in the decade of the 1990s and beyond.
Demand for Thoroughbred racing originates with the viewing and wagering public. Thoroughbred racing is supplied jointly by the horse owners and the racing associations, under state regulation. Therefore, inconducting this study four principal participants in the Thoroughbred horse racing industry have been identified: the horse · sector, the racing associations, the bettors and/or spectators, and the State of California.
All industry participants are linked by the pari-mutuel pool-the total amount of money legally wagered. The majority of the pari-mutuel pool (approximately 81 percent in 1989) is returned to the winning bettors. The remainder, called the "takeout," is retained and divided among the other three participants. The pari-mutuel pool is the primary source of funds for all sectors of the industry (and its supporting firms and industries) and also contributes revenues to the state.
Besides sharing in the takeout, the state controls the terms under which the industry functions. Thus, state policies affect the flow of revenues into the industry and their distribution among industry participants.
Following the introductory chapter, this report presents chapters on the horse sector, the racing associations, the demand for racing1 and the total economic impact on state and local economies. Major findings from each chapter are summarized below.
The Horse Sector Approximately 100 commercial Thoroughbred farms and ranches are dispersed throughout the state of California. Estimates indicate that there could be up to 450 more private farms and ranches, although most of these are relatively small. About 24,000 acres were devoted to the production, care and development of Thoroughbred race horses in California in 1989; the estimated market value of these farms and ranches, including land and other assets, was $386.5 million.
California breeders have ranked second to Kentucky in the production of Thoroughbreds for many years, with approximately 12 percent of the U.S. and Canadian total over the past 10 years. Along with the rest of the nation, California experienced high growth rates in Thoroughbred production during the late 1970s and early 1980s. However, California production peaked in 1985 and has declined gradually each year through 1989.
There were approximately 33,880 Thoroughbred horses in California, on average, with an estimated market value of some $712.7 million in 1989. This includes approximately 770 stallions and 9,300 broodmares held for breeding race horses; 5,580 foals (or weanlings) and 4,880 yearlings held as potential race horses; and 13,350 Thoroughbred horses two years old and older held for racing. Approximately 8,900 of the race horses were in active training for racing, with the remainder being laid up, turned out, or otherwise waiting to begin training.
The horse sector has three primary sources of revenue: purse money, breeder incentive awards, and the sale of horses. The initial amount of money entering the horse sector from the joint pari-mutuel pool of all Thoroughbred racing in the state was estimated .to be $131.5 million in 1989. Of this amount, approximately $3.6 million went to horsemen's organizations (the CHBPA and CTBA), $11.2 million was awarded to California horsemen through the. incentive award programs, and $116.7 million was distributed as purses.
Average daily purses paid at the major California race meetings have long been among the highest in the nation. Although total purse money has been increasing at a substantial rate inCalifornia, average purse money per race, in real dollars, shows only a very slight upward trend in the south and no change in the north.
The horse sector of California's Thoroughbred racing industry made payments of approximately $255 million to households and other industries for goods and services in 1989. In addition, the sector generated at least $14.4
viii

million in state and local government revenues, and employers made additional payments of approximately $6 million for payroll taxes (these are primarily to the federal government).
The Thoroughbred industry also generates large intra-sector cash flows. Approximately $193.7 million were paid for board and training, stallion services, and nomination and entry fees in 1989. Al though no estimates are available documenting private horse sales, total Thoroughbred auction sales in California during 1989 came to about $28 million and sales through claiming races were just over $33 million.
The horse sector provides a variety of full and part time employment opportunities for a wide range of skill, income, and status levels. Estimates indicate that the horse sector provided at least 6,480 full time equivalent jobs in 1989. Approximately 3,525 were employed by trainers on race tracks or major training centers and about 1,880 were employed on farms and ranches, on a FTE basis. Another 1,030 were professionals or self-employed (i.e. trainers, jockeys, veterinarians, farriers, and others) and tD.e remaining 45 were employed by horsemen's organizations.
Although millions of dollars are invested and spent, it appears that business is not profitable for many horse · people. A comparison of revenue going into the horse sector from the pari-mutuel pool ($131.5 million) and total expenditures leaving the sector ($275.3 million) suggests a substantial negative cash flow for the horse sector in aggregate. The results of the survey of horse people provide additional supporting evidence for this negative profitability assessment. Almost 90 percent of the horse owners and 55 percent of the commercial farms surveyed reported that, on average, over the past five years they had lost money on their Thoroughbred related activities. Furthermore, many trainers reported difficulty in maintaining a viable business, with costs increasing faster than returns.
The Racing Associations The Thoroughbred racing associations perform anessential role in the Thoroughbred horse racing industry-they bring together the racing patrons with the horse sector and produce the horse racing event. As part of this function, they provide and maintain the race track and spectator and wagering facilities (grandstands, parimutuel equipment, etc.). They also provide services for the racing patrons such as parking, racing programs, and food and beverage outlets. For the horse sector, they provide and maintain facilities to stable and train the horses. In addition, the associations collect and distribute all pari-mutuel revenues.
Over90percent of the statewide Thoroughbred handle is generated bysix racing associations that conduct their meets at the five major Thoroughbred tracks in California: Bay Meadows, Golden Gate Fields, Del Mar, Hollywood Park, and Santa Anita. Thoroughbred racing is also conducted in conjunction with the state fair and county fairs throughout California.
In meeting the demand for Thoroughbred racing, the associations generated total aggregate annual revenues in excess of $210 million in 1989. Association revenues are derived from two major sources: pari-mutuel activities (approximately 60% of the total revenue earned in 1989) and spectator services (which includes such charges as admission and parking fees).
In 1989, the associations spent approximately $197 million conducting the business of horse racing. The largest expense of the associations is wages, salaries, and benefits for the personnel required to effectively conduct the Thoroughbred meets. Surveys of the associations provided a glimpse of the diverse and highly unionized work
· force that fills approximately 3,680 full-time equivalent jobs within the state. The profitability of the racing associations is an important issue to all Thoroughbred horse racing participants,
including the state. Because of their essential role, the economic viability of the racing associations is critical to the entire industry. This is an especially significant issue today because the four privately owned tracks face pressures for development of their large urban real estate holdings.
After adjustments are made to reflect the distinct corporate structure of racing organizations, it appears that the five major Thoroughbred tracks produce annual average net pretax return of approximately $48.5 million on Thoroughbred horse racing activities. Those tracks have an appraised estimated market value of $810 million. Therefore, the return on these assets is estimated to be approximately 6 percent, and certainly within the range of 4 to 8 percent. This rate is no more than half the average pretax rate of return realized in industries of similar focus, risk and scale.
The rapid appreciation of track real estate assets, coupled with increased competition for spectator and wagering dollars since the state franchise was granted to horse racing, appears to have reduced returns to operating Thoroughbred racing below competitive levels. This is true despite the recent augmentation to total handle provided by off-track wagering. The future of the racing associations and of the broader Thoroughbred industry is clouded both by long term trends in industry demand and by the fact that association returns increasingly derive from holding rather than operating track assets.
ix

The Demand for Racing Public racing events are the primary marketed output of the California Thoroughbred racing industry. The level of public demand for attending and wagering on horse races determines the size of the pari-mutuel pool, thus affecting the economic health of the industry as a whole. An increase in public demand for racing activities results in larger purses for winning horse owners and larger commissions and attendance-related revenues for the racing associations. These additional revenues in ttµn stimulate the demand for inputs such as feed and labor. The State of California is also concerned withpublic demand for racing activities, since most revenues it collects from racing are based on a percenrage of the total amount wagered, or handle.
Total attendance at Thoroughbred races has grown quite steadily over most of the 1953-1989 period and increased sharply in 1988, reflecting a surge in attendance at satellite wagering facilities. However, on a per capita basis attendance declined sharply during the 1950s and early 1960s, which would have represented a serious decline in overall demand had not population growth cushioned its impact. From 1967 through 1979, per capita attendance fluctuated about a slight upward trend. Beginning in 1980, a strong upsurge in total (on- and off-track combined} per capita attendance has occurred. On-track attendance has dropped noticeably since the introduction of satellite wagering and the California lottery.
In nominal terms, total handle (including both on-track and off-track activity) has grown more than sevenfold over the 1953-1989 period. On a real basis, growth has been far less dramatic, showing some strength during the 1960s, a slight downturn in the late 1970s, and renewed strength in 1988, while remaining essentially flat in other years. On-track handle dropped by approximately $400 million in real terms between 1985 and 1989, while total handle including satellite wagering rose by less than half that amount. It appears that satellite wagering may be capturing a portion of the handle that otherwise would have been wagered on-track.
One measure of the "price" of pari-mutuel wagering is the effective takeout rate, which is controlled by state legislation. This rate has risen by more than four percentage points since 1953, implying that bettors are paying a significantly higher price to wager than was true in earlier years.
Perhaps the most notable finding from the demand analysis is that total pari-mutuel revenues are very responsive to changes in the effective takeout rate. In economic terms, the demand for wagering is found to be highly elastic with respect to the "price" of a typical wager. This result indicates that pari-mutuel revenues can be enhanced by reducing the current effective takeout rate.
The supply of racing days has increased steadily over time, as the state legislature periodically allows more racing. A one-percentincreasein the number oflive racing days is estimated to increase total handle by an average of between .36 and .76 percent. However, because the current racing calendar offers little opportunity for further increases in live racing days without overlapping race meets, this policy variable is not likely to provide an important source of new revenues.
The market environment in which Thoroughbred racing competes for customers has recently undergone rapid change. Since the introduction of off-track wagering in 1985, satellite racing days have increased precipitously, from zero to over 5,000 days offered per annum. A one-percent expansion in the number of satellite racing days is found to have little effect on total handle, suggesting that, in general, the current supply of satellite wagering days is adequate. This does not rule out the possibility that expansion into selected new markets may enhance handle and revenues. Increases in satellite racing days reduce on-track attendance; the effect is small but highly statistically significant. Since on-track attendance generates more attendance-related revenues (admission fees, parking fees and concession sales) per patron than does attendance at satellite facilities, an effort should be made to minimize further competition between satellite and on-track facilities.
Another form oflegal gambling, the California state lottery, has also become available only since 1985. We find some evidence that sales of California lottery tickets have a negative impact on Thoroughbred wagering activity, but these effects are small in magnitude and not statistically significant. Based on only the first five years of the lottery's existence, it appears that racing and the lottery compete for wagering dollars, but are not viewed as close substitutes by the public.
A variable that indicates whether Pick Six and/or Pick Nine wagering was offered at each track during a given year was included in the analysis of track-specific data. This variable was associated with a decline in wager per attendee of approximately $40. This negative effect may reflect a reduction of the "churn"; dollars wagered on such bets are temporarily unavailable for rewagering on later races. The negative relationship may also reflect other changes in consumer behavior that coincide in time with the introduction of these types of wagers. Although this finding suggests that Pick Six and Pick Nine wagering can reduce total handle, it may be advisable to continue offering these types of wagers to avoid generating dissatisfaction among the wagering public.
x

Total Economic Impacts on State and Local Economies The Thoroughbred horse industry is important to the State of California and many of its residents-it is an important source of revenue for the state, it creates a significant number of jobs, and it generates large cash flows and economic activity. Additionally, the industry provides recreation for thousands of racing fans.
Revenue generated for state and local governments by the Thoroughbred horse industry in 1989 amounted to almost $164 million. The majority of this revenue came from the portion of the pari-mutuel handle which the state retains in the form of licence fees ($137.5 million). The state also received about $10.6 million from sales taxes, fines and occupational licence fees. Local governments collected about $15.8 million in the form of property taxes, admission taxes and local licence fees.
The horse sector and racing associations collected revenue from all sources of about $341.5 million in 1989. Of these total receipts, almost $265.8 million came from the pari-mutuel handle ($131.5 million for the horse sector and $134.3 million for racing associations). The remainder of the receipts include track admissions ($28.9 million) and other race track patron services ($46.8 million). The ripple or multiplier effect of these receipts on the state economy is a factor of 1.76 for the associations and 5.20 for the horse sector, resulting ina total income contribution of $1,053.5 million.
The number and diversity of jobs of differing skills required to support a complex Thoroughbred racing industry is impressive. About 6,480 full time equivalent jobs are required in the horse sector alone. Another 3,680 FfE workers are employed by the racing associations for a total industry number of 10,160 FTE jobs.
The total investment in Thoroughbred horses, farms and ranches, and race track facilities approaches $2 billion. This figure includes a market value of California Thoroughbred horses of some $712.7 million in 1989. The estimated market value of Thoroughbred farms and ranches in the state, including land and other assets, was $386.5 million. Race tracks were appraised at $810 million.
xi

AN ECONOMIC ANALYSIS OF THE CALIFORNIA THOROUGHBRED RACING INDUSTRY
Chapter 1. Introduction
The colorful history of Thoroughbred racing in California extends back to the mid-l800s. While horse racing has always attracted an enthusiastic following, the industry suffered for nearly 25 years during a ban on wagering activity that began in 1909. However, the legalization of pari-mutuel wagering on horse racing in California in 1933 fostered the growth of a large and diverse industry centered on producing and supplying Thoroughbred racing in the state.1 This industry is important to the State of California and many of its residents-it is an important source of revenue for the state, it creates a significant number of jobs, it generates large cash flows and economic activity, and it provides recreation for thousands of racing fans. Despite the size and long history of the California Thoroughbred horse racing industry, relatively little recent information exists as to its organization and economic contribution.
This report has two broad objectives. The first is to examine California's Thoroughbred horse racing industry and determine its economicimpact on state and local economies. The second objective involves exploring state regulatory aspects of the racing industry, assessing its profitability, investigating the factors influencing the demand for racing, and addressing related policy issues facing the industry. More specifically, the objectives of the study are as follows:
Objectives
1. To measure the cash flows generated by the Thoroughbred racing industry. .
2. To determine the level of investment in the Thoroughbred racing industry.
3. To determine the level and nature of employment generated by the Thoroughbred racing industry.
4. To estimate the direct and indirect effects of the Thoroughbred racingindustryonstateand local economies.
5. To investigate the profitability of the Thoroughbred racing industry.
6. To estimate the factors having important effects
on the demand for racing and the viability of the industry.
Literature Review Previous studies of the horse industry in the United States range from descriptive census work, to relatively more sophisticated industry impact analyses. While a number of authors have considered the entire equine industry within a state (all breeds of horses, donkeys, and mules), the majority of the work has centered on the racing industry. This report contains separate chapters for each of the major participant . groups in the California Thoroughbred racing industry. Because most of the prior research work has concentrated on one sector of the industry, each chapter in this report will include a section reviewing the literature pertaining directly to that sector. In this section,we will briefly summarize the few studies that take a comprehensive look at all sectors of the industry.
In 1965, the Stanford Research Institute (SRI) produced a comprehensive study of the horse racing industry in California. The SRI study includes detailed information on all sectors of the horse racing industry, encompassing Quarterhorse and harness racing as well as the Thoroughbred industry. In addition to the horse sector, the SRI report addresses issues such as association profitability and consumer demand. The study concluded with several concerns, chief among them being the slow rate ofgrowthof the industry, the lack of profitability for the state's horsemen, and the decline of the physical assets of the racing associations. Although the SRI report was published more than 25 years ago, it provides an extremely useful benchmark for future work.
Between 1977 and 1982, studies by the California Department of Finance (1977); Temple, Baker and Sloan (1979); and the Commission of California State Government Organization and Economy (1982) analyzed various state policies that affect the quantity of racing allowed in California, and the distribution of the pari-mutuel pool. The Department of Finance study focused on tax policies that would maximize
1p .and an-~~tuel wag~ring is a form of gambling wherein all wagering at each track is handled by a central authority the track the b~~~ m 0 bl~en~h' P?~l; the odds on each ~orse are th~n ~~ermmed according to the support which each rec~ives fro~
mg pu ic. is ism contrast to gambhng among md1viduals or between mdividuafs and bookmakers.

state revenues from horse racing. Temple, Barker and Sloan (TBS) noted two discouraging industry trends: the state's horsemen and the racing associations were experiencing financial difficulties, and there had been a downward trend in daily attendance. The authors recommended that the takeout rate be reduced and redistributed to reverse these trends. The'tommission of California State Government Organization and Economy responded after legislation had been modified upon the recommendation of TBS, concluding that the distribution of pari-mutuel revenues had been too heavily weighted towards the associations.
There have also been several comprehensive studies produced by researchers in the other racing states. Lawrence (1972) analyzed the economic activity of the major participant groups in Maryland's horse racing industry. A particularly comprehensive descriptive study on pari-mutuel horse racing and breeding in New York state was published by Cain and his associates in 1982. Killingsworth Associates (1984) studied the racingindustry inWashington state, taking a broad view of the racing industry and making several policy recommendations.
The authors of these studies reached common conclusions. They stressed the importance of the economic activity generated by the racing and breeding industries in their respective states. However, they also emphasized that nearly all participants in the racing industry were experiencing varying degrees of financial stress. In addition, the authors pointed to the fact that the market base for the industry is shrinking relative to the general population of the state. All of these issues are of concern to the racing industries in everystate, as the participant groups struggle to thrive in an increasingly complex environment.
Overview of Industry For purposes of this study we have identified four principal participants in the Thoroughbred horse racing industry: the horse sector, the racing associations, the bettors and/or spectators, and the state. The organization and general flow of dollars, goods, and services in the Thoroughbred industry is illustrated in Figure 1-1. Each of the four principal participants is linked by the pari-mutuel pool-the total amount of money legally wagered on Thoroughbred horse rac-
Figure 1-1. The California Thoroughbred Racing Industry Flowchart
,_..IJ--1~~~-==-~~~
Racing Associations
Services
Horses
Horse Sector
Wagering Public
Wagers
Fees Services Commissions & Breakage
State of California
Licensing Fees & Breakage
Licensing Fees, Fines, Taxes
Inputs
Labor, Land, Equipment, Etc.
Inputs
Labor Feed Etc.
2

ing-which is the primary source of funds for all sectors of the industry and for the supporting firms and industries. The majority (approximately 81 percent in 1989) of the pari-mutuel pool is returned to the winning bettors; but a percentage, called the "takeout," is retained and divided among the other three participants.
Horses for racing are produced and supplied by a diverse group referred to collectively in this report as the horse sector. This group includes all those who ownorwork with Thoroughbred horses held for breeding or racing. As illustra ted in Figure 1-1, the primary economic incentive for the horse sector is a share of the pari-mutuel pool which is received in the form of purses (prize money going to the winners and top finishers in horse races). This sector of the Thoroughbred industry will be analyzed and discussed inChapter 2 of the report.
While the horse sector provides the horses, California horse race meetings are conducted by corporations called "racing associations," which provide the race track facilities. The racing associations operate the race tracks, administer the pari-mutuel pool, :set the terms and conditions of the races, provide services to the bettors/spectators, and provide facilities and services for the horses and horse people. The racing associations also receive a percentage of the parimutuel pool in exchange for their role in the production of horse racing. The racing associations will be discussed in Chapter 3 of the report.
Public demand for viewing and wagering at horse races is the primary economic force driving the Thoroughbred racing industry, since it is this demand that produces the pari-mutuel pool. The bettors and spectators compensate the other participants for providing horse racing. They pay the associations for admission to the track and for services such as parking, box seats and racing programs. The bettors also collectively pay the takeout - the amount of the total handle not returned to the winning bettors - which provides revenue to the state, the horse sector, and the racing associations. An analysis of the public demand for horse racing will be presented in Chapter 4 of the report.
The fourth major participant in the California Thoroughbred horse racing industry is the state. The horse racing industry has a unique relationship with the State of California because (1) the state shares directly
in the gross revenue of the industry, and (2) it controls many of the market forces within the industry, while closely. regulating industry participants. The state shares in the gross revenue of the industryby retaining a percentage of the pari-mutuel pool, roughly equal to the percentages allocated to the racing associations and to the horse sector. The state controls market forces within the racing industry by:2
I. Legislating the level of takeout and the percentage of the pari-mutuel pool going to each participant.
2. Legislating the number of racing days and races that may be offered, and specifying where and when race meetings may be held.
3. Licensing the racing associations and other industry participants, thus influencing entry and exit.
Chapter 5 discusses the total economic impact of the industry on state and local economies. The contribution of the horse and racing association sectors is measured collectively through revenue generated, employment and wages, investment in horses and facilities, and taxes and fees paid to all levels of government.
References Cain, E.P. Joint Legislative Task Force. Pari-Mutuel Horse
Racing and Breeding in New York State: An Economic Profile. Albany, New York., 1982.
California Department of Finance. A Study of Horseracing in California. Sacramento, CA, 1977.
Commission of California State Government Organization and Economy. Horse &cing in California: Revenue and Regulation. Sacramento, CA, 1982.
Killingsworth Associates, Inc. The Economic Contribution of {fie Thoroughbred Horse Racingand Breeding Industry to the State of Washington. Lexington, MA, 1984.
Lawrence, R.G. Maryland's Racing Industry: Its Participants, Organization ana Economic Impact. University of Maryland, 1972.
Stanford Research Institute. California's Horse Racing Industries: An Economic Analysis. Palo Alto, CA, 1965.
State of California. Horse Racing Law; Chapter 4, Division 8, Business and Professions Coae and Reltited Laws. Sacramento, CA, 198g.
Temple, Barker and Sloan, Inc. California Horse Racing Board. An Analysis of the California Horse Racing Industry. Lexington, MA, 1979.
Details of state legislation and regulation of the Thoroughbred racing industry are set forth in Chapter 4, Division 8, of the California Business and Professions Code, known as the Horse Racing Law.
3

Chapter 2. The Horse Sector
The horse sector-horse owners, breeders, trainers, farm and ranch owners, and many others. working for them-is one of four principal participant groups in the Thoroughbred horse racing industry. Recall Figure 1-1, which depicts the interaction of the horse sector and the three other participant groups-the state, the associations, and the bettors/spectators. The horse sector's function is to produce and supply horses for the races.
After a brief review of past research on the horse industry, this chapter will provide some background information on the horse sector in California. The background section includes a description of important trends, the organization, and the overall economic structure of the sector. Next, a detailed economic profile of the horse sector is presented. This section begins with a brief explanation of the data sources and methodology used for research, and then presents and discusses estimates of employment, cash flow, and investment in the horse sector. The chapter concludes with a summary of key results.
Prior Research on the Horse Industry
The objectives of previous studies on the horse industry in the United States have varied widely. Some studies aim solely to estimate the number of horses in each state by breed and main use, while others provide detailed information of the economic activity of the horse industry~ The Kentucky Horse Council (1977), and the New York Crop Reporting Service (1978) completed comprehensive statewide equine surveys in the late 1970s. These studies are descriptive in nature and make no attempt to estimate the economic impact of the equine industry in their respective states.
In an effort to fill a serious data gap, the Policy Economics Group of KPMG Peat Marwick took on the arduous task of calculating the economicimpact of the horse industry throughout the United States for the American Horse Council (1987). This study, which has been recently updated, reports the results of a survey that the Horse Council conducted of horse owners in every state. The report lists the number of horses in each state by breed and use, as well as estimating total equine-related expenditures by state. More detailed studies at the state level have been published in New
. Jersey (1987), Michigan (1976) and Oklahoma (1989).
Perhaps more pertinent to this report are economic impact studies focusing specifically on the racing in
dustry that have been published in several of the racing states over the past several years The Stanford Research Institute included a very detailed analysis of the California Thoroughbred industry in their comprehensive study of the state's racing industry (Stanford Research Institute, 1965). In 1964, the Thoroughbred horse sector made an important contribution to California's economy, yet manyof the individual participants experienced a net loss on their Thoroughbred operations. Results of this study indicate that while some of the Thoroughbred breeding and racing opera- . tions were profitable in 1964, overall the industry was operating at a loss. A very limited number of operations were reported to be making sizable profits, while more than 75 percent of the businesses lost money. The authors of the studysuggested that the shortage of high quality stallions in California was leading to a proliferation of inferior foals, which in tum resulted in few wins for California bred horses. These problems appeared to be confounded by a lack of racing opportunities at the highest quality Thoroughbred tracks, and a total purse fund that was insufficient to support the bree<ling and racing operations needed for a viable industry. As we point out in later sections of this chapter~ although many of these issues have been addressed by the industry, many of the participants in the horse sector continue to operate at a net loss.
A report evaluating the economic impact of the Standard bred breeding industry was published in the state of Maryland in 1981 (Lawrence and Downs). This study indicates that while Standardbred breeders made an important contribution to Maryland's economy, their expected net income from horse-related activities was negative. Lawrence also studied the price discovery process in the Thoroughbred yearling market (Lawrence, 1974), and the demand for horse racing inMaryland (Lawrence et al., 1978;Ahem and Lawrence, 1983). The demand studies will be covered in more detail in Chapter 4.
In 1981, a legislative task force in New York state published the results of their evaluation of the parimutuel racing and breeding industries in that state (Cain et al., 1981). Theirobjective was to determine the effectiveness of the New York state Thoroughbred Breeding and Development Fund, which sought to increase the quality and quantity of New York-bred Thoroughbreds. The authors concluded that although the number of New York-bred Thoroughbreds had increased since the Fund was established, the total level of purses available within the state was insufficient to cover the cost of maintaining the horses.
4

Figure 2· 1. Organization of the Horse Sector
Owners of horses of training and racing age (owners)
Owners of breeding stock and young horses (breeders)
Farms and Ranches
Own land and facilities and provide services: boarding, breeding, lay ups, break ing and training.
Trainers
Provide services: training, managing and caring for horses in training and racing.
Hire Purchase Employees Inputs
nia was by Ahern and Thompson (1984), which focused exclusively on the direct economic impact of the horse sector on the state's economy.
Organization and Economic Structure
Overview of Sector
Producing horses for racing is a process that requires many different inputs at a num~ of stages. ~or purposes of this study, those owmng and working with Thoroughbred horses (horseprople) are classified into four groups according to the input supplied or the function performed: (1) owners ofbreeding stock and young horses (breeders), (2) owners ofhorses of training or racing age (owners), (3) trainers, and (4) owners of farms and ranches.1 These groups are interrelated and not mutually exclusive. For example, the same individual or firm often supplies more than one of the
Hire Purchase Employees Inputs
Studies evaluating the direct economic impact of Thoroughbred racing have been completed in Michigan (Dike et al., 1977), Kentucky (Kentucky Thoroughbred Association, 1989),andMinnesota (Allmon, 1987). These studies reported the number of race horses in each state, and estimated direct expenditures on the part of Thoroughbred owners and breeders. Similar studies have been conducted in Oregon (Oregon State University, 1977), Louisiana (Huffman and Guidry, 1979), and Washington (Killingsworth, 1984). The three latter studies concluded that the horsemen were operating at a negative expected return, and the authorscautioned that the viability of the racing industry was threatened. The authors of the Louisiana study were also concerned with decreases in the average daily attendance at the Louisiana race tracks, and the poor financial position of the racing associations. Similar trends have been reported in a number of other racing states, including California. The most recent examination of the Thoroughbred industry in Califor
1 Note that the terms "breeder" and "o'Wner" as used in this report correspond roughly, but not exactly, to the way theyare used in the industry.
5

Figure 2-2. The Race Horse Production Process
Phase 1: Breeding Phase 2: Racing
Leave Leave Leave Industry Industry Industry
Breeding stock
•Owners of Breeding Stock and Young Horses
•TB Farms and Ranches
inputs or performs more than one of the functions. However, this organization, illustrated in Figure 2-1, provides a useful model for analyzing the horse sector.
Owners of breeding stock and young horses supply the basic raw material (potential race horses) to the owners of horses of training and racing age who ultimately supply horses for the races. Many horses change ownership between the yearling stage and the racing stage; others do not. Thus, a breeder and an owner may or may not be the same person.
Thoroughbred farms and ranches provide necessary services to the breeders and owners, including breeding, boarding, breaking, training, and otherwise caring for Thoroughbred horses. Once again, breeders and owners may also be owners of farms and ranches (and virtually all farm and ranch owners also own horses). The primary function performed by most farms and ranches is that of boarding and breeding mares and caring for young horses; henc;e, farms and ranches are most closely associated with breeders. However, some farms and ranches also provide services of training and lay up care and rehabilitation to horses of training and racing age. A few Thoroughbred facilities specialize in training or in lay up care. For this report, farms and ranches include all facilities, other than race tracks, on which Thoroughbred breeding stock, young horses, or racing stock, are kept.
Trainers provide a service to owners of horses of training and racing age. Most trainers are self-em-
Young horses
Horses in training &
racing
•Owners of Horses of Racing and Training Age
•TB Trainers
ployed, independent contractors who contract with one or more owners to control and manage the race preparation (e.g. training, conditioning, workouts, etc.) and racing careers of their horses. Trainers also provide for the horses' day-to-day care, providing feed and other supplies, and usually hiring employees to assist them. Many trainers also own and train their own horses.
It is also useful to view the horse sector as being divided into two subsectors: breeding and racing. This subdivision corresponds with two distinct phases in the race horse production process, illustrated in Figure 2-2. In phase one, horses are bred and the young horses are developed; in phase two, the horses enter training for racing, with some going on to become race horses. Although the actual age when horses begin training for racing differs depending on the circumstances and individuals involved, for this study the break between phases is when the potential race horse turns twoyearsold.2 Thus, "young horses" include all horses less than two years old (foals, weanlings, and yearlings) and "racing sto~k" are all horses two years old and up which are expected to race at some time.
Note that the supply of breeding stock (stallions and mares) comes from horses in the racing and training phase. Also illustrated in Figure 2-2 is the fact that some horses leave the industry at each step in the production process (either by death or because they have entered another sector of the equine industry, such as jumping or pleasure).
2 All race horses, regardless of their individual birth dates, are called "yearling~" ~rtheyear beginningJ anuary1 following the year in which they are born; likewise, horses are called "two-year-olds" begmrung January 1 the next year; and so on.
6

Figure 2-3. Designated Geographic Regions for the Thoroughbred Industry in California
Northern Region
GOLDEN GATE FIELDS
(Albany /Berkeley)
BAY MEADOWS r:._-'1"-.,-"'-~-~~,..-:..,..-...;a~-.....1 (San Mateo)
HOLLYWCXJD PARK
(Inglewood)
Southern Region
The Racing Subsector
For the purposes of this study, we have divided the Mateo) and Golden Gate Fields (located within the state into two distinct regions, illustrated in Figure 2- cities of Albany and Berkeley). In southern California 3. The major markets for racing in California are the the major race tracks are Santa Anita (in Arcadia), northern California Bay Area, and the areas around Hollywood Park (in Inglewood), and Del Mar (in Del Los Angeles and San Diego in southern California. Mar). We followed general industry guidelines in The major race tracks serving the northern California developing the distinction between northern andsouthmarket are Bay Meadows (located in the city of San ernCalifornia, al though these two regions differ slightly
7

from the three racing zones identified by the California Horse Racing Board.
In addition to the major race meetings held at the facilities mentioned above, there are several Thoroughbred races run in conjunction with state and county fairs in northern California. Fair race meetings are held by the tJumboldt County Fair, the Fresno County Fair, the Alameda County Fair, the California State Fair, the Sonoma County Fair, the San Joaquin County Fair, the Solano County Fair, and the San Mateo County Fair. Each of these fairs has racing facilities, owned by the state or county, with the exception of the San Mateo County Fair which leases the Bay Meadows racing facilities.
In southern California there are two additional race meetings associated with county fairs. The Los Angeles County Fair holds a Thoroughbred race meeting at its facilities (Fairplex Park), located in the city of Pomona, and the Orange County Fair holds a race meeting at the Los Alamitos racing facilities, located in the city of Cypress.
In this report, all racing in California will be organized according to the four categories implied above: the northern California major Thoroughbred race meetings, the southern California major Thoroughbred race meetings, northern California fair race meetings, and southern California fair race meetings. Because they account for approximately 90 percent of the total Thoroughbred handle, this report will emphasize the major Thoroughbred meetings in southern and northern California.
As illustrated in Figure 2-4, the number of racing days-and therefore the racing opportunities for California horse people-has persistently increased over time, as the state legislature periodically allows more racing. Note that since 1981, Thoroughbred racing has been virtually year-round in both northern and southern California if the respective fair race meets are included.
Although time series data on the number of race horses (or horses of racing age) in California do not exist, it is reasonable to assume that the numberof race horses and the size of the racing subsector has increased along with these increases in the number of racing opportunities.
For the purposes of this report, training facilities in California were separated into three categories, based on cost to owners and trainers: 1) the race track or offtrack, 2) training centers, and 3) farms and ranches. Horses stabled at the race tracks currently conducting
a race meeting are in various stages of training, although most are racing regularly. Since demand for stall space at the track exceeds the available stalls, additional stall space is made available to trainers for qualified horses at the off-track-a major race track that is not currently conducting a race meeting.
In this report, "training centers" will refer primarily to auxiliary facilities with official clockers. Note that horses are required to have workouts recorded by authorized timekeepers before they are eligible to race at a track. In the north, all such auxiliary training facilities are at state or county fair grounds which allow training when the fair meet is not running. In the south, the auxiliary training facilities consist of two privatelyowned training centers, San Luis Rey Downs and Galway Downs, and the Los Angeles County fair racing facilities at Pomona. All auxiliary facilities are located relatively close to the respective racing circuits.
Training on farms and ranches is distinguished from training at race tracks and auxiliary facilities in both location and in the organizational structure of the operation. In contrast to training done by independent trainers, owners may contract with a farm or ranch to care for and train their horses. The farm or ranch provides board, labor, the training facilities, and a supervisor or trainer, who is usually an employee of the farm rather than an independent contractor. This farm trainer, however, is often in a management position and therefore involved in farm decision making. Training on farms and ranches is usually at a beginning level and is generally less expensive than training by independent trainers.
The Breeding Subsector
As in the racing subsector, in this study the breeding subsector has been divided into the two distinct north and south regions defined in Figure 2-3. Approximately 100 commercial Thoroughbred farms and ranches are dispersed throughout the State of California. Estimates indicate that there could be up to 450 more private farms and ranches, although most of these are relatively small with only a few horses. Not surprisingly, many of the Thoroughbred farms are located near the major racing markets. High concentrations of Thoroughbred farms and ranches are found in western Riverside County, Santa Barbara County, and southwestern San Bernardino County. Other areas with significant Thoroughbred farm and ranch activity include Fresno County, San Diego County, and the areas within about a SO-mile radius of Sacramento and San Francisco.
3 The number of races offered is proportional to the number of racing days, averaging about nine races per racing day.
8

-----------------------------------------------------------------
-----------------------------------------------------------------
Figure 2-4. Number of Racing Days for Major Thoroughbred Race Meetings (A) and Fair Race Meetings (B) in Northern and Southern California, 1953-1989*
A'. Major Race Meetings
~i;.;l~~.if
100
50
0-t--+-+-1--11-t-+-+--+--+-+-+-t--l--l-+-+-+-+--+-+-+-t--l--l-+-+-t--+--+--+-+-t--l--l-+-t
1953 1957 1961 1965 1969 1973 1977 1981 1985 1989
D- Northern • Southern
B. Fair Race Meetings
300
250
200
! 150
100
50 ------------------------------------------:~~~:1·'•~:::~~:;:;_::~:;
O ·-·-·-·-·-·-·-·-·-·-·-·-·-·-·-·-·-·-·-·-·-·-·-·'I I I I I I I I I I I I I I I I I I I I I I I I I I I I I I I I I I I I 1953 1957 1961 1965 1969 1973 1977 1981 1985 1989
0- Northern • Southern
300
250
200
·-·-·-·'·-·-·-·-·------------------------------------------------7--------------. ·-·-·-·-·-·-·-·-·-· ---------------------------/~-:r------------------.,......._,.., -...--...~,... .
•~ JJ...~J-l.J-1....t"...,..,.-""'-\
..Aggregate data for all major Thoroughbred and fair race meetings in northern California and all those in southern California.
Source: California Horse Racing Board, Statistical Report of Operations, Annual Issues.
9

California breeders have ranked second to Kentucky in the production of Thoroughbreds for many years, with approximately 12 percent of the U.S. and Canadian total over the past 10 years. Figure 2-SA shows the number ofregistered foals in California and in the other two of the top three producing states for the period 1965 through 1988. Along with the rest of the nation, Califemia experienced high growth rates in Thoroughbred production during the late 1970s and early 1980s. However, California production peaked in 1985 and has declined gradually each year through 1988. Al though registration for 1989 is not complete, preliminary estimates (to be discussed later in the report) indicate little change since 1988.
Since all Thoroughbred foals in the United States, Puerto Rico, Canada, and Cuba, are required to be registered with the Jockey Club, the number of foals registered each yearprovidesa basis for other trends in the Thoroughbred breeding industry. For example, the number of Thoroughbred broodmares can be roughly approximated by assuming about 1.9 mares for every registered foal.
Figure 2-SB shows the total number of Thoroughbred foals registered with the Jockey Club for 1965 through 1988 (registration for more recent years is not complete). After increasing at a rapid rate through'the late 1970s and early 1980s, Thoroughbred production seems to have leveled off at about 50,000 foals per year. Whether production will continue to decline, as in 1988, remains to be seen.
It is important to note that California's horse sector is an integral part of a much larger national and international Thoroughbred horse racing industry and significantnutnbersofThoroughbredhorsesare exported from and imported to the state each year. Therefore, horses bred in California do not necessarily race in California, and manyof the horses racing in California were bred in other states. For example, from 1978 through 1988, California-bred horses won 41 percent of all races run at the major California tracks. (Note that race tracks are required by law to restrict one race per day to California-bred horses).
Economic Environment
The horse sectorhas three primary sources of revenue: purse money, breeder incentiveawards, and the sale of horses. These will be discussed in turn.
Purse Money Purse money paid to the owners of winners and top finishers in horse races is the primary source of funds forthe horse sectorof the Thoroughbred industry. The purse money filters down from the owners to all other horse people as owners purchase racing stock (or pay the expenses of producing racing stock) and pay for their board and training. Although there are certainly other incentives, race purse money is the main economic incentive driving this sector of the industry. The major source of purse money for California Thoroughbred races is from the horse sector's share of the parl-mutuel pool. However, the horse people also contribute directly to the purses through mandatory nomination and entry fees for stakes races.
It should be noted that purse money, in total and in average per race, has almost always been more than twice as great in southern California as in the north. Consequently, the demand for stall space, the level of competition, and the overall quality of racing is generally greater in the south.
Figure 2-6 shows total purse money paid in nominal and in real dollars-corrected for inflation with the Consumers' Price Index-at all the major Thoroughbred race meetings in northern California and all those in southern California for 1953 through 1988. Thesolid line in Figure2-6, whichbegins in 1%6 and follows just under total purse money for the southern race meetings, represents total purse money less the horse people's contribution to total purse money. Total purse money at the southern tracks-both in nominal dollars and in real dollars-shows a significantly increasingtrend, more thandoublingsince the 1950sand early 1960s. The northern tracks also show an overall increase in total purse money, butat a slower rate than the southern tracks. This relatively slow growth in the north has further widened the gap between the two regions.
The sharp increase in total purse money at the southern meets in 1984 is due to the initiation of the Breeder's Cup races held in southern California in 1984, 1986, and 1987. As Figure 2-6 shows, these races significantly increased total purses, but the increases came from within the horse sector (in the form of nomination and entry fees) and therefore did not directly increase "net" money going to the sector. The increase in purse money coming from outside the
4 Estimate based on actual 1987 foals/mares-bred ratio published by the Jockey Club. See "California Live Foal Percentages," The Thoroughbred of California, January, 1990.
5 In this case the term "California-bred" refers to horses registered "California-bred" by the California Thoroughbred Breeders Association (CTBA). Eligible horses are defined bythe CTBA as follows: 11A Califorma-bred Thoro;ighb~ed is.a ~orse dropped in California after being conceived in California, or any Thoroughbred ~orsedropped}>Ya ~re 1!1 ~hfom1~ if the mare remains in California to subsequently be bred to !1 Tho.roug]tbred stallion standing ~n .Cahfor~~... Registered California-brads do not necessarily include all horses bred m Callforma; however, the great maJOnty ofeligible horses are so registered.
10

-----------------------------------------------------------
Figure 2-5. Number of Foals Registered with the Jockey Club in the Top Three States (A) and in the United States and Canada (B), 1965-1988
A. The Top J'hree States
10
- - ·-'-·-·""-=•'-9 - - - - - - - - - - - - - - - - - - - - - - - - - - - - - - - - - - - - - - - - - - -
8 - - - - - - - - - - - - - - - - - - - ._ - - - - - - - - - - - - - - - - - - - - - - - - 1------------'::'~• ~ 7 -----------------------------------------i~----------------16 --------------------------------------·~------- -
~ 5 -------------------------------:::::-""·-::"':.·~----- -----,..:::.r.•~·--~--4 - - - - - - - . - - •-::-•:-•-::-· - - - .,.,..•.:::--!:":~ --------~~·-·-· /3 - -------------------------------.~---------------------·-·-·-·-·-·2 - - - - - - - - - - ~·-·-~=-= . ---------------------------------------·-·-·lA"":"'_+.::"-------------------------------------------------------0 I I I I I I I I I I I I I I I I I I I I I I I I
1966 1968 1970 1972 1974 1976 1978 1980 1982 1984 1986 1988
·•·Kentucky
~ California
• Florida
B. United States and Canada*
60
50 ------------------------------------------------.---....~=-=1................
·"".] 40 ---------------------------------------;;·"""'·--------------
j 30 ----------------------------~·..r"!·::-~::~--------------------- ·--·-·-· "
....-•-·-·-·-·20 ·-=-·-!-----------------------------------------------------1: t--,--:- -:-~ --;--,--:- -,-- ~--;--,--:-- ,---,- -;--:- ~- ·:- -,--;--,--~--,
1966 1968 1970 1972 1974 1976 1978 1980 1982 1984 1986 1988
*Includes a few foals from Puerto Rico and Cuba.
Source: The Blood-Horse, Mar. 21, 1977, Sept. 13, 1980, Dec. 9, 1989, and communication with the Jockey Club..
11

"' s::; 0:s...... s
$80
$70
$60
$50
$40
$30
$20
$10
$0
--------------- ------- -------.----------------.------···-...._-. ------------------------------------------------·-----~~-~- . ------~------------------------·------------------·-·-·---------
Figure 2-6. Total Purse Money Paid for Major ~ace Meetings in Northern and Southern California in Nominal Dollars (A) and Real* Dollars (B), 1953-1988**
A. Nominal Dollars
$90 .....
1953 1958 1963 1968 1973 1978 1983 1988
0 Northern California •- Southern California - less purse contributed by the Horse ~ctor
B. Real Dollars
$80 •
$70 --------------------------------------------------·~--~~,,~·-· $60 ---------------------------------------------;---~
"' s::; $50 ---------------------------~~---~--------------· ;E
$40 ------------------~~~~:~e~---~---------------------------··s $30 ··~-~···-·-·~.~·~·-·---------------------------------------------·
$20 .
$10
$0 1953 1958 1963 1968 1973 1978 1983 1988
0 Northern California •- Southern California - less purse contributed by the Horse Sector
*Real dollars are deflated by the California CPI (1982-1984:=:100). **Aggregate data for three major race meetings in northern California and five in southern California. Off-track
handle for 1985-88 in the north and for 1988 in the south is included in these data.
Source: California Horse Racing Board, Statistical Report of Operations, Annual Issues.
12

sector in 1988 is attributed to the introduction of strong breeding industry is advantageous to the state satellite wagering in southern California which in because of the economic activity it generates. The creased total handle and therefore the amount of program is administered by the California Thoroughmoney available for the horse sector. bred Breeders Association and is funded from a legis
lated percentage of the pari-mutuel pool and a perTrends in average purse per race, in nominal and centage of the purse money from exotic wagering
in real dollars, for all the major Thoroughbred race takeout. meetings innorthern California and all those in southern California are shown in Figure 2-7. Although There are currently three types of incentive prototal purse money has been increasing at a substan grams: breeder awards, owner awards, and stallion tial rate in California, average purse money per race, owner awards. Breeder awards, which make up 55 in real dollars, shows only a very slight upward trend percent of the total award money, are paid to the in the south and no change in the north. breeders of registered California-bred horses which
finish first, second, or third in any race run in CaliforPurses paid at California race meetings have al nia. Breeder awards are also paid to the breeders of
ways been among the highest in the nation. Table 2 California-bred horses which place in graded stakes 1 shows the top 25 tracks in the United States by races run outside of California but within the U.S. average purse per racing day in 1988. Asterisks Owner awards are bonuses, above purse money, paid indicate California tracks. The three major southern to the owners of registered California-bred horses California tracks are in the top five and the two major which win qualifying races in California. Stallion northern California tracks are in the top 25. Also in owner awards are bonuses paid to the owners of the top 25 are Fairplex Park and Los Alamitos, the California-based stallions whose California bred or two southern California fair meets. conceived progeny win qualifying races, place in stakes
races run in California, or place in graded stakes races Incentive Programs run outside of California but within the U.S. California incentive programs provide another source
The total incentive award money paid to California of revenue for owners of racing and breeding stock in horse owners was over $11 million in 1989. Figure 2California. The incentive programs consist of mon8 shows the total incentive award money paid from etary awards paid to California horse owners and 1970 through 1989, in nominal and real dollars. There breeders whose horses meet certain requirements hasbeena substantial upward trend in incentive award and achieve certain accomplishments. These promoney paid, due mostly to periodic changes in the grams were initiated to encourage the breeding of horse racing law which allow for more generous incenhigh quality Thoroughbred horses in California. A tive awards.
Table 2·1. Average Daily Purse Leaders, North American Thoroughbred Tracks, 1988
Track Average Purses Track Average Purses
Saratoga $401,730 Laurel Race Course $158,556 Belmont Park 342,835 Pimlico 149,107 Santa Anita* 325,856 Oaklawn Park 142,100 Del Mar* 289,169 Louisiana Downs 130,119 Hollywood Park* 288,221 Golden Gate Fields* 129,058 Aqueduct 265,221 Hawthorne 126,898 Keen eland 248,136 Los Alamitos* 125,377 Gulfstream Park 210,019 Greenwood 122,551 Fairplex Park* 207,192 Calder Race Cours 122,293 Churchill Downs 188,633 Bay Meadows* 121,762 Woodbine 177,669 Sportsman's Park 121,747 Meadowlands 173,596 Garden State Park 99,103 Monmouth Park 166,914
*California tracks
Source: The Blood-Horse, Mar. 11, 1989, from the Jockey Oub Information Systems. Excludes Hialeah and Breeders' Cup Day · purses at Churchill Downs in 1988.
13
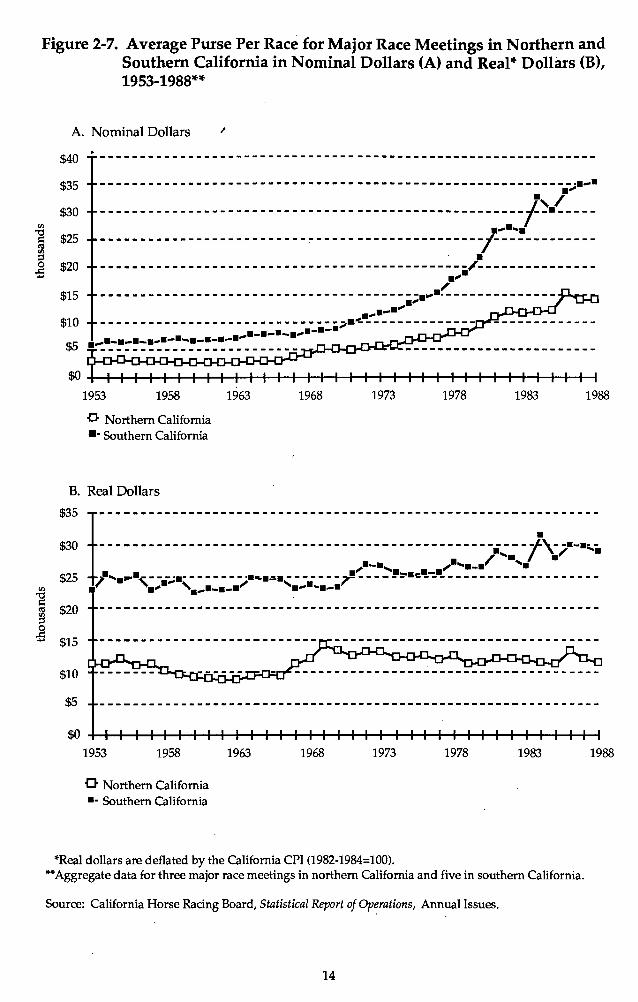
--------------------------------------------------------------
$15
$10
$5
----------------------------------------.~··--------------... ....•-•"" ------------------------------~·-----------------·-·-•.....-·-·-· ·-:.~-~~~=~:·:~~~~~:~~-------"H..U-U-[J"'U""-'"'.._
Figure 2-7. Average Purse Per Race for Major Race Meetings in Northern and Southern California in Nominal Dollars (A) and Real* Dollars (B), 1953-1988**
A. Nominal Dollars "
$40
$35 . .....-----------------------------------------------------------··-· ,/
$30 -----------------------------------------------------~-·-----........"O"' s:: $25 <U --------------------------~---------------------~-------------"' ;3 •0 $20..c: ----------------------------------------------~---------------..... ,....
1953 1958
0 Northern California •- Southern California
B. Real Dollars
$35
1963 1968 1973 1978 1983 1988
$30 !---------------------------------:_~--------;.~~~:;·~;,i\;.~--,. $25 . .... '•-· ·-· "/ ....... , - - -..:·- - -- - - - - ·•·•.::.• - - - - - - -r - - - - - - c - - - - - - - - - - - - - - - - - - - - -
] . .... '·-·----~ ,........_."'
m $20 ;3
~ $15
$10
$5
$0 -t---t-+--t-+-t--t--t-11--+-+-+-+-t--t--t--t--t--t-+-+-+-+-t--t-1t-1-+-+-+-+--+--t--t--t-~
1953 1958 1963 1968 1973 1978 1983
0 Northern California •- Southern California
*Real dollars are deflated by the California CPI (1982-1984=100). **Aggregate data for three major race meetings in northern California and five in southern California.
Source: California Horse Racing Board, Statistical Report of Op~rations, Annual Issues.
14
1988
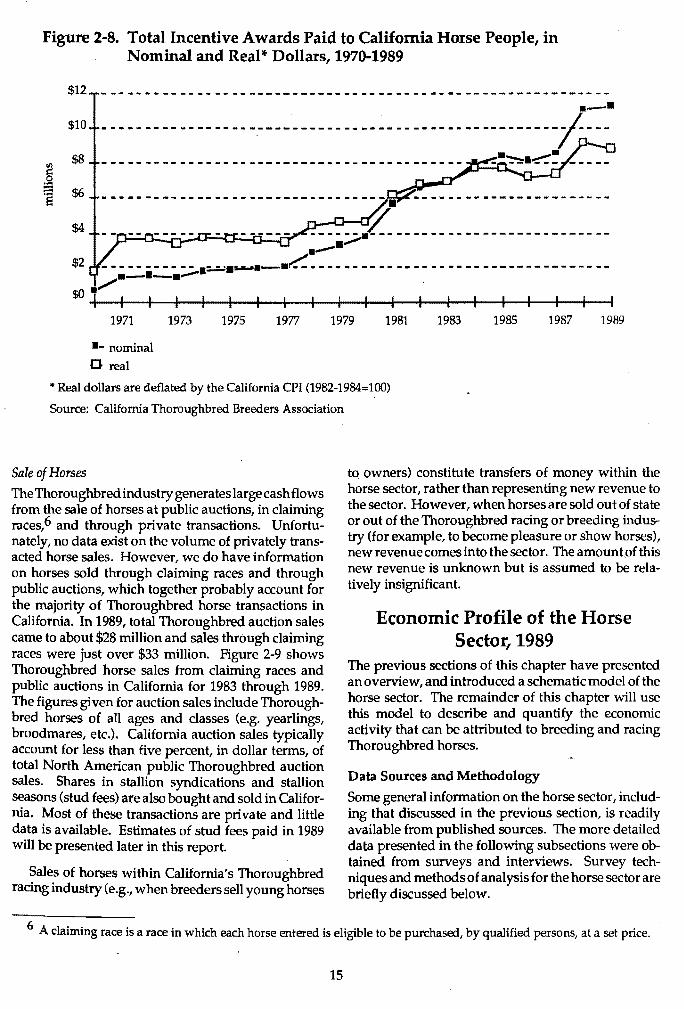
Figure 2-8. Total Incentive Awards Paid to California Horse People, in Nominal and Real* Dollars, 1970-1989
$12
1971 1973 1975 · 1977 1979 1981 1983 1985 1987 1989
•-nominal
0 real
,. Real dollars are deflated by the California CPI (1982-1984=100)
Source: California Thoroughbred Breeders Association
Sale of Horses The Thoroughbred industry generates large cash flows from the sale of horses at public auctions, in claiming races,6 and through private transactions. Unfortunately, no data exist on the volume of privately transacted horse sales. However, we do have information on horses sold through claiming races and through public auctions, which together probably account for the majority of Thoroughbred horse transactions in California. In 1989, total Thoroughbred auction sales came to about $28 million and sales through claiming races were just over $33 million. Figure 2-9 shows Thoroughbred horse sales from claiming races and public auctions in California for 1983 through 1989. The figures given for auction sales include Thoroughbred horses of all ages and classes (e.g. yearlings, broodmares, etc.). California auction sales typically account for less than five percent, in dollar terms, of total North American public Thoroughbred auction sales. Shares in stallion syndications and stallion seasons (stud fees) are also bought and sold in California. Most of these transactions are private and little data is available. Estimates of stud fees paid in 1989 will be presented later in this report.
Sales of horses within California's Thoroughbred racing industry (e.g., when breeders sell young horses
to owners) constitute transfers of money within the horse sector, rather than representing new revenue to the sector. However, when horses are sold out of state or out of the Thoroughbred racing or breeding industry (for example, to become pleasure or show horses), new revenue comes into the sector. The amountof this new revenue is unknown but is assumed to be relatively insignificant.
Economic Profile of the Horse Sector, 1989
The previous sections of this chapter have presented an overview, and introduced a schematic model of the horse sector. The remainder of this chapter will use this model to describe and quantify the economic activity that can be attributed to breeding and racing Thoroughbred horses.
Data Sources and Methodology
Some general information on the horse sector, including that discussed in the previous section, is readily available from published sources. The more detailed data presented in the following subsections were obtained from surveys and interviews. Survey techniques and methods of analysis for the horse sector are briefly discussed below.
A claiming race is a race in which each horse entered is eligible to be purchased, by qualified persons, at a set price.
15
6

Figure 2-9. Value of Horses Sold Through Public Auctions and Claiming Races in California, 1983-1989
$45
$40
$35
$30<fl i:: s $25 ·5 $20
$15
$10
$5
$0
1983
• public auction
ES! claiming races
Source: California Horse Racing Board, Annual Reports
1984 19&5 1986 1987 1988 1989
Survey of Thoroughbred Owners, Breeders, and Fanns and Ranches The general population of horse owners was separated into two groups: (1) major breeders, or people who have been identified as owners or managers of large breeding farms and (2) owners, or people identified as owning at least one Thoroughbred licensed to race in California. A questionnaire eliciting employment, cash flow and investment information was developed for each group.
Industry representatives assisted with the identification of major breeding farms, and surveys were sent to every operation listed, for a total of 101 surveys. A list of every owner licensed to race Thoroughbreds in California was obtained from the California Horse Racing Board. A random sample of 20 percent of the owners was surveyed for a total of 2,245 surveys.
The survey effort consisted of two complete mailouts, as well as follow-up postcards. The response rate for the survey of major breeders was 33 percent, resulting in 32 usable surveys; the response rate from licensed Thoroughbred owners was 24 percent, resulting in 404 usable surveys.
To supplement the mail survey information, a telephone survey was conducted of major breeding farms, lay up facilities, and training centers in California. Additional detail on horse numbers, investment, and cash flow was obtained from 60 percent of the facilities identified. Preliminary estimates were validated through in-person interviews with a small sample of farm owners and managers.
Survey of Thoroughbred Trainers
The general population of Thoroughbred trainers in California was stratified into three groups: (1) trainers who stable the majority of their horses at major southern California tracks, (2) trainers who stable mostly at the major northern California tracks, and (3) all other trainers licensed in California. Survey questionnaires to obtain employment and cash flow information were developed for trainers, after preliminary in-person interviews with several trainers from each of the first two groups.
A random sample of 40 trainers from each of the first two groups was selected. Survey forms were personally delivered to each of the selected trainers by a representative of the northern or southern California Horsemen's Benevolent and Protective Association (CHBPA) with an explanation of the study's purpose and a request for them to participate in the study. Follow up was done by the CHBPA representatives. Fifteen completed surveys were received from trainers in the north and south. In addition to these surveys, in-person interviews were conducted with five trainers from the major northern tracks and eight from the southern tracks. Also, an in-person interview was conducted with a bookkeeper who represented several southern California trainers.
The trainer questionnaire, with slight modifications, was mailed to a sample of 400 trainers in the third group. The response rate from this survey was three percent, and resulted in 10 usable surveys. Thus, the completed surveys analyzed represent trainers
16

from northern and southern California tracks and auxiliary training facilities.
Other Data Sources In addition to the surveys, data were obtained from telephone and in-person interviews with the Jockey Club, the California Horse Racing Board, race track officials and employees, training center personnel, and other industry representatives.
After gathering all the data from published sources, surveys, and interviews, estimates were obtained on horse numbers, employment, cash flow, and investment in the horse sector. Most of the estimates of employment, cash flow, and investment were first obtained on a per horse basis. These results were then extrapolated to industry totals using estimates of the total Thoroughbred population. Results are presented and discussed below.
Thoroughbred Horses in California
Average numbers of Thoroughbred horses in California during 1989 by type and location were estimated using survey information, published data, and personal communication with tracks, training centers, and the Jockey Club. Numbers of racing stock, which includes all Thoroughbred horses two years old and older held for racing purposes, will be presented first; numbers of breeding stock and young horses under the age of two will follow.
Racing Stock TheestimatedaveragenurnberofThoroughbredhorses in training for racing in California during 1989 was 8,900 (Table 2-2). Estimates are presented by location and type of racing or training facility. Horses in
trainingat the track holding a race meeting and horses at the corresponding off track were added together in the category "tracks and off-tracks." Horses in training at major training centers, primarily auxiliary training facilities with authorization to do official works, constitute a second category. The lastcategory, "other training facilities," includes horses in training on farms and at private training centers, which train horses under a single trainer or manager.
The population of race horses is dynamic-horses are continually entering and leaving training, dying or otherwise leaving the industry, or retiring to become breeding stock. Therefore, the reported numbers of horses in training are estimated averages for the year and the actual number of horses in training at any time during the year fluctuates around the reported average. The number of horses in training attracks and offtracks is fairly constant throughout the year, but the number in training at training centers and other training facilities has random and seasonal variation. Peak time for training centers and other training facilities is in the early spring when most of the two-year-olds are just beginning their careers.
Another important category of Thoroughbred race horses in California are two-year-olds and older which are not in training, but which are expected to go into training at some time in the future. This group includes horses laid up or turned out, horses being rehabilitated, horses deemed too physically immature to begin training, and horses which are otherwise waiting to begin training. Like horses in training, this group of horses is also subject to random and seasonal variation. Nevertheless, our estimates indicate that, on average throughout the year, for every two horses in active training in California there is at least one horse of training age waiting to begin training.
Table 2-2. Estimated Year-Round Average Number of Horses in Training, California, 1989
Northern California Southern California Total
Tracks and Off-Tracksa 1,910 3,200 5,110 Major Training Centersb 950 930 1,880 Other Training Facilitiesc 580 1,330 1,910
Total 3,440 5,460 8,900
a Santa Anita, Hollywood Park, & Del Mar in the south; Bay Meadows and Golden Gate Fields in the north.
blncludes Pomona Fair Grounds, San Luis Rey Downs,&. Galway Downs in the south; Pleasanton, Sacramento, Santa Rosa, Vallejo, & Stockton fair grounds in the north,
c Includes private training centers, training facilities and training on farms
Source: Estimated from survey data and personal communication with industry personnel.
17

Table 2-3. Estimated Average Number ofThoroughbred Breeding Stock and Young Horses in California, 1989
Northern California Southern California Total
Stallions 210 560 770 Broodmares 2,530 6,770 9,300 Foals 1,520 4,060 5,580 ~earlings 1,330 3550 4,880
Total 5,590 14,940 20,530
Source: Estimated from survey data and personal communication with industry personnel.
Combining all racing stock (those in training and those waiting) gives an estimated average of at least 13,350 Thoroughbred horses two years old and older held in California in 1989 for the purpose of racing.
Breeding Stock and Young Horses
Table 2-3 shows the estimated number of broodmares, stallions, foals, and yearlings in California in 1989 by region. As with race horses, the population of breeding stock and young horses is also very dynamic; therefore, these estimates again represent averages over the year. The reported number of foals is an average over the second half of the year, since most foals are born in the spring and early summer.
Estimates indicate that there were approximately 10,070 Thoroughbred mares and staliions held for breeding race horses in California during 1989. In addition, there were approximately 10,460 Thoroughbred foals (or weanlings) and yearlings held as potential race horses. Note that the Thoroughbred breeding industry is nearly three times larger in southern than in northern California. This difference can probably be attributed to the fact that the market for racing is far more lucrative in southern California.
Employment and Compensation in the Horse Sector
The horse sector of the Thoroughbred industry provides a wide variety of full-time and part-time employment opportunities for a wide range of skill, income, and status levels. Thoroughbred farms and ranches employrnanagers, general farm laborers, maintenance workers, trainers, riders, and administrative personnel. Trainers employ assistant trainers, barn foremen, grooms, riders, hot walkers, and sometimes nightwatchmen, van drivers, and officeworkers. Both farms and ranches and trainers typically arrange for the professional services of veterinarians and farriers for the horses under their supervision. Other jobs in
this sector include jockeys and jockey agents, and employees of horsemen's organizations.
All estimates of the numberof persons employed in this report will be measured in full-time equivalent (FIE) units. FIE means the number of jobs which would be available ifeveryone employed in the industry worked full time all year. For example, if one person works half time for the whole year in the Thoroughbred horse sector, then that would be counted as .5 FIE job. Ifanother person works full time for only three months during the year in the Thoroughbred horse sector (and nine months doing something else) then that would be counted as .25 FfE job.
Radng and Training
The estimated number of employees hired by trainers, and their average monthly base pay rates, at the major California tracks and training centers is presented in Table 2-4. The numbers are an average for year-round, full-time employees. Included in the estimates are contract laborers who exercise or care for horses on a daily, by-the-head fee. Free lance exercise riders are the most significant part of contract labor; they make up about 12 percent of the reported exercise riders in the south and 25 percent in the north. Other kinds of contract labor, such as contract hot walkers, make up a very small percentage of the total.
None of the trainers reported offering any employee benefits such as health insurance or pension plans. However, the California Thoroughbred Horsemen's Foundation (CTHF) provides medical, dental, optometric, and social welfare benefits for all horsemen licensed to work on California's race tracks and major training centers. The California Horsemen's Benevolent and Protective Association ( CHBP A) also provides a limited pension program. These benefit programs are funded by private contributions, by a legislated portion of the monies available from the pari-mutuel pool, and by the proceeds from one-half of the uncashed pari-mutuel tickets.
18

Table 2-4. Estimated Number of Hired Employees and Average Monthly Base Pay at California Tracks and Major Training Centers, 1989
Northem California Southern California Total
Assistant Trainers Number Average Pay/Month
70 $2,100
65 $1,900
135
Barn Foremen Number
. Average Pay/Month 80
$1,700 175
$1,650 255
Exercise Riders Number Average Pay/Month
300 $1,460
440 $1,540
740
Grooms Number Average Pay/Month
680 $1,150
1,120 $1,200
1,800
Hot Walkers Number Average Pay/Month
75 $950
450 $750
525
Other Stable Helpa Number Average Pay/Month
25 $950
45 $950
70
Total Employed, FfE 3,525
a Includes night watchmen, relief workers, and pony riders.
Source: Estimated from survey data.
In addition to the CHBP A and CTHF benefits, at all of the tracks and at most training centers approximately 70 percent of the stable employees live in free rooms provided by the track. Furthermore, the practice of staking stable employees is common at both the northern and southern tracks? These bonuses can be significant for those employees who care for horses that win purse money.
The estimated number of self-employed professionals working with or caring for horses in training at the major California tracks and training centers is shown in Table 2-5. The estimates refer to the number of individuals whose primary occupation is the indicated profession at the indicated location, and are on a F'fE ·basis. There may be many more who work only part
time in a given profession/location category. Incomes for these jobs are quite variable, depending mostly on an individual's ability and reputation; averages were not estimated. However, estimates of the total amount paid to trainers, jockeys, veterinarians, and farriers by California owners in 1989 will be given in the next subsection.
All persons working on race tracks and auxiliary training facilities in California are required to be licensed with the California Horse Racing Board. Table 2-6gives the number of active licenses held by California Thoroughbred horse people as of April 1989. In most cases, the estimated number of people employed was substantially less than the number of license holders. This discrepancy is due to the fact that the esti
f 7
:taki!'-g ~fet:s to the practice of owners giving stable employees such as the groom or exercise rider a small percentage 0 ~ orse s wmnmgs. Stakes are usually one percent for a groom and sometimes up to one percent for an exercise rider, assistant trainer, or stable foreman.
19

Table 2-5. Estimated Number of Professionals or Self-Employed at California Tracks and Major Training Centers, 1989
Northern California Southern California Total
Trainers .230 350 580 Jockeys 35 25 60 Veterinarians 20 30 50 Farriers 20 30 50 Othe~ 60 65 _rn_
Total, FTE 865
a Includes stable agents, equine dentists, jockey agents, and jockey valets.
Source: Estimated from survey and industry data.
mates in Table 2-5 refer to the average number of fulltime, year-round, and on-track individuals employed, while the number of licensed individuals includes many part-time or seasonal persons and probably many others who maintain active licenses without working on the track. Nevertheless, the number of active licenses may be used as an upper estimate of the number of persons employed on California ~ace tracks.
Fanns and Ranches
Thoroughbred farms and ranches are another important source of employment for individuals involved in the horse sector. Total employment on Thoroughbred farms and ranches in California, along with salary ranges and averages, is listed by category in Table 2-7. The estimates indicate that at least 1,880 persons had full-time, year-round employment on Thoroughbred farms and ranches in California in 1989. These estimates may not include all owner-operators of farms
and ranches since at least some of the survey respondents did not report themselves as full-time employees, even though operating the farm was their primary occupation and source of income.
Salary levels for Thoroughbred farm and ranch employees were generally low. However, approximately 80 percent of those in management positions and 60 percent of all other full-time employees received free housing in addition to their salary. Some, usually trainers or managers, received other benefits such as a vehicle to drive orreduced rates for their own horses. Less than 10 percent of Thoroughbred farms and ranches reported offering medical or retirement benefits. The aggregate value of these fringe benefits could not be estimated from our survey data.
The "General Labor" category includes those jobs associated with the daily care of Thoroughbreds on the farm, such as feeding, stall cleaning, and general farm
Table 2-6. Number of Thoroughbred Active Licenses by Occupational Group in California, 1989
Owners 10,627 Jockey 296
Trainers 1,159 Apprentice Jockey 80
Assistant Trainer 259 Jockey Agent 103
Stable Foremen 192 Jockey Valet 26
Exercise Riders 1,055 Veterinarian 95
Groom/Stable Employee 3,478 Farrier 119
Pony Rider 156 Authorized Agent 1,328
Source: California Horse Racing Board.
20

Table 2-7. Estimated Number of Persons Employed and Average Monthly Salaries for Thoroughbred Farms and Ranches in California, 1989
Management
Administrative/Office Staff
General Labor
Trainers
Riders
Other Full Time
Other Part Time
Total
Source: Estimated from
Low
$1,000
500
600
1,500
950
700
$4.25/hr.
data.
Salary Range
(monthly)
High
$4,000
1,800
1,200
2,000
1,650
1,600
$7.00/hr.
Average
$2,150
1,470
1,020
1,850
1,320
1,000
$4.50/hr.
Total Employed (ffE)
180
170
1,070
50
280
50
80
1,880
work. Some farms reported all non-management employees in this category; consequently, many riders and possibly others are counted in this category. The "Other Full Time" category includes jobs such as maintenance or mechanic workers and night watchmen.
In addition to these several employment categories, owners of Thoroughbred horses on farms and ranches use the services of veterinarians and farriers. Most veterinarians and farriers are self-employed individuals who "contract" with the farm or ranch management to provide services and charge the horse owner on a procedure basis. Many of the larger breeding farms retain "resident" veterinarians who agree to work exclusively, or on a priority basis, on the farm. Similar arrangements are sometimes made with farriers. Most veterinarians and farriers, however, work for other clients, including serving breeds other than Thoroughbreds. Our estimates show that approximately 65 veterinarians and 100 farriers were employed, on a FTE basis, on California Thoroughbred farms and ranches in 1989. It should be emphasized that our estimates understate the total number of veterinarians and farriers, for there are many professionals who make only part of their income on Thoroughbred farms and ranches.
Horsemen's Organizations The California Thoroughbred Breeder's Association (CTBA) and the California Horsemen's Benevolent and Protective Association (CHBPA), two major horsemen's organizations, provide one last source of direct employment in the horse sector. Together these
two organizations provided approximately 45 FfE jobs in 1989.. Most of these jobs were administrative in nature.
Summary Table 2-8 summarizes the estimates of the number of persons employed in the horse sector, on a FfE basis. As shown in the table, estimates indicate thatthe Thoroughbred horse sector provided at least 6,480 FTE jobs in 1989.
Cash Flow in the Horse Sector
The receipts and expenditures made byan industry for goods and services are an important element of that industry's economic impact. California's Thoroughbred industry generates millions of dollars in cash flows. The general nature and direction of cash flows in the horse sector are illustrated in Figure 2-10.
Note that some cash flow is entirely intra-sector while other enters or leaves the sector. For example, the payments made by owners of breeding and racing stock to farms and ranches for board and other services are an intra-sector cash flow. On the other hand, payments made by farms and ranches for feed and labor leave the horse sector. It is important to make this distinction since intra-sector cash flows have little economic impact outside the horse sector.
The organizational model of the horse sector used for this analysis implies that each of the four groups of horse people are mutually exclusive economic agents. However, in actuality many individuals and finns fall
21

Table 2-8. Summary of Estimated Total Employment in the California Thoroughbred Horse Sector, 1989
Racing and Tlaining Employed by Trainers (Table 2-4) Trainers (Table 2-5) Jockeys (Table 2-5) Veterinarians (Table 2-5) Farriers (Table 2-5) Other Self-Employed (Table 2-5)
Subtotal
Farms and Ranches Employed on Farms & Ranches (Table 2-7) Veterinarians Farriers
Subtotal
Horsemen's Organizations
Total
Source: See referenced tables
Total Employed
(Full Time Equivalent)
3,535 580
60 50 50
125
4,390
1,880 65
100
2,045
45
6,480
into more than one of the four groups. Therefore, it is important to note that the estimates presented in the following subsections of expenditures and receipts made between the various groups of horse people are estimates of the amounts that actually changed hai:tds; in other words, we do not count individuals and firms as paying themselves for services performed on their own horses, although all expenses are taken into account.
The initial amount of money entering the horse sector from the joint pari-mutuel pool of all Thoroughbred racingin the state is estimated to be$131.Smillion in 1989. Of this amount, approximately $3.6 million went to horsemen's organizations (the CHBPA and CTBA),8$11.2million was awarded to California horsemen through the incentive award programs,9 and $116.7 million was distributed as purses. As previously discussed, this is the primary source of funds for
the horse sector. After it enters, primarily through purses paid to owners, it is dispersed through the sector as the various participants make (and receive) payments to (and from) each other. As will be seen, most of this money eventually leaves the horse sector-thus impacting the outside economy.
Cash flows from horse purchases and sales are not included in the following analysis because reasonable estimates were not available from the survey results. Although these cash flows are believed to be substantial, it is not so serious an omission as it might first appear since most horse sales are an intra-sector transfer between horse owners. However, some money does enter and leave the sector when sales and purchases of horses orstallion services are made outside of California's Thoroughbred horse sector .. This occurs through out-of-state transactions and when horses or stallion services are sold for purposes other than rac
8 About 70 percent of the money going to the horsemen's organizations is used for salaries and other administrative expenses. The remainder is used to help fl.ind the CHBP A pension program. In addition to this money, the CTHF receives the proceeds from one-half on the uncashed pari-mutuel tickets to fund horsemen's medical benefits programs.
9 In 1989, the incentive award money was distributed as follows: $7.8 million in breeder's ~wards, $3.1 million in owner's awards, and $0.3 million in stallion awards.
22

Purses and
Owners of
Breeding Stock
Horse Owners of
Racing StockSales
Farms and Ranches
Services: •Boarding •Breeding •Breaking •Training
Employees: •Managers •Riders •Laborers
Goods: •Feed & Bedding •Machinery •Farm Overhead
Trainers
Services: •Boarding •Training •Managing
Employees: •Assistants •Grooms •Riders
Bedding •Stable Equipmen •Business Expenses
Horsemen Organizations
Nomination and
Entry Fees
Jockeys Employees: •Jock Agents •Valets
Figure 2-10. Cash Flow in Horse Sector
Horse Purchases and Sales (and Stallion Services) Outside of the California Thoroughbred Racing and Breeding Sector
Goods: •Medications •Horseshoes etc.
Nomination Fees
Vet. and Farrier
Services
Misc. Fees and
Expenses
Goods: •Medications •Horseshoes etc.
Payments to Federal, State,
and Local Governments
23

Table 2-9. Estimated Average Daily Training Rates and Average Daily Lay Up/Turn Out Rates in California, 198~
Northern California Southern California
Tracks and Off-Tracksa $40.00 $52.00 Major Training Centersb,. 33.00 42.00 Ot}ler Training Facilitiesc 22.00 35.00 Lay Up or Turn Out $9.50-$13.50 $1450-$18.00
a Santa Anita, Hollywood Park, & Del Mar in the South; Bay Meadows and Golden Gate Fields in the north.
b Includes Pomona Fair Grounds, San Lws Rey Downs, & Galway Downs in the south; Pleasanton, Sacramento, Santa Rosa, Vallejo, & Stockton in the North.
c Includes private training centers, training facilities on farms, and so on.
Source: Estimated from survey data.
ingorrace horse breeding. Unfortunately, estimates of horses and stallion services purchased and sold outside ofCalifornia's Thoroughbred sector were also not available from the survey results.
Estimates of the expenditures made in 1989, byeach of the four groups of horse people will be presented in the following subsections.
Owners of Radng Stock
This subsection presents estimates of the aggregate expenditures made by the owners of Thoroughbred race horses two years old and older (racing stock) for
the training, racing, and careofthose horses in California during 1989. Per-horse expenses for those owners differ dependingon the location and stage of training. Expenses also differ for those horses temporarily laid up or turned out. Therefore, in estimating expenditures, racing stock was divided into four major categories according to.significant cost differences: horses in training at tracks and off tracks, horses in training at major training centers, horses in training on farms and private training facilities, and horses laid up or turned out (including two-year-olds which have not begun training). Each of these categories was also divided into northern and southern California.
Table 2-10. Estimated Owner Aggregate Expenditures for Thoroughbred Horses in Training at California Race Tracks and Major Training Centers, 1989
Northern California Southern California Total
Training Fees Paid $35,290 $67,780 $103,070 Trainer Commissions Paid 2,700 7,650 10,350 Jockey 2,600 7,300 9,900 Veterinarian 3,400 5,400 8,800 Farrier 1,900 3,750 5,650 Nomination & Entry Fees 1,000 2,000 3,000 State License Fees 220 430 650 Property Taxes, Horses 120 190 310 Other Expensesa 960 1,580 2,540
Total $48,190 $96,080 $144,270
a Other expenses include horse transportation, bonus payments to stable employees, pony to post, racing silks, etc
Source: Estimated from survey and industry data.
24

Table 2-11. Estimated Aggregate Payments Made by Owners of Thoroughbred Racing Stock to Farms and Ranches in California, 1989
Northern California Southern California Total
Training Fees Paid $3,210 $11,280 $14,490 Boarding Fees Paid 3,620 8,440 12,060
Total $6,830 $19,720 $26,550
Source: Estimated from survey data
The largest expenditures for each category of racing stock was the daily fee charged for training or board. The estimated average daily training rates and average daily lay up/tum out rates for the California horse sector in 1989 are shown in Table 2-9.
Table 2-10 gives the estimated total expenditures by owners for horses in training and racing at California tracks and major training centers in 1989. In addition to the daily training fees paid to trainers, which account for 71 percent of all owner expenditures, owners of race horses make routine and non-
routine payments for veterinarian and farrier services. Approximately five percent of the estimated veterinarian expenditures are for equine dental work which may be done by a veterinarian or by an equine dentist who is not necessarily a licensed veterinarian. Race horse owners have added expenses associated with racing, and those who run in the money pay commissions to jockeys and trainers, and sometimes to stable employees.
Some owners of racing stock make payments to farms and ranches (or to private training facilities) for
Table 2-12. Estimated Aggregate Expenditures (Other ThanTraining and Board) byOwners of Thoroughbred Racing Stock Kept on Farms and Ranches in California, 1989
Northern California Southern California Total
Horses in Training Veterinary $560 Farrier 320 Property Taxes, Horses 20 Other Expenses 130
Horses Laid Up or Turned Out Veterinary 1,100 Farrier 430 Property Taxes, Horses 30 Other Expenses 170
Total $2,760.
Source: Estimated from survey data
$1,500 720 40
210
1,750 690 80
220
$5,210
$2,060 1,040
60 340
2,850 1,120
110 390
$7,970
25

training services. Fanns and ranches also provide board and rehabilitation services for horses laid up or turned out. The estimated aggregate expenditures made by owners of Thoroughbred racing stock in 1989 to California farm and ranch owners are giveri in Table 2-11.
I'
Owners of racing stock in training or laid up on farms and ranches also make payments to veterinarians and farriers. In addition, there are other expenses associated with racing stock on farms and ranches, such as those for horse transportation. Estimates of veterinary, farrier, and other expenditures made by all owners of racing stock on fanns and ranches are given in Table 2-12.
Approximately 90 percent of the race horse owners responding to our surveys reported expenditures in excess of receipts. In support of this finding is the fact that estimated expenditures to race, train, and maintain racing stock (not including the investment costs in these race horses) are well in excess of total purse and incentive award money paid in 1989.
Trainers Trainers provide a service to Thoroughbred owners in exchange for a daily training fee, plus commission (normally 10 percent of race winnings). Routine daily expenses such as feed, bedding, and labor are paid by the trainer. As shown in the previous subsection, the cost of professional services provided by veterinarians and farriers are passed on to the owner. Additional racingand training expenses such as jockey fees, horse transportation costs, and race entry fees are also paid by the owner.
The estimated aggregate expenditures made by Thoroughbred race horse trainers in California during 1989 are given in Table 2-13. Labor is the dominant expense for trainers, accounting for over 60 percent of all trainer expenses when mandatory worker's compensation insurance and employer-paid payroll taxes are included. Approximately 48 percent of the total wage bill is earned by the grooms, and 25 percent is paid to exercise riders. The remaining 27 percent is divided among barn foremen, hot walkers, assistant trainers, and other stable employees, in that order.
Table 2-13. Estimated Aggregate Thoroughbred Trainer Expenditures in California, 1989
Northern California Southern California Total
Labor Worker's compensation Employer Insurance
Payroll Taxes Feed and Bedding Feed Supplements Tack, Stable Equipment and Stable Supplies Misc. Stable Overhead a Business Expensesb Stall Rent State Sales TaxesC State License Fees
Total
$17,790 3,500 1,410
8,600 890
1,760 800
2,290 1,020
720 30
$38,810
$32,080 7,900 2,540
15,430 1,290
3,540 560
4,600 550
1,290 40
$69,820
$49,870 11,400 3,950
24,030 2,180
5,300 1,360 6,890 1,570 2,010
70
$108,630
a About 70 percent of miscellaneous stable overhead is for equipment rental.
b This category includes, in order of significance, the following business-related expenses: hired bookkeeping, travel, telephone, entertainment, race-going expenses, interest, insurance, office expenses, and other miscellaneous expenses.
c Sales taxes come from the following categories: feed and bedding, $1,540; feed supplements, $110; tack and stable supplies, $240; and business expenses, $120.
Source: Estimated from survey data.
26
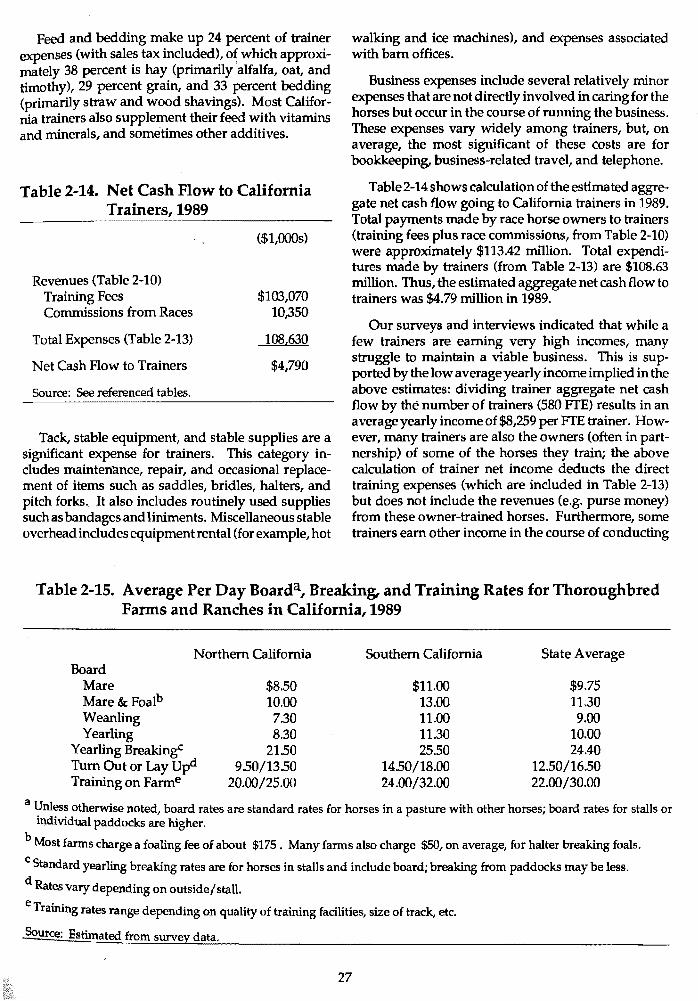
Feed and bedding make up 24 percent of trainer expenses (with sales tax included), of which approximately 38 percent is hay (primarily alfalfa, oat, and timothy), 29 percent grain, and 33 percent bedding (primarily straw and wood shavings). Most California trainers also supplement their feed with vitamins and minerals, and sometimes other additives.
Table 2-14. Net Cash Flow to California Trainers, 1989
($1,000s)
Revenues (Table 2-10) Training Fees $103,070 Commissions from Races 10,350
Total Expenses (Table 2-13) 108,630
Net Cash Flow to Trainers $4,790
Source: See referenced tables.
Tack, stable equipment, and stable supplies are a significant expense for trainers. This category includes maintenance, repair, and occasional replacement of items such as saddles, bridles, halters, and pitch forks. It also includes routinely used supplies such as bandages and liniments. Miscellaneous stable overhead includes equipment rental (for example, hot
walking and ice machines), and expenses associated with barn offices.
Business expenses include several relatively minor expenses that are not directly involved in caring for the horses but occur in the course of running the business. These expenses vary widely among trainers, but, on average, the most significant of these costs are for bookkeeping, business-related travel, and telephone.
Table 2-14 shows calculation of the estimated aggregate net cash flow going to California trainers in 1989. Total payments made by race horse owners to trainers (training fees plus race commissions, from Table 2-10) were approximately $113.42 million. Total expenditures made by trainers (from Table 2-13) are $108.63 million. Thus, the estimated aggregate net cash flow to trainers was $4.79 million in 1989.
Our surveys and interviews indicated that while a few trainers are earning very high incomes, many struggle to maintain a viable business. This is supported by the low average yearly income implied in the above estimates: dividing trainer aggregate net cash flow by the number of trainers (580 FTE) results in an average yearly income of $8,259 per FTE trainer. However, many trainers are also the owners (often in partnership) of some of the horses they train; the above calculation of trainer net income deducts the direct training expenses (which are included in Table 2-13) but does not include the revenues (e.g. purse money) from these owner-trained horses. Furthermore, some trainers earn other income in the course of conducting
Table 2-15. Average Per Day Boarda, Breaking, and Training Rates for Thoroughbred Farms and Ranches in California, 1989
Northern California Southern California State Average Board
Mare $8.50 $11.00 $9.75 Mare&Foalb 10.00 13.00 11.30 Weanling 7.30 11.00 9.00 Yearling 8.30 11.30 10.00
Yearling Breakingc 21.50 25.50 24.40 Tum Out or Lay Upd 950/1350 14.50/18.00 12.50/16.50 Training on Farme 20.00/25.00 24.00/32.00 22.00/30.00
a 1:Jnl~s~ otherwise noted, board rates are standard rates for horses in a pasture with other horses; board rates for stalls or individual paddocks are higher.
b Most farms charge a foaling fee of about $175 . Many fanns also charge $50, on average, for halter breaking foals.
c Standard yearling breaking rates are for horses in stalls and include board; breaking from paddocks may be less.
d Rates vary depending on outside/stall. eT ..
rammg rates range depending on quality of training facilities, size of track, etc .
.§Duree: Estimated from survey data.
27

Table 2-16. Estimated Aggregate Payments Made by Owners of Thoroughbred Breeding Stock and Young Horses to Farms and Ranches in California, 1989
Northern California Southern California Total
,. $1,000s
Boarding Fees Paida
Breaking/Preliminary Training Fees Paidb
$7,980
870
$26,650
2,720
$34,630
3,590
Total $8,850 $29,370
a Boarding fees are for mares, mares and foals, weanlings, and yearlings
b Fees include board.
$38,220
their training business, such as receiving a commission on horses bought and sold, which has not been accounted for. Thus, while it appears that many trainers do make relatively low incomes, average trainer personal income could beunderstated by the above calculations.
Owners of Breeding Stock and Young Horses The greatest expense for owners of breeding stock is board (feed and keep) for the horses. This is true whether the owners keep their horses on their own farm or ranch or pay a daily board fee to other farm and ranch owners. Many of those breeders who own their own farms send at least some of their horses to other farms and ranches to bebred, or to have other services performed, and thus incur board charges. Board fees vary by region and type of horse (e.g., mare, yearling) .. Estimated average board, breaking, and training fees for California farms and ranches are given in Table 215.
The estimated aggregate payments made by the owners of breeding stock and young horses to California farms and ranches in 1989 for boarding and breakingorpreliminary training are presented inTable 2-16. Note that these estimates exclude the board-related costs incurred by those who keep their horses on their own property. The estimates for expenditures on board are for mares, mares and foals, weanlings, and yearlings. The estimated expenditures for breaking and preliminary training are for yearling breaking and the early yearling training. The training expenditures include board fees.
Table 2-17presents the estimated aggregate expenditures made by owners of breeding stock and young
horses for all expenses other than board. These costs are generally incurred by all breeders, regardless of whether they own a farm. Breeders have significant veterinary expenditures associated with breeding and raising young horses. On the other hand, farrier expenses for breeders are minimal since breeding stock and young horses do not generally require so much attention to their feet as do horses in training. Other relatively minor expenditures for breeders include horse transportation costs, foal registration fees, and property taxes.
Stud fees are payments made by mare owners to stallion owners for stallion services. Note that in this report both mare and stallion owners are considered under the same category---{)wners of breeding stock and young horses-and, therefore, stud fee expenditures are an intra-sector cash flow made within this group of horse people. Note also that nomination fees are an intra-sector cash flow since they are returned to the horse sector through purses.
Thoroughbred Fanns and Ranches
The major expenditures made by Thoroughbred farm and ranch owners are for feed, management, labor, and other items associated with maintaining the facilities. Estimates of the aggregate expenditures made by California Thoroughbred farm and ranch owners in 1989 are given in Table 2-18. The aggregate total is estimated at approximately $97.5 million, with feed and bedding constituting the largest category (about 10 percent of this category was spent on bedding). Estimated salary and wage expenditures include direct payments to all employees of the farms and ranches. Maintenance and repair of the farm or ranch facilities and equipment are other important expenses for farms
28

Table 2-17. Estimated Aggregate Expenditures (Other than Board) Made by Owners of Thoroughbred Breeding Stock and Young Horses in California, 1989
Northern California Southern California Total
V eterinarlan $3,110 Farrier· 630 Vanning 240 Registration Fees & Expenses 330 Nomination Fees 1,000 Stud Fees 2,600 Property Taxes, Horses 160 Other Expenses 1,070
Total $9,140
Source: Estimated from survey data.
$8,390 1,690
620 950
2,000 6,900
450 2,900
$23,900
$11,500 2,320
860 1,280 3,000 9,500
610 3,970
$33,040
and ranches. Utility expenses include the costs associ cash loss of approximately $32.7 million for all Thorated with irrigation of permanent pastures. oughbred farms and ranches in California in 1989.
However, nearly all of these operations own, breed, Thoroughbred farms and ranches received an esti and train many of their own horses and the income
mated $64.8 million in board and training fees in 1989 generated by these horses has not yet been taken into (Tables 2-11and2-16) and incurred expenses totaling account. $97.5 million (Table 2-18). This results in an apparent
Table 2-18. Estimated Aggregate Expenditures Made by California Thoroughbred Farms and Ranches, 1989
Northern California Southern California Total
$1,000s)
Feed and Bedding Salaries and Wages Worker's Compensation Employer Paid Payroll TaRepair and Maintenance Utilities, Irrigation Property Taxes, Real
& Personal Sales Taxesa Other Expensesb
xes
$8,920 8,010 1,400
630 2,800 1,710 1,180
750 4,020
$22,660 17,780 3,100 1,410 6,220 3,800 2,600
1,590 8,900
$31,580 25,790 4,500 2,040 9,020 5,510 3,780
2,340 12,920
Total $29,420 $68,060 $97,480
a Sales taxes come from the following categories: feed and bedding, $1,570; repair and maintenance, $450; miscellaneus, $320.
b Other expenses include veterinary supplies, interest, insurance, advertising, legal fees, etc.
Source: Estimated from survey data.
29

Table 2-19A. Summary of Estimated Cash Flows in the California Thoroughbred Horse Sector, 1989
Payments for Goods & Services (Excluding Government and Intra-Sector)
PAYMENTS To LABOR
Trainers (Table 2-13f • Farms & Ranches (Table 2-18)
Total Payments to Labor
PAYMENTS TO PROFESSIONALS & SELF-EMPLoYEDa
Net Cash Flow to Trainers (Table 2-14) Payments to Jockeys (Table 2-10) Payments to Veterinarians & Farriers
Owners (Tables 2-10 & 2-12) Breeders (Table 2-17)
Total Payments to Professionals & Self-Employed
p A YMENTS FOR FEED & BEDDING
Trainers (Table 2-13) Fanns & Ranches (Table 2-18)
Total Payments for Feed & Bedding
PAYMENTS FOR 0rHER Gooos & SERVICESb
Owners (Tables 2-10 & 2-12) Trainers (Table 2-13) Breeders (Table 2-17) Farms & Ranches (Table 2-18) Horsemen's Organizations
Total Payments for Other Goods &Services
Total Payments for Goods & Services
$1,000s)
$49,870 25,790
$75,660
$4,790 9,900
21,520 13,820
$50,030
$24,030 31.580
$55,610
$3,270 28,700 6,110
31,950 3,600
~73,630
$254,930
a Payments to labor and professionals and self-employed do not include payments to the employees of horsemen's organizations nor to the 125 "other" self-employed (see Table 2-8). These payments could not be identified separately and so are i'ncluded in Payments for Other Goods & Services.
bThis category includes all other payments made by the horse sector (excluding intra-sector and government payments) such as those for worker's compensation insurance, farm repair & maintenance, trainer stable supplies, administrative expenses, utilities, and other expenses.
Source: See referenced tables.
Note that the preceding estimates of expenditures made by the owners of racing stock on farms (Table 211) or breeding stock (Table 2-16) did not account for the costs incurred for boarding or training horses owned by the farm owner. These costs, however, are now counted. For example, the estimate for feed and bedding in Table 2-18 is an estimate of the total expenditure on feed and bedding for all Thoroughbred horses in California except those in training at tracks and major training centers.
Payments to Governments The preceding analysis of cash flow in the horse sector identified and estimated four types of payments to governments made by the horse sector: (1) state sales taxes on goods purchased directly by the horse sector, (2) state license fees paid by owners and trainers, (3) employer payroll taxes paid by trainers and farm and ranch owners, and (4) local government property taxes paid on horses, real, and personal property. However, this does not account for all government payments made by the horse sector. In addition to those payments already identified-< there are three others which will now be discussed.Ju
10 These are government revenues attributed to the horse sector. Other state and local government revenues generated by the Thoroughbred racing industry, as a whole, will be discussed in Chapter 5.
30

Table 2-19B. Summary of Estimated Cash Flows in the California Thoroughbred Horse Sector, 1989
Payments to Governments
CALJFORNIA 5ALF5 TAXES Goods
Trainers (Table 2-13) Farms & Ranches (Table 2-18)
Horsesa Total Sales Taxes
STATE LICENSE F'EEs & F'INEs
PROPERTY TAXES (Local Governments) Real & Personal (Table 2-18) Horses (Tables 2-10, 2-12, & 2-17))
Total Property Taxes
EMPLOYER PAYROLL·TAXESb Trainers (Table 2-13) Farms & Ranches (Table 2-18)
Total Payroll Taxes
Total Payments to Governments
a Sales taxes on horses are an estimated lower bound.
-----($1,000s)i----
$2,010 2,340 4,000
$8,350
1,150
$3,780 1.090
4,870
$3,950 2,040
5,990
$20,360
b Approximately 17 percent are state unemployment taxes; the remainder are federal unemployment and social security taxes.
Source: See referenced tables.
Along with owners and trainers, all persons work Other government payments include the state and ingon California tracks and major training centers are federal personal income, social security, and other inrequired to purchase occupational license fees. Some come-related taxes paid by all persons in the horse. members of this group also pay fines for violation of sector, on income from owning or working withhorses. horse racing rules. The total amount of state license However, we have not attempted to estimate this fees and fines paid by all persons in the horse sector in amount. 1989 (including that presented in Tables 2-10 and 2-13)
The most importantgovernment payments made byis estimated to have been $1.15 million. the horse sector, which have not been accounted for, are
Table 2-19C. Summary of Estimated Cash Flows in the California Thoroughbred Horse Sector, 1989
Estimated Intra-Sector Cash Flows
Owners to Trainers (Table 2-10) Owners to Farm & Ranch Owners (Table 2-11) Breeders to Farm & Ranch Owners (Table 2-16) Stud Fees (Table 2-17) Nomination & Entry Fees (Tables 2-10 & 2-17)
Total Estimated Intra-Sector Cash Flows
($1,000s)
$113,420 26,550 38,220
9,500 6,000
$193,690
Source: See referenced tables.
31

Table 2-20. Estimated Average Market Value of Thoroughbred Horses in California by Region and Their Estimated Total Value, 1989
--------AverageValue-------- Total Value
Northern California Southern California ($1,000s),. Stallions Broodmares Young Stocka Racing Stock
$80,000 8,000 8,500 13,000
$160,000 15,000 14,000 35,000
$106,400 121,790 130,760 353,730
Total $712,680
a Foals, weanlings, and yearlings.
Source: Estimated from survey data.
state sales and use taxes paid bybuyers of horses. State law requires that persons selling more than two horses peryear within the State of California collect state sales tax from the buyer. Moreover, under certain conditions the buyers of horses purchased out of state and subsequently imported into California are required to pay a state "use" tax, which is similar to the state sales tax. Syndicated fractional interests (shares) in stallions are also subject to state sales and use taxes. As mentioned previously, we do not have estimates of private Thoroughbred horse transactions within the state, nor do we have estimates of horse transactions subject to state use taxes. However, based on reports of horses sold through public auctions and claiming races, we have estimated, that at least $4 million of state sales tax revenue was paid by the horse sector from Thoroughbred horse sales inCalifornia during 1989. It shouldbe emphasized that this estimate is a lower bound and, therefore, total state sales and use taxes generated by Thoroughbred transactions may be substantially greater.
Summary Estimates of cash flow in California's Thoroughbred horse sector in 1989 are summarized in Tables 2-19A,
2-19B, and 2-19C. Tables and categories are organized according to thedirectionofthecashflow. Table2-19A gives all direct payments made by the horse sector to households and other industries for goods and services, excluding government and intra-sector payments. Table 2-19B summarizes the estimates that we have of payments made by the horse sector to local, state, and federal governments. Recall that these estimates are not complete since estimates of all government revenues generated by the horse sector are not available. Intra-sector cash flows are summarized in Table 2-19C. These estimates are also not complete since we do not include horse purchases and sales.
Invesbnent in the Horse Sector
Estimates of cash flow for the horse sector of the Thoroughbred industry present only part of the economic picture. Large investments in capital assets are made to supply horses for racing. These are of two basic types: (1) horses, and (2) land, facilities, and equipment needed to produce race horses. Breeders invest in breeding stock, an essential factor of production. At the next level, owners invest in the breeder's finished product-horses ready to begin training for racing. Thoroughbred farm and ranch owners invest
Table 2-21. Estimated Average Market Value of Thoroughbred Horses Stabled at California Race Tracks by Region and Their Estimated Total Value, 1989
--------AverageValuP------- Total Value
Northern California Southern California ($1,000s)
Horses at Tracks $38,400 $73,400 $308,224
32

Table 2-22. Land in Thoroughbred Fanns and Ranches in California, 1989
Northern California Southern California Total
Acres 9,900 14,100 24,000
Source: Estimated from survey data.
in other capital assets-land, facilities, and equipment-which are also necessary to produce and develop the horses. Trainers invest in saddle horses, tack, and stable equipment. However, investment made by the trainers has been estimated to be less than five percent of total investment in the horse sector, and therefore will not be considered further.
Investment in Horses Several difficulties arise in trying to estimate investment in Thoroughbred horses. Horse values are sensitive to a number of variables, many of which are not controllable. These values can, and often do, change instantly. Typical measures of value such as the estimated market value of a Thoroughbred horse, its replacement cost, or expected discounted net present value may yield vastly different estimates. Moreover, estimates of market value, even by experts, are very subjective.
For this report, owners of horses in California were asked to estimate the current market value of their racing and breeding stock. The resulting estimates of average and total market values of Thoroughbred horses in California are given in Table 2-20.
Trainers were asked to estimate the market value of horses under their care as of December 31, 1989. The estimated average and total market values of horses
stabled at California tracks and off tracks, based on the trainer survey, are presented in Table 2-21.
The substantial difference in the estimated average market value of horses at the tracks (based on data supplied by trainers), and the estimated average market value of all racing stock (based on data supplied by California owners), may be due to the fact that the trainer sample is restricted to horses in active training at a race track. These horses have a higher average value since they have generally progressed further in their training and are usually racing regularly. Furthermore, horses in trainingat the tracks havegone through a selection process to qualify them for the level of competitionat California tracks-first a voluntary sorting by their owners and then a mandatory sorting imposed by the track due to scarcity of stall space.
Investment in Fanns, Ranches, and Other Horse Facilities Estimates indicate that approximately 9,900 acres in northern California and 14,100 acres in southern Cali-· fornia were used primarily for Thoroughbred horse production, training, or care in 1989 (Table 2-22). Assuming that the average value of the land is $3,000 per acre in the north and $4,000 per acre in the south, the valueofhorsefannand ranch land in 1989amounted to $86 million.
Table 2-23. Estimated Market Value of Thoroughbred Fann and Ranch Assets in California, 1989
Northern California Southern California Total
land $29,700 $56,400 $86,100 Permanent Facilities 92,200 183,200 275,400 Equipment 8,800 16,200 25,000
Total $130,700 $255,800 $386,500
Source: Estimated from survey data.
33

Table 2-24. Summary of Key Results from Chapter 2
EMPLOYMENT [Table 2-8) NUMBER FfE EMPLOYED
Employed by Trainers 3,525 Employed on Farms & Ranches 1,880 Trainers 580 Jockeys ' 60 Veterinarians & Farriers 265 °other Self-Employed 125 Horsemen's Organizations ~
Total 6,480
PAYMENTS FOR Gooos AND SERVICES OursmE THE HORSE SECTOR* [Table 2-19(A)] ($1,000s)
Labor $75,660 Professionals & Self-Employed 50,030 Feed & Bedding 55,610 Other Goods & Services 73,630
Total $254,930
GoVERNMENT PAYMENTS [Table 2-19(B)] ($1,000s)
California Sales Taxes $8,350 State License Fees & Fines 1,150 Property Taxes 4,870 Employer Payroll Taxes 5,990
Total $20,360
ESTIMATED MARKET
HoRSES {Tables 2-3 & 2-20] NUMBER VALUE ($1,000s)
Breeding Stock 10,070 $228,190 Young Horses 10,460 130,760 Racing Stock 13,350 353,730
Total 33,880 $712,680
ESTIMATED MARKET
THOROUGHBRED FARM AND RAND-I ASSETS (Tables 2-22 & 2-23) ACRES VALUE ($1,000s)
24,000 $386,500
,. Payments to labor and professionals and self-employed do not include payments to the employees of horsemen's organizations nor to the 125 "other'' self-employed. These payments could not be identified separately and so are included with Payments for Other Goods & Services.
Source: See referenced tables.
Table 2-23 summarizes the estimated 1989 market value of California Thoroughbred farm and ranch assets. These figures were based on estimates of asset market value obtained from surveys ofThoroughbred farm and ranch owners. BesidesJand, Thoroughbred farms and ranches invest in permanent or semi-permanent facilities needed for race horse production, including fencing, barns, other buildings, stalls, pens, training tracks, feed storage facilities, water and irrigation systems, and housing for employees. These facilities make up approximately 71 percent of the total investment in Thoroughbred farms and ranches. The category "permanent facilities" probably over
states the value for race horse production since it includes the homes located on the farms and ranches. However, the value of these houses could not be separated in the survey information.
The final category is investment in equipment needed to run the Thoroughbred farms and ranches. This includes general farm/ranch equipment such as tractors, trucks, water trucks, and horse trailers. Also included is specialized equipment such as aqua-tred mills, starting gates, hot walker machines, and veterinary equipment. Equipment accounts for approximately six percent of total farm and ranch investment.
34

Thoroughbred fanns and ranches also invest in tack and stable equipment, but since this is relatively less important, it has not been treated separately.
Summary and Conclusions California's Thoroughbred horse sector, which includes both the breeding and racing subsectors, generates a substantial amount of economic activity. Key indicators of this economic activity are summarized in Table 2-24.
Our estimates indicate that the horse sector provided at least 6,480 FfE jobs and made payments of approximately $255 million to households and other industries for goods and services. In addition, the sector generated at least $14.4 million in direct state and local government revenues, and made additional payments of approximately $6 million for employer payroll taxes (these were primarily to the federal government).
In 1989, there were approximately 33,880 Thoroughbred horses in California, on average, with an estimated market value of some $713 million. About 24,000acres were devoted to the production, care, and development of Thoroughbred race horses in California; the estimated market value of these farms and ranches, including land and other assets, was $386.5 million.
Although millions of dollars are invested and spent, it appears that the racing and breeding business is not profitable for many horse people. Comparing revenue going into the horse sector from the pari-mutuel pool ($131.5 million) with total expenditures going out of the sector ($275.3million)11 suggests substantial negative cash flow for the horse sector.12 Hqwever, this conclusion does not account for horse and stallion service sales and purchases. Intra-sector transactions cancel each other out and therefore do not count as a net cash outflow or inflow. On the other hand, horses and stallion services purchased and sold outside of the sector result in cash outflows and inflows, respectively. The net effect of such transactions may be positive or negative to the horse sector. Although insufficient data exist to provide a definitive estimate of the actual amounts, it appears highly unlikely that the net effectof out-of-sector horse transactions results in a large positive cash inflow. Therefore, it appears that the horse sector, as a whole, had a net cash loss in 1989.
The results of the survey of horse people provide additional supporting evidence for this profitability assessment. Almost 90 percent of the horse owners and 55 percent of the breeders surveyed reported that, on average, over the past five years they had lost money on their Thoroughbred-related activities. Furthermore, many trainers reported difficulty in maintaining a viable business, with costs increasing faster than retrims. ·
Other studies indicate that the negative cash flow problem faced by Thoroughbred horse people in this state is not unique to California. Reports (mentioned in the literature review) from New York, Maryland, Minnesota, Louisiana, Washington and Oregon all indicate that horse people throughout the country are experiencing similar difficulties. It appears that there are strong non-profit motives for being in the Thoroughbred business. Possibly, horse owners, and others, enjoy participation in the sport despite the negative returns. It is also possible that some consider the business a gamble and, lik~ the racing patrons, hope to beat the odds.
In Chapter 5 we bring together this analysis of the horse sector with other sectors of the Thoroughbred racing industry for anestimate otits total impact on the economy.
References Ahern, J. and Thompson, R. An Economic Description of
California's Thoroughbred Industry. California State University, San Luis Obispo, 1984.
Ahem, J. and Lawrence, R.G. The Demand for Horse Racing in Maryland. University of Maryland, 1983.
Allmon,C.I. Minnesota Department of Revenue. Horse Racing in Minnesota: The Impact of 1988 Changes on the State's Economy. St. Paul, MN, 1989.
Cain, E.P., Ellsworth, B. and Haskins, R. Joint Legislative Task Force. Thoroughbred Breeding in New York State: An Analysis. Albany, NY, 1981.
Dike, G.K., Hostin, R. and Harrington, L. (1977). Horse Radng: Its Contribution to Michigan's Economy. Michigan State University.
11 This is the sum ofpayments for goods and services, from Table2-19A, and payments to government, from Table2-19B.
12 It is recognized that for individuals or corporations, tax losses sustained in the horse sector may be used to offset profits realized in other occupational endeavors. No attempt was made to measure this effect.
35

Goode, J.C.,Walker,0.L., Topliff, D.R.,Freeman, D.W ., and Jobes, R.A. Agricultural Experiment Station. Economic Analysis of Selected Horse Production Systems in Oklahoma. Oklahoma State University, 1989.
Huffman, D. and Guidry, R. pepartment of Agricultural Economics and Agribusiness. Economic Impacrofthe Horse Racing Industry in Louisiana. Louisiana State University and Agricultural and Mechanical College, 1979.
Kentucky Horse Council, Kentucky Crop & Livestock Reporting Service USDA, and Kentucky Department of Agriculture. Kentucky Equine Survey 1977. Lexington, KY, 1978.
Kentucky Thoroughbred Association, Inc. A Fact Book on the Kentucky Thoroughbred Industry 1989. Lexington, KY, 1989.
Killingsworth Associates, Inc. The Economic Contribution of the Thoroughbred Horse Racing and Breeding Industry to the State of Washington. Lexington, MA, 1984.
KPMG Peat Marwick. The American Horse Council. The Economic Impact of the U.S. Horse Industry. Washington, D.C, 1987. ·
Lawrence R.G. Thoroughbred Yearlings: Factors Behind the 1973 'Boom' in Yearling Prices. University of Maryland, 1974.
Lawrence, R.G. Maryland's Racing Industry: Its Participants, Organization and Economic Impact. University of Maryland, 1972.
Lawrence, R.G. and Downes, J.M. Costs and Returns of Maryland's Standardbred Breeders. University of Maryland, 1981.
Lawrence, R.G., Jones, W. and Bender, F. Market Analysis of Maryland's Horse Industry. University of Maryland, 1978.
Michigan State University. Agricultural Experiment Station. Michigan CommercialHorseIndustry. Michigan State University, 1976.
New Jersey Department of Agriculture. Ne:w Jersey Equine Industry. Trenton, NJ, 1987.
New York Crop Reporting Service. New York Equine Survey 1978. Albany, NY, 1979.
Oregon State University. Survey Research Center. Oregon's Race Horse Industry: An Estimate ofBreeding and Racing Cash Flows. Oregon State University, 1977.
36

Chapter 3. The Racing Associations
The racing associations are another key participant in the Thoroughbred horse racing industry (Recall Figure 1-1). Their role is to bring the product supplied by the horse sector-race horses-to the ultimate customers-racespectatorsand wagerers. In economic terms, spectator and wagering patrons demonstrate demand for Thoroughbred racing which, through the horse racing associations, is translated into a derived demand for Thoroughbred race horses. Horse people respond to this demand by producing horses, creating the demand noted in Chapter 2 for such inputs as feed, supplies, hired labor and professional services.
Over 90 percent of the statewide Thoroughbred handle is generated by six racing associations that conduct their meets at the five major Thoroughbred tracks: Bay Meadows, Golden Gate Fields, Hollywood Park, and Santa Anita, and Del Mar. Consequently, this chapter will focus on the economic activity of these six associations. After reviewing the organization and structure of the racing association sector, this chapter will examine their economic contribution to the State of California. Realizing that the continued financial viability of the racing associations is essential to the overall health of the entire industry, the last section of this chapter will assess the aggregate profitability of the six major racing associations.
Prior Research on Racing Associations
Many of the more general studies cited elsewhere in this report are of interest to the associations because of the critical link among the industry participants. Issues of direct concern to the associations include parimutuel taxation and distribution, trends in attendance and wagering on Thoroughbred racing and, of course, the specific issue of association profitability.
The 1965 study by the Stanford Research Institute (cited in Chapter 1) analyzed historical trends onattendance and wagering at California tracks, as well as racing association profitability. Although both attendance and wagering had been growing in absolute terms prior to 1965, the SRI report pointed out that the r~te of growth relative to overall increases in population and income in California was quite slow. This problem was particularly acute in northern California.
. In addition, the SRI study concluded that association profitability; based on the then current market v.al~e of the racing assets, was low when compared to similar businesses. The lack of profitability appeared
to be leading to a corresponding lack of investment on the part of the associations. A decrease in investment activity was reported to have serious implications for the entire racing industry, as the horse sector relies on the associations to provide them with safe racing conditions, and the fans expect a comfortable environment from which to view and wager on horse races. Several suggestions were offered in the SRI study to combat slow growth and low profitability including changing the size and/or distribution of the takeout adding more ra'cing days to the calendar, and consoli~ dating racing activities in northern California.
A collection of papers specifically addressing the northern California horse racing industry was published by the School of Business at San Francisco State University in 1981 (Ingraham). Topics for the various papers include off-track wagering, the organizational structure of Bay Meadows Racing Association, factors influencing the track surface at Golden Gate Fields, and analysis of the market potential for new patrons at the northern California tracks.
In addition, several of the economic impact studies mentioned in Chapter 2 included limited information on the racing associations in their respective states, along with historical trends on attendance and wagering. The 1982 study assessing horse racing and breeding in New York State (Cain et al.) contained a section on the economic impact of the racing associations in New York State. This section included statistics on attendance (lnd handle, followed by estimates of association revenue and employment. Most notably, the report contained a five-year trend analysis of New York tracks, which indicated that every New York association would experience future financial losses unless the economic environment improved.
Similar conclusions were reported in Louisiana by Huffman and Guidry (1979). In addition to reporting on the level of economic activity in the horse sector, the authors provided estimates of the income and employment effects of the racing associations in Louisiana. The study reported that the earnings of the Louisiana associations were at competitive levels in 1979. However, the authors asserted that if the current inflationary pressures continued, the associations might face financial difficulties in the future.
A study on the the horse racing and breeding industries in Alberta, Canada (Deloitte Haskins & Sells Associates, 1986), concluded that horse racing had a positive effect on local income and employment, but that the industry in Alberta was plagued with prob
37

lems common to the racing industry throughout North America. These problems included: 1) increased competition from other sports activities, 2) the age structure of the race-going public, 3) the need for the associations to market their product (horse races) more effectively, and 4) a lack of adequate return on investment to Alberta's horse owners. ,
Chapter4 containsan extensive review of the literatute pertaining specifically to pari-mutuel taxation and the public demand for Thoroughbred racing.
Organization and Economic Structure
Overview of Sector
In their role as market intermediaries, the Thoroughbred racing associations provide vital services to the other participants in the horse racing industry. For example, they provide and maintain stable and training facilities for the horse people. For the racing patrons, the associations maintain the grandstand area and related facilities, provide food and parking services, and generally attempt to present the horse racing event in an appealing manner. In addition, the associations collect and distribute all pari-mutuel revenues for the State of California.
The State of California grants the associations li·censes to offer pari-mutuel wagering on Thoroughbred racing. The state is divided into distinct racing regions, and racing days are allocated to each association such that there is only one major Thoroughbred race meeting operating at one one time in each region. As a result, each association operates with monopoly power in the production of Thoroughbred races. The only entities aside from the major Thoroughbred associations that are allowed to conduct Thoroughbred races are the state fair and certain county fairs (known as the 'racing fairs'). The racing fairs, however, do not limit their meets to Thoroughbred races.
The racing associations are heavily regulated. The "Horse Racing Law," found in Chapter 4 of the Business and Professwns Code, conveys regulatory authority over horse racing to the California Horse Racing Board (CHRB). The CHRB currently consists of seven members, each appointed by the Governor of California. CHRB regulation, as it relates specifically to the associations, takes the fonn of licensing individual racing associations and allocating racing days among asso
. ciations. In addition, the CHRB influences numerous facets of the association's business ranging from record keeping to vendor concessions.
The development of satellite wagering in 1985, and its subsequent expansion throughout California, brought another participant into the association sector
of the racing industry. Satellite wagering constitutes an important structural change for California racing because it expands the market area for Thoroughbred racing. Satellite wagering also presents the associations with additional challenges - how to make horse wagering more accessible, without reducing on-track wagering activity or saturating the market.
Satellite wagering adds a degree of complexity to the industry because it puts yet another middleman between the spectator/wagerer and the live racing event. This problem has been acknowledged by the management of some of the Thoroughbred associations, who have voiced the concern that satellite wagering puts their product in the hands of vendors, leaving the associations with little control over the manner in which the product is presented. More detail on the location and function of the satellite wagering facilities in California will be given in a subsequent section of this chapter.
The California Thoroughbred Racing Associations
All of the major Thoroughbred tracks, with the exception of Del Mar, are owned by "for profit" business entities. Del Mar is owned by the State of California, and. operated by a non-profit corporation. Golden Gate Fields is owned by Santa Fe Pacific, Inc., and leased to a British corporation. The remaining three tracks are owned by publicly traded American corporations and are leased to the associations that conduct horse racing meets. The ownership status of each of the major tracks in California is summarized in Table 3-1.
In recent years, the three publicly traded Thoroughbred racing organizations that own Bay Meadows, Hollywood Park, and Santa Anita race tracks have reorganized and divided their operations into separate units, an "operating company'' and a "realty company'' (See Figure3-1). The racing associations that are licensed by the state to conduct Thoroughbred race meets (lre subsidiaries of the operating companies. The realty companies own the respective race track facilities and rent them to the operating companies. The rent paid by the operating companies to the realty companies is, in part, based on negotiated percentages of the total pari-mutuel handle generated by on-track and satellite wagering and is subject, in some cases, to guaranteed minimum levels of rent. Additionally, the operating company is generally responsible for the payment of all track-related insurance and property taxes, as well as maintenance and repair of the facilities.
The stocks of the operating and realty companies trade as paired shares, so the track facilities and the companies that operate the tracks are owned by the
38

Table 3-1. Summary Information on Major California Thoroughbred Tracks, 1989
Track
Golden Gate Fields Bay Meadows Hollywood Park Santa Anita Del Mar
Location
Albany San Mateo Inglewood Arcadia Del Mar
Track Owner
Santa Fe Pacific California Jockey Club Hollywood Park Realty Santa Anita Realty State of California
Founded
1940 1934 1938 1934 1937
Source: Annual reports of the respective associations and Mary Fleming, A History of the Thoroughbred in California, California Thoroughbred Breeders Association, 1983.
same shareholders. This structure waschosen because realty companies operating as real estate investment trusts (REITs) are free from income taxes at the trust level, whereas dividends paid by other corporations, including the operating companies, are taxed at the corporate and shareholder levels. To qualify as a REIT, companies must pay out at least 95 percent of their earnings as dividends to shareholders. Accordingly, the realty I operating company structure provides an opportunity to reduce the corporate income tax liability of the entire horse racing entity, while compensatingownersof the paired stock through rent paid by the operating company to the REIT and reimbursed as dividends to REIT shareholders. The operating companies have historically paid no dividends.
Pacific Racing Association/Bay Area Sport Enterprises Golden Gates Fields is located on the San Francisco Bay waterfront, on the border of the neighboring cities of Albany and Berkeley. Bay Area Sports Enterprises (BASE), a real estate investment trust, held the lease on Golden Gate Fields from the late 1940s until 1988. During that time, BASE subleased the track to Pacific Racing Association (PRA) for the purpose of conducting Thoroughbred racing. Prior to 1986, two associations held horse racing meets at Golden Gate Fields: PRA and Tanforan Racing Association. However, after a legislated expansion of racing days in California, PRA and Bay Meadows Racing Association pur~ chased all of Tanforan' s racing days.
racing at Golden Gates Fields. Potential uses of the site subsequent to the expiration of the lease range from continuing "business as usual" to full-scale urban development.
Bay Meadows Operating Company/California Jockey Club ·
Bay Meadows race track is located in the city of San Mateo, approximately 19 miles south of San Francisco. The race track is owned by the California Jockey Club, which operates as a real estate investment trust. Bay Meadows Racing Association (BMRA) has been licensed to conduct race meetings at the Bay Meadows track since 1934. BMRA is a wholly-owned subsidiary of Bay Meadows Operating Company, which leases the track from the California Jockey Club.
The realty company's income is almost entirely dependentonrentfromBayMeadowsOperatingCompany pursuant to a master lease tying annual rents to the amount of pari-mutuel handle derived from wagers at Bay Meadows race track. Because of the value of its real estate assets in relationship to the earnings received from the lease, the real estate company has actively pursued mixed-use development of a 40-acre parcel currently used as a training track. Such development is dependent upon completion of an environmental impact report and adoption of a specific plan by the city of San Mateo for a 325-acre area which includes the training track site.
In December of 1988, the shareholders of BASE and PRA approved a plan for Ladbroke Group, PLC of the United Kingdom to purchase 100 percent of the outstanding stock of PRA for $41 million. The final closing occurred on January 3, 1989; since that time PRA has been owned and operated by Ladbroke Group.
The lease with Santa Fe on the property underlying ·the track expires in 2002. Consequently, there is some question as to the long-term future of Thoroughbred
Hollywood Park Operating Company/Hollywood Park Realty Enterprises The Hollywood Park (HP) race track is located in the cityof Inglewood, In the west side of Los Angeles, only three miles from the Los Angeles International Airport. The track is owned by Hollywood Park Realty Enterprises, Inc., one of the three horse racing real estate investment trusts. Hollywood Park Operating Company leases the track from the Realty Company
39

Figure 3-1. Structure of Three Major Thoroughbred Racing Organizations
,.
Horse Racing Organization
Operating Company
Racing Revenues
Realty Company
Rent J--'1111....i Real Estate Revenues
Expenses
NET REVENUES NET REVENUES
Potential Capital Appreciation
Dividend and Potential Capital
Appreciation
Paired Common Stock
40

for the purpose of conducting an annual Thoroughbred race meet from late April through late July. In February of 1987,Hollywood Park Fall Operating Company, a wholly-owned subsidiary of Hollywood Park Operating Company, was formed to conduct an annual Thoroughbred race meet in November and December.
Santa Anita Operating Company/Santa Anita Enterprises The Santa Anita race track is located in the central partion of Arcadia, approximately 13 miles northeast of downtown Los Angeles. Santa Anita Enterprises, Inc., operating in conjunction with the Santa Anita Operating Company as a real estate investment trust, owns the Santa Anita race track. The race track is leased by the realty company to the Los Angeles Turf Oub (LATC), a wholly-owned subsidiary of Santa Anita Operating Company, Inc., for a predetermined portion of the parl-mutuel handle. LATC conducts an annual 17-week Thoroughbred racing meet at Santa Anita from late December through mid-April.
Santa Anita Realty also owns the real estate underlying the Santa Anita Fashion Park Shopping Center. The Fashion Park is situated onapproximately 73 acres ofland that wasonce a training track for Thoroughbred horses. In addition, the realty company is a limited partner in Anita Associates, which owns and operates Fashion Park, and owns a 72,000 square-foot medical building built in 1986.
Oak Tree Racing Association TheOakTreeRacingAssociation(OakTree)wasincorporated as a mutual benefit, non-profit corporation in 1968 and began Thoroughbred racing during the 1969 racing season at the Santa Anita race track. Oak Tree sublets the Santa Anita race track from LATC to conduct its annual Thoroughbred horse racing meet. The Oak Tree meet commences in late September or early October, and lasts five to six weeks. Oak Tree is distinguished from the other five associations in that it uses the facilities of another association. Moreover, the net proceeds of OakTree's racing activities are devoted to the welfare of the Thoroughbred racing industry including the support of equine research, care and breeding. ·
Del Mar Thoroughbred Club
The Del Mar race track is located on the fairgrounds of the 22nd Agricultural Association District in the city of Del Mar, approximately 18 miles north of central San Diego. The Del Mar Thoroughbred Club (DMTC), a non-profit corporation, )eases the track from the State of California for the purpose of conducting its summer meet. Under its lease agreement with the state, DMTC
is allowed to retain 25 percent of the racing profits for working capital and track improvement.
Aside from a brief period of closure during World War II, the Del Mar track has been the site of an annual Thoroughbred horse racing meet since 1937. The race track re-opened in 1945, but growth in attendance, pari-mutuel handle and purses was too slow to provide revenue for appropriate maintenance of the facilities. By the mid-1960s, the grandstand and backstretch were in disrepair. When the initial lease to the Del Mar Thoroughbred Club came to its end, the State of California enacted legislation establishing the State Racetrack Leasing Commission, charged with the responsibility of controlling and overseeing the leasing of the race track. In 1968, the commission awarded the Del Mar lease to the DMTC for a 20-year period, commencing in 1970. That lease established a partnership unique in North American horse racing, committing, as it does, all the profit of Del Mar racing to the improvement of facilities and the betterment of Thoroughbred racing.
The Satellite Wagering Facilities
The 1980swerea decade of significant structural change for the horse racing industry. The California State Lottery, initiated in October ofl985 with the "scratcher" game, was a major catalyst for change. While most people anticipated success for the new lottery, sales from the first year were well in excess of the original projections. The introduction of a variety of new games, combined with a particularly intensive advertising campaign, ensured the lottery' scontinued popularity for a number of years. In the very recent past, however, the public's enthusiasm for the lottery appears to be diminishing.
As a legal wagering alternative, the lottery competes directly with pari-mutuel betting on horse races. While the lottery does not offer participants the spectator appeal of horse racing, lottery wagering is much simpler to understand and less demanding of participants' time. Moreover,lotterywageringismorewidely available to Californians because of the broad geographical distribution of the lottery retail sites, the density of such sites in each area, the frequency of lottery games, and the low price of lottery participation. In short, the lottery brings wagering to the consumer in a convenient, mass merchandized format. For these reasons, introduction and expansion of the lottery games has been of concern to the participants of the horse racing industry, who regard the lottery as a state-funded incursion on the monopoly franchise originally granted to the racing associations.
In response to this source of competition, the horse racing industry sought and gained authorization to
41

establish satellite wagering in California. Among those involved with satellite wagering are the host track, the guest site and the simulcast service suppliers, who facilitate the transmission of the satellite signal from host to guest. The track holding the live racing meet is called the host track. The races are sent via satellite from the host track to an off-track receiving site called the " guest location. Guest locations amequipped with monitors to televise the races, and pari-mutuel facilities so that people can place their wagers. Money wagered at the guest site is combined with the host track parimutuel pool for thedetennination of pari-mutuel odds. Initially, only tracks holding a license to conduct live Thoroughbred racing were eligible to act as guest locations. The list of potential guest sites has since expanded to county and agricultural fairs other than racing fairs, and more recently, Indian reservations.
The video system is operated by an entity that is separate from both the host and guest locations. This ensures the continual flow of signal from host to guest, no matter which track is actually hosting the live meet. The video signals for the north are handled by Simulcast Enterprises, Inc. Satellite broadcasts in southern California are managed by Southern California Off Track Wagering Incorporated.
Simulcast wagering began on an experimental basis in the northern region of California in 1985. The CHRB has recommended the controlled expansion of satellite wagering each year since the initial successful season (Table 3-2). Satellite wagering was expanded to the southern region in 1987. Figure 3-2 displays the location of every guest satellite site in California as of December, 1989.
Economic Environment
Association revenues are derived from two major sources: pari-mutuel activities, and spectator services (which includes admission and parking fees) pro
vided atrace tracks. This subsection presents a detailed discussion of the revenue sources.
Revenue From Pari-mutuel Activities Since the introduction of satellite wagering in California, pari-mutuel activities include involvement in televised, as well as live Thoroughbred racing. Pari-mutuel revenue may be generated from the following activities:
1) hosting a live meet, 2) transmitting a satellite signal to a guest location in California, 3) transmitting a satellite signal to a guest location outside of California, 4) acting as a guest location for a live meet hosted at another track in California, and 5) acting as a guest location for a live meet hosted outside of California. Not all of the associations are involved in all of the satellite activities listed above. When bets are taken at a guest location, the money wagered at the guest facility is pooled with the money wagered at the host facility for the determination of pari-mutuel odds.
The state government legislates the takeout rate; the associations are responsible for distributing the resulting takeout among each of the industry participants. The association's share of the takeout is called the track commission. The commission is a legislated percentage of the total takeout, and it varies depending onwhether the handle was generated at a live meet, or a guest receiving site. Furthennore, under existing legislation, the state receives a greater share of the takeout as the total pool increases. The progressive nature of the state tax means that the share going to the associations and the horsemen (in the form of purses) decreases as the pari-mutuel pool increases. Because of the state's regulatory role, the associations cannot directly control the price that they charge for pari-mutuel betting.
On a nominal basis, total pari-mutuel revenue retained by the associations has grown through time
Table 3-2. Summary Statistics on Satellite Wagering Facilities in California, 1985-1989
1985 1986 1987 1988 1989
Number of Sites Total Number of Days Attendance* Handle
5 194
207,000 $36,881,693
6 973
907,362 $166,752,490
14 1,604
1,211,398 $221,721,573
22 4,498
3,427,097 $660,799 ,512
'26 5,204
3,833,8&3 $761,985,463
.. The 1985 figure is an estimate.
Source: California Horse Racing Board, Statistical Report of Operations, Annual Issues.
42

Fresn
Figure 3-2. Location of Satellite Wagering Facilities in California, 1989
,------------------------~
-------------1-- Eureka •---------Anderson
-------,...._ Santa Rosa
•-------------Sacramento
e----------""ic------ Vallejo •------------- Stockton ____________....,.___ Pleasanton
'------------...11o.--- Albany
•
Bakersfield •
•
Arca di Inglewoo
•-Indio Pomo
Del Mar San Bernardi
Santa Mari
Santa Barbar
SantaOara San Mateo
---- Lancaster --------Ventura
43

---
Figure 3-3. Total Pari-Mutuel Revenue Retained by Major Thoroughbred Racing Associations, Nominal and Real* Dollars, 1965-1989
$130
$120 --·-------·---------·-------------------·----·-------·-------------.o;..io-• $110 --·------------------------- ..... -----·----·-----------------·----·-~---- ------ --~-- -- .-- -- --- --· -- -- --- -- .-- ------- ----- --- .__....,.._ ·-· -- --........--· ----$100 $90
$80§"'
] ~~ __..........$50 - - • - - - - - - - • - - - - • - - - - • - - - - • - - - - - - - - ••/.: - ;:. • - - - - - - - - - - - - • - - - - - - - - - - - - - - - -
$40 ----- ----------. ---- --- -- .•.....-=.---- -- --- --·-- -- ·----·--. -- --·-- -- . -- -- --$30 ----------·----...,.~~----·---------·----·----·----·--·----·----·----·-·---·-· .$20 ·-·--·....: -- ·----· -- -- • -- -- • -- -- --- -- • -- -- • -- -- - -- --- -- • -- -- • -- -- - -- -- • -
~o t··;H;H;· 0;--; 0·; ··;H.-- ·.---.- O-.- --.- --.-- O.-- -.- O-.---: H,- --.-- ·,-- -- O-,---,- --,1
1965 1967 1969 1971 1973 1975 1977 1979 1981 1983 1985 1987 1989
•·nominal 0 real
*Real dollars are deflated by the California CPI (1982-1984=100). ·
Source: California Horse Racing Board, Statistical Report of Operations, Annual Issues.
along with increases in the pari-mutuel handle. How associations have far more control over the non-pariever, the growth in pari-mutuel revenues has been far mutuel prices and need not share profits associated less dramatic on a real basis (Figure 3-3). with non-parl-mutuel activities with the state. On the
'· other hand, some industry participants argue that the The success of simulcasting has increased total prices of food, parking, admission and programs are
handle. However, these revenues must be shared with more visible to the public than is the takeout rate. the guest facility and signal-carrying company, so the host association receives a smaller share of the total There is no secondary source of data for historical pari-mutuel pool. This has been detrimental to asso trends on revenue generated from the provision of ciation pari-mutuel revenues. That is, the growth in spectator services. However, it is reasonable to astotal handle due to satellite :wagering has in part been sume that trends in these sources of revenue will offset by a reduction in on-track handle and the fact follow the general pattern of trends in attendance. As that they receive a smaller share of the off-track handle. illustrated in Figure 3-4, total attendance has grown Moreover, attendance-related revenues from admis significantly since 1953. However, virtually all of the sions, parking and concessions have suffered as pa gain in the past four years can be attributed to the trons choose off-track rather than on-track facilities. satellite wagering facilities. As a result, the atten
dance-related revenues of the major Thoroughbred The respective influence of such countervailing fac associations have probably suffered as patrons choose
tors as racing days and the lottery on race track atten off-track rather than on-track facilities; dance and wagering are quantified in Chapter 4.
Economic Contribution of theRevenues from Spectator Services The main sources of non-pari-mutuel revenue include Thoroughbred Associations
~~-----~~~~~~~---·----·----·---~·---·----~~~--~~~-~~~~:~~~::::::~::::::~.~-~~::~~~:::~::~::::::~:~:~:~:
admission fees, and charges for goods and services Data Sources and Methodologysuch as food, parking, programs and boxseats. In
Specific data regarding handle, attendance, and racinggeneral, these sources represent less than a third of days were assembled from annual statistical reports total association revenues. However, the individual
44

Figure 3-4. Total and On-Track Attendance, 1953-1989
11
10
Ell 9c: a . ...... 8-. 8 -------------------------------------------------- ---------~-----.... 0
"'a::: 0 7::3'8
·-· \________________!,
I
6
5
1953 1957 1961 1965 1969 1973 1977 1981 1985 1989
[J total attendance
• on-track atte~dance
Source: California Horse.Racing Board, Statistical Report of Operations, Annual Issues.
published by the CHRB. Financial information on the Thoroughbred-related activities of the racing associations for the upcoming cash flow and profitability sections was extracted from financial reports that the associations are required to file with the CHRB. Additional information on the associations that operate as subsidiaries of larger public corporations was taken from the corporate annual reports and other documents filed with the Securitiesand Exchange Commission (10-Ks). Every effort was made to ensure that the final numbers reflect only Thoroughbred-related activities for each association.
The variety of reporting practices followed by the six associations required standardization of the revenue and expense categories. Once the data was collected and standardized, the numbers were sent back to the individual associations for confirmation before aggregating to industry levels.
The employment data was obtained from surveys that were sent to each association. Because only 50 percentof the associations responded, it was necessary to extrapolate to a statewide total. Estimates for the associations that did not respond were based on the length of the race meet, additional information available from public documents, and gross association payroll.
The dynamic market for real estate in California complicates the calculation of a rate of return on assets
for the Thoroughbred racing associations. All of the tracks in California are located in major metropolitan areas, where development pressures have markedly increased land values. Consequently, book value is no longer an accurate reflection of the value of the land resources devoted to horse racing meets in California.
To facilitate the calculation of a meaningful rate of return on horse racing activity, an independent firm was employed to perform a Limited Scope Appraisal of the land underlying the five major Thoroughbred tracks in California. The resulting values were based on a visual appraisal of the property, as well as readily available public and private information. Issues such as location and the current social/political environment of the surrounding communities were considered by the appraisers. However, considerable uncertainty exists as to how local authorities would allow race track sites to be developed so appraisal values are only approximate. Appendix B-1, the Executive Summary of the appraisal, provides an overview of the methodologies employed.
Cash Flow
The direct revenues and expenditures of the Thoroughbred associations represent an important source of economic activity for the State ofCalifornia. In 1989, the associationsspent approximately $197 million conducting the business of horse racing (Table 3-3). These expenses supported thousands of association employ
45

Table 3-3. Aggregate Revenues and Expenses for the Six Major Thoroughbred Racing Associations in California, 1989
Revenues
Pari-Mutuel I'
Admissions Concessions, Parking, & Program Other
Total Revenue
Expenses
Wages & Benefits Rentals & Services Contracted Materials & Supplies Marketing Professional Services Utilities Depreciation Net Payments to Charity Insurance Taxes: Real, Personal, Other Interest Expense Other
Total Expenses
Net Revenues
$134,264,000 28,930,000 34,667,000 12,185,000
$210,046,000
$88,019,000 50,733,000 9,320,000
10,704,000 4,286,000 5,077,000 5,916,000 2,013,000 6,317,000 2,889,000 3,115,000 8,845,000
$197,234,000
$12,812,000
Source: Summary ofThoroughbred~related revenues and expenses on file attheCHRB, audited financial statements, and personal communications with association personnel.
ees, as well as many other businesses throughout the state that provide goods and services to the horse racing industry.
Revenue
Pari-mutuel revenues accounted for approximately 61 percentofassociation gross revenues in 1989 (Figure 35). These revenues include funds generated by satellite wagering activity, aswell as the commission earned from hosting a live meet. Most of the remaining revenue is derived from admission fees and the provision of spectator services.
Aggregate figures, such as those presented in Table 3-3, can effectively mask the dynamic nature of an industry. Becausepari-mutuelrevenuesconstitutethe majority of the total revenue for each association, it is instructive to consider these numbers more closely. It is reasonable to assume that the total cost of conduct
ing a Thoroughbred meet is highly correlated with the number of days the facility is open to the public. Therefore, pari-mutuel revenue earned on a per-day basis provides a useful perspective on the financial position of the associations (Figure 3-6). As illustrated in Figure 2-4 of Chapter 2, the number of Thoroughbred racing days has steadily increased. As a result, there has been very little real gain in average parimutuel revenue earned per day by the associations. Daily pari-mutuel revenue has fluctuated through time with legislative changes in the track commission, and with fluctuations in daily attendance and handle per attendee. However, the overall trend in daily parimutuel revenues has been downward since 1972. The rate of decline hasbeen more thanone percent per year since 1978. While precise historical data on the cost of conducting .meets is not available, it is unlikely that those costs have followed a similar decline. Accordingly, the associations find themselves in a classic cost
46

Figure 3-5. Approximate Breakdown of Association Revenue, California, 1989
• Pari-mutuel
D Admissions
II Parking & Concessions
61% 11111 Other
5%
18%
Source: See Table 3-3.
Figure 3-6. Pari-Mutuel Revenue Retained by Major Thoroughbred Racing Associations Per Day, Nominal and Real* Dollars, 1965-1989
$250 ----· - -- --- - ·- __ ,;.. - -- - • - -- - -- -· - -- - • - -- - -- -- --- - • - -- - ·- --- -- -- - --;:;;•
./ $225 - -----------·--------.....~----·-·' $200 ---- -------·-- -·----·------------·---------.-...:...~-------"D--CJ!"'""'<:::i....::i-.
1$175 ----· - -- ---- ·----·---- ·- -- --- -·- -- -· - --~7.t'..__ -.----·--------- ---. _g $150 - -- - - - -- - -- - -- --- • - -- - • - --- -- -· - -- -·;r- -- -- ---- ·- -- -·------ -- --- -· ~ . /
$125 - -- -· - -- - -- - • - -- - • - -- - • - -- - -- - ·-·-. - -- - -- -- - -- - • - -- - • - -- - -- -- - -- - • ./
$100 - -- - • - -- - -- - ·- ---· - -- - .__,,./.__ -· - -- - • - -- - ---- - -- - • - -- - ------- -- - -- - • ....... ........ $75 --------------,r--------------·----------------------·------------·.-·,._......·-· $50 I I I I I I I I I I I I I I
.
I I I I I I I I
.
I I I 1965 1967 1969 1971 1973 1975 1977 1979 1981 1983 1985 1987 1989
•·nominal· O real
,. Real dollars are deflated by the California CPI (1982-1984=100).
Source: California Horse Racing Board, Statistical Report of Operations, Annual Issues.
47

Figure 3-7. Approximate Breakdown of California Association Expenditures (A) and Breakdown of the Category "Other'' (B), 1989
,.
A. Association Expenditures
25%
• WagesandBenefits
D Rentals& Services Contracted
DI ether
B. "Other" Category
• 18% 16% D
f3j
11115%
l[[J19%5%
~
m11%
~
10% 9% ~
Materials & Supplies
Marketing
Professional Services
Utilities
Depreciation
Insurance
Taxes
Interest
Other
Source: See Table 3-3.
48

Table 3-4. Estimated Payments to Governments by California Thoroughbred Racing Associations, 1989
Payments to Governments -------1$1,000s)-----
Sales Tax (State Government) $880 Occupational License Fees and Fines $180 Property Tax (Local Government) $2,890 Employer Payroll Tax
State $2,070 Federal 5,980
Total Payroll Taxes $8,050
Total Payments to Governments $12,000
Source: Estimated from survey data and CHRB Annual Reports
price squeeze in the provision of horse racing and pari-mutuel services.
Satellite wagering has had a substantial impact on the components of association pari-mutuel revenue. Since the introduction of off-track wagering, an increasing percentage of the total pari-mutuel revenue has been derived from wagering activity at satellite guest locations. In addition, satellite capabilities allow the associations to remain open to the public yearround by acting as guest sites for other race tracks during the time that had traditionally been their offseason.
Expense
As is true with other service industries, the direct pretax expenses incurred by the associations are dominated by personnel costs (Figure 3-7). The approximately $88 million spent on payroll in 1989 accounted for nearly 45 percent of total pre-tax expenses. Another major expense category for the racing associations in 1989 was rentals and services contracted. Within this category race track rent amounted to almost $38 million, or just over 75 percent of the total services contracted. Rental of the totalister equipment is another important component of this category. For several of the associations, the race track rents are ultimately
Table 3-5. Handle, Attendance, and Racing Days by Association, California, 1989
Days Attendance Handle
Northern Bay Meadows 108 (22%) 1,324,712 (13%) $246,942,069 (11%) Pacific Racing Assoc. 110 (23%) 1,563,235 (15%) 305,773,774 (13%)
Sub Total 218 (45%) 2,887,947 (28%) $552,715,843 (24%)
Southern Hollywood Park 98 (20%) 2,448,003 (24%) $590,749,140 (26%) Los Angeles Turf Oub 90 (19%) 2,571,768 (25%) 654,077,964 (28%) Oak Tree 32 (07%) 900,512 (09%) 199,121,852 (09%) Del Mar 43 (09%) 1,491,245 (14%) 314,786,781 (14%)
Sub Total 263 (55%) 7,411,528 (72%) $1,758,735,737 (76%)
Total 481 10,299,475 $2,311,451,580
Source: California Horse Racing Board, Statistical Report of Operations, Annual Issues.
49

Table 3-6. Handle Per Patron, Average Daily Handle and Attendance by Association California, 1989 '
Handle/Patron Handle/Day Attendance/Day Northern
Bay Meadows Pacific Racing Association Average
$186 $1% $191
,. $2,286,501 $2,779,762 $2,535,394
12,266 14,211 13,247
Southern Hollywood Park Los Angeles Turf Park Oak Tree Del Mar Average
$241 $254 $221 $211 $237
$6,028,052 $7,267,533 $6,222,558 $7,320,623 $6,687,208
24,980 28,575 28,141 34,680 28,181
Source: California Horse Racing Board, Statistical Report of Operations, Annual Issues.
dispersed to shareholders through the REITs that own the facilities. As noted earlier, rental payments are based on fonnulas that incorporate a percentage of the total handle wagered. Consequently, the rents on an average daily basis are significantly lower in northern California than they are in the s6uth.
Payments to Governments
·The Thoroughbred racing associations, like those who participate in the horse sector, make payments to state, local and federal governments (Table 3-4). In addition to sales tax on goods, the state government collects occupational license fees and fines from the racing association sector. In 1989, these sources amounted to over $1 million. The associations also contributed over $2 million towards state payroll taxes in 1989. Data on association expenditures indicated that the associations paid almost $3 million in real and personal property taxes to local governments in 1989. The local governments also benefit from a legislated percentage of the pari-mutuel pool, which will be detailed in Chapter 5.
Comparison of 1989 Attendance and Wagering Activity Among Tracks
As the following figures illustrate, there is a substantial.r~gional di~ference in theattendanceand wagering activity of racmg patrons in California. In 1989, the southem associations accounted for approximately 75 percent of total statewide Thoroughbred racing handle and attendance, but only slightly more than halfof the racing days (Table 3-5). The Los Angeles Turf Club an~ the Hollywood Park Operating Company compnsed between 70 and 75 percent of the total southern California handle and attenda~ce and 73 percent of the
total southern California racing days. Bay Meadows and Golden Gate Fields split the northern handle, attendance and racing days approximately equally.
Table 3-6 presents the data ona per-patron and perday basis. Notice that while the state allocates racing days (~ageringopportunities) almost equally between the northern and southern regions, the southern tracks drew almost twice as many patrons per day as the northern tracks in 1989. Moreover, these southern patrons tended to wager more than their northern counterparts. However, within the respective regions, wagering activity is remarkably similar across associations, suggesting that patron behavior is fundamentally different between the two regions. Historical data suggests that these patterns are not simply a one year anomaly. That the northern tracks offer longer meets but experience markedly lower attendance and handles likely reflects the smaller population and differing traditions, weather and entertainment opportunities of the San Francisco Bay Area.
Association Employment Levels
Much of the overall economic impact of an industry stems from the job opportunities created by the major employers Of the industry. Because secondary sources of information indicate that the employment structure varies rather dramatically between northern andsouthern California, it is difficult to estimate the exact number of people employed by this sector of the industry from the survey data that was acquired from southern California. However, an industry wide extrapolation of the survey data indicates that there were approximately. 3,68? full-time equivalent positions created by theCahforn1a Thoroughbred associations in 1989(Table 3-7).
50

Employment within the association sector of the industryisboth highlyseasonal and highly unionized. Seventy percent of the total association labor force is employed in positions required to supportThoroughbred racing during meets. Results from the employment survey indicate that it takes approximately 2,000
Table 3-7. Estimated Employment in the Association Subsector, • California, 1989
Pari-Mutuel and Racing .1,150 Administrative, Accounting and Operations 420 Marketing and Publicity 120 Janitorial and Track Maintenance 640 Security and Auto Park 430 Food Service 920
Total Employment 3,.680
*Employment is presented on a Full-Time Equivalent basis.
Source: Estimated from survey data and published financial information from the parent corporations of the associations.
people (FIB) to conduct a Thoroughbred meetinsouthemCalifornia. Although no employment information was received from the northernCalifornia tracks, payroll information and public documents indicate that the northern California associations hire significantly fewer people to conduct their meets.
During the racing season, almost 40 percent of the association work force is involved with pari-mutuel and racing activities. Another 25 percent of the total labor force works in food service. Twenty-three percentofthe employeesmaintainand secure thegrounds and facilities, while the remaining 14 percent are employed in officeandadministrative positions. Because the seasons for each association do not overlap within a region, many seasonal employees can find yearround work in the racing industry.
According to the survey, the number of people required to conduct associationbusinessandmaintain the track and facilities during the off-season varies from approximately 200 to over 500. Many of these people areyear-round employees of the track. Almost 50 percent of the off-season employees are involved with track maintenance. The next largest employment
category is office and administrative personnel. In contrast to the racing .season, pari-mutuel, racing and food service employees combined make up less than 25 percent of the association work force when no meet is being conducted at the track.
In addition to the direct provision of almost 4,000 jobs in California, the associations contribute indirectly to employment levels in supporting industries through the course of their business operations.. The most notable supporting industry since the mid-1980s has been satellite wagering. In addition to receiving signals from themajorThoroughbred associations, the satellite wagering facilities receive broadcasts from Quarterhorse and harness races, as well as from meets conducted at the various county fairs. Many of the facilities remain open to the public all year.
Major employment categories at the satellite sites include administration, communication, pari-mutuel, food service and maintenance. Although we did not survey these facilities in detail, telephone interviews indicate that satellite wagering may provide an additional 500 to 800 full-time equivalent positions.
Profitability of the Thoroughbred Racing Associations
The profitability of the racing associations (and their affiliated operating and realty companies) has significance that transcends the private interests of the associations and their stockholders. First, the associations act as a "retail window" for the broaderThoroughbred industry, thusbringing revenue into the industryfrom spectators and wagerers. With their portion of this income, the associations purchase the goods and services they need to conduct the business of racing. In addition, they distribute purse money to Thoroughbred owners who, in tum, createdemand amongother industrysuppliers. Because they provide the vital link between the supply side and the demand side of the market, the financial health of the associations is crucial to the economic viability of the entire Thoroughbred racing industry.
The profitability of the racing associations also has significance fr()m a public policy perspective both because they operate with government franchise and because the state shares directly in the takeout generated from horse racing. At one extreme, if the associations enjoy unusually high or "excessive" profits because of their favored position as purveyors of legalized gaming opportunities, the state may be called upon to reduce industry profits to "normal" levels, enhancing consumer welfare and, perhaps, state revenues. This might be achieved using regulatory controls such as manipulating the number of racing days, altering the takeout rate, or changing the distribution
51

of takeout among industry participants. At the other extreme, if profitability is persistently below returns realized in industries with comparable levels of risk, the state risks loss or deterioration of the race tracks and associations as assets currently devoted to racing become redeployed in more profitable uses. This, of course, would threaten the viability of the br9ader industry as well as a significant source of revenue for the state. •
The question of whether, in the long run, it will be profitable to continue to employ association and race track assets in horse racing is more than a theoretical one in California. As noted earlier, two of the four privately owned tracks have already converted or are planning to convert significant real estate assets from horse racing to other uses. Moreover, two racing organizations have been the object of major proxy battles between competing shareholder groups looking to maximize returns oncorporate assets. Only one racing organization that operates a track has neither engaged in real estate development norbeen the object of shareholder battles. However, it faces another, equally perplexing dilemma: its occupancy of extremely valuable real estate on San Francisco Bay is subject to a ground lease expiring in 2002. The lease is held by a major public corporation that has recently restructured with the object of realizing the value of its real estate assets. In short, there exists anunmistakable trend towards . conversion of race track real estate assets to other uses. That trend, prevalent in other Thoroughbred racing markets in North America, seems especially imminent in California, where land values have been subject to unparalleled appreciation.
Net Returns to Racing Associations In order to determine the returns associated with conducting Thoroughbred horse racing events, net pretax returns reported by the associations must be adjusted to reflect their distinct corporate structure. As noted above, privately held, land-owning racing entities take the form of operating companies paired with real estate investment trusts (REITs) for tax reasons. The operating company pays the REIT rental for use of the track, and rents are distributed to REIT holders. In order to gain a truer picture of the net returns to Thoroughbred tracks and association assets, this intraorganization transfer of facility rents should be added back into income from racing. A three-year trend of pre-tax income with this adjustment is shown in Tab.le 3-8.
The data indicate that adjusted net association pretax returns were subject to some variation between 1987 and 1989. In aggregate, the associations posted a $2 million loss in 1987, versus gains of $8 million and $13 million in 1988 and 1989 respectively. Note, too, that gains in1988and 1989coincidedwith the d~velopment of satellite wagering opportunities in southern California. While off-track wagering has increased access to Thoroughbred racing for people who live some distance from the race tracks, introduction of this inn'ovation is a one time phenomenon: as its effects are absorbed, net returns to the associations will likely plateau. For this reason and due to the unusually low returns in 1987 for one association, the 1988 and 1989 average adjusted pretax net returns, $48.5 million is accepted as a representative indicator of of annual net returns to Thoroughbred racing in California.
Table 3-8. Aggregate Returns and Adjusted Returns from Racing to California Thoroughbred Associations, 1987-1989
1987 1988 1989
Total Revenue from Racing Total Expenses from Racing Pretax Net Returns from Racing
$172
($2)
$193 185
$8
$210
$13
Plus Rental for Track Facilities $39 $38 $38
Adjusted Pretax Returns from Racing $37 $46 $51
Source: Summary ofThoroughbred-related revenues and expenses on file at theCHRB, audited financial statements, and nerson1a1 communications with association
52

Current Marke:t Value ofThoroughbred Racing Facilities The five Thoroughbred race tracks in California are situated on relatively large pieces of property in mature metropolitan areas. Because the tracks were established many years ago, the real estate resources devoted to racing are far more valuable than the association financial statements might suggest. Current market value is relevant to this analysis both because it more accurately represents the magnitude of resources that society devotes to racing and because it captures the potential for further conversion of racing assets to other purposes.
An appraisal of horse racing real estate assets was · obtained from a private appraisal firm (see Appendix' B-1 for an Executive Summary of the appraisal). This valuation wasbased on the firm's expert opinion of the most likely alternate uses of the lands, making allowance for a variety of factors including sales of comparable land and local land use policies. Itwas estimated that the land underlying the five major Thoroughbred race tracks inCalifornia is worth a total of $810 million.
This 1990 valuation cannot be directly compared to observations made in earlier studies because they did not include estimates of the value of tracks not owned by associations or their parent companies. , However, the 1965 SRI study placed a $38 million value on three of the tracks. These tracks are now estimated to have a market value of $605 million, indicating an annual rate of appreciation of 12 percent. This coincides with other published estimates of real estate appreciation. For example, aggregate statistics indicate that during the last three decades the value of real estate rose by from 8 to 12 percent per year, dependingon the region and type of property involved. Well located, urban commercial property in California can reasonably be expected to have experienced a rate of appreciation in the upper end of this range.
The $810 million appraisal of the five tracks reflects the associated value of the land without existing improvements because such things as grandstands, park-. ing facilities and stables would be removed if the property were developed for more profitable purposes. The value of other assets used for racing, principally fixtures and office equipment, is likewise disregarded because of their negligible salvage value. Finally, no allowance is made for net working capital, because it is a relatively small component of assets because financial structure is subject to decisions made by the associations.
Rate of Return on Assets On an aggregate basis, the rate of return to Thoroughbred racing (on operations) is estimated bydividing the
average annual return from operations, $48.5 million, by the current market value ~f the princ.ii::al asse!s employed inThoroughbred racmg, $810 rmlhon. ThIS process supports an estimate of 6 percent as the average operating rate of retu~on race track land used.f~r the production of horse racmg events. Note that this ts a pre-tax rate of return, suggestive of a 4 percent net, after tax rate of return.
Because of the conjectural nature of the alternative uses to which race track lands might be put, the 6 percent rate of return is an approximate figure. While no statistical basis exists on which to establish formal confidence intervals, the relatively narrow range of adjusted returns in the industrygives reason to believe that the long-term rate of return on horse racing assets is no lower than 4 nor greater than 8 percent, allowing for as much as a 50 percent variation in the actual value of the assets.
Drawing on data from the period 1960 to 1964, the SRI study reports average annual net operating income of about $3 million on real estate assets of $38 million for the three Thoroughbredland-owning associations. This corresponds to an after tax return on land of approximately 8 percent and pre-tax returns of approximately 12 percent. Figures from the 1960s thus reflect twice the rate of profitability noted in recent years, indicating that operating Thoroughbred races has become significantly less profitable during the intervening decades.
The 6 percent estimated rate of return compares to a pre-tax average rate of return on operations of 13 percent in the national gaming and hotel industry for the years 1987to1989. The corresponding nationwide average pre-tax rate of return on operations in the recreation industry, which includes amusement parks, motion pictures and other entertainment, was 17 percent. Real estate investment trusts as an industry group averaged an 11 percent rate of return between 1986and1989. These comparisons clearly indicate that returns to operating Thoroughbred races in California are markedly lower than returns observed in industries of similar focus, risk and scale.
There is significant a priori reason to have expected that returns to horse racing would be less than competitive. When horse racing was initially authorized by the Legislature, the associatio~ enjoyed a virh:1al monopoly on wagering opporturuhes and shared with boxing a near monopoly on professional spectator sports. Since that time, California has witnessed rapid growth of the spectator sport industry with the creation ofmore than a dozen professional baseball, football and basketball teams. In addition, numerous coll~giate teamsas well as a variety of other equestrian events compete for spectators' attention. Modem tele
53

communications provide spectators television access to sports events throughout the world virtually round the clock. As a wagering alternative, horse racing competes with a heavily marketed state lottery and, increasingly, with bingo. Furthermore, improved air and ground transportation makes gambling in Nevada more accessible to Californians. Finally, casual empiricism suggests that many of the professkmal sports compete with horse.racing for wagering dollars through illegal but widespread betting activities ranging from informal office pools to well organized book making operations. All of these forces would appear to have reduced significantly the economic profit once associated with the franchise granted by the state to horse racing associations.
While satellite wagering has provided recent stimulus to pari-mutuel handle, it quite likely will remain the case that future industry profitability will largely derive from holding, rather than operating, track assets. Indeed, the 12 percent rate of appreciation noted in the value of the tracks since the 1960s suggests that only about one-third of the total pre-tax return to racing entities comes in the form of operating profits. This industrial scenario is not without precedent. For example, a significant part of the long-term profit from farming, particularly near urban areas, has derived from rising land values. Likewise, at various times industries as diverse as rail road transportation, lumber production and paper manufacturing have attracted capital because of the prospect of asset appreciation rather than year to year operating returns. In the case of Thoroughbred racing, however, tracks would have to be closed in order to realize competitive rates of return. At a minimum, this threatens to bring the industry an element of disloc~tion as racing moves to suburban sites. At a maximum, it means closing one or more of the tracks that now provide the broader Thoroughbred industry with access to spectators and wagerers.
Summary and Conclusions An indispensable component of the California Thoroughbred ind us try, the horse racing associations bring together the supply and demand factors that drive all sectors of the industry. For this reason, the continued flow of capital resources to the associations and the entrepreneurial expertise of association management are prerequisite to the success of the Thoroughbred industry within the state. The financial strength of the associations is essential to the industry's future success.
Each association, while it operates its scheduled meet, enjoys a spatial and temporal monopoly on Thoroughbred horse racing. However, the associa
tions face fierce competition from alternative forms of entertainment and from other state-sanctioned wagering alternatives, which have been intensively marketed in the past three years. These kinds of dynamic pressures, as well as the pressure for development of their racing sites, will continue to test the financial viability and marketing ingenuity of associations, just as in the past other conditions and opportunities have shaped their structure and performance.
The horse racing industry faces a number of sobering facts. Most importantly, the total real handle wagered on-track has shown no significant growth over the past two decades. This has occurred despite significant growth in on-track attendance arising from an increase in racing days. The decline in real on-track handle per patron implicit in these patterns has to be a matter of concern for the associations and the broader industry.
On the other hand, total (on-track and off-track) attendance and total handle have increased significantly during the past threeyears. Theseforcesappear to be directly attributable to the authorization, introduction, and expansion of simulcasting races and inter-track wagering. While this endeavor to bring racing and wagering to new patrons in new settings has unarguably enhanced short-run aggregate industry performance, that enhancement has occurred at the expense of on-track activities. Moreover, one worries that in time, once simulcasting has fully permeated its market, the trend toward lower handle per patron that surfaced between 1970 and the mid-1980s will once again dominate industry performance.
In meeting the demand for Thoroughbred racing, the associations generated total average annual revenues in excess of $210 million in 1989. The largest impact or expense of the associations is the personnel require to effectively conduct the business of Thoroughbred horse racing. The survey of the associations provided a glimpse of the diverse and highly unionized work force that fills approximately 3,680 full-time equivalent jobs within the state. The direct and indirect effects of the racing associations and the total Thoroughbred industry are estimated in Chapter 5.
Profitability of the racing associations represents an issue pertinent to the viability of the broader Thoroughbred industry as well as to the level and continuity of state revenues from racing. It is an especially sigruficant issue because the four privately owned tracks face pressures for development of their large urban real estate holdings. After adjustments are made to reflect the distinct corporate structure of racing organizations, it appears that the five major Thoroughbred tracks produced anannual average net pretax return of approximately $48.5 million from Thorough
54

bred horse race meets. Those tracks have an appraised estimated market value of $810 million. Thus the operating return on these assets is estimated to be approximately six percent and, certainly, within the range of four to eight percent. This rate is at least half the average rate of return on operations realized in industries of similar focus, risk and scale. The rapid appreciation of track real estate assets, coupled with increased competition for spectator and wagering dollars since the state franchise was granted to horse racing, appears to have reduced returns to operating Thoroughbred racing below competitive levels. This is true despite the recent augmentation to total handle provided by off-track wagering. The future of the racing associations and the broader Thoroughbred industry is clouded both by long term trends in industry demand and by the fact that association returns increasingly derive from holding rather than operating track assets. ·
References Cain, E.P., Aldwin, R., Baker, D.T., Bendell, R.F.,
Harrison, S.C. Joint Legislative Task Force. PariMutuel Horse Racing and Breeding in New York State: An Economic Profile. Albany, NY, 1982.
Deloitte Haskins & Sells Associates. Alberta's Racehorse Breeding and Racing Industries: Opportunities and Constraints. Calgary, Alberta, Canada, 1986.
Huffman, D. and Guidry, R. Department of Agricultural Economics and Agribusiness. Economic Impact of the Horse Racing Industry in Louisiana. Louisiana State University and Agricultural and Mechanical College, 1979.
Ingraham, M., ed. Thoroughbred Racing: Winning All the Way? School of Business, San Francisco State, 1981.
State of California. Horse Racing l.a.w; Chapter 4, Division 8, Business and Professions Code and Related Laws. Sacramento, CA, 1989.
55

Chapter 4. The Demand for Thoroughbred Racing in California
Public racing events are the primary marketed output of the California Thoroughbred racing industry. Therefore, it is the level of public demand for attending and wagering on horse races that ultimately determines the economic health of the industry as a whole. An increase in public demand for racing activities results in larger purses for winning horsemen and larger commissions and attendance-related revenues for the racing associations. These additional revenues in tum stimulate the demand for inputs such as feed and labor. The State ofCalifornia is also concerned with the public's demand for racing activities, since the revenues it collects are determined as a ~rcentage of the total amount wagered, or "handle." To investigate the factors influencing the demand for racing activities in California is thus an important component of this study.
In this chapter we provide an overview of factors likely to affect the public's demand for attending and betting on Thoroughbred races in California, and analyze statistically the relationship among them. Several issues are of particular interest:
1. How do changes in state policies affect the demand for racing? Could modification of current policies generate additional state revenues and/ or industry profits?
The state regulates the supplyof racing through actions taken by the State Legislature and the CHRB. The Legislature has the ability to alter the effective "price" of wagering by adjusting the percentage of wagered dollars returned to bettors. The Horse Racing Board determines the number of racing days offered and how they are distributed among race meets, subject to legislated maxima. Additionally, the state regulates the availability of alternative forms of gambling, such as the lottery and off-track satellite wagering on horse races. Information regarding how consumers respond to these policy variables is needed in order for the state to manage Thoroughbred racing optimally.
2. Opportunities for legal gambling in California have expanded greatly since the introduction of the California lottery and of off-track satellite wagering. Have these alternative forms of gambling impacted on-track attendance and/or wagering significantly? What are their effects on total racing attendance and handle (on- and off-track combined)? Also, how does consumer demand for newer forms of exotic bets such as the "Pick Six" (which offer low probabilities of winning large prizes) compare with the demand for conventional bets at shorter odds?2
3. What other factors have impOrtant effects on the demand for Thoroughbred racing in California, and how might these be expected to change in the future?
This chapter is arranged as follows. First we review some prior studies of racing demand that are relevant to the empirical questions above, and provide a graphical overview of trends in factors affecting demand for California racing. Next, the results of our statistical demand analyses are presented. Two sets of annual dataare analyzed: (i) statewide data for the years 19531989;and (ii) data by individual northern and southern California race tracks for 1970-1988. The chapter concludes with a brief discussion of our major findings.
Prior Research on Economic Determinants
of Racing Demand In this section we review a number of existing studies of the demand for attending and wagering on horse races in various markets, and briefly summarize their findings.
Morgan and Vasche (MV, 1979) investigated attendance and wagering patterns at the four major southern California race meets from 1958 through 1978. They estimated the effects on Thoroughbred racing demand of a number of variables, including consumer
1Figure1-1 in Chapter 1 illustrates how revenues withheld from the pari-mutuel pool are distributed amongthe horsemen, the associations, and the state.
2 Conventional wagers are those for which a winning outcome depends on the successful performance of a single horse; these include win, place and show wagers. Exotic wagers depend on the successful performance of more than one horse; examples include the Daily Double and the Pick Six.
56

income, unemployment,.the number of racing days, competition from harness and Quarterhorse racing, and the effective takeout rate. Additionally, several dummy variables designed to measure impacts of events such as the 1970 labor strike atSanta Anita were included in the estimation. MV found that increases in per capita real disposable income had a positive effect on the size of an average (nominal) wager but reduced attendance; while unemployment had the reverse effect, leading to higher attendance but smaller wagers. The number of racing days offered had a positive impact on both attendance and average wager per attendee. The latter result was contrary to theauthors' expectations, since it had been anticipated that an increase in racing days might "spread" the dollars available for wagering over more days. Quarterhorse and harness racing were found to negatively impact the demand for Thoroughbred racing when scheduled at night on dates of Thoroughbred (daytime) meets, but not otherwise.
Of particular interest from a policy standpoint are MV' s estimates of the elasticities of attendance and wagering with respect to the effective takeout rate. The takeout rate is one measure of the average price of wagering. That is, in the long run a person who wagers $100 when the takeout rate is 15 percent can expect to win back $85, with the remaining $15 being retained for distribution to the track, the horse sector, and to the state as tax revenues. Economic theory suggests that when the price of wagering falls, the demand for wagering is likely to increase. If the percentage increase in total wagering is larger than the percentage decrease in the takeout, then total revenues can be raised by reducing the takeout rate. In this case, demand for wagering is said to be elastic with respect to its own price. Conversely, if the percentage decline in total wagering is less than the percentage increase in the takeout, then total revenues can be enhanced by raising the takeout rate. In this latter case, racing demand is termed inelastic.3
MV reported that demand for track attendance was elastic with respect to the takeout rate; a one percent rise in takeout was estimated to lead to a 1.48 percent decline in attendance. For those individuals who did attend the races, the amount wagered per person appeared to decline when takeout rose, but the effect was not statistically significant. Given these findings, MV recommended that the racing industry and the state would benefit if the effective takeout rate was reduced. The percentage increase in attendance and total handle would be greater in absolute value than the percentage decline in the takeout rate, yielding a net revenue gain from wagering.
In response to MV, Guthrie (1980) pointed out that revenue maximization does not imply profit maximization unless marginal costs arising from additional attendance and wagering are near zero. In a reply, MV (1980) argued that marginal costs are indeed likely to be low, since race tracks have excess capacity on all but the busiest racing days. Furthermore, non-pari-mutuel revenues (admission, parking and concession fees) would also rise if the takeout rate was reduced due to increases in attendance. These non-pari-mutuel revenues would likely offset increases in variable costs at the tracks arising from higher attendance and betting activity, and so both state revenues and track profits would benefit from a lower takeout rate.
Inan earlier study of annual data from New York's Aqueduct and Belmont Park race tracks over the period 1940-1969, Gruen (1976) found a similar impact of the takeout rate on wagering demand, reporting an elasticity of total (nominal) wagering with respect to the (effective) takeout rate of -1.57. He did not attempt to differentiate between attendance effects and impacts on wagering per attendee.
In a study of the demand for horse racing in Maryland, Ahern (1980) estimated the elasticity of percapita wagering with respect to the legislated takeout rate (not including breakage) to be -1.13. This study suggested that revenues from racing would be maximized if the legislated takeout rate were reduced to 14.6 percent from its mean of 16.6 percent over the sample period 1969-1978. Ahern also proposed that, as an alternative to imposing a pari-mu tuel tax in the form of a takeout percentage, a lump sum .tax per racing day could be charged by the state. Such a tax would not affect the marginal price of wagering, and could benefit the racing industry while maintaining the state's income at current levels.
Suits (1979) used two methods to estimate the price elasticity of demand for wagering on horses.. Fir~t, he analyzed the response of bettors to a 1974 reduction (from 10 percent to two percent) in the Federal excjse tax on legal Nevada bookmaking on horse races. l.llsing observations of wagerin~ activity before and after the tax reduction and assuming a constant price elasticity of demand, he calculated that the price elasticity of demand for wagering was -1.64. In the second portion of his study, he estimated three versions of a demand function for wagering, using real (as opposed to nominal) data and legislated takeout rates from 24 states over the period 1949-1971. He reported price elasticity estimates of -2.14, -2.73, and -1.59 respectively, with the third regression yielding the best fit.
3A more detailed explanation of elasticities can be found in Appendix D-1.
57

Pescatrice (1980a), using yearly data from both Aqueduct and Belmont race tracks in New York for 1944-1975, found that the elasticity of the real track handle with respect to the takeout rate was near unity (-1), which would imply that the on-track takeout was at that time near-optimal in terms of maximizing ontrack revenues. (Whether profits were alsobeing nu\ximized would depend on costs as well as revenues.) He reasoned, however, that the response of off-track bettors to a takeout rate increase would likely be much less than that ofon-trackbettors, since the "churn" (i.e., the rewagering of winnings during the racing day) is much lower at off-track facilities than on-track. Since off-track betting constituted about half of the total handle at that time, he suggested that overall state revenues from racing would be enhanced by raising the takeout rate both on- and off-track, and attempting to avoid competition between the two types of facilities.
A possible explanation for Pescatrice' s finding of a lower price elasticity than that reported by most other
. authors is his inclusion of (i) unanticipated changes in attendance, (ii) a time trend, and (iii) two dummy variables representing positive and negative market conditions, as explanatory variables. It is also possible that public responsiveness to the takeout rate varies greatly by track and/or by time period.
In a second paper, Pescatrice (1980b), following a similar methodology to that used in his previous work (1980a), found a price elasticity of --0.5 at the Fairgrounds race track in New Orleans, Louisiana. He noted that Gruen's study failed to account for inflation, and argued that Suits erred in using legislated, rather than effective, takeout rates in his analysis; furthermore, he stressed the need to examine trackspecific rather than aggregated data. In response to this article, MV (1982) suggested that Pescatrice's estimate of the price elasticity of demand for wagering wasbiased downward byinclusionofattendanceas an explanatory variable. (In this regard, it is not clear whether MV drew a distinction between total attendance and the residual attendance used in Pescatrice' s analysis.)
As reported byWolff (1986), a large reduction in the takeout rate (from 24.3 percent to 19.14 percent) at Assiniboia Downs race track inWinnipeg, Manitoba in 1984 resulted in a 26.5 percent increase in daily handle and a 10 percent increase in attendance by 1985. This was at a time when other tracks in western Canada were experiencing declining daily handles. These results again suggest that the demand for wagering is price-elastic. However, suchanecdotal evidence of the effects of takeout rate reductions must be interpreted with somecaution, as changes in factors other than the takeout rate are not controlled for.
Perhaps the most important issue raised in the empirical studies above is the size of the elasticity of demand for wagering with respect to the takeout rate. This elasticity determines whether total revenues are likely to rise or to fall in response to an increase in the takeout rate. Most (but not all) evidence from these demand studies suggests that the demand for wagering may be in the elastic range. Since elasticities can change over time and may vary by market location, these results cannot be applied indiscriminately in analyzing the current demand for attendance and wagering at California race tracks.
Another interesting aspect of the demand for parimutuel wagering has come to be known as the "longshot-favorite bias." Authors including Ali (1977) and Thaler and Ziemba (1988) have noted that the majority of the racing public, when given a choice between two bets having an equal expected value, appear to prefer a "longshot" bet offering a small probability of winning a large prize to a "favorite" bet that is more likely to pay off but with only small winnings. Longshot horses receive more public backing than their actual racing performance suggests is warranted, while favorites are underbacked; that is, longshots win even less often than their odds would indicate, while for favorites theopposite is true. Quandt (1986) showed that this pattern of demand is theoretically consistent with market equilibrium among a group of risk-loving bettors. De Seve (1973) argued persl,lasively that because the government's takeout rate is applied to the gross handle, and winnings are rounded down to the nearest dime per dollar or 20 cents per $2.00 wager ("breakage"), the payback on a successful favorite bid is taxed far more highly than are winnings from a longshot bet, offering racing patrons a price incentive to wager on longshots in comparison with favorites.
This '1ongshot-favorite bias" is relevant to the empirical analysis that follows later in this chapter since several new wageringopportunities in California now offer bettors low probabilities of winning very large prizes. First, the "Pick Six" (a type of exotic wager in which the bettor must correctly choose the winners of six races) was introduced in 1980 at Hollywood Park, and in 1981 at the remaining four major Thoroughbred tracks. More recently, the Pick Six has been modified to include a rollover of the pool from day to day until there is a winner; and at some tracks a Pick Nine pool has been initiated, offering even longer odds than the Pick Six. The creation of the California state lottery, beginning with instant-win ("scratchers") games in 1985 and followed by a lotto game in October of 1986, has provided a significant gambling alternative to California bettors in recent years-one offering very long odds of winning a very large prize. The popular
58

ity of the lotto game and the success of the new exotic wagering alternatives at the track suggest that the public's demand for racing may have shifted in recent years in response to the introduction of these new, "longshot," types of bets.
Based on race-by-race data from Maryland tracks, Lawrence, Jones and Bender (1978) estimated that the total amount wagered onagiven race was significantly higher if exotic wagering was offered. However, the effect of exotic wagering on total daily handle was not examined. Also, during the period of analysis, exotic wagering in Maryland was limited to one daily double and two exactas. The proliferation of exotic wagering opportunities in California permits further investigation of the longshot-favorite-bias issue.
Graphical Overview of Factors Affecting Demand for California
Thoroughbred Racing This section provides an overview of trends in (a) the demand for attendance and wagering at California's major Thoroughbred race tracks; and in (b) other variables that are likely to be important determinants of racing demand in the state. The time period considered is 1953 through 1989.
As mentioned in Chapter 3, total revenues derived from the public at race tracks are generated by parimutuel and non-pari-mutuel activities. Pari-mutuel sources of revenue are wagering-related; these revenues are based on the total amount wagered (the total handle) and on the takeout rate. Non-pari-mutuel revenues depend primarily on attendance; these include admission fees, concession sales, and parking fees. Wagering-related revenues are affected both by attendance and by the amount wagered per attendee. Thus trends in attendance, in handle per attendee and in the effective takeout rate all affect total revenues.
Figure 4-1 illustrates the nominal and real values of the total handle wagered per year on Thoroughbred racing at major California race tracks and satellite wagering facilities. In nominal terms, total handle has grown more than sevenfold over the sample period. On a real basis, growth has been far less dramatic, showing some strength during the 1960s, a slight downturn in the late 1970s, and renewed strength in 1988, while remaining essentially flat in other years. It is important to remember that this graph represents the sum of both on-track and off-track activity.
Figure4-2 presents the annual nominal and real ontrackhandle for major California Thoroughbred meets.
Figure 4-1. Total Handle, Nominal and Real* Dollars, California, 1953-1989
$2.50 ·----------------·-------------·-------------·--·-------------·-----· $2.25
$2.00
$1.75
$1.50 Tiol" ........ J-1...1- -- - • - - • - -- - -- - -- - • - - • - -- ....._ - -- - • - - • - -- - -·
.1$1.25 ---·-------------·--·---------------,,--------·--·-----·..... $1.00 • - - • ---- --- ----- - ·- -- - -------- ----·- --- -----,,.·~- ·- -- - ------· - - • - ----· ...... $0.75 • - - • - -- - -- - -- - -- - • - -- - -- - -- - -- - • - - • - - .... 1-(_ -- - • - - • - -- - -- - -- - • - - • - -- - -·
................ ·-·$0.50 ·- -· --------,-----. ----·=·....•'--- -·--. --- -------·- -.---- ------· --.-----·
·-·-·-·-·-·-·-·-·-·-·-·:::t·; ·;·;·,- -;-,--,- ~- ~. ~ -~ -~-;-;·,--; ·,- -,· -,--,- ~- ~ -~ -~ -;.;-;-.--,- -,- -,· -,- ·,- ~- ~ -~ 1953 1957 1%1 1%5 1%9 1973 1977 1981 1985 1989
•·nominal 0 real
,. Real dollars are deflated by the California CPI (1982-1984=100).
Source: California Horse Racing Board, Statistical Report of Operations, Annual Issues.
59

Until 1985, all wagering was on-track; thus this figure differs from Figure 4-1 only in excluding the handle from satellitewagering for the years 1985-89. Note that on-track handle dropped by approximately $400 million in real terms between 1985 and 1989, while total handle including satellite wagering rose by less than half that amount. Itwould appear that satellitewagering may be capturing a portion of the handle that otherwise would have been wagered on-track.
In addition to the total handle and on-track handle, another importantmeasureofthedemand for racing is attendance. Figure 4-3 portrays total and on-track attendance. Total attendance has grown quite steadily over most of the sample period and increased sharply in 1988, reflecting a surge in attendance at satellite wagering facilities. On-track attendance has dropped noticeablyduring the periodcoincidingwith the introduction of satellite wagering and the California lottery.
Since total attendance has risen more rapidly than total real handle, it is clear that the real dollar amount wagered per attendee per day has been declining over much of the sample period. This trend can be seen in Figure4-4. From1953 to 1989,the ammmt wagered ontrack per patron per day of attendance declined by over a third on a real basis.
While total handle and attendance are important indicators of the level of demand for Thoroughbred racing in California, they do not provide a complete picture of demand conditions. The population of California has been growing rapidly for many years, as illustrated in Figure 4-5. This increase in the pool of potential racegoers may conceal a decline in the frequency of attendance on a percapita basis, lending the appearanceofhealthy demand during periods when attendance is actually growing more slowly than is population. Figure 4-6 illustrates the number of track admissions per thousand residents of California. During the 1950s and early 1960s, the popularity of racing as measuredbypercapita attendance declined sharply, which would have implied a serious decline in overall demand had not population growth cushioned its impact. From 1967 through 1979, per capita attendance fluctuated about a slight upward trend. Beginning in 1980, a strong upsurge in per capita attendance has occurred; this might reflect bettors' enthusiasm for new types of bets such as the Pick Six, introduced in1980at Hollywood Park, and in 1981 at the othermajor tracks. The advent of satellite wagering appears to have led to a steep decline in on-track attendance per capita, while stimulating total (on- and off-track) attendance per capita. In 1988, total attendance per capita reached
Figure 4-2. On-Track Handle, Nominal and Real* Dollars, California, 1953-1989
$1.8
$1.6 ... ---------------------------.~-------
------------------------------------------~1---------- ---s~ $1.0 - - - - - - - - - - - - - - - - - - - - - - - - - - - - - - - - - - - - - -;•'!"-·-·- -- -- -- - - - - -- -- -- E
$0.8 - - - - - - - - - - - - - - - - - - - - - - - - - - - - - - - - -...-.I'-~ ----------------------. ,_... $0.6 - - - - - - - - - - - - - - - - - - - - - - - -.,.., ""'•' - - - - - - - - - - - - - - - - - - - - - - - - - - - - -
·-·-·-·I' .
$0.4 •-i:i;1:.:•:.•-•i.:1::..•-•"'•:------------- -----------------------------
:;t~-;-,-~-;-,-;-;-,-;-;-;~-;-,-;-; ·l-;-;-l-;-1--1-;-;-I-;-,- -,· ;·1--1-;-, 1953 1957 1961 1965 1969 1973 1977 1981 1985 1989
•·nominal O real
•Real dollars are deflated by the California CPI (1982-1984=100).
Source: California Horse Racing Board, Statistical Report of Operations, Annual Issues.
60

Figure 4-3. Total and On-Track Attendance, California, 1953-1989
11 - --- - ·- -- -- - • ----- --- -- --·----- - • - - -- -- - • ---- -- - • -
10 ------·-------------------·-----------------------------·------- ·
9
8
7
6
5
4+-+-+-+-t--t-1~~-+-+-+-+--t--+--+-+--t-+-+-+-+-1--1--tr-t.....-t-+-+-+-t--+--+--+--t--+-~
1953 1957 1961 1965 1969 1973 1977 1981 1985 1989
CJ total attendance • on-track attendance
Source: California Horse Racing Board, Statistical Report of Operations, Annual Issues.
Figure 4-4. On~Track Handle Per Patron, Nominal and Real* Dollars, California, 1953-1989
$300 -----------------------------·-------------------·----------------·
$275
$250
$225 .....----------------~ ..... $200 - - -- - -- - - • -- -- --- - - -- - -- - -- - -- - - -- - -- - - • - --- - -- - - • -- - -- - -,••,.t.--·- --
$175 - - -- - -- - - • - - -- - -- - - • - - -- - -- - - • - - -- - -- - - • - - -- - -- - - • - -• 'l""L..Jn.4:H:lt-"'"'"'t:l--<J-n......... ...... $150 - - -- - -- - - • - - -- - -- - - • - - -- - -- - - • - - -- - -- - - • - - -- ....... - - • - - -- - -- - - • - - -- - --
. ·' $125 - - -- - -- - - • - - -- - -- - - • - - -- - -- - - • - - -- - -- - -·:.:·"-- - -- - - • - - -- - -- - - • - - -- - -- ......... $100 __ -- _ -- __ • __ -- _ -- __ • __ -- _ -- ....~:-!::I".:'•• __ . __ -- _-- __ . __ -- _-- - - . __ -- - __ _
.....-·-·-•-•"" $75 ·~-~·~•w•-•-•rl~!~---·---------·---------·---------·---------·--------
~O +l~li-+~J.....-t-l~l-.~l~l-li-+1-+--+l~l~l-+-~l~l~l+--~I+l-li-+~l.....-t-l~l.....-t-~l~l~l-+-~l~lr--+1-+-+l~I 1953 1957 1961 1965 1969 1973 1977 1981 1985 1989
•·nominal 0 real
"'Real dollars are deflated by the California CPI (1982-1984=100).
Source: California Horse Racing Board, Statistical Report of Operations, Annual Issues.
61
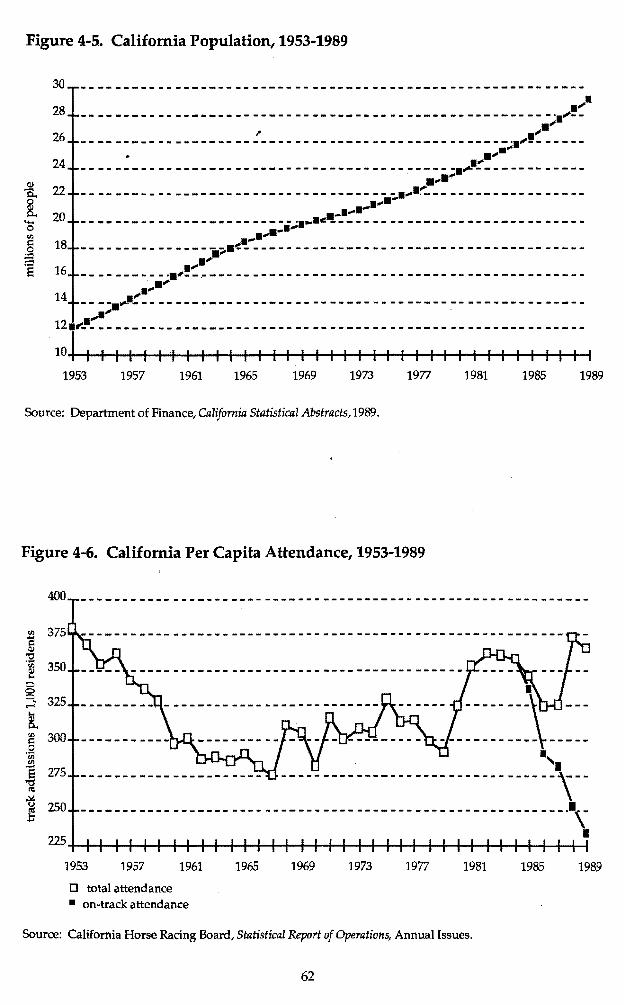
Figure 4-5. California Population, 1953-1989
30
28
26 24
22 20
18 16
14
...... - - - - - - - - - - - - - - - - - - - - - - - - - - - - - - - - - - - - - - - - - - - - - - - - - - - - - - - ..... - , ....... --------------------------------------------------~-·------. ...... --------------------------------------~----;.~-------------..... ...
-------------------------------------·-·~------------------...._________________________ ....•ell.""_•,:-~: __ -___ --___ -__ ----------__....
.......---------------.;•<---------------------------------------
....... ------- -.--;•"- -.- -------------------------------------------..... - - - - ..... •.::-- - - - - - - - - - - - - - - - - - - - - - - - - - - - - - - - - - - - - - - - - - - - - - - - - - - .......
121..:..---------------------------------------------------------10I1 111111111111111 1111111 I I I I I I I I I
1953 1957 1961 1965 1969 1973 1977 1981 1985 1989
Source: Department of Finance, California Statistical Abstracts, 1989.
Figure 4-6. California Per Capita Attendance, 1953-1989
400
Cl"' 375 QJ
:g QJ 350"' ...
0 0 0,....; 325
~ "' s:i 300 0...... "' "' ·s 275
"O <tS ~ u <tS 250 .l:l
225
----- --~\b ------------\----.,
I ---------------------------------"'\-
----------------------------------------------------------··\
1953 1957 1961 1965 1969 1973 1977 1981 1985 1989
D total attendance • on-track attendance
Source: California Horse Racing Board, Statistical Report of Operations, Annual Issues.
62
I

-- - - - - -- -
500
Figure 4-7. Racing Days On-Track (A) and Off-Track (B)1 California, 1953-1989
A. On-Track
.... 475 - - - - - - - - - - - - - - - - - - - - - - - - - - - - - - - - - - - - - - - - - - - - - - - - - - - ·•· - - - - r -. / '·-·-· :4:00 : : : : : : : : : : : : : : : : : : : : : : : : : : : : : : : : : : : : : : : : : : : : :r:~~::::::::::
----------------------------------------.........;•· --------------. .! 375 - - - - - - - - - - - - - - - - - - - - - - - - -?',,,.~-=..--•:\/-- - -- -- -- - - .
:: ~~~~~~~~~~~~~~~~~~~~~~~~~~~~~~~~~~~~~~~~~~~~~~~~~~~~~~~~~~~~ •
300 - -- - --- ---- --- --- ·1· I - ·'- - - - - - - - - - - - - - - - - - - - - - - - - - - - - - - - - - - - - •. ·-•-................ - 275 • ..;.....!'~ _\_/_ - - - - - - - - - - - - - - - - - - - - - - - - - - - - - - - - - - - - - - - - - - - - - - - - - - - - .
:1-,-~-~-1- -,-~-,--1- ~ -~ -,- ~ -;-1- -l-;-,--1-~-~ -,- ~ -;- ,--l-;-1--1-~ - ~-,- ~ -;-,--,- ~ 1953 1957 1%1 1%5 1%9 1973 1977 1981 1985 1989
B. Off-Track
6,000
5,000
4,000
"' ~ 3,000 "Cl
2,000
1,000
-------------------------------------------------~~·
------------------------------~~--------------------~ 0 ·----------·---========i:----------4------------1-----------1------------1
1983 1984 1985 1986 1987 1988
Source: California Horse Racing Board, Statistical Report of Operations, Annual Issues.
63
1989

Figure 4-8. Annual California Lottery Sales, 1985-1989*
$3.0
$2.5 -- • -- -- -- -- • -- -- -- -- - -- -- -- -- • -- -- -- -- • - • -- -- -- • - • -~1'-"""-~-~-'='-'!":.-~-~-"='-"='-~-_:-:_:-:_~_".'.'.'."_!
. $2.0 --·-------------------------------------
~ I .9 $1.5 -- -- -- --· -- - ·~ -- • -- -- ---- - -- ---- -- ·- - -- -- ----· -- -- -- • ---- -- -- • - --- ~--= :.c:
$1.0 • - - - - - - - - - - - - - - - - - - • - - - - - - - - - - - - - - - - - • - • - - - - - - • - • - - - - - - - - • - - - - - - • - • - -
:.1--•H•• H•••----Hm HH•• H•HH•: •••• • •• •• •• ._.H____ ••••• H••• • •--• 1
1985 1986 1987 1988 1989
,. Lottery sales began in October, 1985.
Source: State Lottery Commission, Quarterly Financial Reports.
its highest level since 1953, while in 1989 on-track races since the number of days of racing has grown attendance fell to a new low of 234 (per thousand substantially during the same period. California residents).
The demand for many goods and services tends to The remaining figures show trends in several vari increase when consumers' per capita real incomes
ables that are hypothesized to affect attendance and increase. Goods for which demand rises when inwagering at major Thoroughbred tracks in the state. comes rise are termed normal goods. The demand for First, attendance and handle,are influenced by the some products, however, declines when income rises; number of racing days available. As mentioned in this type of good is termed an inferior good. For previous chapters, the supply of on-track and satellite example, when income rises a person may switch from racing days are regulated by the State of California; eating beans (an inferior good) to eating more beef (a they are graphed in Figure 4-7. On-track days have normal good) since he or she can now afford to do so. risen quite steadily throughout the entire sample pe Whether racing is a normal or inferior good is an riod, while off-track days have increased precipitously, empirical question, discussed later in this chapter. Per from zero to over 5,000 days offered per annum in just capita real income in California is depicted in Figure 4a five-year period. Another form of legal gambling, 10. Overall, it has grown strongly except during the the California state lottery, has also become available recession period of the early 1980s and smaller deonly since 1985, as shown in Figure 4-8. Clearly, the clines in 1954, 1958 and 1975. market environment in which Thoroughbred racing
The demand for any product will typically decline competes for customers is currently in a state of rapid
when that product's price rises. One measure of the change. "price" of pari-mutuel wagering is the effective take
Figure 4-9 presents the on-track handle on a per out rate. Figure 4-11 plots movements in the effective racing-day basis. Nominal handle per day exhibited takeout rate over the sample period. This rate has risen steady growth through 1985. The decline since 1985 bymorethanfourpercentagepointssince1953,implymay be related to the advent of satellite wagering, and ing that bettors are paying a higher price to wager than perhaps to competition from the state lottery as well. was true in earlier years. In 1953, bettors would on On a real basis, the on-track handle per day has slipped average expect to win back more than86 cents on every by almost half since 1953. However, this in itself does dollar wagered. Today, the expected return per dollar not necessarily imply weak demand for wagering on has fallen to less than 82 cents.
64

Figure 4-9. On-Track Handle Per Day, Nominal and Real• Dollars, California, 1953-1989
$55 -----------------------------------------------------------
$5.0
$4.5
$4.0 Ill
0 r::: ...·~ $3.5 - - - - - - - - - - - - - - - - - - - - - - - - - - - - - - - - - - - - - - - - - - - - - - ·-·,- - = ·s ...•- ·-· $3.0 ----------------------------~--------------!----------....
$2.5 - - - - - - - - - - - - - - - - - - - - - - - - - - - - - - - - - - - - -,•:::.'!:•_ -- --------------,,.•
$2.0 - - - - - - - - - - - - - - - - - - - - - - - - - - - - - - - - ..... - - - - - - - - - - - - - - - - - - - - - - - - •. . ....... ........... $1.5 - - - - - - - - - - - - - - - ··-·-=·--- :t-:: - - - - - - -- - - -- - - - - - - -- -- - - - - - - - - - - - - - ....,_._...•~·-·-·-·-·-$1.0 I I I I I I I I I I I I I I I I I I I I I I I I I I I I I I I I I I I I
1953 1957 1961 1965 1969 1973 1977 1981 1985 1989
•·nominal 0 real
,. Real dollars are deflated by the California CPI (1982-1984=100).
Source: California Horse Racing Board, Statistical Report of Operations, Annual Issues.
Figure 4-10. Real* Income Per Capita, California, 1953-1989
$16,00
1953 1957 1961 1965 1969 1973 1977 1981 1985 1989
,. Real dollars are deflated by the California CPI (1982-1984=100).
Source: Department of Finance, California Statistical Abstracts, 1989.
65
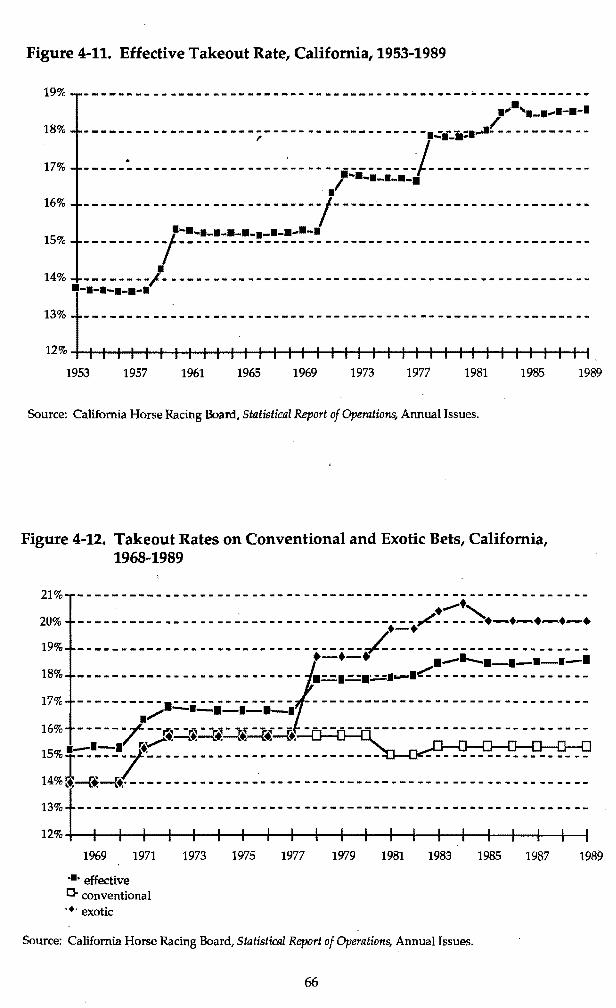
Figure 4-11. Effective Takeout Rate, California, 1953-1989
19%
::: 163
15%
143
---------------------------------------------~-------------•... '•-·--·-·-·/----·:·-------------;----------------""/~'9'"~··----------. -----------------------------;·=•-•:•:.:~ ------------------------ -- -- ----- -- -- ------- -/- ----'- -- -- -- ----- -- -- ------- -
---------f:~:·:~:---_•:!:.._-~=~:~ ------------------------------•
--------/-------------------------------------------------
·-·-·-·-·-·
:::t-:-.-·,·; ·: ·,·;·:;·;·,·;·;-,·; ·; ·:; ·,--,·;·: ·,·; ·;-,·; ·,·;·;·,-;-;·I·; . 19651953 1957 1961 1969 1973 1977 1981 1985 1989
Source: California Horse Racing Board, Statistical Report of Operations, Annual Issues.
Figure 4-12. Takeout Rates on Conventional and Exotic Bets, California, 1968-1989
21%
203
193
18%
l7%
16%
. .........., - - - - - - - - - - - - - - - - - - - - - - - - - - - - - - - - - - - - - - - lfl"'!- - -- - -:t-+,..,...,.•...-.•-• ---------------------------------~-----------------------·-·--
t-+
·-·-·-·-·-·-· -------------------------1:·.:...::.1.:.:1:..::;::1..-.1e".'."-----------------
----------.-------------- -------------------------------
-----!'~~;;;~:: -- ·-----------------------------
---- ------ -- -- -- ---·-·-· It,....15%1-----1~--------------------------
14% ~--{+.--Ct· - - - - - - - - - - - - - - - - - - - - - - - - - - - - - - - - - - - - - - - - - - - - - - - - - - - - 0:::t--:--:--1- ·;··;··;··;·-1-- 1° -;--;- -~ - •;--1 • - ; • ·; • - ; • ·; ·.:. -1- ·;
1%9 1971 1973 1975 1977 1979 1981 1983 1985 1987 1989
·•·effective 0. conventional ·•·exotic
Source: California Horse Racing Board, Statistical Report of Operations, Annual Issues.
66

Recently, there has been an important change inthe way in which the effective takeout rate is determined in California. Since 1978, the state has authorized the racing associations to collect a surcharge on exotic bets from the total handle wagered on exotic bets, in addition to the standard legislated takeout rate that applies to all types of bets. The surcharge was three percent in 1989. As a result, the overall takeout rate from all bets combined now increases when the percentage of the total handle that is in exotic pools {such as Exactas, the Daily Double or the Pick Six) rises relative to the percentage wagered in conventional {win-place-show) pools. For this reason, consumer demand for wagering not only is affected by the takeout rate, but now also affects the rate. This can be seen in Figure 4-12.
In the decade prior to 1978, the effective takeout tended to be about one percent higher than the baseline legislated takeout rate. The difference arose because amounts paid on winning tickets are rounded down to the nearest 10 cents per dollar, with the remainder, known as "breakage," not paid back to bettors. Once the surcharge on exotic wagers was put into effect in 1978, the effective takeout rate became a weighted average of the two differing legislated rates (conventional and exotic), plus breakage.
This section has provided a graphical overview of trends in the demand for attending and wagering on Thoroughbred races in California from 1953-1989, and also has illustrated the behavior over time of other variables that may affect demand. In the following section, equations describing the relationship between these variables will be developed and estimated in order to examine in more depth the determinants of public demand for attendance and wagering opportunities in the state.
Empirical Analysis of the Demand for Thoroughbred Racing
in California In this section we identify factors that may be important in explaining the public's demand for attending and wagering on Thoroughbred races in California, and use multiple regression analysis to measure their effects on racing attendance and handle wagered per attendee. We first discuss some basic issues that were considered in developing the demand equations to be estimated and describe the data used. Next we report two sets of regression results. These correspond to the two sets of annual data used in this analysis: (i) statewide data for the period 1953-1989; and (ii) observationsby major Thoroughbred track from 1970-1988. The chapter concludes-with a summary ofour findings and some policy implications.
General Considerations
A first step in understanding how the demand for racing activities is determined is to identify those variables that are believed to influence racegoers' attendanceand wagering patterns in some manner. Economic theory indicates that the demand for any consumer good typically is affected by the population of potentialconsumersand their income levels; the good' s own price; and the quantities or prices of substitute or complementary goods. In addition, there may be other demand shifters that are specific to the good in question. For instance, the demand for attending outdoor sporting events can be influenced by the weather, the location and quality of the facilities, and the quality of the event itself. (For team sports, quality might be measured by the win-loss record; and for horse racing, by the calibre of horses entered in competition.)
Using economic theory and findings from the existing racing literature as guidelines, a number of factors likely to influence the demand for California parimutuel wagering and race attendance were identified for possible inclusion in our econometric analysis. These variables included state population; real income per capita; the unemployment rate; various measures of the price of attendance and wagering; the number of on-track and satellite racing days offered; the existence of Pick Six and Pick Nine wagers; and the availability of other forms of gambling and/or spectator activities such as Nevada wagering, professional sporting events, harness and Quarterhorse racing, and the California lottery. The size of purses paid by California race tracks was included as an indicator of the quality of racing offered, since larger purses tend to attract better horses. From this list, the final set of variables that was included ineach regression equation waschosen based on(a) the availability of consistent time series observations for the period underconsideration; and {b) statistical limitations on the number of parameters that can be estimated given the limited number of observations in each data set.
Several of these variables were not available for the entire period of this analysis, and thus were omitted. However, this is not meant to suggest that their impacts on racing are negligible. Nevada gaming revenues were not available prior to 196.5 at the statewide level. We were unable to locate complete records of race track admission fees for the entire period. The same was true for attendance and admissions fees for professional football, baseball and basketball, since such data would need to be disaggregated by dates so as to match sporting events with the relevant race meets. California's definition of unemployment was altered in 1970, so that the reported statewide unemployment rate is inconsistent prior to that date. Also,
67

reporting of unemployment by county (for use in the track-specific regressions) is inconsistent prior to 1975.
In choosing explanatory variables for the demand analysis, several difficulties were encountered thatare peculiar to the racing industry. First, while consumers purchasing a good typically pay a single price, this is not the case for the consumer of racing actlvities. Rather, the racing patron'pays an admission fee (which varies depending on whether a box seat is chosen), along with miscellaneous charges such as fees for parking and for a racing program. Once in attendance at the track, the average "price" paid to wager can be viewed as the percentage of the total handle that is not returned to bettors as winnings. As discussed in the literature review, this is termed the "effective takeout rate" per dollar wagered. A further complication in identifying a "price" of wagering has existed since 1978, when the legislated takeout rate on exotic bets was increased relative to the takeout rate on conventional (win-place-show) wagers. As a result of this surcharge on exotic wagers, the average takeout rate paid by an individual now varies based on the consumer's pattern of wagering. Since there is no single "price" that patrons must pay in order to enjoy horse racing activities, the demand/price relationship for racing is more complex than it is for many other goods.
A second difficulty encountered fo estimating racing demand involves the recent changes in the structure of the racing industry mentioned in Chapter 3. Prior to 1985, on-track wagering on horse races constituted the primary legal form of gambling in California; the leading alternative wagering opportunity required travel to Nevada. However, since 1985,drastic changes in the economic environment within which live racing operates have occurred. These include the introduction of satellite wagering at off-track facilities (late 1985) 'and the advent of the California lottery (also in late 1985). Since these important events occurred nearly simultaneously and have only existed for the past few years, data on which to base estimates of their likely effects on the demand for racing are limited.
Even within the on-track betting environment itself, there have been significant changes in the types of betting opportunities offered to patrons during the period considered in this study. As previously mentioned, new types of exotic wagers (such as the Pick Six and Pick Nine) have been introduced in recent years. These offerings can be viewed as new products, with demand characteristics that are likely to differ somewhat from the demand for more traditional forms of wagers.
As was shown in Figure 4-5, California's population has grown dramatically over the period 19531989. This factor alone would be likely to cause total attendance and handle to rise over time, even if percapita attendance and wagering were declining. In order to better distinguish how factors other than population growth influence racing demand, this analysis follows the approach of Morgan and Vasche (1979) in focusing on two key demand components: (1) attendance per capita and (2) handle or wager per attendee. Note that, by multiplying:
[attendance per capita• wager per attendee• total population],
the total dollars wagered on racing can be derived.
Data Sources
In order to measure the impact of various explanatory factors on the public's demand for racing, three sets of data were assembled and analyzed, each designed to focus on particular aspects of demand behavior.
The first data set consists of statewide observations (aggregated across all race tracks and all regions of the state) for the period 1953-89, and provides an historical perspective of racing demand in the state. The second data set includes individual observations for each of the five major Thoroughbred tracks in California for the years 1970-1988. This disaggregated information permits a more detailed analysis of consumer demand behavior in recent years. Data used to construct these variables were taken from the following sources:
California personal income, population and the California Consumer Price Index (1982 - 1984 = 100) were reported by the California Department of Finance primarily in the annual issues of the California Statistical Abstracts. All data reported in real dollar terms have been deflated by the California CPL
Data series concerning Thoroughbred horse racing meets and pari-mutuel wagering within California were assembled from the annual statistical reports published by the California Horse Racing Board over the period 1953-1989.
Lottery data, representing total state lottery sales by calendar year, were obtained from the California State Lottery Commission.
In the discussion below, we report our findings first from the statewide analysis and then from the trackspedfic model.
68

Regression Results ·and Statistical Analysis
The Statewide Econometric Model
In this section we examine patterns of attendance and handle per attendee at major Thoroughbred races for Californiaasawhole,overtheperiod 1953-89. We seek to explain how the demand for both live racing activities (on-track) and total racing activities (on-track plus satellite) are affected byvarious factors in the economy. The explanatory variables included in the analysis are real income per California resident; the effective takeout rate on wagers; the number of on-track racing days; the number of off-track racing days; and real sales of lottery tickets. Since only 37 observations are included in the statewide data set, we defer consideration of the effects of Pick Six wagering and purse size until the track-specific analysis in the next section, where more observations are available and track-specific effects can be accounted for.
The equations to be estimated are:
(1) Attendance per capita= °<J + ai *(per capita income) + a2 * (effective takeout rate) + a3 * (racing days) + a4 * (off-track days) + a5 * (lottery sales) + ei
(2) Real handle wagered per attendee = Po + Pt * (per capita income) + ~2 * (effective takeout rate) + P3 * (racing days) + ~4 * (off-track days) + Ps * (lottery sales) + e2
where e} and e2 represent random disturbances, and Greek letters indicate unknown parameters to be estimated from the data.
The equations above were estimated by ordinary least squares. Definitions of the variables used in these regressions are given in Table 4-1. Table 4-2 presents the regression results where the variables to be explained are on-track attendance per capita and handle per attendee. Table 4-3 reports the comparable estimated equations for total (including satellite facility) attendance and handle per attendee.
Table 4-1. Definitions of Variables
(Note: Variables measured in real dollars have been deflated by the California consumer price index; base year= 1982-1984)
ATTEND Annual on-track attendance per thousand California residents at major California Thoroughbred meets.
HANDLE Amount wagered on-track per attendee, in real dollars.
PCY Real per-capita annual income of California residents.
ETO Effective take-out; the percentage of total handle that was not returned to bettors as winnings.
DAYS The sum of all racing days offered by major California race tracks per annum.
OTDAYS The sum of all racing days offered by off-track satellite wagering facilities per annum.
LOTTERY Real dollars wagered per thousand California residents on the California state lottery.
TATTEND Actual attendance per thousand California residents at major California Thoroughbred meets. This figure includes attendance at satellite facilities receiving a signal from a major Thoroughbred meet.
THANDLE Amount wagered per attendee onmajor California Thoroughbred meets in real dollars. This figure includes the money wagered at satellite facilities receiving a signal from a major Thoroughbred meet. ·
69

Table 4-2. Estimated Demand for On-track Attendance and Pari-Mutuel Wagering at Major California Thoroughbred Race Tracks, 1953-1989a
Equation 1. Annual On-Track Attendance per Thousand California Residents
ATfEND = 409.92- .0217 * PCY-11.817;.* ETO + 1.017 *DAYS -.0140 * OTDAYS-.00052 * LOTIERY
(7.26).(-4.44) (-1.69) (5.02) (-2.03) (-1.22) .
R2= .70
Equation 2. On-Track Handle Wagered per Attendee
HANDLE = 544.72 + .0163 * PCY - 18.837 * ETO- .530 * DAYS + .0022 *OTDAYS - .00035 * LOTTERY
(14.04) (4.87) (-3.91) (-4.56) (0.46) (-1.18)
R2 =.90
aFigures in parentheses are t-ratios.
Effect of Takeout Rate on Attendance and Handle As mentioned earlier in this chapter, the elasticity of demand for pari-mutuel wagering with respect to the effective takeout rate is a key figure, since it indicates whether the current takeout percentage maximizes wagering revenues. This number indicates the percentage change in handle that results from a one percent increase in the effective takeout rate. If this elasticity is less than -1, then reducing the effective takeout rate will increase total takeout revenues, since the reduction in the takeout'rate is more than offset by the resulting increase in total handle. If instead the elasticity is between 0 and -1, then track and state revenues will grow if the takeout rate is increased.4
Referring to Table 4-2, equation 1, the effective takeout rate (abbreviated ETO) is found to have a negative effect on per capita on-track attendance that is statistically significant at the .90 confidence level as measured by the t-test. Evaluated at the means of the data, the elasticity of attendance with respect to the ETO is-.61. This implies that a one percent increase in ETO results in a decline of .61 percent in per capita ontrack attendance, given that all other factors remain unchanged.
In Table 4-2, equation 2, an increase in ETO is also seen to reduce on-track handle per attendee; this effect is significant at the .99 level. The elasticity of on-track
handle per attendee with respect to ETO (evaluated at the means) is -1.25.
, Perhaps of greatest interest is the elasticity of total. on-track handle with respect to the effective takeout rate. This elasticity equals the sum of the effects of the takeout rate on attendance and on wagering per attendee, and is estimated to equal -1.86. This price elasticity implies that a reduction in the current effective takeout rate will increase total on-track revenues from ~agering, other variables held constant. About one-third of the estimated effect of ETO on total ontrack handle is due to changes in attendance, with the remaining two-thirds of the effect arising from changes in wagering per attendee.
Regression results in Table 4-3 differ from those in Table 4-2 in that attendance and wagering at satellite facilities are included in the data. An increase in the effective takeout rate is found to decrease both total attendance and wagering per attendee. The former effect is significant at the .90 level, the latter at the .99 level. A one percent increase in ETO is estimated to cause a .60 percent decline in total attendance per capita; a 1.25 percent drop in handle per attendee; and an overall reduction in total handle of 1.85 percent. As with on-track handle, total handle is elastic with respect to ETO (since -1.85 is· less than -'U. This implies that the total revenues from wagering would rise if the ETO were reduced.
4 See appendix D-1 for a more detailed explanation of elasticities.
70

Effect of Live (On-track) Racing Days on Attendance and Handle
The estimated effect of increasing on'."track racing days by one percent is to raise on-track attendance by 1.18 percent, while decreasing handle per attendee by .79 percent (Table4-2). Both effects are statistically significant at the .99 level. As expected, an expansion of available days stimulates on-track attendance; it also appears to ca~se some bettors to spread their wagering activity over moredaysand thusbet less pervisit to the track. These estimates imply that, historically, a one percent increase in racing days has generated a net gain of .39 percent in total wagering revenues (1.18 percent increase due to attendance gains minus .79 percent loss from declining wagering per attendee).
In Table 4-3, the effects of an increase in on-track racing days on total. attendance and handle per attendee are found to be similar to those for on-track activity. Again, attendance rises while handle per attendee falls, with both effects significant at the .99 level. A one percent increase in racing days leads to a 1.15 percent gain in attendance per capita, a .79 percent decline in handle per attendee, and therefore a net revenue gain from wagering of .36 percent.
While these empirical findings suggest that further expansion of live racing days has some potential to increase revenues, several caveats are in order. First, the number of live racing days in each region of the state (north, south) has risen greatly in recent years.
Thus, the opportunity for further expansion of racing days is limited if overlapping of race meets within the same market area is to be avoided. Second, to expand racing days is not costless; such additional costs must be weighed against any potential pari-mutuel and non-pari-mutuel revenue increases resulting from an increase in racing days. As a third consideration, offtrack wagering was in effect only during the last five years covered by the regression analysis. Dramatic recent increases in off-track days may alter the historical relationship between on-track wagering and racing days.
Effect of Satellite Days on Attendance and Wagering In Table 4-2 equation 1, OTDAYS (the number of days offered at California satellite facilities per annum) is found to have a negative effect on on-track attendance that is statistically significant at the .95 confidence level. However, the estimated effect of a one percent increase in off-track days on on-track attendance is very small (only-.015 percent.) The impact of off-track days on on-track handle per attendee appears to be negligible; it is near zero and not statistically significant.
Turning to Table 4-3, a one percent increase in OTDAYS is estimated to increase total attendance very slightly (by .01 percent). This effect is significant at .90 level. The estimated effect of OTDAYS on total handle per attendee appears negligible.
Table 4-3. Estimated Demand for Attendance and Pari-Mutuel Wagering at Major California Thoroughbred Race Tracks and Satellite Facilities, Statewide Data, 1953-1989a
Equation 1. Tot.al Annual Attendance per TJwusand California Residents
TATTEND = 410.73- .0217 * PCY-11.88 * ETO + 1.017 *DAYS+ .0096 * OTDAYS- .00035 *LOTTERY
(7.29) (-4.45) (-1.70) (6.03) (1.40) (--0.83)
Equation 2. Total Handle Wagered per Attendee
THANDLE = 544.68 + ..0163 *PCY - 18.83 * ETO .529 * DAYS .00077 * OTDAYS - .00036 *LOTTERY
(14.04) (4.86) (-3.91) (-4.56) (--0.16) (-1.23) R2 =.91
aFigures in parentheses are t-ratios.
71

Given these estimates, it would appear that substantial gains in revenues are unlikely to come from further expansion of satellite racing days in California. However, satellite wagering was in existence only during the final five years included in this analysis, so this finding is based on limited data. Also, the effect of an additional sateUite day will certainly vary depending on the market in which it is offered; site-tpecific information is required 'to make this decision.
Effect of the California Lottery on Attendance and Wagering.
Increases in LOTIERY (real lottery sales per thousand California residents) are found to benegativelyrelated to both on-track (Table 4-2) and total (Table 4-3) attendance and handle per attendee. Thus there is some evidence that the lottery competes with racing for customers' dollars. However, in each case the estimated effect of the lottery on racegoingand wagering is small in magnitude and not statistically significant at the usual levels. Because only the final five observations of the statewide data set include the lottery, the sample period may simply be too short to allow for an accurate measurement of the impact of the lottery on race track attendance and wagering.
Effect of Per Capita Real Income on Attendance and Wagering
Another explanatory variable of interest is per capita real income. Rising real income is found to have a negative and statistically significant effect on race track attendance, but a positive and significant effect on wager per attendee. A one percent increase in PCY is estimated to reduce on-track attendance by .85 percent, and total attendance by .82 percent. At the same time, on-track and total handle per attendee each rise an estimated .82 percent.
Income's negative effect on attendance may in part reflect the scarcity of free time that is associated with high levels of employment and earnings in the population; track attendance is a time-consuming activity. Once at the track, however, attendees appear to wager more during prosperous periods, as would be expected. Since attendance and wagering effects are nearly equal in magnitude and opposite in sign, the net result is that total handle is not very sensitive to changes inPCY.
Demand Analysis by Major Thoroughbred Track
In this section the demand for attendance and wagering (on- and off-track combined) is analyzed using data collected individually from each major Thoroughbred race track in California over the years 19701988. The data setincludes 19 annual observations per track and five major tracks, for a total of 95 observations. Because five observations are available peryear,
this data set is better suited to examining the effects of recent changes in the racing environment (such as the introduction of satellite wagering, new types of bets, and the California lottery) than is the statewide data set used in the previous section. Another advantage of using track-specific data is that factors unique to each track, such as location or quality of facilities, can be accounted for by allowing the intercept of each estimated demand function to vary by track.
As in the statewide analysis, we estimate two equations: (i) attendance per thousand California residents and (ii) handle wagered per attendee (including satellite facility activity). Explanatory variables include those used in the statewide model, plus additional variables designed to capture the impacts of trackspecificeffects, horse quality as measured by the size of purses, and the introduction of new types of wagers such as the Pick Six. Definitions of these variables, together with their abbreviations, are found in Table44. Regression results are reported in Table 4-5.
Track-specific Components of Attendance and Wagering
In the regression equations of Table 4-5, the variables GG, BM, HP, SA and OM representthe effects offactors specific to each race track (such as location or ease of access) that are not otherwise included in this model. As an example, the variable GG equals one for any observation taken at Golden Gate Fields, and zero for observations from other race tracks. In equation 1 (Table 4-5), the estimated intercepts for attendance per thousand residents range from approximately 54 (at Del Mar) to 112 (at Santa Anita). These estimates imply that, even if all other factors could be held equal for every track, Santa Anita and Hollywood Park would be expected to have substantially higher attendance per capita than do the remaining tracks.
Handle wagered per attendee varies less by track than does attendance. The track-specific variables in Equation 2 (Table 4-5) have coefficients ranging from 501 (Del Mar) to529 (Bay Meadows), indicating that, all else equal, handle per attendee at each major race track would be fairly uniform across tracks.
Effect of Takeout Rate on Total Attendance and Handle
Recall that the elasticity of demand for racing activities with respect to the effective takeout rate measures how revenues will respond when the takeout rate is raised by one percent. In the track-specific analysis for 19701988 (Table 4-5), the estimated elasticity of the total handle with respectto ETD is-1.77, indicating (as in the statewide analysis) that pari-mutuel revenues can be enhanced by reducing ETO.
The effective takeout rate is found to be negatively related both to per capita attendance and to handle per
72

attendee. However, its estimated impact on attendance is small and does not differ significantly from zero. A one percent increase in ETO results in a estimated decline of .20 percent in on-track attendance and a reduction in handle per attendee of 1.57 percent, given that all other factors remain unchanged.
Effect of Live (On-track) Radng Days on Attendance and Handle
A one percent increase in on-track racing days is estimated to raise attendance by .78 percent, while
decreasinghandleperattendeeby .016percent(Table · 4-5). The impact on attendance is statistically significant at the .99 level, while the effect on wagering per attendee does not differ significantly from zero as measured by the t-test.
Comparing these estimates with those from the statewide regressions, note that attendance and handle per attendee appear to have been less responsive to the number of live racing days during 19701988 than was the case during the longer 1953-1989
Table 4-4. Definitions of Variables for Track-Specific Econometric Model
(Note: Variables measured in real dollars have been deflated by the California consumer price index; base year= 1982-1984)
TATTEND
THANDLE
GG
BM
DM
HP
SA
PCY
ETO
DAYS
OTDAYS
LOTTERY
PURSE
P6
Total attendance per thousand California residents by major Thoroughbred track. This figure includes people attending satellite facilities to wageron races hosted by the major Thoroughbred track.
Amount wagered per attendee on each major Thoroughbred meet in real dollars. This figure includes the money wagered at all satellite facilities acting as a guest site for the major Thoroughbred meet.
Dummy variable to indicate that the observation came from the meet at the Golden Gate Fields racetrack.
Dummy variable to indicate that the observation came from the meet at the Bay Meadows race track.
Dummy variable to indicate that the observation came from the meet at the Del Mar race track.
Dummy variable to indicate that the observation came from a meet at the Hollywood Park race track.
Dummy variable to indicate that the observation came from the meet at the Santa Anita race track.
Real per capita income of Northern California residents if the observation came from BM or GG, or southern California residents if the observation came from SA, HP, or DM (see Figure 2-3 for definition of North versus South).
Effective takeout by major Thoroughbred tracks.
The number of racing days granted to each major Thoroughbred track.
The sum of all racing days offered by satellite facilities in northern California if the observation came from BM or GG, or southern California if the observation came from HP, SA or DM.
Real dollars wagered per thousand California residents on the California State Lottery.
Real purse money paid per day, in 1,000s.
A dummy variable indicating whether "Pick Six" and/or "Pick Nine" wagering was offered.
73

period although a significant and positive relationship between days and attendance is still found. However, because handle per attendee was estimated to decline very little in response to additional live racing days in the track-specific model, the percentage increase in total handle from a one-percent increase in live racing days is estimated to be .77, which exceeds the aggregated statewide estimate of .36. '
Effect of Satellite Days ~n Attendance and Wagering The variable OTDAYS (representing the number of days offered at California satellite facilities perannum in the region where a given race track is located) is found to have a positive effect on total attendance but a negative effect on handle per attendee. These effects are significantly non-zero, but are small in magnitude. A one-percent increase in satellite days in the region where a given track is located (northern or southern California) is estimated to cause a .0140 percent rise in total attendance per capita; a .0063 decline in handle per attendee; and thus a small positive net change (.0077 percent) in total handle per capita.
Effect of the California Lottery on Attendance and Wagering The estimated effects of real lottery sales on racing attendanceandhandleperattendeearenegative. However, these effects are small in value (implying that a one-percent increase in real lottery sales results in a .013 percent decline in total handle) and are not statistically different from zero at the usual significance levels. It is possible, that since the lottery variable used here represents real sales of lottery tickets for the state as a whole, the true impact of the lottery ondemand for racing activities at each track may be understated. Data on lottery sales by location and date would allow an improved estimate of the lottery's track-specific impacts. Additionally, the lottery existed only during the last five years of the sample period; further observation would allow for a more accurate estimate of its effect on racing demand. Nevertheless, the limited evidence here suggests that the lottery competes to some extent with racing for consumer dollars, but is not viewed by the public as a close substitute for wagering on horse races.
Table 4-5. Estimated Demand for Pari-Mutuel Betting at Major California Thoroughbred Race Tracks, Track-Specific Data, 1970-1988a
Equation 1. Total Annual Attendance per Thousand California Residents
TATIEND = 64.546 ""GG + 60.075 ""BM+ 91.813""HP+112.38 ""SA
(2.68) (2.53) (3.41) (4.20)
+ 54.32 ""DM-1.41""ETO+1.13 ""DAYS+ 0.022 ""OTDAYS
(2.22) (-0.64) (8.95) (3.87)
- 0.004 ""PCY -0.00008 .. LOTTERY+ 0.185 ""PURSE -1.01 ""P6
(-1.90) (-0.91) (3.69) (-0.30)
R2 =.92
Equation 2. Total Handle Wagered Per Attendee
THANDLE = 519.31 ""GG + 528.50"" BM+ 525.32 *HP+ 505.48 .. SA
(11.27) (11.51) (11.03) (10.65)
+ 501.16 .. DM -19.691""ETO-0.041 ""DAYS - 0.018 ""OTDAYS
. (10.75) (-4.86) (-0.32) (-2.30)
+ 0.0047 ""PCY - 0.00011 ""LOTTERY + 0.0406 •PURSE -40.526 "" P6
(1.15) (-0.67) (0.87) (-6.43)
R2 =0.89
aFigures in parentheses are t-ratios.
74

Effect of Per Capita Real Income on Attendance and Wagering As in the statewide regressions, income is found to have a negative effect on race track attendance, but a positive on handle per attendee. A one-percent increase in PCY is estimated to reduce attendance per capita by .50 percent, and increase wager per attendee by .36 percent. The effect on wager per attendee is not statistically significant at normal levels here, although it was found to be significant in the statewide model.
These estimates imply that the demand for racing activities hasbeen little affected since 1953bybusiness cycle fluctuations. Racing demand may even respond countercyclically, rising during business slowdowns and weakening when the general economy is robust.
Effect of Purse Size cm Attendance and Handle We included the variable PURSE in these regressions as an indicator of the average quality of racing offered at each track byyear; it measures the average real value of purses paid per racing day during each year, by track. That is, we have assumed that larger purses attract a higher calibre of horses to a race track, thus creating more exciting racing events.
In Table 4-5, Equation 1, PURSE has an estimated effect on attendance that is positive and significant at the .99 level. A one-percent increase in average purse per racing day results in an estimated .28 percent increase in attendance per thousand residents per annum. The estimated effect of PURSE on handle per attendee is also positive, but small and statistically insignificant.
In interpreting the estimated effect of purse size on racing demand, note that amount of money currently available for purses at a track is affected by past levels of wagering activity since a portion of the pari-mutuel pool is set aside as revenue for purses. Thus the purse variable may capture not only the public's response to the quality of racing, but also any other time trends in attendance or handle per attendee. For instance, if attendance at race tracks depends in part on habit formation and past familiarity with racing, then high levels of past attendance will be positively correlated with both high current attendance, and large current purses. To test whether introduction of the PURSE variable affects other parameter estimates in the model, a second set of regressions were run in which purse was omitted. The estimates thus obtained varied only slightly from those reported in Table 4-5.
Effect of Pick Six and Pick Nine Wagering on Attendance and Handle The variable P6 indicates whether a track offered Pick Six and/or Pick Nine wagering during a particular
year; it equals one if so, and zero otherwise. This variable is estimated to have a substantial negative effect on handle per attendee, and the effect is significant at the .99 confidence level. The presence of Pick Six or Pick Nine wagering is associated with a $40 decline in handle per attendee. Surprisingly, the P6 variable does not appear to have a significant impact on attendance.
While these results suggest that Pick Six and Pick Nine wagering may have significantly harmed parimutuel revenue generation, a cautionary note is required. The P6 variable indicates only whether these typesofbets were offered, not the actual dollar amount wagered on them. Thus estimates of P6's effects can include impacts of any other factors not in the regression equations, provided that their effects occurred at approximately the same time as the introduction of the Pick Six. For instance, if the public's general level of interest in racing activities was lower in the 1980s than in previous years, this would be measured here by the P6 variable. (Because all major California Thoroughbred tracks introduced some type of Pick Six or Pick Nine betting during 1980or1981, no "control group" is available to allow examination of wagering and attendance patterns in the absence of such wagers.)
Nevertheless, wagers that depend on the outcome ofsixornineracesremovemoneyfromattendeesearly in the racing dayand do not return winnings until later in the afternoon. This reduces the "chum" (the rewagering of winnings during the day), Total handle will fall unless a substantial portion of wagers on Pick Six/Pick Nine are "new dollars" that would not otherwise have been wagered on other types of bets. The limited information at hand suggests that consumer response to these new wagering opportunities has been insufficient to avoid a negative effect on handle.
A Note on the Effective Takeout Rate
Analysis of both statewide and track-specific data has indicated thatpari-mutuel revenues could beenhanced by reducing the current effective takeout percentage (ETO). However, it should be noted that the effective takeout rate is not a single policy variable that can be adjusted directly by the legislature. Instead, the effective takeout rate is itself affected by the behavior of consumers, as is explained below.
Since 1978, a surcharge takeout percentage has been charged on exotic wagers, so that the legislated takeoutrateonexotic bets (here termed XTO) is higher than the legislated takeout rate on conventional win-placeshow wagers (CTO). The effective takeout rate is a weighted average of the two legislated rates, plus breakage:
75

ETO = ( Exotic Handle *XTO + Conventional Handle *CTO + Exotic Breakage + Conventional Breakage)/Total Handle
The effective takeout rate is thus influenced indirectly, rather than directly, by the legislature, since it can vary if consumers shift dollars from conventional to exotic pools or vice versa. For example, if the overall takeout rate on exotic wagers (including the percent exotic breakage) is higher than the overall rate on conventional wagers (including conventional breakage), then a shift by bettors toward more exotic wagering will cause the effective takeout rate to rise even without any changes in the legislated rates (XTO and CTO).
An analysis of wagering activity by bet type was conducted to explore whether an optimal price differential between the two major categories of wager could be determined. However, no clear-cut consumer response was found to changes in relative legislated takeout rates on conventional and exotic wagers. We feel that our poor statistical results are at least in part due to severe data limitations.
Perhaps the most serious limitation for an analysis of this complexity, is the extremely small size of the data set. Second, the legislated conventional takeout rate was changed only twice during the entire 12-year period included in the data set. On each of these occasions the exotic rate was changed as well. Consequently, the effects of each rate change cannot be clearly distinguished statistically.
Finally, while breakage is a significant component of the effective takeout rate for each type of bet, it is not considered here since pastbreakage revenues were not reported by type of bet. The variables representing exotic takeout and conventional takeout thus did not represent the entire "price" of each type of wager. On average, the percentage of wagers paid as breakage is likely to be higher on conventional than on exotic pools, so the difference in the overall takeout rate on exotic versus conventional wagers may be smaller than is the difference between the variables we used to represent exotic and conventional takeout rates.
To explore the relationship between the conventional and exotic takeout rates and wagering activity, and to qiscover whether revenues might be enhanced by changing the relative prices of the two types of wagering, it would be useful to alter one rate but not the other and observe consumer responses (perhaps reducing the conventional takeout rate, but not the exotic takeout rate, for example). If such an experiment were performed, data onbreakage should also be maintained by type of bet, to allow a more complete picture of the actual takeout rates on each category of bet.
Summary and Policy Implications This chapter has examined the effects of various factors on the public's demand for attending and wagering on Thoroughbred races in California. Two sets of annual data were analyzed: statewide data for the years 1953-1989; and data by major race track for 19701988. Here we briefly summarize our major results and discuss their policy implications.
Perhaps most notable is the finding that total parimutuel revenues are very responsive to changes in the effective takeout rate. In economic terms, the demand for wagering is found to be highly elastic with respect to the "price" of a typical wager. This result indicates that pari-mutuel revenues can be enhanced by reducing the current effective takeout rate.
The estimated effect of reducing the takeout rate varies by year, depending on the current values of model variables. Based on statewide data from 19531989 evaluated at mean levels, a one-percent reduction in the effective takeout rate is found to increase the total pari-mutuel handle by 1.77 percent. Using trackspecific data from 1970-1988, a one-percent reduction in the effective takeout rate is estimated to cause a 1.86 percent increase in the pari-mutuel handle. Because the total handle increases by a larger percentage than
' the percent decline in the takeout rate, these estimates imply that pari-mutuel revenues rise when the effective takeout rate is reduced.
To illustrate howpari-mutuel revenues would likely respond to a lower effective takeout rate, we simulated the effects ofreducing the 1989 effective takeout rate of 18.55by(i) one percent to 18.36 percent; and by (ii) five percent to 17.62 percent. Based on the estimated demand functions from Table 4-3 and data values from 1989, we find that:
(i) A simulated one-percent reduction in the 1989 effective takeout rate (from 18.55 to 18.36 percent) resulted in a 2.65 percent increase in expected total handle and 1.59 percent gain in expected parimutuel revenues for 1989. This implies an increase in pari-mutuel revenues of approximately $8.7 million (in nominal dollars) over actual 1989 values.
(ii) A simulated five-percent reduction in the 1989 effective takeoutrate (from 18.55to17.62) resulted in a 14.44 percentincrease in expected total handle, and an 8.70 percent gain in expected pari-mutuel revenues for 1989. This implies an increase in parimutuel revenues of approximately $47.8 million (in nominal dollars) over actual 1989 values.
Because the econometric methods used in this chapter measure the effects of small changes in relevant
76

variables on demand, simulations of more substantial reductions in the effective takeout rate were not undertaken. A stepwise reduction in the effective takeout rate would allow observation of market responsiveness to lower rates.
The effective takeout rate is not a single policy variable; rather, it is the sum of separate legislated takeout rates on (a) conventional and (b) exotic wagers, plus breakage on each type of bet. Thus there are alternative ways in which the overall effective and exotic takeout rate can be reduced. For example, legislated conventional and exotic takeout rates could each be lowered by an equal amount; or; instead, one legislated rate could be adjusted downward while maintaining the other at current levels.
A number of other variables are found to affect the total pari-mutuel handle. A one-percent increase in the number oflive racing days is estimated to increase total handle by an average of between .36 and .76 percent. However, because the current racing calendar offers little opportunity for further increases in live racing days withoutoverlappingracemeets, this policy variable is not likely to provide an important source of new revenues.
A one-percent expansion in the number of .satellite racing days is found to have little effect on total handle, suggesting that, in general, the current supply of satel
. lite wagering days is adequate. This does not rule out the possibility that expansion into selected new markets may enhance handle and revenues. Increases in satellite racing days reduce on-track attendance; the effect is small but statistically highly significant. Since on-track attendance generates more attendance-related revenues (admission fees, parking fees and concession sales) per patron than does attendance at satellite facilities, aneffort should be made to minimize further competition between satellite and on-track facilities.
We find some evidence that sales of California lottery tickets have a negative impact on Thoroughbred wagering activity, but these effects are small in magnitude and not statistically significant at the usual levels. Based on only the first five years of the lottery's existence, it appears that racing and the lottery compete for wagering dollars, but are not viewed as close substitutes by the public.
A variable that indicates whether Pick Six and/or Pick Nine wagering was offered at each track during a given year was included in the analysis of track-specific data. This variable was associated with a decline in wager per attendee. of approximately $40. This negative effect may reflect a reduction of the "chum"; dollars wagered on such bets are temporarily unavailable for rewagering on later races. The negative rela
tionship may also reflect other changes in consumer behavior that coincide with the time of introduction of these types of wagers. Although this finding suggests that Pick Six and Pick Nine wagering can reduce total handle, it may be advisable to continue offering these types of wagers to avoid generating consumer dissatisfaction.
Real per capita income is found to have a negative effect onattendance, but a positive effect onhandle per attendee. Overall, total handle changes little in response to changing income. In fact, handle may respond countercyclically, rising slightly when income declines.
Several factors likely to have important effects on the demand for racing activities were not included in the statistical analysis due to lack of data. Admission and parking fees almost certainly affect attendance. Another factor which may impact the demand for racing is the amount of free or recreational time available to potential racing patrons. As mentioned in the discussion of income effects on racing demand, race . track attendance requires a substantial amount of free time. This is especially true in comparison with the time required to purchase a lottery ticket. In a busy society, lack of free time is likely to limit track attendance even ifadmission fees and takeout rates are very reasonable. In this respect, increases in "two-earner families" might hurt racing, while the so-called "graying of America" may boost racing demand in future years, since retirees typically have more time available for entertainment activities than do the fully employed.
References Ahem, James John, Jr "Analysis of the Demand for
Racing in Maryland and Its Effect on State and Industry Revenues." Ph.D. Dissertation, University of Maryland, 1980.
Ali, Mukhtar M. "Probability and Utility Estimates for Racetrack Bettors." Journal of Political Economy 85: 803-815, 1977.
California Horse Racing Board. State of California Horse Racing Law (Chapter4, Division8, Business and Professions Code and Related Laws. Sacramento, CA, 1989.
Coate, Douglas and Gary Ross. "The Effect of OffTrack Betting inNew York City on Revenues to the City and State Governments." National Tax Journal 27(1): 63-69, 1974.
De Seve, Charles W. "Improved Pari-Mutuel Taxation." National Tax Journal 26(4): 591-597, 1973.
77
Gruen, Arthur. "An Inquiry into the Economics of Race-Track Gambling." Journal ofPolitical Economy 84(1): 169-177, 1976.
Guthrie, Robert S. · "State Revenue Potential of Parimutuel Taxation." National Tax Journal 33(4): 509-510, 1980.
Hollingsworth, Kent. .:''What HappensWhen Takeout is Reduced." The Bloodhorse (March 6): 1046-1047, 1978.
Morgan, W. DouglasandJohnDavidVasche. "ANote on the Elasticity of Demand for Wagering." Applied Economics 14(5): 469-474, 1982.
Morgan, W. Douglas and Jon David Vasche. "Horseracing Demand, Parimutuel Taxation and State Revenue Potential." National Tax Journal 32(2): 185-194, 1979.
Pescatrice, DonnR "The Inelastic Demand for Wagering." Applied Economics 12(1): 1-10, 1980.
Pescatrice, DonnR. "A Model Enhancing Parimutuel Revenue to Government and the Racing Industry." Growth & Change 11(3): 9-16, 1980.
Quandt, Richard E. "Bettingand Equilibrium." Quarterly Journal of Economics 101: 201-207, 1986.
S.D. Leidesdorf & Co. The New York Racing Association, Inc. Study of the Effect of a 5% Increase in Takeout Upon Revenues at Thoroughbred Race Tracks in New York State. New York, NY, 1965.
Suits, Daniel B. "The Elasticity of Demand for Gambling/' Quarterly Journal of Economics (February): 155-162, 1979.
Thaler, Richard H. and William T. Ziemba. ''Parimutuel Betting Markets: Racetracksand Lotteries." Journal ofEconomic Perspectives 2(2)(Spring): 161-74, 1988.
Wolff, Mary R. "Better Bets: Where Supply-Side is on Track." Wall Street Journal, July 1, 1986.
78

Chapter 5. Total Economic Impact of the Thoroughbred Racing Industry on State and Local Economies
Previous chapters of this report have discussed the principal participants in the Thoroughbred horse racing industry and presented separate estimates of the economic activity generated byeachparticipantgroup. However, these estimates do not account for the total economic impact of the industry. In this chapter we summarize the economic activity of the entire industry, and examine how the industry as a whole contributes directly and indirectly to the California economy.
Government Revenues The State of California plays a key role in the Thoroughbred racing industrybycontrollingmarket forces (such as the number of racing days and the takeout rate) and regulating the industry. The state also receives a significant amountofrevenue from the industry. Estimates of the state revenue generated by the Thoroughbred horse racing industry in 1989 are displayed in Table 5-1. The majority of this revenue was
from the legislated percentage of the pari-mutuel pool which the state retains in theform of license fees (recall the discussion in Chapter 1), estimated to be approximately $137.5 million in 1989.
Inaddition to pari-mutuel license fees, the industry generates state revenues from sales taxes. Most sales of Thoroughbred horses in California are subject to sales tax. Purchases of goods used by both the horse sector and the racing associations (those not for resale) are also subject to sales tax. Because we do not have estimates o( all taxable transactions occurring in the Thoroughbredhorse racingindustry(e.g., private horse sales), the sales tax estimate reported in Table 5.-1 can be considered a lower bound on taxes paid-that is, the industry generated directly at lea.st $9.2 million in state sales taxes.
The state also collects an occupational license fee from all horse peopleworkingonCaliforniarace tracks
Table 5-1. Estimated Government Revenues From the California Thoroughbred Horse Racing Industry, 1989
Revenue
----tin $1,000si---
To State: . Pari-Mutuel License Fee Revenue3 State Sales Taxb Occupational License Fees and FinesC Subtotal, State
$137,460 9,230 1.330
$148,020
To Local Governments: Admission Taxes, Local License Feesd Property Taxese Subtotal, Local Governments
8,050 7,760
15,810
Total $163,830
astatetakeout from pari-mutuel pool, including an estimate ofstate revenue generatedby Thoroughbred racing at fair race meets.
b This is an estimated lower bound on the state sales tax paid directly by trainers, farm and ranch owners, horse owners, and the racing associations. Therefore, it does not include all sales taxes generated by the industry. See Tables 2-198 and 3-4.
c See Tables 2-19B and 3-4.
d A legislated percentage of the pari-mutuel pool.
e See Tables 2-19B and 3-4.
Source: Estimated from survey and industry data.
79

Table 5-2. Estimated Revenues of the California Thoroughbred Horse Racing ' Industry, 1989
Horse Sector Pari-Mutuel Revenuesa
Racing Association Revenuesb
Pari-Mutuel
Admissions
Concessions, Parking, Programs, etc.
Other
Total Racing Associations Revenues
Total
Revenue
------tin$1,000s)----
$131,500
$134,264
28,930
34,667
12.185
210,046
$341,546 a Includes estimate of Thorougttbred horse sector pari-mutuel revenue from fair race meetings; does not include purse
money contributed by horse owners. See Chapter 2.
b See Table 3-3.
Source: Estimated from survey and industry data.
orauxiliary training facilities, from race horse owners, and from certain association employees. A relatively small amount of revenue is collected in fines from those who violate rules and regulations established by the state. These two state revenues are combined in Table5-1.
Local governments in California also benefit from the Thoroughbred horse racing industry. They receive a percentage of the pari-mutuel pool for admission taxes and local license fees, along with property taxes collected from race tracks, Thoroughbred farm and ranch owners, and Thoroughbred horse owners. California local government revenues generated by the Thoroughbred horse racing industry were estimated to be approximately $15.8 million in 1989 (Table 5-1).
It is important to note that our estimates do not include all government revenues generated by the Thoroughbred horse racing industry in California. As mentioned previously, the estimate of sales taxes is a lower bound. Furthermore, we have not included an estimate of state and federal income, social security, . self-employment,and other income-related taxes paid by individuals and corporations on income earned in California's Thoroughbred horse racing industry.
Industry Revenues In 1989, over 10million spectators wagered about $2.3 billion on Thorouglibred racing at major tracks and satellitewageringfacilities. Table5-2showsthatthese
· spectators and bettors generated approximately$341.5 million in revenues for the horse sector and the racing associations. Of the total receipts, almost $265.8 million came from the pari-mutuel handle ($131.5 million to the horse sector and $134.3 million to the racing associations). The remainder of the receipts came from track admissions ($28.9 million) and other race track patron services ($46.8 million).
Indirect Economic Impact The economic importance of the horse racing industry would be understated for the total economy if only these direct receipts of $341.5 milHon are considered. Whenever one sector of an economy experiences a change in activity, not only are the output, receipts, and expenditures of that sector directly affected, but there are also corresponding changes in many other sectors. This is somewhat analogous to throwing a rock in a lake; the splash is the direct effect, but there are also ripples growing out around the initial point of change. Economic "multipliers" quantitatively mea
1 Preliminary results of the updated 512 Sector California Input-Output Model were provided byRichard B. Le, Economist Division of Planning, Department of Water Resources, State of California, August 21, 1990.
80

Table 5-3. Estimated Employment in the California Thoroughbred Horse Racing Industry, 1989
Total Employed
(Full-Time Equivalent)
Horse Sector Employed by Trainers, Farms & Ranchesa 5,405 Professionals & Self-Employedb 905 Other Employment'= 170
Racing Associationsd 3,680
Total 10,160 a See Table 2-8.
b Includes trainers, jockeys, veterinarians, and farriers. See Table 2-8.
c Includes Other Self-Employed and those employed by horsemen's organizations, from Table 2-8.
d Excluding depreciation and taxes. See Table 3-7.
Source: Estimated from survey and industry data.
sure a total change for the economy that includes the Employment and Cash Flow direct and indirect effects from a change in demand in
Table 5-3 shows the total number of persons directly one sector. The California Department of Water Reemployed in California's Thoroughbred horse racing sources (CDWR) has constructed an input-output industry in 1989. The diversity of jobs required tomodel of the California economy with 512 sectors.I support a complex Thoroughbred racing industry is One sector in the CDWR input-output model-Racing indeed impressive. Approximately 6,480 full-time and Track Operations-is closely aligned with the horse equivalent jobs are supported within the horse sector, racing component of this study. Another sectorranging from general farm labor to self-employedMiscellanrous Livestock-most closely corresponds to professionals. Another 3,680 full-time equivalent what we identify as the Horse Sector. The Type II workers are employed by the racing associations, fill- · income multipliers for the Racing and Track Operations ing positions in such general categories as pari-mutuel sector and Miscellanrous Livestock is 1.76 and 5.20, clerk, corporate officer, accountant, maintenance respectively.2 Using these two multipliers with the worker, and parking lot attendant. Thus, full-time corresponding revenues in Table 5-2 provides an estiequivalent employment for the total industry is estimate of the total (direct, indirect, and induced) income mated to be approximately 10,160.contribution of the California Thoroughbred industry
to the state's economy. This amounts to approxi All direct payments to households and other indusmately $1,053 million {(1.76 x $210.05 million)+ (5.2 x tries for goodsand services, excluding intra-sector and $131.50 million)}.3
2 Two t,Y,Pes ofincome multipliers are defined in the literature. The type I multiplier is the ratio ofthe "direct plus indirect" to "direct' fiousehold income generated by a $1 increase in final demand. The Type II multiplier is similar but also reflects induced or second-round adjustments affecting households.
3 It should be noted that the portion of the total income impact r.elated to the horse sector (5.2x $131.5 million= $684 million) may well be understated. The analysis in chapter 2 revealed substantial negative cash flows for the horse sector in 1989 (i.e., revenue of $131.5 million compared to expenditures of $275.3 million). Cala.ilating the total (direct and indirect) income effects from the horse sector expenditures on goods and services (rather than receipts) almost doubles the multiplier effect ($1,278 million). Combining this alternative total income estimate for the horse sector ($1,278 million) with the previous estimate for the racing sector (1.76 x$210.05 million= $369.7 million) gives a substantially higher estimate ofthe totalincome contribution of the Thoroughbred industry to the state economy of$1,647.7 million (compared to $1,053 million). It seems unlikely, however, that tnehorse sector can sustain overtime such negative cash flows as were measured in1989; therefore, we conclude that the multiplier effect based on horse sector receipts is fhe better overall estimate.
4Note that this does not include the relatively minor payments to employees of horsemen' sorganizations nor to 125 "other" self-employed (see Table 2-8). These payments could not be identified separately and so are included with payments for other goods and services.
81

Table 5-4. Estimated Payments for Goods and Services by the California Thoroughbred Horse Racing Industry, 1989a
Expenditures
$1,000s1---
Horse Sectorb ' Labor (employees of trainers and farms & ranches) Professionals & Self-Employed Feed and Bedding Payments for Other Goods and Services Outside Horse Sector Subtotal
Racing Associationsc Wages and Salaries Rentals and Services Contracted Marketing Materials and Supplies Insurance Utilities Professional Services Payments to Charity Interest Other Subtotal
Total
$75,660 50,030 55,610
$254,930
88,019 50,733 10,704
9,320 6,317 5,077 4,286 2,013 3,115 8,845
188.429
$443,359
a These expenditures do not include major intra-sector and government payments.
b See Table 2-19A.
c See Table 3-3.
Source: Estimated from survey and industry data.
Table 5-5. Estimated Investment in the California Thoroughbred Horse Racing Industry, 1989
Horse Secto~ Thoroughbred Horses Farm and Ranch Land and Other Assets
Racing Associationsb
Total
a Estimated market value. See Table 2-20 and 2-23.
b Estii:nated by independent appraisal.
Investment
(in $1,000s)
$712,680 386,500
810,000
$1,909,180
Source: Estimated from survey and industry data, and from independent appraisal.
82

government payments, made by the Thoroughbred racing industry are shown in Table 5-4. Direct expenditures made to persons employed in the industry totaled nearly $214 million.4 Of this, $125.7 million was paid by the horse sector and $88 million was paid by the racing associations. Other payments include purchases for feed and bedding, specialized equipment and machinery, utilities, insurance, advertising, and supplies for track patron services, all of which indirectly affect a wide range of businesses through the multiplier effect.
Investment Total investment in Thoroughbred horses, farms and ranches, and race track real property is exhibited in Table 5-5. As shown, the estimated market value of horses, land, and other assets used primarily for producing horses and horse racing inCalifornia was nearly $2 billion in 1989. The largest component of this figure is the estimated value of the land on which the major race tracks are located, which is appraised at $810 million.
Surveys of the horse sector indicate that there were almost 34,000 Thoroughbred horses in California in 1989 including racing stock, breeding stock, young horses and potential race horses (those two years old and older) not in training. Based on owners' estimates
of the current market value of their racing and breeding stock, the total market value of Thoroughbred horses in California was $712.7 million in 1989 (Table 5-5).
Besides horses, Thoroughbred farm and ranch owners invest in land, permanent and semi-permanent facilities (fencing, barns, other buildings, pens, training tracks, feed storage facilities, water and irrigation systems and employee housing) and equipment (tractors, trucks, horse trailers, tack, etc.). The estimated market value of these farm and ranch assets was $386.5 million for 1989.
Summary and Conclusions In 1989, 105 million spectators wagered about $2.3 billion on Thoroughbred racing in California. This generated $341.5 million for the horse sector and the racing associations and added at least $163.8 million to state and local government coffers (excluding payroll taxes and income taxes). The industry provided fulltime equivalent employment to approximately 10,160 people and made payments to these individuals of over $213.7 million. Combining the indirect as well as the direct economic effects, the industry contribution to the state economy is over one billion dollars. Total market value of investment in Thoroughbred horses, farms and ranches, and race tracks is estimated to be just under two billion dollars.
83
Appendix A-1
Thoroughbred Breeding and Racing ,.
An economic impact study by the University of California, Davis .
.SURVEY QUESTIONNAIRE FOR OWNERS AND BREEDERS OF THOROUGHBRED RACEHORSES
Please return to: Department of Agricultural Economics University of California, Davis Davis, CA 95616 ATfENTION: Katie Blackman
84

Thoroughbred Racing and Breeding Survey
YOUR ANSWERS TO THESE QUESTIONS ARE ENT1RELY CONFIDENTIAL. Data from this questionnaire will be reported in terms of averages and totals. The number stamped on the outside cover is for mailing purposes only. This is so your name will be crossed off the address list when your completed survey is returned.
The following questions focus mainly on issues such as employment, cashflow and investment. Therefore, the person who is most familiar with the financial decisions involving your Thoroughbred horse or operation should provide the answers. It is very important that your completed questionnaire be included in our analysis. If you cannot answer a question exactly, please give the best estimate you can.
Which of the following titles best describes your involvement in the Thoroughbred industry?
1. Owner of a Thoroughbred horse (or horses), but NOT the owner or operator
I of afu~,--~~~~~~~~~~~~~~--. Please proceed to Section One of the questionnaire, beginning on page 2.
2. Owner or managing operator of a Thoroughbred breeding farm.
L If you owned Thoroughbred horses in addition to managing a farm, please fill out the entire questionnaire. If you did not own any Thoroughbred horses in 1988, please skip Section One of the questionnaire, and proceed to Section Two, beginning on n:HYP...8... '-'
85

SECTION ONE: THOROUGHBRED OWNERS
PLEASE FILL OUT PAGES 2 THROUGH 7 IF YOU OWNED THOROUGHBREr5 HORSES IN 1988. IF YOU MANAGED A
• THOROUGHBRED FARM IN 1988, BUT DID NOT OWN ANY HORSES, SKIP TO SECTION TWO, BEGINNING ON PAGE 8.
Q-1 How many Thoroughbred horses did you own in 1988? Please include syndicated stallions, and other horses you co-owned with others. Do not report breeds other than Thoroughbreds in your answer to this question.
,,
NUMBER OF THOROUGHBRED
HORSES
BROODMARES
STALLIONS AT STUD
OTHER HORSES
RACING STOCK (18 months old and older.)
YOUNG STOCK (Less than 18 months of age.)
Q-1 a. How many of your racehorses were in training in 1988?
HORSES IN TRAINING
Q-1 b. On average, how many months out of the year where the horses reported above in training in 1988?
MONTHS
Q-2 Did you own, or co-own, any horses in 1988 that were not Thoroughbreds? (Circle the correct answer.)
.--~~~~~~~~~~~~~~~~~~~~~---.
1. YES_.. Q-2 a. Please specify breed and main use of non-Thoroughbreds.
2. NO MAIN USEBREED
86

Q-3 How many of the Thoroughbred stallions reported in question Q-1 are syndicated?
SYNDICATED THOROUGHBRED STALLIONS
:"" Q-3 a. How many shares do you own per stallion?
SHARES OWNED PER STALLION
Q-4 Aside from syndicated stallions, how many of the horses reported in question Q-1 do you co-own with others? (For example, horses owned in partnership.)
RACING STOCK (18 months of age or older.)
BROODMARES
STALLIONS AT STUD
YOUNG STOCK (Less than 18 months old.)
OTHER HORSES
TOTAL THOROUGHBRDS OWNED WITH OTHERS IN 1988
What is your best estimate, by category, of the following values: 1) the MOST expensive Thoroughbred you owned in 1988, 2) the LEAST expensive Thoroughbred you owned in 1988, and 3) the AVERAGE VALUE of all Thoroughbreds you owned in 1988?
LEASTMOST AVERAGEEXPENSIVEEXPENSIVE VALUE
THOROUGHBREDTHOROUGHBRED
$ $ $ STALLIONS AT STUD
$ $ $ BROODMARES
$ $ $ RACING STOCK
$ $ $ YOUNG STOCK
Q-6 How many of the horses reported in question Q-1 are Cal-breds? (According to the definition of a California-bred Thoroughbred outlined by the California Horse Racing Law and the California Thoroughbred Breeders Association)
CAL-BREDS
87
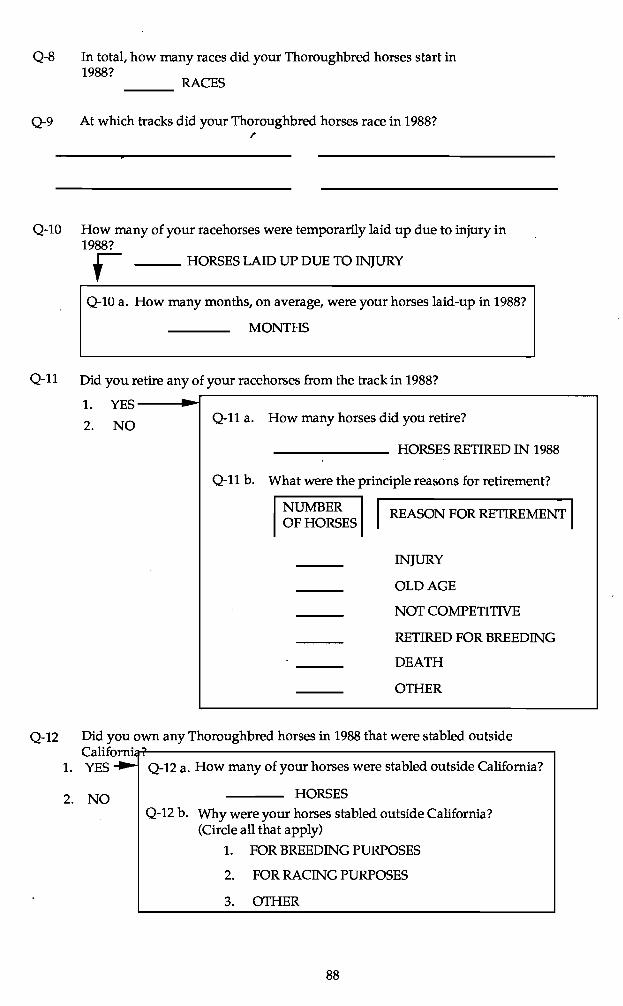
---
Q-8 In total, how many races did your Thoroughbred horses start in 1988?
RACES
Q-9 At which tracks did your Thoroughbred horses race in 1988? /
Q-10 How many of your racehorses were temporarily laid up due to injury in 1988?
' HORSES LAID UP DUE TO INJURY
Q-10 a. How many months, on average, were your horses laid-up in 1988?
MONTHS
Q-11 Did you retire any of your racehorses from the track in 1988?
1. YES ----:-...i Q-11 a. How many horses did you retire?
2. NO
HORSES RETIRED IN 1988
Q-11 b. What were the principle reasons for retirement?
NUMBER REASON FOR RETIREMENT IOF HORSES
INJURY
OLD AGE
NOT COMPETITIVE
RETIRED FOR BREEDING
DEATH
OTHER
Q-12 Did you own any Thoroughbred horses in 1988 that were stabled outside Californi:w----------------------------.
1. YES Q-12 a. How many of your horses were stabled outside California?
HORSES2. NO Q-12 b. Why were your horses stabled outside California?
(Circle all that apply)
1. FOR BREEDING PURPOSES
2. FOR RACING PURPOSES
3. OTHER
88

Q-13 How many of your broodmares were bred in 1988?
MARES
Q-14
Q-15
How many of the mares reported in questionQ-13 produced a live foal in 1989?
MARES
If some of the mares reported in Q-13 did not produce a live foal, what were the principle reasons? (Circle all that apply)
1. THE MARE DID NOT CONCEIVE
2. THE MARE ABORTED
3. THE FOAL DIED AT BIRTI-1
4. OTHER (please specify
What was the average stud fee you paid in 1988?
Q-17 Did you breed any of your mares to stallions that were not based in California in 1988?
1 __-j..._....,. Q-17 a. How many of your mares were bred to stallions based . YES in states other than California?
2. NO MARES
What is your best estimate of the cost of keeping a pregnant mare throughout her pregnancy?
Q-19 What is your best estimate of the costs associated with raising a foal from the time it is born until January 1 of the following year?
DOLLARS
Q-20 How do you obtain your horses? (Circle all that apply)"
1. THROUGH PUBLIC AUCTIONS
2. THROUGH PRIVATE SALES
3. THROUGH CLAIMING RACES
4. PROGENY OF YOUR OWN BREEDING STOCK
5. OTI-IER (Please specify:________________ )
89

Q-21 In which county (counties) were your Thoroughbred horses stabled in 1988?
Q-22 Did you keep any of your Thoroughbred horses on your own property in 1988? I'
1. YES ......... Q-22 a. How many acres are devoted to your Thoroughbred horses?
2. NO ACRES
Q-22 b. What is your best estimat of the value of the land and buildings that are used to conduct Thoroughbred related activities?
$ TarAL ASSETS
Q-23 What were your total Thoroughbred related expenses in 1988?
OOLLARS
Q-24 What percent of your total expenses repbrted in Q-23 were spent in each of the following categories?
PERCENT I LABOR
STUD FEES AND PURCHASE OF HORSES
BOARD AND TRAINING FEES
VETERINARY, DENTAL AND FARRIER BILLS
VANNING AND TRAVEL EXPENSES FOR YOUR HORSES
INSURANCE, INTEREST, ADVERTISING AND LEGAL FEES
PERSONAL TRAVEL AND ENTERTAINMENT
TAXES
OTHER EXPENSES
TOfAL= 100%
Q-25 Approximately what percent of the total annual expenses reported in question Q-23 was spent outside of California? (For example, out of state stud fees.)
PERCENT OF TOTAL 1988 EXPENSES SPENT OUT OF STATE
90

Q-26 What was the total income generated by your Thoroughbreds in 1988?
Q-27 What percent of your total income reported in Q-26 was generated by each of the following categories?
I PERCE~I PURSES AND INCENTNE AWARDS
SALE OF HORSES
STUD FEES
OTHER
TOTAL= 100%
Q-27 Which of the following best describes the organizational structure of your involvement in the Thoroughbred industry?
1 In business by myself.
2 Involved in a partnership with others.
3 Own shares in a corporation whose primary business is horses
Q-28 What is your principal occupation? .
Q-29 On average over the past five years, did you make a profit, break even, or lose money with your Thoroughbred horses? (Circle one)
1. MADE A PROFIT
2. BROKE EVEN
3. LOST MONEY
This is the end of Section One. H you owned or managed a Thoroughbred breeding and/or racing operation, please proceed to Section Two, beginning on the next page. If not, feel free to add any additional comments you may have on the back cover. Thank you very much for your cooperation in filling out and returning this questionnaire.
91

SECTION TWO: THOROUGHBRED BREEDERS
Please fill this section out if you are the owner or managing operator of a Thoroughbred breeding farm.
Q-1 In which county is your horse operation located?
COUNTY
Q-2 How many acres are devoted to your horse operation? Please include only the acreage that is used to conduct Thoroughbred related activities.
ACRES
Q-3 How many of the acres reported in question Q-2 are irrigated?
IRRIGATED ACRES
Q-4 Which of the following services does your horse operation provide, and what is the daily, monthly or 'one time' fee that you charge?. Please fill in all that apply, and indicate whether the fee.is on a daily, monthly or 'one time' basis.
FEEFEE
$1. $ BREEDING 5. LAYUPS
2. $ BOARDING $6. FOALING
TRAINING FOR RACING $3. $ 7. SALES
4.$ TRAINING FOR OTHER EQUESTRIAN EVENTS
Q-5 Was the value of your horse operation assessed in 1988?
Q-5 a. What was the assessed value?1. YES ----1.,.__
$----------- TOT AL ASSETS
r 2. NO EQUI1Y
Q-5 b. What is your best estimate of the value of your horse operation?
TOT AL ASSETS $-~~--~------$ EQUI1Y
92

Q-6 Assuming no vacant stalls or paddocks, how many horses can be stabled at your operation?
NUMBER OF HORSES
HORSES IN ST ALLS
HORSES IN PADIXX:KS OR CORRALS
HORSES IN PASTURE
TOTAL CAP AOTY OF OPERATION
Q-7 How many horses were actually stabled at your operation in 1988? Please include horses you owned, as well as horses you boarded for others in your answer to this question.
____ HORSES
Q-8 How many of the horses reported in question Q-7 are Thoroughbreds? Please fill in the number of Thoroughbreds by category.
NUMBER OF THOROUGHBREDS
STALLIONS AT STUD
BROODMARES
RACING STOCK (18 months of age or older.)
YOUNG STOCK ( Less than 18 months old.)
OTHER
Q-9 Did you stable any horses on your property in 1988 that were not Thoroughbreds? (Circle the correct answer)
1.YES--_....i-------------------------,
Q-9 a. Please specify breed and main use of non-Thoroughbreds. 2. NO
MAIN USEBREED
Q-10 How many of the horses reported in Q-7 were boarded for other people?
HORSES
93

Q-11 Did all of the horses you boarded for others in 1988 remain on your property for the entire year?
Q-11 a. On average, how many months did the boarders remain on your property in 1988?
1. YES
2. NO AVERAGE MONTHSAVERAGE MONTHS ON PROPERTY IN 1988ON PROPERTY IN 1988
LAYUPSBROODMARES
OTHER __ HORSES IN TRAINING
__ HORSES RECEIVING GENERAL CARE
Q-12 Were all the horses you owned in 1988 stabled on your property for the entire year?
1. YES Q-12 a. Where were the horses kept that were not stabled 2. NO --i.,.._ on your property for the entire year?
1. IN TRAINING AT ANOTHER FACILITY
2. AT A RACETRACK·
3. BOARDED OUT FOR BREEDING
4. OTHER
Q-13 If you owned any horses in 1988 thafwere in training at another facility, how many months did you board them away from your property?
MONTHS
Q-14 If you owned any mares that you sent out for breeding in 1988, how many months· were they stabled away from your property?
MONTHS
Q-15 What is your best estimate, by category, of the following values: 1) the MOST expensive Thoroughbred horse on your operation in 1988, 2) the LEAST expensive Thoroughbredhorse on your operation in 1988, and 3) the AVERAGE VALUE of all Thoroughbred horses on your operation in 1988?
MOST LEAST AVERAGE EXPENSIVE VALUE OF ALL
THOROUGHBRED EXPENSIVE
THOROUGHBREDSTHOROUGHBRED
$
$
$
$
$
$
STALLIONS AT STUD
BROODMARES
$ $ $ RACING STOCK
$ $ $ YOUNG STOCK
94
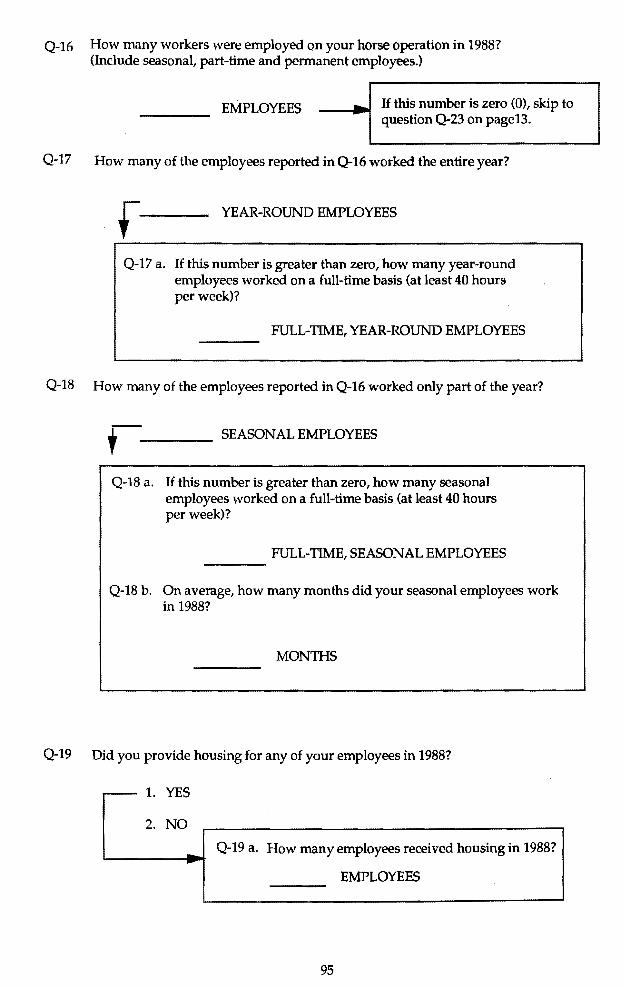
Q-16 How many workers were employed on your horse operation in 1988? (Include seasonal, part-time and permanent employees.)
----. If this number is zero (0), skip to EMPLOYEES question Q-23 on page13.
Q-17 How many of the employees reported in Q-16 worked the entire year?
r YEAR-ROUND EMPLOYEES
Q-17 a. If this number is greater than zero, how many year-round employees worked on a full-time basis (at least 40 hours per week)?
FULL-TIME, YEAR-ROUND EMPLOYEES
Q-18 How many of the employees reported in Q-16 worked only part of the year? ,-__ SEASONAL EMPLOYEES
Q-18 a. H this number is greater than zero, how many seasonal employees worked on a full-time basis (at least 40 hours per week)?
FULL-TIME, SEASONAL EMPLOYEES
Q-18 b. On average, how many months did your seasonal employees work in 1988?
MONTHS
Q-19 Did you provide housing for any of your employees in 1988?
.-- 1. YES
2. NO
- Q-19 a. How many employees received housing in 1988?-EMPLOYEES
95

--
Q-20 Please fill in the number of employees that worked on your operation in 1988 and their average wage or salary beside the most appropriate job title. Please indicate whether you are reporting the compensation on an hourly, weekly, monthly or yearly basis ..
NBMBEROF EMPLOYEES
, TOTAL EMPLOYEES
J'
AVERAGE WAGE OR SALARY
JOB TITLE
MANAGERS
TRAINERS
BREEDING SPECIALISTS
EXERCISE RIDERS
GENERAL STABLE HANDS
OFFICE STAFF
OTHER EMPLOYEES
Q-20 a. If the number of OTHER EMPLOYEES is greater than zero, please do the following: n specify a more appropriate job title, 2) indicate how many employees are in each new category, 3) indicate the average wage or salary of the employees in each new category.
JOB TITLEI I NUMBER OF EMPLOYEES
AVERAGE WAGE OR SALARY
Q-21 What was your total wage bill (including taxes and benefits) in 1988?
TOTAL WAGE BILL FOR 1988
Q-22 What percent of the total wage bill went to workman's compensation?
PERCENT
96

Q-23 What were the total gross expenses associated with operating and maintaining your horse operation in 1988?
DOLLARS
Q-24 Roughly what percent of the total expenses reported in Q-23 were spent in each of the following catetories?
PERCENT I LABOR
STUD FEES AND PURCHASE OF HORSES
TRANSPORTATION AND BOARD FOR HORSES
VETERINARY SERVICES, SHOEING AND MEDICAL SUPPLIES
TACK, FEED AND BEDDING
REPAIRS AND MAINTENANCE FOR HORSE OPERATION
INSURANCE, INTEREST, ADVERTISING AND LEGAL FEES
TAXES
TOTAL= 100%
Q-24 a. If the OTHER category is greater than 5.0%, please specify the additional major horse related expenditures in the following spaces:
Approximately what percent of the total annual expenses reported in question Q-23 was spent outside of California? (For example, out of state stud fees.)
PERCENT OF TOT AL 1988 EXPENSES SPENT OUT OF ST ATE
97

Q-26 What was the total gross income (before taxes) of the horse operation in 1988? Please report only the dollar amount that was generated from horse related activities.
OOLLARS
Q-27 Please estimate the percent of the total gross income from question Q-26 that resulted from the folldW'ing activities:
IPERCENT
STUD FEES AND SALE OF HORSES
PURSES AND INCENTIVE AWARDS PROGRAMS
BOARD AND TRAINING FEES
COMMISSION ON SALE OF HORSES
OTHER HORSE RELATED ACTIVITIES
TOTAL= 100%
Q-27 a. If the "OTHER" category is greater than 5.0%, please specify the other major horse related activities resulting in revenue: ...
Q-28 On average over the past five years, did you make a profit, break even, or lose money conducting horse related activities? (Circle one answer.)
1. MADE A PROFIT
2. BROKE EVEN
3. LOST MONEY
Q-29 Is the horse operation the only source of income for the owner(s) of the operation?
I.YES
N0---1-....-i Q-29 a. What is the owner's principal source of income? 2 ...
98

Is there anything else you would like to tell us about any aspect of your horse operation in particular, or the Thoroughbred industry in general? If so, please use this space and other pieces of paper if necessary.
Thank you very much for your cooperation in filling out and returning this survey.
99

Appendix A-2
Thoroughbred Breeding and Racing Industries An economic impact study bf the University of California, Davis
SURVEY QUESTIONNAIRE FOR TRAINERS OF
THOROUGHBRED RACE HORSES
Please return to: Department of Agricultural Economics University of California, Davis Davis, CA 95616 ATTENTION: Kim Craft
100
INTRODUCTION
This survey is for trainers of Thoroughbred racehorses who stable the majority of their horses at Northern California Race Tracks. Information should be reported by head trainers (or a representative) in regard to stables directly under their care or under the care of an assistant trainer employed by the head trainer. Horses and employees should be counted by the trainer who pays the employees (who care for those horses) and the other training bills normally paid by the head trainer.
For purposes of this survey, "horses in training" will be defined as any Thoroughbred horse which is two years old or older, and which is exercised regularly for the purpose of preparation for racing.
"Other" California racing or training facilities refers to any public or private facility in California where Thoroughbred racehorses are trained.
For purposes of this survey, Northern and Southern California will be defined according to the map on the opposite page.
YOUR ANSWERS TO THESE QUESTIONS ARE ENTIRELY CONFIDENTIAL. Data from this questionnaire will be reported in terms of averages and totals.
101

SECTION 1: Horses in Training and Employment At B~Meadows and Golden Gate Fields
1. NUMBER OF HORSES IN TRAINING. Please estimate the average number of horses you had in training and stabled full time at Bay Meadows and/or Golden Gate Fields (if you had horses at both locations at the same time, add them together) during each quarter of 1989.
Average Number of Horses in Training At Bay Meadows and Golden Gate Fields
Durin_g_ Each Quarter of 1989
Ouarter1 Quarter2 Quarter3 Quarter4 (Jan 1 - Mar 31) (Apr 1 - Jun 30) (Jul 1 - Sep 30) (Oct 1 - Dec 31)
2. FULL-TIME (PAYROLL) EMPLOYEES. Please indicate the average number of people you employed fi.ill 1i.mfl (employees whose primary occupation was working for you) at Bay Meadows and/or Golden Gate Fields during each quarter of 1989, by the most appropriate job title:
Average Number Of Full Time Employees At Bay Meadows and Golden Gate Fields
During Each Quarter of 1989
Quarter1 (Jan 1 • Mar 31)
Quarter2 (Apr 1 ·Jun 30)
Quarter3 (Jul 1 - Sep 30)
Quarter4 (Oct 1 - Dec 31)Job Title
ASSISTANT TRAINER
BARN FOREMAN
EXERCISE RIDER
GROOM
HOTWALKER
OTHER (Please Specify)•
•e.g. office staff, van driver, night watchman, other stable help, etc.
102

3. CONTRACT LABOR. Please indicate how many times per month on average you used self-employed, free-lance, or contract labor at Bay Meadows and/or Golden Gate Fields during each quarter of 1989 (excluding professional services such as Jockey, Veterinarian, or Farrier).
Average Number of Times Used Per Month At Bay Meadows and Golden Gate Fields
During Each Quarter of 1989
Quarter1 (Jan 1 - Mar 31)
Quarter2 (Apr 1 ·Jun 30)
Quarter3 (Jul 1 ·Sep 30)
Quarter4 (Oct 1 - Dec 31) Job Title
EXERCISE RIDER
PONY BOY/GIRL-MORNING
PONY BOY/GIRL--TO POST
HOTWALKER
OnER?{~-----
4. PART TIME EMPLOYEES. If you employed any l2atl 1lm.e. help at Bay Meadows and/or Golden Gate Fields during each quarter of 1989, please specify the number of part time employees along with job title and approximate number of hours worked per week:
Job Title
Average Number of Part Time Employees At Bay Meadows and Golden Gate Fields
Durin_g_ Each Quarter of 1989
Hours per Week
Quarter 1 (Jan 1 - Mar 31)
Quarter2 (Apr 1 - Jun 30)
Quarter 3 (Jul 1 • Sep 30)
Quarter4 (Oct 1 - Dec 31)
103

SECTION 2: Horses in Training and Employment At Facilities Other Than B~Meadows and Golden Gate Fields
1. If you had horses in training at locations in California other than Bay Meadows and Golden Gate Fields during 1989--horses for which you paid the feed ar:ad labor bills--please indicate the name of the racing or training facility, its location, and the average number of horses in training for each quarter.
If you maintained a racing stable on the California fair racing circuit for most of the fair racing season, count the average number of horses in that stable as if they were at one location in quarter 3.
Name and Location of Racjng or Trajnjng Facility
Aver~e Number Of Horses In Trainin_g_, 1989
Quarter1 (Jan 1 - Mar 31)
Quarter2 (Apr 1 - Jun 30)
Quarter3 (Jul 1 - Sep 30)
Quarter4 (Oct 1 - Dec 31)
Fair Racing Cjrcujt xxxx xxxx xxxx 2. FULL-TIME (PAYROLL) EMPLOYEES. Please indicate the average number of people you employed ll.ill 1i..!Il§. (employees whose primary occupation was working for you) in caring for the horses at the facilities specified in question 1 of this section (if more than one facility, add employees at each location together) during each quarter of 1989, by the most appropriate job title:
Job Title
ASSISTANT TRAINER
Avert:'!Q_e Number Of Full Time Em_Qloy_ees, 1989
Quarter1 (Jan 1 - Mar 31)
Quarter2 (Apr 1 - Jun 30)
Quarter3 (Jul 1 - Sep 30)
Quarter4 (Oct 1 - Dec 31)
BARN FOREMAN
EXERCISE AIDER
GROOM
HOTWALKER
OTHER (Please Specify)'"
• e.g. office staff, van driver, night watchman, other stable help, etc.
104
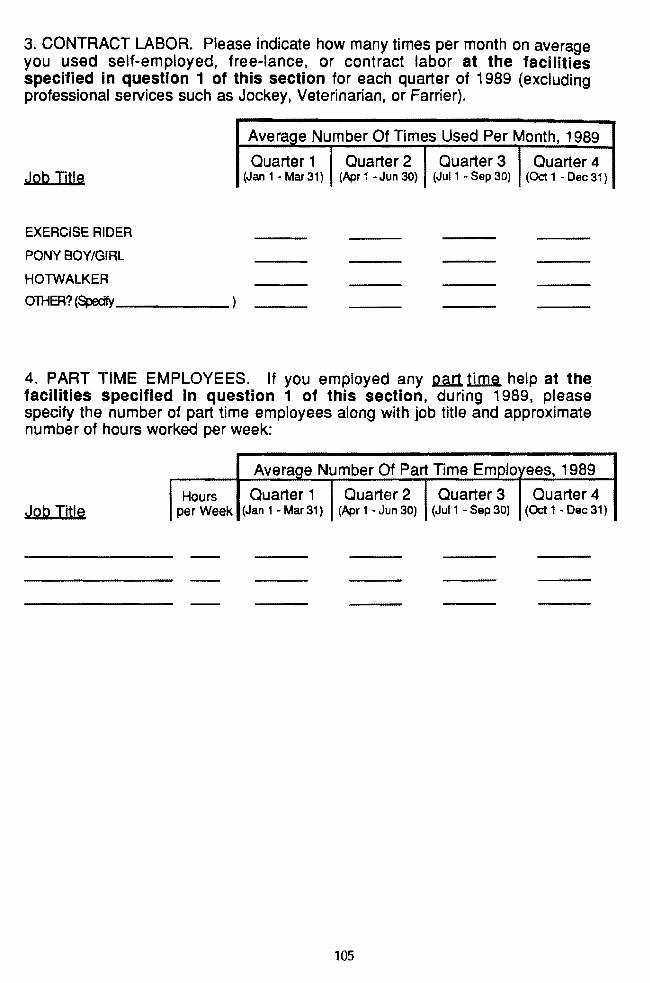
3. CONTRACT LABOR. Please indicate how many times per month on average you used self-employed, free-lance, or contract labor at the facilities specified in question 1 of this section for each quarter of 1989 (excluding professional services such as Jockey, Veterinarian, or Farrier).
Avera_g_e Number Of Times Used Per Month, 1989
Quarter1 Quarter2 Quarter3 Quarter4 (Jan 1 ·Mar 31) (Apr 1 ·Jun 30) (Jul 1 - Sep 30) (Oct 1 ·Dec 31)Job Title
EXERCISE RIDER
PONY BOY/GIRL
HOTWALKER OlHER? (Specify______
4. PART TIME EMPLOYEES. If you employed any J2.fill 1i!!JJ! help at the facilities specified in question 1 of this section, during 1989, please specify the number of part time employees along with job title and approximate number of hours worked per week:
Aver~e Number Of Part Time Em.Q!ovees, 1989
Hours Quarter1 Quarter2 Quarter 3 Quarter4 Job Title per Week (Jan 1 ·Mar 31) (Apr 1 • Jun 30) (Jul 1 - Sep 30) (Oct 1·Dec31)
105
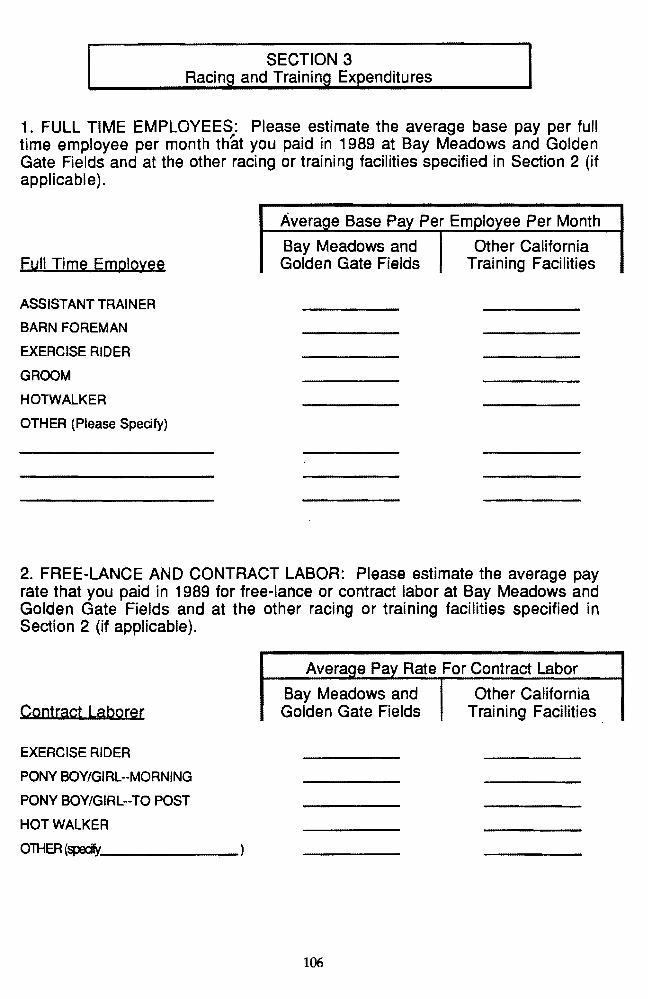
SECTION 3 Racin_g_ and Training Expenditures
1. FULL TIME EMPLOYEES: Please estimate the average base pay per full time employee per month that you paid in 1989 at Bay Meadows and Golden Gate Fields and at the other racing or training facilities specified in Section 2 (if applicable).
Avera e Base Pa
Bay Meadows and Other California Full Time Employee Golden Gate Fields Training Facilities
ASSISTANT TRAINER
BARN FOREMAN
EXERCISE RIDER
GROOM
HOTWALKER
OTHER (Please Specify)
2. FREE-LANCE AND CONTRACT LABOR: Please estimate the average pay rate that you paid in 1989 for free-lance or contract labor at Bay Meadows and Golden Gate Fields and at the other racing or training facilities specified in Section 2 (if applicable).
AverC!S_e P~Rate For Contract Labor
Bay Meadows and Other California Golden Gate Fields Contract Laborer Training Facilities.
EXERCISE RIDER
PONY BOY/GIRL·-MORNING
PONY BOY/GIRL··TO POST
HOT WALKER OTHER(spocify,______
106

3. PAYROLL: Please estimate your total payroll expenditure in 1989 (for employees caring for or working with horses in training at the California locations specified in Sections 1 and 2) and the approximate percentage of that total which went to each of the indicated categories.
TOTAL PAYROLL EXPENDITURE, 1989
ESTIMATED PERCENTAGE OF TOTAL GOING TO THE FOLLOWING:
WORKMEN'S COMPENSATION %
EMPLOYER PAID PAYROLL TAXES %
EMPLOYEE BENEFITS (e.g. health insurance, pension plans) %
BONUSES, COMMISSIONS, OR "ST AKES" %
CONTRACT LABOR %
PART TIME LABOR %
4. If possible, please estimate the total amount of bonuses or "stakes" which your employees received from your owners in 1989.
5. How many of your employees lived full time in track provided housing (tack rooms) or in housing provided by you?
6. EXPENSES: For each of the following expenses, please estimate the total amount paid in 1989 for your entire stable(s) or the average annual cost per horse (whichever is easier) paid by you--or estimate as closely as possible the amount paid by the owners of horses trained by you-for horses you had in training at Bay Meadows and Golden Gate Fields and at the other California racing or training facilities specified in Section 2 (if applicable).
Exgense
FARRIER
VETERINARIAN
EQUINE DENTIST
STALL RENT AL
VANNING
Average Annual Cost Per Horse
Or Total Stable Cost For The Year
Other California Bay Meadows and Training Facilities Golden Gate Fields
107

7. FEED AND BEDDING COSTS PER HORSE: Please estimate your average cost per horse per month for feed and bedding at Bay Meadows and Golden Gate Fields and at the other California racing or training facilities specified in Section 2 (if applicable). If it is easier, just give the total feed and bedding cost per horse and indicate the approximate percentage of the total going to each category.
Avera_ge Cost Per Horse Per Month
Bay Meadows and Other California Golden Gate Fields Training Facilities Expense
FEED
ALFALFA HAY
OTHER HAYS
GRAINS
FEED SUPPLEMENTS
BEDDING
STRAW
WOOD SHAVINGS
OTHER
TOTAL FEED AND BEDDING COSTS Per Horse Per Month
8. STABLE OVERHEAD: Please estimate the total annual stable overhead expenses for your California racing and/or training stables. If it is easier, just give the total stable overhead expense for the year and indicate the approximate percentage of the total going to each category.
Annual Stable Overhead Expenses
TACK &STABLE EQUIPMENT (INCLUDING REPAIRS)
VET SUPPLIES SUCH AS LINIMENTS, BANDAGES, ETC.
FEED SUPPLEMENT$
EQUIPMENT RENTAL (E.G. HOTWALKERS, ICE MACHINES, ETC.)
BARN OFFICE, TELEPHONE
OTHER STABLE OVERHEAD EXPENSES
TOTAL STABLE OVERHEAD EXPENSES
108

9. BUSINESS OVERHEAD: Please estimate your annual race horse training business overhead expenses for 1989 by category. If it is easier, just give the total business overhead expense for the year and indicate the approximate percentage of the total going to each category.
ANNUAL BUSINESS OVERHEAD EXPENSES
BUSINESS INSURANCE (OTHER THAN WORKMEN'S COMP.)
INTEREST ON BUSINESS LOANS
LICENSE FEES
TELEPHONE FOR BUSINESS USE
BUSINESS RELATED TRAVEL, LODGING
BUSINESS RELATED ENTERTAINMENT
BOX SEATS AT TRACK, PROGRAMS, RACING FORMS, ETC.
OFFICE EXPENSES
BOOKKEEPING, ACCOUNTING, OR TAX PREPARATION
OTHER
TOTAL BUSINESS OVERHEAD EXPENSES
10. Approximately what percentage of your total business overhead expenses were spent out of state?
11. What were your daily training rates in 1989?
Dai!t Trainin_g_ Rates
Bay Meadows and Other California Golden Gate Fields Training Facilities
12. What percent of your total yearly income was generated by your race horse training business in 1989?
109

SECTION 4 Investment I
1 . Please estimate the market value of all Thoroughbred race horses which you had in training on December 31, 1989 by indicating your best estimate of the number of horses you had in 'each value category
Number Of Horses
On
Estimated Market Value December 31, 1989
LESS THAN $5,000
$5,000 - 9,900
$10,000 - 14,900
$15,000 - 24,900
$25,000 - 49,900
$50,000 - 99,900
$100,000 - 199,900
$200,000 - 499,900
$500,000 - 999,900
GREATER THAN $1,000,000
2. Please estimate the number and market value of the pony horses you owned and used primarily for your race horse training business in 1989:
INUMBER OF HORSES I I AVERAGE VALUE
PONY HORSES
3. Estimate the value of your investment in depreciable assets and equipment which is used by you primarily for the racing or training of Thoroughbred race horses:
1. TACK & STABLE EQUIPMENT
2. VANNING EQUIPMENT
3. OTHER (Please Specify)
110

Is there anything else you would like to tell us about your training operation in particular, or the Thoroughbred industry in general? If so, please use this space and the back cover if necessary.
Thank you very much for your cooperation in filling out and returning this survey.
111

Appendix A-3
Thoroughbred Breeding and Racing Industries An economic impact study by the University of California, Davis
SURVEY QUESTIONNAIRE FOR TRAINERS OF
THOROUGHBRED RACEHORSES
Please return to: Department of Agricultural Economics University of California, Davis Davis, CA 95616 ATIENTION: Kim Craft
112

This survey is for trainers of Thoroughbred racehorses who stable the majority of their horses at Southern California Race Tracks. Information should be reported by head trainers (or a representative) in regard to stables directly under their care or under the care of an assistant trainer employed by the head trainer. Horses and employees should be counted by the trainer who pays the employees (who care for those horses) and the other training bills normally paid by the head trainer.
For purposes of this survey, "horses in training" will be defined as any Thoroughbred horse which is two years old or older, and which is exercised regularly for the purpose of preparation for racing.
"Southern California Race Tracks" refers to Santa Anita, Hollywood Park, Del Mar, and Pomona, whether or not the meet is running.
"Other" California racing or training facilities refers to any public or private facility in California where Thoroughbred race horses are trained.
For purposes of this survey, Northern and Southern California will be defined according to the map on the opposite page.
YOUR ANSWERS TO THESE QUESTIONS ARE ENTIRELY CONFIDENTIAL. Data from this questionnaire will be reported in terms of averages and totals.
113

SECTION 1: Horses in Training and Employment At Southern California Race Tracks
1. NUMBER OF HORSES IN TRAINING. Please estimate the average number of horses you had in training and stabled full time at Southern California race tracks and the corresponding off tracks during each Southern California Ra~e meeting of 1989.
Average Number of Horses in Training Durin_g_ Each 1989 Race Meetin_g
Santa Anita
(12126 - 4124)
Hollywood Park, Summer
(4/26 - 7124) Del Mar
(7/26. 9/13)
Oak Tree & H.P., Fall (10/4 - 12124) Where Stabled
ON TRACK DURING THE MEET
THE OFF TRACK DURING THE MEET
2. FULL-TIME (PAYROLL) EMPLOYEES. Please indicate the average number of people you employed f.u.U :tirJJ..e. (employees whose primary occupation was working for you) at Southern California race tracks and the corresponding off tracks (add together employees at both locations) during each race meeting of 1989, by the most ap'propriate job title:
Average Number Of Full Time Employees At The Track And The Off Track
Durin_g_ Each 1989 Race Meetin_g_
Santa Anita
(12126 - 4124)
Hollywood Park. Summer
(4/26 - 7124) Del Mar
(7126 - 9/13)
Oak Tree & H.P., Fall (10/4. 12124)Job Title
ASSIST ANT TRAINER
BARN FOREMAN
EXERCISE RIDER
GROOM
HOTWALKER
OTHER (Please Specify)•
.. e.g. office staff, van driver, night watchman, other stable help, etc.
114

3. CONTRACT LABOR. Please indicate how many times per month on average you used self-employed, free-lance, or contract labor at Southern California race tracks and the corresponding off tracks (add together employees at both locations) during each race meeting of 1989 (excluding professional services such as Jockey, Veterinarian, or Farrier).
Average Number of Times Used Per Month At The Track And The Off Track Duri'!9_ Each 1989 Race Meetin_g_
Santa Anita
(12126 - 4124)
Hollywood Park, Summer
(4126 - 7/24) Del Mar
(7126 - 9/13)
Oak Tree & H.P., Fall (10/4 - 12124)Job Title
EXERCISE RIDER
PONY BOY/GIRL-MORNING
PONY BOY/GIRL--TO POST
HOTWALKER
OTHER?(Spedfy~~~~~
4. PART TIME EMPLOYEES. If you employed any Qarl ti.m.e. help at Southern California race tracks or the corresponding off tracks during 1989, please specify the number of part time employees along with job title and approximate number of hours worked per week:
Job Title
Average Number of Part Time Employees At The Track And The Off Track
Duri'!9_ Each 1989 Race Meetin_g_
Hours per Week
Santa Anita
(12126 - 4124)
Hollywood Park, Summer
(4126 - 7124) Del Mar
(7126 - 9/13)
Oak Tree & H.P., Fall (10/4 - 12124)
115

SECTION 2: Horses in Training and Employment At Facilities Other Than Southern California Race Tracks
IF ALL THE HORSES THAT YOU TRAINED IN 1989 WERE STABLED AT SOUTHERN
CALIFORNIA RACE TRACKS (l.E?. SANTA ANITA, HOLLYWOOD PARK, OR DEL MAR), THIS
SECTION DOES NOT APPLY TO YOU. PLEASE TURN THE PAGE TO SECTION 3.
1. If you had horses in training at locations in California other than Southern California race tracks during 1989--horses for which you paid the feed and labor bills--please indicate the name of the racing or training facility, its location, and the average number of horses in training for each quarter.
Name and Location of Racing or Training Facility
Avera_g_e Number Of Horses In Training, 1989
Quarter1 (Jan 1 - Mar 31)
Quarter2 (Apr 1 - Jun 30)
Quarter3 (Jul 1 - Sep 30)
Quarter4 (Oct 1 - Dec 31)
2. FULL-TIME (PAYROLL) EMPLOYEES. Please indicate the average number of people you employed !ul.!.11.lrut (emplbyees whose primary occupation was working for you) in caring for the horses at the facilities specified in question 1 of this section (if more than one facility, add employees at each location together) during each quarter of 1-989, by the most appropriate job title:
Job Title
ASSISTANT TRAINER
Avera_g_e Number Of Full Time Em_pJoyees, 1989
Quarter1 (Jan 1 - Mar 31 )
Quarter2 (Apr 1 - Jun 30)
Quarter3 (Jul 1 - Sep 30)
Quarter4 (Oct 1 - Dec 31)
BARN FOREMAN
EXERCISE RIDER
GROOM
HOTWALKER
OTHER (Please Specityt
• e.g. office staff, van driver, night watchman, other stable help, etc.
116
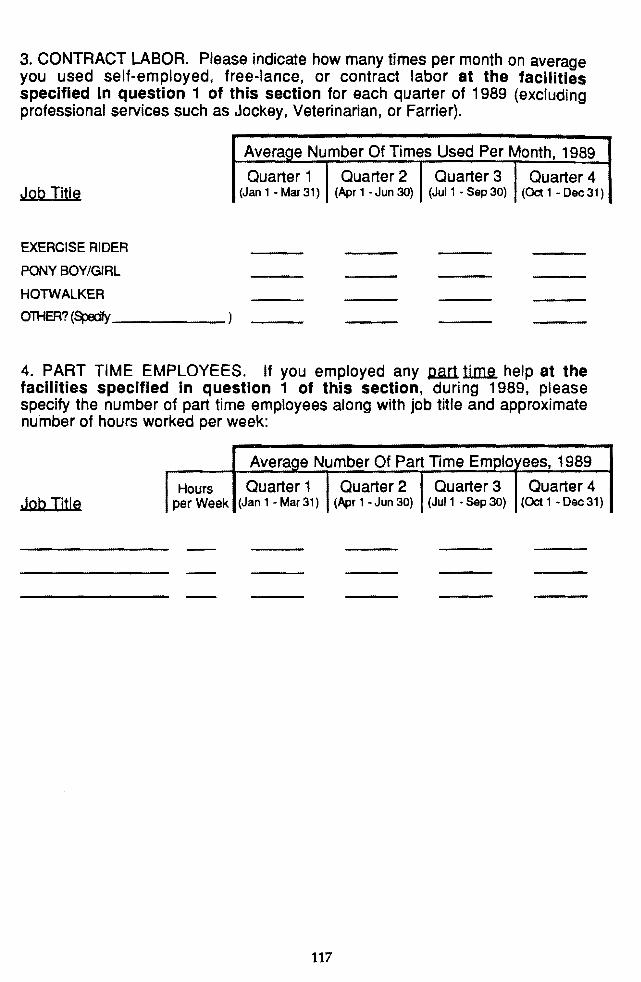
3. CONTRACT LABOR. Please indicate how many times per month on average you used self-employed, free-lance, or contract labor at the facilities specified in question 1 of this section for each quarter of 1989 (excluding professional services such as Jockey, Veterinarian, or Farrier).
Aver<!_g_e Number Of Times Used Per Month, 1989
Quarter1 Quarter2 Quarter3 Quarter4 (Jan 1 - Mar 31) (Apr 1 - Jun 30) (Jul 1 • Sep 30) (Oct 1 - Dec 31) Job Title
EXERCISE RIDER
PONY BOY/GIRL
HOTWALKER OlHER? (Specify______
4. PART TIME EMPLOYEES. If you employed any .c..ar11Ulut help at the facilities specified in question 1 of this section, during 1989, please specify the number of part time employees along with job title and approximate number of hours worked per week:
Aver<!_g_e Number Of Part Time Em_Qlovees, 1989
Hours Quarter 1 Quarter 2 Quarter 3 Quarter 4 Job Title per Week (Jan 1 - Mar 31) (Apr 1 - Jun 30) (Jul 1 ·Sep 30) (Oct 1 - Dec 31)
117

SECTION 3 Racing and Trainin_g_ Expenditures
1. FULL TIME EMPLOYEES: Please estimate the average base pay per full time employee per month, at Southern California race tracks and at the racing or training facilities specified in Section 2 (if applicable).
Full Time Employee Southern California
Race Tracks
ASSIST ANT TRAINER
BARN FOREMAN
EXERCISE RIDER
GROOM
HOTWALKER
OTHER (Please Specify)
2. FREE-LANCE AND CONTRACT LABOR: Please estimate the average pay rate that you pay for free-lance or contract labor at Southern California race tracks and at the racing or training facilities specified in Section 2 (if applicable).
Aver~e P~Rate For Contract Labor
Southern California Other California Contract Laborer Race Tracks Training Facilities
EXERCISE RIDER
PONY BOY/GIRL--MORNING
PONY BOY/GIRL--TO POST
HOT WALKER
OlHER(~------
118

3. PAYROLL: Please estimate your total payroll expenditure in 1989 (for employees caring for or working with horses in training at the California locations specified in Sections 1 and 2) and the approximate percentage of that total which went to each of the indicated categories.
TOTAL PAYROLL EXPENDITURE, 1989
ESTIMATED PERCENTAGE OF TOTAL GOING TO THE FOLLOWING:
WORKMAN'S COMPENSATION
EMPLOYER PAID PAYROLL TAXES
EMPLOYEE BENEFITS (e.g. hearth insurance, pension plans)
BONUSES, COMMISSIONS, OR "STAKES"
CONTRACT LABOR
PART TIME LABOR
4. If possible, please estimate the total amount of bonuses or "stakes" which your employees received from your owners in 1989.
5. How many of your employees lived full time in track provided housing (tack rooms) or in housing provided by you?
6. EXPENSES: For each of the following expenses, please estimate the total amount paid in 1989 for your entire stable(s) or the average annual cost per horse (whichever is easier) paid by you--or estimate as closely as possible the amount paid by the owners of horses trained by you-for horses you had in training at Southern California race tracks and at the other California racing or training facilities specified in Section 2 (if applicable).
Expense
FARRIER
VETERINARIAN
EQUINE DENTIST
STALL RENTAL
VANNING
Average Annual Cost Per Horse
Or Total Stable Cost For The Year
Other California Southern California Training Facilities Race Tracks
119

7. FEED AND BEDDING COSTS PER HORSE: Please estimate your average cost per horse per month for feed and bedding at Southern California race tracks and at the other California racing or training facilities specified in Section 2 (if applicable). If it is easier, just give the total feed and bedding cost per horse and indicate the approximate percentage of the total going to each category.
I
Average Cost Per Horse Per Month
Southern California Other California Race Tracks Training Facilities Expense
FEED
ALFALFA HAY
OTHER HAYS
GRAINS
FEED SUPPLEMENTS
BEDDING
STRAW
WOOD SHAVINGS
OTHER
TOTAL FEED AND BEDDING COSTS Per Horse Per Month
8. STABLE OVERHEAD: Please estimate the total annual stable overhead expenses for your California racing and/or training stables. If it is easier, just give the total stable overhead expense for the year and indicate the approximate percentage of the total going to each category.
Annual Stable Overhead Expenses
TACK & STABLE EQUIPMENT (INCLUDING REPAIRS)
VET SUPPLIES SUCH AS LINIMENTS, BANDAGES, ETC.
FEED SUPPLEMENTS
EQUIPMENT RENTAL (E.G. HOTWALKERS, ICE MACHINES, ETC.)
BARN OFFICE, TELEPHONE
OTHER STABLE OVERHEAD EXPENSES
TOTAL STABLE OVERHEAD EXPENSES
120

9. BUSINESS OVERHEAD: Please estimate your annual race horse training business overhead expenses for 1989 by category. If it is easier, just give the total business overhead expense for the year and indicate the approximate percentage of the total going to each category.
ANNUAL BUSINESS OVERHEAD EXPENSES
BUSINESS INSURANCE (OTHER THAN WORKMEN'S COMP.)
INTEREST ON BUSINESS LOANS
LICENSE FEES
TELEPHONE FOR BUSINESS USE
BUSINESS RELATED TRAVEL, LODGING
BUSINESS RELATED ENTERTAINMENT
BOX SEATS AT TRACK, PROGRAMS, RACING FORMS, ETC.
OFFICE EXPENSES
BOOKKEEPING, ACCOUNTING, OR TAX PREPARATION
OTHER
TOT AL BUSINESS OVERHEAD EXPENSES
10. Approximately what percentage of your total business overhead expenses were spent out of state?
11. What were your daily training rates in 1988?
Dai_!y Traini~ Rates
Other California Training Facilities
Southern California
12. What percent of your total yearly income was generated by your race horse training business in 1989?
121

SECTION 4 Investment
1. Please estimate the market value of all Thoroughbred race horses which you had in training on DecembeJ 31, 1989 by indicating your best estimate of the number of horses you had in each value category .
Number Of Horses
On
Estimated Market Value December 31, 1989
LESS THAN $5,000
$5,000 - 9,900
$10,000 - 14,900
$15,000 - 24,900
$25,000 - 49,900
$50,000 - 99,900
$100,000 - 199,900
$200,000 - 499,900
$500,000 - 999,900
GREATER THAN $1,000,000
2. Please estimate the number and market value of the pony horses you owned and used primarily for your race horse training business in 1989:
INUMBER OF HORSES I I AVERAGE VALUE
3. Estimate the value of your investment in depreciable assets and equipment which is used by you primarily for the racing or training of Thoroughbred race horses:
1. TACK & STABLE EQUIPMENT
2. VANNING EQUIPMENT
3. OTHER (Please Specify)
122

Is there anything else you would like to tell us about your training operation in particular, or the Thoroughbred industry in general? If so, please use this space and the back cover if necessary.
Thank you very much for your cooperation in filling out and returning this survey.
123

Appendix B-1
Clark - WO/COit I'
October 22, 1 990
Mr. Lawrence Shepard Department of Agricultural Economics University of California, Davis Davis, California 95616
SUBJECT: Land Value Estimates for 90/116 The California Horse Industry Study
Dear Mr. Shepard:
In response to your request and authorizatioh, we have completed a study leading to a Limited Appraisal of specified lands needed as input to the above-referenced study. During the study and preparation of the appraisal, a general viewing of lands identified in the attached Executive Summary was conducted and a limited investigation made for relevant market indicators.
Based on the consideration of data obtained during the inspections and investigation, we have estimated a value for the land only as though vacant, based on a Limited Scope Appraisal as of October 15, 1990. A summary of this appraisal, including the scope, methodology and the aggregate total of the estimated values are described in the attached Executive Summary.
The file report of the appraisal transmitted under separate cover includes a description of the scope of the assignment, and the Assumptions and Limiting Conditions that define the appraisal and its results. Your attention is directed specifically to these portions of the report for an understanding of the scope of the appraisal as mutually agreed upon, and the significance of the conclusions and estimates reached.
Respectfully submitted,
CLARK-WOLCOTT COMPANY, INC.
Clark-Wolcott Company. Inc. Real Estat11 Analysts and Consultants
3230 Ramos Circle. Sacramento. California 95821 TEL 916·366·3911 FAX 916·366·3835
124

Clark - WO/COii 1nr::orpora1eo
EXECUTIVE SUMMARY
The assignment is the preparation of a limited scope appraisal estimating the probable
market value of five properties representing components of the California Horse
Industry. The five properties are all currently developed race-horse tracks and related
facilities, identified as:
Bay Meadows, San Mateo Del Mar, Del Mar Golden Gate Fields, Albany Hollywood Park, Inglewood Santa Anita, Arcadia
The appraisal is of the land only in each of these properties, as though vacant and
available for development to their probable use other than as a race track.
The appraisal was requested by the client for consideration and input to a broader
study of the horse industry in California.
The properties are valued as of October 15, 1990. The value estimated is the
probable estimate of market value that would result from a full and complete appraisal
of the properties.
Each of the five properties is located in a decidedly urban environment and within
major metropolitan centers of the north and south state regions. With the exception of
the Del Mar property situated on the coastal plain, the properties are surrounded by a
mix of mature urban land uses varying in density, quality, and stage of useful life.
Real Estate Analysts and Consultants 125

Clark - Wolcott
The size of the properties range from 154 to 334 acres, more or less. In the vacant
state, the properties would represent an extraordinary land parcel in an otherwise near
fully developed urban setting. Consequently, their actual utilization, absent the current
use, would be subject to numerous opposing and conflicting social, economic and
political forces that obscure the actual alternative use that might otherwise emerge.
The limited appraisal of these properties is based on and limited to three distinct
components.
• Determination of the approximate land area occupied by each property and
presumably available for alternative use.
• Estimation of the probable land use absent and ignoring the current use as a
race track. This estimation is based on the properties' location, surrounding land
uses, and the regulatory, political and social influences affecting local land use to ' the extent such influence is currently identifiable.
• An estimate of the probable value under the alternative land use and readily
available and summarized indicators of price levels for comparable land use.
The complete assignment included preparation of a file report and maintenance of a
file in support of the appraisal.
In completing the scope of the limited appraisals, data was gathered from public and
private sources and agencies, and interviews held with some of their representatives.
The data gathered included zoning ordinances, general and specific land use plans,
indication of attitude toward land use, and indicators of price levels for land suitable
for the various uses to which the property, if vacant, might be put.
Real Estate Analysts and Consultants 126

Clark - WO/COii
In estimating the probable value of the respective properties, the appraisal considered:
• The size and other physical characteristics of each property.
• Land use and the type and quality of development surrounding the property.
• Alternative land uses for each property based on current zoning ordinances,
existing and pending general and specific plans, local attitude toward specific
forms of alternative use, and adjacent development and development trends.
• Market indicators of value for the most probable alternative uses.
Based on our consideration and analysis of these data and factors, we have
concluded, as of October 15, 1990, that the most probable estimate of market value
that would result from a full and complete appraisal of each property would amount
to, in the aggregate, a total of:
EIGHT HUNDRED TEN MILLION ($810,000,000) DOLLARS
Further details of the appraisal are included in the file copy of the report of the
appraisal. Attention is called to this report for a fuller understanding of the scope of
the appraisal and the Assumptions and Limiting Conditions under which it was
prepared and to which the estimate of value is subject.
CLARK-WOLCOTT COMPANY, INC.
B~~------. /u-2.?-~o~C:Wo1cott,MA
Date
Assisted By:
REAL ESTATE ANALYSTS OF SAN FRANCISCO
By: 1!J.~ (/ ~ Date /• - n-i" Mary . ella
Real Estate Analysts and Consultants 127

Clark - Wolcott
SPECIAL ASSUMPTIONS AND LIMITING CONDITIONS
• No examination of title was made by this Company or any of its staff, nor was any repmt of title made available to the Company or any of its staff for review in the preparation of this appraisal. (See Assumptions and Limiting Conditions, Item 1).
• Location, size, and configuration of the properties is based on public information available from the offices of the respective county jurisdiction. Clark*Wolcott Company, Inc .• and the appraiser make no representation relative to the accuracy of such information beyond it being available to the public in general.
• The area of each site described and employed for valuation purposes is only that area that is likely to be available for alternative use regardless of the ownership or total size of the property. An example of this condition is the Del Mar Race Track that is part of a larger, public*owned property.
• The "probable use" described for each property is based on published local regulations, land use studies, opinions expressed by representatives of the local jurisdiction and the appraiser's perception of the property's location and environment. The use described is not represented to be "highest and best use," nor the use to which the land may eventually be put, but is an estimation of the market's probable perception given the same information as considered by the appraiser.
• The estimates of "probable value11 are based on indicators obtained from public and private sources who are familiar with the local market areas of the respective properties. The information is assumed valid and accurately reported, but has not been separately investigated by the appraiser, the Company, or any of its staff members.
• The estimates of value are for described land area only as though vacant without race track or structural improvements.
6
Real Estate Analysts and Consultants 128

Appendix C-1
F!g_ure 2·41.Al F!g_ure 2·41.Bl Figure 2·5J.Al Fjgure 2-5JBJ
Number of FoalsNumber of FoalsNumber of Days, Number of Days, Major Races Fair Races
Year Kentucky cantornia FloridaYear North South Year North South Year United States
1965 3,536 2,903 1,1171953 125 141 1953 67 14 1965 18,659 1966 3,640 3,092 1,2841954 129 141 1954 67 14 1966 19,881 1967 3,723 3,229 1,4221955 134 146 1967 21,3191955 66 14 1968 3,825 3,480 1,6551956 139 150 1956 70 14 1968 22,911 1969 3,868 3,980 1,6671957 119 151 1957 70 14 1969 24,428 1970 3,889 3,967 1,9041958 140 152 1958 72 14 1970 25,147 1971 3,526 3,771 1,9391959 139 152 1971 24,3041959 73 14 1972 3,837 3,949 2,2281960 139 152 1960 73 14 1972 25,793 1973 3,955 3,917 2,4301961 134 152 1973 26,9351961 74 14 1974 4,306 3,768 2,4851962 141 152 1962 74 14 1974 27,473 1975 4,252 3,696 2,5511963 139 152 1963 74 14 1975 27,649 1976 4,287 3,863 2,5471964 143 152 1976 28,2901964 95 14 1977 4,710 3,881 2,6421965 144 152 1965 95 14 1977 30,006 1978 5,037 3,856 2,6951966 144 152 1966 96 14 1978 31,466 1979 5,227 3,876 2,8571967 144 172 1967 83 14 1979 33,862 1980 5,885 4,117 3,2021968 163 189 1980 35,6131968 87 14 1981 6,541 4,357 3,816. 1969 158 212 1969 88 14 1981 38,629 1982 7,521 4,867 4,2371970 162 186 1982 42,8291970 88 14 1983 8,943 5,597 4,443 1983 47,2281971 165 213 1971 88 14 1984 9,110 5,832 4,6721972 165 213 1972 89 14 1984 49,228 1985 8,889 6,060 4,9571973 168 212 1973 89 14 1985 50,399 1986 8,957 5,960 4,9991974 168 216 1974 91 14 1986 51,102 1987 8,746 5,810 4,8281975 169 217 1975 93 14 1987 50,912 1988 8,363 5,620 4,5481976 141 222 1988 48,9501976 81 14
1977 171 221 1977 94 26 1978 177 223 1978 94 28 1979 168 222 1979 94 28 1980 176 222 1980 109 52 1981 192 258 1981 97 36 1982 202 260 1982 95 31 1983 193 262 1983 98 31 1984 208 265 1984 97 31 1985 202 260 1985 99 31 1986 202 263 1986 100 31 1987 202 263 1987100 32 1988 222 263 1988100 35 1989 213 263 1989 100 35
129

I'
Figure 2·6 (A) Figure 2-6 (B),...o;-----"""------------------------,
Total Purse Paid/Nominal Dollars Total Purse Paid/Real Dollars
Year NORTH SOUTH Year NORTH SOUTH
1953 $3,060,325 $6,695,200 1953 1954 $3,050,250 $7,450,300 1954 1955 $3,416,500 $7,361,400 1955 1956 $3,275,700 $7,953,650 1956 1957 $2,983,144 $8,185,900 1957 1958 $3,283,350 $8,238,350 1958 1959 $3,152,000 $8,603,600 1959 1960 $3,154,150 $8,088,600 1960 1961 $3,172,064 $8,525,555 1961 1962 $3,286,600 $8,658,931 1962 1963 $3,343,749 $9,424,037 1963 1964 $3,691,250 $10,481,625 1964 1965 $3,886,073 $10,545,107 1965 1966 $3,884,189 $3,809,489 $10,846,740 $10,124,600 1966 1967 $4,825,105 $4,743,125 $11,766,190 $11,070,400 1967 1968 $6,076,220 $5,970,570 $13,907,287 $13,110,107 1968 1969 $7,241,388 $7,127,263 $15,899,549 $15,075,004 1969 1970 $7,351,620 $7,279,520 $14,697,089 $13,949,219 1970 1971 $7,271,949 $7,184,449 $19,187,822 $18,366,237 1971 1972 $7,938,090 $7,815,715 $20,925,706 $19,860,906 1972 1973 $8,542,809 $8,414,907 $21,909,077 $21,044,282 1973 1974 $8,786,632 $8,655,032 $23,576,161 $22,420,721 1974 1975 $9,756,630 $9,611,730 $25,754,325 $24,790,595 1975 1976 $8,846,661 $8,671,046 $28,344,610 $27,331,650 1976 1977 $10,878,350 $10,682,750 $30,371,926 $29,172,191 1977 1978 $12,806,649 $12,541,849 $35,185,635 $34,069,020 1978 1979 $12,161,014 $11,955,964 $37,543,454 $36,154,044 1979 1980 $14,974,572 $14,734,972 $43,431,373 $41,976,413 1980 1981 $18,938,456 $18,643,506 $61,521,047 $59,019,194 1981 1982 $21,548,251 $21,152,851 $63,006,105 $60,187,823 1982 1983 $20,838,106 $20,484,184 $62,589,544 $60,312,870 1983 1984 $23,068,114 $22,325,686 $78,252,785 $64,134,974 1984 1985 $23,417,999 $22,625,356 $71,176,167 $66,234,068 1985 1986 $26,334,398 $25,275,446 $80,024,697 $64,448,725 1986 1987 $26,268,706 $25,227,111 $82,098,200 $68,556,529 1987 1988 $28,939,237 $27,525,347 $83,692,043 $78,499,391 1988
$11,861,725 $11,822,674 $13,293,774 $12,502,672 $11,007,911 $11,684,520 $11,020,979 $10,801,884 $10,752,759 $10,991,973 $10,999,174 $11,907,258 $12,336,740 $12,062,699 $14,621,530 $17,663,430 $20,059,247 $19,397,414
$25,950 ,388 $28,877,132 $28,643,580 $30,357,443 $30,206,273 $29,317,972 $30,082,517 $27,700,685 $28,900,186 $28,959,635 $31,000,122 $33,811,694 $33,476,530
$11,830,711 $33,685,528 $31,442,857 $14,373,106 $35,655,121 $33,546,667 $17,356,308 $40,428,160 $38,110,776 $19,743,111 $44,043,072 $41,759,014 $19,207,177 $38,778,599 $36,805,327
$18,503,687 $18,281,041 $48,823,975 $46,733,427 $19,551,946 $19,250,530 $51,541,148 $48,918,488 $19,866,998 $19,569,551 $50,951,342 $48,940,191 $18,537,198 $18,259,561 $49,738,736 $47,301,099 $18,655,124 $18,378,069 $49,243,451 $47,400,755 $15,911,261 $15,595,406 $50,979,514 $49,157,644 $18,282,941 $17,954,202 $51,045,254 $49,028,892 $19,886,101 $19,474,921 $54,636,079 $52,902,205 $17,056,121 $16,768,533 $52,655,616 $50,706,934 $18,173,024 $17,882,248 $52,707,977 $50,942,249 $20,720,411 $20,397,709 $67,309,679 $64,572,422 $22,146,198 $21,739,826 $64,754,476 $61,857,989 $21,069,875 $20,712,016 $63,285,687 $60,983,691 $22,223,617 $21,508,368 $75,388,039 $61,787,066 $21,563,535 $20,833,661 $65,539,749 $60,989,013 $23,512,855 $22,567,363 $71,450,622 $57,543,504 $22,528,907 $21,635,601 $70,410,120 $58,796,337 $23,740,145 $22,580,268 $68,656,311 $64,396,547
130

Figure 2·7 (A)
Average Purse Per A-ace/Nominal Dollars
Vear North South
1953 $2,874 $5,888 1954 2,875 6,553 1955 3,103 6,244 1956 2,863 6,568 1957 3,035 6,211 1958 2,850 6,692 1959 2,748 7,012 1960 2,691 6,560 1961 2,630 6,777 1962 2,590 6,840 1963 2,671 6,986 1964 2,868 7,662 1965 2,996 7,708 1966 3,009 7,929 1967 3,723 7,596 1968 4,142 8,176 1969 5,092 8,333 1970 5,042 8,780 1971 4,897 10,009 1972 5,346 10,904 1973 5,650 11,483 1974 5,811 12,128 1975 6,415 13,187 1976 6,971 14,186 1977 7,068 15,270 1978 8,039 17,531 1979 8,043 18,791 1980 9,424 21,737 1981 10,960 26,495 1982 11,781 27,240 1983 11,648 26,443 1984 11,922 32,769 1985 12,096 30,262 1986 15,065 33,624 1987 14,062 34,758 1988 13,987 35,298
Figure 2-7 (B)
Average Purse Per Race/Real Dollars
Vear North South
1953 $11,138 $22,824 1954 11,143 25,398 1955 12,074 24,295 1956 10,929 25,068 1957 11,198 22,918 1958 10,143 23,816 1959 9,609 24,517 1960 9,217 22,466 1961 8,916 22,973 1962 8,662 22,875 1963 8,785 22,980 1964 9,252 24,716 1965 9,512 24,471 1966 9,344 24,624 1967 11,282 23,018 1968 12,041 23,767 1969 14,106 23,083 1970 13,304 23,165 1971 12,460 25,469 1972 13,166 26,858 1973 13,140 26,704 1974 12,260 25,586 1975 12,265 25,214 1976 12,538 25,515 1977 11,880 25,664 1978 12,483 27,223 1979 11,281 26,354 1980 11,437 26,380 1981 11,991 28,988 1982 12,108 27,996 1983 11,777 26,737 1984 11,485 31,570 1985 11,138 27,866 1986 13,451 30,021 1987 12,060 29,810 1988 11,474 28,957
131

,Figure 2·8
Total Incentive Award
Year Nominal$ Real$
1970 $678,954 $1,791,435 1971 $1,439,624 $3,663,165 1972 $1,480,000 $3,645,320 1973 $1,464,631 $3,406,119 1974 $1,772,193 $3,738,804 1975 $1,895,297 $3,623,895 1976 $1,962,219 $3,529,171 1977 $2,040,604 $3,429,587 1978 $2,851,228 $4,427,373 1979 $3,283,129 $4,604,669 1980 $3,836,624 $4,656,097 1981 $5,618,442 $6,147,092 1982 $6,607,425 $6,790,776 1983 $6,827,113 $6,903,047 1984 $7,945,304 $7,654,435 1985 $8,333,462 $7,673,538 1986 $8,070,186 $7,205,523 1987 $8,570,500 $7,350,343 1988 $11,090,581 $9,098,098 1989 $11,233,043 $8,762,124
F~ure 2·9
Sales of Horses In California
Year Public Auction Claiming Races
1983 $41,930,750 $20,557,300 1984 $28,801,587 $22,981,375 1985 $20,953,900 $26,226,810 1986 $14,164,650 $28,224,750 1987 $22,786,900 $28,235,000 1988 $18,489,700 $35,322,500 1989 $27,906,950 $33,245,750
132

Appendix C-2
Figure 3-3 Figure 3-4 Total Parl-Mutuel Revenue Retained AttendanceBy Track Operators
Year Total O~TrackYear Nominal Real
1953 4,590,175 4,590,1751965 $20,297,085 $64,435,189 1954 4,600,355 4,600,3551966 $21,108,124 $65,553,182 1955 4,601,853 4,601,8531967 $19,965,622 $60,501,884 1956 4,908,009 4,908,0091968 $22,099,057 $64,241,443 1957 4,857,426 4,857,4261969 $24,969,251 $69,166,900 1958 4,961,616 4,961,6161970 $24,001,757 $63,329'175 1959 5,002,863 5,002,8631971 $31,180,194 $79,338,915 1960 4,720,666 4,720,6661972 $33,853,323 $83,382,569 1961 4,950,675 4,950,6751973 $36,111,732 $83,980,772 1962 4,863,821 4,863,8211974 $38,142,382 $80,469,160 1963 5,038,860 5,038,8601975 $42,362,374 $80,998,803 1964 5,138,285 5,138,2851976 $44,333,731 $79,736,926 1965 5,368,831 5,368,8311977 $49,202,437 $82,693,171 1966 5,309,313 5,309,3131978 $57,775,150 $89,712,966 1967 5,275,554 5,275,5541979 $59,978,527 $84,121,356 1968 6,018,214 6,018,2141980 $69,592,884 $84,457,383 1969 6,039,533 6,039,5331981 $87,448,428 $95,676,617 1970 5,641,540 5,641,5401982 $90,033,936 $92,532,308 1971 6,414,560 6,414,5601983 $92,219,523 $93,245,220 1972 6,179,678 6,179,6781984 $100,869,188 $97,176,482 1973 6,412,333 6,412,3331985 $103,767,927 $95,550,577 1974 6,470,857 6,470,8571986 $103,416,034 $92,335,745 1975 7,100,362 7,100,3621987 $107,174,762 $91,916,605 1976 6,852,345 6,852,3451988 $117,383,435 $96,294,861 1977 7,023,906 7,023,9061989 $120,336,087 $93,865,902 1978 6,820,014 6,820,014 1979 6,772,620 6,772,620 1980 7,708,803 7,708,803 1981 8,568,721 8,568,721 1982 8,958,000 8,958,000 1983 9,119,231 9,119,231 1984 9,225,864 9,225,864 1985 9,091,658 8,884,658 1986 8,735,403 7,828,041 1987 9,006,240 7,794,842 1988 10,579,418 7,152,321 1989 10,640,107 6,806,224
133
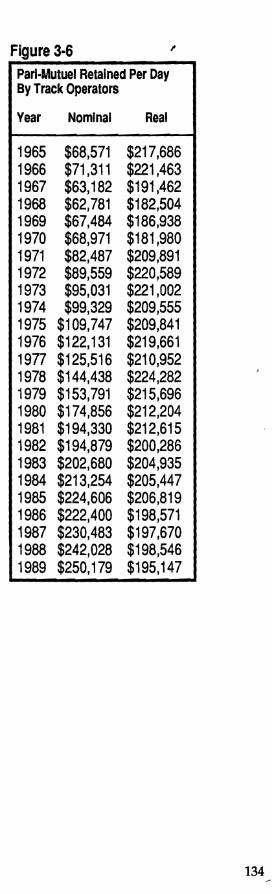
,Figure 3-6 Parl-Mutuel Retained Per Day By Track Operators
Year Nominal Real
1965 $68,571 1966 $71,311 1967 $63,182 1968 $62,781 1969 $67,484 1970 $68,971 1971 $82,487 1972 $89,559 1973 $95,031 1974 $99,329 1975 $109,747 1976 $122,131 19n $125,516 1978 $144,438 1979 $153,791 1980 $174,856 1981 $194,330 1982 $194,879 1983 $202,680 1984 $213,254 1985 $224,606 1986 $222,400 1987 $230,483 1988 $242,028 1989 $250,179
$217,686 $221,463 $191,462 $182,504 $186,938 $181,980 $209,891 $220,589 $221,002 $209,555 $209,841 $219,661 $210,952 $224,282 $215,696 $212,204 $212,615 $200,286 $204,935 $205,447 $206,819 $198,571 $197,670 $198,546 $195,147
134

Appendix C-3
Figure 4-1 Figure4-2
Total Handle On-Track Handle
Year Nominal Real Year Nominal Real
1953 $336,052,510 $1,302,529,109 1953 $336,052,510 $1,302,529,109 1954 $326,842,150 $1,266,830,039 1954 $326,842, 150 $1,266,830,039 1955 $334,343,864 $1,300,948,887 1955 $334,343,864 $1,300,948,887 1956 $360,341,915 $1,375,350,821 1956 $360,341,915 $1,375,350,821 1957 $359,210,064 $1,325,498,391 1957 $359,210,064 $1,325,498,391 1958 $371,058,022 $1,320,491,181 1958 $371,058,022 $1,320,491,181 1959 $382,418,538 $1,337,127,755 1959 $382,418,538 $1,337,127,755 1960 $368,796,798 $1,263,002,733 1960 $368,796,798 $1,263,002,733 1961 $387,658,415 $1,314,096,322 1961 $387,658,415 $1,314,096,322 1962 $395,538,155 $1,322,870,084 1962 $395,538,155 $1,322,870,084 1963 $430,066,n2 $1,414,693,329 1963 $430,066,n2 $1,414,693,329 1964 $451,827,624 $1,457,508,465 1964 $451,827,624 $1,457,508,465 1965 $475,366,000 $1,509,098,413 1965 $475,366,000 $1,509,098,413 1966 $481,636,241 $1,495,764,724 1966 $481,636,241 $1,495,764,724 1967 $491,991,737 $1,490,884,052 1967 $491,991,737 $1,490,884,052 1968 $579,483,305 $1,684,544,491 1968 $579,483,305 $1,684,544,491 1969 $633,858,286 $1,755,840,127 1969 $633,858,286 $1,755,840,127 1970 $592,160,726 $1,562,429,356 1970 $592,160'726 $1,562,429,356 1971 $669,130,255 $1,702,621,514 1971 $669,130,255 $1,702,621,514 1972 $684,822,000 $1,686,753,695 1972 $684,822,000 $1,686,753,695 1973 $730,857,666 $1,699,668,991 1973 $730,857,666 $1,699,668,991 1974 $776,395,505 $1,637,965,200 1974 $776,395,505 $1,637,965,200 1975 $868,967,000 $1,661,504,780 1975 $868,967,000 $1,661,504,780 1976 $913,630,175 $1,643,219,739 1976 $913,630,175 $1,643,219,739 19n $1,020,302,081 $1,714,793,413 1977 $1,020,302,081 $1,714,793,413 1978 $1,058,411,082 $1,643,495,469 1978 $1,058,411,082 $1,643,495,469 1979 $1,102,996,780 $1,546,980,056 1979 $1,102,996,780 $1,546,980,056 1980 $1,288,006,239 $1,563,114,368 1980 $1,288,006,239 $1,563,114,368 1981 $1,498,472,727 $1,639,466,879 1981 $1,498,472,727 $1,639,466,879 1982 $1,547,222,583 $1,590,156,817 1982 $1,547,222,583 $1,590,156,817 1983 $1,584,101,983 $1,601,720,913 1983 $1,584, 101,983 $1,601,720,913 1984 $1,722,738,246 $1,659,670,757 1984 $1,722,738,246 $1,659,670,757 1985 $1,776,034,213 $1,635,390,620 1985 $1,739,152,520 $1,601,429,576 1986 $1,780,309,693 $1,589,562,226 1986 $1,613,557,203 $1,440,676,074 1987 $1,866,661,228 $1,600,910,144 1987 $1,644,933,655 $1,410,749,275 1988 $2,229,796,480 $1,829,201,378 1988 $1,568,996,968 $1,287,118,103 1989 $2,311,451,580 $1,803,004,353 1989 $1,549,466,117 $1,208,631,917
135

I'
Figure 4-3
Attendance
Year Total On·Track
1953 4,590,175 4,590,175 1954 4,600,355 4,600,355 1955 4,601,853 4,601,853 1956 4,908,009 4,908,009 1957 4,857,426 4,857,426 1958 4,961,616 4,961,616 1959 5,002,863 5,002,863 1960 4,720,666 4,720,666 1961 4,950,675 4,950,675 1962 4,863,821 4,863,821 1963 5,038,860 5,038,860 1964 5,138,285 5,138,285 1965 5,368,831 5,368,831 1966 5,309,313 5,309,313 1967 5,275,554 5,275,554 1968 6,018,214 6,018,214 1969 6,039,533 6,039,533 1970 5,641,540 5,641,540 1971 6,414,560 6,414,560 1972 6,179,678 6,179,678 1973 6,412,333 6,412,333 1974 6,470,857 6,470,857 1975 7,100,362 7,100,362 1976 6,852,345 6,852,345 1977 7,023,906 7,023,906 1978 6,820,014 6,820,014 1979 6,772,620 6,772,620 1980 7,708,803 7,708,803 1981 8,568,721 8,568,721 1982 8,958,000 8,958,000 1983 9,119,231 9,119,231 1984 9,225,864 9,225,864 1985 9,091,658 8,884,658 1986 8,735,403 7,828,041 1987 9,006,240 7,794,842 1988 10,579,418 7,152,321 1989 10,640,107 6,806,224
Figure 4-4
On-Track Handle Per Patron
Year Nominal Real
1953 $73 $284 1954 $71 $275 1955 $73 $283 1956 $73 $280 1957 $74 $273 1958 $75 $266 1959 $76 $267 1960 $78 $268 1961 $78 $265 1962 $81 $272 1963 $85 $281 1964 $88 $284 1965 $89 $281 1966 $91 $282 1967 $93 $283. 1968 $96 $280 1969 $105 $291 1970 $105 $277 1971 $104 $265 1972 $111 $273 1973 $114 $265 1974 $120 $253 1975 $122 $234 1976 $133 $240 1977 $145 $244 1978 $155 $241 1979 $163 $228 1980 $167 $203 1981 $175 $191 1982 $173 $178 1983 $174 $176 1984 $187 $180 1985 $196 $180 1986 $206 $184 1987 $211 $181 1988 $219 $180 1989 $228 $178
Figure 4-5
California Population
Year
1953 12,101,000 1954 12,517,000 1955 13,004,000 1956 13,581,000 1957 14,177,000 1958 14,741,000 1959 15,288,000 1960 15,863,000 1961 16,412,000 1962 16,951,000 1963 17,530,000 1964 18,026,000 1965 18,464,000 1966 18,831,000 1967 19,175,000 1968 19,432,000 1969 19,745,000 1970 20,039,000 1971 20,346,000 1972 20,585,000 1973 20,869,000 1974 21,174,000 1975 21,538,000 1976 21,936,000 1977 22,352,000 1978 22,836,000 1979 23,257,000 1980 23,780,000 1981 24,267,000 1982 24,786,000 1983 25,309,000 1984 25,780,000 1985 26,358,000 1986 27,001,000 1987 27,653,000 1988 28,315,000 1989 29,063,000
Figure 4-6
CA Per Capita Attendance
Year Total On-Track
1953 379 379 1954 367 367 1955 353 353 1956 361 361 1957 343 342 1958 337 336 1959 327 327 1960 298 297 1961 302 301 1962 287 287 1963 287 287 1964 285 285 1965 291 291 1966 282 282 1967 275 275 1968 310 310 1969 306 306 1970 282 282 1971 315 315 1972 300 300 1973 307 307 1974 306 306 1975 330 330 1976 312 312 1977 314 314 1978 299 299 1979 291 291 1980 324 324 1981 353 353 1982 361 361 1983 360 360 1984 358 358 1985 345 337 1986 324 290 1987 326 282 1988 374 253 1989 366 234
136

--------Figure 4·7 (A & B) Figure 4-8 Figure 4-9
Thoroughbred Racing Days
Vear On-Track Off-Track
Lottery
Vear Total
1953 266 - 1985 $862,175,6491954 270 -· 1986 $1,533,139,6531955 280 - 1987 $1,632,823,6231956 289 -· 1988 $2,521,116,9041957 270 -1958 292 - 1989 $2,563,080,073
1959 291 -1960 291 -1961 286 ·1962 293 .. 1963 291 .. 1964 295 -· 1965 296 .. 1966 296 -1967 316 ·1968 352 .. 1969 370 -1970 348 .. 1971 378 -1972 378 .. 1973 380 .. 1974 384 .. 1975 386 .. 1976 363 .. 1977 392 .. 1978 400 .. 1979 390 .. 1980 398 -1981 450 .. 1982 462 .. 1983 455 .. 1984 473 -1985 462 209 1986 465 973 1987 465 1,604 1988 485 4,498 1989 481 5,204
On-Track Handle Per Day
Vear Nominal Real
1953 $1,263,355 $4,896,726 1954 $1,210,526 $4,691,963 1955 $1,194,085 $4,646,246 1956 $1,246,858 $4,758,999 1957 $1,330,408 $4,909,253 1958 $1,270,747 $4,522,230 1959 $1,314,153 $4,594,941 1960 $1,267,343 $4,340,216 1961 $1,355,449 $4,594,742 1962 $1,349,960 $4,514,915 1963 $1,477,893 $4,861,489 1964 $1,531,619 $4,940,707 1965 $1,605,966 $5,098,305 1966 $1,627,149 $5,053,259 1967 $1,556,936 $4,717,988 1968 $1,646,259 $4,785,638 1969 $1,713,131 $4,745,514 1970 $1,701,611 $4,489,740 1971 $1,770,186 $4,504,290 1972 $1,811,698 $4,462,311 1973 $1,923,310 $4,472,813 1974 $2,021,863 $4,265,534 1975 $2,251,210 $4,304,417 1976 $2,516,888 $4,526,776 1977 $2,602,811 $4,374,473 1978 $2,646,028 $4,108,739 1979 $2,828,197 $3,966,616 1980 $3,236,197 $3,927,423 1981 $3,329,939 $3,643,260 1982 $3,348,967 $3,441,898 1983 $3,481,543 $3,520,266 1984 $3,642,153 $3,508,818 1985 $3,764,399 $3,466,298 1986 $3,470,015 $3,098,228 1987 $3,537,492 $3,033,869 1988 $3,235,045 $2,653,852 1989 $3,221,343 $2,512,748
137

, Figure 4-10
Real Income Per Capita
Year Real
1953 $8,620 1954 $8,539 1955 $9,156 1956 $9,416 1957 $9,410 1958 $9,121 1959 $9,351 1960 $9,541 1961 $9,631 1962 $9,910 1963 $10,079 1964 $10,429 1965 $10,724 1966 $11,252 1967 $11,630 1968 $12,087 1969 $12,424 1970 $12,522 1971 $12,616 1972 $13,202 1973 $13,572 1974 $13,572 1975 $13,291 1976 $13,752 1977 $14,072 1978 $14,613 1979 $14,763 1980 $14,081 1981 $13,921 1982 $13,603 1983 $14,081 1984 $14,543 1985 $14,763 1986 $15,016 1987 $15,301 1988 $15,391 1989 $15,544
Figure 4-11
Effective Takeout Rate
Year Percentage
1953 13.77% 1954 13.71% 1955 13.69% 1956 13.67% 1957 13.66% 1958 13.72% 1959 14.29% 1960 15.37% 1961 15.31% 1962 15.23% 1963 15.21% 1964 15.23% 1965 15.22% 1966 15.18% 1967 15.24% 1968 15.21% 1969 15.30% 1970 15.27% 1971 16.33% 1972 16.82% 1973 16.78% 1974 16.72% 1975 16.69% 1976 16.72% 1977 16.65% 1978 17.87% 1979 17.84% 1980 17.83% 1981 17.93% 1982 18.00% 1983 18.48% 1984 18.68% 1985 18.45% 1986 18.45% 1987 18.52% 1988 18.52% 1989 18.55%
Figure 4-12
Takeout Rates on Bets
Year Effective Conventional Exotic
1968 15.21% 14.00% 14.00% 1969 15.30% 14.00% 14.00% 1970 15.27% 14.00% 14.00% 1971 16.33% 15.25% 15.25% 1972 16.82% 15.75% 15.75% 1973 16.78% 15.75% 15.75% 1974 16.72% 15.75% 15.75% 1975 16.69% 15.75% 15.75% 1976 16.72% 15.75% 15.75% 1977 16.65% 15.75% 15.75% 1978 17.87% 15.75% 18.75% 1979 17.84% 15.75% 18.75% 1980 17.83% 15.75% 18.75% 1981 17.93% 15.00% 19.75% 1982 18.00% 15.00% 19.75% 1983 18.48% 15.33% 20.42% 1984 18.68% 15.33% 20.65% 1985 18.45% 15.33% 20.08% 1986 18.45% 15.33% 20.08% 1987 18.52% 15.33% 20.08% 1988 18.52% 15.33% 20.08% 1989 18.55% 15.33% 20.08%
138

Appendix D-1
A Note on Elasticities
In the analysis of the demand for horse racing in California, we frequently refer to the concept of the elasticity demand with respect to the various explanatory variables. Because this is an important concept, a more detailed explanation will be presented here.
Suppose the following demand equation is estimated from data on handle, the takeout rate and other explanatory variables:
H = b0 + b1R + b2Z
where H represents total handle (demand), R represents the effective takeout rate, Z represents all other explanatory variables, and the b's are estimated coefficients. The elasticity of demand with respect to an explanatory variable is an estimate of the percentage increase or decrease in demand which will result from a one percent change in the explanatory variable. The elasticity of handle (demand) with respect to the takeout rate may be expressed as follows:
eR = %~H/%Lfil
where eR represents the elasticity of demand with respect to Rand %~means "percentage change."
Economic theory suggests that when the price ofa good falls (rises) the demand for that good should increase (decrease). Thus, we would expecteR to be negative in this example. IfeR islessthan-1, then reducing the effective takeout rate will increase total handle, since the reduction in the takeout rate is more than offset by the resulting increase in total handle. In this case, demand is said to be elastic with respect to the takeout rate. If instead the elasticity is between 0 and -1, then reducing the takeout rate would reduce the total handle, since the percentage increase in handle would not be enough to cover the percentage decrease in the takeout rate. In this case, demand is said to be inelastic with respect to the takeout rate.
Referring to our example above, the elasticity ofdemand with respect to the effective takeout rate is calculated as follows:
ER = (bl) x (R/H)
where (b1) estimated coefficient on the variable R. Note that many observations of H, Rand Z were used to estimate the demand equation (there are individual observations for each track and year) and that ER varies with each individual observation of Hand R. Therefore, the estimated elasticity evaluated at 1965 levels will be different than the elasticity evaluated at 1985 levels of Hand R (assuming the levels of Hand Rare different in 1965 and 1985). When there is no reason to use one observation over another, it is common to evaluate elasticities "at the means of the data"-inother words, the elasticity is calculated using an average ofall observations of each variable.
The demand analysis divided the measure of demand into two parts: attendance and handle per attendee. Elasticities of each demand component with respect to the explanatory variables were calculated and reported in the text. However, also of interest are the elasticities of total handle with respect to each of the explanatory variables. Note that total handle equals attendance times handle per attendee. The elasticity of total handle with respect to an explanatory variable is approximately equal to the elasticity of attendance with respect to the explanatory variable plus the elasticity of handle per attendee with respect to the explanatory variable. These elasticities, where of interest, were also calculated and reported in the text.
139

ln accordance with applicable State and Federal laws and University policy, the University of California does not discriminate in any of its policies, procedures, or practices on the basis of race, color, national origin, religion, sex, sexual orientation, handicap, age, veterans status, medical condition (cancer-related) as defined in Section 12926 of the California Government Code, ancestry, or marital status; nor does the University discriminate on the basis of citizenship, within the limits imposed by law or University policy. In conformanre with applicable law and University policy, the University of California is an affirmative action[ equal opportunity employer. Inquiries regarding the University's equal opportunity policies may be directed to the Vice Chancellor of Academic Affairs~Affirmative Action Officer and Title lX Coordinator, 525 Mrak Hali, (916) 752-2070. Speech or hearing impaired persons may dial 752-7320 (TDD).