Embed Size (px)
Citation preview
AN ECONOMIC ASSESSMENT OF THE FACTORS INFLUENCING
SMALLHOLDER FARMERS’ ACCESS TO FORMAL CREDIT:
A CASE STUDY OF RWAMAGANA DISTRICT, RWANDA
by
Wivine Muhongayire
A thesis submitted to the University of Nairobi in partial fulfillment of the
requirements for the award Master of Science degree in Agricultural & Applied
Economics
Department of Agricultural Economics
Faculty of Agriculture
College of Agricultural and Veterinary Sciences
University of Nairobi
August 2012

i
DECLARATION
This thesis is my original work and has not been presented for the award of a degree in any other
academic institution.
Signed ....................................................... Date …………………………………
Wivine Muhongayire (Candidate)
This thesis has been submitted to Board of Postgraduate Student (BPS) for approval with the
consent of the following academic supervisors:
Signed ............................................................. Date....................................................
Prof. O.L.E. Mbatia
Signed ……………………………………… Date……………………………………
Dr. S.M. Mukoya-Wangia

ii
DEDICATION
I dedicate this thesis to my parents, brothers and sisters.
iii
ACKNOWLEDGEMENT
First I praise and honor the almighty God for the opportunity and capacity given to me to realize
my aspiration.
I gratefully acknowledge the financial support provided by Collaborative Masters Program in
Agricultural and Applied Economics (CMAAE) for conducting this study under the auspices of
the African Economic Research Consortium (AERC).
My sincere gratitude goes to my University Supervisors, Prof. O.L.E. Mbatia and
Dr. S.M.Mukoya-Wangia, for the cooperation and encouragement they have individually shown
me throughout this study.
I also extend my thanks to respondents for their patience and collaboration during field survey.
Appreciation is also expressed to my Department of Agricultural Economics and Applied
Economics of University of Nairobi.
The assistance accorded by enumerators, Mr. Niyibigira Theogene and my classmate Mr Hirwa
Emmanuel and Ms.Priscilla Wairimu, is highly appreciated.
Lastly, I wish to extend my heartfelt gratitude to all my colleagues and members of my family
for their patience, endurance and moral support during the entire period of this study.
iv
ABSTRACT
Farm credit enhances productivity and promotes standard of living by breaking vicious cycle of
poverty of small scale farmers. It is usually considered as an essential input to increase
agricultural productivity. Agricultural credit is indeed an integral part of the process of
modernization of agriculture and commercialization of the rural economy. Credit is a necessary
input if agriculture intensification and agricultural growth is to be achieved. Despite financial
institutions having been established to offer agricultural credit in Rwanda, access to credit in
many rural households in Rwanda remains limited.
This study assesses the factors influencing smallholder farmers’ access to credit in Rwamagana
District, Rwanda. The study sought to establish the relationship between formal and informal
credit use and to assess the factors that influence smallholder farmers’ access to formal credit. It
was hypothesized that informal credit participation is negatively associated with formal credit
use and that access to credit is not determined mostly by household socio- economic and
institutional factors such as land, agricultural extension service, gender. Both primary and
secondary data were used in the analysis. Multi stage sampling technique was used. A sample of
185 smallholder farmers stratified by access to formal credit was drawn. The data for the survey
was collected in the month of May, 2011. Both t-test and Chi-square test statistics were used to
compare users (33 percent) and non users of formal credit (67 percent) with respect to the
explanatory variables hypothesized to influence access to formal credit. Binary Logit is applied
in assessing the factors influencing smallholder farmers’ access to formal credit.
v
Descriptive statistics show that farmers’ credit users and non users were significantly different
by gender of household head, keeping farm records head, off-farm incomes at5 percent level of
significance. Moreover, education of household, agricultural extension service, participating in
informal credit was significantly different at 1 percent level of significance. However, other
variable such as age of household head and land size of household head were not significant
different between users and non-users.
Results from the logistic model showed that, participating in informal credit increased the
likelihood of participating in formal credit by 29.2 percent. It also found that off-farm income,
agricultural extension service, participating in informal credit and education level of household
head were statistically significant at 1 percent level of probability. The farmers earning more off-
farm income increased the likelihood of participating in formal credit by 4.6 percent. In addition,
farmers with higher levels of education and those who receive technical advice from agricultural
extension services are more likely to use formal credit (14.9 percent versus 14.5 percent
respectively).
The study recommends the following policies aimed at improving farmers’ access to formal
credit. The government should emphasize on policies aimed at increasing opportunities for off-
farm activities, not only focusing on increasing agricultural production. The policy should also
promote agricultural extension services geared towards increasing training to the farmers and
redouble efforts to improve education levels at Rwamagana District since education makes
people arrive at informed decisions about loans.
vi
TABLE OF CONTENTS
Declaration ............................................................................................................................ i
Dedication ............................................................................................................................ ii
Acknowledgement ............................................................................................................... iii
Abstract ............................................................................................................................... iv
Table of Contents ................................................................................................................. vi
List of Tables ....................................................................................................................... ix
List of Figures ...................................................................................................................... x
List of Appendices ............................................................................................................... xi
Abbreviation and Acronyms ............................................................................................... xii
CHAPTER ONE ................................................................................................................ 1
INTRODUCTION.............................................................................................................. 1
1.1Background to the Study ................................................................................................. 1
1.2 Problem statement .......................................................................................................... 4
1.3 Objectives of the Study .................................................................................................. 6
1.4 Hypotheses to be tested .................................................................................................. 7
1.5 Justification of the Study ............................................................................................... 7
1.6 Organization of the Thesis ............................................................................................. 8
CHAPTER TWO ............................................................................................................... 9
LITERATURE REVIEW ................................................................................................. 9
2.1 Concept of Smallholder Farmer ..................................................................................... 9
2.2 Concept of Credit .......................................................................................................... 10
2.3 Credit Access in Rural and Agricultural Development ................................................ 11
2.4 Problem associated with Access to Credit in Less Developed Countries ..................... 12
2.4.1 Asymmetric Information: Moral Hazard and Adverse Selection .............................. 13
2.4.1.1. Adverse selection ................................................................................................... 13
2.4.1.2. Moral hazard .......................................................................................................... 14
2.5 Characteristics of Credit Market in Developing Countries Rural Area ........................ 15
2.5.1 Informal and formal credit ......................................................................................... 15
vii
2.5.2 New Rural Financing ................................................................................................. 16
2.6 An overview of financial sector in Rwanda .................................................................. 18
2.7 Empirical Literature Review ......................................................................................... 20
CHAPTER THREE .......................................................................................................... 28
METHODOLOGY ........................................................................................................... 28
3.0 Introduction ................................................................................................................... 28
3.1 Conceptual Framework ................................................................................................. 28
3.2 Empirical Model ........................................................................................................... 30
3.2.1Model Specification .................................................................................................... 33
3.2.1.1 The Dependent Variable ......................................................................................... 33
3.2.1.2 The Following Independent Variables used in the Model ...................................... 33
3.2.2 Econometric Models Diagnostic Tests ...................................................................... 38
3.2.2.1 Multicollinearity ..................................................................................................... 38
3.2.2.2 Heteroscedasticity Test ........................................................................................... 39
3.2.2.3 Model Specification Errors Test ............................................................................. 39
3.3 Methods and Procedures ............................................................................................... 40
3.3.1 Data need and Data sources ....................................................................................... 40
3.3.2 Sampling Procedure and Data Collection .................................................................. 41
3.4 Data Analysis Tools ...................................................................................................... 42
3.5 Study Area .................................................................................................................... 43
CHAPTER FOUR ............................................................................................................. 44
RESULTS AND DISCUSSIONS ..................................................................................... 44
4.1 Introduction ................................................................................................................... 44
4.2 Descriptive Statistics ..................................................................................................... 44
4.2.1 Socio-economic and Institutional characteristics (Discrete Variables) ..................... 44
4.3 Maximum-Likelihood Estimation of Factors Influencing Access to Credit ................. 50
4.3.1 Introduction ................................................................................................................ 50
4.3.2 Econometric Model Diagnostic Result Tests ............................................................. 50
viii
4.3.2.1 The Specified Model and MLE of Multiple Regression Models for
Logistic Model ........................................................................................................ 50
4.3.2.2 Test of Multicollineality ......................................................................................... 51
4.3.2.3 Test of Heteroscedasticity ....................................................................................... 52
4.3.3 Discussion of Significant Variables ........................................................................... 53
CHAPTER FIVE .............................................................................................................. 56
SUMMARY, CONCLUSION AND RECOMMENDATION ....................................... 56
5.1 Summary and Conclusion ............................................................................................. 56
5.2 Major findings ............................................................................................................... 58
5.3 Recommendations ......................................................................................................... 59
5.4 Future research .............................................................................................................. 60
REFERENCE .................................................................................................................... 61
APPENDICES ................................................................................................................... 71
ix
LIST OF TABLES
Table 1.1: Sector Contribution to GDP and Flow of Bank Credit (1990 to 2005 in
Percent)…………………………………………………………………………………………..5
Table 3.1: Variables to be included in logit regression model…………………..……………....40
Table 3.2: Selection of Household to be interviewed and effectively interviewed……………...42
Table 4.1: Proportion of credit users and non users defined across categorical variables.............45
Table 4.2 Summary statistics of Household credit users and non users………………………....48
Table 4.3: Link test analysis…………………………………………………………………..…50
Table 4.4: Contingence Coefficients’ Estimate…………………………………………….........51
Table 4.5: Variance inflation factor for continuous explanatory variables………………..….....52
Table 4.6: Logit regression of the Factors Influencing Access to formal Credit…………...........53
x
LIST OF FIGURES
Figure 3.1: Conceptual Framework………………………………………………….……...29
xi
LIST OF APPENDICES
Appendix 1: Continuous Variables used......................................................................................71
Appendix 2: Household Survey Questionnaire............................................................................72
xii
ABBREVIATION AND ACRONYMS
COOPECs : Coopérative d'Epargne et de Crédit
DFID : Department for International Development
EDPRS : Economic Development and Poverty Reduction Strategy
GDP : Gross Domestic Product
IFDC : International Center for Soil Fertility and Agricultural Development LDC : Less Developed Countries
MFIs : Microfinance Institutions
MDG : Millennium Development Goals
NBR : National Bank of Rwanda
NGOs : Non Governmental Organizations
NISR : National Institute of Statistics Rwanda
SACCOS : Savings and Credit Cooperative Societies
UNDP : United Nations Development Program
1
CHAPTER ONE
INTRODUCTION
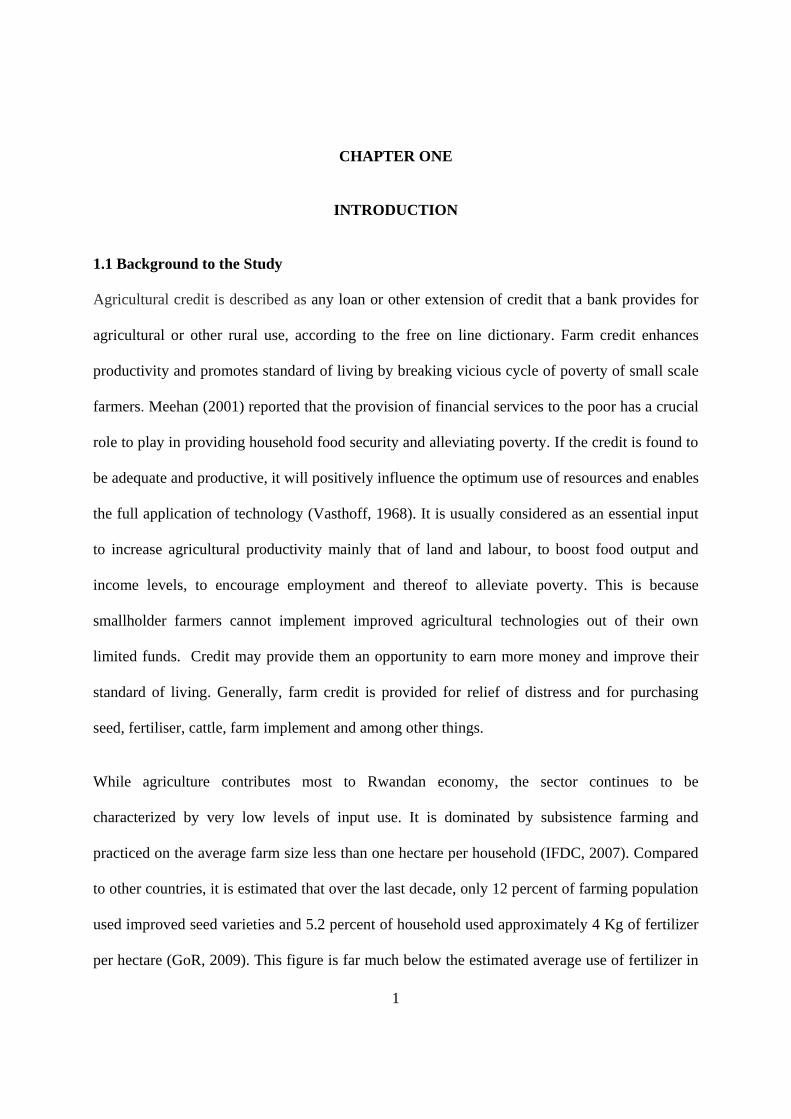
1.1 Background to the Study
Agricultural credit is described as any loan or other extension of credit that a bank provides for
agricultural or other rural use, according to the free on line dictionary. Farm credit enhances
productivity and promotes standard of living by breaking vicious cycle of poverty of small scale
farmers. Meehan (2001) reported that the provision of financial services to the poor has a crucial
role to play in providing household food security and alleviating poverty. If the credit is found to
be adequate and productive, it will positively influence the optimum use of resources and enables
the full application of technology (Vasthoff, 1968). It is usually considered as an essential input
to increase agricultural productivity mainly that of land and labour, to boost food output and
income levels, to encourage employment and thereof to alleviate poverty. This is because
smallholder farmers cannot implement improved agricultural technologies out of their own
limited funds. Credit may provide them an opportunity to earn more money and improve their
standard of living. Generally, farm credit is provided for relief of distress and for purchasing
seed, fertiliser, cattle, farm implement and among other things.
While agriculture contributes most to Rwandan economy, the sector continues to be
characterized by very low levels of input use. It is dominated by subsistence farming and
practiced on the average farm size less than one hectare per household (IFDC, 2007). Compared
to other countries, it is estimated that over the last decade, only 12 percent of farming population
used improved seed varieties and 5.2 percent of household used approximately 4 Kg of fertilizer
per hectare (GoR, 2009). This figure is far much below the estimated average use of fertilizer in
2
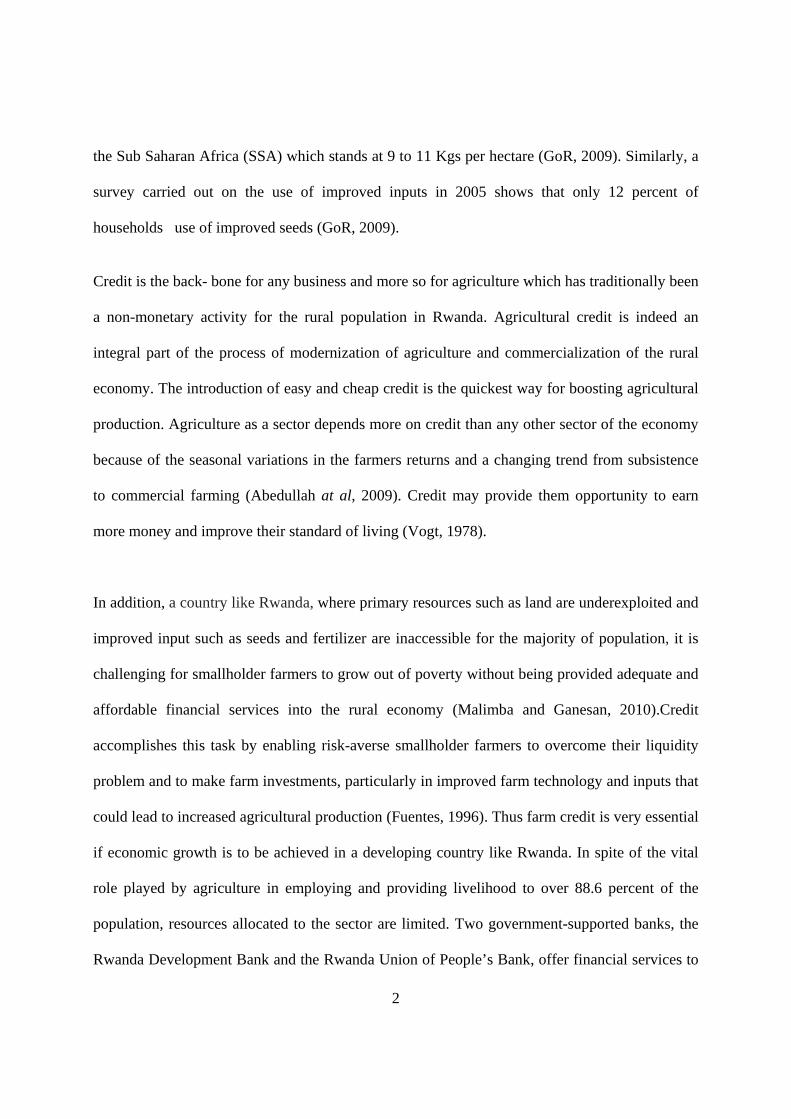
the Sub Saharan Africa (SSA) which stands at 9 to 11 Kgs per hectare (GoR, 2009). Similarly, a
survey carried out on the use of improved inputs in 2005 shows that only 12 percent of
households use of improved seeds (GoR, 2009).
Credit is the back- bone for any business and more so for agriculture which has traditionally been
a non-monetary activity for the rural population in Rwanda. Agricultural credit is indeed an
integral part of the process of modernization of agriculture and commercialization of the rural
economy. The introduction of easy and cheap credit is the quickest way for boosting agricultural
production. Agriculture as a sector depends more on credit than any other sector of the economy
because of the seasonal variations in the farmers returns and a changing trend from subsistence
to commercial farming (Abedullah at al, 2009). Credit may provide them opportunity to earn
more money and improve their standard of living (Vogt, 1978).
In addition, a country like Rwanda, where primary resources such as land are underexploited and
improved input such as seeds and fertilizer are inaccessible for the majority of population, it is
challenging for smallholder farmers to grow out of poverty without being provided adequate and
affordable financial services into the rural economy (Malimba and Ganesan, 2010).Credit
accomplishes this task by enabling risk-averse smallholder farmers to overcome their liquidity
problem and to make farm investments, particularly in improved farm technology and inputs that
could lead to increased agricultural production (Fuentes, 1996). Thus farm credit is very essential
if economic growth is to be achieved in a developing country like Rwanda. In spite of the vital
role played by agriculture in employing and providing livelihood to over 88.6 percent of the
population, resources allocated to the sector are limited. Two government-supported banks, the
Rwanda Development Bank and the Rwanda Union of People’s Bank, offer financial services to
3
agricultural customers, but the volume of rural lending by these banks amounted to less than 2%
of bank loans in 2003 (Malimba and Ganesan, 2008). It is documented that more than 80 per cent
of formal financial institutions are centralized in the city of Kigali and urban centers of provinces
and districts with few branches in the rural areas (Malimba and Ganesan, 2010).
Rwanda “Vision 2020” spells out the importance of agriculture as the main driver in
transforming the country into an industrialized state. In order to achieve this vision, the
government has encouraged an accelerated agricultural growth through increased budgetary
allocation (GoR, 2009 and World Bank, 2011). According to Strategic Plan for Agricultural
Transformation, the government’s budget allocation to the agriculture sector increased from
about 4.2 percent in 2008, to 6.6 percent in the financial year 2010/11. Together with agricultural
related spending allocated to other institutions, Rwanda now complies with the 10 percent
commitment made under the Africa Union’s Comprehensive African Agriculture Development
Program (CAADP) compact, which Rwanda was the first signatory, (GoR , 2009).
In order to improve the situation of access to credit by smallholder farmers and low income
earners, rural financial institutions such as Microfinance and Saving and Credit Cooperative
Societies (SACCOs) have been promoted (Malimba and Ganesan, 2008). In September 2006, the
Government adopted the National Microfinance Policy with a recommendation to the National
Bank of Rwanda to put in place a legal and regulatory framework for the microfinance sector.
This law was brought into force in 2008.
4
The government has also promoted some specific programmes to encourage access to credit by
the marginalized populations. These include; Women Guarantee Fund Project, Agricultural
Export and Agro-business Guarantee, Guarantee Fund and Credit Line for the retrenched civil
servant project and the Rural Investment Facility project (NBR, 2008). Musahara, (2006)
indicates that Rwandan land policy reform was also based on the assumption that poor farmers
will have access to credit when land tenure systems were formalized1.
Despite these efforts, Straton (2007) documents that access to formal credit does not improve
with the national economy. Similarly, financial services are not available in places where the
poor can easily access them at affordable costs (DFID, 2010). Smallholder farmers are still
constrained in their daily activities in different ways which also contributes to low participation
in formal credit markets. For instance, they are faced with the problem of continuous land
deterioration, climate change, high demand and price inelastic nature of agriculture production.
These challenges further complicate the ability of the smallholder farmers to acquiring
productive agricultural inputs and funding the necessitate investments (GoR, 2002 and
MINECOFIN, 2006).
1.2 Problem statement
The concern of this study is the overall aspect of credit in Rwanda. The problem of this study is
arisen from the identified limited access to credit, inadequate distribution of credit among the
economic sectors and the preferred source of credit for the consumer.
1When everyone who has land is also having title deed; so that land can be used at any time as his own fixed asset.
5
The limited access to finance industry is evident: Out of a population of more than 9 million
people in Rwanda, borrowers from commercial banks are estimated at 29,000 individuals and
depositors are approximated at 123,000 individuals in 2006 (Paul et al., 2007). Only 14 percent
of adult population had bank accounts, about 78 percent among active population were
constrained to access the whole package of formal financial services while 52 percent were
excluded from financial services at all, whether formal or informal (Tony et al., 2008 and DFID,
2010).
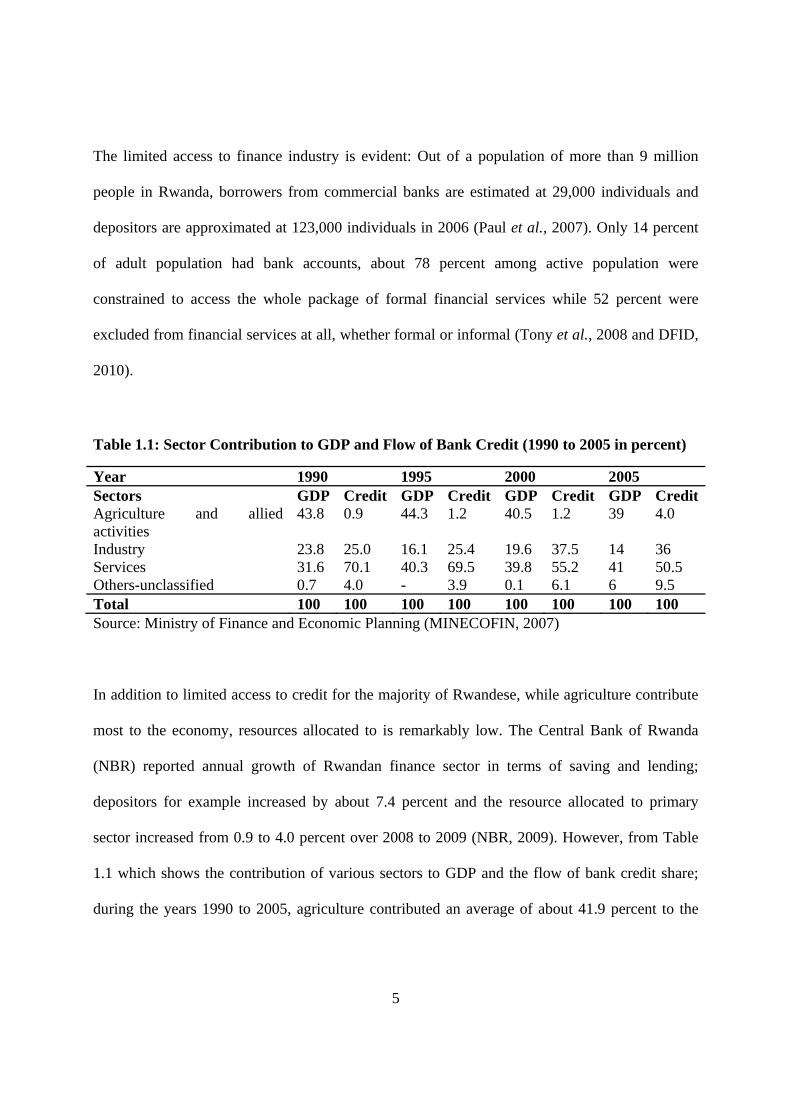
Table 1.1: Sector Contribution to GDP and Flow of Bank Credit (1990 to 2005 in percent)
Year 1990 1995 2000 2005 Sectors GDP Credit GDP Credit GDP Credit GDP CreditAgriculture and allied activities
43.8 0.9 44.3 1.2 40.5 1.2 39 4.0
Industry 23.8 25.0 16.1 25.4 19.6 37.5 14 36 Services 31.6 70.1 40.3 69.5 39.8 55.2 41 50.5 Others-unclassified 0.7 4.0 - 3.9 0.1 6.1 6 9.5 Total 100 100 100 100 100 100 100 100 Source: Ministry of Finance and Economic Planning (MINECOFIN, 2007)
In addition to limited access to credit for the majority of Rwandese, while agriculture contribute
most to the economy, resources allocated to is remarkably low. The Central Bank of Rwanda
(NBR) reported annual growth of Rwandan finance sector in terms of saving and lending;
depositors for example increased by about 7.4 percent and the resource allocated to primary
sector increased from 0.9 to 4.0 percent over 2008 to 2009 (NBR, 2009). However, from Table
1.1 which shows the contribution of various sectors to GDP and the flow of bank credit share;
during the years 1990 to 2005, agriculture contributed an average of about 41.9 percent to the
6
total gross domestic product but the amount of credit allocated to the agricultural sector is about
4 percent which is much less than the proportional contribution of agriculture to the GDP.
Moreover, informal finance plays a big role for many in Rwandese. It is argued that many
Rwandeses prefers to borrow from informal sources such as; friends, family, shop, or someone in
the community for some reason, such as having no collateral to offer or being discouraged by the
procedures bottleneck (DFID et al, 2008). About 39 percent of adults save in informal financial
and the access to credit in that kind of informal market ranges from 32 to 56 percent whereas
access to formal credit ranges from 2 to 7 percent ( Ephraim et al., 2009).
Given the little access to credit, disproportionate distribution of credit among the economic
sectors and from which model most people source credit in Rwanda, this study builds on
previous studies by analyzing how different factors affect access to credit. The study therefore
seeks to identify the host of various factors that affect access to credit in Rwanda adding to
similar studies that have been conducted in Africa.
1.3 Objectives of the Study
The purpose of this study is to assess the factors influencing smallholder farmers’ access to
formal credit in Rwamagana District, Rwanda.
The specific objectives of the study are:
1. To examine the relationship between formal and informal credit use.
2. To assess factors that influence smallholder farmer access to formal credit.

7
1.4 Hypotheses to be tested
1. The informal credit participation is negatively associated with formal credit use
2. Access to credit is not determined mostly by household socio- economic and institutional
factors such as land, agricultural extension service, gender and so on.
1.5 Justification of the Study
Agriculture is the dominant sector in the Rwandan economy. The level and the speed of
economic development are determined to a great extent by the growth of agricultural sector. This
sector, which is composed of small, fragmented and subsistence farming families has limited or
no working capital to purchase inputs to improve productivity. Hence, credit is a vital component
of modern agriculture. As stated by Meehan, (2001) and Tsehay and Mengistu, (2002),
agricultural credit helps to bring the requested productivity, improve farmers lives for better and
to attain food self-sufficiency through the adoption of new and improved technologies.
A developed financial system, especially for rural areas is one of the pillars to meet long run
Rwandan economic development objectives stipulated in the Vision 2020. It is also stated in the
Millennium Development Goals (MDGs) that access to credit is expected to play a critical role in
vulnerability and poverty alleviation. The lack of capital and the absence of attractive investment
opportunities are considered to be key reasons behind inadequate economic development in
many developing countries. This is why an attempt is made in most developing countries to
encourage, through development policy measures, capital formation as well as the supply of
financial means in the form of credit through official financial institutions (Manig, 1996). As a
result of the lack of access to credit in the formal sector, productive assets of the poor are
8
depleted; assets used as collateral are transferred from the poor to wealthier informal lenders, and
households may become impoverished.
Therefore the findings of this study inform policy by providing information to lenders and policy
makers that will enable appropriate measures to improve farmers’ access to formal credit in the
study area. The outcome of the study would be useful to identify innovative options and
institutional arrangements that would serve as an input for policy makers in formulating rural
credit policy. Above all, it can be a benchmark for further study.
1.6 Organization of the Thesis
This thesis is organized into five chapters. Chapter one presents the introduction, which focuses
mainly on the background, problem statement, objectives, hypotheses to be tested and
justification of the study. Chapter two presents review of relevant study gaps. Chapter three
discusses the methodology used. Chapter four presents the results and discussion. The last
chapter presents main findings, conclusions and policy recommendations.
9
CHAPTER TWO
LITERATURE REVIEW
2.1 Concept of Smallholder Farmer
The concept of smallholder farmers arises as a classification based on; the size of the
landholding; the purpose of production which may be own home consumption or market and
income levels of the farmer. Machethe et al. (2004) argues that limited purchased input and use
of actual technologies often associated with small-scale and subsistence farming in resource-poor
conditions are major characteristics of smallholder farmer. Nevertheless, smallholder farmers
operate in different conditions which vary across geographic regions; whether a farmer is urban
or rural and also whether in a developed or a developing country.
Though, there is no defined specific characteristics of smallholder farmer in Rwanda, different
statistics such as land scarcity, little use of input, purpose of production whether business or own
consumption, rural population fall in category of smallholder farmers. According to a study
carried out by Ministry of Agriculture (MINAGRI) on production systems in 1991, the small
farmer is defined as a farmer with a small piece of land, his homestead, which cannot produce
enough food for the family's subsistence. He has to engage in other activities (trader, hauling,
crafts etc...) or sell his labour to someone else to complement his farm output.
Dixon et al. (2003) stated that smallholder farmers are the backbone of African agriculture. The
author notes that majority of the population in Sub-Saharan Africa are considered as smallholder
farmers and reside in the rural areas. According to Delgado (1998), smallholder agriculture is
important to employment, human welfare, and political stability in Sub-Saharan Africa (SSA).
10
Eicher and Rukuni (1996) pointed out that smallholder agriculture is a source of growth linkages
by enlarging the market for industrial goods and moderation of the urban migration.
2.2 Concept of Credit
The subject of credit is a major subset in finance. Financial dictionaries define credit as involving
money, time, and risk all together. Ellis (1992) defined credit as a sum of money in favor of the
person to who control over it is transferred, and who undertakes to pay it back. This definition by
Ellis (1992) best suits the understanding of the term credit for this particular study. It implies and
requires a trust in one’s ability to make payment when due. Moreover, Beckman and Forster
(1969), defined credit as the power or ability to obtain goods or services in exchange for a
promise to pay later.
Therefore, access to finance refers to the possibility that individuals or enterprises can access
finance service, including credit, deposit, payment, insurance and other risk management
services. According to (Demirgüç et al., 2008), access to finance varies greatly between
countries and ranges from about 5 percent of the adult population in Guinea and Tanzania to 100
percent in the Netherlands (for a comprehensive list of estimated measures of access to finance
across countries). Diagne et al., (2000) stated that a household is said to have access to a type of
credit if at least one of its members has a strictly positive credit limit for that type of credit.
Similarly, a household is classified as credit constrained for a type of credit if at least one of its
members is constrained for that type of credit.
11
The distinction between access to formal credit and participation in formal credit programs is not
well understood (Aliou, 1999). The study argued that a household has access to a particular
source of credit if it is able to borrow from that source, although for a variety of reasons it may
choose not to borrow. Such reasons may be that the farmer does not need the credit at that time
or may even be limited in terms requirements by the lending institutions. The study further
indicates that the extent of access to credit is measured by the maximum amount that a household
can borrow. A household is said to be participating if it has borrowed from any source of credit.
A household is credit constrained when it lacks access to credit or cannot borrow as much as it
wants.
2.3 Credit Access in Rural and Agricultural Development
A controversy persists whether credit is better way for poverty alleviation and further
development. The results from different studies show that even new rural financing system is
questionable. Some studies argue that microfinance has very beneficial economic and social
impacts (Kidane, 2003) while others argue that microfinance system can be an instrument of
defaults and stagnation rather than an instrument of progress, unless it is promptly and efficiently
used (Adams and Von Pischke, 1992; Buckley, 1997 and Dhawan and Kahlon, 1977). The latter
justify their position arguing that farmers operate under uncertainty especially in developing
countries.
Despite differences in opinion pointed out above, credit and other finance services remains
important to rural capital development and to rural economic growth. Moshar (1966) classified
education for development, production credit, group action by farmers, improving and expanding
12
agricultural land and national planning for agricultural development as the top five accelerators
involved in agricultural modernization. He argued that credit found its role among essential
factors that enable the adoption of innovation and accelerator factors that enable to maintain
innovation. Briquette (1999) stated that enhanced provision of rural credit would accelerate
agricultural production and productivity. Aliou and Zeller (2001) show that access to credit can
significantly increase the ability of poor households to acquire agricultural inputs. They further
indicate that it reduces the opportunity costs of capital-intensive assets relative to family labor,
thus encouraging labor-saving technologies and raising labor productivity. Tefera (2004) stated
that the lack of capital in rural areas is one of the major factors which undermine the
development of agriculture. According to Straton (2007), credit is useful for poor households to
take advantage of new business opportunities, expand income-generating activities, and cope
with shocks and life cycle events. He also states that poor people, particularly those who live in
rural areas, need savings, credit, cash transfer and insurance services in the same way as others
who live in urban areas. Therefore, credit and its supply conditions plus its use remain subjects
of economic discussion.
2.4 Problem associated with Access to Credit in Less Developed Countries
According to information from different sources such as World Bank, International Financial
Statistics, and the IMF’s World Economic Outlook Database 2005, access to credit is mostly the
problem of less developed countries Shimek and Sengupta (2007). It is observed that for a
country the access to credit ranking was related to its income per capita and also its governance.
Shimek and Sengupta (2007) argued that getting credit measures the ease with which a country’s
institutions facilitate lending to entrepreneurs. It also argued that lenders make more loans if they
13
have good information about borrowers and effective legal recourse to protect their interests in
case of defaults. Uncertainty in finance area and underdevelopment of financial institutions are
highlighted as causes of limited finance in those countries.
2.4.1 Asymmetric Information: Moral Hazard and Adverse Selection
The rural financial markets are characterized by information asymmetry between borrowers and
lenders. This is confirmed by Conning et al. (2005) who argued that that the major cause of
adverse selection by suppliers and moral hazards by clients in the rural credit market is
information asymmetry between the suppliers and rural clients of financial services.
2.4.1.1. Adverse selection
A key condition for the existence of adverse selection, in the usual case is an asymmetry of
information (Akerlof, 1970). In economics, information asymmetry occurs when one party to a
transaction has more or better information than the other party.
The adverse selection theory of credit markets originated with the paper by Stiglitz and Weiss
(1981) (as sighted by Ghosh and Mookherjee, 1999). The theory rests on two main assumptions:
that lenders cannot distinguish between borrowers of different degrees of risk, and that loan
contracts are subject to limited liability (i.e., if project returns are less than debt obligations, the
borrower bears no responsibility to pay out of pocket).
Adverse selection arises when borrowers have characteristics that are unobservable to the lender
(Karlan and Zinman, 2004). A lender can try to deal with this information problem directly, by
trying to assess these characteristics, or indirectly by offering loan terms that only good risk will
14
accept. The typical method for separating good risks from bad risks is to ask the borrower to
pledge collateral such as land title deeds, houses, proof of job and so on. Risky borrowers are
likely to fail more often and lose their collateral. If the bank offers two different contracts, one
with high interest rates and low collateral and the other with the opposite, risky borrowers will
select the former and safe borrowers the latter. But poor people by definition do not have assets
that make useful collateral, meaning that lenders have no effective way to separate good risks
from bad. Group lending deals with adverse selection by drawing on local information networks
to achieve the equivalent of gathering direct information on borrowers and using differences in
loan terms to separate good from bad borrowers (Eston and Gersovitz, 1981).
2.4.1.2. Moral hazard
The problem of moral hazard is immense for formal sector lending but even moneylenders have
not fully overcome it although they can distinguish between bad luck and poor performance,
especially when their clients reside in the same villages (Mohiuddin, 1993).
Moral hazard has been defined as a problem that results when one party insures another against
some event over which the insured party has some control (Gould and Lazear, 2002). Once a
borrower has taken a loan, it would be expected that the returns from the proposed project should
be able to fully repay the loan. The project’s payoff partly depends on the borrower’s actions,
including levels of labor and other inputs put in the project. Ordinarily, we would expect the
borrower to efficiently choose these actions such that the marginal benefit of each action equals
its marginal cost so as to generate maximum returns. However, with asymmetric information that
is not necessarily the case. In the absence of collateral, the lender and borrower do not have the
15
same objectives because the borrower does not fully internalize the cost of project failure.
Moreover, the lender cannot stipulate perfectly how the borrower should run the project, in part,
because some of the borrower’s actions are not costlessly observable.
According to Mohiuddin (1993), problem of moral hazard is solved in formal sector by tying
credit and savings together, by having a built-in mechanism for emergency fund to handle
unforeseen shocks (due to weather or price changes), and by its emphasis on borrower-initiated
lending to avoid loan use in risky unknown ventures where markets or input supplies are
uncertain.
Asymmetric information makes it difficult for a would-be creditor or insurer to be sure whether
the expected probability distribution over state-contingent payoffs associated with a contract
promise is the one being represented by the seller or not, as in the case of adverse selection
(private information about the agent or the project’s characteristics) or moral hazard (private
information about whether a specified action or contingency has occurred or not). In practice
variants of each of these problems may be the concern.
2.5 Characteristics of Credit Market in Developing Countries Rural Area
2.5.1 Informal and formal credit
Informal and formal credits are the most common types of credit market in developing countries
(Aryeetey and Udry, 1997). On formal credit markets, the activity is controlled by the
government which provides directives between depositors and lenders. The formal credit is
mostly known to be used for financing production (Feder et al., 1990) and interest rate is
relatively low that usually are government subsidized. On the contrary, for informal credit
16
markets money is borrowed from private individuals, professional moneylenders, traders,
commission agents, land lords, friends and relatives (Mohieldin and Write 2000).
The interest rate on informal credit is assumed to be higher and is characterized by irregularity in
many aspects. This is perhaps due to the speculative spirit and the lack of government regulation
on that market (Mohieldin and Write, 2000). The formal financial institutions operate in areas
where they perceive lower risks, where enforcement and transaction costs are least while the
informal financial sector operates in areas and sectors where the former financial institutions fail
to provide lending and deposit services. The informal credit market was mainly relevant only for
issues that were not directly productive and through which the expenditure for social obligations
was met (Manig, 1996; Aliou, 1999) and (Fengxia et al., 2010). Therefore, informal finance
system is deemed weak because appropriate financial institutions assisting farmers in credit
administration are still wanting. For that reason, policy makers discourage informal credit to the
benefit of formal credit.
2.5.2 New Rural Financing
It is assumed that microfinance programme’ interventions would have changed human behaviors
and practices in ways that will lead to the achievement of desired outcomes. Green (2006) gives
an example by saying that “the provision of a microfinance package of technical assistance and a
loan is intended to increase household income which in turn may lead to greater household
economic security, and thus lead to positive changes in the morbidity and mortality of household
members, in educational and skill levels and in future economic and social opportunities”.
However, there are conflicting views from different authors on impact of microfinance; on one

17
hand, some studies clearly point out that the microfinance programs do not have beneficial
impacts on development and do not assist the poorest (Hulme and Mosley, 1996; Mosley and
Hulme, 1998). On the other hand, other studies argue that microfinance has very beneficial
economic and social impacts (Holcombe, 1995 and Hashemi and Schuler, 1997).
Notwithstanding, introduction of microfinance programmes and institutions into the development
economics arena about two decades ago have become an increasingly important component of
strategies for Medium and Small Enterprise (MSE) development promotion and poverty
reduction (Green, 2006). To shed light on these, the study by (Hulme, 2005) argued that credit
contributes positively by microfinance programmes and institutions to household welfare
through improving household production or smoothing consumption over time. Specifically, it is
shown that although most credit programmes may not serve the poorest of the poor, all
categories of the poor may be able to benefit through increased income and reduced vulnerability
to ‘shocks’, as noted in Khandker (1998).
From the literature review, this new rural financing system through Microfinance programs is
supported by two different stands. First, microfinance approaches tend to feature three sets of
agents: households which are potential borrowers, formal lenders and informal lenders such as
money lenders, relatives, friends and Rotating Savings and Credit Associations. Second, as
experienced in Grameen Bank’s group lending program, the new approach resolved the problem
of collateral by substituting it to group lending system.
18
It is also argued that microfinance services characterized by group lending with joint liability
may lead to peer-monitoring or peer-pressure among group members which reduces problems of
moral hazard and enforcement (Besley and Coate, 1995).
The first stand is not only criticized that microfinance services are provided at high transaction
cost but also its difficulties in the identification of the determinants of the credit supply to
households; specification of the determinants of credit rationing and determinants of the channels
through which credit may contribute to household welfare. On the other hand the criticism due to
the second stand is that microfinance can reduce but not solve the problem of effective
information since the real world is characterized by frictions due to imperfect information (Green
et al., 2005, and Green 2006).
2.6 An overview of financial sector in Rwanda
Financial sector in Rwanda is composed of nine commercial banks; namely Banque de Kigali
(BK), Banque Commerciale du Rwanda (BCR), FINA Bank, Ecobank, Access Bank and
Compagnie Générale de Banques (COGEBANQUE), Kenya Commercial Bank (KCB), Urwego
Opportunity Bank, and recently Union des Banques Populaires du Rwanda2 transformed into
commercial bank known as Banque Populaire du Rwanda. It is also has one housing bank
namely Rwanda Housing Bank (RHB) and one development bank namely Banque Rwandaise de
Développement (BRD). Other foreign finance institutions from East African Countries such as
Equity Bank from Kenya are being established.
2 Before the Union des Banques Populaires du Rwanda (UBPR) was transformed into a Commercial Bank, it was a union of local microfinance (well organized and experienced).They started operation in 1975. It has about 55 percent of all deposits in Rwanda.

19
The last two decades, has seen the introduction of many microfinance institutions and saving and
Credit Cooperatives in Rwandan economy. In total by 2009, 145 MFIs and SACCO had been
established. By June 1999, the Law No. 08/99 of June 1999 governing banks and other financial
institutions gave authority to the Central Bank to supervise banks and other financial institutions
including MFIs. In 2002 and 2003, the National Bank of Rwanda further introduced two
regulations; the first governing microfinance institutions in general, and the second regulating
SACCOs (NBR, 2007 and NBR, 2008).
Therefore, the Rwandan formal finance sources are financial institutions that are set up legally
and engaged in the provision of credit and mobilization of savings. The system includes National
Bank of Rwanda (NBR), commercial banks, Rural Development Bank (BRD), credit and savings
cooperative, insurance companies and microfinance institutions (NBR, 2009). Formal finance
Institutions are regulated and controlled by the Central Bank of Rwanda.
The informal market on the other hand comprises a range of diverse credit sources such as
relatives and friends, moneylenders, neighbours and ‘Tontines’ or Rotating Savings and Credit
Agencies (ROSCA). The tontines (ROSCA or IKIMINA) operate on the basis of the
contributions made by their members. They require no legal status or license and control from
the Central Bank to exercise their activities. The tontine can be defined as a collection system for
rotating savings funds which benefited in turn to each of the members. The tontine groups
together people who have some affinity between them such as neighbors, students, workers of
the same company, and members of the same chorale. These groups are characterized primarily
by their diversity and found in the villages and they mobilizing significant resources.
20
The informal credit market is used more extensively than the formal market. As stated by
Malimba and Ganesan (2008) that before the war and genocide of 1994, the rural credit market
in Rwanda was dominated by informal sector which accounted for more than 80 per cent of the
total rural credit market shares (Integrated Household Living Conditions Survey, 2000/2001).
Encompassing a variety of sources, the informal market is more flexible and typically better
suited to the credit needs of poor borrowers since they do not ask for collateral and other
restrictive credit requirements as opposed to the formal sector. In addition, contrary to the formal
market, informal credit is used primarily for personal reasons related to the more mundane
aspects of day-to-day life. Loans taken in the informal market are used by households mainly for
living expenses.
Informal credit is best understood as borrowing meant for the servicing of everyday debts; for
example, informal credit at stores. The second most popular type of informal credit is a revolving
credit that allows customers to maintain an account that can be paid off over time. Informal
markets often lack the stringent collateral requirements that formal lenders can enforce, allowing
poorer borrowers access to smaller pools of funds. However, the informal creditors make up for
the added risk by charging poor borrowers higher interest rates (Bradley, 2005). This is due to
lack of collateral for instance when farmers do not own their own land.
2.7 Empirical Literature Review
Several studies, on access to credit, have been done. This section, presents a review of some
related past studies in which the current study builds on. I therefore present a summary on the
methodologies used, the key findings as well as their contribution to this study.
21
A study conducted in Vihiga Division of Kakamega District showed that there was no
relationship between farm size and the supply of institution credit (Musebe, 1990). But these
results were not conclusive because farm size would influence the amount of credit demand. In
real life, the larger the farm, the more funds demanded. The study established that this value of
the marketed surplus is positive and statistically significant and this means that this value has a
relationship with the amount of institution credit actually obtained. It is expected that farmers
with greater marketed surplus have a higher probability of own-savings compared to those with
less off-farm income. In view of this, the results of the study should not be generalized to other
areas without further investigation. The variable tested will be adopted expecting that it influence
smallholder farmer’s access to formal credit in the study area.
A study by Taslim et al., (2003), conducted during July 2001/ 2002 in Central Lombok,
Indonesia on government credit scheme pointed out that the farmers generally show a negative
attitude to credit. The analysis of the reasoning underlying this attitude showed that farmers
perceived credit as being risky and liable to cause severe losses. The uncertainties that are
prevalent in agriculture specifically uncertainties on price, and production explains the farmers’
reluctance to participate and their lack of borrowing due to the fear of embarrassment as a result
of risk default.
Kiiza and Pederson (2001) with an objective of analyzing the factors that affects households’
participation in micro-credit programmes and their investment behaviour in Uganda adopted the
bivariate logistic model. The results show that proximity to the institution, dual sources of
income and income stability were the significant factors influencing the rural households’
participation in the credit programmes. The estimated model found that the likelihood of
22
participation increased with the level of education of the borrower and that farmers were less
likely to participate probably because of the uncertain nature of farm income. Using the logit
model, the authors acknowledged that it does not capture the underlying credit constraints but
noted that it served the useful purpose of identifying factors that are important in the initial
design and implementation of credit programs to reach poor households. The current study
adopted this approach
Shah et al. (2008) used a binary Logistic regression model in identifying the factors affecting
household access to credit and participation in credit programme in Pakistan. The study found
that at household level, the participation to credit was influenced by age of the head of
household, years of schooling of household head, income earners in a household and household
size. The study pointed out that the ownership of a house increased the probability of obtaining
loan and the presence of formal financial institution increased the access to credit by a
household. Also result showed that the households were indifferent of the rate of interest, they
prefer liquidity even at high rate of interest. The authors observed that major source of external
financing were the informal credit market. The current study has adopted similar variables and
methodology in a different region (Rwanda) to test the variables influencing smallholder farmers
access to formal credit.
A study by Oboh and Kushwaha(2009) employing the Multiple regression analysis on a data set
of 300 farm households revealed that income, distance between home and bank, farm size and
evidence of previous loan as having significant effects on the size of loan received. The study
recommended that government should increase the volume of loan facilities to the Nigerian
23
Agricultural Cooperative and Rural Development Bank (NACRDB) for onward disbursement to
qualified applicants. By so doing, the individual loan size of farmers will increase and this may
lead to increased farm output, productivity and income. Some of those variables such as level
education, age, gender, farm size and household size are used in the present study. However, the
present study is based on one agricultural zone and focused on specific smallholder farmers
beneficiaries of any formal financial institution unlike Oboh and Kushwaha (2009) study that
was based on a different agricultural and geopolitical zones in the state and focus on specific
farmer beneficiaries of the Nigerian Agricultural Cooperative and Rural Development Bank
(NACRDB). The multiple regression analysis was not used for this study since the nature of the
dependent variable differs; this study has a binary dependent variable as opposed to Oboh and
Kushwaha (2009) where the dependent variable is continuous.
Sisay (2008) analyzed the determinants of smallholder farmers access to formal credit in
Ethiopia, using a binary logit. The results showed that the probability of accessing formal credit
was positively and significantly affected by participation in extension package programs,
cultivated land size, experience in credit use from the formal sources and membership of
households in multipurpose cooperatives. However, farmers’ perceptions of group lending and
number of livestock in Tropical Livestock Unit (TLU) negatively and significantly affect access
to credit from formal source. Also the study noted that the status of women and different wealth
groups’ affect access to formal and informal credit sources. The study recommended that in
order to accelerate agricultural development in the area the factors (Participation in extension
package programs, Experience in credit use from the formal sources, total cultivated land size,
number of livestock , collateral or group formation and membership) were founded to be highly
24
important in influencing access to formal credit use and problems should be taken into
consideration to access credit from the formal financial sources. A similar methodology was
adopted to assess factors that influencing smallholder farmers access to formal credit in Rwanda.
This was found appropriate as it is easy to compute and interpret .The present study adds value
by identifying and evaluating factors that influencing smallholder farmers’ access to formal
credit which were not considered by Sisay (2008) for example: keeping farm records,
participation in informal credit, off-farm income. Also the study was done in Ethiopia and there
is need to find out if their findings would be applied to the Rwandese situation.
Mohamed (2003) analyzed the access to formal and quasi-formal credit by smallholder farmers
and artisanal fishermen in Zanzibar. He compared borrowers and non-borrowers by applying t-
test and determined the factors that influence an individual’s ability to secure and access loan
from formal and quasi- formal financial institutions using a logistic regression model. In addition
to socio economic factors such as age, gender, education, income levels and degree of awareness
on credit availability there was significant relationship between income levels and value of
productive assets owned by both users and non-users. The choice of the appropriate econometric
model and the selection of variables to be included in the model have been useful in informing
the current study. The current study is conducted in landlocked area in which transport is more
difficult and household activities are diverse whereas Zanzibar has a coastline and most
households were fishermen. Thus the factors affecting credit access in a landlocked country like
Rwanda are likely to be different to those of a country with a coastline such as Zanzibar.
25
Nguyen et al., (2008), used the Heckman two-step model, to determine the farming households’
access to formal credit in Mekong Delta, Vietnam. The authors found that among other factors
land size was a significant factor in explaining access to formal credit since it is considered as a
major collateral. Therefore borrowers with large land sizes are likely to get the big amount of
loan. However, the Rwandan case will be different since most the farmers don’t registered title
deeds. Rwanda is dominated by households relying on agriculture at more than 80 percent, with
population density of more than 380 people per square kilometer. It is therefore evident that land
may not be major factor influencing credit access, especially in the study area (East province of
Rwanda) where there is a problem of insecure land rights Musahara(2006). Additionally, this
study cannot employ the Heckman two step method and other participatory methods since the
objective is to assess the factors affecting access to credit and not to estimate the impact of credit
access.
Musyimi (2010) assessed access to formal credit in Mwingi District, in Kenya. The study used
participatory methods to determine the factors that influence access to credit services among
beekeeping farmers. The author pointed out that majority of sampled farmers had no access to
credit due to low and unsteady income, high interest rates and lack of knowledge on how to
access and manage credit. The financial institution dominated in network establishment with
farmers has been successful in gaining customers and influenced their positive believes on
formal finance services. However, the study selected a limited range of explanatory variables
(such as education level, source of income of farmers, occupation, limitation to credit access,
Financial Institutions Identified, distance to credit service providers) and focused only on
agricultural credit. In addition to the factors included by Musyimi (2010), the current study seeks
26
to establish the effect of participation in informal credit on access to formal credit; which could
be one of the major determinants of access to formal credit.
Tang et al., (2010) evaluated formal and informal credit markets and rural credit demand in
China. They used binary choice probit models and a multinomial probit model to analyze both
determinants of credit market access and credit constraints. From that study household size,
agricultural land size, and household head's education level were found to increase the
probability of borrowing from formal credit markets. The effect of the variables with regard to
informal credit demand was inconsistent. Household with more social network or social capitals
and more off-farm activities had a higher likelihood of borrowing from formal or informal
markets. China and Rwanda share similarities in terms of coexistence of informal and formal
credits in the rural areas. However, the productive capacities of each country differ. The authors
explained in their study one of the econometric models used in the analysis of access to credit.
From the empirical literature review, the authors used different approaches such as binary probit
models, multinomial probit model, Heckman two-step model and the logistic regression model.
The observation is that the choice of the model to be used was based on the nature of the
dependent variable and the objective of the study. In this study the dependent variable is of a
binary form taking a value of one if the respondent uses credit and zero otherwise. Such models
are estimated using either Logit or Probit models. Both the Logit and Probit models estimate
parameters using maximum likelihood method. Probit assumes normally distributed error term
whereas the Logit model assumes a logistic distribution of the error term. The Logit model is
often preferred due to the consistency of parameter estimation associated with the assumption
27
that error term in the equation has a logistic distribution (Ravallion, 2001 and Baker, 2000).
Therefore the current study adopts the logit model. More details on econometric models are
given in the next chapter.
In addition, the past studies discussed different factors that affected household or farmers access
to credit. Those factors can be characterized as socio- economic, institutional and environmental
factors. This study is not much different from others studies discussed above especially in terms
of the methodology. However, each study presented some particulars with regard to analyzed
factors which influenced access to credit. This may be due to the fact that the study areas are
different especially in its population, institutions that regulate the credit market as well as the
environmental factors. From the available studies, none of the study was conducted in a
landlocked zone, over populated rural area like Rwanda where the density population is about
383 inhabitants per square kilometer. As we know the higher the population density the less land
per capita gets and when there is lack of adequate land policy, the more the land gets fragmented.
In addition, Rwanda has not experienced modern rural finance for long. The market is small and
actors are few (only 14 percent have bank accounts) and MFI are being introduced now.
Therefore, these different empirical studies undertaken in different countries identified the most
probable causes of factors influencing access to credit and recommended the remedies that might
mitigate these problems. The results of these different empirical studies from different countries
such as Kenya, Tanzania and China may not be applicable in the current study area. For those
reasons, some factors were picked and others were left out depending on the way they were
responding to the Rwandan perspective. Therefore, this study will add to the empirical literature
on factors that influence access to credit for a specific context such as Rwanda.
28
CHAPTER THREE
METHODOLOGY
3.0 Introduction
This Chapter contains five sections. The first section of this chapter present conceptual
framework. In section two empirical model is presented. Section three and four present methods,
procedures and data analysis tools respectively. Section five describes the study area.
3.1 Conceptual Framework
A number of factors affect access to and demand for credit. According Sisay (2006) they are
classified into three categories, namely institutional factors, socio-economic factors and
environmental factors (Figure 3.1). Institution factors include; culture, government policies and
extension services while household socio-economic factors are the size of land holding, age,
education and finally, the environmental factors include , the national resource endowment,
presence of technology to invest in and financial institutions.
The framework shows that when more profitable resource conserving or improving technologies
are available and presence of financial institutional, farm households may able demand credit.
Enabling policies (e.g., secure rights to land), access to markets and institutional arrangements
(e.g., credit services and extension systems) create incentives to demand of financial service that
expand future production and consumption possibilities.
29
Considering the economy in which this study was carried out (small economy in which actors are
among the poorest with less than one dollar as income per capita), a household with limited
capacity to access credit is assumed to be vulnerable to different shocks such drought, plant or
animal disease and adoption of new agricultural technologies:
On the other hand, it is assumed that household able to access credit have the ability to
participate in the process of new technological innovations, i.e adopt new technological
innovations and use available resources such as human capital and time.
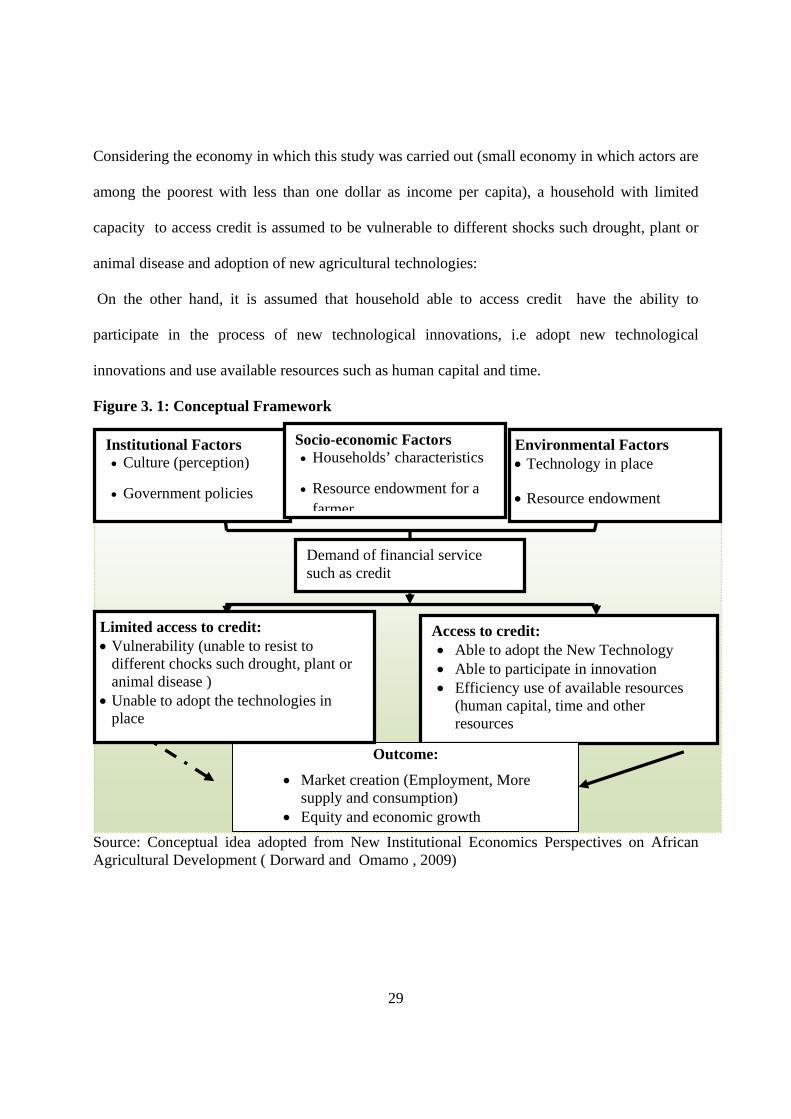
Figure 3. 1: Conceptual Framework
Source: Conceptual idea adopted from New Institutional Economics Perspectives on African Agricultural Development ( Dorward and Omamo , 2009)
Access to credit: • Able to adopt the New Technology • Able to participate in innovation • Efficiency use of available resources
(human capital, time and other resources
Institutional Factors • Culture (perception)
• Government policies
Demand of financial service such as credit
Outcome:
• Market creation (Employment, More supply and consumption)
• Equity and economic growth
Environmental Factors • Technology in place
• Resource endowment
Socio-economic Factors • Households’ characteristics
• Resource endowment for a farmer
Limited access to credit: • Vulnerability (unable to resist to
different chocks such drought, plant or animal disease )
• Unable to adopt the technologies in place

30
As show in Figure 3.1; the study assumed that institutional, socio economic and environment
factors, together influence farmers access to credit. As result, on one hand, a household has
access to credit and hence influence positively market creation, equity and economic growth. On
other hand, a limited access to credit implies limited employment, supply and consumption.
Failure on credit market reaches gradually a small group of population and lives out to big
portion of it to national wellbeing while access to credit impacts positively national equity.
3.2 Empirical Model
The dependent variable is dichotomous in nature, that is either a household has access to formal
credit or not. It implies that the dependent variable takes only two values of either 0 or 1.
According to Green (1993) and Maddala (2001), the ordinary least square leads to a linear
probability model stated as follows:
; where
Where yi is one or zero.
Where, is the probability that an individual used formal credit or did not use given ;
represents the explanatory variable to be estimated;
and are parameters to be estimated .
represents error term
That phenomenon became a limitation which arises from the fact that one of the dependent
variables may be or not be observable. Omissions of the unobservable variable results in an
inadequate use of the Classical linear models like Ordinary Least Squares (OLS). The use of
such a model may be inappropriate because it may result into biased and inconsistent parameter
estimates; the expected value of the error terms [E (ui)] will not be necessarily zero. The problem
31
that comes from the dichotomous choices of use of access to formal credit is typically remedied
by using Maximum Likelihood Estimation (MLE) (Green, 2000 and Wooldridge, 2000).
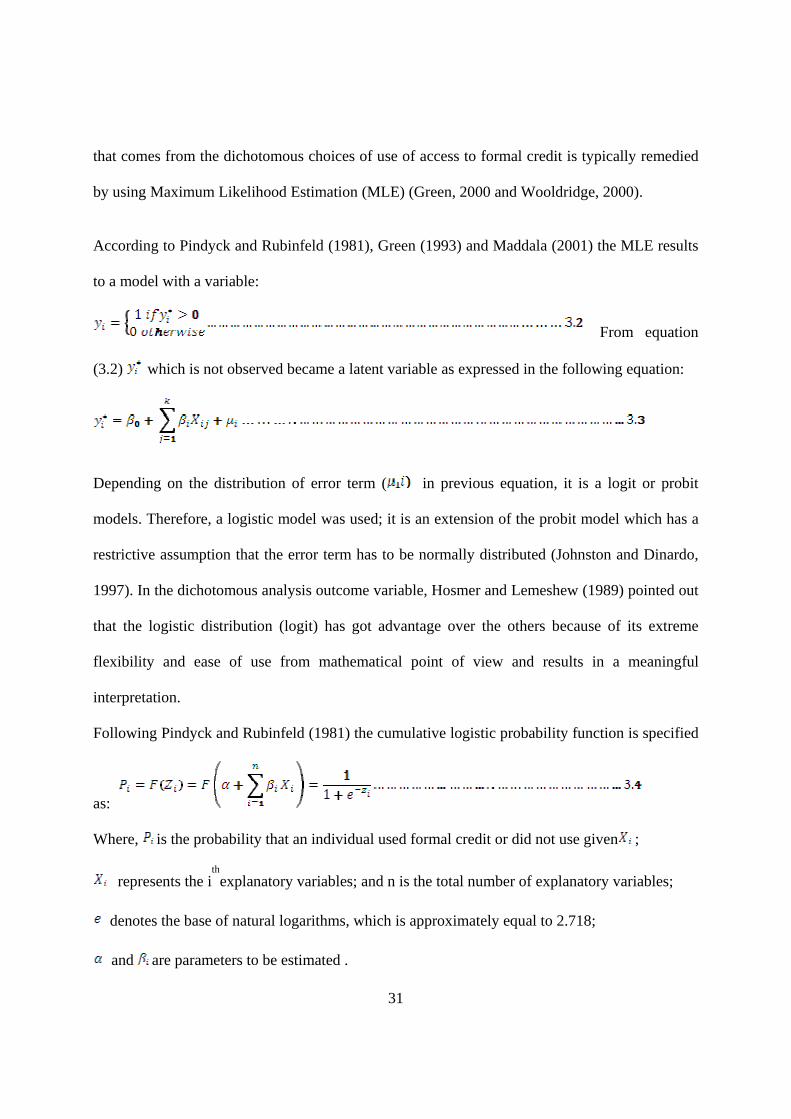
According to Pindyck and Rubinfeld (1981), Green (1993) and Maddala (2001) the MLE results
to a model with a variable:
From equation
(3.2) which is not observed became a latent variable as expressed in the following equation:
Depending on the distribution of error term ( in previous equation, it is a logit or probit
models. Therefore, a logistic model was used; it is an extension of the probit model which has a
restrictive assumption that the error term has to be normally distributed (Johnston and Dinardo,
1997). In the dichotomous analysis outcome variable, Hosmer and Lemeshew (1989) pointed out
that the logistic distribution (logit) has got advantage over the others because of its extreme
flexibility and ease of use from mathematical point of view and results in a meaningful
interpretation.
Following Pindyck and Rubinfeld (1981) the cumulative logistic probability function is specified
as:
Where, is the probability that an individual used formal credit or did not use given ;
represents the ith
explanatory variables; and n is the total number of explanatory variables;
denotes the base of natural logarithms, which is approximately equal to 2.718;
and are parameters to be estimated .
32
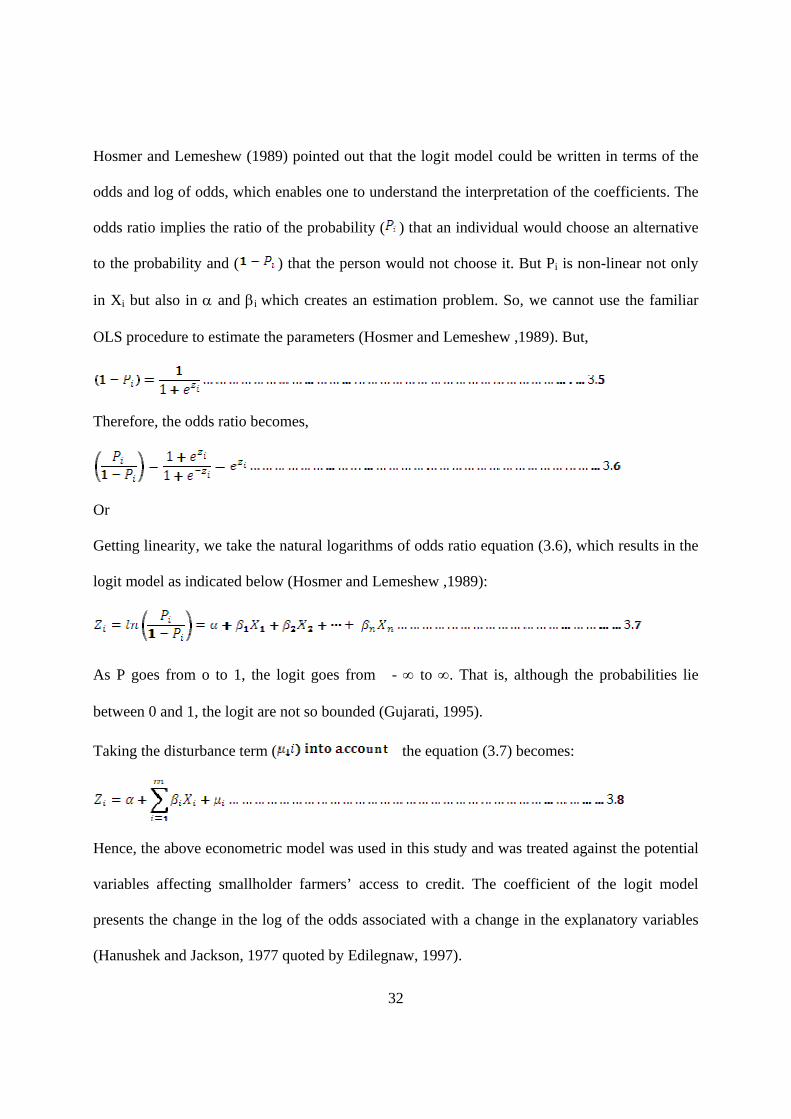
Hosmer and Lemeshew (1989) pointed out that the logit model could be written in terms of the
odds and log of odds, which enables one to understand the interpretation of the coefficients. The
odds ratio implies the ratio of the probability ( ) that an individual would choose an alternative
to the probability and ( ) that the person would not choose it. But Pi is non-linear not only
in Xi but also in α and βi which creates an estimation problem. So, we cannot use the familiar
OLS procedure to estimate the parameters (Hosmer and Lemeshew ,1989). But,
Therefore, the odds ratio becomes,
Or
Getting linearity, we take the natural logarithms of odds ratio equation (3.6), which results in the
logit model as indicated below (Hosmer and Lemeshew ,1989):
As P goes from o to 1, the logit goes from - ∞ to ∞. That is, although the probabilities lie
between 0 and 1, the logit are not so bounded (Gujarati, 1995).
Taking the disturbance term ( the equation (3.7) becomes:
Hence, the above econometric model was used in this study and was treated against the potential
variables affecting smallholder farmers’ access to credit. The coefficient of the logit model
presents the change in the log of the odds associated with a change in the explanatory variables
(Hanushek and Jackson, 1977 quoted by Edilegnaw, 1997).
33
3.2.1 Model Specification
3.2.1.1 The Dependent Variable
The dependent variable for the logit analysis is smallholder farmer’s access to formal credit. The
sample was divided into credit user and non credit users based on the question whether the
household head applied for the credit or not. All of those who applied for credit but were not
successful (rejected) and who did not apply were all classified as non users of credit while those
respondents that got credit were classified as credit users. Distinguishing between those users or
non-users of formal credit in the study area, the dependent variable takes value of “1” for users
and “0” for non-users. The regression model was used to analyze some factors affecting access
to credit by respondents.
3.2.1.2 The Following Independent Variables used in the Model
Gender of Household Head (GENDHH): This is a dummy variable that assumes a value of “1”
if the head of the household is female and “0” otherwise. Gender represented in terms of
household head sex has been identified by different authors as an important factor defining the
economic role of rural people in Africa (McSweeney, 1979 and Dey, 1980). The view on human,
either a man or woman credit access is not shared: different authors such as Mayada et al (1994)
argued that women are especially discriminated against in formal financial markets while others
such as Zeller (1994) argued that gender appeared to have no impact on credit access. According
to Buvinic et al. (1979), factors related to woman’s lack of control over the economic resources
and the nature of their economic activity are two categories of major factors that restrict
women’s access to formal credit compared to men. Therefore, in this study, it was expected that
female headed households were less likely to use formal credit.
34
Age of Household Head (AGEHH): It is a continuous variable, defined as the farm household
heads age at the time of interview measured in years. In this study, the age of the head of the
household is considered because he or she is the one who makes management decisions in the
house or farm. He or she is also the one responsible for making decisions regarding whether or
not to request for credit for any activities. Age of household heads goes with characteristics
which may differentiate their ability of credit access. On one side, older people have more
experience in the economic activities being financed and increase their trust and confidence
regards to lenders institution officers (Gershon et al., 1988 and Zeller et al., 2001). One the other
side, young people have not yet constituted enough wealth and need more finance for adoption of
new technology (Nguyen, 2003). Therefore, old are privileged and less demander (risk averse)
while young people are more credit seeker but disadvantaged. Therefore, the expected sign of
effect of age on the probability of access to credit is ambiguous; either positive or negative sign
is expected.
Education Level (EDUCL): Education level of households head is independent variable which
measured by number of the school years of household head. According to Gershon et al., (1988),
education especially formal schooling constitutes an asset as human capital which determines the
efficiency of the owner. Arene (1992) and Njoku (1997) state that with environment change in
different aspect such as climate and competitiveness conditions, increasing return in agriculture
production is nothing as adoption of new technologies which goes with farmer ability from
different form of knowledge acquisition. Musebe et al, (1993) argued that as household gets
more formal education, the access to credit ability increase. Marge (2003) generalized the
argument by stating that, in general, more educated persons were less constrained. In this study,
more educated people are supposed to have more level of awareness on the available credit
35
facilities in their areas and more seekers. Therefore education is expected to have positive
influence on access to credit.
Size of Household (SIZEH): The family size has been defined as the number of people under
the same roof. On production side, according to Bizoza et al. (2007), the size of household is
synonym of labor endowment for business enterprise in Rwanda. From his study, the more the
labor force available from the larger the family members, there is possibility of more income to
overcome credits risk (Schereiner and Nagarajan, 1997). On the consummation side, a family
size may increase with an increase of dependence rate and loss of potential to attract lenders
despite more need to spend and demand for credit. Therefore, looking any side, the negative and
positive signs are expected.
Off-farm Income (OFF-FARMI): It is defined as amount of off-farm income by the household in
Rwandan francs. Off-farm income, on one side, may build confidence to borrower and it can be
major source of finance to ensure repayment (Sharma and Zeller, 1997). On the other side,
higher off-farm incomes may reduce household’s borrowing needs because such household’s
may be able to meet their investment needs, without having to resort to borrowing. According to
Diagne (1999), Bhuiya et al (2001), Marge (2003) and Johnston and Morduch (2007), the
increase in income raises access to credit. So, the expected effect of off-farm income on access to
credit is either negative or positive.
Land Size (LANDSIZE): It is defined as the total land owned by the household in acres.
Binswanger et al. (1989) states that land has been the most important collateral for formal credit
and he also argued that farmers with more land are more likely to seek credit and as long as the
exploitation requires more capital. Therefore, in this study, land is hypothesized to increase the
36
probability of farmers’ access to credit.
Keeping Farm Records (KEEPFARE): This is a dummy variable which takes a value “1” and
“0” for keeping farm records and non-keeping farm records respectively. When applying for
credit a borrower is required to produce finance documents that relate to his financial position.
Therefore, the household which keeps regularly it finance records such as cash flow; income
statement and balance sheet fulfill one of the lenders conditions. Such as household is aware
about its strengths and weakness and is more likely to access credit. Having already those
documents can show the capacity of household in management of its finance.
Participation in informal credit (PARTINFIN): This is a dummy variable which takes a value “1” and “0” for non participation and participation
in informal credit respectively. According to Jacobson and Petrie (2008) and Malimba and
Ganesan (2010) informal finance sector may be observed through three aspects or types of
informal finance such as savings groups, insurance groups and informal loans in Rwanda.
Savings groups (tontines): A fixed amount at a given fixed period of time is deposited and each
member of savings groups receives all money at his round. It is a rotating credit association that
allows members to accumulate finance for a projected investment that a member cannot afford
himself once. It can also serve for members to pool risk. There is no penalty to leave the group
for any member once a cycle in which all group members receive the pool of money is complete.
There is also no limited size or rotating period.

37
Insurance groups: present two general forms; rotating work group for construction or
agricultural work by exchanging labor to help each other among the group members and offering
financial assistance in the case of a bad shock such as death, illness. It is insurance characteristic
and members typically pay a periodic fee to belong well as not only monetary is the existence
matter of the group.
In addition to this informal credit indicated above, informal loan come in as usually short-term,
small, and are largely used for immediate consumption smoothing. It is hypothesized that
participant in informal credit are less likely to participate in formal credit. This is because may
be risk averse in way that they still want to bear the cloth of other group members. This is
because they fear the risk of default once they take the formal credit.
Agricultural Extension Service (AGREXTSERV):
This is a dummy variable which takes a value “1” and “0” for participation and non-participation
in agricultural extension service respectively. Extension service in this study was categorized in
two aspects: extension to modern agriculture use and finance service aspect. A household which
accessed extension service on fertilizer use, mechanization, and improved seeds may be a
potential borrower and producer. The household may interest more lenders by having more
working capital than the one which did not use such modern technologies. Therefore, it was
expected that, this variable positively influences farmer’s access to credit from the formal
sources.
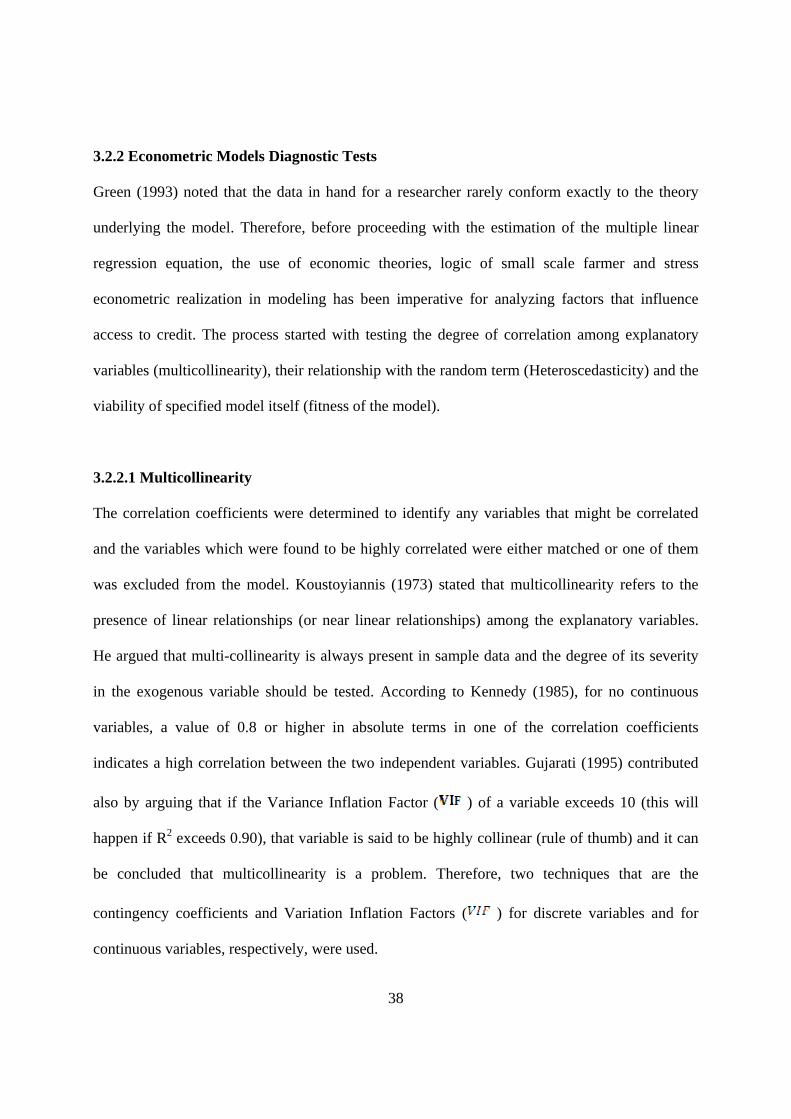
38
3.2.2 Econometric Models Diagnostic Tests
Green (1993) noted that the data in hand for a researcher rarely conform exactly to the theory
underlying the model. Therefore, before proceeding with the estimation of the multiple linear
regression equation, the use of economic theories, logic of small scale farmer and stress
econometric realization in modeling has been imperative for analyzing factors that influence
access to credit. The process started with testing the degree of correlation among explanatory
variables (multicollinearity), their relationship with the random term (Heteroscedasticity) and the
viability of specified model itself (fitness of the model).
3.2.2.1 Multicollinearity
The correlation coefficients were determined to identify any variables that might be correlated
and the variables which were found to be highly correlated were either matched or one of them
was excluded from the model. Koustoyiannis (1973) stated that multicollinearity refers to the
presence of linear relationships (or near linear relationships) among the explanatory variables.
He argued that multi-collinearity is always present in sample data and the degree of its severity
in the exogenous variable should be tested. According to Kennedy (1985), for no continuous
variables, a value of 0.8 or higher in absolute terms in one of the correlation coefficients
indicates a high correlation between the two independent variables. Gujarati (1995) contributed
also by arguing that if the Variance Inflation Factor ( ) of a variable exceeds 10 (this will
happen if R2 exceeds 0.90), that variable is said to be highly collinear (rule of thumb) and it can
be concluded that multicollinearity is a problem. Therefore, two techniques that are the
contingency coefficients and Variation Inflation Factors ( ) for discrete variables and for
continuous variables, respectively, were used.
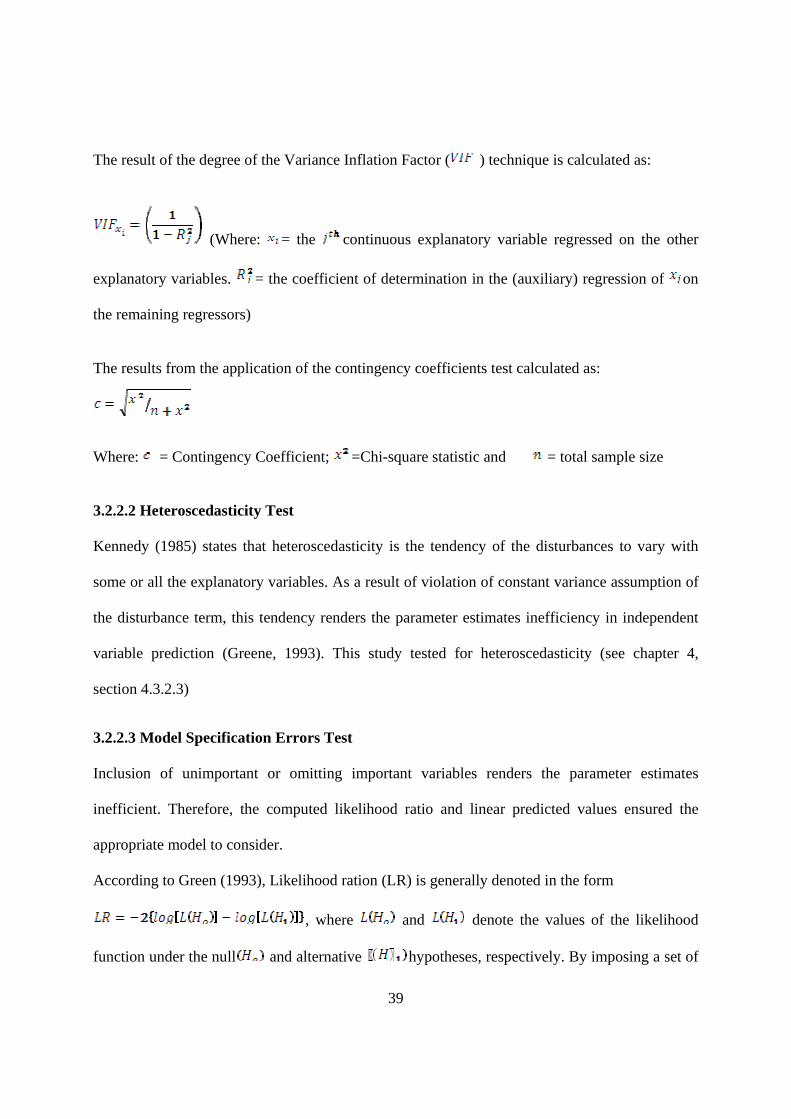
39
The result of the degree of the Variance Inflation Factor ( ) technique is calculated as:
(Where: = the continuous explanatory variable regressed on the other
explanatory variables. = the coefficient of determination in the (auxiliary) regression of on
the remaining regressors)
The results from the application of the contingency coefficients test calculated as:
Where: = Contingency Coefficient; =Chi-square statistic and = total sample size
3.2.2.2 Heteroscedasticity Test Kennedy (1985) states that heteroscedasticity is the tendency of the disturbances to vary with
some or all the explanatory variables. As a result of violation of constant variance assumption of
the disturbance term, this tendency renders the parameter estimates inefficiency in independent
variable prediction (Greene, 1993). This study tested for heteroscedasticity (see chapter 4,
section 4.3.2.3)
3.2.2.3 Model Specification Errors Test
Inclusion of unimportant or omitting important variables renders the parameter estimates
inefficient. Therefore, the computed likelihood ratio and linear predicted values ensured the
appropriate model to consider.
According to Green (1993), Likelihood ration (LR) is generally denoted in the form
, where and denote the values of the likelihood
function under the null and alternative hypotheses, respectively. By imposing a set of
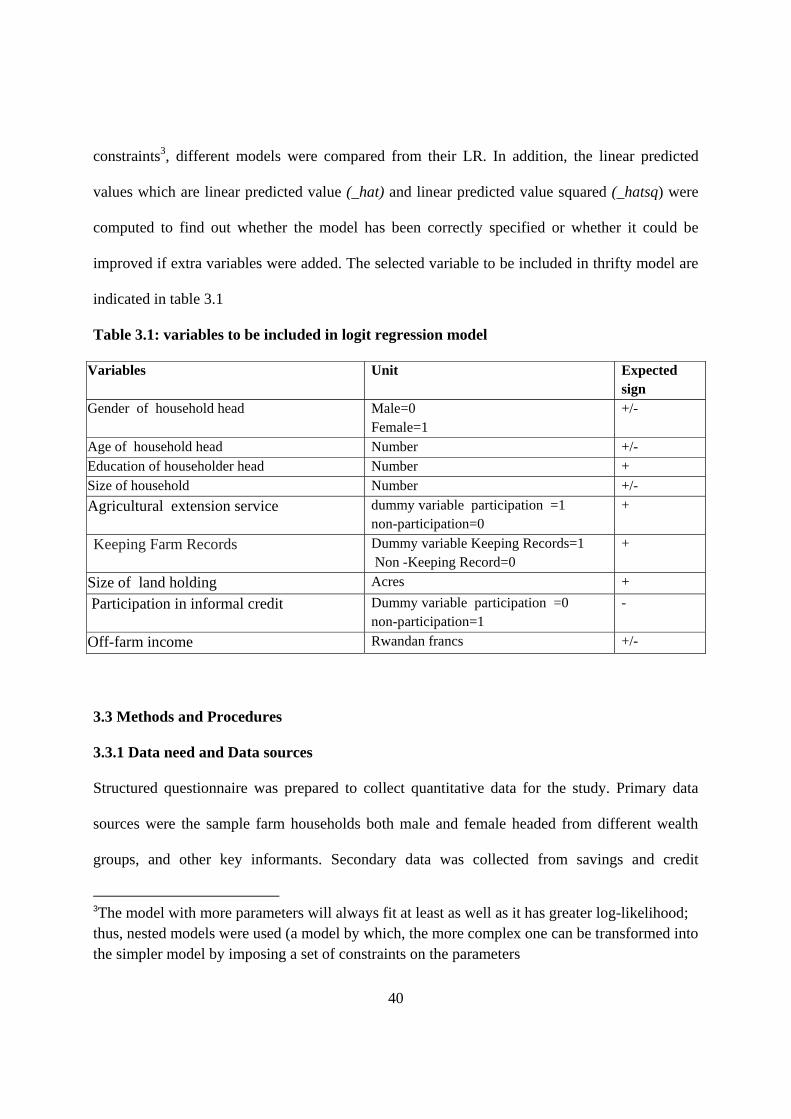
40
constraints3, different models were compared from their LR. In addition, the linear predicted
values which are linear predicted value (_hat) and linear predicted value squared (_hatsq) were
computed to find out whether the model has been correctly specified or whether it could be
improved if extra variables were added. The selected variable to be included in thrifty model are
indicated in table 3.1
Table 3.1: variables to be included in logit regression model
Variables Unit Expected sign
Gender of household head Male=0 Female=1
+/-
Age of household head Number +/- Education of householder head Number + Size of household Number +/- Agricultural extension service dummy variable participation =1
non-participation=0 +
Keeping Farm Records Dummy variable Keeping Records=1 Non -Keeping Record=0
+
Size of land holding Acres + Participation in informal credit Dummy variable participation =0
non-participation=1 -
Off-farm income Rwandan francs +/-
3.3 Methods and Procedures
3.3.1 Data need and Data sources
Structured questionnaire was prepared to collect quantitative data for the study. Primary data
sources were the sample farm households both male and female headed from different wealth
groups, and other key informants. Secondary data was collected from savings and credit
3The model with more parameters will always fit at least as well as it has greater log-likelihood; thus, nested models were used (a model by which, the more complex one can be transformed into the simpler model by imposing a set of constraints on the parameters
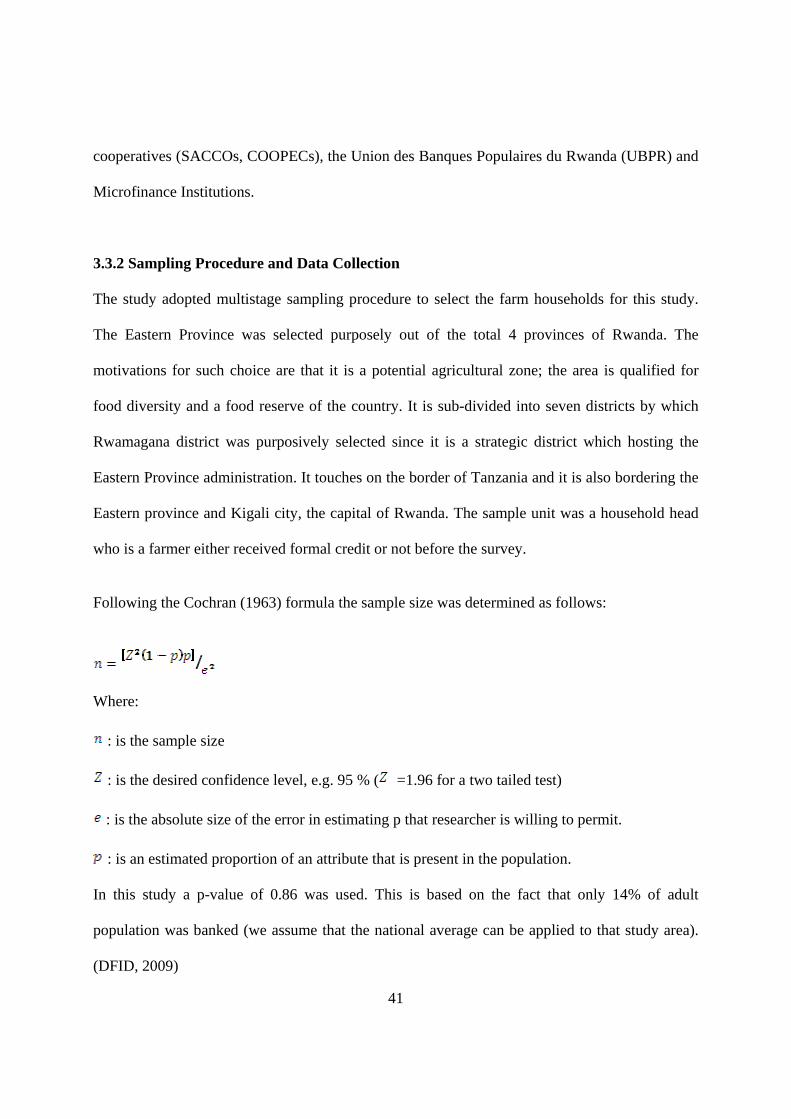
41
cooperatives (SACCOs, COOPECs), the Union des Banques Populaires du Rwanda (UBPR) and
Microfinance Institutions.
3.3.2 Sampling Procedure and Data Collection
The study adopted multistage sampling procedure to select the farm households for this study.
The Eastern Province was selected purposely out of the total 4 provinces of Rwanda. The
motivations for such choice are that it is a potential agricultural zone; the area is qualified for
food diversity and a food reserve of the country. It is sub-divided into seven districts by which
Rwamagana district was purposively selected since it is a strategic district which hosting the
Eastern Province administration. It touches on the border of Tanzania and it is also bordering the
Eastern province and Kigali city, the capital of Rwanda. The sample unit was a household head
who is a farmer either received formal credit or not before the survey.
Following the Cochran (1963) formula the sample size was determined as follows:
Where:
: is the sample size
: is the desired confidence level, e.g. 95 % ( =1.96 for a two tailed test)
: is the absolute size of the error in estimating p that researcher is willing to permit.
: is an estimated proportion of an attribute that is present in the population.
In this study a p-value of 0.86 was used. This is based on the fact that only 14% of adult
population was banked (we assume that the national average can be applied to that study area).
(DFID, 2009)
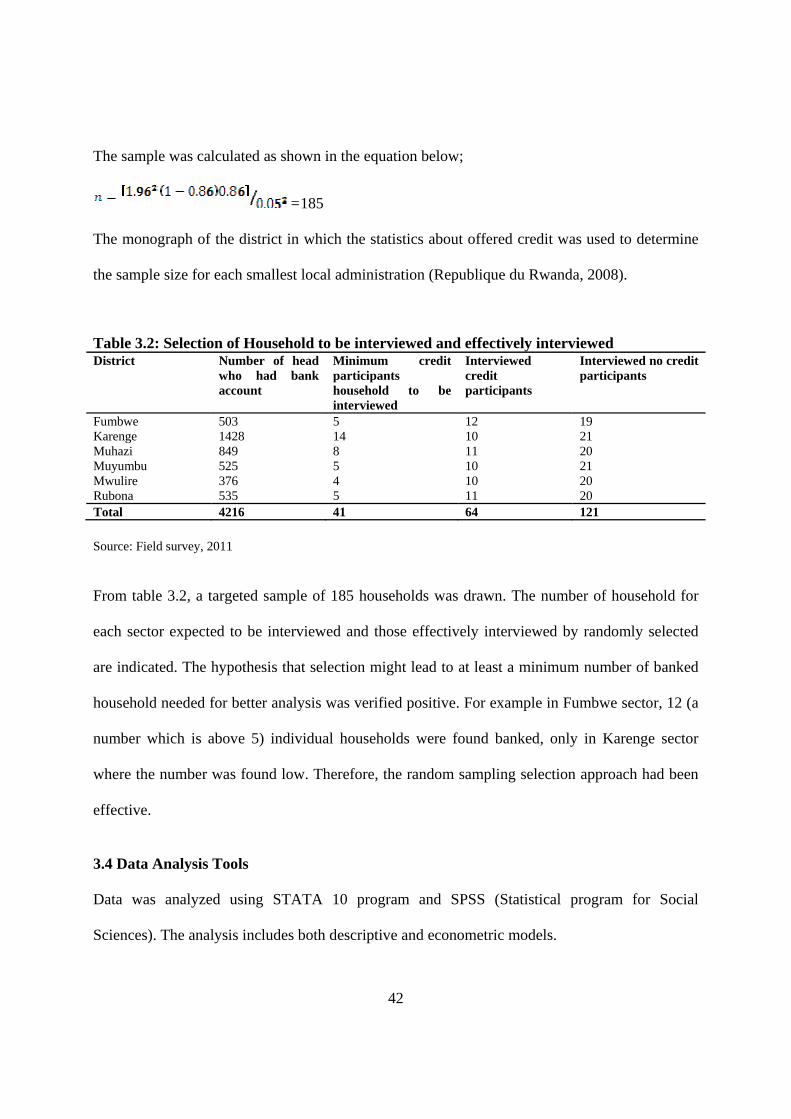
42
The sample was calculated as shown in the equation below;
=185
The monograph of the district in which the statistics about offered credit was used to determine
the sample size for each smallest local administration (Republique du Rwanda, 2008).
Table 3.2: Selection of Household to be interviewed and effectively interviewed District Number of head
who had bank account
Minimum credit participants household to be interviewed
Interviewed credit participants
Interviewed no credit participants
Fumbwe 503 5 12 19 Karenge 1428 14 10 21 Muhazi 849 8 11 20 Muyumbu 525 5 10 21 Mwulire 376 4 10 20 Rubona 535 5 11 20 Total 4216 41 64 121
Source: Field survey, 2011
From table 3.2, a targeted sample of 185 households was drawn. The number of household for
each sector expected to be interviewed and those effectively interviewed by randomly selected
are indicated. The hypothesis that selection might lead to at least a minimum number of banked
household needed for better analysis was verified positive. For example in Fumbwe sector, 12 (a
number which is above 5) individual households were found banked, only in Karenge sector
where the number was found low. Therefore, the random sampling selection approach had been
effective.
3.4 Data Analysis Tools
Data was analyzed using STATA 10 program and SPSS (Statistical program for Social
Sciences). The analysis includes both descriptive and econometric models.
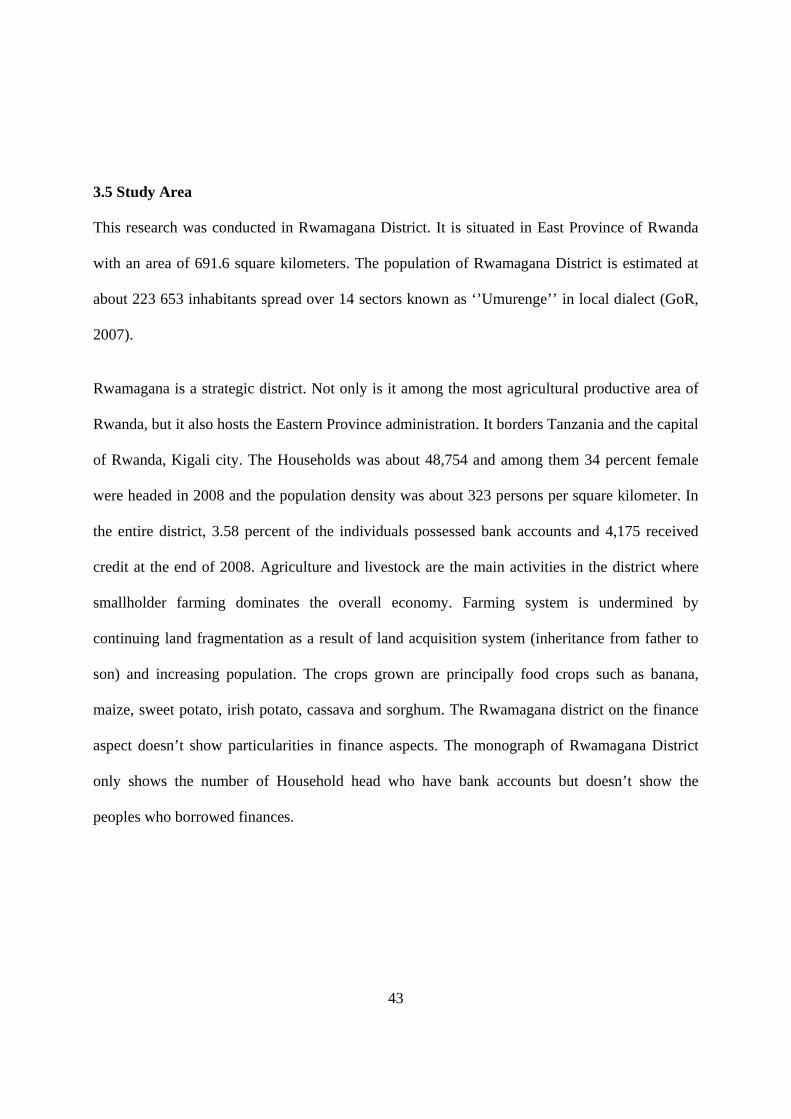
43
3.5 Study Area
This research was conducted in Rwamagana District. It is situated in East Province of Rwanda
with an area of 691.6 square kilometers. The population of Rwamagana District is estimated at
about 223 653 inhabitants spread over 14 sectors known as ‘’Umurenge’’ in local dialect (GoR,
2007).
Rwamagana is a strategic district. Not only is it among the most agricultural productive area of
Rwanda, but it also hosts the Eastern Province administration. It borders Tanzania and the capital
of Rwanda, Kigali city. The Households was about 48,754 and among them 34 percent female
were headed in 2008 and the population density was about 323 persons per square kilometer. In
the entire district, 3.58 percent of the individuals possessed bank accounts and 4,175 received
credit at the end of 2008. Agriculture and livestock are the main activities in the district where
smallholder farming dominates the overall economy. Farming system is undermined by
continuing land fragmentation as a result of land acquisition system (inheritance from father to
son) and increasing population. The crops grown are principally food crops such as banana,
maize, sweet potato, irish potato, cassava and sorghum. The Rwamagana district on the finance
aspect doesn’t show particularities in finance aspects. The monograph of Rwamagana District
only shows the number of Household head who have bank accounts but doesn’t show the
peoples who borrowed finances.
44
CHAPTER FOUR
RESULTS AND DISCUSSIONS
4.1 Introduction
This chapter presents and discusses results. It is divided into two main sections. The first section
summarizes the results of descriptive analysis of farm household interviewed, while the second
section presents the econometric analysis that identifies the most important factors that affect
smallholder farmers’ access to formal credit.
4.2 Descriptive Statistics
These results are based on cross-sectional data collected from a total of 185 smallholder farmers
from 6 out of 14 sectors4 that constitute Rwamagana district (Table 3.2). The descriptive
statistics presented include mean, percentage, standard deviation and frequency distribution. In
addition, t-test and Chi-square test statistics were employed to compare formal credit users as
and no credit user groups with respect to the hypothesized explanatory variables.
4.2.1 Socio-economic and Institutional characteristics (Discrete Variables)
Out of 185 interviewed households 64 (33 %) use formal credit and the remaining 121 (67 %) do
not. Table 4.1 shows the proportion of credit users and non users defined across some household
categorical variables (including keeping farm records, participation in agricultural extension,
gender, education levels and participation in informal credit). It also shows the chi square test of
proportion between the two groups.
4 The sector is known as Umurenge in native language and it is the smallest local administration
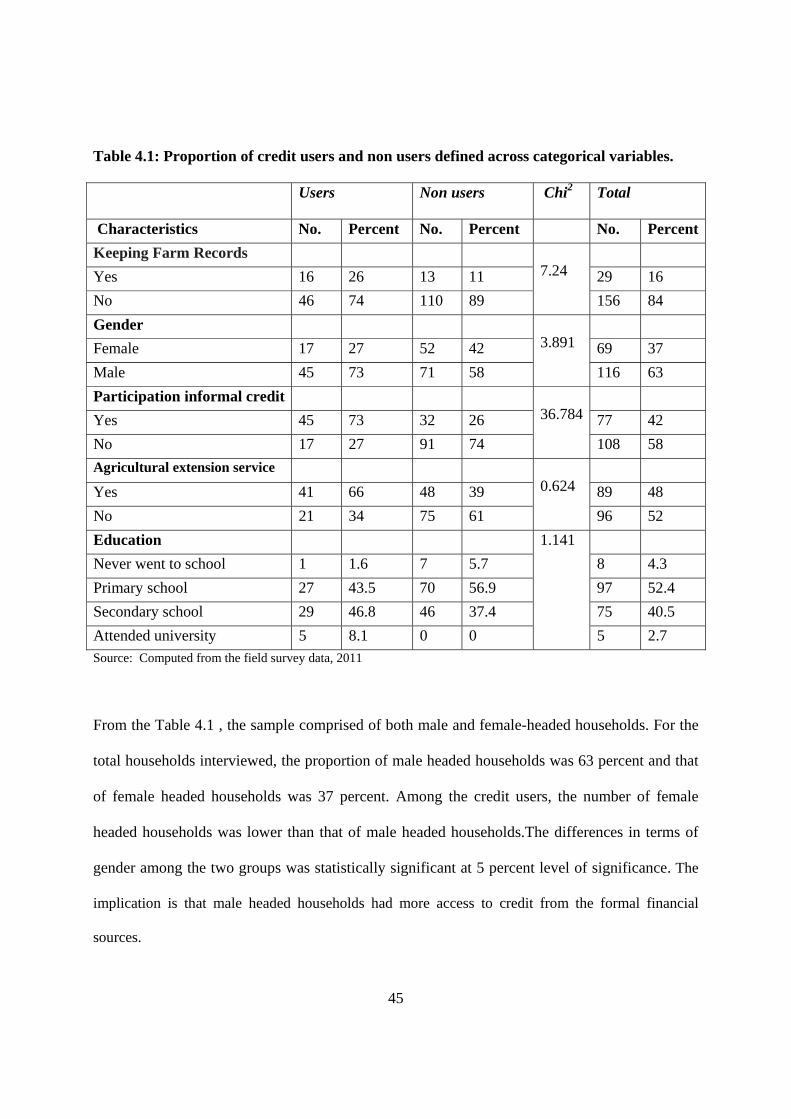
45
Table 4.1: Proportion of credit users and non users defined across categorical variables. Users
Non users
Chi2 Total
Characteristics No. Percent No. Percent No. PercentKeeping Farm Records
7.24
Yes 16 26 13 11 29 16 No 46 74 110 89 156 84 Gender
3.891
Female 17 27 52 42 69 37 Male 45 73 71 58 116 63 Participation informal credit
36.784
Yes 45 73 32 26 77 42 No 17 27 91 74 108 58 Agricultural extension service
0.624
Yes 41 66 48 39 89 48 No 21 34 75 61 96 52 Education 1.141
Never went to school 1 1.6 7 5.7 8 4.3 Primary school 27 43.5 70 56.9 97 52.4 Secondary school 29 46.8 46 37.4 75 40.5 Attended university 5 8.1 0 0 5 2.7 Source: Computed from the field survey data, 2011
From the Table 4.1 , the sample comprised of both male and female-headed households. For the
total households interviewed, the proportion of male headed households was 63 percent and that
of female headed households was 37 percent. Among the credit users, the number of female
headed households was lower than that of male headed households.The differences in terms of
gender among the two groups was statistically significant at 5 percent level of significance. The
implication is that male headed households had more access to credit from the formal financial
sources.
46
From Table 4.1 , the proportion of illiterate respondents (that is, those who never went to school)
for the whole sample was 4.3 percent, 1.6 percent for the credit users and 5.7 percent for non
credit users. The table further shows the proportion of farmers who attended primary school that
is about 52.4 percent, 43.5 and 56.9 percent for the whole sample, credit users and non-users
respectively. Also about 40.5 percent for the sample and 46.8 and 37.4 percent for credit user and
non-users respectively have attended secondary school. Proportion of respondents with
university education was higher among the credit users compared to the non credit users.
Generally the proportion of credit users that have higher levels of education is higher compared
to the non credit users significantly different at one percent level of significance as shown by the
Chi square test. This may implies that educated farmers have more experience to the external
environment and information which can facilitate them easily connect to credit sources.
The collected information on extension was about farming aspect and use of financial products
aspect. The number of respondents who received agricultural extension service was 48 percent. As
indicated in Table 4.1, out of the total respondents, among the credit users 66 percent received
agricultural extension service while among the non-users only 39 percent received agricultural
extension service. In general it can be seen that more credit users received advice from extension
services compared to the non credit users. The proportion of credit users who received extension
services was significantly higher compared to that of non credit users at 1 percent level of
significance. This implies that farmers who access extension service are more knowledgeable on
formal credit source and will have more opportunities to get agricultural credit.
47
Out of the total formal credit users 73 percent of household also participate in informal credit,
whereas among the non credit users only 26 percent participate in informal credit (Table 4.1).
This is implies that there was complementarily or dependence between formal credit and
informal credit; the proportional of household which accessed formal credit was higher among
informal credit users than their counterpart. The chi- square test also indicates that the proportion
of formal credit users who participate in informal credit was significantly higher compared to the
non credit users at 1 percent level of significance.
From table 4.1, among the users credit, only 26 percent had been keeping records whereas 74
percent did not. While among the non users credit 11 percent have been keeping records whereas
89 percent did not. Chi square test indicate the proportion of credit users who keep record was
significantly higher than the non credit users at 5 percent level of significance. This is an
assumed indicator that borrowers were more conscious about farm management. They had an
advantage accessing credit because they are required to provide finance historical records on
their enterprise when applying for loan in order to assess their credit worthiness.
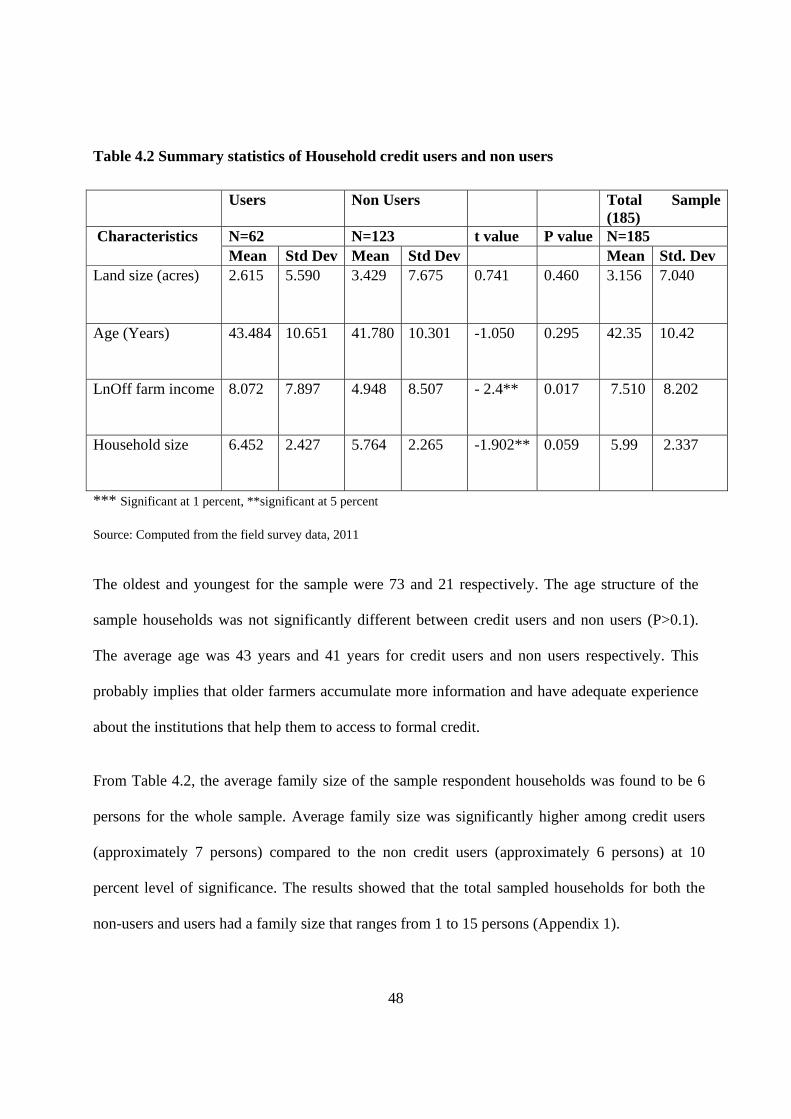
48
Table 4.2 Summary statistics of Household credit users and non users
*** Significant at 1 percent, **significant at 5 percent
Source: Computed from the field survey data, 2011
The oldest and youngest for the sample were 73 and 21 respectively. The age structure of the
sample households was not significantly different between credit users and non users (P>0.1).
The average age was 43 years and 41 years for credit users and non users respectively. This
probably implies that older farmers accumulate more information and have adequate experience
about the institutions that help them to access to formal credit.
From Table 4.2, the average family size of the sample respondent households was found to be 6
persons for the whole sample. Average family size was significantly higher among credit users
(approximately 7 persons) compared to the non credit users (approximately 6 persons) at 10
percent level of significance. The results showed that the total sampled households for both the
non-users and users had a family size that ranges from 1 to 15 persons (Appendix 1).
Users Non Users Total Sample (185)
Characteristics N=62 N=123 t value P value N=185 Mean Std Dev Mean Std Dev Mean Std. Dev
Land size (acres) 2.615 5.590 3.429 7.675 0.741 0.460 3.156 7.040
Age (Years) 43.484 10.651 41.780 10.301 -1.050 0.295 42.35 10.42
LnOff farm income 8.072 7.897 4.948 8.507 - 2.4** 0.017 7.510 8.202
Household size 6.452 2.427 5.764 2.265 -1.902** 0.059 5.99 2.337
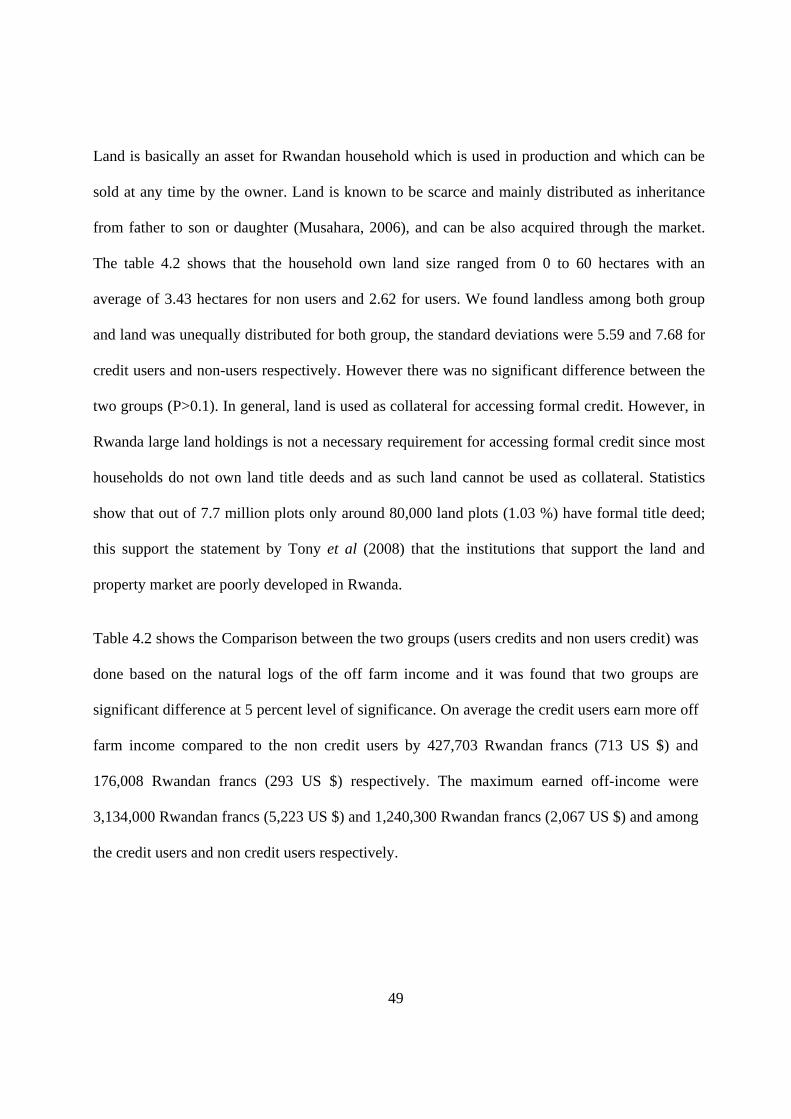
49
Land is basically an asset for Rwandan household which is used in production and which can be
sold at any time by the owner. Land is known to be scarce and mainly distributed as inheritance
from father to son or daughter (Musahara, 2006), and can be also acquired through the market.
The table 4.2 shows that the household own land size ranged from 0 to 60 hectares with an
average of 3.43 hectares for non users and 2.62 for users. We found landless among both group
and land was unequally distributed for both group, the standard deviations were 5.59 and 7.68 for
credit users and non-users respectively. However there was no significant difference between the
two groups (P>0.1). In general, land is used as collateral for accessing formal credit. However, in
Rwanda large land holdings is not a necessary requirement for accessing formal credit since most
households do not own land title deeds and as such land cannot be used as collateral. Statistics
show that out of 7.7 million plots only around 80,000 land plots (1.03 %) have formal title deed;
this support the statement by Tony et al (2008) that the institutions that support the land and
property market are poorly developed in Rwanda.
Table 4.2 shows the Comparison between the two groups (users credits and non users credit) was
done based on the natural logs of the off farm income and it was found that two groups are
significant difference at 5 percent level of significance. On average the credit users earn more off
farm income compared to the non credit users by 427,703 Rwandan francs (713 US $) and
176,008 Rwandan francs (293 US $) respectively. The maximum earned off-income were
3,134,000 Rwandan francs (5,223 US $) and 1,240,300 Rwandan francs (2,067 US $) and among
the credit users and non credit users respectively.
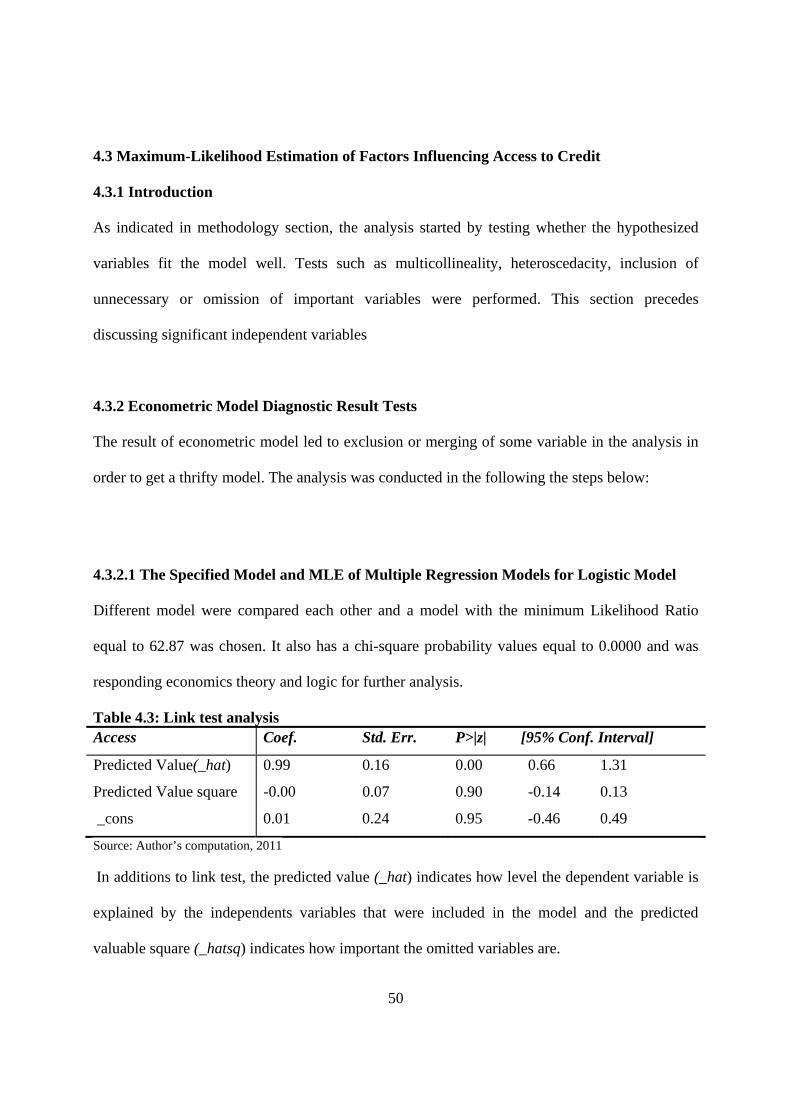
50
4.3 Maximum-Likelihood Estimation of Factors Influencing Access to Credit
4.3.1 Introduction
As indicated in methodology section, the analysis started by testing whether the hypothesized
variables fit the model well. Tests such as multicollineality, heteroscedacity, inclusion of
unnecessary or omission of important variables were performed. This section precedes
discussing significant independent variables
4.3.2 Econometric Model Diagnostic Result Tests
The result of econometric model led to exclusion or merging of some variable in the analysis in
order to get a thrifty model. The analysis was conducted in the following the steps below:
4.3.2.1 The Specified Model and MLE of Multiple Regression Models for Logistic Model
Different model were compared each other and a model with the minimum Likelihood Ratio
equal to 62.87 was chosen. It also has a chi-square probability values equal to 0.0000 and was
responding economics theory and logic for further analysis.
Table 4.3: Link test analysis Access Coef. Std. Err. P>|z| [95% Conf. Interval]
Predicted Value(_hat) 0.99 0.16 0.00 0.66 1.31
Predicted Value square -0.00 0.07 0.90 -0.14 0.13
_cons 0.01 0.24 0.95 -0.46 0.49
Source: Author’s computation, 2011
In additions to link test, the predicted value (_hat) indicates how level the dependent variable is
explained by the independents variables that were included in the model and the predicted
valuable square (_hatsq) indicates how important the omitted variables are.
51
From the Table 4.3 the coefficient of (_hat) was statistically significant at 1 percent while one of
(_hatsq) was not statistically significant even at 10 percent. Therefore, the two hypothesizes that
the models did not fit the data well and that some variable (s) might have been omitted were
rejected.
4.3.2.2 Test of Multicollineality
As indicated in Chapter 3, there are two measures that are often suggested to test the presence of
multicollinearity. These are: Variance Inflation Factor (VIF) for association among the continuous
explanatory variables and contingency coefficients for dummy variables Gujarati (2003). From
Table 4.4, as suggested by Kennedy (1985) and Gujarati (1995), the hypothesis that there was
high degree of association between the variables was rejected. The decision is based on the fact
that the high coefficient correlation was 0.20.
Table 4.4: Contingence Coefficients’ Estimate
KEE
PFA
RE
GEN
DH
H
EDU
CL
PAR
TIN
FIN
AG
REX
TSER
V
KEEPFARE 1.00
GENDHH -0.08 1.00EDUCL -0.00 -0.10 1.00PARTINFIN -0.20 0.19 0.01 1.00 AGREXTSERV 0.06 -0.09 0.08 -0.19 1.00Source: Author’s computation, 2011
Contingency coefficients were computed to check the existence of multicollinearity problem
among the discrete explanatory variables. The decision rule for contingency coefficients is that
when its value approaches 1, there is a problem of association between the discrete variables.

52
The negative sign shows the negative relationship between variables that is an increase in one
variable will cause a decrease in the other. From table 4.4 the hypothesis that there was high
degree of association among the discrete variables was rejected since the highest coefficient
correlation was 0.20.
Table 4.5: Variance inflation factor for continuous explanatory variables Variable VIF 1/VIF SIZEH 8.08 0.12 AGEHH 8.40 0.11 LNOFF-FARMI 1.40 0.71 LANDSIZE 1.21 0.82 Mean VIF 4.77 Source: Author’s computation, 2011
Table 4.5 shows the VIF for the continous variables included in the model. According Gujarati
(1995) presence of multicollinearity among variables is indicated by a VIF greater than 10. As
such the hypothesis of presence of mulicollinearity among the continuous variables was rejected.
Generally, the data was found to have no serious problem of multicollinearity.
4.3.2.3 Test of Heteroscedasticity
One of the assumptions in regression analysis is that the errors, ui have a common (constant)
variance 2σ . If the errors do not have a constant variance we say they are heteroscedastic
(Maddala, 1992). The problem in this study is minimized by choosing the best functional form
and also checks the result using statistic test. Based on the Breusch-Pagan and Cook-Weisberg
test which resulted to chi2 (1) = 0.12 that means fail to reject the null hypothesis, no
heteroscedasticity problem in the model.
Ho: Constant variance (homoscedasticity)
H1: Not constant variance (heteroscedasticity)
53
Therefore we concluded that there is no violation of the assumption of homoscedasticity; that is
the variance of the error term is constant.
4.3.3 Discussion of Significant Variables
Table 4.6 below presents the estimated results of the logistic model. The likelihood ratio test has
a Chi-square statistic equal to 62.87 with 9 degrees of freedom. The Log likelihood is equal to -
86.55. Therefore, the null hypothesis that the parameter estimates for the model are equal to zero
is rejected.
The results (Table 4.6) below give us the probability of household use of formal credit. The
maximum likelihood estimates of the logistic regression model show that participating in
informal credit, agricultural extension service, education and the off-farm income were important
significant explanatory variables.
From Table 4.6, the logit coefficients are function coefficients which do not correspond on
average partial effect and are interpreted in terms of changes in the logit index. The computation
of marginal effects allows getting changes in probability of an event as a consequence of unit
change in independent variable.

54
Table 4.6: Logit Regression of the Factors Influencing Access to Formal Credit
Maximum likelihood estimates Marginal effects
Variable Coef. Std. Err. P-value Coef. (dy/dx) Std. Err. P-value KEEPFARE 0.69 0.54 0.19 0.10 0.08 0.19 LANDSIZE -0.02 0.03 0.48 -0.00 0.00 0.48 AGEHH 0.01 0.02 0.39 0.00 0.00 0.39 GENDHH 0.05 0.41 0.89 0.00 0.06 0.89 SIZEH 0.04 0.09 0.60 0.00 0.01 0.60 EDUCL 0.98 0.35 0.00*** 0.14 0.04 0.00*** PARTINFIN -1.92 0.40 0.00*** -0.29 0.04 0.00*** AGREXTSERV 0.95 0.38 0.01*** 0.14 0.05 0.00*** LNOFF-FARMI 0.04 0.02 0.06* 0.00 0.00 0.05** CONST -3.01 1.11 0.00*** ***, **, * Represent level of significance at 1%, 5% and 10 %, respectively. Pseudo R2 0.2664 LR chi2(9) = 62.87 Prob > chi2 = 0.0000 Log likelihood = -86.552163
The result of this study as shown in Table 4.6 confirms the hypothesis that off-farm income
influenced positively the access to formal credit. The effect was significant at 5 percent. A unit
increase in the off farm income will increase the likelihood of the farmer to access formal credit by
4.6 percent. This finding suggest that farmer‘s financial endowment increases the probability of
formal credit use. The finding that households with higher levels financial endowments are more
likely to participate in formal credit than their counterparts suggests poor farmers can be
excluded from accessing formal credit perhaps because they lack appropriate collateral.
It is also apparent from the results that households which receive technical advice from
agriculture extension agents are more likely to use formal credit as shown by the positive and
statistically significant coefficient. The result in Table 4.6 shows that the probability of formal
credit use for those households who had accessed advice is higher by 14.5 percent compared to
those who do not access these services. This finding holds true if extension on use of modern
55
technology such as improved seeds, pesticide and fertilizers requires more capital in farming
enterprise.
We had hypothesized that participating in informal credit for a household disfavored access to
formal credit but the coefficient was negative and highly significant (at one percent). Therefore,
participating in informal credit was found positively associated to formal credit use. This
indicates that the probability of participating in formal credit is affected by participating or not in
informal credit. In particular, the results show that households which participated in informal
credit had a higher probability of participating also in formal credit than their counterparts. The
result also indicates that a household which does not use informal credit have a lower likelihood
of accessing formal credit by 29.2 percent. The finding may be due to the purpose that the two
different credit sources fulfill and or complement each other. It means that the policy of
transforming systematically informal finance organization to formal may increase access to
formal credit use.
Just as expected education level has a positive sign and is significant at 1 percent, implying that a
higher educated farmer is associated with a significantly higher chance of accessing a formal
credit. The result of marginal effect indicates that farmers with higher levels of education have
higher likelihood of accessing formal credit by 14.9 percent. This finding are supported by
Nguyen (2003) who holds that education is the most important factor affecting households’
credit activities. This may be due to the fact that educated farmers have a better understanding of
banking procedures and rules for acquiring and using formal banking financial product and
services.
56
CHAPTER FIVE
SUMMARY, CONCLUSION AND RECOMMENDATION
5.1 Summary and Conclusion
The purpose of this study was to provide an economic assessment of factors influencing
household access to credit in Rwamagana district, Rwanda. Secondary and primary data were
used. A total of 185 households were interviewed in May 2011. Primary data were collected
using structured questionnaires that were administered to the sample of households’ heads via
person-interviews. Data was analyzed using STATA 10 program and SPSS (Statistical program for
Social Sciences). The t-test and Chi-square test statistics were employed to compare credit user as
participant and non credit user as non participant farmer group with respect to the explanatory
variables hypothesized to influence access to credit. The binary logit model was used to estimate
factors which influenced household access to credit were discussed.
Out of 185 households interviewed households 64 (33 percent) of the sampled farm households
were credit users, whereas the remaining 121 (67 percent) were non-users. The logistic
regression analysis results show that among nine explanatory variables which were included in
the model namely off-farm income, agricultural extension service, education, Participating in
informal credit, gender of household, size of the household, size of the landholdings, age of
household and keeping farm records, only four variables (off-farm income, agricultural extension
service and education, Participating in informal credit) were statistically significant. The
remaining five variables (gender of household, size of the household ,size of the landholdings,
age of household and keeping farm records ) was less powerful in explaining the variation.
57
The maximum likelihood estimates of logistic regression model showed that off-farm income,
agricultural extension service, education and participating in informal credit were important
factors influencing smallholder farmers’ access to formal credit in the study area.
It was observed that household’s credit users and non users were significantly different. The
households’ formal credit users were mainly male headed than their counterparty. Users credit
(66 percent) received agriculture extension service more than non users credit (39 percent). The
majority (58%) of sampled household did not used credit at all, either formal or informal. About
73 percent among formal credit users participated also in informal. The household which
participated in formal credit were earning more off-farm income than their counterparts. The
average off-farm incomes were 427,703 Rwandan francs (713 US $) and 176,008 Rwandan
francs (293 US $) for participants and no-participant respectively and the two categories were
significantly different. Average household size was higher among the credit users compare to the
non credit users. The two groups were found significant different. The average household sizes
were 6.45 and 5.76 members for formal credit participants and no-participants respectively.
Binary Logit model was used to assess the factors influencing household participating in formal
credit use with the dependent variable taking the value of 1 for participant and 0 for no-
participant. From this study earning more off-farm income increased about 4.6 percent likelihood
of participating in formal credit. The results confirmed the Bradley (2005) finding; that
households experiencing an increase in income were more likely to use formal credit.
It was found that participating in informal credit increased the likelihood of participating in
formal credit. This indicates that there is compatibility between informal credit and formal credit
use since the participation in the first increased the probability to use the second. Therefore, the
58
hypothesis that the informal credit participation has the negative relationship with formal credit
use, the hypothesis was rejected.
The results of the logit model show that participating in agricultural extension services affect
positively and significantly to access to formal credit at one percent. The farmers who use
modern agricultural technologies are those who got more access to credit facility than does who
do not participate in agricultural extension services.
In addition it was found that education level of household affects access to formal credit
positively and it was significant at one percent probability level. It was observed that farmers
educated have more facilities accessing that formal credit. This result differs with Shah et al
(2008) who found that education level has a negative effect on credit participation which also
similar to Nguyen, (2007). Households heads possessing higher degrees were showing almost no
participation, because higher education may help head of households to easily find a paid job.
The hypothesis that the informal credit participation is negatively associated with formal credit
use was rejected since those farmers who participated in informal were also found to use formal
credit. Similarly, the hypothesis that access to credit is not determined mostly by household
socio-economic and institutional factors was also rejected for some variables (off-farm income,
agricultural extension service, participating in informal credit and education level of household)
which were significant in the logit model.
5.2 Major findings
Out of 185 samples of households interview, the study concluded that a total of 33 per cent of the
surveyed households were found to be users credit and 67 per cent were non users credit. In
59
addition, the descriptive statistics results showed that there were statistically significant
differences between users and non-users in Rwamagana District with respect to agricultural
extension service, education, gender, participating in informal credit and keeping farm records.
On the other hand, using Logit model the study shows that off-farm income, agricultural
extension service, participating in informal credit and education level of household were
statistically significant, that means they have influence on smallholder farmers access to credit.
Whereas gender of household, size of the household ,size of the landholdings, age of household
and keeping farm records were not statistically significant, that means they don’t have influence
on smallholder farmers access to credit .
5.3 Recommendations
The study recommends the following policies aimed at improving farmers’ access to formal
credit.
- Off –farm income was found to be one of important factors, which increase access to
credit use maybe because those Farmers who engage in off-farm activities earn more
income and are able to get formal credit. Hence, other than focusing on increasing
agricultural production only, the government should also emphasize on policies aimed at
increasing opportunities for off-farm activities. This can be enhanced through creation of
jobs and motivating self employment.
- Empirical results show that educated farmers have a higher likelihood of accessing credit.
The government and other development agencies should redouble efforts to improve
education levels at Rwamagana District since education enhances people to arrive at
60
more informed decisions about loans. Hence, the government and development agencies
need to invest more in educational efforts.
- Farmers who participate in agricultural extension services were found to be more likely
to access credit. This might be because of the fact that those farmers who have received
the extension service have developed the skills of using new agricultural technologies
that would increase access to credit use. In other words, encouraging farmers to
participate in the uptake of new technologies on regular basis would improve the
availability of loan to the farmers. Hence, the government agencies should promote
agricultural extension services geared towards increasing training to the farmers in
Rwamagana District.
- In addition, informal credit was more preferable and its use was found positively
associated to formal credit participation. This may be due to traditional functionality of
formal finance institutions which is not friendly to the current business environment.
Therefore, the policies in place regulating formal finance sector should be revised and be
made more appropriate for the smallholder farmers in Rwamagana District of Rwanda.
5.4 Future research
This study was limited to factors that determine smallholder farmer access to formal credit and
didn’t include the effect of risk attitude of the farmers on access to credit. It would be expected
that farmers who are risk averse are likely to shun from credit due to the fear of default. The
study combining formal and informal finance sector in their all aspects should establish the
exhaustive information on rural finance sector development need. These is a possible research
gap that may bridged by future researchers.
61
6. REFERENCES
Abedullah, Mahmood, N., Khalid1, M., and Kouser, S., (2009). “The role of agricultural credit in
the growth of livestock sector: a case study of faisalabad” Department of Agricultural
Economics, University of Agriculture, Faisalabad, Pakistan. 29(2): 81-84.
Adams, D., and Von Pischke, J., (1992). “Microenterprise Credit Programs: Déja vu”. World
Development , vol.20 ,no.10:1463-70.
Adegeye, A., and Dittoh, J., (1985). “Essentials of Agricultural Economics’’. Impact Publishers
Economics Nigeria, Limited, Ibadan.
Akerlof, G., (1970). “The Market for Lemons: Quality Uncertainty and the Market Mechanism’’.
Quarterly Journal of Economics. 84 (3): 488-500.
Aliou, D., & Zeller, M., (2001). “Access to Credit and its Impact on Welfare in Malawi”,
International Food Policy Research Institute, Washington, D.C
Aliou, D., (1999). “Determinants of Household Access to and Participation in Formal and
Informal Credit Markets in Malawi”: International Food Policy Research Institute.
Washington, D.C. U.S.A.
Arene, C., (1992). “ Loan Repayment and Technical Assistance among Smallholder Maize
Farmers in Nigeria”, African Review of Money Finance and Banking. A supplement of
Savings and Development Journal, Vol. 1. pp. 64-72.
Aryeetey,E., and Udry, C., (1997). “The Characteristics of the Informal Finance in Sub-Sahara”
Journal of African Economies, supplement to vol.6. number1.
Baker, J. (2000). “Evaluating the Impact of Development Projects on Poverty A Handbook for
Practitioners”. The World Bank Washington, D.C.
Beckman, T., and Forster, R., (1969). “Credit and Collection”, Mcgrawn Hill.
Besley, T., and Coate S., (1995). ‘’Group Lending, Repayment Incentives and Social Collateral”.
Journal of Development Economics 46
Binswanger, H., Khandker, S., and Rosenzweig, M., (1989). “How Infrastructure and Financial
Institutions Affect Agricultural Output and Investment in India.”Washington DC: World
Bank Working Paper No. 163. World Bank
Bizoza, A., Ortmann, G., and Lyne, M., (2007). “Determinants of the Potato Yield in Gikongoro
Province, Rwanda”, Africa Insight vol 37(1) April 2007
62
Bradley, T., (2005). “ Economic Decision-Making as a Function of Risk Tolerance: The Case of
Rwanda”. Andrew Young School of Policy Studies Department of Economics, Summer
2005 Internship Program., Georgia State University.
Briquette, (1999). “Better Practices in Agriculture Lending”, FAO
Buckley, G., (1997). “Microfinance in Africa: Is it either the Problem or the Solution?” World
Development 25(7).
Bhuiya, A., Mushtaque, C. and Syed, M., (2001). “ Micro-credit and Emotional Wellbeing:
Experience of Poor Rural Women from Matlab, Bangladesh”. World
Development, Vol. 29, No. 11, pp 1957-1966.
Buvinic, M., Sebstad, J., and Zeidenstein, S., (1979). “Credit for Rural Women: Some Facts and
Lessons”. International Center for Research on Women. Washington, DC.
Conning, J. and Udry, C., (2005). “Rural Financial Markets in Developing Countries”. Working
Papers 914. Economic Growth Center, Yale University.
Cochran, W., (1963). “Sampling Techniques”, 2nd Ed., New York: John Wiley and Sons, Inc.
Delgado, C., (1998). “Sources of growth in smallholder agriculture in sub-Saharan Africa: The
role of vertical integration of smallholders with processors and marketers of high value-
added items”. Paper presented at the inter-conference symposium of the international
Association of Agricultural Economists, Badplaas, South Africa, 10-16 August.
Demirgüç-Kunt, A., Beck, T., & Honohan, P., (2008). “Finance for All?: Policies and Pitfalls in
Expanding Access”. Washington, D.C.: The World Bank. Retrieved March 21, 2008,
from http://siteresources.worldbank.org/INTFINFORALL/Resources/4099583-
1194373512632/FFA_book.pdf
Department for International Development(DFID), (2010). “Access to Finance Rwanda
Programme ” Document, Kigali
Department for International Development, National Institute of Statistics of Rwanda, Fin
MarkTrust, National Bank of Rwanda, Africa Scope, Incisive Africa.,(2008). “FinScope
Rwanda 2008” Kigali, Rwanda.
Dey, J., (1980). “Gambian Women: Unequal Partners in Price Development Projects.” Journal of
Development Studies. 17(3): 109-122.
Dhawan, K., and Kahlon, A. , (1977). “Some Methodological Issues in Using Linear
Programming Technique in Agriculture”.
63
Diagne, A., (1999). “Determinants Of Household Access To And Participation In Formal And
Informal Credit Markets In Malawi”: International Food Policy Research Institute.
Washington, D.C. U.S.A.
Diagne, A., Zeller, M., and Sharma, M. (2000). “Empirical Measurements of Households' Access
To Credit And Credit Constraints In Developing Countries: Methodological Issues And
Evidence”, International Food Policy Research Institute. Washington, D.C. U.S.A.
Dixon, J., Tanyeri A., and Wattenbach, H., (2003). “Smallholders, Globarisation and Policy
Analysis Produced by: Agriculture and Consumer Protection:Framework for Analyzing
Impacts of Globalization on Smallholders”. FAO Corporation Reposition. Rome
Dorward, A., and Omamo S., (2009). “A Framework for Analyzing Institutions. In Dorward,
A.R.and S.W.Omamo(Eds).Institutional Economics Perspective on Africa Agricultural
Development (75-110) ”.International Food Policy Research Institute, Washington ,D.C
Eicher, C., and Rukuni, M., (1996). “Reflections on Agrarian Reform and Capacity Building in
South Africa”. Staff Paper No. 96-3, Department of Agricultural Economics, Michigan
State University, East Lansing.
Ellis, F., (1992). “Agricultural Policies in Developing Countries”. School of Development
Studies, University of East Angellia, Cambridge university press
Ephraim, N., Pamela, P., Judith, O., Kwaw, S. and Andam, E. K., (2009). “Lake Kivu Pilot
Learning Site Baseline study Socio-economic baseline study”. Report prepared by
International Food Policy Research Institute, Instituts des Sciences Agronomiques du
Rwanda (ISAR), Forum for Agricultural Research in Africa (FARA), Preliminary
Report Submitted to CIAT.
Eston, J., and Gersovitz, M., (1981). Debt with potential Repudiation: Theoretical and Emperical
Analysis. Review of Economic Studies. 48(2): 289-309.
Feder, Gershon, Lawrence J., Justin Y., and Xia- openg L., (1990). “The Relationship between
Credit and Productivity in Chinese Agriculture: A Microeconomic Model of
Disequilibrium.”American Journal of Agricultural Economics. Vol. 72(5): 1151-1157.
Fengxia, D., and Jing, L., and Allen, F., (2010). “Effects of Credit Constraints on Productivity
and Rural Household Income in China,”Center for Agricultural and Rural Development
(CARD) Publications 10-wp516, Center for Agricultural and Rural Development
(CARD) at Iowa State University.
64
Free on line dictionary, encyclopedia, undated. http://www.thefreeonlinedictionary .com/credit.
Fuentes, A., 1996, “The Use of Village Agents in Rural Credit Delivery,” The Journal of
Development Studies 33(2) December, pp. 5-22.
Gershon, F., Onchan, T., and Raparla, T., (1988). “Collateral, Guarantees and Rural Credit in
Developing Countries: evidence from Asia”, Agricultural Economics, Vol. 2.
Ghosh, P., and Mookherjee, D., (1999). “Credirt Rationning in Developing Countries”. An
overview of the Theory. Readings in the Theory of Economic Development. Chapter
11:383-401.
Gould, J., and Lazear, E., (2002). “Micro Economic Theory”. Sixth Edition, Richard D.
Irwin,INC.
Government of Rwanda. , (2002). “Economic Development and Poverty Reduction Strategy.
2003- 2007 ”. Government printers, Kigali-Rwanda.
Government of Rwanda. ,(2007). “Development Plan of Rwamagana District (2007-2011)”,
Eastern Province-Rwanda
Government of Rwanda, (2009). “Strategic Plan for the Transformation of Agriculture in
Rwanda – Phase II (PSTA II)” Final Report, Kigali-Rwanda.
Green, J., Kirkapatrick,C., and Murinde, V. ,(2006). “Policy Arena Finance for Small Enterprise
Growth and Poverty Reduction in Developing Countries” Journal of International
development .18, 1017-1030
Green, W., (1993). “Econometric Analysis”. Macmillan.
Greene, W., (2000). “Econometric Analysis”. Fourth Edition, Pretice Hall International, Inc.New
York
Gujarati, N., (1995). “Basic Econometrics”. Third Edition. McGraw-Hill Book Company, New
York. U.S.A.
Gujarati, N., (2003). “Basic econometrics”. Fourth Edition, McGraw Hill, New York.
Hashemi, S.,and Schuler, S., and Riley, A., (1997). “The Influence of Women’s changing Roles
and Status in Bangladesh’s Fertility Transition: Evidence from a Study of Credit
Programs and Contraceptive Use”, World Development 25(4), 563-576
Holcombe, S., (1995). “Managing to Empower: the Gramean Bank’s Experience of Poverty
Alleviation, London”: Zed Press.
65
Hosmer, D., and Lemeshew, S., (1989). “Applied Logistic Regression”. A Wiley-Inter science
Publication, New York.
Hulme, D., and Mosley, P., (1996). “Finance against Poverty” Vol. 2, London.
International Center for Soil Fertility and Agricultural Development (2007) “Roadmap
for the CATALIST Project to Strengthen Agricultural Input Markets in Rwanda”
www.ifdc.org, Muscle Shoals, Alabama 35662, U.S.A.
Jacobson, S., and Petrie. R., (2008). “Learning from Mistakes: What Do Inconsistent Choices
Over Risk Tell Us? ” Working Paper, Georgia State University.
Johnston, J. and Dinardo, J., (1997). “Econometrics Methods”. Fourth Edition. The McGraw-
Hill Companies, Inc, New York.
Johnston, Jr., and Morduch, J., (2007). “The unbanked: Evidence from Indonesia”. New York:
Financial Access Initiative.
Karlan, D., and Zinman, J., (2004). “Observing Unobservable: Identifying Information
Asymmetries with a Consumer Credit Field Experiment”. Princeton Economics
Department working Paper.
Khandker ,S., (1998). “Fighting Poverty With Microcredit: Experience in Bangladesh’’. World Bank: Washington DC. Kennedy, P., (1985). “A Guide to Econometrics.” Massachusetts Institute of Technology Press,
Cambridge, Massachusetts, USA
Kidane , A., (2003). “Impacts and Implications of Agricultural Credit Use on Gross Farm
Income in Southern Ethiopia” Department of Economics and Resource Management,
Norwegian University of Life Sciences, Norway.
Kiiza, B., and Pederson, G., (2001). “Rural Household Savings Mobilization: Empirical
Evidence from Uganda” Journal of African Economics, Vol. 10, No. 3. pp. 390�409.
Koustoyiannis, A., (1973). “Theory of Econometrics.” Macmillan Press Ltd.
Leagans J., (1979). “Adoption of Modern Agricultural Technology by Small farm Operators”.
Cornell international agricultural mimeograph no. 69, Cornell University, New York.
Machethe,C., Mollel, N., Ayisi, K., Mashatola, M., Anim, F., and Vanasche, F. (2004).
“Smallholder Irrigation and Agricultural Development in the Olifants River Basin of
Limpopo Province: Management Transfer, Productivity, Profitability and Food Security
Issues” Report to the Water Research Commission on the project entitled “Sustainable
Local Management of Smallholder Irrigation” South Africa.
66
Maddala, G., (1992). “Introduction to Econometrics.” Second Edition. Macmillan Publishing
Company, New York.
Maddala, G., (2001). “Introduction to Econometrics”. 3rd edition.Cambridge University Press.
Malimba, M., and Ganesan P., (2008). “Repayment Behaviour in Credit and Savings
Cooperative Societies Empirical and Theoretical Evidence from Rural Rwanda ” ,
Kigali Institute of Science and Technology, Kigali, Rwanda and VIT Business School,
VIT University, Vellore, India.
Malimba M., and Ganesan, P., (2010). “Financial Services Consumption Constraints: Empirical
evidence from Rwandan Rural Households” Journal of Financial Services Marketing
Vol. 15, 2, 136–159
Manig, W., (1996). “The Importance of the Informal Financial Market for Rural Development
Financing in Developing Countries: The example of Pakistan”. The Pakistan
Development Review, 35 (3): 229-239
Marge, S., (2003). “Banking Sector Development and Credit Constrained Households in
Estonia”.
Mayada, M., Richard M., & Nelson A., (1994). “Discrimination against Women in Formal
Credit Markets: Reality or Rhetoric”. World Development, Vol. 22, No. 7, pp 1073-
1082.
Malimba M., and Ganesan, P., (2010). “Financial Services Consumption Constraints: Empirical
evidence from Rwandan Rural Households” Journal of Financial Services Marketing
Vol. 15, 2, 136–159
Meehan, F., (2001). "Usage and Impact of Micro-Credit Provision: A case Study Based on the
Credit Operations of Dedebit Credit and Saving Institution (DECSI), Tigray Ethiopia," A
Paper Presented at the International Workshop on Dimensions of Microfinance Institutions
in Sub-Saharan Africa: Relevance of International Experience Mekelle University, Mekelle.
Ministry of Finance and Economic Planning (MINECOFIN), (2006). “Rwanda’s Poverty
Reduction Strategy Evaluation Report”, Republic of Rwanda, Kigali.
Ministry of Agriculture and Animal Resources (2009) “Strategic Plan for the Transformation of
Agriculture in Rwanda – Phase II (PSTA II), Final Report”, Republic of Rwanda,
Kigali.
67
Mohamed, K., (2003). “Access to Formal and Quasi-Formal Credit by Smallholder Farmers and
Artisanal Fishermen” Ministry of Agriculture, Natural Resources, Environment and
Cooperation, Zanzibar, Tanzania. Research Report No. 03.6
Mohieldin, S. and Write W., (2000). “Formal and Informal Credit Markets in Egypt”. Center for
Economic Policy Research and University of Nottingham.
Mohiuddin, Y., (1993). “Credit Worthiness of Poor Women. A Comparison of Som Minimalist
Credit Programmers in Asia: a Preliminary Analysis”. The Pakistan Development
Review. 34(4): 1199-1209. Tennessee, USA.
Mosley, P. and Hulme, D., (1998). “Micro enterprise Finance: is there a Conflict between
Growth and Poverty Alleviation?” World Development 26(5)
Moshar, A., (1966). “Getting Agriculture Moving: Essentials for Development and
Modernization”. New York, Praeger.
Musahara, H., (2006). “Improving Tenure Security for the Rural Poor .Rwanda – Country Case
Study” LEP Working Paper, prepared under contract with the Food and Agriculture
Organization of the United Nations (FAO).
Musebe, R., (1990). “An Analysis of Agricultural Credit Markets in Vihiga Division, Kakamega
District”.Masters dissertation, University of Nairobi.
Musebe, R., Oluoch.W., and Wangia C., (1993). “An Analysis of Agricultural Credit Market in
Vihiga Division of Kakamega District, Kenya,” East Africa Agriculture and Forestry
Journal, 58(3): 4.
Musyimi, J., (2010). “Assessing Credit Access by Beekeeping Farmers in Mwingi District”
Technical Repport prepared by Research Project Sponsored by the ASARECA funded
project entitled “Facilitating Collective Marketing Best Practices in Kenya and Uganda”.
National Bank of Rwanda(NBR), Annual report (2009).
National Bank of Rwanda(NBR), Annual report (2007).
National Bank of Rwanda(NBR), Annual report (2008).
Nguyen,V., (2003). “Effects of the Value of Assets on Farming Households’ Access to Credit in
Rural Vietnam: the case of Chau Thanh A district, Can Tho province”, M.A thesis,
Master thesis, The Vietnam-Netherlands Project, Ho Chi Minh City.
Nguyen, H., (2007), Access to credit and borrowing behaviour of Rural Households: Center for
Economic Reforms and Transformation Heriot-Watt University, Edinburgh, UK.

68
Nguyen,V., and Lensink,R., and Linh, L., (2008). “Determinants of Farming Households’
Access to Formal Credit in the Mekong Delta, Vietnam”Final report for NPT-Part B4-
Paper 9.
Njoku, J., (1997). “Determinants of Loan Repayment under the Special Emergency Loan
Scheme (SEALS) in Niger: a case study in Imo state”, African Review of Money
Finance and Banking, Vol. 1, pp. 39-51.
Oboh, V., and Kushwaha S., (2009). “Socio-economic Determinants of Farmers’ Loan Size in
Benue State, Nigeria” Department of Agricultural Economics, University of Agriculture,
Makurdi, Nigeria. Journal of Applied Sciences Research, 5(4): 354-358, 2009
Paul, M., James, D., Tom, P., and William, P., (2007). “Rwanda Financial Sector Development
Program, Rwanda’’
Pindyck, S., and Rubinfeld, L., (1981). “Econometric Models and Economic Forecasts,”2nd
Edition, McGraw-Hill Book Campany. New York.
Green, C., Prasad, S., and Murinde, V., (2005). “Company financing, capital structure and
ownership: a survey and implications for developing countries”. In Finance and
Development: Surveys of Theory,
Ravallion, M., (2001). “The Mystery of the Vanishing Benefits: An Introduction to Impact
Evaluation. ”The World Bank Economic Review 15(1): 115-140.
Republique du Rwanda. , (2008). “ Monographie du District de Rwamagana” Province de l’Est
Schereiner, M., and Nagarajan, G., (1997). “Predicting Creditworthiness: Evidence from
ASCRAs and ROSCAs in the Gambia”. Saving and Development, Quarterly review.
22(4): 399-413.
Sharma, M., and Zeller, M., (1997). “Repayment Performance in Group-Based Credit Programs
in Bangladesh: An Empirical Analysis”. Food Consumption and Nutrition Division,
International Food Policy Research Institute, Washington D. C., USA.
Shah, S., Hashmi, A.,and Bukhari, A.,(2008).“Determination of Credit Programme Participation
and Socioeconomic Characteristics of Beneficiaries: Evidence from Sargodha. ” The
Pakistan Institute of Development Economics, 2008, vol 47, issue 4.
Shimek, L., and Sengupta,R.,(2007) “Access to Credit’’ Economic Synopses short essays and
reports on the economic issues of the day. Federal Reserve Bank st Louis. Washington,
DC
69
Sisay, Y., (2008). “Determinants of Smallholder Farmers Access to Formal Credit: The case of
Metema Woreda, North Gondar, Ethiopia”, M.Sc. Thesis , Haramaya University
Stiglitz, J., and Weiss, A., (1981). “Credit Rationing in Markets with Imperfect information”,
American Economic Review 71 (3): 393–410.
Straton, H., 2007. “Access to Finance through Value Chains: Lessons from Rwanda SNV”
Rwanda, [email protected]
McSweeney, B., (1979). “Collection and Analysis of Data on Rural Women’s Time Use”.
Studies in Family Planning. 10(11/12): 379-383.
Tang, S., Zhengfei, G., and Songqing, J., (2010). “Formal and Informal Credit Markets and Rural
Credit Demand in China”, Selected Paper prepared for presentation at the Agricultural &
Applied Economics Association 2010 AAEA,CAES, & WAEA Joint Annual Meeting,
Denver, Colorado, July 25-27, 2010
Taslim, S., Iean R., and Donald, C., (2003). “Acceptance and Repayment of Agricultural Credit
in Lombok Indonesia – Farmers’ perspectives” School of NRSM, University of
Queensland, Gatton Campus, Australia. Faculty of Agriculture, University of Mataram,
Indonesia
Tefera, D., (2004). “Determinants of Smallholder Farmers Demand for no Form Credit: the case
of Falta Woreda”, Alemaya University, Ethiopia.
Tsehay, T., and Mengistu, B., (2002) “The Impact of Microfinance Services Among Poor
Women in Ethiopia,” Occasional Paper No. 6, Association of Ethiopian Microfinance
Institutions (AEMFI), Addis Ababa, Ethiopia.
Tony, O., Richard, K., and Ben, D., (2008). “Access to Housing Finance in Africa: Exploring the
Issues (No. 6) RWANDA”. Overview of the housing finance sector in Rwanda,
commissioned by the FinMark Trust with support from habitat for humanity.
United States Department of Agriculture, (2009). “Assessment of Local Production for School
Feeding in Rwanda” Foreign Agricultural Service, Office of Capacity Building &
Development, Washington, D.C.
Vasthoff, J., (1968) "Small Farm Credit and Development: Some Experience in East Africa with
Special Reference to Kenya," Welt Forum Verlog-Munchen, No 3, Germany.
Vogt, D., (1978). “Broadening to access credit.” Development Digest, 16: 25-32.
70
Wooldridge, J., (2000). “Limited Dependent Variable Models and Sample Selection
Corrections. In: Introductory Econometrics: A Modern Approach. South Western
College” Publishing, USA, pp. 529–569
World Bank., (2011). “The Rwanda Economic Update. Seed for higher growth”. Prepared by the
Poverty Reduction and Economic Management team at the World Bank Country Office
in Rwanda, under the leadership of Birgit Hansl, Senior Economist.
Zeller, M., (1994). “Determinants of Credit Rationing: A Study of Informal Lenders and Formal
Credit Groups in Madagascar”, World Development, Vol.22 No.12, pp.1895-1907.

71
7. APPENDICES
Appendix I: Continuous Variables used
No user User
Min Max Mean Std. Deviation
Min Max Mean Std. Deviation
Land size 0 60 3.428 7.674 0 41 2.615 5.589
LnOffarm income
-4.61 14.03 4.948 8.507 -4.61 14.96 8.072 7.896
Hhd age 21 66 41.78 10.301 25 73 43.48 10.651
Hhd size 1 14 5.7 2.25 3 15 6.39 2.41
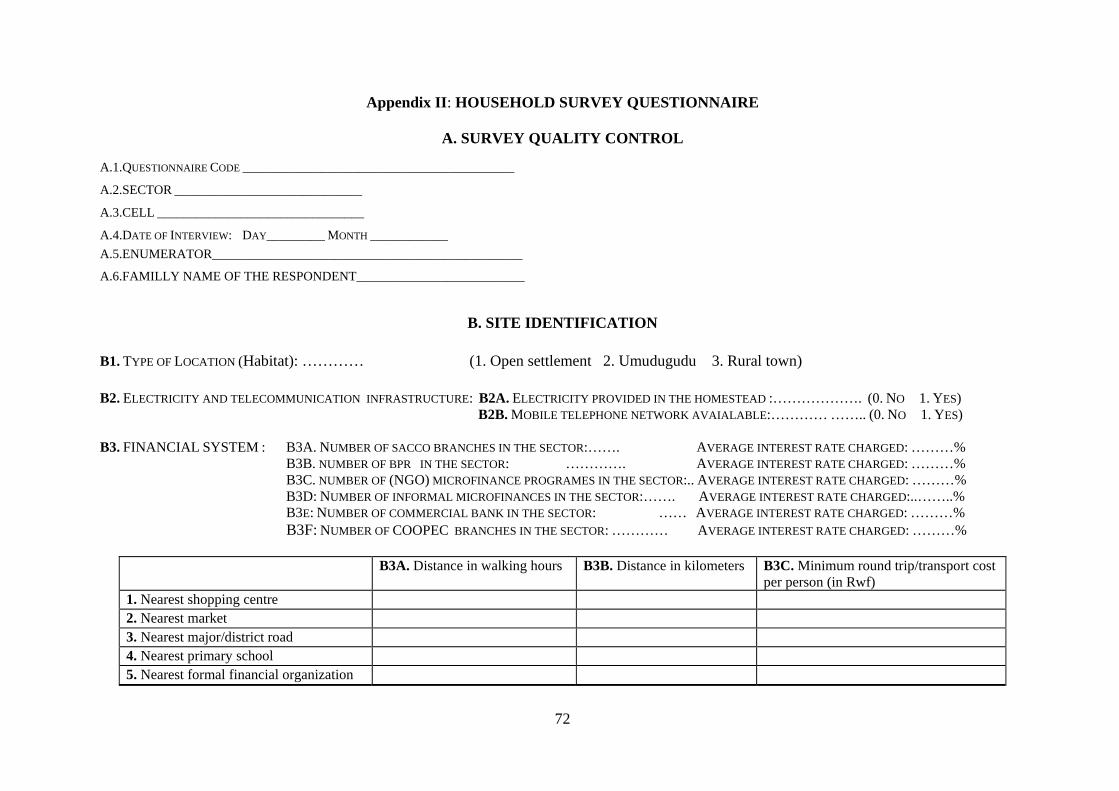
72
Appendix II: HOUSEHOLD SURVEY QUESTIONNAIRE
A. SURVEY QUALITY CONTROL
A.1.QUESTIONNAIRE CODE __________________________________________
A.2.SECTOR _____________________________
A.3.CELL ________________________________
A.4.DATE OF INTERVIEW: DAY_________ MONTH ____________ A.5.ENUMERATOR________________________________________________
A.6.FAMILLY NAME OF THE RESPONDENT__________________________
B. SITE IDENTIFICATION B1. TYPE OF LOCATION (Habitat): ………… (1. Open settlement 2. Umudugudu 3. Rural town) B2. ELECTRICITY AND TELECOMMUNICATION INFRASTRUCTURE: B2A. ELECTRICITY PROVIDED IN THE HOMESTEAD :………………. (0. NO 1. YES) B2B. MOBILE TELEPHONE NETWORK AVAIALABLE:………… …….. (0. NO 1. YES) B3. FINANCIAL SYSTEM : B3A. NUMBER OF SACCO BRANCHES IN THE SECTOR:……. AVERAGE INTEREST RATE CHARGED: ………% B3B. NUMBER OF BPR IN THE SECTOR: …………. AVERAGE INTEREST RATE CHARGED: ………% B3C. NUMBER OF (NGO) MICROFINANCE PROGRAMES IN THE SECTOR:.. AVERAGE INTEREST RATE CHARGED: ………% B3D: NUMBER OF INFORMAL MICROFINANCES IN THE SECTOR:……. AVERAGE INTEREST RATE CHARGED:..……..% B3E: NUMBER OF COMMERCIAL BANK IN THE SECTOR: …… AVERAGE INTEREST RATE CHARGED: ………% B3F: NUMBER OF COOPEC BRANCHES IN THE SECTOR: ………… AVERAGE INTEREST RATE CHARGED: ………%
B3A. Distance in walking hours B3B. Distance in kilometers B3C. Minimum round trip/transport cost per person (in Rwf)
1. Nearest shopping centre 2. Nearest market 3. Nearest major/district road 4. Nearest primary school 5. Nearest formal financial organization
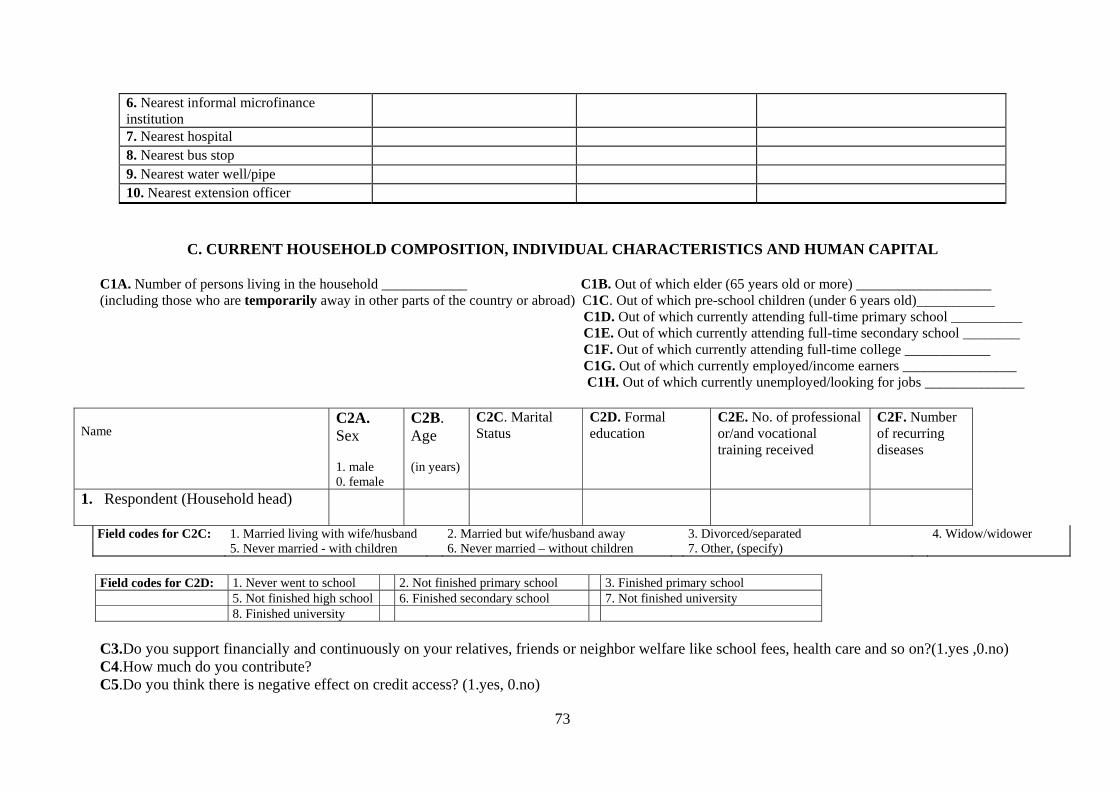
73
6. Nearest informal microfinance institution
7. Nearest hospital 8. Nearest bus stop 9. Nearest water well/pipe 10. Nearest extension officer
C. CURRENT HOUSEHOLD COMPOSITION, INDIVIDUAL CHARACTERISTICS AND HUMAN CAPITAL C1A. Number of persons living in the household ____________ C1B. Out of which elder (65 years old or more) ___________________ (including those who are temporarily away in other parts of the country or abroad) C1C. Out of which pre-school children (under 6 years old)___________ C1D. Out of which currently attending full-time primary school __________ C1E. Out of which currently attending full-time secondary school ________ C1F. Out of which currently attending full-time college ____________ C1G. Out of which currently employed/income earners ________________ C1H. Out of which currently unemployed/looking for jobs ______________
Name
C2A. Sex 1. male 0. female
C2B. Age (in years)
C2C. Marital Status
C2D. Formal education
C2E. No. of professional or/and vocational training received
C2F. Number of recurring diseases
1. Respondent (Household head)
Field codes for C2C: 1. Married living with wife/husband 2. Married but wife/husband away 3. Divorced/separated 4. Widow/widower 5. Never married - with children 6. Never married – without children 7. Other, (specify) Field codes for C2D: 1. Never went to school 2. Not finished primary school 3. Finished primary school 5. Not finished high school 6. Finished secondary school 7. Not finished university 8. Finished university C3.Do you support financially and continuously on your relatives, friends or neighbor welfare like school fees, health care and so on?(1.yes ,0.no) C4.How much do you contribute? C5.Do you think there is negative effect on credit access? (1.yes, 0.no)

74
D. EMPLOYMENT AND INCOMES
[Record only for the last 12 months, i.e. from April 2010 to April 2011]
D1. Main job (In terms of revenue) D2. Secondary job (In terms of revenue) D1A. sector of activity
D1B. Employment status
D1C. Experience in this job? Years
D1D. Net income from this job? Rwf
D1E. Distance to this work place. km
D2A. . Sector of activity
D2B. Employment status
D2C. Experience in this job? Years
D2D. Net income from this job? Rwf
D2E. Distance to this work place. km
Field codes for D1A and D2A: 1. Agriculture (1) 2. Non-agriculture (including processing of agricultural products) (2) Field codes for D1B and D2B: 1. Self Employment 2. Wage Employment D3. Other sources of incomes (unearned incomes) [Record only for the last 12 months, i.e. from April 2010 to April 2011]
D3A. Do you have any other source of income? 0. No 1. Yes
D3B. Rented out land and/or other properties
D3C. Relief (from government or NGOs programs)
D3D. Pension income
D3E. Remittances (sent from friends and relatives living elsewhere)
D3F. Others (Specify………………….)
D4. Income volumes
D4A. Total farm incomes (from D1D or D2D)
D4B. Did the household earn off-farm income? 1. Yes 0. No
D4C. Total nonfarm income Frw
D4D. Did the household receive unearned incomes? 1. Yes 0. No
D4E. Total unearned incomes Frw
D4F. Total household income
D4G. Did the HHH earn wage incomes? 1. Yes 0. No
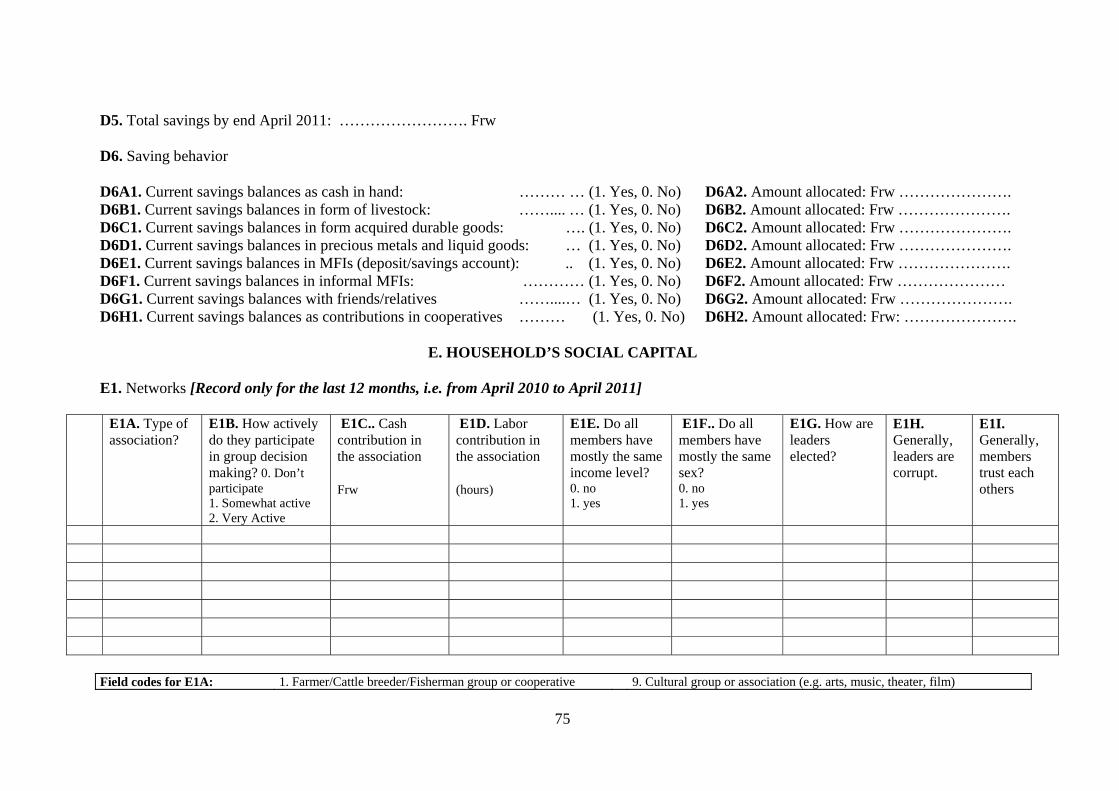
75
D5. Total savings by end April 2011: ……………………. Frw D6. Saving behavior D6A1. Current savings balances as cash in hand: ……… … (1. Yes, 0. No) D6A2. Amount allocated: Frw …………………. D6B1. Current savings balances in form of livestock: …….... … (1. Yes, 0. No) D6B2. Amount allocated: Frw …………………. D6C1. Current savings balances in form acquired durable goods: …. (1. Yes, 0. No) D6C2. Amount allocated: Frw …………………. D6D1. Current savings balances in precious metals and liquid goods: … (1. Yes, 0. No) D6D2. Amount allocated: Frw …………………. D6E1. Current savings balances in MFIs (deposit/savings account): .. (1. Yes, 0. No) D6E2. Amount allocated: Frw …………………. D6F1. Current savings balances in informal MFIs: ………… (1. Yes, 0. No) D6F2. Amount allocated: Frw ………………… D6G1. Current savings balances with friends/relatives ……....… (1. Yes, 0. No) D6G2. Amount allocated: Frw …………………. D6H1. Current savings balances as contributions in cooperatives ……… (1. Yes, 0. No) D6H2. Amount allocated: Frw: ………………….
E. HOUSEHOLD’S SOCIAL CAPITAL E1. Networks [Record only for the last 12 months, i.e. from April 2010 to April 2011]
E1A. Type of association?
E1B. How actively do they participate in group decision making? 0. Don’t participate 1. Somewhat active 2. Very Active
E1C.. Cash contribution in the association Frw
E1D. Labor contribution in the association (hours)
E1E. Do all members have mostly the same income level? 0. no 1. yes
E1F.. Do all members have mostly the same sex? 0. no 1. yes
E1G. How are leaders elected?
E1H. Generally, leaders are corrupt.
E1I. Generally, members trust each others
Field codes for E1A: 1. Farmer/Cattle breeder/Fisherman group or cooperative 9. Cultural group or association (e.g. arts, music, theater, film)
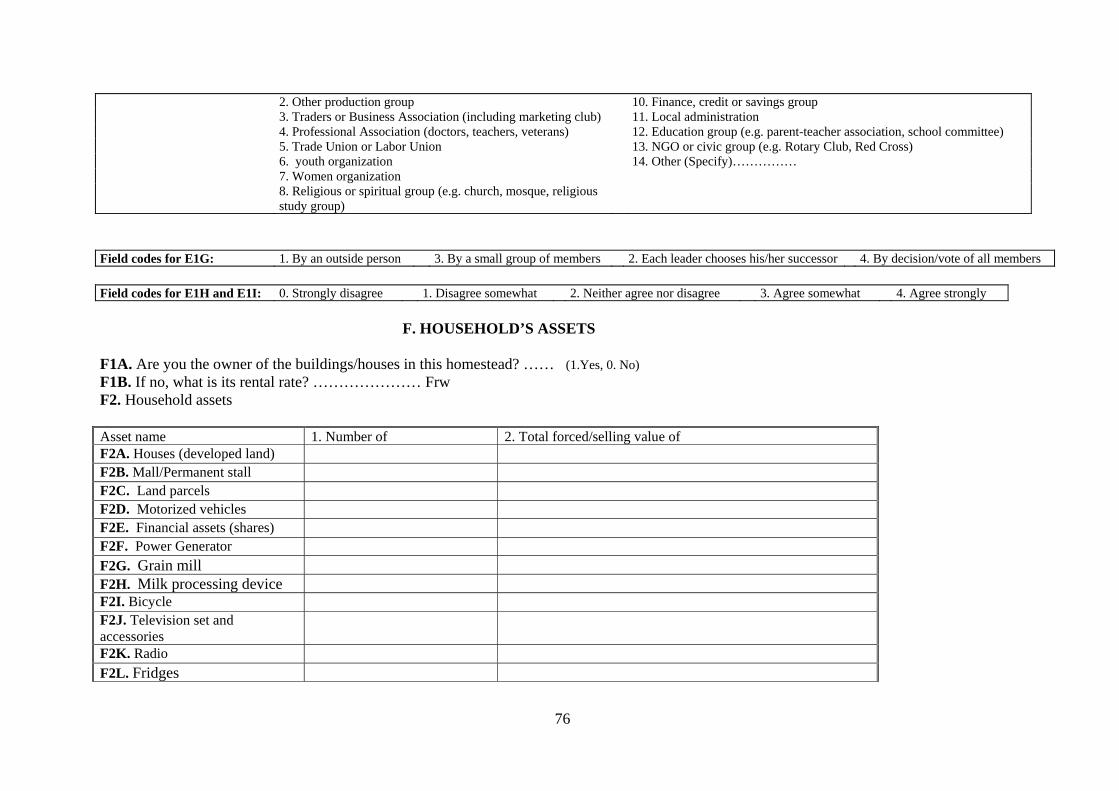
76
2. Other production group 10. Finance, credit or savings group 3. Traders or Business Association (including marketing club) 11. Local administration 4. Professional Association (doctors, teachers, veterans) 12. Education group (e.g. parent-teacher association, school committee) 5. Trade Union or Labor Union 13. NGO or civic group (e.g. Rotary Club, Red Cross) 6. youth organization 14. Other (Specify)…………… 7. Women organization 8. Religious or spiritual group (e.g. church, mosque, religious
study group)
Field codes for E1G: 1. By an outside person 3. By a small group of members 2. Each leader chooses his/her successor 4. By decision/vote of all members Field codes for E1H and E1I: 0. Strongly disagree 1. Disagree somewhat 2. Neither agree nor disagree 3. Agree somewhat 4. Agree strongly F. HOUSEHOLD’S ASSETS F1A. Are you the owner of the buildings/houses in this homestead? …… (1.Yes, 0. No) F1B. If no, what is its rental rate? ………………… Frw F2. Household assets Asset name 1. Number of 2. Total forced/selling value ofF2A. Houses (developed land) F2B. Mall/Permanent stall F2C. Land parcels F2D. Motorized vehicles F2E. Financial assets (shares) F2F. Power Generator F2G. Grain mill F2H. Milk processing device F2I. Bicycle F2J. Television set and accessories
F2K. Radio F2L. Fridges
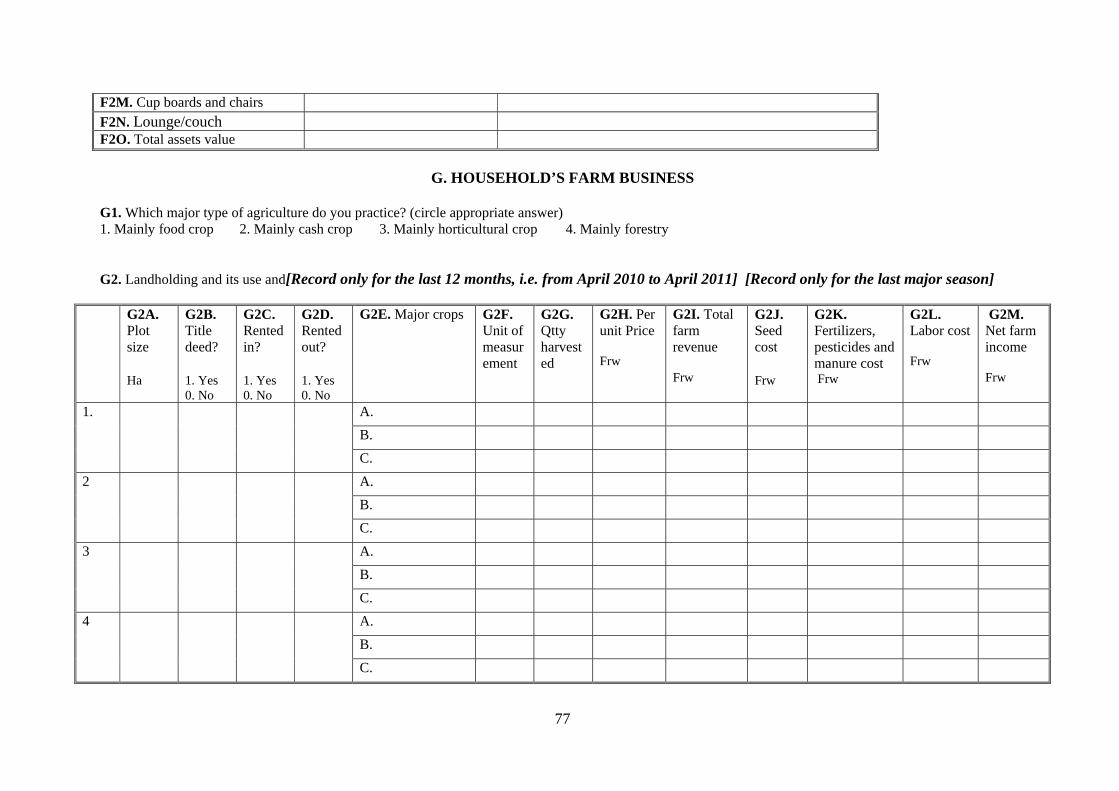
77
F2M. Cup boards and chairs F2N. Lounge/couch F2O. Total assets value
G. HOUSEHOLD’S FARM BUSINESS
G1. Which major type of agriculture do you practice? (circle appropriate answer) 1. Mainly food crop 2. Mainly cash crop 3. Mainly horticultural crop 4. Mainly forestry G2. Landholding and its use and[Record only for the last 12 months, i.e. from April 2010 to April 2011] [Record only for the last major season]
G2A. Plot size Ha
G2B. Title deed? 1. Yes 0. No
G2C. Rented in? 1. Yes 0. No
G2D. Rented out? 1. Yes 0. No
G2E. Major crops G2F. Unit of measurement
G2G. Qtty harvested
G2H. Per unit Price Frw
G2I. Total farm revenue Frw
G2J. Seed cost Frw
G2K. Fertilizers, pesticides and manure cost Frw
G2L. Labor cost Frw
G2M. Net farm income Frw
1. A. B. C.
2 A. B. C.
3 A. B. C.
4 A. B. C.
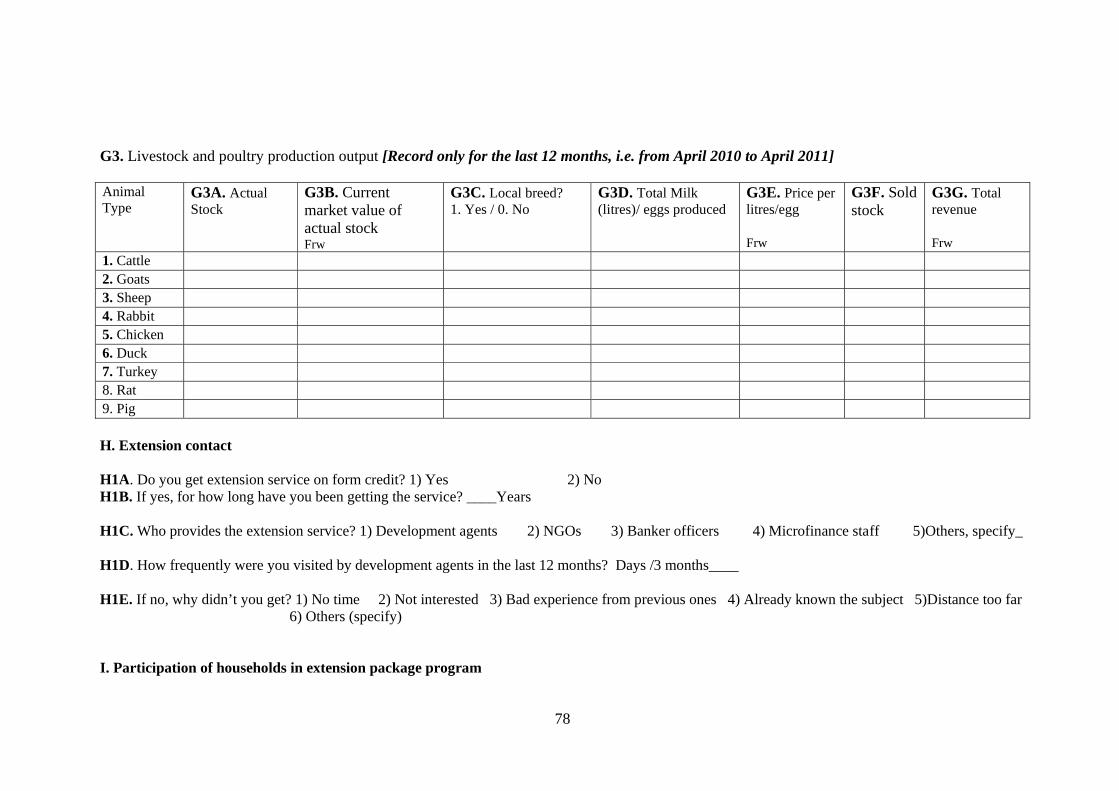
78
G3. Livestock and poultry production output [Record only for the last 12 months, i.e. from April 2010 to April 2011] Animal Type
G3A. Actual Stock
G3B. Current market value of actual stock Frw
G3C. Local breed? 1. Yes / 0. No
G3D. Total Milk (litres)/ eggs produced
G3E. Price per litres/egg Frw
G3F. Sold stock
G3G. Total revenue Frw
1. Cattle 2. Goats 3. Sheep 4. Rabbit 5. Chicken 6. Duck 7. Turkey 8. Rat 9. Pig H. Extension contact H1A. Do you get extension service on form credit? 1) Yes 2) No H1B. If yes, for how long have you been getting the service? ____Years H1C. Who provides the extension service? 1) Development agents 2) NGOs 3) Banker officers 4) Microfinance staff 5)Others, specify_ H1D. How frequently were you visited by development agents in the last 12 months? Days /3 months____ H1E. If no, why didn’t you get? 1) No time 2) Not interested 3) Bad experience from previous ones 4) Already known the subject 5)Distance too far 6) Others (specify) I. Participation of households in extension package program
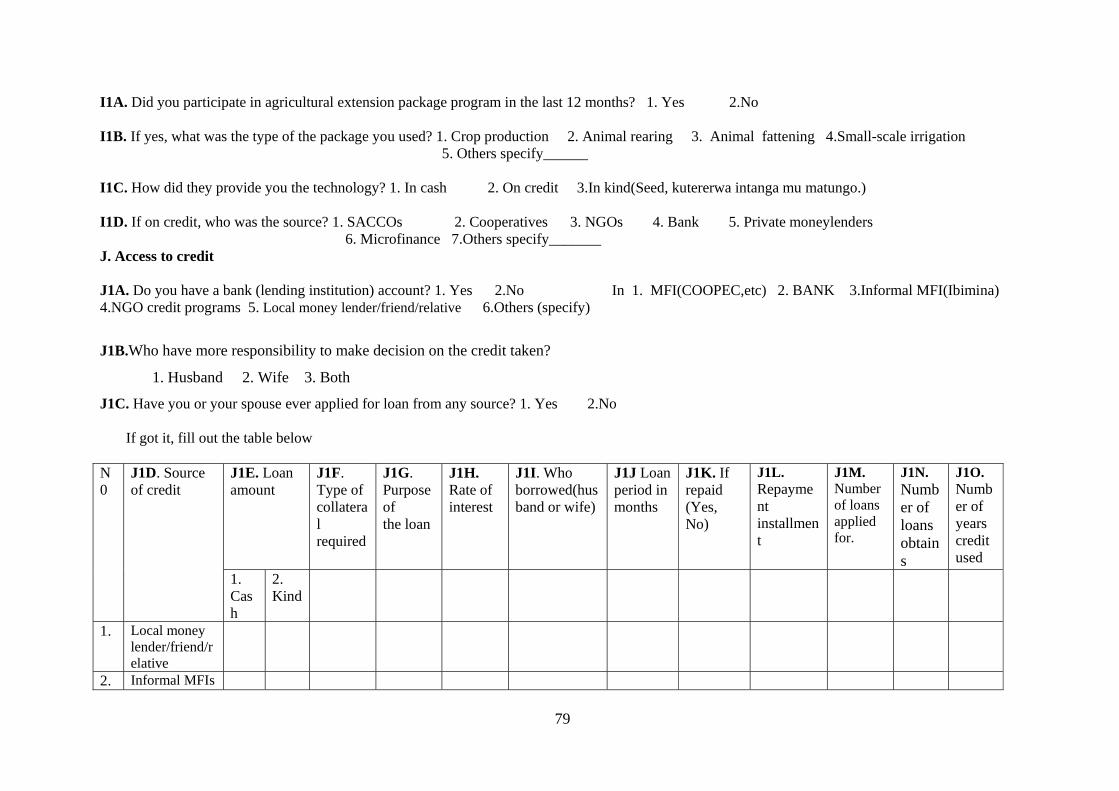
79
I1A. Did you participate in agricultural extension package program in the last 12 months? 1. Yes 2.No I1B. If yes, what was the type of the package you used? 1. Crop production 2. Animal rearing 3. Animal fattening 4.Small-scale irrigation 5. Others specify______ I1C. How did they provide you the technology? 1. In cash 2. On credit 3.In kind(Seed, kutererwa intanga mu matungo.) I1D. If on credit, who was the source? 1. SACCOs 2. Cooperatives 3. NGOs 4. Bank 5. Private moneylenders 6. Microfinance 7.Others specify_______ J. Access to credit J1A. Do you have a bank (lending institution) account? 1. Yes 2.No In 1. MFI(COOPEC,etc) 2. BANK 3.Informal MFI(Ibimina) 4.NGO credit programs 5. Local money lender/friend/relative 6.Others (specify)
J1B.Who have more responsibility to make decision on the credit taken?
1. Husband 2. Wife 3. Both
J1C. Have you or your spouse ever applied for loan from any source? 1. Yes 2.No If got it, fill out the table below
N0
J1D. Source of credit
J1E. Loan amount
J1F. Type of collateral required
J1G. Purpose of the loan
J1H. Rate of interest
J1I. Who borrowed(husband or wife)
J1J Loan period in months
J1K. If repaid (Yes, No)
J1L.Repayment installment
J1M. Number of loans applied for.
J1N.Number of loans obtains
J1O. Number of years credit used
1. Cash
2. Kind
1. Local money lender/friend/relative
2. Informal MFIs
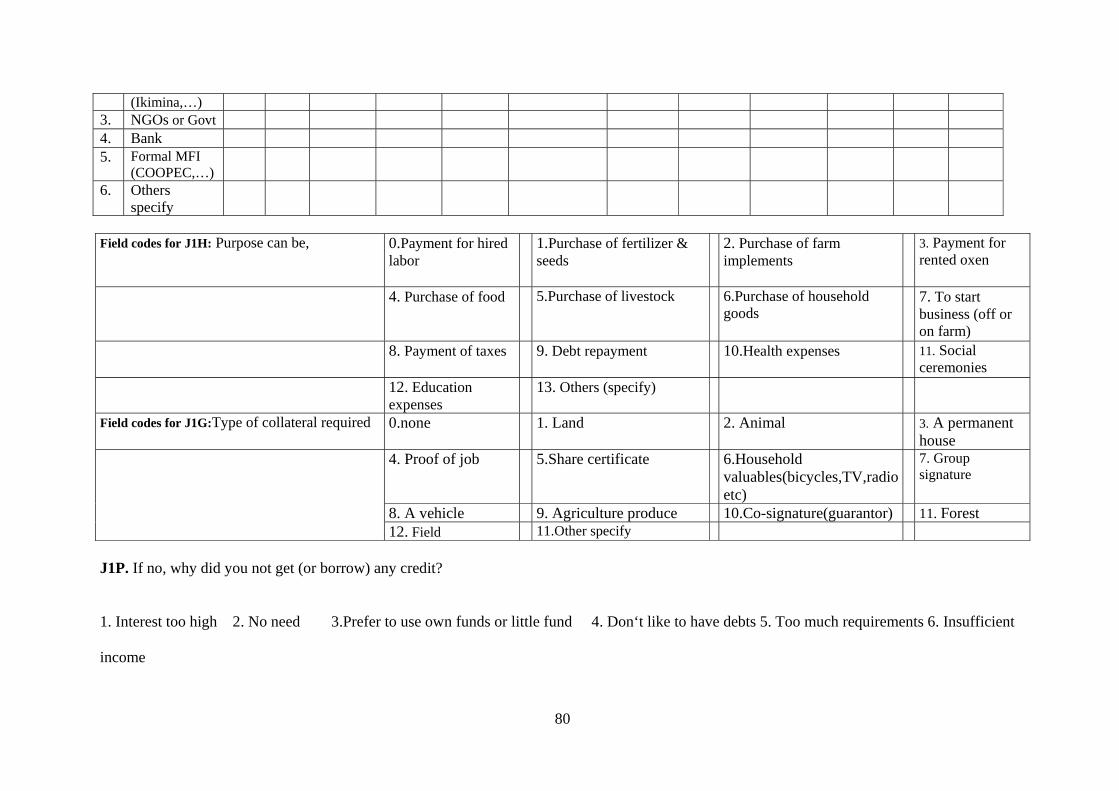
80
(Ikimina,…)3. NGOs or Govt 4. Bank 5. Formal MFI
(COOPEC,…)
6. Others specify
Field codes for J1H: Purpose can be, 0.Payment for hired
labor
1.Purchase of fertilizer & seeds
2. Purchase of farm implements
3. Payment for rented oxen
4. Purchase of food
5.Purchase of livestock 6.Purchase of household goods
7. To start business (off or on farm)
8. Payment of taxes
9. Debt repayment 10.Health expenses 11. Social ceremonies
12. Education expenses
13. Others (specify)
Field codes for J1G:Type of collateral required 0.none 1. Land 2. Animal 3. A permanent house
4. Proof of job 5.Share certificate 6.Household valuables(bicycles,TV,radio etc)
7. Group signature
8. A vehicle 9. Agriculture produce 10.Co-signature(guarantor) 11. Forest 12. Field 11.Other specify
J1P. If no, why did you not get (or borrow) any credit?
1. Interest too high 2. No need 3.Prefer to use own funds or little fund 4. Don‘t like to have debts 5. Too much requirements 6. Insufficient
income
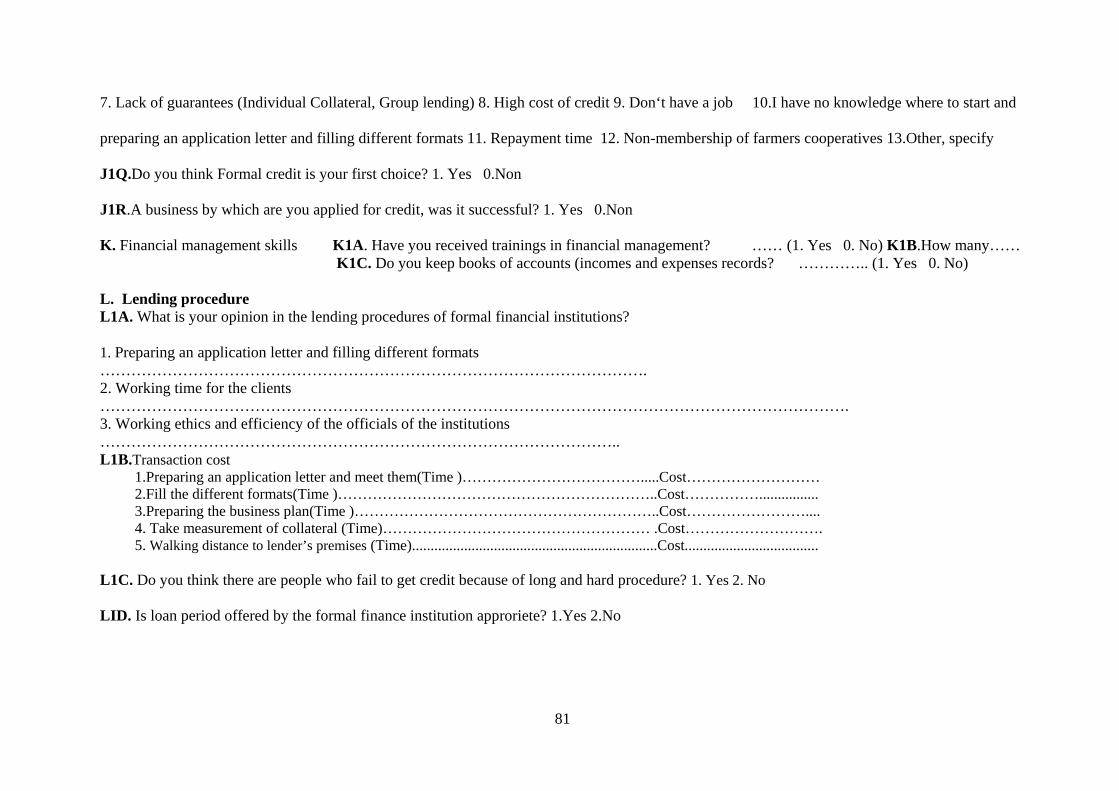
81
7. Lack of guarantees (Individual Collateral, Group lending) 8. High cost of credit 9. Don‘t have a job 10.I have no knowledge where to start and
preparing an application letter and filling different formats 11. Repayment time 12. Non-membership of farmers cooperatives 13.Other, specify
J1Q.Do you think Formal credit is your first choice? 1. Yes 0.Non J1R.A business by which are you applied for credit, was it successful? 1. Yes 0.Non K. Financial management skills K1A. Have you received trainings in financial management? …… (1. Yes 0. No) K1B.How many…… K1C. Do you keep books of accounts (incomes and expenses records? ………….. (1. Yes 0. No) L. Lending procedure L1A. What is your opinion in the lending procedures of formal financial institutions? 1. Preparing an application letter and filling different formats ……………………………………………………………………………………………. 2. Working time for the clients ………………………………………………………………………………………………………………………………. 3. Working ethics and efficiency of the officials of the institutions ……………………………………………………………………………………….. L1B.Transaction cost
1.Preparing an application letter and meet them(Time )……………………………….....Cost……………………… 2.Fill the different formats(Time )………………………………………………………..Cost……………................ 3.Preparing the business plan(Time )……………………………………………………..Cost…………………….... 4. Take measurement of collateral (Time)……………………………………………… .Cost………………………. 5. Walking distance to lender’s premises (Time)..................................................................Cost....................................
L1C. Do you think there are people who fail to get credit because of long and hard procedure? 1. Yes 2. No LID. Is loan period offered by the formal finance institution approriete? 1.Yes 2.No
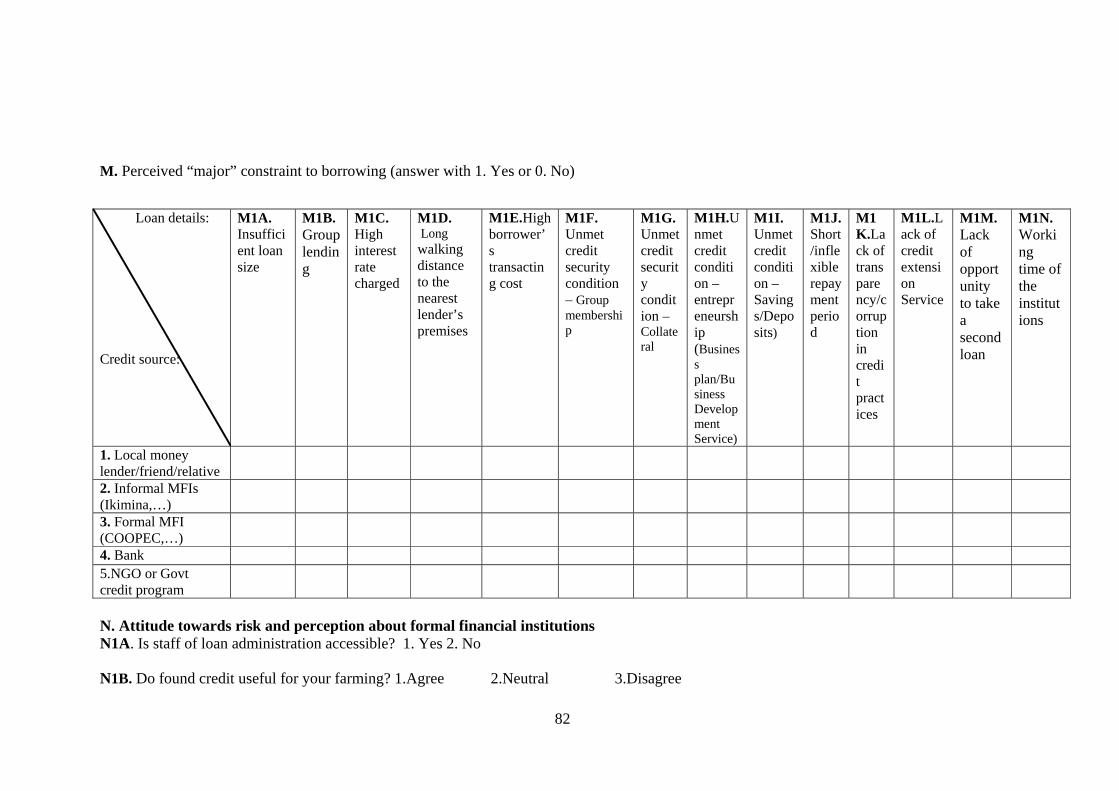
82
M. Perceived “major” constraint to borrowing (answer with 1. Yes or 0. No)
N. Attitude towards risk and perception about formal financial institutions N1A. Is staff of loan administration accessible? 1. Yes 2. No N1B. Do found credit useful for your farming? 1.Agree 2.Neutral 3.Disagree
Loan details: Credit source:
M1A. Insufficient loan size
M1B. Group lending
M1C.High interest rate charged
M1D. Long walking distance to the nearest lender’s premises
M1E.High borrower’s transacting cost
M1F. Unmet credit security condition – Group membership
M1G. Unmet credit security condition – Collateral
M1H.Unmet credit condition – entrepreneurship (Business plan/Business Development Service)
M1I. Unmet credit condition – Savings/Deposits)
M1J. Short/inflexible repayment period
M1K.Lack of transparency/corruption in credit practices
M1L.Lack of credit extension Service
M1M. Lack of opportunity to take a second loan
M1N. Working time of the institutions
1. Local money lender/friend/relative
2. Informal MFIs (Ikimina,…)
3. Formal MFI (COOPEC,…)
4. Bank 5.NGO or Govt credit program
83
N1C. If disagree, what is your bad experience on credit? ............................................................................ N1D.How do you get information from lending institution?…………………………………………………………