Embed Size (px)
Citation preview
2
An Economic Partnership for Twenty-fi rst Century Asia
Devesh Kapur and Rohit Lamba
As the two largest democratic Asian countries with economies that are complementary, Japan and India’s economic engagement has been rela-tively limited. In this chapter, we fi rst discuss the principal dimensions of their economic relationship, focusing on trade, aid, investment, and fi nancial fl ows. We then analyse why Japanese foreign direct invest-ment (FDI) in India has been modest. Subsequently we examine areas in which the economic relationship has the greatest potential—FDI in urban infrastructure and railways, trade, labour, capital fl ows, and education. Finally, we examine how Japanese investment and aid can address India’s infrastructural weaknesses to pave the way for Japanese fi rms to make India a manufacturing hub for their operations, and how Indian fi rms can leverage their comparative advantage in infor-mation technology (IT) services to serve customers in Japan, and more broadly how the two countries can collaborate to better develop India’s human capital in order to address the needs of both countries.
Th ere are few major economies in the world with as little historical baggage between them as India and Japan. Th e spread of Buddhism

An Economic Partnership for Twenty-fi rst Century Asia 69
in Japan led the land of its origin to be christened Tenjiku, an ancient name for the Indian subcontinent defi ned as the land far away where dharma was fi rst preached and practised. 1 But, reeling under colonial rule, India could not gain much from the rapid strides made by Japan under the Meiji restoration of the late nineteenth century. Following India’s independence in 1947, its import-substitution industrializa-tion (ISI) economic model meant that trade and foreign investment played little role in the country’s development, which further limited economic engagement with Japan.
Instead, for more than half a century, foreign aid played a key role in Japan’s engagement with India. Japanese aid to India com-menced in 1958 and has been mainly in the form of yen loans (95 per cent of Japan’s offi cial development assistance [ODA] to India is in yen loans). 2 However, the lack of strategic convergence and grow-ing Japanese interest in Southeast Asia from the 1970s and in China from the 1980s resulted in weak economic and diplomatic relations between the two countries. Th e nadir was in 1998 when, following India’s nuclear tests Japan suspended its aid programme. However, matters began to change considerably from the early 2000s, and since 2003 India has been the largest recipient of Japanese ODA, which averaged about US$2.6 billion annually between 2008 and 2012. 3
Commercially, while there were a number of joint ventures between Japanese and Indian fi rms, it was not until the early 1980s, when Suzuki invested in a joint venture with the Indian govern-ment in what would become India’s largest automobile company (Maruti)—unlocking the car ownership aspirations of India’s middle class—that an iconic Japanese investment took root in India. Unforeseen cultural links formed as well, such as Tamil movie star Rajinikanth’s popularity in Japan and children in India growing up watching dubbed versions of Japanese animated series. Nonetheless, the economic relationship between the two countries continued to be anaemic. In the 2000s, even as South Korean fi rms invested heavily in India’s white goods sector, risk-averse Japanese fi rms stayed away, ceding ground to the competition.
Th e modest economic links are striking both on economic logic and political grounds. Japan is a capital-rich country with an ageing and declining population. India is a capital-poor country poised to reap a major demographic dividend in the next few decades. Japan has

70 Poised for Partnership
long had a comparative advantage in manufacturing while India has developed a comparative advantage in services. However, as Japanese companies looked for newer pastures to graze their manufacturing aspirations, their destinations were inevitably in East Asia (especially China and South Korea) and Southeast Asia (particularly Indonesia and Th ailand).
Additionally, unlike other East and Southeast Asian countries, Japan has no historical baggage with India. Th e legacies of Japanese colonialism and WWII are bitterly contested, especially in China and South Korea, and periodically erupt in tensions between those countries and Japan. Indeed, rather than waning, if anything this historical legacy has become a bigger issue over time. In contrast, there is no such historical baggage between Japan and India and few major countries enjoy as much consensus across the Indian political spectrum as Japan.
Th e good news, however, is that despite the lost decades, these favourable fundamentals still exist. A growing rapport between the national leadership of the two countries and, especially, changes in the strategic environment in Asia are adding impetus to a deeper eco-nomic relationship between the two countries. In a survey of overseas business operations of Japanese manufacturing companies done by the Japan Bank for International Cooperation (JBIC) in 2014, India was ranked second on the list of promising countries/regions for the medium term and ranked fi rst for the long term (Table 2.1). 4
In this chapter, we fi rst lay out the complementary nature of the two economies, characterized by demography and capital. Next, the chapter discusses the recent history of economic interaction between Japan and India, a history marked by missed opportunities. After that, the chapter switches gear and examines the way forward, focusing on a series of sectors that present opportunities for the two countries to deepen their economic engagement, particularly urban infrastructure and railways in India and labour mobility for Indian workers—especially in services—to work in Japan. We then report on the experience of Japan Plus, a team set up by the Government of India exclusively to attract and facilitate Japanese investments. We conclude by examining some other key features of the 2014 Tokyo Declaration between Prime Ministers Narendra Modi and Shinzo Abe, as well as the salience of the Japan–India

An Economic Partnership for Twenty-fi rst Century Asia 71
economic relationship against the backdrop of a changing geopo-litical environment.
Complementary Economies
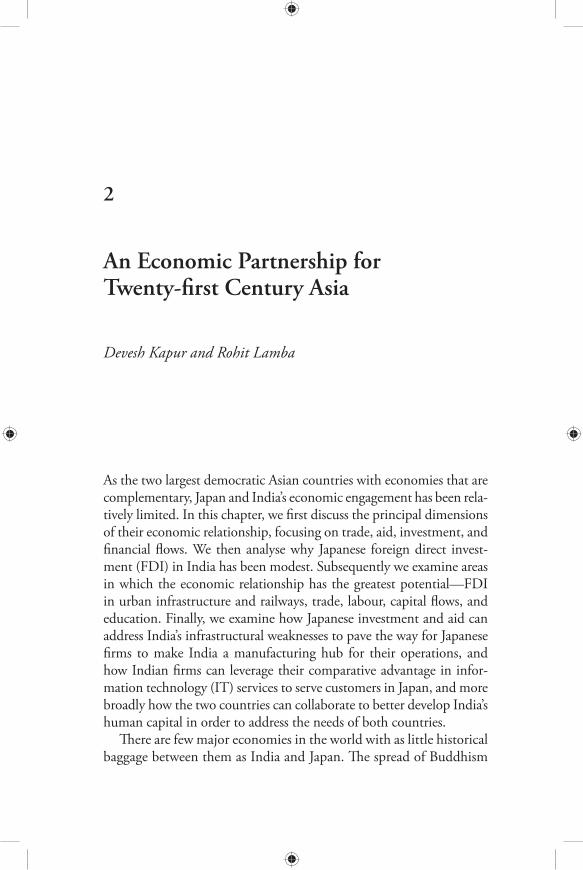
With regard to factors of production, India and Japan have com-plementary strengths that provide a strong basis for an economic partnership. Most Asian countries that grew rapidly after the Second World War were aided by favourable demographics, namely, a declin-ing dependency ratio—the ratio of the number of people not in the labour force to the number of people in the labour force—and an expanding and young labour force that underpinned the big push towards industrialization. Figure 2.1 illustrates this trend. Th e ‘take-off period’ for Korea (1970) and for China (1980) is also when this ‘demographic dividend’ starts to kick in. Today, India is the anvil of a similarly favourable demographic moment.
Since investment is a key driver of economic growth, gross capital formation—which delineates the fraction of new value added directed towards investment rather than consumption—is a good indicator of future growth. Figure 2.2 illustrates how India has lagged behind
Table 2.1 Most Promising Countries for Overseas Business for Japanese Manufacturing Companies
Medium Term Long Term
1 Indonesia India 2 India China 3 Th ailand Indonesia 4 China Brazil 5 Vietnam Th ailand 6 Brazil Vietnam 7 Mexico Myanmar 8 Myanmar Russia
Source : JBIC, ‘Survey Report on Overseas Business Operations by Japanese Manufacturing Companies’, 2014, retrieved from https://www.jbic.go.jp/wp-content/uploads/press_en/2014/11/32994/20141128English1.pdf on 2 September 2015.
72 Poised for Partnership
75
70
65
60
55
50
1950
1960
1970
1980
1990
2000
2010
2020
2030
2040
India
Japan
China
United States of America
Republic of Korea
Figure 2.1 Percentage of Population That Is of Working Age (15–64) in Selected Countries, 1950–2040 Source : UN Statistics Division Demographic Yearbooks (http://unstats.un.org/unsd/demographic/) and authors’ estimates.
China and Korea over the last half-century. Note that the fi gure does not capture the fact that this diff erence is compounded annually. But this also means that there is considerable room for ramping up capital formation in India.
India requires large amounts of capital investment to strengthen infrastructure, reinvigorate manufacturing, and sustain its burgeon-ing urbanization. Th e erstwhile Planning Commission of India—until recently in charge of setting economic priorities for the Indian government through centralized plans every fi ve years—had set a target of close to 40 per cent gross capital formation for the 12th Five

An Economic Partnership for Twenty-fi rst Century Asia 73
Year Plan (2012–17). 5 For India to achieve this target, it will need to increase savings (both public and private) as well as attract large capital infl ows from overseas.
Japan is a capital-rich country whose high labour costs have led Japanese fi rms to look towards China, Korea, Indonesia, and other ASEAN countries for the labour-intensive parts of their supply chains. Th e success of South Korea and China has meant that while the former has long crossed the low-cost manufacturing frontier, China is getting close to the low-cost frontier even as India is still quite far from it.
Japan faces two singular economic challenges in the fi rst half of the twenty-fi rst century: an ageing population (Figure 2.3) and high and rising government debt (Figure 2.4). Both are, of course, interconnected. While fertility rates invariably decline as per capita incomes rise, in Japan the eff ect has been particularly pronounced, in part because of the lack of immigration into Japan, in contrast to many European countries or the United States. Japan’s public debt has mounted due to sharp increases in government spending to stimulate the economy to counter the economic stagnation of the
60
50
40
30
20
10
0
1960
1962
1964
1966
1968
1970
1972
1974
1976
1978
1980
1982
1984
1986
1988
1990
1992
1994
1996
1998
2000
2002
2004
2006
2008
2010
2012
India KoreaChina
Figure 2.2 Gross Capital Formation (Per Cent of GDP) in India, China, and Korea, 1960–2012 Source : World Bank database (http://data.worldbank.org/).

74 Poised for Partnership
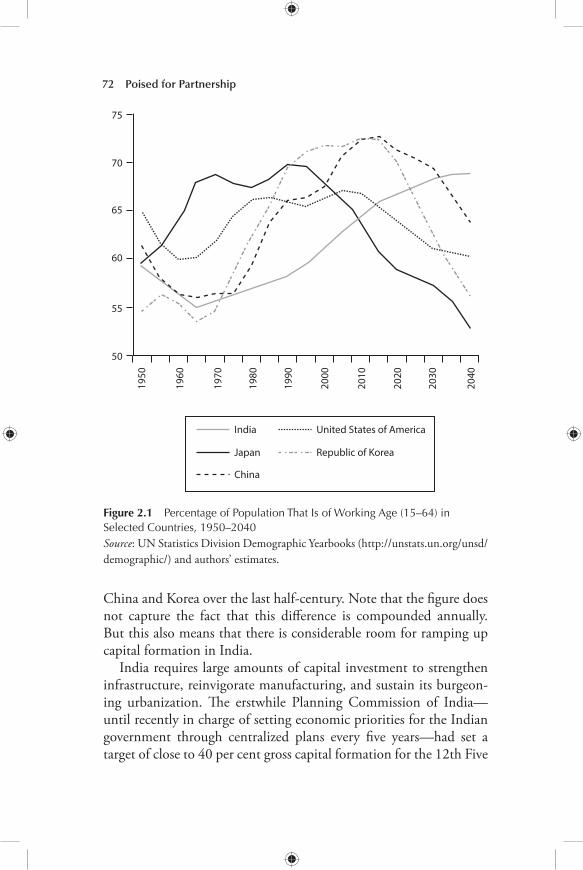
1990s. By 2013, the gross debt to gross domestic product (GDP) ratio stood at 240 per cent. Even after cancelling cross-ownership of this debt within the government, the fi gure stood at 135 per cent. Th e only way such high levels of debt have been sustainable is that the debt is largely domestically owned.
Managing public expenditures for an ageing population and keep-ing public debt within reasonable limits simultaneously is going to be a major challenge for Japan. Raising taxes will be politically unpopu-lar (and may further stymie growth), and printing more money can be dangerous. Th e solutions lie (at least partly) in some combination
25
20
35
30
40
15
10
5
0
1950
1955
1960
1965
1975
1985
1995
1970
1980
1990
2000
2005
2015
2025
2035
2010
2020
2030
2040
India
Japan
China
United States of America
Republic of Korea
Figure 2.3 Percentage of Population That Is of Old Age (65 and Above) in Selected Countries, 1950–2040 Source : UN Statistics Division, Demographic Yearbooks (http://unstats.un.org/unsd/demographic/) and authors’ estimates.
An Economic Partnership for Twenty-fi rst Century Asia 75
of: ( a ) seeking growth in emerging markets; ( b ) investing capital and pensions smartly; and ( c ) hiring cheap services.
Enter India.
A History of Missed Opportunities: Trade, FDI, and Capital Markets
Th e weakness of trade and investment between India and Japan poses a puzzle in political economy. While Japan’s massive invest-ments in the United States are understandable in the geopolitical scenario of the second half of the twentieth century, the breadth and depth of Japan’s investments in China, a country with whom it has a heavy historical burden, were driven by strategic and commercial factors. Th e marriage between Japanese fi rms and Chinese labour and access to the world’s fastest-growing market was a seemingly natural partnership, and its mutual benefi ts were meant to soothe the painful memories of the past. But instead of mutual reinforcement, the strategic and commercial goals have undermined each other, as the cumulative eff ect of the thousands of investment decisions has
100
150
200
250
2005 2006 2007 2008 2009 2010 2011 2012
50
0
Japan United States of America Germany
Figure 2.4 Central Government Debt to GDP Ratio in Japan, the US, and Germany, 2005–12 Source : World Bank database (http://data.worldbank.org/).

76 Poised for Partnership
been to nurture Japan’s most formidable strategic competitor in the twenty-fi rst century.
In contrast, trade and investment between India and Japan has been quite low (Figure 2.5). Total trade between the two countries (exports and imports) forms around 2 per cent of India’s total trade and less than 1 per cent of Japan’s.
Overseas FDI has become an important part of the Japanese economy since the early 1990s. In 2013, Japan was the second largest source of outward FDI (investing $136 billion), with large investments in the automotive sector, followed closely by machinery, metals, electronics, and fi nancial services. 6
Despite a big investment by Suzuki during the 1980s, from a global perspective Japanese investment in India has been modest (Figure 2.6). Th ere are several reasons for this prolonged hiatus. An annual survey conducted over the last few years by JBIC amongst Japanese fi rms has repeatedly pointed out underdeveloped infrastruc-ture, an unclear legal system, labour problems, and a complicated tax system as some of the major hurdles of doing business in India. Th ese concerns are shared by most overseas investors and indeed by Indian business as well.
20,000.0018,000.0016,000.0014,000.0012,000.0010,000.00
8,000.006,000.004,000.002,000.00
0.00 0
54.543.532.521.5
10.5
2009–10 2010–11 2011–12 2012–13 2013–2014
IMPORT EXPORT %Share INDIA Trade %Share JAPAN Trade
Figure 2.5 Indian Trade with Japan, 2009–10 to 2013–14 Source : Ministry of Commerce and Industry (MoCI), India (Export and Import Databank), and the World Trade Organization database (http://stat.wto.org/).

An Economic Partnership for Twenty-fi rst Century Asia 77
A closer look at the Indian side of the data reveals that Japan has actually been doing fairly well compared to other FDI source countries (see Table 2.2), which suggests that the constraints inhibit-ing direct investment for Japan are the general ones faced by most countries with respect to investing in India. (However, a caveat is in order since many US and European fi rms reroute their investments through Mauritius for tax reasons.)
It is important to note that the same is not true for trade, which as pointed out earlier has been modest from the perspective of both countries. As a correlation exercise, this seems to be driven by Japanese trade patterns: in comparison to India, for Japan the main propeller is intra-fi rm trade, and it is highest amongst the countries where Japan has substantial direct investments of assets.
Capital markets in India are relatively underdeveloped in compari-son to the US, UK, and Hong Kong, where Japanese funds have been much more active. Japanese overseas investments have traditionally been more focused on the bond market. Table 2.3 lists the top 10 destinations for Japanese funds in terms of investment in equities. It is interesting to note that Japanese investments in Indian capital
140000
120000
100000
80000
60000
40000
20000
0 0
5
40
35
30
25
20
10
15
2005 2006 2007 2008 2009 2010 2011 2012 2013
Total (100 mln Yen)
Thailand (%)
China (%)
India (%)
Korea (%)
U.S.A. (%)
Figure 2.6 FDI by Japan (Assets), 2005–13 Source : Ministry of Finance, Government of Japan (http://www.mof.go.jp/english/statistics).

78 Poised for Partnership
Table 2.2 FDI Infl ows to India (Share of Top 10 Sources, Per Cent), 2000–14
Rank according Country 1991–2000 2000–March 2014 to 2000–14
1 Mauritius 31.51 36.09 2 Singapore 2.76 11.69 3 United Kingdom 5.44 9.54 4 Japan 7.41 7.48 5 USA 20.10 5.48 6 Netherlands 5.19 5.16 7 Cyprus 0.20 3.42 8 Germany 5.61 3.00 9 France 2.59 1.78 10 UAE 0.08 1.24
Sources : Department of Industrial Policy and Promotion, Government of India; S. Ray, ‘Impact of Foreign Direct Investment on Economic Growth in India: A Co-integration Analysis’, Advances in Information Technology and Management , 2(1), 2012, pp. 187–201.
Table 2.3 Japanese Toshin Fund Exposure to Overseas Assets, 2014
Country Allocation to Allocation to Bond/Equity Equity (Rank) Bonds (Rank) Ratio
USA 1 1 2.32 Euro 2 3 4.46 Hong Kong 3 23 0.01 United Kingdom 4 6 2.69 Brazil 5 4 5.35 India 6 21 0.06 Switzerland 7 22 0.05 Australia 8 2 22.29 Canada 9 5 10.35 Taiwan 10 25 0.03 Top 26 Total 3.02
Source : Nomura Global Markets Research, ‘Abenomics × Modinomics = Greater Opportunities for Japan and India’, Anchor Report, 2014, p. 30. Reprinted with permission of the Nomura Group.
An Economic Partnership for Twenty-fi rst Century Asia 79
markets have favoured equities rather than bonds (unlike Brazil but very much like Hong Kong).
Despite complementary factors of production and a rapidly grow-ing Indian market relative to anaemic economic growth in Japan, the India–Japan economic partnership has not really been able to take off . However, a rapidly changing strategic environment in Asia, a greater recognition within India of the need to address the concerns of investors, and strong political commitment at the highest levels of government in both countries now off er a rare opportunity to build a robust economic partnership. India has a range of options as it seeks to build a robust economic partnership with Japan. While many of the constraints are in the general area of ‘ease of doing business’—essentially issues of cutting red tape that India needs to address in the coming years—it is also important to look at specifi c sectors.
Supply Chains and Industrial Clusters
Industrial clusters have been empirically proven to enhance produc-tivity and effi ciency—the underlying economic force is often referred to as the agglomeration eff ect, or localization economies. 7 With a large and cheap labour force, India needs to work with Japan to build industrial clusters that off er a common but high-quality infrastruc-ture catering to specifi c sectors. Th ree examples come to mind.
First, adding to the existing three major supply chain networks (which have also been major export-driven success stories) in the Indian automobile sector—the Mumbai–Pune corridor, the Chennai–Bengaluru corridor, and the National Capital Region (NCR)—and linking them to the global supply chains of Japanese auto fi rms.
Second, creating completely new clusters around the proposed Delhi–Mumbai and Mumbai–Bengaluru industrial corridors. Th e Delhi–Mumbai Industrial Corridor (DMIC), an ambitious infra-structure project with rail-cum-highway trunk corridors along with manufacturing zones and new urban centres, is being partially funded by the Government of Japan. A Japanese industrial cluster is taking shape in Vithalpur in Gujarat. Th e governance models of these new urban centres and industrial clusters are still evolving. One possible model they could draw from is the industrial city of Jamshedpur,

80 Poised for Partnership
a private fi rm–dominated governance model that has successfully provided better public services than most Indian cities.
Th ird, developing an infrastructure (transportation and energy) corridor connecting eastern India–Bangladesh–Myanmar with Southeast Asia and piggybacking new supply chains on this corridor. Th is is especially important for India since the eastern wing of the country has so far been unable to partake in much of the twenty-fi rst century growth story.
Th e industrial clusters can be organized around fi ve sectors where Japanese fi rms are acknowledged leaders: automotive; railways and public transportation and people-moving systems for urban India; shipbuilding; heavy industry for energy (low-emission, high-effi -ciency power plants); and consumer electronics and chips.
Delhi–Mumbai Industrial Corridor
Th e Economic Survey of India 2012–13 states that ‘[T]he Delhi-Mumbai Industrial Corridor (DMIC) is being developed by the Government of India with a view to using the high capacity western Dedicated Freight Corridor as a backbone for creating a global man-ufacturing and investment destination.’ 8 Th e master plan has a vision for 24 cities, each linked to a manufacturing zone. General manu-facturing, IT-enabled services, electronics, agro and food processing, heavy engineering, pharmaceuticals, biotechnology, and services are some of the sectors being actively promoted in the proposed indus-trial clusters. Investment is pegged at US$90 billion. Th e DMIC was conceived by the Ministry of Economy, Trade and Industry (METI) of Japan and the Ministry of Commerce and Industry (MoCI) of India.
By 2014, US$4.5 billion worth of investment was already under implementation in the fi rst stage of the DMIC through the Japan International Cooperation Agency (JICA) and JBIC. Th ey hold a combined 26 per cent stake in the project. Of the seven cities being developed in the fi rst phase of the DMIC project, master planning for six is complete (Figure 2.7).
Th e DMIC project infl uence area of 436,486 square kilometres is about 13.8 per cent of India’s geographical area. It extends over seven states and two union territories, namely, Delhi, Uttar Pradesh,

An Economic Partnership for Twenty-fi rst Century Asia 81
Haryana, Rajasthan, Madhya Pradesh, Gujarat, Maharashtra, Diu and Daman, and Dadra and Nagar Haveli. Th e population infl u-enced would be around 17 per cent of the country’s total popula-tion. Th e key to DMIC’s infrastructure is the multi-modal high axle load dedicated freight corridor (DFC), a high-capacity railway system. Covering 1,483 kilometres and nine new railway stations along which other railroads would connect, the DFC is set to lay a wide network in the transportation of goods and services in the north-western part of the country. Other infrastructure plans include logistic hubs, feeder roads, power generation facilities, upgrades of existing ports and airports, development of greenfi eld ports, environ-ment protection mechanisms, and social infrastructure.
Th e basic provision of trunk infrastructure is unlikely to be com-mercially viable, at least initially. 9 Hence, public fi nancing is required to build this infrastructure, which includes land improvement, road works, earthworks, sewerage, storm water drainage, fl ood manage-ment, and solid waste management. Th ere are major implementation challenges including land acquisition, power, water management, and environmental protection. Once such infrastructure is in place, the subsequent addition of cities would become commercially viable and can be implemented through public–private partnerships
Figure 2.7 Delhi–Mumbai Industrial Corridor: The Route Source : Economic Survey of India 2012–13 ; DMIC Corporation Ltd.

82 Poised for Partnership
(PPPs). Th e trunk infrastructure, industrial zones, and linked cities are all part of an integrated vision of economic development that will require very substantial amounts of fi nancing. How that might occur is discussed in a later section.
The Urban Challenge
Th e single largest urban transformation of the twenty-fi rst century will be in India. Between 2014 and 2050, India’s urban population is expected to grow by about 400 million people—just under a million a month. About one-sixth of the global increase in urban population until 2050 is expected to be in India (China, with under one-eighth, will have the second largest increase). 10 India’s demographic projec-tions suggest that over 65 per cent of Indians are going to be between the ages of 15 and 65 by 2032 (see Figure 2.1). If we (realistically) expect the labour participation rate to rise from 60 per cent to 70 per cent and the population of India to be around 1.5 billion in 2032, this points towards an active and young labour force that is 730 mil-lion strong. Th ese numbers are unprecedented. A large part of this hugely expanding labour force is expected to move out of agriculture and into urban occupations.
Currently, India has 54 cities with populations of more than one million. As classifi ed by the government census, these include three megacities, or census-defi ned urban agglomerations with at least 10 million residents (Mumbai, Delhi, and Kolkata); six major metros, or urban agglomerations with between 5 and 10 million residents (Ahmedabad, Bengaluru, Chennai, Hyderabad, Pune, and Surat); and 45 large cities, or urban agglomerations with between 1 and 5 million residents.
In comparison to other countries at similar stages of development, India’s urbanization rate is relatively low. Only about a third of India’s population is urban compared to 45 per cent in China, 54 per cent in Indonesia, 74 per cent in Mexico, and 87 per cent in Brazil. 11 Typically there are four key drivers of urban growth: natural increase, net rural–urban migration, expansion of boundaries, and net reclassi-fi cation. Contrary to the standard theory, 12 India’s story suggests that rural–urban diff erentials in productivity have widened in the last few decades and rural to urban migration has not kept pace. Th e share

An Economic Partnership for Twenty-fi rst Century Asia 83
of agriculture in GDP has consistently been declining, whereas the sectoral composition of the workforce has changed only moderately (Figure 2.8 and Table 2.4).
Managing this urban transformation will be a Herculean chal-lenge, and addressing it will require India to sharply improve urban governance and rapidly increase urban infrastructure investment. While the former is largely endogenous to India’s political economy, the latter will require India to access large amounts of international capital and technologies. As an initial step, India has launched a 100 ‘smart cities’ programme to improve the quality of life in India’s bur-geoning urban spaces.
100
90
80
70
60
50
40
30
20
10
1982
–83
1984
–85
1986
–87
1988
–89
1990
–91
1992
–93
1994
–95
1996
–97
1998
–99
2000
–01
2002
–03
2004
–05
2006
–07
2008
–09
2010
–11
2012
–13
0
Industry and Manufacturing
AgricultureServices
Figure 2.8 Share of GDP by Sector in India, 1982–3 to 2012–13 Source : Planning Commission, Government of India, ‘GDP at Factor Cost at 2004–05 Prices, Share to Total GDP and % Rate of Growth in GDP’, 2014, retrieved from http://planningcommission.gov.in/data/datatable/data_2312/DatabookDec2014%202.pdf on 4 September 2015.

84 Poised for Partnership
India’s urban infrastructure investment requirements are vast. A recent report by the McKinsey Global Institute estimated that India required US$1.2 trillion of investment in urban infrastructure by 2030, to be fi nanced by public fi nance, monetizing land assets, leveraging debt and PPPs, and accessing private investment. 13 Th e Government of India’s High Powered Expert Committee Report of 2011 called for Rs 39.2 lakh crore (about US$670 billion) of investment in urban infrastructure over a similar time period, with increasing private fi nancing and reliance on PPPs. 14 In 2014, India’s Ministry of Urban Development estimated that India needs to invest about US$250 billion over the next 20 years for basic urban infra-structure relating to transport, water supply, sanitation, and solid waste management alone. 15
As a resource-scarce country—especially in land and energy—Japan has had to develop technologies, regulations, systems, and practices that are well adapted to its natural endowments. In particu-lar, its land scarcity has led to dense urban metropolitan areas, where Japan has developed a comparative advantage in public transport systems and solid waste management, both of which are critical gaps in India’s urban expansion. Th e Tokyo–Yokohama metropolitan area is a prime example of high-density urban management in Japan.
India will need to fund public transport investments to: provide high-capacity and quality transport infrastructure in both existing urban areas as well as in emerging greenfi eld urban areas; integrate intermediate public transport for better connectivity at public
Table 2.4 Share of Employment by Sector in India (Per Cent), 1999–2000 to 2009–10
Sectors 1999–2000 2004–5 2009–10
Agriculture 59.9 56.6 53.2 Manufacturing 11.1 12.2 11.0 Non-manufacturing 5.3 6.5 10.5 Services 23.7 24.7 25.3 Total 100 100 100
Source : Various rounds conducted by the National Sample Survey Organization under the Ministry of Statistics and Programme Implementation.

An Economic Partnership for Twenty-fi rst Century Asia 85
transport nodes; and creatively design cities to integrate land use and transport infrastructure to ensure good-quality access to a broad range of transportation modes.
From 2002 to 2011, the transport sector received 25 per cent of JICA’s total assistance to India. Within this sector, subway systems account for the largest share (77 per cent), followed by railways (12 per cent), roads (10 per cent), and ports (1 per cent). 16 Japanese aid has been supporting the construction of subway systems in Delhi, Bengaluru, Kolkata, Mumbai, and Chennai. Th e model has been the Delhi Metro Rail Corporation, which began construction in Delhi in 1998. Yen loans covered about 60 per cent of the costs for the fi rst phase and roughly half the costs for the second phase, and Japanese companies received orders in a broad range of areas includ-ing construction, signal systems, and rail cars. 17 With the Indian government having decided to develop subway system projects in all cities with a population of over 2 million—22 currently—subway projects off er a sustained investment and commercial opportunity for Japanese companies.
Urban India is poorly equipped to handle waste—both sewage as well as solid waste. According to data from the Central Pollution Control Board, in 2012–13 around 133,000 tons of municipal solid waste was generated in the country daily. 18 A report by the McKinsey Global Institute projected a tripling in per capita waste generation because of higher incomes and consumption resulting in a six-fold increase in waste generation to reach 377 million tons per annum inclusive of construction debris, or almost one million tons a day. 19 Already only about two-thirds of India’s urban waste is being col-lected and barely a fi fth is treated, with the remainder littered and often burned, further adding to pollution. 20 Much of the collected waste goes to landfi ll sites, which are scarce and poorly used. Clearly, developing better landfi ll technologies (for instance, with systems for compaction); separating the biodegradable waste in municipal waste (constituting nearly half of municipal solid waste) to produce compost for use as fertilizers; and setting up waste-to-energy plants will all be needed. Indian and Japanese researchers can collaborate on developing new technologies to address these urban waste challenges and make them integral to the green city investments being planned on the DMIC.

86 Poised for Partnership
Given the enthusiasm in the bilateral relationship, especially economic, there is scope for substantially increasing Japanese invest-ments in developing India’s urban infrastructure. In a bid to facilitate and fast-track Japanese investment proposals, the Indian govern-ment’s Department of Industrial Policy and Promotion (DIPP) set up a special management team known as Japan Plus, comprising offi cials of both governments. In a later section, we examine the chal-lenges facing this group in ensuring that obstacles facing Japanese investments into India are removed.
Smart City Bonds
Rome was not built in a day, not only because it is physically a chal-lenging task but also because large building projects need large and reliable fl ows of resources, fi nanced by long-term debt with appropri-ate maturity structures. For this purpose, a prominent policy option is a renewed emphasis on local government and municipal bonds.
In India, for a host of policy reasons, the dominance of the sover-eign bond market and availability of cheap credit to big corporations has so far stymied all other bonds, particularly corporate and local government. It is well known, and Table 2.3 speaks to the fact, that Japanese investors prefer bonds to equity. Along with Hong Kong (if considered a separate market from Mainland China), India is one of the few countries where the opposite is true, that is, Japanese investors have a higher share of equity than bonds. Th e major reason for Japanese investors’ preferred interest in bonds is of course that the former are widely known to favour longer-term and safer capital investment, and these are typically found in sovereigns and big cor-porate bonds.
So far, Japanese investments in Indian infrastructure have been exclusively in the form of loans. Th ere is a strong case to be made for encouraging Japanese insurance and pension funds to invest in what may be called ‘smart city bonds’, or fi nancial debt instruments designed to raise capital for the building of new industrial clusters and economic zones. A key constraint on this proposal is the perceived and actual quality of the debt issued through these bonds, especially for Japanese investors, who are known to be quite risk averse. To allay investor fears, a holding entity can be created which has the sovereign

An Economic Partnership for Twenty-fi rst Century Asia 87
guarantees of both the Indian and Japanese governments. A holding entity would be essential to keep the bonds at an arm’s length from the governments’ balance sheets, which are already stressed.
Th ere are very good economic reasons for Japanese interest in Indian infrastructure. In the current macroeconomic scenario, there are very few countries with growth rates at the level of India, from the perspective of both base and level eff ects, and there are certainly very few with the demography to generate sustained demand. Investing through FDI instead of simple loans will also give Japanese fi rms greater access to Indian markets and create supply chain linkages. Critically, however, given the very low levels of interest rates in Japan, the country’s pension funds and insurance companies have to look off shore for profi table investments. As Table 2.3 shows, so far the US, Europe, UK, Hong Kong, and Brazil have been their preferred destinations. But, with fi nancial sector reforms under way in India, the institutional infrastructure to attract long-term capital into the country is being put into place. India’s demand for long-term capital with the promise of good returns is perfectly matched with Japan’s need to export capital to generate healthy returns.
Railways
Connectivity is the bedrock of growth in a modern economy. While digital connectivity is growing rapidly, India continues to be severely constrained in physical connectivity, that is, the movement of goods and people. While roads and highways have received a much-needed push in policy, investments in railways have been languishing for many decades.
In his 1960 opus, Th e Stages of Economic Growth , W. W. Rostow argued, ‘Th e introduction of the railroad has been historically the most powerful single initiator of take-off s. It was decisive in the United States, France, Germany, Canada, and Russia; it has played an extremely important part in the Swedish, Japanese, and other cases.’ 21 One can now surely add China to that list.
Th e Indian railway system has unfortunately suff ered from a lack of investment, both in terms of capacity addition and technology upgrades. Figure 2.9 shows capacity addition in India and China from 1990 to 2010. Th e progressive diff erence is quite striking.

88 Poised for Partnership
Comparing this with the investment data available in Figure 2.10 completes the sorry picture.
Other than congested passenger travel, the biggest casualties of underinvestment in railways in India have been the manufacturing and power sectors. Access to markets and the fl ow of raw materials, specifi cally coal and iron ore, are constrained. Low passenger ticket prices are often cross-subsidized with high freight rates. Rail freight rates in India are therefore expensive and have been growing steadily.
95
85
75
65
551990 1995 2000 2005 2010
China
India
Figure 2.9 Addition to Railway Capacity (Route Km, ’000s) in India and China, 1990–2010 Source : World Bank database; Economic Survey of India 2014–15 , p. 92.
Figure 2.10 Investment in Railways (Per Cent of GDP) in India and China, 2005–12 Source : World Bank database; Economic Survey of India, 2014–15 , p. 92.
2.5
2
1.5
1
0.5
02005 2006
Public Investment in India Capital Investment in China
2007 2008 2009 2015 2011 2012

An Economic Partnership for Twenty-fi rst Century Asia 89
Th is has ensured a decline in the share of railways in freight from over 60 per cent in the 1970s to about 33 per cent today, most of the diff erence being compensated by roads. Figure 2.11 shows the fi gures for India with respect to some other countries. Th is shift has had adverse consequences for the environment and is logistically more cumbersome.
How Can Japan Help and Make a Profi t?
Given the large investment needs of railways in India, opportunities abound and there are many options from an investor’s perspective. Earlier we had pointed to Japan’s involvement in urban transport in India through investments in subway systems. In addition, Japanese excellence in railways can be leveraged through the production of state-of-the-art locomotives, rolling stock, and signalling equipment. Collaboration with Indian Railways in producing locomotives in India will allow for the transfer of technology, which is essential for the development of domestic capacity in railways.
Australia
Canada
China
Russia
US
India*
0 10
33
44
44
65
51
66
20 30 40 50 60 70
Figure 2.11 : Modal Share of Railways (Per Cent) in Domestic Freight for Selected Countries, 2011 Sources : P. Amos, Freight Railways Governance, Organization and Management: An International Round-Up , World Bank paper submitted to the National Transport Development Policy Committee, Government of India, 2011, cited in Economic Survey of India, 2014–15 , p. 94. * Data for India is an estimate for 2011–12 provided in the report of the National Transport Development Policy Committee, 2014.

90 Poised for Partnership
In terms of current and prospective Japanese investments in the Indian railways, for the western DFC project currently under imple-mentation, Japanese ODA assistance of ¥646 billion is envisaged and loan agreements for ¥226 billion have already been signed. 22 Th is ODA has a condition of 30 per cent goods being sourced from Japan, which includes electric locomotives, rails, high-capacity elec-tric transformers, and signalling equipment. Th e total value of these goods sourced from Japan would be approximately Rs 12,000 crore (US$2 billion), and it would fl ow over the next three to four years. While this would undoubtedly be benefi cial for India, it nonetheless highlights that Japan’s economic engagement with India continues to be in the form of loans, and not direct long-term investment in physical assets. Another area where there is long-standing Japanese technological leadership is that of high-speed trains. While pre-liminary studies have been launched for the Mumbai–Ahmedabad corridor, the high investment required means that the opportunity costs of such investments are substantial. Given other investment priorities, investments in high-speed Shinkansen-type train corridors might need to wait.
Financial Flows and Monetary Stability
In addition to deepening fi nancial markets through much-needed fi nancial sector reforms, India needs a well-developed corporate bond market. Infrastructure development in emerging markets has been driven in large parts by non-secured loans and bonds. Unfortunately, both the quality of credit and the nature of the cor-porate bond market have left much to be desired in India. Japanese pension funds should be encouraged to invest more in debt fl ows and the corporate bond market in India, where interest rates are considerably higher than the very low rates in Japan and other devel-oped countries.
Central bank liquidity swaps have become a key tool for hedging exchange rate risk and providing liquidity amongst developed coun-tries. Developing countries have now begun this process as well, and India has taken modest steps in this direction. Th e US$50 billion swap arrangement that India signed with Japan in 2013 could be widened to include other bilateral and multilateral partners. 23
An Economic Partnership for Twenty-fi rst Century Asia 91
Education and Labour Mobility
Th ere is going to be a massive need for workers in Japanese agriculture, nursing and old age care, and other low- and medium-skill services in Japan in the years to come. India and Japan can develop temporary worker programmes (such as the one between Canada and Mexico) where Indian workers can either go seasonally (for agriculture) or for short-to-medium-term stays of three to fi ve years. In addition, in higher-skill service jobs, such as IT, Japan can draw lessons from programmes such as the H1-B visa programme in the United States to take advantage of India’s acknowledged expertise in this area.
But if Indian labour is to be able to serve the Japanese market, it needs to be trained to meet the exacting standards of Japanese employers. India’s National Skill Development Corporation needs to partner with Japanese educational institutions and vocational training schools to develop training programmes that will impart both hard skills and the soft cultural skills necessary for the Japanese labour market as well as Japanese fi rms operating in India. On the other side, Japan needs to have less stringent visa norms at least for academic and research-related travel so as to better leverage India’s burgeoning human capital.
Japan Plus
Following Prime Minister Modi’s visit to Japan in September 2014, the Indian government established a special cell called Japan Plus in MoCI to attract and fast-track Japanese investments in India. 24 According to government documents, the mandate of Japan Plus
runs through the entire spectrum of investment promotion—research, outreach, promotion, facilitation and aftercare. Th e team will sup-port the Government of India in initiating, attracting, facilitating, fast tracking and handholding Japanese investments across sectors. Th e team will also be responsible for providing updated informa-tion on investment opportunities across sectors, in specifi c projects and in industrial corridors in particular. In addition, the ‘Japan Plus’ team will identify prospective Japanese companies, including Small and Medium Enterprises (SMEs) and facilitate their investments in India. 25

92 Poised for Partnership
Th e cell has been organizationally placed in the Department of Industrial Policy and Promotion (DIPP) in the MoCI. Currently the team is composed of six members—four from the Government of India and two from Japan’s METI. Th e decision to place two mem-bers of a foreign government directly within a unit of the Indian government is exceptional and conveys the priority that both gov-ernments attach to facilitating and implementing the agreements reached between them.
Th e four major objectives of Japan Plus are as follows. First, hand-holding existing Japanese companies and their investments in India. Second, investment in industrial parks, particularly in identifying locations and working with Indian states. Th ird, an e-forum to fi nd potential partners on both sides for joint ventures. Finally, facilitating technology transfers from Japanese fi rms. A key fact that emerged out of our discussions with members of the team is that the main roadblocks that have arisen are located in contractual agreements with state governments. Th e role of the central government is to help Japanese companies identify potential locations, to provide central tax incentives, and to build basic external infrastructure. Th e state government addresses the nuts and bolts of location-specifi c issues such as land acquisition, power supply, and infrastructural connectiv-ity including roads, power, water, and sewage. Coordination between the centre and states is therefore critical to the smooth implementa-tion of projects.
Th e sequencing is typically as follows. An investor approaches the central government for a project, typically with a region in mind. Th e central government is tasked with obtaining clearances (mostly tax- and licence-based) from the relevant central minis-tries. After identifying a particular region, the central government may facilitate land acquisition and external infrastructure. Th e rest requires the involvement of the relevant state government, which gets refl ected in a memorandum of understanding (MOU) between the state government and the investor. It is thus not surprising that a substantial chunk of investments, especially in manufacturing and IT, are clustered in very few states. For example, states in the Hindi heartland and the north-east have not found favour with big investors because of a general weakness in institutional capacity and infrastructure.

An Economic Partnership for Twenty-fi rst Century Asia 93
A key facilitating tool in reducing bottlenecks is investment through joint ventures. Suzuki did not just succeed as a standalone company in India; its association with Maruti played an important role. If public sector companies were the joint venture of choice in the 1980s, market-driven private fi rms fi t the bill today. Th us, fi nding suitable partners can signifi cantly reduce the setup costs in terms of navigating the bureaucracy. Table 2.5 lists the various joint ventures between Indian and Japanese fi rms in the last 10 years.
Th e emergence of a more cooperative (centre–state) and competi-tive (inter-state) federalism in India means that Japanese investments are likely to cluster where states make special eff orts to facilitate these investments. Greater fi scal autonomy for the states that has been recently proposed by the central government will ensure that the next stage of federalism will bode well for international investors. 26 For example, the state of Andhra Pradesh is currently in the process of
Table 2.5 Selected Joint Ventures between Indian and Japanese Firms, 2005–15
Product Indian Side Japanese Firm
1. High Voltage Sterlite Technologies VISCAS Cables (Vedanta Group) Corporation 2. Alloy Wheel Minda Industries Kosei Group 3. Drugs Lupin Pharma Yoshindo Inc. 4. Mutual Funds LIC Nomura 5. Auto Parts Lumax Auto Mannoh Technologies 6. Food and Food Ruchi Soya KMDI Processing Industries International 7. Construction Tata Hitachi Machinery 8. Steel Wire Usha Siam Steel TESAC Wire Ropes Ropes 9. Telecommunications Tata NTT DoCoMo 10. Telecom and Bharti Airtel Softbank E-commerce
Source : Constructed by authors using information available on www.moneycontrol.com.

94 Poised for Partnership
building a new capital after the creation of the new state of Telangana from the erstwhile united Andhra Pradesh. Th e chief minister of Andhra Pradesh has already travelled to Japan and been assured mon-etary and technical expertise by the Government of Japan.
As a fi nal thought on Indian and Japanese collaboration in the private sector, the lack of cultural diplomacy cannot be overempha-sized. Th e reason why Japanese involvement in Indian industry has been limited somewhat to providing technical assistance rather than full-scale FDI is not just regulatory but also cultural. In reply to our questions, a former head of the India–Japan Chamber of Commerce wrote:
[O]pportunities are signifi cant but Japanese risk aversion, unwill-ingness to get deeply involved with unique India issues, and lack of successful role models is acting as a constraint on closer economic participation. India is defi nitely not Th ailand/Indonesia and here schools, karaoke bars, and entertainment parlours are as important as opaque regulations and shifting stands. Moreover, new age Indian companies are more culturally in tune with the Western ones.
Geopolitical Considerations
Th ere are two strong underlying reasons for closer economic links between Japan and India. Th e fi rst is the complementarity between the strengths (and weaknesses) of their respective economies. Th e second rationale is strategic, a response to the changing geopolitical environment in the region. To that extent, the two countries should also explore closer ties in defence production in areas where Japan has state-of-the-art technologies such as naval vessels, maritime reconnaissance aircraft, and defence electronics (see Chapter 6 in this volume for more on India–Japan strategic economic cooperation). Th is type of cooperation would also lower the unit costs of produc-tion for Japan.
One issue we have not addressed in this chapter is a strategic part-nership between the two countries in global economic governance. Th is issue is especially important in the case of global trade where two mega trade blocs—the Trans-Pacifi c Partnership (TPP) and the Transatlantic Trade and Investment Partnership (TTIP)—are likely

An Economic Partnership for Twenty-fi rst Century Asia 95
to account for about half of world trade. For Japan, this is important for economic as well as strategic reasons, including being able to get energy imports from the United States. Th erefore, over the medium term, the developments that take place in the TPP would begin to underpin the consideration of investments made by Japanese business. Th e most important policy aspects would include standards, intellec-tual property rights, and digital trade (especially data transfer issues). India has for long focused on the Regional Comprehensive Trade Partnership, another mega regional agreement which will likely have less stringent standards and discipline than the TPP. Indian policies and standards at present are below the levels likely to prevail as a result of mega regional trade agreements such as the TPP and TTIP. Th is is one area where cooperation with Japan could focus on improving Indian standards in line with those emerging in the largest free-trade agreements and developing value chains for foreign markets.
Notes
1. P. A. George (ed.), East Asian Literatures: An Interface with India , New Delhi: Jawaharlal Nehru University, 2006.
2. MOFA, ‘Overview of Japan’s ODA to India’, June 2011, retrieved from http://www.in.emb-japan.go.jp/Japan-India-Relations/ODA_Eng_Jun2011.pdf on 2 September 2015; MOFA, ‘India’, n.d., retrieved from http://www.mofa.go.jp/policy/oda/data/pdfs/india.pdf on 2 September 2015.
3. Authors’ estimates from Japanese government data. 4. JBIC, ‘Survey Report on Overseas Business Operations by Japanese
Manufacturing Companies’, 2014, retrieved from https://www.jbic.go.jp/wp-content/uploads/press_en/2014/11/32994/20141128English1.pdf on 2 September 2015.
5. Planning Commission, Government of India, ‘Faster, Sustainable and More Inclusive Growth: An Approach to the Twelfth Five Year Plan’, 2011, retrieved from http://planningcommission.gov.in/plans/planrel/12appdrft/appraoch_12plan.pdf on 2 September 2015.
6. OECD, ‘FDI in Figures’, 2014, retrieved from http://www.oecd.org/daf/inv/FDI-in-Figures-April-2014.pdf on 2 September 2015.
7. For an overview of the evidence, see M. Nathan and H. Overman, ‘Agglomeration, Clusters, and Industrial Policy’, Oxford Review of Economic Policy , 29(2), 2013, pp. 383–404.

96 Poised for Partnership
8. Th is section draws on Government of India, Economic Survey of India 2012–13 , 2013, chapter 2, Box 2.2.
9. Trunk infrastructure is referred to as the support to large-scale infra-structure projects to allow them to be functional on the ground. Water supply, sewage, connecting roads, fl ood management, community spaces, and so on constitute trunk infrastructure.
10. High Powered Expert Committee, Ministry of Urban Development, Government of India, Report on Indian Urban Infrastructure and Services , 2011, retrieved from http://icrier.org/pdf/FinalReport-hpec.pdf on 4 September 2015.
11. High Powered Expert Committee, Report on Indian Urban Infrastructure and Services .
12. W. A. Lewis, ‘Economic Development with Unlimited Supplies of Labour’, Manchester School , 22(2), 1954, pp. 139–91; J. R. Harris and M. P. Todaro, ‘Migration, Unemployment and Development: A Two-Sector Analysis’, American Economic Review , 60(1), 1970, pp. 126–42.
13. McKinsey Global Institute, India’s Urban Awakening , 2010, retrieved from http://www.mckinsey.com/insights/urbanization/urban_awaken-ing_in_india on 4 September 2015.
14. High Powered Expert Committee, Report on Indian Urban Infrastructure and Services .
15. Th e numbers are based on a speech delivered by India’s urban develop-ment minister, cited in: ‘India Needs $250 Billion in the Next 20 Years for Infrastructure’, Economic Times , 7 October 2014.
16. See JICA, ‘India’, n.d., retrieved from http://www.jica.go.jp/india/english/ on 4 September 2015.
17. S. Ray, ‘Japan to Fund Metro’s Phase III from December’, Hindustan Times , 24 July 2011.
18. Ministry of Environment, Forests and Climate Change, Government of India, Annual Report 2014–15 , 2015, p. 120, retrieved from http://envfor.nic.in/sites/default/files/Environment%20Annual%20Report%20%20Eng..pdf.
19. McKinsey Global Institute, India’s Urban Awakening . 20. Ministry of Environment, Forests and Climate Change, Annual Report
2014–15 , p. 120. 21. W. W. Rostow, Th e Stages of Economic Growth: A Non-communist
Manifesto , Cambridge, UK: Cambridge University Press, 1960, pp. 55–6.
22. Th e data in this paragraph were acquired by the authors from the Indian Ministry of Railways.

An Economic Partnership for Twenty-fi rst Century Asia 97
23. Ministry of Finance, Government of India, ‘Bilateral Currency Swap Arrangement between the Reserve Bank of India and Bank of Japan Enhanced from US $15 billion to US $50 billion’, 18 December 2013, retrieved from http://pib.nic.in/newsite/PrintRelease.aspx?relid=102007 on 4 September 2015.
24. Th is section is based on interviews with members of the Japan Plus unit by one of the authors on 26 February 2014.
25. DIPP, Government of India, ‘“Japan Plus” constituted to fast track Japanese investments’, 9 October 2014, retrieved from http://dipp.nic.in/English/acts_rules/Press_Release/japanPlus_09October2014.pdf on 4 September 2015.
26. See Finance Commission of India, Report of the Fourteenth Finance Commission , 24 February 2015, retrieved from http://fi nmin.nic.in/14fi ncomm/14fcreng.pdf on 4 September 2015.