Embed Size (px)
Citation preview

Electronic Journal of Biotechnology ISSN: 0717-3458 Electron. J. Biotechnol. http://www.ejbiotechnology.info DOI: 10.2225/vol15-issue3-fulltext-3 BIOTECHNOLOGY ISSUES FOR DEVELOPING COUNTRIES
An economic valuation of a biotechnology R&D project in a developing economy
Bahar Celikkol Erbas1 · Selin Arslanhan Memis2
1 TOBB University of Economics and Technology, Department of Economics, Sogutozu, Ankara, Turkey
2 Economic Policy Research Foundation of Turkey, Sogutozu, Ankara, Turkey
Corresponding author: [email protected] Received January 06, 2012 / Accepted March 26, 2012 Published online: May 15, 2012 © 2012 by Pontificia Universidad Católica de Valparaíso, Chile
Abstract
Background: Biotechnology complements technological developments in main sectors of economies, such as health, energy, and agriculture, and thus contributes to economic development. It provides solutions to the problems that are frequently faced in developing economies, such as resource constraints, lower productivity and environmental concerns. In order to benefit from biotechnology, its associated markets need to develop and function well to support the developments and transactions of intangible assets, such as technology transfers, license agreements and research and development joint ventures. Economic valuation of the intangible assets is necessary for the development and functioning of these markets. It provides better understanding of value creation at micro scales and its economic and financial dynamics. The literature lacks valuation studies in biotechnology sectors in developing economies. This study performs economic valuation analysis of a research and development project of a Turkish biotechnology company operating in health sector. Turkey, as a developing economy, has slow progress in biotechnology despite its wealth of biological resources and genetic variety. Thus, the study provides an excellent case to analyze valuation issues in developing economies. It uses data from in-depth interviews from the company and employs real options and discounted cash flow (DCF) methods. Results: Developing countries and biotechnology sector introduce additional risks that need to be accounted for in valuation. These risks reduce the value of the project under real options and discounted cash flow methods. Since real options method permits the valuation of options that might arise during the R&D process and provides flexibility to managers to act, it results in higher values compared to discounted cash flow method. The grant from a public institution that partially financed the Project reduces the discount factor and thus increases the value of it. Conclusions: Economic values of biotechnology intangibles in developing countries are affected by country and sector risks and public financing. Thus, both microeconomic and macroeconomic policy interventions are important for the development of biotechnology in these economies. While public financing enables the risky R&D projects to take place, it makes them more valuable than they would be under no intervention. Long run effects of these interventions require diligent analyses.
Keywords: biotechnology sector, developing economies, real options, R&D project valuation, Turkey INTRODUCTION
Increase in competition and change in demographic trends and demand structures lead countries to follow different growth strategies and transform their economies. Knowledge-based sectors constitute the most important component of the transformed new economies. Life sciences encompassing many sectors like health, agriculture and energy are among the top fields that influence this transformation.
Celikkol and Arslanhan
DOI: 10.2225/vol15-issue3-fulltext-3 2
They are mainly represented by biotechnology (Yagüe-Perales and March-Chordà, 2011). Biotechnology embraces technological implementations using biological systems and live organisms and transforms or creates products or procedures by making use of basic engineering, life and computer sciences. After a long incubation period, the importance of biotechnology continues to increase in the 21st century. It will continue to draw the majority of the funds allocated to science and its applications that influence many areas of life such as agriculture, food, pharmaceutical, and diagnosis (Audretsch, 2001; Bustamante and Bowra, 2002).
Together with the development of biotechnology, it is expected that the contributions of the sectors that biotechnology horizontally cuts, will increase via improvement in productivity and rise in competitive power (Holm-Nielsen and Agapitova, 2002). Moreover, biotechnology provides solutions to the problems that are frequently faced in developing economies, such as resource constraints, lower productivity and environmental concerns (Hernandez-Cuevas and Valenzuela, 2004; Hermann et al. 2007; Wohlgemuth, 2009). It also plays an important role in giving answers to the fundamental problems of food and water security that elevates with the rise in pollution and threats the World peace (Kryl, 2001; Da Silva et al. 2002; Tonukari, 2004). As the number of studies on the contributions of biotechnology increases, especially in developing economies with increasing population, food security issues continue to be the main agenda (Anderson, 2010).
In 2050, the World population is expected to reach 9.3 billion. Apart from the increase, it is also aging rapidly. Aging, which has been a problem especially in the developed countries in the past, has rapidly felt in developing countries in recent years. The share of the population over age 65 in the World is expected to be 16% in 2010 (UN, Population Division Statistics, 2011). As a developing economy, Turkey has not yet come across this problem, but it is expected to face it. As the population is expected to increase to 92 million, the share of the population over the age of 65 will reach 20% by 2050 in Turkey (UN, Population Division Statistics, 2011). Depending on these changes in the population composition, demand level and structure will also change. The demand for health services, food, water and energy will increase (OECD, 2009a). The expenditures on health services are increasing together with the changing illnesses and health service quality. This brings along quests of cost control and productivity increase. The products and services developed with new biotechnology applications will enable the costs control as well as productivity improvements (Kumar et al. 2004; Güldem, 2011).
Along with the changes in trends, all these needs bring biotechnology to forefront and stimulate scientific publications and patents in the field. The commercialization activities intensify and the number and size of biotechnology companies rise (Deloitte, 2006). Spin-offs with a high capacity of transforming scientific studies to commercial product/services become important for the development of advanced technology in developing economies (Fontes, 2005). While biotechnology markets of developed countries expand 17% annually, this rate is 36% for developing countries in Asia (TÜSİAD, 2006).
On the other hand, in developing countries in other parts of the World, where the expansion of biotechnology sector is relatively slow, such as Turkey, financial support mechanisms and legal infrastructures regarding the protection of intellectual property must be formed (Baum and Silverman, 2004). These mechanisms and the infrastructure enable innovations, facilitate economic transactions and create added value. Financial support to these activities might be given through risk and venture capital markets as well as institutional infrastructures that assume the role of these markets. Therefore, measurement of the efficiency and success of R&D supports in any form becomes crucial both for policy makers and investors in the market. This measurement requires determination of economic values of R&D processes and other intangible assets. Valuation is an established analysis in the areas of business and economics. It takes into account country, sector and company characteristics. Given that the commercialization activities in biotechnology sector are shaped by country specific factors (Hosseini et al. 2011), the valuation of intellectual properties needs to be conducted specific to the sectors and the countries that they were born in. In this study, the economic valuation of a R&D project of a biotechnology company in Turkey was conducted. As a developing economy, Turkey’s historical average annual growth rate over the period of 1999 to 2011 is 3.83%. However, it is expected to be the fastest growing economy of OECD members by expected average annual growth rate of 6.7% for the period 2011-2017. Particularly, in 2010, Turkey grew 8.9% and became the fifth fastest growing economy after Singapore, Taiwan, China and Argentina. The number of companies using biotechnology processes in R&D and product/service production in Turkey has been increasing in recent years. These companies mostly operate in Environment-Energy, Chemical-Pharmaceutical, Agriculture-Forestry-Husbandry and Food-Medicine sectors according to the classification of State

An economic valuation of a biotechnology R&D project in a developing economy
DOI: 10.2225/vol15-issue3-fulltext-3 3
Planning Organization (SPO). With the increase in the number of biotechnology companies, technology transfers, license agreements, patent activities, mergers and acquisitions are gaining importance in the sector. For the healthy expansion of the biotechnology sector in Turkey, small biotechnology companies, that enable commercialization of academic research, need to be established, risk and entrepreneurial capital markets need to be developed and foreign investment needs to be attracted. Turkish Industry and Business Association (TÜSİAD, 2006). states that biotechnology has long-run economic, social and environmental effects and thus it needs to be understood well and more importantly managed successfully. To do so, it is important to know the economic value of the biotechnology R&D processes.
The literature is seriously underprovided in regard to valuation of biotechnology intangible assets, specifically R&D projects, in developing economies in general and in Turkey in particular. This study aims to fill this gap by providing a case study of valuation of a R&D project of a biotechnology company operating in Turkey. Although there are many case studies examining the sector specific company structure in different countries (Diaz et al. 2002; Marsh, 2003; Bigliardi et al. 2005; Nosella et al. 2005), it is important to conduct case studies and valuation analysis for biotechnology firms to elaborate on the sector's financial, economic and policy dynamics in developing economies. This study provides discussions on these sectoral dynamics from a perspective of a developing market economy. The importance of biotechnology for the World and thereby for Turkey is presented in the literature review section. The data collected through in-depth interviews is summarized in the data section. The succeeding section covers real options and discounted cash flow methods (DCF) implementations. The results of the valuations and the sensitivity analyses are presented in section five. The last section provides the overall evaluation of the study.
LITERATURE REVIEW
The biotechnology sector in the World and in Turkey
Although there is no recent figure related to the size of the global biotechnology sector, its turnover in 2007 was 84.8 billion US$ (Ernst and Young, 2008). This figure was 9.1 billion US$ in 1996 (Ernst and Young, 2008). The sector expanded approximately 9 times in 12 years. Although the United States of America (USA) has been the leader in the sector, in recent years the sector has been developing rapidly in countries such as India, Singapore, and Israel. According to the 2007 OECD data, while the total number of biotechnology companies in the World was 4414, 1502 of these were in USA. The total number of companies in the European Union (EU) was 1744 in 2007. While the USA has 41.5% of the total biotechnology patents, the EU has 27.4% (OECD, 2009b). Factors and policies that stand out in the development of biotechnology in the USA and the EU differ. Compared to the EU, the USA industrial side of biotechnology is stronger and it is easier to access financial resources through venture capital, the legal infrastructure supports the developments, and public agencies, universities and private sector are successfully networked (Mowery, 2001; Orsenigo, 2001; Owen-Smith et al. 2002). Although there are many high quality studies, the commercialization of research results in biotechnology are not as fast and intense in the EU as it is in the USA (Enriquez, 2001; Fuchs, 2001; Prevezer, 2001; Todt et al. 2007; Aguilar et al. 2008). For example, Germany is one of the countries in which the number of biotechnology companies has been increasing rapidly since 1990’s, however due to the weak ties between the universities and research centres and private sector, it has not been able to catch up the progress made in the USA and even some of the big German companies carried out their research and development activities in the USA (Krauss and Stahlecker, 2001; Müller, 2002). Meanwhile, opinions on the use of biotechnology in certain areas such as food and agriculture and the development stages of the sector also diverge from one another in the USA and the EU (Braun, 2002). Even though the USA has strong sides compared to the EU in regard to the role of the private sector, the EU carries out intensive research and innovation programs directed to biotechnology (Cichocka et al. 2011). Furthermore, within the EU, there are differences across the countries (Çetindamar and Laage-Hellman, 2001; Cooke, 2001; Zeller, 2001). As such, Germany and France differ from England in regard to commercialization activities. For the countries where the biotechnology market is immature, it is very important to carefully establish the relationships between basic research and commercialization and to benefit from other experiences.
As mentioned before, biotechnology has particular importance for developing countries. Although countries like the USA and England continue their leadership, the sector is developing fast and there is a stimulus in developing economies. Primary factors affecting the rapidly increasing successes of the

Celikkol and Arslanhan
DOI: 10.2225/vol15-issue3-fulltext-3 4
biotechnology sectors in countries like India, South Korea and China, are the long-term government support and regulations encouraging the development of the sector (Thorsteinsdóttir et al. 2004; Lee and Park, 2006; Taesun, 2009). When capital markets, that support the growth of small firms, are not developed fully, as in the case of China and South Korea, public support becomes vital. The South Korean Government support program titled “Biotechnology 2000”, started in 1993, has created a very fast growing market (Wong et al. 2004). In these countries, biotechnology became one of the strategic sectors (Gedajlovic et al. 2011).
On the other hand, as a developing economy, Turkey needs to make use of its biological resources and genetic diversity to build up a successful development of biotechnology. Turkey has achieved high economic growth rate recently, however, the development of biotechnology has not caught up yet. With general industrial R&D policies, small sized and medium sized companies conducting R&D increased by four times between 1995-2001 in Turkey (Taymaz and Üçdoğruk, 2009). However, there are no studies about the R&D dynamics of the biotechnology companies in the Country. The discussion about the sector mostly takes place at the government level. The Science-Research-Technology Master Plan (SPO, 1998) and the VIth Five Year Development Plan declares biotechnology as one of the priority areas and presents policies about the sector. Similar studies to the ones in previous period were continued during the preparation phase of the VIIth Five Year Development Plan and a Biotechnology Expertise Commission was established. At the end of 1993, the General Directorate of Social Planning of SPO and The Scientific and Technological Research Council of Turkey (TUBITAK), commenced their work in order to create the priorities and support mechanisms in R&D activities in the fields of Environment-Energy, Chemistry-Pharmaceutical, Agriculture-Forestry-Husbandry and Food-Medicine in the biotechnology sector. Although the current data on the biotechnology sector in Turkey is insufficient, according to TÜSİAD, (2006) report, the number of biotechnology companies increased from 50 in 2000 to 90 in 2006. When the application domains of some of these companies are analyzed, the distribution to the subsectors is as follows; 58% medicine, 9% agriculture, 8% chemistry, 9% food, 7% energy, 6% pharmaceutical, and 5% environment. As there is no current data on the number of companies and their profiles, TÜSİAD, (2006) reported that most of the companies are seem to be small companies with less than 20 employees. 93% of the companies employ less than 250 employees. 61% of the companies have a turnover below 5 million dollars and 64% exports under 100,000 US$. It is observed that only one fourth of the companies allocate more than 10% of their turnover to R&D activities, 60% carry out patent activities and 82% have five or less patents. Turkey’s share in the biotechnology patents in the World is below 0.1%. Figure 1 gives patent distribution for the total biotechnology patents in the world (BRIC countries are Brazil, Russia, India and China).
Financial models in biotechnology sector play important role in moving from patents to commercialization in most of the countries where biotechnology develops fast. The development of risk capital plays a rather important role in accelerating the development of advanced technology sectors such as biotechnology. Figure 2 presents total amount of risk capital in life sciences in various countries.
USA has the highest risk capital amount. Risk capital is relatively new for Turkey and there is no data on it. The risk capital and venture fund markets in developing countries have been structuring only in recent years. For the initial phases of the structuring, public R&D funds are important. Public financing policies are used for advanced technology sectors, like biotechnology, in many developing countries as in South Korea (Kang and Park, 2012). Experiences of successful countries show that the sector needs to be seen as a strategic one and to be supported by the governments (Narasimharao, 2009).
Valuation and valuation methods in the biotechnology sector
Risk capital plays an important role in the development of the sector since it provides financial resources (Senker, 1998). Geography plays an important role in obtaining and distributing the risk capital (Zook, 2002; Waxell and Malmberg, 2007). The development of risk capital, in turn, depends on economic values of companies being financed and/or economic values of R&D projects. Similarly, other important activities such as mergers and acquisitions, licensing, public offering, technology transfer, portfolio management, fund raising, joint venture, and collaborations, requires valuation of intangible assets (Üreten and Ercan, 2000). Licensing and technology transfers are the second most common activities where valuation is used the most (Awny, 2005). For small biotechnology companies, it can be difficult to commercialize and market the new products they created through R&D projects. Moreover, completed or continuing R&D projects are especially among the most valuable assets for these companies. Their long-term success depends on the success of their R&D projects and their

An economic valuation of a biotechnology R&D project in a developing economy
DOI: 10.2225/vol15-issue3-fulltext-3 5
commercialization (Mcnamara and Baden-Fuller, 2007). Furthermore, the correct calculation of the value of the projects is important for determining the fair value of the whole company, and thus for successfully managing mergers and acquisitions activities, which has increased in recent years. On the other hand, valuation in the biotechnology sector is rather difficult due to long research and product development phases involving high risks and uncertainty that are sensitive to the changes in market conditions (Hartmann and Hassan, 2006). The fundamental considerations about valuation are: choosing the right valuation method, determining the inputs specific to the company and the sector, and interpreting the results correctly. When companies are at the point of licensing, merging, being acquired or acquiring, they need to employ a valuation method showing the values of the projects that are just started or in the development stages (Bogdan and Villiger, 2008). There are two basic valuation methods used for the biotechnology sector; the discounted cash flow (DCF) and real options. Although DCF is a traditional method used for years, valuation with real options has gained importance in recent years and stems as the major alternative in valuation studies for life sciences (Gürbüz and Ergincan, 2004).
The fundamental deficiency in traditional methods such as DCF is the lack of flexibility for managers’ decision making processes. The changes in the project in time and existing options are not taken into account under DCF (Senel, 2004). Managerial flexibility is the ability to make decision during the project to maximize expected returns or to minimize expected losses (Schulmerich, 2005). Real options method was developed to fulfil the deficiencies of the traditional methods, but has a complex implementation compared to other methods like DCF. It is basically the expanded version of DCF, taking into account real managerial flexibility (Schulmerich, 2005). It enables the managers to handle projects as a phase where they can constantly reshape it in the light of changes that might occur in the technology or in the market (Neely and Neufville, 2001). Under uncertainty, it accounts for the choices to use or decline possible options (Miller and Shapira, 2004; Benaroch et al. 2006; Mun, 2006). Therefore, it is used as an important tool in valuing of investment and strategic decisions in sectors that have long R&D phases with high costs (Bowman and Moskowitz, 2001; Mcgrath and Nerkar, 2004). It is advised in the literature that managers should use real options to value their long-term investments and use the value as an input in their decisions (Denison, 2009; Denison et al. 2011).
Moreover, the complexity in the implementation of the real positions method is decreasing, while the managers are still reluctant about employing it (Graham and Harvey, 2001). The number of valuation studies in the biotechnology sector is low, mainly due to the young age of the sector and lack of data. Studies are carried out with a combination of more than one approach instead of using a single model most of the time. In this study, both the real options and DCF methods are employed.
CASE STUDY
The Company chosen for the study is a biotechnology firm operating in the health sector in Turkey. It has been carrying out various R&D projects. This study focuses on an ongoing R&D project (from now on the Project) that was started in 2010. There are important decisions and choices to be made by the manager throughout the Project. The analysis illustrates how the valuation process and its consequences affect the decisions and choices of the manager of the Company. More importantly, the created model provides theoretical and practical information on the economic valuation of R&D projects for biotechnology companies in developing economies in general and for biotechnology companies in Turkey in particular.
The Project is analyzed under a case study. The data was gathered through in-depth interview method between September 2009 and April 2010. Interview questions and the type of data to be collected were constructed prior to the interviews, based on the literature surveyed. The following data was received from the Company: general information on the sector and the subsector that the Company is active in; the Company’s performance and market share; the number of products that the Company has on the market; product development and R&D phases of the Project; the types of the financing instruments used for the Project; the Project stages, their length and success rates; general information about the market for which the product is targeted; prediction of the number of years that the product will sell until a similar one comes along after it enters the market; the market entry costs of the targeted product after the Project completion; sale figures expected from the product and their probability of occurrence; relevant information on the risk profile of the Project and the Company. In addition, the information on the previous projects of the Company was obtained from the officials. This information was used to calculate the success rates for the project stages, expected sales values, and probability of sales.

Celikkol and Arslanhan
DOI: 10.2225/vol15-issue3-fulltext-3 6
The Project was not financed entirely from the Company’s own equity. Part of the financing came from a public institution in the form of a grant. The financing structure of the Project makes the Project attractive for this valuation analysis since it requires special modifications of one of the key variables in the model, i.e. the discount rate. The illustration of these modifications are important for the valuation of R&D projects and companies in developing market economies where this type of public interventions are commonly observed.
The Project basically consists of two R&D phases, first R&D phase and second R&D phase. Once the first R&D phase is completed, there will be a developed product to be placed in the market. However, if the market entry with this product is not chosen and the second R&D phase is initiated, then various features will be added to the product to make it a new one. Consistent with the literature, the first R&D phase is seen as the planned path and the second R&D phase is seen as a real option (Barnett, 2005). In order to protect the Company's privacy, the product that emerged at the end of the first R&D phase is called, Product A and the product created at the end of the second R&D phase is called, Product B.
The Project’s first R&D phase began in 2010 and the valuation analysis was done in 2010. The first R&D phase consists of three different six-month length periods. In the first half of 2011, the first R&D phase of the Project was completed. Upon completion, the Company needed to decide whether to carry on with the validation and certification phase for Product A to enter into the market or to continue with the second R&D phase to differentiate and develop it further as Product B. If continued to the second R&D phase, this phase will consist of three different six-month length periods. After the second R&D phase is completed, it is expected that it will be moved on to the validation and certification phase for Product B. Product B will be ready for market entry in 2014. R&D, operation, validation-certification and sale-marketing costs are the basic cost data in both DCF and real options methods (Hsu and Schwartz, 2003). Since the start of the first R&D phase in 2010, various costs have been incurred in the Project.
There are four main categories of costs to be calculated: (1) R&D expenses, (2) overhead cost associated with the Project, (3) validation and certification expenses and (4) production and sales-marketing expenses. The R&D expenses calculated during the project-writing phase were obtained from the Company. The overhead costs that will be incurred during the Project required to be calculated. The Project takes a share from the Company's overhead cost that is made up of general staff and management expenses. This share was calculated by finding out the percentage of the turnover that the Company allocates to R&D activities and the percentage shares that each R&D project receives from the overall R&D budget. The percentage share of each project depends on its size. The overhead cost calculated for the Project was added to their R&D expenses of the Project. Similar computations were carried out for the second phase of the Project. The validation and certification costs for the product created was estimated by taking into account the Company’s validation and certification costs for previous projects of similar sizes. The final cost item is the production and sales-marketing costs of the product once it enters the market. It was estimated separately for Product A and B, in a manner similar to the validation and certification costs. These costs will be incurred throughout the period that the products would stay on the market. They were projected by estimating the number of products that would be sold in a year, the structure of the market and target customers. Sales estimations for Product A and Product B were taken separately from the Company official. The associated sales probabilities were determined by analyzing similar projects carried out previously. The total cost of the Project was then calculated by adding up the expenses in all four categories.
Another crucial variable that affects the results of the valuation analysis is the discount rate that allows to carry the future values back to the date of the analysis. The discount rate varies depending on the country, the sector, the company and the valuated project. In developing countries, this rate needs to be calculated by taking into account the country’s specific risks. In this study it was calculated by taking into account the developing market characteristics of Turkey as well as the financing structure of the Project. The combination of the two methods was used to calculate the discount rate to take into account the effect of public grant received; the Capital Asset Pricing Model (CAPM) and weighted average cost of capital (WACC). The CAPM is a widely used model in life sciences reflecting particular risks to discount rate: i = r + βk, where i stands for the discount rate, r for the risk free rate of interest, β for the risk premium for company size, and k for the market risk premium of the country. The risk free interest rate, r, was around 5% in 2007 in Turkey and it was around 7% in 2010. Therefore, given that the valuation was done in 2010, 7% was used for the risk free interest rate (Statistics of the Undersecretary of Treasury, 2010). In addition to the risk free rate, market risk premium of the country

An economic valuation of a biotechnology R&D project in a developing economy
DOI: 10.2225/vol15-issue3-fulltext-3 7
is another parameter, k, to be used in calculating the discount rate. Market risk premium data for different countries for the biotechnology sector was obtained from different sources and comparatively evaluated. While the risk premium for countries in the high-income group is below 1%, the risk premium for Turkey, as a developing economy, is 5.25% (OECD, 2010). The β coefficient is taken as two for small companies in the biotechnology sector (Cockburn and Lerner, 2009). Thus, the discount rate is calculated as 17,5%:
i =7 + (2 x 5,25) = 17,5
The CAPM is used in cases where the whole project financing is supplied from the equity. The R&D Project in this study was financed in 40% by equity and in 60% by a grant from a public institution. This requires adjustment to the discount rate calculated under CAPM via WACC method. The discount rate
after adjustment is , where Wj and ij are the weight and the cost for the j the financing source, respectively. With the given percentage weights in the capital structure, the discount rate is adjusted down to 7%: p = 0.4 x 17,5 + 0.6 x 0 = 7.
As aforementioned earlier, due to varying risk factors, when the risk premiums and beta coefficient are changed, different discount rates are calculated. In other words, when the risk premium is different for countries in different income groups, for the companies in different sizes and the sectors, the beta coefficient change. A current empirical study shows that the future proceeds from and riskiness of R&D projects are systematically related to the size of companies and point out that R&D investments of big companies are less risky compared to smaller ones (Ciftci and Cready, 2011). When the discount rates used for companies that are in different sizes and serving different biotechnology sectors are examined, it is observed that the discount rate might go over 20% for some risky projects and small companies (Bogdan and Villiger, 2008). Therefore, in order to illustrate the effects of less and more risky circumstances on the value of the project, various discount rates and associated sensitivity analysis were conducted (Table 1 and Table 2).
In addition to the risk structure of the Project, uncertainties related to the Project are other important inputs to valuation analysis with real options method (Bogdan and Villiger, 2008). The Project uncertainties were reflected as volatilities, up and down movements, in the expected sale figures. The volatility is directly affected by the uncertainty associated with the products, the performance of the company, the company’s risk profile and product market conditions. It is possible to find volatility ranges for the different sectors in the literature. In sectors like biotechnology where the risk is high and the returns are obtained after long periods into the future, the volatility is expected to be high. The volatility for companies in the biotechnology sector takes values between 20% and 70% (Bogdan and Villiger, 2008). Country and market conditions, company performance and size are responsible for the width of this rage. For small biotechnology companies, the uncertainty in the form of fluctuation in sales revenues might even go up to 50%-60%. In the study, based on the company official’s view, volatility of sales was chosen as 40%. Moreover, a sensitivity analysis was conducted with various volatility values (Table 3).
METHODOLOGY
Based on the literature and the information gathered from the Company, the value of the selected project was calculated by DCF and real options method. The Project is an ongoing R&D project and there was a major decision point at the end of the first R&D phase (Figure 3). When the first R&D phase was completed, either Product A might be presented to the market in 2012 or the R&D activities should proceed to the second phase and Product B launched to the market in 2014. This decision was needed to be made before the end of the first half of 2011. This decision is important as it affects the future success of the Company. Furthermore, it is also important as regards to the efficiency of public funds granted. Therefore, both from the Company's and the public policy perspective, a sound decision making is necessary. For sound decisions the Company managers need to know the value of the Project as well as the value of the option of producing Product B. Valuation of the Project with real options method provides that information as an input for the Managers before the decision time comes. This analysis was done in 2010, before the decision time was reached. Valuation was carried out separately for Product A and Product B under real options and DCF. In addition to real options, DCF
Celikkol and Arslanhan
DOI: 10.2225/vol15-issue3-fulltext-3 8
valuation was also done since it is the most commonly used valuation methodology despite its limitations in regard to option valuations. The difference between the two methods and its effect on the decision made are evaluated together in the results section.
In real options method, solutions are done through the Black-Scholes Model or the Binominal Tree. In parallel to biotechnology literature, the sales expectations and its probabilities were calculated by the binomial tree method. The binomial method allows users to easily follow each phase and compute valuation results more easily. While forming a binomial tree, the starting values of sales need to be calculated. These values were obtained from the Company official as 300,000 Turkish Lira (TL) and 700,000 TL for Product A and Product B, respectively. It was forecasted that if Product A enters the market, it will stay until 2020 and if Product B enters the market it will stay until 2027. The starting values were moved forward to the market entry year by multiplying them by the up and down coefficients given in Equation 1.
[Equation 1]
where “σ” denotes volatility and was taken as 40%. ∆t denotes the time passed and was specified as 1, since sale figures were calculated for each year. The probabilities associated with sales values, p, were computed by using, the u and d coefficients and risk free interest rate, r:
[Equation 2]
From the starting value in 2010, the binominal tree sale expectations (first line in the cells) and the probabilities (second line in the cells) are shown in Figure 4 for Product A and in Figure 5 for Product B.
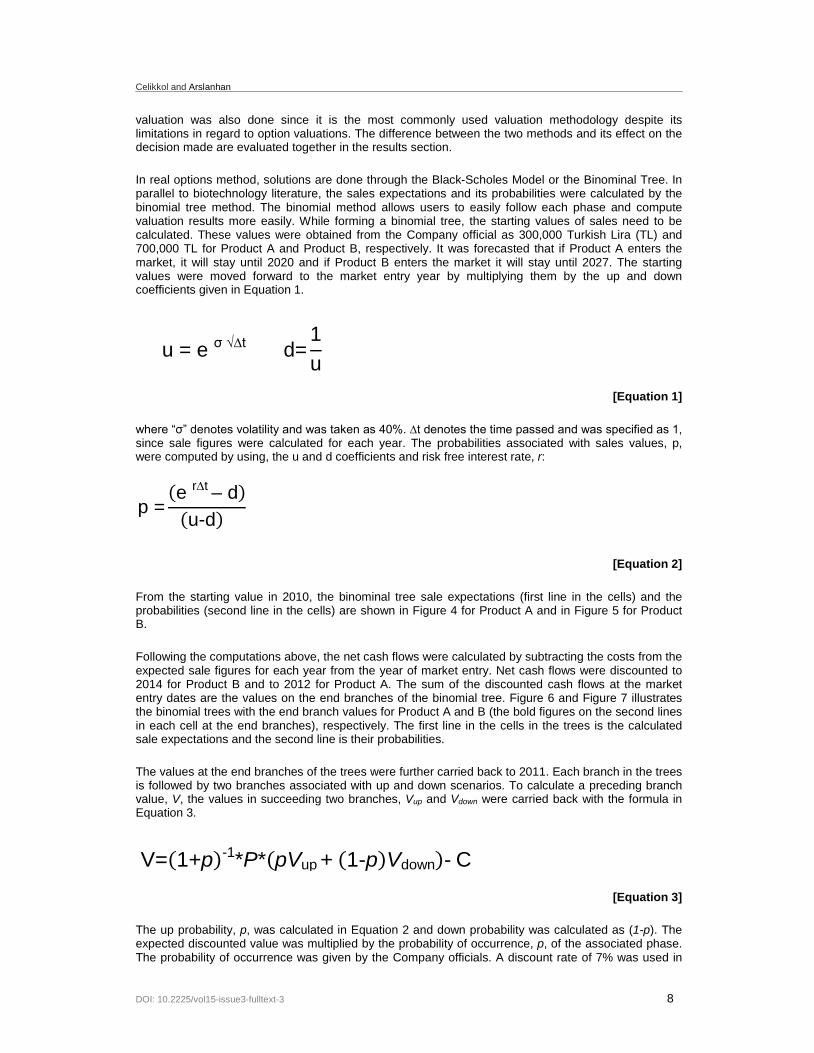
Following the computations above, the net cash flows were calculated by subtracting the costs from the expected sale figures for each year from the year of market entry. Net cash flows were discounted to 2014 for Product B and to 2012 for Product A. The sum of the discounted cash flows at the market entry dates are the values on the end branches of the binomial tree. Figure 6 and Figure 7 illustrates the binomial trees with the end branch values for Product A and B (the bold figures on the second lines in each cell at the end branches), respectively. The first line in the cells in the trees is the calculated sale expectations and the second line is their probabilities.
The values at the end branches of the trees were further carried back to 2011. Each branch in the trees is followed by two branches associated with up and down scenarios. To calculate a preceding branch value, V, the values in succeeding two branches, Vup and Vdown were carried back with the formula in Equation 3.
[Equation 3]
The up probability, p, was calculated in Equation 2 and down probability was calculated as (1-p). The expected discounted value was multiplied by the probability of occurrence, p, of the associated phase. The probability of occurrence was given by the Company officials. A discount rate of 7% was used in
u = e σ √∆t d=1u
p =(e r∆t – d)
(u-d)
V=(1+p)-1*P*(pVup + (1-p)Vdown)- C

An economic valuation of a biotechnology R&D project in a developing economy
DOI: 10.2225/vol15-issue3-fulltext-3 9
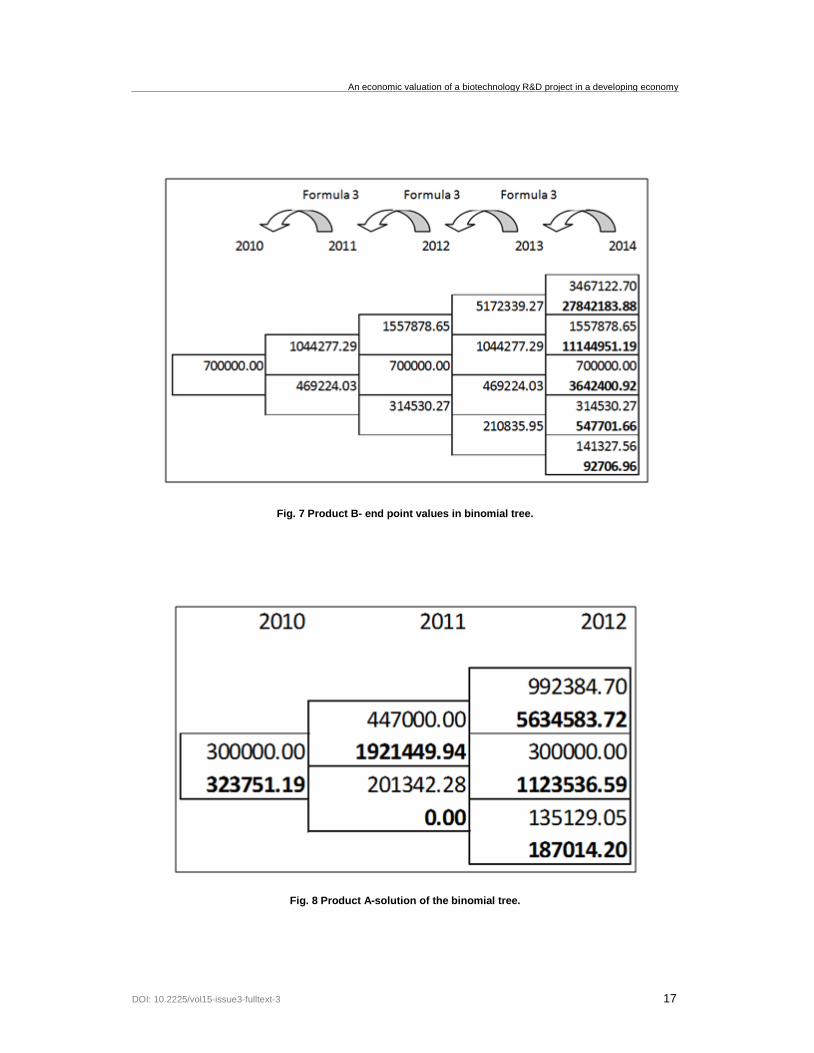
the calculations. C is the cost realized in the calculated year and made up of R&D expenses. The values carried forward are presented in bold in the binomial trees for Product A and B in Figures 8 and Figure 9, respectively. The negative values obtained are taken as “zero” (Bogdan and Villiger, 2008). A negatively valued option will not be preferred by the decision maker.
The DCF was also employed to value the R&D process and the results are presented in Figures 10 and Figure 11 for Product A and Product B, respectively (The value of Product B under DCF was calculated just to give idea about what would be the value of it under this method. As noted before, Product B is an option to the planned path and thus DCF method does not take into account its value). For the DCF method, sales figures and their realization probabilities were obtained by the interviews with the Company officials. The DCF and Real options valuation results are contrasted comparatively in the next section.
RESULTS
As mentioned before, the Project has two R&D phases. Product A will be produced at the end of the first phase and Product B will be produced at the end of the second phase. In other words, there is an option for the Company to continue with the R&D in the second phase and introduce Product B to the market. The valuation results under both methods, DCF and real options, indicate that the option of entry into the market with Product B is more valuable than Product A. Under real options method, the value of Product B is 782,528 TL and that of Product A is 323,751 TL. Pertaining to the decision to be made, going for the Product B option is more profitable for the Company. Thus, in any transactions such as acquisition of the Company, the value of the R&D Project needs to be taken as 782,528 TL.
Results using DCF method differ from those obtained by real options method. The real option method includes the values of the options in the Project value and employs binomial tree approach. It provides flexibility to the manager at the very beginning of the Project to do resource planning for the option available. On the other hand the DCF permits to value only the initially planned path with no options. Consistent with the literature (Barnett, 2005), the Project value under the DCF is lower than that under real options. The value of the planned path, Product A, is 288,388 TL under DCF. If DCF is the accepted method of valuation, the value of the project will be taken as 288,388 TL under any market transactions. This figure is 323,751 TL with Product A option and 782,528 TL with Product B option. The differences between the figures are due to the differences between the two methods. Primarily, as mentioned above, real options accounts the value of option faced during the project implementation. Secondarily, it uses sale figures and probabilities calculated through either binomial tree approach or Black-Scholes Model while the DCF method uses management estimates of these data for each year into the future. The management relies on the expansion rates of sales in similar projects completed in the past years to provide these estimates.
Furthermore, the resulting values depend on risk and uncertainty levels associated with the Project. In order to analyze the impact of risk and uncertainty on the results, sensitivity analyses were carried out. Thus, the Project value under various discount rates and volatility levels were calculated. Given the nature of the methods, the real options method is sensitive to both discount rate and volatility while the DCF is sensitive to discount rates (Bogdan and Villiger, 2008). Discount rates obtained under various scenarios are displayed in Table 1. The economic value of the project calculated using these discount rates is displayed in Table 2. A change in the country’s risk for a company in low technology sector rather than a high technology one, and a change in the size of the company alters the discount rate. When the country, sector and/or company risks increase, the difference between the values of the Project’s under real options and DCF increase. For example, if the project was financed completely from the equity, the discount rate would be 17.5%. With a 17.5% discount rate, the Project becomes viable only under real options, but if DCF is used, it will be rejected. However, public intervention in the form of a grant with zero interest rate and no back payments makes the Project attractive under both methods by pulling down the discount rate to 7%. On the other hand, if economic conditions change and make the risk free interest rate or the country's risk premium higher and the discount rate rise to 25%, the Project will not be profitable regardless of the valuation method used.
The uncertainty is reflected in the volatility values. The results under different volatility values are presented in Table 3. The change of the volatility value, directly affects the valuation results in the real options method by changing the estimation of sale expectations and probabilities. In the valuation with

Celikkol and Arslanhan
DOI: 10.2225/vol15-issue3-fulltext-3 10
DCF, since a binomial tree is not formed, the effect of uncertainty cannot be clearly monitored. The volatility rate increases in high technology and risky sectors such as biotechnology. There are different volatility calculation methods (Cassimon et al. 2011), however, due to the data constraints for the sector and the Company under the study, the volatility has been taken as 40% based on the opinions of company officials. As it can be seen from the values in the table, as volatility increases, the differences between values under both methods increase. Volatility increases the value of options (Hull, 2006).
DISCUSSION
Biotechnology processes have important roles as complementary and substitute technologies in technological development of key sectors, mainly health, energy and agriculture in any economies. Moreover, trends like increasing and aging population and changing illness structures carries it to a rather important place in health services and food, energy and water demand. The performance of the biotechnology sector itself and the sectors that it technologically integrates with, is closely related to the economic growth and welfare increase in developing economies. In the biotechnology field, as scientific publications and patent numbers increase rapidly, commercialization of these activities intensifies and the number and size of biotechnology companies in the World increases. Biotechnology provides developing economies with opportunities to increase their competitiveness sustain their development and become global centres. Since biotechnology companies are mainly based on R&D activities related to intangible assets such as patents, they deal with economic transactions such as technology transfers, license agreements, joint projects, and mergers and acquisitions. Furthermore, for the development of the sector, financing models are very important. In countries where the biotechnology sector is immature or still growing sluggishly, risk capital comes to the forefront. All of these dynamics necessitate valuation of global and national biotechnology companies, and their R&D projects and intellectual properties.
This study aimed to analyze economic valuation process of an incomplete R&D project of a biotechnology company serving to the health sector in Turkey, being the study applicable in other developing economies. The data was gathered through in-depth interviews under the case study. Real options and DCF methods were used for the valuation by integrating developing country features of the Country. Real option provides managers with flexibility and permits to value the options that arise during the project. DCF is the traditional and more widely used method due to its ease of implementation and relatively less data requirement (Nielsen, 2009). Both Product A and B turned out to be more valuable under the real options than DCF. Thus, the value of the Project under real options exceeds its value under DCF. These findings are consistent with the findings of the studies in the literature. The decision of the Company Manager changes with the methods employed. While the decision might be not to start the Project under DCF, it might be to move on with real option method. Moreover, the method chosen affects the decisions of public officials and venture capitalists, also. These decisions shape the future of the sector.
The sensitivity analysis shows that risky circumstances reduce the value of R&D project. Risk of a project increases in developing economies, makes the project less valuable through the use of higher discount rate. On the other hand, public grants reduce the cost of capital and increase the value of the project, which in turn helps the sector to grow. However, if DCF method is used in presence of these funds, less viable options will become more attractive and thus decisions of managers will be erroneous. Therefore, under different valuation methods, the effects of public finances on the value of projects need to be investigated before they are provided.
Although the Country’s genetic diversity and biological resource potential is promising, the biotechnology sector in Turkey is relatively young as opposed to the ones in developed economies. The majority of the companies in Turkey’s biotechnology sector are small and medium size enterprises. Different forms of financial support, including the ones from public institutions, are very important for successful development and commercialization processes of innovations of especially small companies. As in many developing nations, venture capital market is very thin. Public institutions provide support with certain forms of interventions. For these supports to be fruitful, the selection of R&D projects to be funded need to be done carefully. Moreover, ex-post assessments of policy tools or intervention mechanisms need to be conducted. Resources such as risk capital, public grants or low interest debts necessary for the development of the sector are much more limited in developing economies. The scarcity of resources requires them to be distributed more carefully. Thus, economic

An economic valuation of a biotechnology R&D project in a developing economy
DOI: 10.2225/vol15-issue3-fulltext-3 11
valuation of the projects becomes indispensible input for ex-ante funding decisions and ex-post effectiveness analysis. The valuations need to incorporate idiosyncratic characteristics of projects, company, market and country.
From a policy point of view, it is observed that economic values of biotechnology intangibles are affected by country and sector risks and by public financing. Thus, both macroeconomic and microeconomic policy interventions become important for the development of biotechnology in developing economies. While public financing enables the risky R&D projects to take place, it makes them more valued than they would be under no intervention policy. Thus long-run effects of public support need to be carefully studied and its benefits and costs need to be assessed in developing economies.
REFERENCES
AGUILAR, A.; BOCHEREAU, L. and MATTHİESSEN-GUYADER, L. (2008). Biotechnology and sustainability: The role of transatlantic cooperation in research and innovation. Trends in Biotechnology, vol. 26, no. 4, p. 163-165. [CrossRef]
ANDERSON, K. (2010). Economic impacts of policies affecting crop biotechnology and trade. New Biotechnology, vol. 27, no. 5, p. 558-564. [CrossRef]
AUDRETSCH, D.B. (2001). The role of small firms in U.S. biotechnology clusters. Small Business Economics, vol. 17, no. 1-2, p. 3-15. [CrossRef]
AWNY, M.M. (2005). Technology transfer and implementation processes in developing countries. International Journal of Technology Management, vol. 32, no. 1-2, p. 213-220. [CrossRef]
BARNETT, M. (2005). Paying attention to real options. R&D Management, vol. 35, no. 1, p. 61-72. BAUM, J.A.C. and SILVERMAN, B.S. (2004). Picking winners or building them? Alliance, intellectual, and human
capital as selection criteria in venture financing and performance of biotechnology startups. Journal of Business Venturing, vol. 19, no. 3, p. 411-436. [CrossRef]
BENAROCH, B.; LICHTENSTEIN, Y. and ROBINSON, K. (2006). Real option in information technology risk management: An empirical validation of risk-option relationships. MIS Quarterly, vol. 30, no. 4, p. 827-864.
BIGLIARDI, B.; NOSELLA, A. and VERBANO, C. (2005). Business models in Italian biotechnology industry: A quantitative analysis. Technovation, vol. 25, no. 11, p. 1299-1306. [CrossRef]
BOGDAN, B. and VILLIGER, R. (2008). Valuation in life sciences: A practical guide. 2nd edition. Springer, 370 p. ISBN 3642108199.
BOWMAN, E.H. and MOSKOWITZ, G.T. (2001). Real option analysis and strategic decision making. Organization Science, vol. 12, no. 6, p. 772-777. [CrossRef]
BRAUN, R. (2002). People’s concerns about biotechnology: Some problems and some solutions. Journal of Biotechnology, vol. 98, no. 1, p. 3-8. [CrossRef]
BUSTAMANTE, P. and BOWRA, S. (2002). Biotechnology in developing countries: Harnessing the potential of high-tech SMEs in the face of global competition. Electronic Journal of Biotechnology, vol. 5, no. 3, p. 196-202. [CrossRef]
CASSIMON, D.; ENGELEN, P.J. and YORDANOV, V. (2011). Compound real option valuation with phase-specific volatility: A multi-phase mobile payments case study. Technovation, vol. 31, no. 5-6, p. 240-255. [CrossRef]
ÇETİNDAMAR, D. and LAAGE-HELLMAN, J. (2001). Growth dynamics in biomedical/biotechnology system. Small Business Economics, vol. 20, no. 4, p. 287-303. [CrossRef]
CICHOCKA, D.; CLAXTON, D.; ECONOMIDIS, I.; HÖGEL, J.; VENTURI, P. and AGUILAR, A. (2011). European Union research and innovation perspectives on biotechnology. Journal of Biotechnology, vol. 156, no. 4, p. 382-391. [CrossRef]
CIFTCI, M. and CREADY, W.M. (2011). Scale effects of R&D as reflected in earnings and returns. Journal of Accounting and Economics, vol. 52, no. 1, p. 62-80. [CrossRef]
COCKBURN, I. and LERNER, J. (2009). The importance of evaluating the cost of capital for early-stage biotechnology ventures to preserve innovation. National Venture Capital Organization. Boston University and Harvard University, p. 23-29.
COOKE, P. (2001). Biotechnology clusters in the U.K.: Lessons from localization in the commercialization of science. Small Business Economics, vol. 17, no. 1-2, p. 43-59. [CrossRef]
DA SILVA, E.J.; BAYDOUN, E. and BADRAN, A. (2002). Biotechnology and the developing world. Electronic Journal of Biotechnology, vol. 5, no. 1, p. 64-92. [CrossRef]
DELOITTE. (2006). The future of life sciences industries: Strategies for success in 2015. Survey results from Deloitte and the EIU, 36 p.
DENISON, C.A. (2009). Real options and escalation of commitment: A behavioral analysis of capital investment decision. The Accounting Review, vol. 84, no. 1, p. 133-155. [CrossRef]
DENISON, C.A.; FARRELL, M.A. and JACKSON, K.E. (2011). Managers’ incorporation of the value of real options into their long-term investment decisions: An experimental investigation. Contemporary Accounting Research, Early View. [CrossRef]
DIAZ, V.; MUÑOZ, E.; ESPINOSA DE LOS MONTEROS, J. and SENKER, J. (2002). The socio-economic landscape of biotechnology in Spain. A comparative study using the innovation system concept. Journal of Biotechnology, vol. 98, no. 1, p. 25-40. [CrossRef]

Celikkol and Arslanhan
DOI: 10.2225/vol15-issue3-fulltext-3 12
ENRIQUEZ, J. (2001). Green biotechnology and European competitiveness. Trends in Biotechnology, vol. 19, no. 4, p. 135-139. [CrossRef]
ERNST and YOUNG. (2008). Beyond Borders, Global Biotechnology Report. [11 April 2012]. Available from Internet: http://www2.eycom.ch/publications/items/biotech-report/2008/2008_EY_Global_Biotech_Report.pdf. 110 p.
FONTES, M. (2005). The process of transformation of scientific and technological knowledge into economic value conducted by biotechnology spin-offs. Technovation, vol. 25, no. 4, p. 339-347. [CrossRef]
FUCHS, G. (2001). Introduction: Biotechnology in comparative perspective-regional concentration and industrial dynamics. Small Business Economics, vol. 17, no. 1-2, p. 1-2. [CrossRef]
GEDAJLOVIC, E.; CAO, Q. and ZHANG, H. (2011). Corporate shareholdings and organizational ambidexterity in high-tech SMEs: Evidence from a transitional economy. Journal of Business Venturing. In Press. [CrossRef]
GRAHAM, J. and HARVEY, C. (2001). The theory and practice of corporate finance: Evidence from the field. Journal of Financial Economics, vol. 60, no. 2-3, p. 187-243. [CrossRef]
GÜLDEM, Z.Ö. (2011). Innovation in the health sector in Turkey on its way to European Union membership. No: TÜSİAD-T/2011/02/511, İstanbul. 40 p.
GÜRBÜZ, O. and ERGINCAN, Y. (2004). Sirket Degerlemesi Klasik ve Modern Yaklasımlar, Literatür Yayıncılık, İstanbul. 348 p. ISBN 979975040776.
HARTMANN, M. and HASSAN, A. (2006). Application of real option analysis for pharmaceutical R&D project valuation-empirical results from a survey. Research Policy, vol. 35, no. 3, p. 343-354. [CrossRef]
HERMANN, B.G.; BLOK, K. and PATEL, M.K. (2007). Producing bio-based bulk chemicals using industrial biotechnology saves energy and combats climate change. Environmental Science and Technology, vol. 41, no. 22, p. 7910-7921. [CrossRef]
HERNANDEZ-CUEVAS, C. and VALENZUELA, P.D.T. (2004). Strategies to capture biotechnology opportunities in Chile. Electronic Journal of Biotechnology, vol. 7, no. 2, p. 191-207. [CrossRef]
HOLM-NIELSEN, L. and AGAPITOVA, N. (2002). Chile-science, technology and innovation. Department of Human Development. The World Bank Latin America and the Caribbean Regional Office. No. 79.
HOSSEINI, S.J.; ESMAEELI, S. and ANSARI, B. (2011). Challenges in commercialization of nano and biotechnologies in agricultural sector of Iran. African Journal of Biotechnology, vol. 10, no. 34, p. 6516-6521.
HULL, J.C. (2006). Options, Futures and Other Derivatives. 6th edition. Pearson Prentice Hall, Upper Saddle River, New Jersey. 789 p. ISBN 0131499084.
HSU, J.C. and SCHWARTZ, E.S. (2003). A model of R&D valuation and the design of research incentives. Insurance: Mathematics and Economics, vol. 43, no. 3, p. 350-367.
KANG, K.N. and PARK, H. (2012). Influence of government R&D support and inter-firm collaborations on innovation in Korean biotechnology SMEs. Technovation, vol. 32, no. 1, p. 68-78. [CrossRef]
KRAUSS, G. and STAHLECKER, T. (2001). New biotechnology firms in Germany: Heidelberg and the bioregion rhine-neckar triangle. Small Business Economics, vol. 17, no. 1-2, p. 143-153. [CrossRef]
KRYL, D. (2001). Environmental and industrial biotechnology in developing countries. Electronic Journal of Biotechnology, vol. 4, no. 3. [CrossRef]
KUMAR, N.K.; QUACH, U.; THORSTEINSDOTTIR, H.; SOMSEKHAR, H.; DAAR, A.S. and SINGER, P.A. (2004). Indian biotechnology-rapidly evolving and industry led. Nature Biotechnology, vol. 22, no. 12s, p. DC31-DC36. [CrossRef]
LEE, J.-D. and PARK, C. (2006). Research and development linkages in a national innovation system: Factors affecting success and failure in Korea. Technovation, vol. 26, no. 9, p. 1045-1054. [CrossRef]
MARSH, D. (2003). Does New Zealand have an innovation system for biotechnology? Technovation, vol. 23, no. 2, p. 103-112. [CrossRef]
MCGRATH, R.G. and NERKAR, A. (2004). Real options reasoning and a new look at the R&D investment strategies of pharmaceutical firms. Strategic Management Journal, vol. 25, no. 1, p. 1-21. [CrossRef]
MCNAMARA, P. and BADEN-FULLER, C. (2007). Shareholder returns and the exploration-exploitation dilemma: R&D announcements by biotechnology firms. Research Policy, vol. 36, no. 4, p. 548-565. [CrossRef]
MILLER, K. and SHAPIRA, Z. (2004). An empirical test of heuristics and biases affecting real options valuation. Strategic Management Journal, vol. 25, no. 3, p. 269-284. [CrossRef]
MOWERY, D.C.; NELSON, R.R.; SAMPAT, B.N. and ZIEDONIS, A.A. (2001). The growth of patenting and licensing by U.S. universities: An assessment of the effects of the Bayh-Dole act of 1980. Research Policy, vol. 30, no. 1, p. 99-119. [CrossRef]
MÜLLER, C. (2002). The evolution of the biotechnology industry in Germany. Trends in Biotechnology, vol. 20, no. 7, p. 287-290. [CrossRef]
MUN, J. (2006). Real options analysis: Tools and techniques for valuing strategic investment and decisions. 2nd edition. Hoboken, NJ. John Wiley & Sons. 704 p. ISBN 978-0-471-74748-2.
NARASIMHARAO, B.P. (2009). Need for new trends in biotechnology education and training. Asian Biotechnology and Development Review, vol. 11, no. 2, p. 89-114.
NEELY, J.E. and NEUFVILLE, R. (2001). Hybrid real options valuation of risky product development projects. International Journal of Technology, Policy and Management, vol. 1, no. 1, p. 29-46.
NIELSEN, N.H. (2009). Financial valuation methods for biotechnology. Biostrat Biotech Consulting. 3 p. NOSELLA, A.; PETRONI, G. and VERBANO, C. (2005). Characteristics of the Italian biotechnology industry and
new business models: The initial results of an empirical study. Technovation, vol. 25, no. 8, p. 841-855. [CrossRef]
ORGANISATION FOR ECONOMIC CO-OPERATION AND DEVELOPMENT (OECD). (2009a). OECD Biotechnology Statistics 2009, OECD, Paris.
ORGANISATION FOR ECONOMIC CO-OPERATION AND DEVELOPMENT (OECD). (2009b). The Bioeconomy to 2030, OECD, Paris.

An economic valuation of a biotechnology R&D project in a developing economy
DOI: 10.2225/vol15-issue3-fulltext-3 13
ORGANISATION FOR ECONOMIC CO-OPERATION AND DEVELOPMENT (OECD). (2010). Workshop on Biotechnology for Environment in Future, Paris.
ORSENIGO, L. (2001). The (failed) development of a biotechnology cluster: The case of Lombardy. Small Business Economics, vol. 17, no. 1-2, p. 77-92. [CrossRef]
OWEN-SMITH, S.; RICCABONI, M.; PAMMOLLI, F. and POWELL, W.W. (2002). A comparison of U.S. and European university-industry relations in the life sciences. Management Science, vol. 48, no. 1, p. 24-43. [CrossRef]
PREVEZER, M. (2001). Ingredients in the early development of the U.S. biotechnology industry. Small Business Economics, vol. 17, no. 1-2, p. 17-29. [CrossRef]
SCHULMERICH, M. (2005). Real options valuation: The importance of interest rate modelling in theory and practice (lecture notes in economics and mathematical systems). Springer. 357 p. ISBN 9783540261919.
SENEL, K. (2004). The new valuation paradigm: Real options. İstanbul Ticaret Üniversitesi Dergisi, vol. 3, p. 105-119.
SENKER, J. (1998). Biotechnology and competitive advantage: Europe's firms and the U.S. challenge. Edward Elgar Publishing Ltd, Cheltenham. UK. 180 p. ISBN 1858987393.
State Planning Organization (SPO). (1998). The Science-Research-Technology Master Plan. Ankara. p. 31-35. Statistics of the Undersecretary of Treasury, 2010 [21 April 2010]. Available from Internet:
http://www.hazine.gov.tr/irj/portal/anonymous?NavigationTarget=navurl:/ /ca8a5b252efea63752b1cb4e1cc81997&InitialNodeFirstLevel=true
TAESUN, M. (2009). The biotechnology research and development supported by the Korea science and engineering foundation. New Biotechnology, vol. 25, p. s349. [CrossRef]
TAYMAZ, E. and ÜÇDOĞRUK, Y. (2009). Overcoming the double hurdles to investing in technology R&D activities of small firms in developing countries. Small Business Economics, vol. 33, no. 1, p. 109-128. [CrossRef]
THORSTEINSDÓTTIR, H.; QUACH, U.; DAAR, A.S. and SINGER, P.A. (2004). Conclusions: Promoting biotechnology innovation in developing countries. Nature Biotechnology, vol. 22, no. 12s, p. DC48-DC52. [CrossRef]
TODT, O.; GUTIERREZ-GRACIA, A.; FERNANDEZ DE LUCIO, I. and CASTRO-MARTÍNEZ, E. (2007). The regional dimension of innovation and the globalization of science: The case of biotechnology in a peripheral region of the European Union. R&D Management, vol. 37, no. 1, p. 65-74. [CrossRef]
TONUKARI, N.J. (2004). Fostering biotechnology entrepreneurship in developing countries. African Journal of Biotechnology, vol. 3, no. 6, p. 299-301.
TURKISH INDUSTRY & BUSINESS ASSOCIATION (TÜSIAD). (2006). Uluslar arası Rekabet Stratejileri: Türkiye’de Biyoteknoloji İşbirlikleri. No: TÜSİAD-T/2006/06-421, İstanbul, 208 p. ISBN 9944-405-00-0.
UN Population Division Statistics. (2011). [20 December, 2011]. Available from Internet: http://esa.un.org/unpd/wpp/unpp/panel_population.htm.
ÜRETEN, A. and ERCAN, M.K. (2000). Firma Değerinin Tespiti ve Yönetimi, Gazi Kitabevi, Ankara. 213 p. ISBN 975731353.
WAXELL, A. and MALMBERG, A. (2007). What is global and what is local in knowledge-generating interaction? The case of the biotech cluster in Uppsala, Sweden. Entrepreneurship and Regional Development, vol. 19, no. 2, p. 137-159. [CrossRef]
WOHLGEMUTH, R. (2009). The locks and keys to industrial biotechnology. New Biotechnology, vol. 25, no. 4, p. 204-213. [CrossRef]
WONG, J.; QUACH, U.; THORSTEINSDÓTTIR, H.; SINGER, P.A. and DAAR, A.S. (2004). South Korean biotechnology-a rising industrial and scientific powerhouse. Nature Biotechnology, vol. 22, no. 12s, p. D42-D47. [CrossRef]
YAGÜE-PERALES, R.M. and MARCH-CHORDÀ, I. (2011). Performance analysis of research spin-offs in the Spanish biotechnology industry. Journal of Business Research. In Press. [CrossRef]
ZELLER, C. (2001). Clustering biotech: A recipe for success? Spatial patterns of growth of biotechnology in Munich, Rhineland and Hamburg. Small Business Economics, vol. 17, no. 1-2, p. 123-141. [CrossRef]
ZOOK, M.A. (2002). Grounded capital: Venture financing and the geography of the internet industry, 1994-2000. Journal of Economic Geography, vol. 2, no. 2, p. 151-177. [CrossRef]
How to reference this article:
CELIKKOL ERBAS, B. and ARSLANHAN MEMIS, S. (2012). An economic valuation of a biotechnology R&D project in a developing economy. Electronic Journal of Biotechnology, vol. 15, no. 3. http://dx.doi.org/10.2225/vol15-issue3-fulltext-3
Note: Electronic Journal of Biotechnology is not responsible if on-line references cited on manuscripts are not available any more after the date of publication. Supported by UNESCO / MIRCEN network.

Celikkol and Arslanhan
DOI: 10.2225/vol15-issue3-fulltext-3 14
FIGURES
Fig. 1 Countries share (%) of patent applications in biotechnology. (Source: OECD, 2009a).
Fig. 2 Total venture capital investments in the life sciences, Million $ Purchasing Power Parity, 2007. (Source: OECD, 2009a).

An economic valuation of a biotechnology R&D project in a developing economy
DOI: 10.2225/vol15-issue3-fulltext-3 15
Fig. 3 The project phases.
Fig. 4 Product A- expected sales in binomial tree.

Celikkol and Arslanhan
DOI: 10.2225/vol15-issue3-fulltext-3 16
Fig. 5 Product B- expected sales in binomial tree.
Fig. 6 Product A- end point values in binomial tree.
An economic valuation of a biotechnology R&D project in a developing economy
DOI: 10.2225/vol15-issue3-fulltext-3 17
Fig. 7 Product B- end point values in binomial tree.
Fig. 8 Product A-solution of the binomial tree.

Celikkol and Arslanhan
DOI: 10.2225/vol15-issue3-fulltext-3 18
Fig. 9 Product B-solution of the binomial tree.
Fig. 10 Product A- discounted cash flows.
Fig. 11 Product B- discounted cash flows.

An economic valuation of a biotechnology R&D project in a developing economy
DOI: 10.2225/vol15-issue3-fulltext-3 19
TABLES
Table 1. Discount rates under various scenarios.
Risk-free
interest rate β co-efficient Risk Premium Expected rate of return
Small Sized Biotechnology Company in Turkey 7% 2 5.25% 17.5%
Large Sized Biotechnology Company in Turkey 7% 1 5.25% 12.25%
Small Sized Low Technology Company in Turkey 7% 1 4% 11%
Small Sized Biotechnology Company in developed countries 4% 1,5 1% 5.5%
Large Sized Biotechnology Company in developed countries 4% 1 1% 5%
Table 2. Sensitivity analysis: The results under different discount rates.
Economic Value (TL) Discount rate 7% 15% 17.5% 20% 25% Product B-Real Options 782,528 292,952 139,141 16,681 -132,536 Product A-Real Options 323,751 93,710 30,550 -25,123 -104,121 Product B- DCF 691,175 260,249 77,265 -74,593 -270,381 Product A- DCF 288,388 39,590 -22,742 -79,266 -162,545
Table 3. Sensitivity analysis: The results under different volatility values.
Economic Value (TL) Volatility 30% 40% 50% Product B-Real Options 744, 966 782,528 834,139 Product A-Real Options 293,814 323,751 365,170 Product B- DCF 691,175 691,175 691,175 Product A- DCF 288,388 288,388 288,388