Embed Size (px)
Citation preview
Contents lists available at ScienceDirect
Biological Conservation
journal homepage: www.elsevier.com/locate/biocon
An ecosystem-based risk assessment for California fisheries co-developed byscientists, managers, and stakeholdersJameal F. Samhouria,⁎, Errin Ramanujamb, Joseph J. Bizzarroc,d, Hayley Carterb, Kelly Saycee,Sara Shenea Conservation Biology Division, Northwest Fisheries Science Center, National Marine Fisheries Service, National Oceanic and Atmospheric Administration, United States ofAmericab California Ocean Science Trust, United States of Americac Institute of Marine Sciences, University of California, Santa Cruz, United States of Americad Fisheries Ecology Division, Southwest Fisheries Science Center, National Marine Fisheries Service, National Oceanic and Atmospheric Administration, United States ofAmericae Strategic Earth Consulting, United States of America
A R T I C L E I N F O
Keywords:Ecological risk assessmentEcosystem-based managementEcosystem-based fisheries managementHabitatsBycatchMarineCaliforniaParticipatory processStakeholder engagementKnowledgeDiversity
A B S T R A C T
The intensive harvest of wild populations for food can pose a risk to food security and to conservation goals.While ecosystem approaches to management offer a potential means to balance those risks, they require amethod of assessment that is commensurate across multiple objectives. A major challenge is conducting theseassessments in a way that considers the priorities and knowledge of stakeholders. In this study, we co-developedan ecological risk assessment (ERA) for fisheries in California (USA) with scientists, managers, and stakeholders.This ERA was intended to meet the requirements of existing policy mandates in the state of California andprovide a systematic, efficient, and transparent approach to prioritize fisheries for additional management ac-tions, including the development of fisheries management plans fully compliant with California laws. We as-sessed the relative risk posed to target species, bycatch, and habitats from nine state-managed fisheries andfound risk to target species was not necessarily similar to risks to bycatch and habitat groups. In addition, nosingle fishery consistently presented the greatest risk for all bycatch or habitat groups. However, considered incombination, the greatest risk for target species, bycatch groups, and habitats emerged from two commercialfisheries for California halibut. The participatory process used to generate these results offers the potential toincrease stakeholders' trust in the assessment and therefore its application in management. We suggest thatadopting similar processes in other management contexts and jurisdictions will advance progress toward eco-system-based fisheries management that simultaneously satisfies fisheries, conservation, and relationship-building objectives.
1. Introduction
Fishing is the most widespread practice of capturing wild animalsfor food in the modern world. This activity affects the populations thatare harvested, non-targeted species and habitats in the ecosystem, aswell as other user groups (e.g., ecotourists) and sectors (e.g., trans-portation, energy) (White et al., 2012). Yet viable approaches to eval-uate the ecosystem-wide effects of fishing are still nascent. Real-worldexamples of system-scale evaluations of the potential and realized im-pacts of fishing, developed with stakeholders and used by decisionmakers, are even less common (Dolan et al., 2016; Fletcher and Bianchi,2014; Marshall et al., 2017).
The appraisal of the potential ecosystem-wide effects of fishing canbe accomplished via a structured process known as risk assessment(Burgman, 2005). Risk assessment identifies the probabilities that fac-tors impeding or preventing the achievement of fisheries and ecosystemmanagement objectives will persist and the consequences if they do(ISO, 2009). A central challenge in traditional fisheries managementhas been to negotiate a balance between risk to the persistence ofexploited populations and benefits to people, including food provi-sioning, livelihoods, cultural connections, and way of life (Poe et al.,2014). Evolution of more traditional approaches toward ecosystem-based fisheries management (EBFM) has increased recognition thatfisheries also pose risk to species that are not targeted directly and to
https://doi.org/10.1016/j.biocon.2018.12.027Received 21 February 2018; Received in revised form 7 December 2018; Accepted 21 December 2018
⁎ Corresponding author.E-mail address: [email protected] (J.F. Samhouri).
Biological Conservation 231 (2019) 103–121
Available online 17 January 20190006-3207/ Published by Elsevier Ltd. This is an open access article under the CC BY-NC-ND license (http://creativecommons.org/licenses/BY-NC-ND/4.0/).
T
the habitats in which fisheries operate (Hobday et al., 2011). Over re-cent decades, frameworks for ecological risk assessments (ERAs) haveemerged alongside EBFM to enable formal assessment of potential un-intended consequences from fishing (Brown et al., 2013; Hobday et al.,2011; Micheli et al., 2014; Patrick et al., 2010; Samhouri and Levin,2012; Stobutzki et al., 2001). In fact, on a global scale, most EBFMapproaches call for ERAs (reviewed recently by Levin et al., 2018).
Although ERAs for the biophysical effects of fishing rely on a gen-erally consistent conceptual framework, they vary in the extent towhich they evaluate risk to target species alone (Patrick et al., 2010;Stobutzki et al., 2001) or risk to target species in combination withother ecosystem components (Battista et al., 2017; Micheli et al., 2014;O et al., 2012; Samhouri and Levin, 2012; Williams et al., 2011). Thislatter type of ERA is one of the few readily-available approaches thatcan integrate within existing US legal-regulatory processes to broadenfisheries perspectives from single-species toward communities andecosystems (Dolan et al., 2016; Gibbs and Browman, 2015; Hobdayet al., 2011; Hunsaker et al., 1990).
Existing ERAs for the effects of fishing also vary in the extent towhich they include government and stakeholders at each step of theirdevelopment to achieve shared support for management priorities (seerecent reviews in Holsman et al., 2017; Stelzenmüller et al., 2018).Indeed, evidence is accumulating that EBFM, like other types of en-vironmental management, will be most effective if it embraces riskassessment that fully integrates stakeholder needs and perspectives(Röckmann et al., 2017) and is matched to the timelines of decisionmakers. Participation can increase the public's perceived legitimacy ofERAs, even with little or no changes to computational methods. Thoughthe need for stakeholder participation and knowledge co-production isincreasingly appreciated in a variety of governance venues (Cook et al.,2013), it remains the exception rather than the rule for EBFM initiatives(Francis et al., 2018).
In this study we capitalized on an opportunity to co-develop an ERAfor fisheries in the state of California (USA) by participating in anamendment process to the Marine Life Management Act (MLMA)Master Plan1,2. This ERA is an ecosystem-based assessment of the re-lative risk posed to target species, and bycatch and habitat groups, fromnine fisheries in California (Fig. 1), based on the collective knowledgeof scientists, managers, and stakeholders. The result is a systematic,efficient, collaborative, and transparent approach to prioritize fisheriesspecies for additional management actions as required by the MLMA.The co-developed ERA reflects a substantive advancement towardEBFM in California because it incorporates extensive stakeholder input,reflects a broad focus on multiple aspects of the biophysical systemaffected by fisheries, and matches the decision timeline for the MLMAMaster Plan Amendment.
2. Methods
2.1. Project design
In California, the MLMA calls for the conservation, sustainable use,and where feasible, restoration of California's living marine resourcesand the habitats on which they depend. It also requires the engagementof fishery participants in developing ocean management actions,3 andexternal reviewers have emphasized this need (Harty et al., 2010). Ourwork was conducted from July 2016–July 2017 as a core component toinforming the MLMA Master Plan Amendment process,4 which was ledby CDFW from late 2015 to June 2018.
The MLMA Master Plan Amendment process includes a mandate to
prioritize fisheries for the preparation of FMPs. It stipulates that thisprioritization should be based on the need for changes in managementto comply with the broad objectives of the MLMA, including the “…sustainable use…of California's living marine resources and the habitatson which they depend.” ERAs provide an effective and quantitativeapproach to assess ecosystem components that are most likely to ex-perience a negative impact from human activities and natural stressors(Smith et al., 2014). The core concern of the ERA described here istherefore to evaluate which fisheries are posing the greatest risk toecosystem components (where ecosystem components are defined byMLMA).
In this study a project team consisting of CDFW staff scientists andmanagers and the authors of this manuscript developed the ERA fra-mework and analytical approach. It is adapted from Samhouri andLevin (2012), and we chose it after careful consideration of a number ofcompelling alternatives (Table 1). Like most ERAs developed for fish-eries and EBFM, this one relies on two axes of information. The firstaxis, referred to as exposure E, distinguishes and quantifies factors thatmodify the probability that a target species or associated ecosystemcomponent (e.g., bycatch species, habitat) is negatively affected by afishery. The second axis (sensitivity, S) focuses on factors that influencethe response of the ecosystem component if it is exposed to the fishery.More exposed and more sensitive ecosystem components (target spe-cies, bycatch groups, habitat groups) are considered to be at higher risk.We define a negative impact as an unwanted outcome, here assumed tobe the decline in abundance of a species or group, or in the area orquality of a habitat.
In order to be consistent with the MLMA Master Plan Amendment,we designed the ERA with the specific intent of incorporating inputfrom fishery participants and other interested stakeholders via work-shops. We define stakeholders as participants in the nine commercialand recreational fisheries assessed (Fig. 1), representatives from en-vironmental NGOs, academics, or scientists from other agencies. Thefisheries were often represented by anglers, commercial fishers, sport-fishing operators, and fishing community leaders.
We convened two workshops with stakeholders to solicit inputabout the framework itself, provide details of its implementation, andenable presentation of different options for consideration by CDFW staffand stakeholders. All interested stakeholders who learned about theworkshops through various communication channels and expressedinterest in participating were invited to attend. After each workshop,we incorporated input from CDFW staff and stakeholders to arrive atthe final product presented here. We did not intend to measure theinfluence of this participatory process, but rather built it into ourmethodological approach to increase transparency, meet the require-ments of the MLMA, and improve the risk assessment.
One consequence of co-developing this ERA is that difficult choiceshad to be made, and these choices reflected the personal and profes-sional biases and preferences of the project team and workshop parti-cipants. Some of these choices included identification of experts toconduct scoring assessments; selection of target species, and bycatchand habitat groups; and, disproportionate weighting of a subset of ex-posure and sensitivity attributes. Decisions around these issues allowedus to obtain full and meaningful engagement across a diversity ofparticipants at the workshops, and are described in detail below. Wedefined experts as CDFW staff most familiar with the social and eco-logical characteristics of the fisheries under study for this analysis(Fig. 1). These individuals were chosen by CDFW.
2.2. Defining units of analysis: Fisheries and ecosystem components
We developed this ERA and applied it as part of a pilot study ofseveral fisheries. Considerations for selection of a fishery included theneed for CDFW to understand its potential impact to invertebrate andvertebrate, nearshore and pelagic, upper- and lower-trophic level, and
1 https://www.dfg.ca.gov/marine/pdfs/binders_nc/b3_79.pdf2 https://www.wildlife.ca.gov/Conservation/Marine/MLMA/Master-Plan3 Section 7056, https://www.dfg.ca.gov/marine/pdfs/binders_nc/b3_79.pdf4 https://www.wildlife.ca.gov/Conservation/Marine/MLMA/Master-Plan
J.F. Samhouri et al. Biological Conservation 231 (2019) 103–121
104
data-rich and data-poor species. In addition, we wanted to capture sportand commercial sectors across the state, a range of gear types, varyingeconomic and socio-cultural values, and fisheries with and withoutexisting management plans. Final decisions concerning which speciesand fisheries to include were made by CDFW staff.
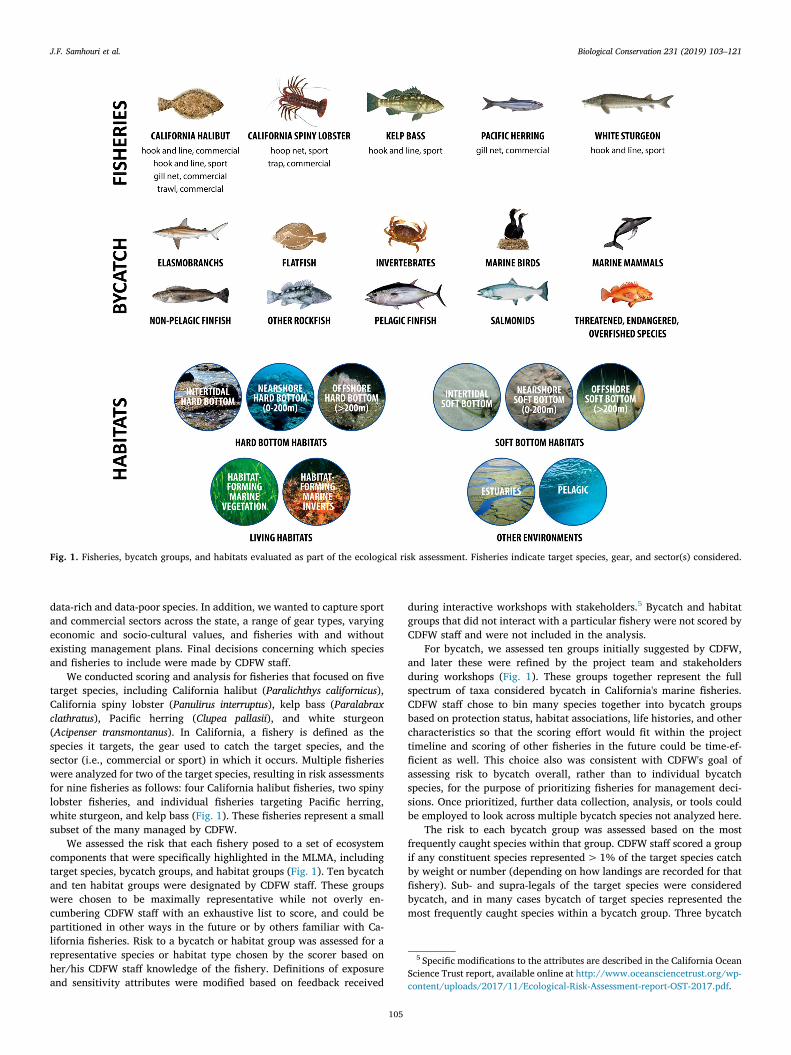
We conducted scoring and analysis for fisheries that focused on fivetarget species, including California halibut (Paralichthys californicus),California spiny lobster (Panulirus interruptus), kelp bass (Paralabraxclathratus), Pacific herring (Clupea pallasii), and white sturgeon(Acipenser transmontanus). In California, a fishery is defined as thespecies it targets, the gear used to catch the target species, and thesector (i.e., commercial or sport) in which it occurs. Multiple fisherieswere analyzed for two of the target species, resulting in risk assessmentsfor nine fisheries as follows: four California halibut fisheries, two spinylobster fisheries, and individual fisheries targeting Pacific herring,white sturgeon, and kelp bass (Fig. 1). These fisheries represent a smallsubset of the many managed by CDFW.
We assessed the risk that each fishery posed to a set of ecosystemcomponents that were specifically highlighted in the MLMA, includingtarget species, bycatch groups, and habitat groups (Fig. 1). Ten bycatchand ten habitat groups were designated by CDFW staff. These groupswere chosen to be maximally representative while not overly en-cumbering CDFW staff with an exhaustive list to score, and could bepartitioned in other ways in the future or by others familiar with Ca-lifornia fisheries. Risk to a bycatch or habitat group was assessed for arepresentative species or habitat type chosen by the scorer based onher/his CDFW staff knowledge of the fishery. Definitions of exposureand sensitivity attributes were modified based on feedback received
during interactive workshops with stakeholders.5 Bycatch and habitatgroups that did not interact with a particular fishery were not scored byCDFW staff and were not included in the analysis.
For bycatch, we assessed ten groups initially suggested by CDFW,and later these were refined by the project team and stakeholdersduring workshops (Fig. 1). These groups together represent the fullspectrum of taxa considered bycatch in California's marine fisheries.CDFW staff chose to bin many species together into bycatch groupsbased on protection status, habitat associations, life histories, and othercharacteristics so that the scoring effort would fit within the projecttimeline and scoring of other fisheries in the future could be time-ef-ficient as well. This choice also was consistent with CDFW's goal ofassessing risk to bycatch overall, rather than to individual bycatchspecies, for the purpose of prioritizing fisheries for management deci-sions. Once prioritized, further data collection, analysis, or tools couldbe employed to look across multiple bycatch species not analyzed here.
The risk to each bycatch group was assessed based on the mostfrequently caught species within that group. CDFW staff scored a groupif any constituent species represented>1% of the target species catchby weight or number (depending on how landings are recorded for thatfishery). Sub- and supra-legals of the target species were consideredbycatch, and in many cases bycatch of target species represented themost frequently caught species within a bycatch group. Three bycatch
Fig. 1. Fisheries, bycatch groups, and habitats evaluated as part of the ecological risk assessment. Fisheries indicate target species, gear, and sector(s) considered.
5 Specific modifications to the attributes are described in the California OceanScience Trust report, available online at http://www.oceansciencetrust.org/wp-content/uploads/2017/11/Ecological-Risk-Assessment-report-OST-2017.pdf.
J.F. Samhouri et al. Biological Conservation 231 (2019) 103–121
105
groups were scored differently: Marine Mammals, Marine Birds, andThreatened and Endangered Species and/or Overfished Rockfish. Forthese three bycatch groups, incidental catch of any species in the group,no matter the magnitude, caused CDFW staff to assign a score. Thisdecision was made because these groups include species with legalprotections that make even minimal bycatch an issue of managementconcern.
CDFW staff selected ten habitat groups (Fig. 1) based on theirknowledge of California coastal and oceanic ecosystems and char-acteristics of the nine fisheries under study. Habitat groups were re-stricted to those defined by CDFW and, like bycatch, limited so that thescoring effort would fit within the project timeline and scoring of otherfisheries in the future could be time efficient as well. CDFW staff alsoestimated the proportion of each fishery's activity that occurs in eachhabitat for use in subsequent analysis. As with bycatch, the habitatgroups were refined by the project team and stakeholders duringworkshops.
2.3. ERA framework
The risk assessment for each fishery was based on the exposure andsensitivity of each target, bycatch, or habitat group. CDFW staff quan-tified exposure and sensitivity based on sets of attributes (Tables 2–3).Individual attributes were assigned weightings based on their perceivedimportance in affecting exposure and sensitivity. Perceived importanceemerged from discussions with CDFW staff and via conversations at thestakeholder workshops. A single CDFW staff member scored target,bycatch, and habitat for each fishery, and revised these scores multipletimes following discussions with the project team and stakeholders. OneCDFW staff member worked with the other CDFW staff members toreview scores and ensure that the attributes were interpreted in aconsistent manner across all nine fisheries.
2.3.1. Data qualityAccounting for the quality of the data used to score attributes is a
key component of any modern ERA (Stelzenmüller et al., 2018). Be-cause ERAs are used to generate scores for data poor and data richfisheries, the information used for scoring can range from expert opi-nion to formal quantitative assessments. CDFW staff provided a dataquality rationale for each of the attributes they scored. This rationalewas based on whether peer-reviewed literature, personal observation,data, model output, or some other source of information was used todetermine the score (Table A1). The rationale used in scoring is veryimportant for interpreting results, for ensuring standardization inscoring rationale among CDFW staff, and for transparency with stake-holders. The data quality scores were adapted from Samhouri and Levin(2012). To summarize the assessment of data quality, we averaged dataquality scores across exposure or sensitivity attributes for each eco-system component.
2.4. Stakeholder engagement
We convened two workshops to introduce stakeholders to the ERAtool while it was still under development and solicit feedback and re-commendations for improvement. Workshops were held on two dif-ferent days in Long Beach (June 2017) and Santa Rosa (July 2017),California, between 0830 and 1500, to encourage broad stakeholderparticipation across the state and improve inclusivity (total number ofparticipants across both workshops: 28).
To ensure success in the project team's efforts to engage with andgenerate support from stakeholders during the development of the ERAtool (Bednarek et al., 2016), we worked with a local consulting firmthat specializes in building and fostering relationships with fishers andother interested stakeholders. Targeted outreach was conducted withfishing leadership within the nine pilot fisheries to increase commercialand recreational fishing representation. Outreach channels to solicitTa
ble1
Comparisonof
arangeof
ecological
risk
assessmenta
pproachesandconsiderations
fortheirapplicationto
Californiafisheries.
Consideration
Ecologicalrisk
assessmentfram
ework
EcologicalRisk
Assessm
ent
forFisheries(ERA
F)-
developedforCanadian
fisheries
(Oet
al.2
012)
CARE
andCA
RElitetool
-developedby
Environm
ental
Defense
Fund
(Battista
etal.,
2017)
EcologicalRisk
Assessm
entfor
theEff
ectsof
Fishing(ERA
EF)-
developedforAustralian
fisheries
(Hobdayet
al.,2011)
Multip
lestressor
ecosystem-based
risk
assessment-(Samhouri
andLevin,
2012)
Qualitativeconsequence
risk
assessmenta
nalysis-
developedforAustralian
fisheries
(Fletcher,2005)
Cumulativeim
pactsassessment-
aquantitativeassessmentfor
assessing
multip
lehu
man
impacts(Stelzenmüller
etal.,2010,H
alpern
etal.,2009)
Scalable(regionaland
statew
ide
application)
Yes
Needs
tobe
adapted
Yes
Yes
Yes
Yes
Efficiency
ofdevelopm
enta
ndapplication
Longer
Moderate
Lessfortarget,moderateto
high
forbycatchandhabitat
Lessfortarget,m
oderate
forhabitata
ndbycatch
Moderate
Moderateto
Longer
Scientifically
peer-reviewed
Yes
Yes
Yes
Yes
Yes
Yes
Dem
onstratedapplication
Yes
Yes
Yes
Yes
Yes
No
Addressfisheries
asCaliforniadefin
esthem
Yes
Needs
tobe
adapted
Needs
tobe
adapted
Yes
Needs
tobe
adapted
Yes
Addresshabitat,bycatch,andtargetspecies
insametool/scale
Yes
Needs
tobe
adapted
Needs
tobe
adaptedforhabitat
Needs
tobe
adapted
Yes
Needs
tobe
adapted
Incorporateconsiderationof
CAMPA
network
Needs
tobe
adapted
Yes
Needs
tobe
adapted
Needs
tobe
adapted
Needs
tobe
adapted
Needs
tobe
adapted
Abilityto
assessstressorsotherthan
fishing
(e.g.sea
surfacetemperature,o
cean
acidificatio
n,etc.)
Yes
Yes
Needs
tobe
adapted
Yes
Yes
Yes
Minim
altraining
needed
forCD
FWNo
Yes
Yes
Yes
No
No
Alignm
entwith
federalfi
sheries
managem
enttools
No
No
No
Yes
No
No
J.F. Samhouri et al. Biological Conservation 231 (2019) 103–121
106
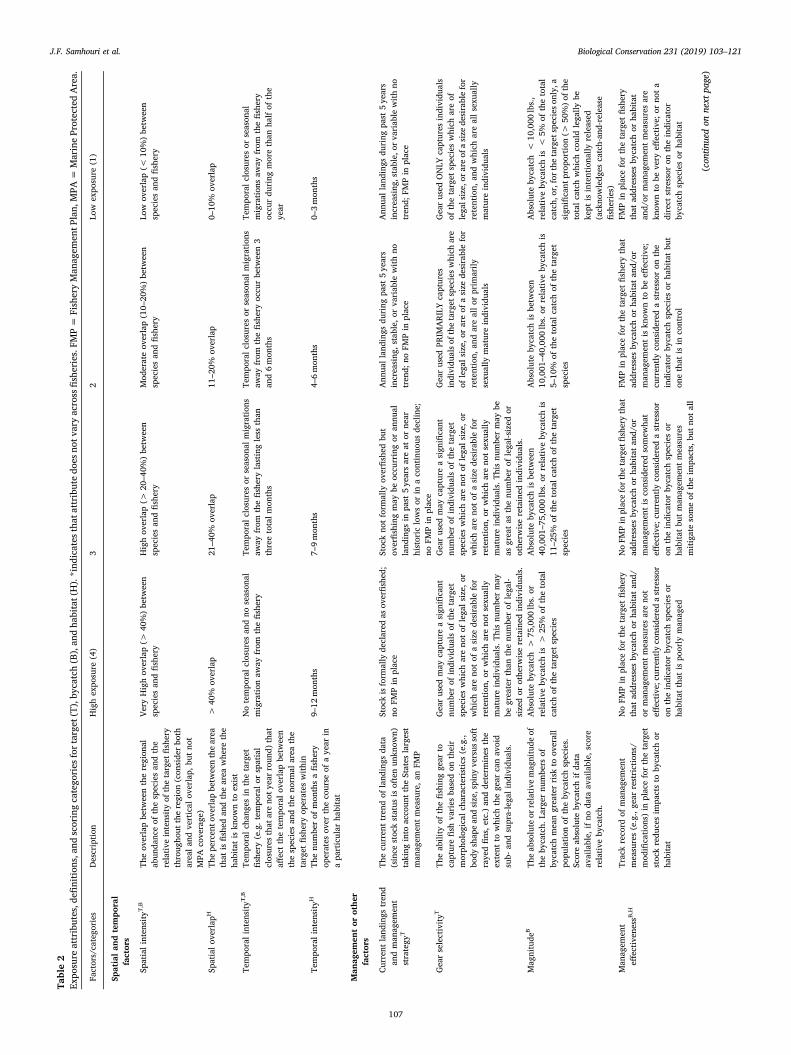
Table2
Exposureattributes,definitio
ns,and
scoringcategoriesfortarget(T),bycatch
(B),andhabitat(H).*indicatesthatattributedoesnotvaryacrossfisheries.FMP=
FisheryManagem
entP
lan,MPA
=MarineProtectedArea.
Factors/categories
Descriptio
nHighexposure
(4)
32
Lowexposure
(1)
Spatialandtemporal
factors
Spatialintensity
T,B
Theoverlapbetweentheregional
abundanceof
thespeciesandthe
relativ
eintensity
ofthetargetfishery
throughout
theregion
(considerboth
arealand
vertical
overlap,
butnot
MPA
coverage)
Very
Highoverlap(>
40%)between
speciesandfishery
Highoverlap(>
20–40%
)between
speciesandfishery
Moderateoverlap(10–20%)between
speciesandfishery
Lowoverlap(<
10%)between
speciesandfishery
Spatialo
verlap
HTh
epercentoverlap
betweenthearea
that
isfishedandthearea
where
the
habitatisknow
nto
exist
>40%
overlap
21–40%
overlap
11–20%
overlap
0–10%
overlap
Temporalintensity
T,B
Temporalchanges
inthetarget
fishery
(e.g.tem
poralo
rspatial
closures
thatarenotyearround)that
affectthetemporalo
verlap
between
thespeciesandthenorm
alarea
the
target
fishery
operates
with
in
Notemporalclosuresandno
seasonal
migratio
naw
ayfrom
thefishery
Temporalclosuresor
seasonalmigratio
nsaw
ayfrom
thefishery
lastinglessthan
threetotalm
onths
Temporalclosuresor
seasonalmigratio
nsaw
ayfrom
thefishery
occurbetween3
and6months
Temporalclosuresor
seasonal
migratio
nsaw
ayfrom
thefishery
occurduring
morethan
halfof
the
year
Temporalintensity
HTh
enumberof
monthsafishery
operates
over
thecourse
ofayear
inaparticular
habitat
9–12
months
7–9months
4–6months
0–3months
Managem
entorother
factors
Currentlandings
trend
andmanagem
ent
strategy
T
Thecurrenttrendof
landings
data
(since
stockstatus
isoftenunknow
n)taking
into
accountthe
States
largest
managem
entmeasure,anFM
P
Stockisform
allydeclared
asoverfished;
noFM
Pin
place
Stocknotform
ally
overfishedbut
overfishing
may
beoccurringor
annual
landings
inpast5yearsareat
ornear
historiclowsor
inacontinuous
decline;
noFM
Pin
place
Annuallandingsduring
past5years
increasing,stable,or
variablewith
notrend;
noFM
Pin
place
Annuallandingsduring
past5years
increasing,stable,or
variablewith
notrend;
FMPin
place
Gearselectivity
TTh
eability
ofthefishing
gear
tocapturefishvaries
basedon
their
morphological
characteristics(e.g.,
body
shapeandsize,spiny
versus
soft
rayedfin
s,etc.)anddeterm
ines
the
extent
towhich
thegear
canavoid
sub-
andsupra-legalindividuals.
Gearused
may
captureasignificant
numberof
individualsof
thetarget
specieswhich
arenotof
legalsize,or
which
arenoto
fasize
desirablefor
retention,
orwhich
arenotsexually
matureindividuals.Th
isnumbermay
begreaterthan
thenumberof
legal-
sizedor
otherw
iseretained
individuals.
Gearused
may
captureasignificant
numberof
individualsof
thetarget
specieswhich
arenoto
flegalsize,o
rwhich
arenotof
asize
desirablefor
retention,
orwhich
arenotsexually
matureindividuals.Th
isnumbermay
beas
greatas
thenumberof
legal-sized
orotherw
iseretained
individuals.
Gearused
PRIM
ARILY
captures
individualso
fthe
targetspeciesw
hich
are
oflegalsize,or
areof
asize
desirablefor
retention,
andareallo
rprim
arily
sexually
matureindividuals
Gearused
ONLY
captures
individuals
ofthetarget
specieswhich
areof
legalsize,or
areofasize
desirablefor
retention,
andwhich
areallsexually
matureindividuals
Magnitude
BTh
eabsoluteor
relativ
emagnitude
ofthebycatch.
Larger
numbersof
bycatchmeangreaterrisk
tooverall
populatio
nof
thebycatchspecies.
Scoreabsolute
bycatchifdata
available,ifno
data
available,score
relativ
ebycatch.
Absolutebycatch>
75,000
lbs.or
relativ
ebycatchis
>25%
ofthetotal
catchof
thetarget
species
Absolutebycatchisbetween
40,001–75,000lbs.or
relativ
ebycatchis
11–25%
ofthetotalcatch
ofthetarget
species
Absolutebycatchisbetween
10,001–40,000lbs.or
relativ
ebycatchis
5–10%
ofthetotalcatch
ofthetarget
species
Absolutebycatch<
10,000
lbs.,
relativ
ebycatchis
<5%
ofthetotal
catch,or,for
thetargetspecieso
nly,a
significant
proportio
n(>
50%)o
fthe
totalcatch
which
couldlegally
bekept
isintentionally
released
(acknowledges
catch-and-release
fisheries)
Managem
ent
effectiv
enessB
,HTrackrecord
ofmanagem
ent
measures(e.g.,gear
restrictions/
modificatio
ns)in
placeforthetarget
stockreducesim
pactsto
bycatchor
habitat
NoFM
Pin
placeforthetarget
fishery
that
addressesbycatchor
habitatand/
ormanagem
entmeasuresarenot
effectiv
e;currently
considered
astressor
ontheindicatorbycatchspeciesor
habitatthat
ispoorly
managed
NoFM
Pinplaceforthe
targetfishery
that
addressesbycatchor
habitata
nd/or
managem
entisconsidered
somew
hat
effectiv
e;currently
considered
astressor
ontheindicatorbycatchspeciesor
habitatb
utmanagem
entmeasures
mitigate
someof
theim
pacts,butnotall
FMPin
placeforthetarget
fishery
that
addressesbycatchor
habitata
nd/or
managem
entisknow
nto
beeff
ectiv
e;currently
considered
astressor
onthe
indicatorbycatchspeciesor
habitatbut
onethat
isin
control
FMPin
placeforthetarget
fishery
that
addressesbycatchor
habitat
and/or
managem
entmeasuresare
know
nto
bevery
effectiv
e;or
nota
direct
stressor
ontheindicator
bycatchspeciesor
habitat
(contin
uedon
next
page)
J.F. Samhouri et al. Biological Conservation 231 (2019) 103–121
107
workshop participants focused on reaching community leaders, or “keycommunicators.”
We structured workshops to provide stakeholders with an overviewof the MLMA Master Plan Amendment process (described in Section2.1). We highlighted how this mandate leads to a potential role for ERAin fisheries prioritization, and provided an introduction to ERAs in-cluding, Productivity Susceptibility Analysis (PSA; Patrick et al., 2010).An in-depth exploration and discussion of the draft ERA tool occurredduring both workshops, including attribute definitions, the approach toscoring and weighting, review of iterations of the ERA tool design, anddraft results from the nine pilot fisheries. Between and after theworkshops, the ERA tool was modified to reflect the knowledge, ex-pertise, and recommendations of stakeholders. CDFW staff re-assessedthe pilot fisheries with the revised ERA tool to yield the final resultspresented here.6 The re-assessment followed the same procedure out-lined above, but incorporated modifications made in response to sta-keholder input.
2.5. Analysis of risk
Given the ERA framework described in Section 2.3 and the stake-holder input received as described in Section 2.4, the relative risk Ri to atarget species, or bycatch and habitat group, i was calculated as theEuclidean distance of the species or group from the origin in a spacedefined by exposure and sensitivity indices, or
= +R E S( 1) ( 1) .i2 2 (1)
Thus, the risk to a species or group increased with distance from theorigin and each axis received equivalent weight in estimating risk.Values for each exposure attribute ae,i and sensitivity attribute as,i weredetermined by assigning a score ranging from one to four for a stan-dardized set of Ae or As attributes (for the exposure and sensitivity axes,respectively; see Tables 2–3). These scores were used to calculate anexposure or sensitivity index with each attribute weighted by a factor wi
(ranging from [0,1] with == w 1iA
i1 ) related to its importance, as
==
E w ai
A
i e i1
,
e
(2)
and
==
S w a .i
A
i s i1
,
s
(3)
2.5.1. Analysis of risk: Target speciesFor each target species in each fishery, all exposure and sensitivity
attributes were assigned an equal weight wi=1/Ae or wi=1/As.
2.5.2. Analysis of risk: BycatchWe assessed risk only to the subset of the ten bycatch groups that
interact with each fishery. Attribute scores for each affected bycatchgroup were averaged by axis (following Eqs. (2)–(3)). Average valuesfor each bycatch group on each axis were summed to provide a cu-mulative risk score for all bycatch related to each fishery. That is, afterusing Eqs. (2)–(3) to calculate exposure Eb and sensitivity Sb for eachindividual bycatch group b, cumulative exposure and sensitivity, CE,B
and CS,B, to all bycatch groups B that are affected by a fishery werecalculated as
==
C EE Bi
B
b,1 (4)
Table2(contin
ued)
Factors/categories
Descriptio
nHighexposure
(4)
32
Lowexposure
(1)
MPA
coverage
and/or
otherperm
anent
spatialclosuresT,B,⁎
Thespatialo
verlap
betweenthe
regionalrangeof
thespeciesandno-
take
MPA
s;MPA
sim
partapositiv
ebenefit
orprotectio
nto
thespecies
MPA
sand/oro
ther
spatialclosuresw
ithappropriatehabitate
ither
donot
overlapwith
speciesregionalrange,are
thoughtto
provideno
benefit,o
rno
MPA
sweredesignated
specifically
toprotectthisspecies
MPA
sand/or
otherspatialclosureswith
appropriatehabitatcomprise<
10%
ofspeciesregionalrangeandmay
provide
somebenefit.
MPA
sand/or
otherspatialclosureswith
appropriatehabitatcomprise10–19%
ofspeciesregionalrangeandmay
provide
somebenefit.T
hisrecognizes
that
some
MPA
swerespecifically
designated
toprotectthisspeciesfrom
fishing
impacts.
MPA
sand/or
otherspatialclosures
with
appropriatehabitatcom
prise
20%
ormoreof
speciesregional
rangeandmay
providesomebenefit.
Thisrecognizes
thatsomeMPA
swere
specifically
designated
toprotectthis
speciesfrom
fishing
impacts.
MPA
coverage
and/or
perm
anentspatial
closures
H
MPA
coverage
ofhabitatand/or
significant
coverage
ofactiv
efishing
grounds(w
here
effortd
idnotshiftto
adiffe
rent
portionof
theunprotected
habitat)im
partssomebenefit
tohabitatitself.
MPA
sand/or
otherspatialclosures
either
donotoverlapwith
habitat,are
thoughtto
provideno
benefit,o
rno
MPA
sweredesignated
specifically
toprotectthishabitat.
MPA
sand/or
otherspatialclosures
comprise<
10%
ofhabitata
ndmay
providesomebenefit.
MPA
sand/or
otherspatialclosures
comprise10–19%
ofhabitatandmay
providesomebenefit.
MPA
sand/or
otherspatialclosures
comprise20%
ormoreof
habitat's
regionalrangeandmay
providesome
benefit.T
hisrecognizes
that
some
MPA
swerespecifically
designated
toprotectthishabitatfrom
fishing
impacts.
Valueof
exploited
speciesT,⁎
Theex-vesselv
alue
offishedstocks;
highly
valued
stocks
areassumed
morelikelytobe
affectedby
stressors
becausefishing
effortislikelyto
begreater
Stockishighly
valued
ordesiredby
the
fishery
(>$5.00/lbs.;
>$100,000
K/yr.landed;
>76%
retention).
Stockishighly
valued
ordesiredby
the
fishery
($2.25–4.99/lbs.;$
10,000
K-$99,000K/yr.landed;51–75%
retention).
Stockismoderatelyvalued
ordesiredby
thefishery
($1–$2.25/lbs.;
$500
K–$10,000K/yr.landed;
26–50%
retention).
Stockisnothighly
valued
ordesired
bythefishery
(<$1/lbs.;
<$500
K/yr.landed;
<25%
retention).
6 Proceedings from the workshop are available at http://www.oceansciencetrust.org/wp-content/uploads/2017/09/ERA_KeyThemesSummary_Final.pdf.
J.F. Samhouri et al. Biological Conservation 231 (2019) 103–121
108
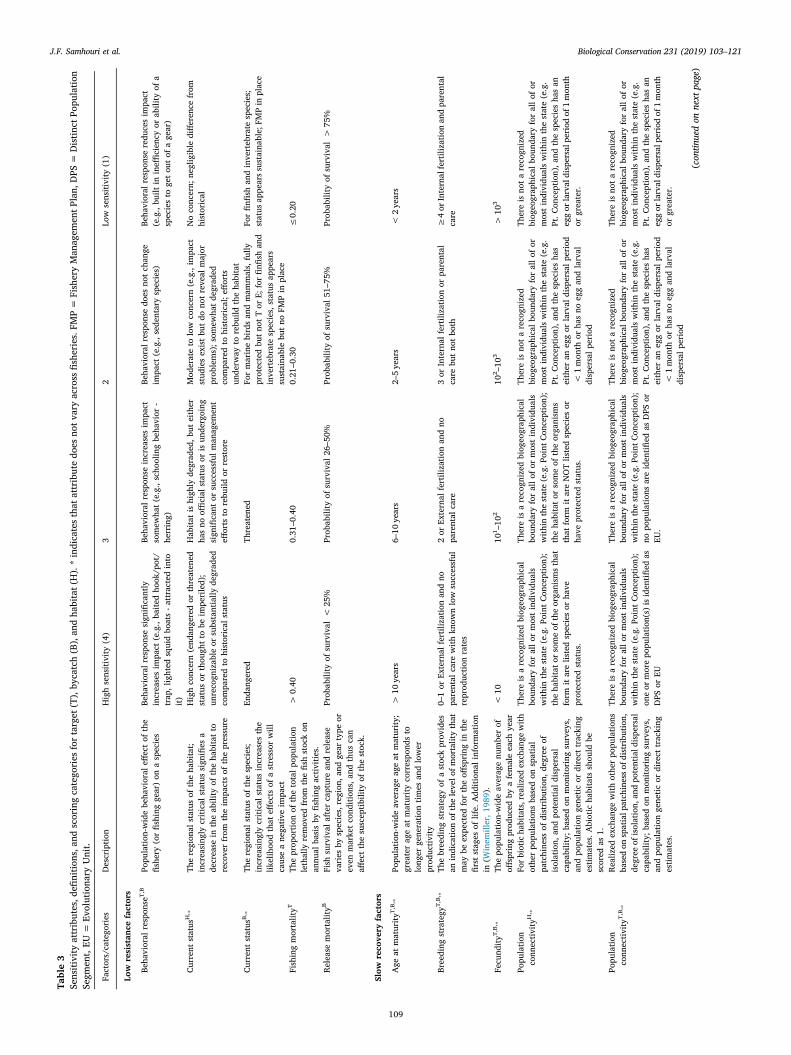
Table3
Sensitivity
attributes,definitio
ns,and
scoringcategories
fortarget(T),bycatch(B),andhabitat(H).*indicatesthatattributedoes
notv
aryacrossfisheries.FMP=
FisheryManagem
entP
lan,DPS
=Distin
ctPopulatio
nSegm
ent,EU
=Evolutionary
Unit.
Factors/categories
Descriptio
nHighsensitivity
(4)
32
Lowsensitivity
(1)
Lowresistancefactors
Behavioral
response
T,B
Populatio
n-widebehavioraleff
ectof
the
fishery
(orfishing
gear)on
aspecies
Behavioralresponse
significantly
increasesim
pact
(e.g.,baitedhook/pot/
trap,lighted
squidboats-a
ttracted
into
it)
Behavioralresponse
increasesim
pact
somew
hat(e.g.,schoolingbehavior
-herring)
Behavioral
response
does
notchange
impact
(e.g.,sedentaryspecies)
Behavioral
response
reducesim
pact
(e.g.,built
inineffi
ciency
orability
ofa
speciesto
getouto
fagear)
Currentstatus
H,⁎
Theregional
status
ofthehabitat;
increasingly
criticalstatussignifies
adecrease
intheability
ofthehabitatto
recoverfrom
theim
pactsof
thepressure
Highconcern(endangeredor
threatened
status
orthoughttobe
imperiled);
unrecognizableor
substantially
degraded
comparedto
historicalstatus
Habita
tishighly
degraded,b
uteither
hasno
officialstatus
orisundergoing
significant
orsuccessful
managem
ent
effortsto
rebuild
orrestore
Moderateto
lowconcern(e.g.,im
pact
studiesexistbutdo
notrevealm
ajor
problems);som
ewhatdegraded
comparedto
historical;effo
rts
underw
ayto
rebuild
thehabitat
Noconcern;
negligiblediffe
rencefrom
historical
Currentstatus
B,⁎
Theregional
status
ofthespecies;
increasingly
criticalstatusincreasesthe
likelihoodthat
effectsof
astressor
will
causeanegativ
eim
pact
Endangered
Threatened
Formarinebirdsandmam
mals,fully
protectedbutn
otTor
E;forfin
fishand
invertebrate
species,status
appears
sustainablebutno
FMPin
place
Forfin
fishandinvertebrate
species;
status
appearssustainable;FMPin
place
FishingmortalityT
Theproportio
nof
thetotalp
opulation
lethally
removed
from
thefishstockon
annualbasisby
fishing
activ
ities.
>0.40
0.31–0.40
0.21–0.30
≤0.20
ReleasemortalityB
Fish
survival
aftercaptureandrelease
varies
byspecies,region,and
gear
type
oreven
marketconditio
ns,and
thus
can
affectthe
susceptib
ility
ofthestock.
Probability
ofsurvival
<25%
Probability
ofsurvival
26–50%
Probability
ofsurvival
51–75%
Probability
ofsurvival
>75%
Slow
recoveryfactors
Age
atmaturity
T,B,⁎
Populatio
n-wideaverageageat
maturity
;greaterageat
maturity
correspondsto
longer
generatio
ntim
esandlower
productiv
ity
>10
years
6–10
years
2–5years
<2years
Breeding
strategy
T,B,⁎
Thebreeding
strategy
ofastockprovides
anindicatio
nof
thelevelo
fmortalitythat
may
beexpected
fortheoff
spring
inthe
firststages
oflife.Additional
inform
ation
in(W
inem
iller,1
989).
0–1or
External
fertilizatio
nandno
parentalcare
with
know
nlowsuccessful
reproductio
nrates
2or
External
fertilizatio
nandno
parentalcare
3or
Internal
fertilizatio
nor
parental
care
butnotb
oth
≥4or
Internalfertilizatio
nandparental
care
Fecundity
T,B,⁎
Thepopulatio
n-wideaveragenumberof
offspring
produced
byafemaleeach
year
<10
101 –10
210
2 –10
3>
103
Populatio
nconnectiv
ityH,⁎
Forb
iotic
habitats,realized
exchange
with
otherpopulatio
nsbasedon
spatial
patchinessof
distributio
n,degree
ofisolation,
andpotentiald
ispersal
capability;
basedon
monito
ring
surveys,
andpopulatio
ngenetic
ordirecttracking
estim
ates.A
biotichabitatsshould
bescored
as1.
Thereisarecognized
biogeographical
boundary
forallo
rmostindividuals
with
inthestate(e.g.P
oint
Conceptio
n);
thehabitato
rsomeof
theorganism
sthat
form
itarelistedspeciesor
have
protectedstatus.
Thereisarecognized
biogeographical
boundary
forallo
formostindividuals
with
inthestate(e.g.P
oint
Conceptio
n);
thehabitator
someof
theorganism
sthat
form
itareNOTlistedspeciesor
have
protectedstatus.
Thereisnotarecognized
biogeographicalb
oundaryforallo
for
mostindividualswith
inthestate(e.g.
Pt.C
onception),and
thespecieshas
either
aneggor
larvaldispersalp
eriod
<1month
orhasno
eggandlarval
dispersalp
eriod
Thereisnotarecognized
biogeographicalb
oundaryforallo
for
mostindividualswith
inthestate(e.g.
Pt.C
onception),and
thespecieshasan
eggor
larvaldispersalperiodof1month
orgreater.
Populatio
nconnectiv
ityT,B,⁎
Realized
exchange
with
otherpopulatio
nsbasedon
spatialpatchinesso
fdistribution,
degree
ofisolation,andpotentialdispersal
capability;
basedon
monito
ring
surveys,
andpopulatio
ngenetic
ordirecttracking
estim
ates.
Thereisarecognized
biogeographical
boundary
forallo
rmostindividuals
with
inthestate(e.g.P
oint
Conceptio
n);
oneor
morepopulatio
n(s)isidentifi
edas
DPS
orEU
Thereisarecognized
biogeographical
boundary
forallo
formostindividuals
with
inthestate(e.g.P
oint
Conceptio
n);
nopopulatio
nsareidentifi
edas
DPS
orEU
.
Thereisnotarecognized
biogeographicalb
oundaryforallo
for
mostindividualswith
inthestate(e.g.
Pt.C
onception),and
thespecieshas
either
aneggor
larvaldispersalp
eriod
<1month
orhasno
eggandlarval
dispersalp
eriod
Thereisnotarecognized
biogeographicalb
oundaryforallo
for
mostindividualswith
inthestate(e.g.
Pt.C
onception),and
thespecieshasan
eggor
larvaldispersalperiodof1month
orgreater.
(contin
uedon
next
page)
J.F. Samhouri et al. Biological Conservation 231 (2019) 103–121
109
and
==
C S .S Bi
B
b,1 (5)
This cumulative risk method produces higher risk scores for fish-eries interacting with many bycatch groups than for fisheries inter-acting with fewer groups.
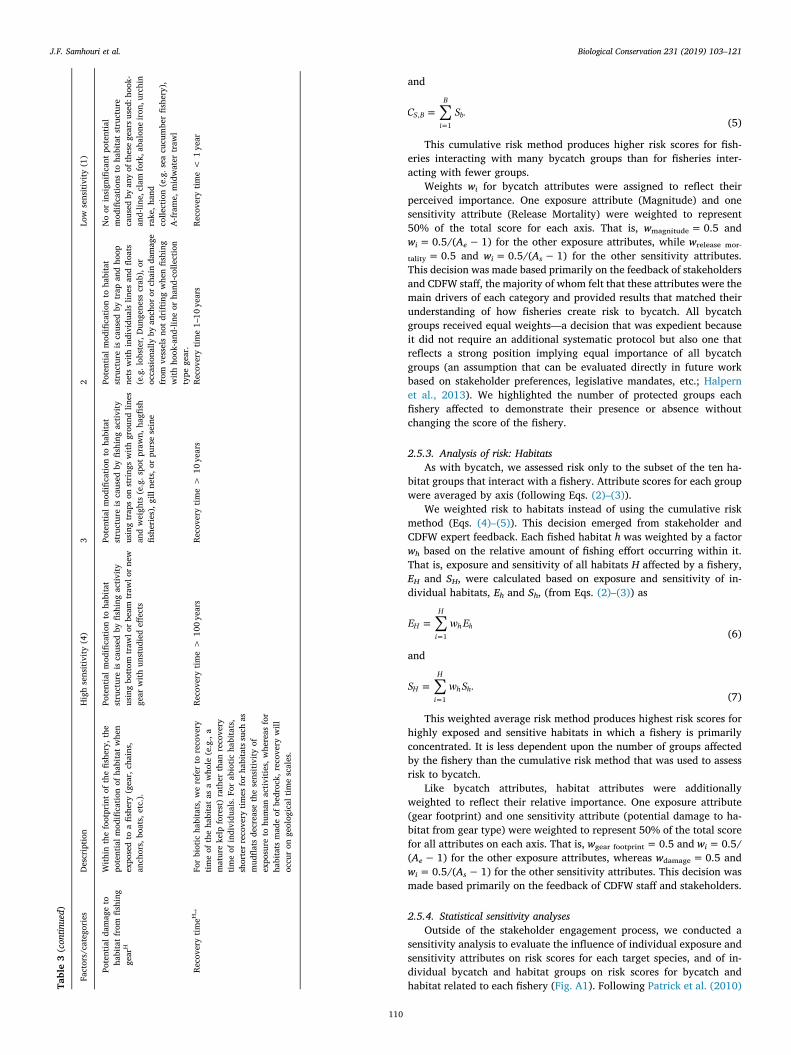
Weights wi for bycatch attributes were assigned to reflect theirperceived importance. One exposure attribute (Magnitude) and onesensitivity attribute (Release Mortality) were weighted to represent50% of the total score for each axis. That is, wmagnitude= 0.5 andwi=0.5/(Ae−1) for the other exposure attributes, while wrelease mor-
tality= 0.5 and wi=0.5/(As−1) for the other sensitivity attributes.This decision was made based primarily on the feedback of stakeholdersand CDFW staff, the majority of whom felt that these attributes were themain drivers of each category and provided results that matched theirunderstanding of how fisheries create risk to bycatch. All bycatchgroups received equal weights—a decision that was expedient becauseit did not require an additional systematic protocol but also one thatreflects a strong position implying equal importance of all bycatchgroups (an assumption that can be evaluated directly in future workbased on stakeholder preferences, legislative mandates, etc.; Halpernet al., 2013). We highlighted the number of protected groups eachfishery affected to demonstrate their presence or absence withoutchanging the score of the fishery.
2.5.3. Analysis of risk: HabitatsAs with bycatch, we assessed risk only to the subset of the ten ha-
bitat groups that interact with a fishery. Attribute scores for each groupwere averaged by axis (following Eqs. (2)–(3)).
We weighted risk to habitats instead of using the cumulative riskmethod (Eqs. (4)–(5)). This decision emerged from stakeholder andCDFW expert feedback. Each fished habitat h was weighted by a factorwh based on the relative amount of fishing effort occurring within it.That is, exposure and sensitivity of all habitats H affected by a fishery,EH and SH, were calculated based on exposure and sensitivity of in-dividual habitats, Eh and Sh, (from Eqs. (2)–(3)) as
==
E w EHi
H
h h1 (6)
and
==
S w S .Hi
H
h h1 (7)
This weighted average risk method produces highest risk scores forhighly exposed and sensitive habitats in which a fishery is primarilyconcentrated. It is less dependent upon the number of groups affectedby the fishery than the cumulative risk method that was used to assessrisk to bycatch.
Like bycatch attributes, habitat attributes were additionallyweighted to reflect their relative importance. One exposure attribute(gear footprint) and one sensitivity attribute (potential damage to ha-bitat from gear type) were weighted to represent 50% of the total scorefor all attributes on each axis. That is, wgear footprint = 0.5 and wi=0.5/(Ae−1) for the other exposure attributes, whereas wdamage= 0.5 andwi=0.5/(As−1) for the other sensitivity attributes. This decision wasmade based primarily on the feedback of CDFW staff and stakeholders.
2.5.4. Statistical sensitivity analysesOutside of the stakeholder engagement process, we conducted a
sensitivity analysis to evaluate the influence of individual exposure andsensitivity attributes on risk scores for each target species, and of in-dividual bycatch and habitat groups on risk scores for bycatch andhabitat related to each fishery (Fig. A1). Following Patrick et al. (2010)Ta
ble3(contin
ued)
Factors/categories
Descriptio
nHighsensitivity
(4)
32
Lowsensitivity
(1)
Potentiald
amageto
habitatfrom
fishing
gear
H
With
inthefootprintof
thefishery,the
potentialm
odificatio
nof
habitatw
hen
exposedto
afishery
(gear,chains,
anchors,boats,etc.).
Potentialm
odificatio
nto
habitat
structureiscaused
byfishing
activ
ityusingbottom
traw
lorbeam
traw
lornew
gear
with
unstudiedeff
ects
Potentialm
odificatio
nto
habitat
structureiscaused
byfishing
activ
ityusingtrapson
stringswith
ground
lines
andweights(e.g.spotp
rawn,
hagfi
shfisheries),gillnets,o
rpurseseine
Potentialm
odificatio
nto
habitat
structureiscaused
bytrap
andhoop
netswith
individualslin
esandflo
ats
(e.g.lobster,D
ungenesscrab),or
occasionallyby
anchor
orchaindamage
from
vesselsnotdriftingwhenfishing
with
hook-and-line
orhand-collection
type
gear.
Noor
insignificant
potential
modificatio
nsto
habitatstructure
caused
byanyofthesegearsu
sed:hook-
and-lin
e,clam
fork,abalone
iron,urchin
rake,h
and
collection(e.g.sea
cucumberfishery),
A-fram
e,midwater
traw
l
Recovery
timeH
,⁎Forbiotichabitats,w
ereferto
recovery
timeof
thehabitata
sawhole(e.g.,a
maturekelp
forest)rather
than
recovery
timeof
individuals.Forabiotic
habitats,
shorterrecoverytim
esforh
abita
tssuch
asmudflatsdecrease
thesensitivity
ofexposure
tohu
man
activ
ities,w
hereas
for
habitatsmadeof
bedrock,
recovery
will
occuron
geological
timescales.
Recovery
time>
100years
Recovery
time>
10years
Recovery
time1–10
years
Recovery
time<
1year
J.F. Samhouri et al. Biological Conservation 231 (2019) 103–121
110
and Samhouri and Levin (2012), we calculated jackknifed estimates ofmedian, 2.5%, and 97.5% values and report these results in the Ap-pendix. Note that for bycatch we calculated jackknifed cumulative ex-posure and sensitivity scores, rather than jackknifed averages, prior toestimating the median, 2.5%, and 97.5% values, and we consideredonly equal weightings for the analysis of uncertainty in habitat scores.
2.6. Visualizing risk
Results are represented most simply by ecosystem component-spe-cific figures that display exposure and sensitivity of target species, andbycatch and habitat groups within a fishery. Contour lines in theseexposure-sensitivity figures represent equivalent risk. For bycatch re-sults, the size of points in each figure indicates how many groups withprotected status (maximum=3) contributed to the overall score for afishery. For habitat results, the size of points in each figure indicateshow many habitat groups contributed to the overall score for a fishery.
To consider risk across all three ecosystem components for eachfishery, we also present standardized risk scores and results of a non-metric multidimensional scaling (nMDS) analysis. The standardizedscores are constrained to be>0 and less than or equal to 1, and arecalculated as the target, bycatch, or habitat risk score for each fisherydivided by the maximum risk to that ecosystem component observedacross the nine fisheries.
The nMDS analysis illustrates the relative similarity among fisherieswith respect to the source and magnitude of risk to target species, andbycatch and habitat groups. nMDS arranges objects in a low-dimen-sional ordination space so that the inter-object distances in the inputsimilarity matrix and in the derived ordination have the same rankorder, with the measure of this difference termed stress. Risk scores fortarget species and all bycatch (n=10) and habitat (n=5) groups thatinteracted with at least one fishery were included in the analysis.Two–dimensional nMDS was calculated using the Bray–Curtis dissim-ilarity measure and a maximum of 100 random starts to find a stablesolution. A permutation test with 999 iterations was used to determinethe stress value. Ordination dissimilarities resulting from nMDS werecompared to observed (Bray–Curtis) dissimilarity using correlation re-sults of Shepard plots to assess goodness of fit. All analyses were con-ducted using R v3.4.3, and the function envfit in the package vegan wasused to calculate and depict variable loadings on the nMDS ordinationplot (Oksanen et al., 2008; R Core Team, 2014). A permutation test with999 iterations was conducted to assess statistical significance of vari-able loadings.
3. Results
3.1. Risk to target species
Of the nine fisheries assessed, relative risk to target species wasgreatest for white sturgeon in the sport hook-and-line fishery, followedby California halibut in all four fisheries (Fig. 2a). For all five of thesefisheries, relatively high-risk scores resulted from high scores for nearlyall exposure attributes.7 Relative risk to California spiny lobster fromtrap and sport hoop fisheries and to kelp bass from the hook-and-linefishery were similar to relative risk to California halibut from its fourfisheries. However, this outcome resulted from higher sensitivity scoresrather than higher exposure scores. For California spiny lobster, highFishing Mortality, Behavioral Response, and Age at Maturity attributescores resulted in high sensitivity scores, whereas kelp bass sensitivityscores were relatively high because of Population Connectivity andBreeding Strategy attributes, in addition to their Behavioral Response to
the fishery. Pacific herring exhibited the lowest relative risk due to thecommercial gill net fishery, with low scores for most exposure andsensitivity attributes. Statistical sensitivity analysis revealed that ex-posure scores for both lobster fisheries exhibited the greatest varia-bility, but scores on both axes for the remaining fisheries exhibitedrelatively narrow confidence intervals (Fig. A1).
3.2. Risk to bycatch
Compared with the target species assessment, cumulative risk scoresto bycatch were much more variable across the nine fisheries and fellinto three main groups (Fig. 2b). The commercial gill net and trawlfisheries for California halibut posed the greatest cumulative risk to allbycatch groups. This result emerged because both fisheries interactwith six of the ten bycatch groups, and the magnitude of bycatch andassociated mortality is relatively high for some groups. Intermediatecumulative risk scores for bycatch associated with the sport hook-and-line fisheries for white sturgeon and kelp bass resulted from their in-teractions with five bycatch groups each. Risk scores were lower forCalifornia halibut hook-and-line fisheries than for the commercial gillnet and trawl fisheries because the score for the Release Mortality at-tribute is much lower for hook-and-line gear. The remaining threefisheries exhibited notably lower cumulative risk to bycatch groups,largely because those fisheries interacted with only one or two bycatchgroups. Statistical sensitivity analysis indicated that median estimateswere precise for most fisheries, with halibut fisheries exhibiting thewidest spread in jackknifed scores (Fig. A1).
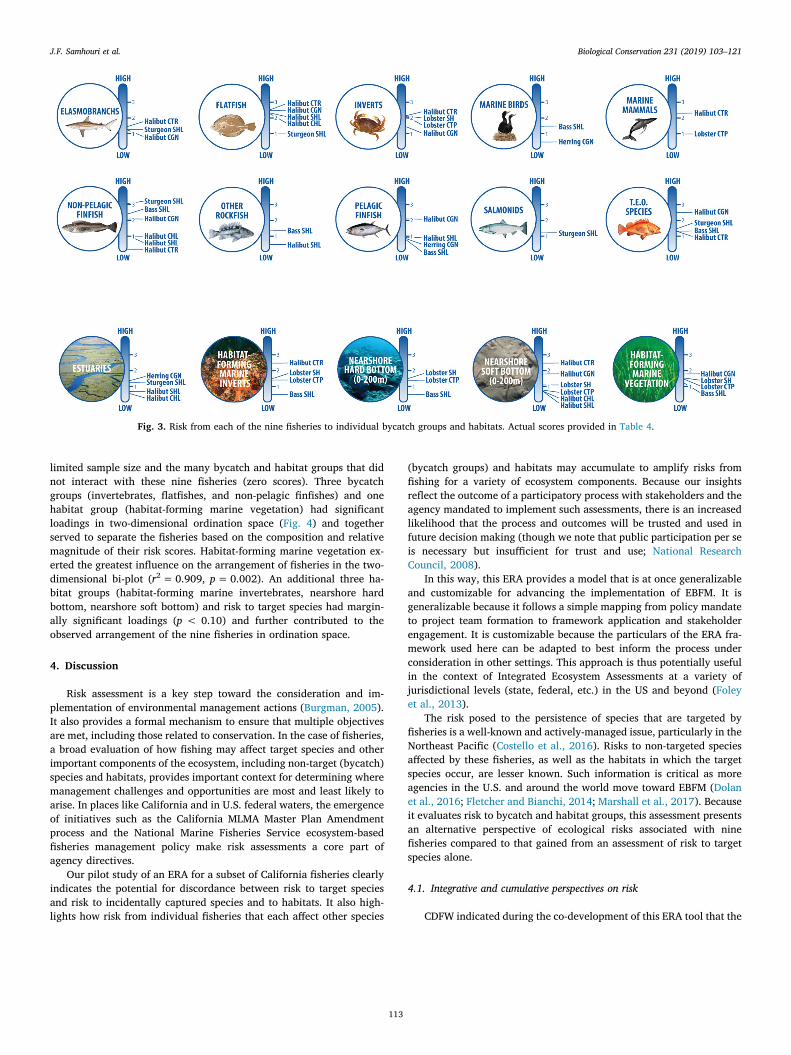
The ten bycatch groups we assessed were at risk from an average of3.3 (± 1.6 SD) fisheries, with salmon affected by only one fishery andnon-pelagic finfishes at risk from six fisheries (Fig. 3). Across the ninefisheries we considered, some bycatch groups were at consistently highor low risk, but risk to other bycatch groups was more variable. Forexample, several fisheries posed moderate to high risk to flatfishes andinvertebrates whereas risk to elasmobranchs and birds from multiplefisheries were all relatively low (Fig. 3). In contrast, threatened andendangered species and/or overfished rockfishes and pelagic finfisheswere at high risk from only one of the four fisheries that affected them.Similarly, half of the fisheries affecting non-pelagic finfishes posed highrisk whereas half posed low risk (Fig. 3).
3.3. Risk to habitats
Compared with bycatch, the nine fisheries we assessed did notproduce as much variability in risk to all of the habitats consideredcollectively (Fig. 2c). One notable exception was the substantiallyhigher risk to habitats affected by the California halibut commercialtrawl fishery (nearshore soft bottom and habitat-forming marine in-vertebrates; Fig. 3b, Table 4). Importantly, though these two habitatswere both highly exposed to the California halibut commercial trawlfishery, neither was expected to be particularly sensitive. Of the re-maining eight fisheries, habitats influenced by the commercial gill netfishery for California halibut were at the greatest risk (Fig. 2c). Notably,overall risk to habitats from the two California spiny lobster fisherieswas moderate but these fisheries affected the most habitats, includingnearshore hard and soft bottom, marine vegetation, and habitat-forming marine invertebrates. The lowest risk to habitats emerged forthree hook-and-line fisheries: the sport fishery for kelp bass and boththe commercial and sport fisheries for California halibut. The 95%confidence intervals for habitat exposure scores were narrow across allfisheries, with greater uncertainty evident in some sensitivity scores(e.g., halibut sport hook and line, herring commercial gillnet) (Fig. A1).
The ten habitat groups we assessed were at risk from an average of2.1 (± 2.3 SD) fisheries, ranging from five habitats with no fisheryinteractions to one habitat (nearshore soft bottom) that was affected bysix of the nine fisheries (Fig. 3). A closer inspection of the risk posed byeach fishery to individual habitat groups produces two additional
7 Scores for each fishery-target/bycatch/habitat combination and associatedrationale are available online at http://www.oceansciencetrust.org/projects/era/.
J.F. Samhouri et al. Biological Conservation 231 (2019) 103–121
111
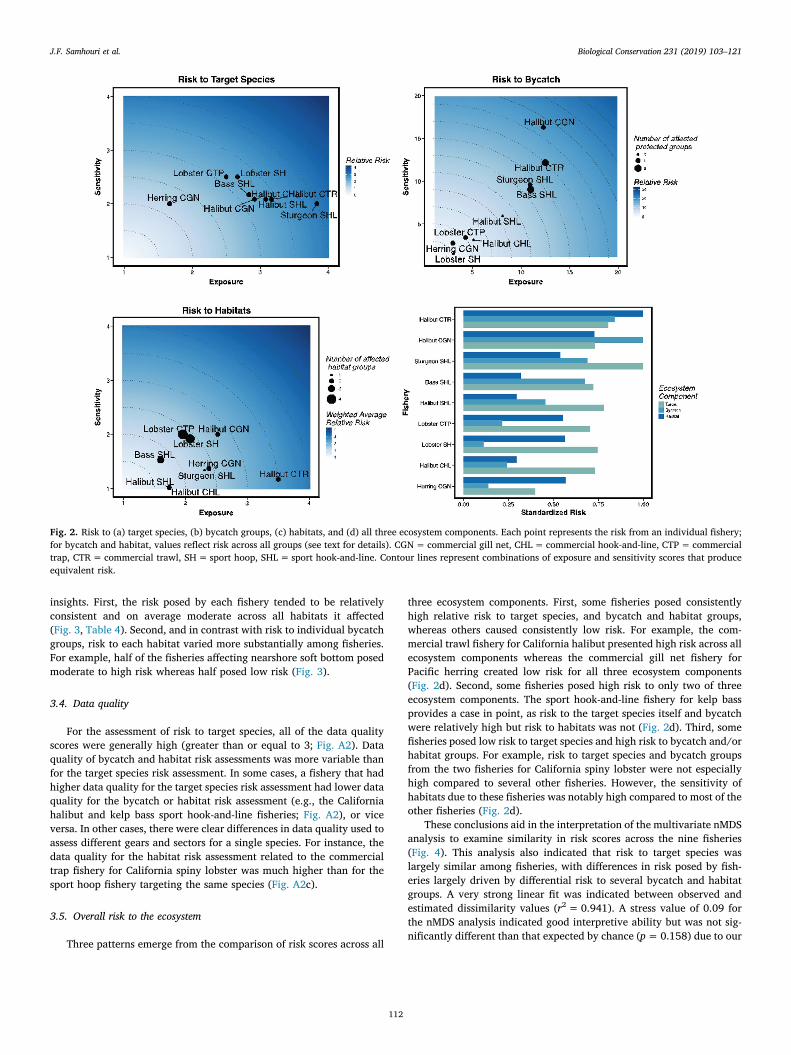
insights. First, the risk posed by each fishery tended to be relativelyconsistent and on average moderate across all habitats it affected(Fig. 3, Table 4). Second, and in contrast with risk to individual bycatchgroups, risk to each habitat varied more substantially among fisheries.For example, half of the fisheries affecting nearshore soft bottom posedmoderate to high risk whereas half posed low risk (Fig. 3).
3.4. Data quality
For the assessment of risk to target species, all of the data qualityscores were generally high (greater than or equal to 3; Fig. A2). Dataquality of bycatch and habitat risk assessments was more variable thanfor the target species risk assessment. In some cases, a fishery that hadhigher data quality for the target species risk assessment had lower dataquality for the bycatch or habitat risk assessment (e.g., the Californiahalibut and kelp bass sport hook-and-line fisheries; Fig. A2), or viceversa. In other cases, there were clear differences in data quality used toassess different gears and sectors for a single species. For instance, thedata quality for the habitat risk assessment related to the commercialtrap fishery for California spiny lobster was much higher than for thesport hoop fishery targeting the same species (Fig. A2c).
3.5. Overall risk to the ecosystem
Three patterns emerge from the comparison of risk scores across all
three ecosystem components. First, some fisheries posed consistentlyhigh relative risk to target species, and bycatch and habitat groups,whereas others caused consistently low risk. For example, the com-mercial trawl fishery for California halibut presented high risk across allecosystem components whereas the commercial gill net fishery forPacific herring created low risk for all three ecosystem components(Fig. 2d). Second, some fisheries posed high risk to only two of threeecosystem components. The sport hook-and-line fishery for kelp bassprovides a case in point, as risk to the target species itself and bycatchwere relatively high but risk to habitats was not (Fig. 2d). Third, somefisheries posed low risk to target species and high risk to bycatch and/orhabitat groups. For example, risk to target species and bycatch groupsfrom the two fisheries for California spiny lobster were not especiallyhigh compared to several other fisheries. However, the sensitivity ofhabitats due to these fisheries was notably high compared to most of theother fisheries (Fig. 2d).
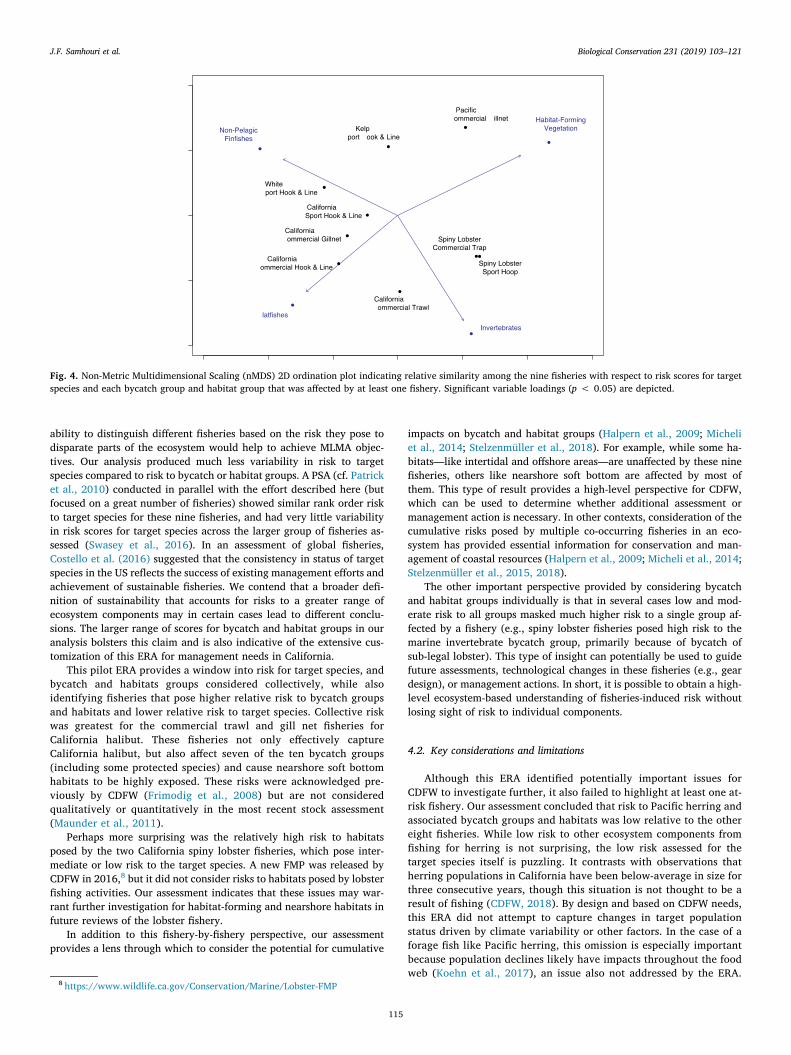
These conclusions aid in the interpretation of the multivariate nMDSanalysis to examine similarity in risk scores across the nine fisheries(Fig. 4). This analysis also indicated that risk to target species waslargely similar among fisheries, with differences in risk posed by fish-eries largely driven by differential risk to several bycatch and habitatgroups. A very strong linear fit was indicated between observed andestimated dissimilarity values (r2= 0.941). A stress value of 0.09 forthe nMDS analysis indicated good interpretive ability but was not sig-nificantly different than that expected by chance (p=0.158) due to our
Fig. 2. Risk to (a) target species, (b) bycatch groups, (c) habitats, and (d) all three ecosystem components. Each point represents the risk from an individual fishery;for bycatch and habitat, values reflect risk across all groups (see text for details). CGN= commercial gill net, CHL= commercial hook-and-line, CTP= commercialtrap, CTR= commercial trawl, SH= sport hoop, SHL= sport hook-and-line. Contour lines represent combinations of exposure and sensitivity scores that produceequivalent risk.
J.F. Samhouri et al. Biological Conservation 231 (2019) 103–121
112
limited sample size and the many bycatch and habitat groups that didnot interact with these nine fisheries (zero scores). Three bycatchgroups (invertebrates, flatfishes, and non-pelagic finfishes) and onehabitat group (habitat-forming marine vegetation) had significantloadings in two-dimensional ordination space (Fig. 4) and togetherserved to separate the fisheries based on the composition and relativemagnitude of their risk scores. Habitat-forming marine vegetation ex-erted the greatest influence on the arrangement of fisheries in the two-dimensional bi-plot (r2= 0.909, p=0.002). An additional three ha-bitat groups (habitat-forming marine invertebrates, nearshore hardbottom, nearshore soft bottom) and risk to target species had margin-ally significant loadings (p < 0.10) and further contributed to theobserved arrangement of the nine fisheries in ordination space.
4. Discussion
Risk assessment is a key step toward the consideration and im-plementation of environmental management actions (Burgman, 2005).It also provides a formal mechanism to ensure that multiple objectivesare met, including those related to conservation. In the case of fisheries,a broad evaluation of how fishing may affect target species and otherimportant components of the ecosystem, including non-target (bycatch)species and habitats, provides important context for determining wheremanagement challenges and opportunities are most and least likely toarise. In places like California and in U.S. federal waters, the emergenceof initiatives such as the California MLMA Master Plan Amendmentprocess and the National Marine Fisheries Service ecosystem-basedfisheries management policy make risk assessments a core part ofagency directives.
Our pilot study of an ERA for a subset of California fisheries clearlyindicates the potential for discordance between risk to target speciesand risk to incidentally captured species and to habitats. It also high-lights how risk from individual fisheries that each affect other species
(bycatch groups) and habitats may accumulate to amplify risks fromfishing for a variety of ecosystem components. Because our insightsreflect the outcome of a participatory process with stakeholders and theagency mandated to implement such assessments, there is an increasedlikelihood that the process and outcomes will be trusted and used infuture decision making (though we note that public participation per seis necessary but insufficient for trust and use; National ResearchCouncil, 2008).
In this way, this ERA provides a model that is at once generalizableand customizable for advancing the implementation of EBFM. It isgeneralizable because it follows a simple mapping from policy mandateto project team formation to framework application and stakeholderengagement. It is customizable because the particulars of the ERA fra-mework used here can be adapted to best inform the process underconsideration in other settings. This approach is thus potentially usefulin the context of Integrated Ecosystem Assessments at a variety ofjurisdictional levels (state, federal, etc.) in the US and beyond (Foleyet al., 2013).
The risk posed to the persistence of species that are targeted byfisheries is a well-known and actively-managed issue, particularly in theNortheast Pacific (Costello et al., 2016). Risks to non-targeted speciesaffected by these fisheries, as well as the habitats in which the targetspecies occur, are lesser known. Such information is critical as moreagencies in the U.S. and around the world move toward EBFM (Dolanet al., 2016; Fletcher and Bianchi, 2014; Marshall et al., 2017). Becauseit evaluates risk to bycatch and habitat groups, this assessment presentsan alternative perspective of ecological risks associated with ninefisheries compared to that gained from an assessment of risk to targetspecies alone.
4.1. Integrative and cumulative perspectives on risk
CDFW indicated during the co-development of this ERA tool that the
Fig. 3. Risk from each of the nine fisheries to individual bycatch groups and habitats. Actual scores provided in Table 4.
J.F. Samhouri et al. Biological Conservation 231 (2019) 103–121
113
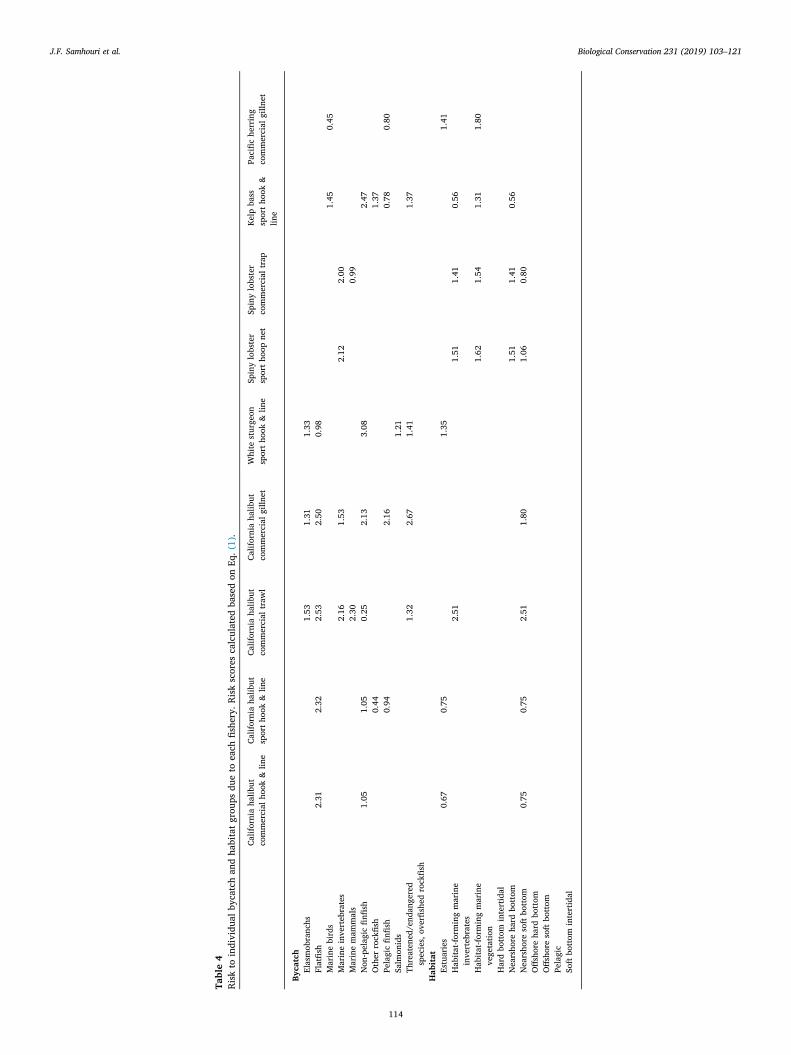
Table4
Risk
toindividual
bycatchandhabitatgroups
dueto
each
fishery.R
iskscores
calculated
basedon
Eq.(1).
Californiahalib
utcommercialhook
&lin
eCaliforniahalib
utsporth
ook&lin
eCaliforniahalib
utcommercial
traw
lCaliforniahalib
utcommercialgilln
etWhite
sturgeon
sporth
ook&lin
eSpinylobster
sporthoop
net
Spinylobster
commercialtrap
Kelp
bass
sporthook
&lin
e
Pacific
herring
commercialgilln
et
Bycatch
Elasmobranchs
1.53
1.31
1.33
Flatfish
2.31
2.32
2.53
2.50
0.98
Marinebirds
1.45
0.45
Marineinvertebrates
2.16
1.53
2.12
2.00
Marinemam
mals
2.30
0.99
Non-pelagicfin
fish
1.05
1.05
0.25
2.13
3.08
2.47
Other
rockfish
0.44
1.37
Pelagicfin
fish
0.94
2.16
0.78
0.80
Salm
onids
1.21
Threatened/endangered
species,overfishedrockfish
1.32
2.67
1.41
1.37
Habitat
Estuaries
0.67
0.75
1.35
1.41
Habita
t-formingmarine
invertebrates
2.51
1.51
1.41
0.56
Habita
t-formingmarine
vegetatio
n1.62
1.54
1.31
1.80
Hardbottom
intertidal
Nearshore
hard
bottom
1.51
1.41
0.56
Nearshore
softbottom
0.75
0.75
2.51
1.80
1.06
0.80
Offshore
hard
bottom
Offshore
softbottom
Pelagic
Softbottom
intertidal
J.F. Samhouri et al. Biological Conservation 231 (2019) 103–121
114
ability to distinguish different fisheries based on the risk they pose todisparate parts of the ecosystem would help to achieve MLMA objec-tives. Our analysis produced much less variability in risk to targetspecies compared to risk to bycatch or habitat groups. A PSA (cf. Patricket al., 2010) conducted in parallel with the effort described here (butfocused on a great number of fisheries) showed similar rank order riskto target species for these nine fisheries, and had very little variabilityin risk scores for target species across the larger group of fisheries as-sessed (Swasey et al., 2016). In an assessment of global fisheries,Costello et al. (2016) suggested that the consistency in status of targetspecies in the US reflects the success of existing management efforts andachievement of sustainable fisheries. We contend that a broader defi-nition of sustainability that accounts for risks to a greater range ofecosystem components may in certain cases lead to different conclu-sions. The larger range of scores for bycatch and habitat groups in ouranalysis bolsters this claim and is also indicative of the extensive cus-tomization of this ERA for management needs in California.
This pilot ERA provides a window into risk for target species, andbycatch and habitats groups considered collectively, while alsoidentifying fisheries that pose higher relative risk to bycatch groupsand habitats and lower relative risk to target species. Collective riskwas greatest for the commercial trawl and gill net fisheries forCalifornia halibut. These fisheries not only effectively captureCalifornia halibut, but also affect seven of the ten bycatch groups(including some protected species) and cause nearshore soft bottomhabitats to be highly exposed. These risks were acknowledged pre-viously by CDFW (Frimodig et al., 2008) but are not consideredqualitatively or quantitatively in the most recent stock assessment(Maunder et al., 2011).
Perhaps more surprising was the relatively high risk to habitatsposed by the two California spiny lobster fisheries, which pose inter-mediate or low risk to the target species. A new FMP was released byCDFW in 2016,8 but it did not consider risks to habitats posed by lobsterfishing activities. Our assessment indicates that these issues may war-rant further investigation for habitat-forming and nearshore habitats infuture reviews of the lobster fishery.
In addition to this fishery-by-fishery perspective, our assessmentprovides a lens through which to consider the potential for cumulative
impacts on bycatch and habitat groups (Halpern et al., 2009; Micheliet al., 2014; Stelzenmüller et al., 2018). For example, while some ha-bitats—like intertidal and offshore areas—are unaffected by these ninefisheries, others like nearshore soft bottom are affected by most ofthem. This type of result provides a high-level perspective for CDFW,which can be used to determine whether additional assessment ormanagement action is necessary. In other contexts, consideration of thecumulative risks posed by multiple co-occurring fisheries in an eco-system has provided essential information for conservation and man-agement of coastal resources (Halpern et al., 2009; Micheli et al., 2014;Stelzenmüller et al., 2015, 2018).
The other important perspective provided by considering bycatchand habitat groups individually is that in several cases low and mod-erate risk to all groups masked much higher risk to a single group af-fected by a fishery (e.g., spiny lobster fisheries posed high risk to themarine invertebrate bycatch group, primarily because of bycatch ofsub-legal lobster). This type of insight can potentially be used to guidefuture assessments, technological changes in these fisheries (e.g., geardesign), or management actions. In short, it is possible to obtain a high-level ecosystem-based understanding of fisheries-induced risk withoutlosing sight of risk to individual components.
4.2. Key considerations and limitations
Although this ERA identified potentially important issues forCDFW to investigate further, it also failed to highlight at least one at-risk fishery. Our assessment concluded that risk to Pacific herring andassociated bycatch groups and habitats was low relative to the othereight fisheries. While low risk to other ecosystem components fromfishing for herring is not surprising, the low risk assessed for thetarget species itself is puzzling. It contrasts with observations thatherring populations in California have been below-average in size forthree consecutive years, though this situation is not thought to be aresult of fishing (CDFW, 2018). By design and based on CDFW needs,this ERA did not attempt to capture changes in target populationstatus driven by climate variability or other factors. In the case of aforage fish like Pacific herring, this omission is especially importantbecause population declines likely have impacts throughout the foodweb (Koehn et al., 2017), an issue also not addressed by the ERA.
Fig. 4. Non-Metric Multidimensional Scaling (nMDS) 2D ordination plot indicating relative similarity among the nine fisheries with respect to risk scores for targetspecies and each bycatch group and habitat group that was affected by at least one fishery. Significant variable loadings (p < 0.05) are depicted.
8 https://www.wildlife.ca.gov/Conservation/Marine/Lobster-FMP
J.F. Samhouri et al. Biological Conservation 231 (2019) 103–121
115
However, future adaptations of the ERA tool presented here(i.e., Samhouri and Levin, 2012) could be used to close thisgap by considering other stressors such as climate variability andchange alongside fishing pressure. CDFW is currently developingan FMP for Pacific herring,9 and this shortcoming of the ERA,along with potential solutions, are worth noting there. Other regionsin the US are engaged in similar efforts to incorporate ecosystem-based risk assessment in fisheries management (e.g., Gaichas et al.,2016).
Several other important considerations for this ERA affect its in-terpretation and application. First, for the sake of expediency and inconsideration of CDFW staff capacity, we chose to lump speciescaught as bycatch and multiple habitat types into groups. However, itis likely that some bycatch or habitat groups have many subgroupsthat are at higher risk, but only contribute a single score to the by-catch and habitat risk scores (Burgess et al., 2013; Fletcher, 2005;Hobday et al., 2011; Williams et al., 2011; Zhou et al., 2016; Zhouand Griffiths, 2008). Conversely, because each expert scorer selectedthe taxon that they considered at highest risk in a bycatch group, thisERA could be considered excessively precautionary at the group level.In addition, it is important to keep in mind that this is a relative riskassessment, implying that the ranked risk of fisheries will change asadditional fisheries are evaluated. This feature suggests that futurework to validate relative risk scores against more quantitative, ab-solute measures of risk (e.g., via formal stock assessment or popula-tion viability analysis) will be needed. Finally, the risks posed byfishing in this assessment are not contextualized relative to otherchallenges facing these ecosystem components or relative to theirpotential socio-economic and socio-cultural costs and benefits (Poeet al., 2014). These types of analyses could enrich our assessment andprovide even greater insight into appropriate management actions,though they would vastly increase the staff capacity, time, and re-sources needed to complete such an evaluation.
4.3. Evolution of ecosystem approaches via participatory processes
No static framework can be directly applied to address every en-vironmental policy need (Table 1). In the case of fisheries, if the goal islong-term agreement and acceptance of the outcomes and process fromfishers and other stakeholders, each fishery, ecosystem, managementstructure, and policy context will have particular nuances thatneed to be considered from the outset (Weichselgartner and Kasperson,2010). Further, almost any tool used to support environmentaldecision making will have limitations, and the ERA described hereis no exception. However, as in other arenas of environmental man-agement, processes that incorporate active participation, informationexchange, transparency, fair decision-making, and positive participantinteractions are more likely to be supported by stakeholders, meetmanagement objectives, and fulfill conservation goals (Clark et al.,2016; National Research Council, 2008; Sayce et al., 2013; Wall et al.,2017).
Participatory processes for improving trust in marine fisheriesmanagement are particularly important in California. CDFW is man-dated to provide analyses of the State's fisheries and guidance on thedevelopment and prioritization of fishery management plans. The ERAprocess described here is the outcome of a participatory process thatincluded a deep partnership between CDFW staff and external scien-tists, along with active involvement and input by fishers, re-presentatives from environmental non-governmental organizations,and interested members of the public. One goal of employing this ap-proach was to ensure that our research questions and scientific outputswere matched to (a) expected decision timelines related to theCalifornia MLMA Master Plan Amendment process, and (b) available
technical capacity (Cash et al., 2003; Clark et al., 2016). In contrast,ERA tools are often developed by academic scientists or governmentmanagers with little to no stakeholder input (the “loading dock” model;Francis et al., 2018). The final tools may be shared with stakeholders sothe implications of the tools' application are known, but in many casesthese results are not shared publicly. Stakeholders rarely have the op-portunity to learn about, engage with, and shape the tool during thedevelopment phase (but see Arkema et al., 2015), as we facilitated withthis ERA tool.
The decision to not engage stakeholders during development comesat the expense of a less comprehensive and accurate tool that does notincorporate stakeholders' intimate knowledge of the operation of afishery or on-the-water observations and understanding of data(Plagányi et al., 2013). Furthermore, this decision can decrease stake-holders' trust in the tool and challenge future implementation efforts(Jarvis et al., 2015; Weichselgartner and Kasperson, 2010). This isespecially true in California and other states that have a legislativemandate to engage in a deep public process associated with the man-agement of their fisheries. California has very few organized fishingassociations, and – as is true of small social networks generally (Barneset al., 2017)—working knowledge and trusted relationships with keycommunicators in the fishing industry were critically important to fa-cilitating the co-development of the ERA tool. Indeed, these key com-municators acted on behalf of many other fishers to negotiate a sharedagreement about what a new ecological risk assessment tool shouldlook like. Knowledge co-production is a core component of actionablescience, though barriers of applying the resulting outputs to actions stillexist (National Research Council, 2008; Weichselgartner andKasperson, 2010).
5. Conclusions
The ERA approach described here has been adopted into the 2018Master Plan10 and we understand that this outcome occurred in partbecause of the process we used to develop it. Absent our efforts, any riskassessment adopted into the MLMA Amendment would likely have beenless integrative (across target species, bycatch, and habitats) and morequalitative. If MLMA stipulations are implemented in good faith, part-nerships among scientists, managers, and stakeholders will form thefoundation for future engagement in fisheries and ecosystem manage-ment issues in California and perhaps beyond. Such engagements couldfacilitate risk assessment for a greater number of fisheries and othertypes of analyses. For example, one potential extension of thiswork—and a recommendation heard by stakeholders during work-shops— includes downscaling this ERA from a California-wide assess-ment to one that is regional (e.g., southern, central, northern California)and reflective of issues prioritized at a local level. Indeed, a regionalrepresentation of the ERA would be more accurate for certain fisheries,like California halibut, that occur over a broad area of the state. It is ourhope that this ERA will inspire an approach to fisheries prioritizationthat is more transparent and inclusive of diverse sources of knowledge,and can lead to a more effective, comprehensive, and trustworthypackage of information to guide management decisions.
Acknowledgements
We express our sincerest gratitude to the time and effort devoted byCDFW experts to score each of the fisheries assessed here: Paul Reilly,Heather Gliniak, Travis Buck, Ryan Bartling, and Marty Gingras. Thedevelopment of the ERA tool and this paper benefited greatly from theactive involvement of the workshop participants, and consultationswith Alistair Hobday, Rick Fletcher, Rebecca Martone, Phil Levin, JohnField, Chris Costello, Steve Gaines, Mark Nelson, Jim Hastie, Rod Fujita,
9 https://www.wildlife.ca.gov/Fishing/Commercial/Herring/FMP 10 https://nrm.dfg.ca.gov/FileHandler.ashx?DocumentID=159222&inline
J.F. Samhouri et al. Biological Conservation 231 (2019) 103–121
116
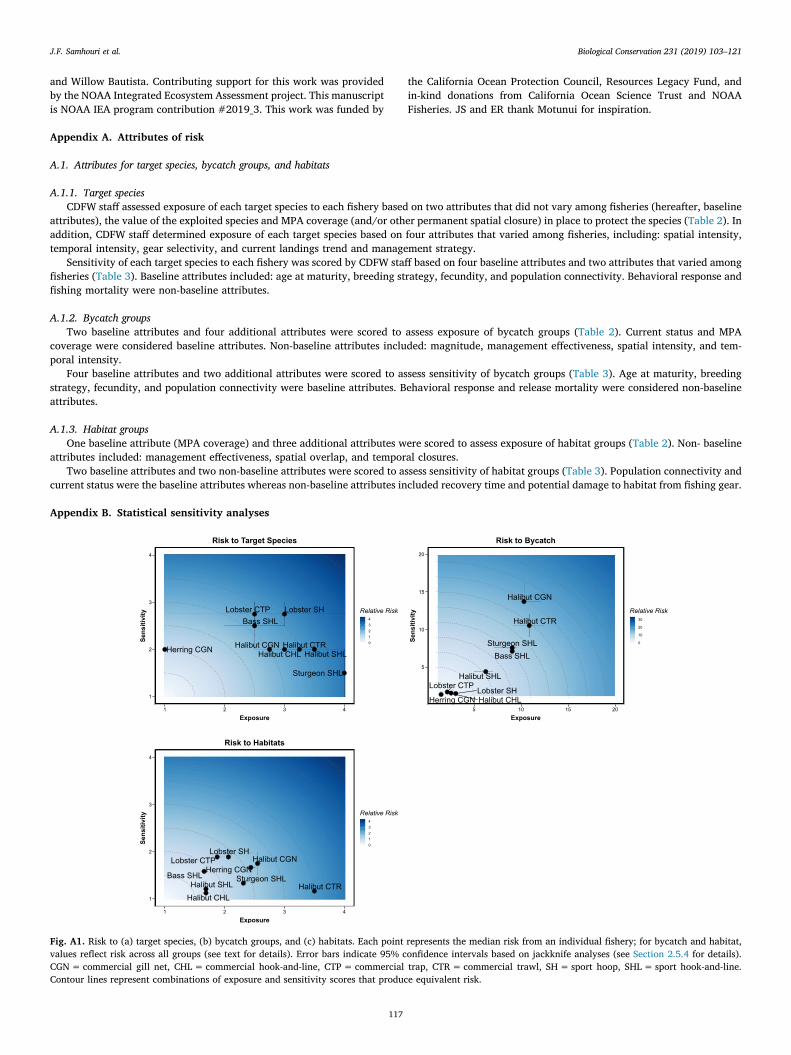
and Willow Bautista. Contributing support for this work was providedby the NOAA Integrated Ecosystem Assessment project. This manuscriptis NOAA IEA program contribution #2019_3. This work was funded by
the California Ocean Protection Council, Resources Legacy Fund, andin-kind donations from California Ocean Science Trust and NOAAFisheries. JS and ER thank Motunui for inspiration.
Appendix A. Attributes of risk
A.1. Attributes for target species, bycatch groups, and habitats
A.1.1. Target speciesCDFW staff assessed exposure of each target species to each fishery based on two attributes that did not vary among fisheries (hereafter, baseline
attributes), the value of the exploited species and MPA coverage (and/or other permanent spatial closure) in place to protect the species (Table 2). Inaddition, CDFW staff determined exposure of each target species based on four attributes that varied among fisheries, including: spatial intensity,temporal intensity, gear selectivity, and current landings trend and management strategy.
Sensitivity of each target species to each fishery was scored by CDFW staff based on four baseline attributes and two attributes that varied amongfisheries (Table 3). Baseline attributes included: age at maturity, breeding strategy, fecundity, and population connectivity. Behavioral response andfishing mortality were non-baseline attributes.
A.1.2. Bycatch groupsTwo baseline attributes and four additional attributes were scored to assess exposure of bycatch groups (Table 2). Current status and MPA
coverage were considered baseline attributes. Non-baseline attributes included: magnitude, management effectiveness, spatial intensity, and tem-poral intensity.
Four baseline attributes and two additional attributes were scored to assess sensitivity of bycatch groups (Table 3). Age at maturity, breedingstrategy, fecundity, and population connectivity were baseline attributes. Behavioral response and release mortality were considered non-baselineattributes.
A.1.3. Habitat groupsOne baseline attribute (MPA coverage) and three additional attributes were scored to assess exposure of habitat groups (Table 2). Non- baseline
attributes included: management effectiveness, spatial overlap, and temporal closures.Two baseline attributes and two non-baseline attributes were scored to assess sensitivity of habitat groups (Table 3). Population connectivity and
current status were the baseline attributes whereas non-baseline attributes included recovery time and potential damage to habitat from fishing gear.
Appendix B. Statistical sensitivity analyses
Fig. A1. Risk to (a) target species, (b) bycatch groups, and (c) habitats. Each point represents the median risk from an individual fishery; for bycatch and habitat,values reflect risk across all groups (see text for details). Error bars indicate 95% confidence intervals based on jackknife analyses (see Section 2.5.4 for details).CGN=commercial gill net, CHL= commercial hook-and-line, CTP= commercial trap, CTR= commercial trawl, SH= sport hoop, SHL= sport hook-and-line.Contour lines represent combinations of exposure and sensitivity scores that produce equivalent risk.
J.F. Samhouri et al. Biological Conservation 231 (2019) 103–121
117
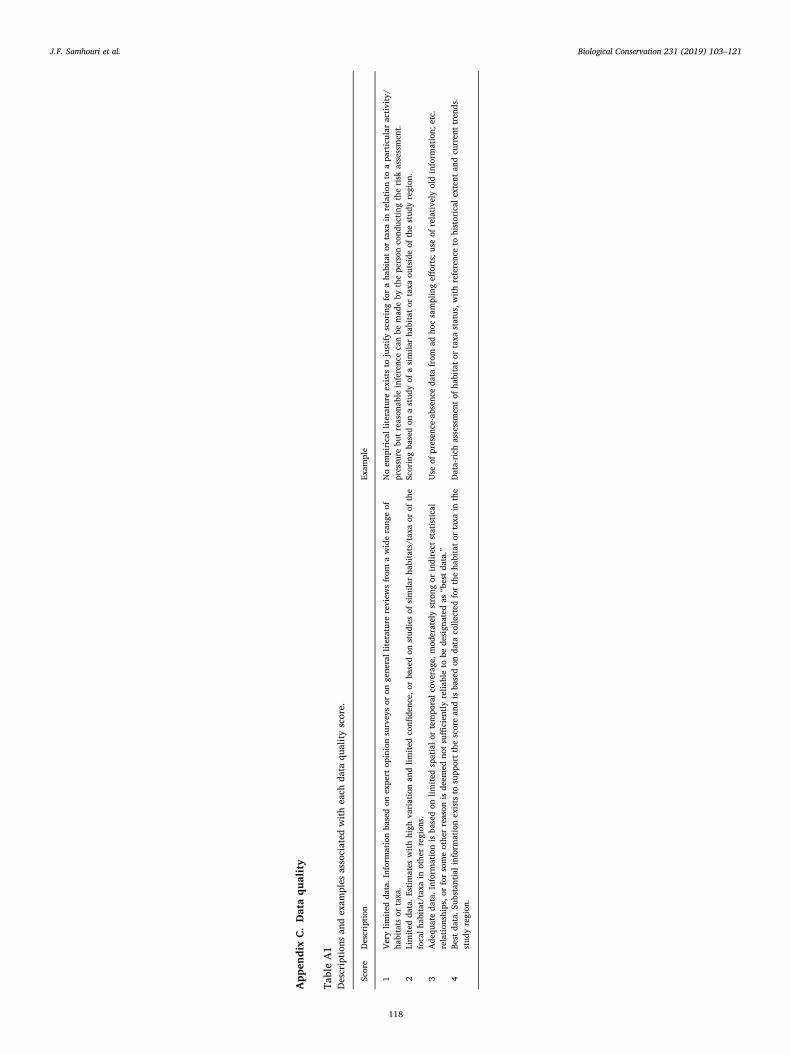
AppendixC.
Dataquality
TableA1
Descriptio
nsandexam
ples
associated
with
each
data
quality
score.
Score
Descriptio
nExam
ple
1Ve
rylim
iteddata.Informationbasedon
expertopinionsurveysor
ongeneralliterature
review
sfrom
awiderangeof
habitatsor
taxa.
Noem
piricalliterature
existsto
justify
scoringforahabitato
rtaxa
inrelatio
nto
aparticular
activ
ity/
pressure
butreasonableinferencecanbe
madeby
theperson
conductin
gtherisk
assessment.
2Limiteddata.E
stim
ates
with
high
variationandlim
itedconfi
dence,or
basedon
studiesof
similarhabitats/taxaor
ofthe
focalh
abita
t/taxa
inotherregions.
Scoringbasedon
astudyof
asimilarhabitator
taxa
outsideof
thestudyregion.
3Adequatedata.Informationisbasedon
limitedspatialo
rtemporalcoverage,moderatelystrong
orindirect
statistical
relatio
nships,o
rforsomeotherreason
isdeem
ednotsufficiently
reliableto
bedesignated
as“bestdata.”
Use
ofpresence-absence
data
from
adhocsamplingeff
orts;u
seof
relativ
elyoldinform
ation;
etc.
4Bestdata.Substantia
linformationexiststo
supportthe
scoreandisbasedon
data
collected
forthehabitator
taxa
inthe
studyregion.
Data-rich
assessmento
fhabita
tor
taxa
status,w
ithreferenceto
historical
extent
andcurrenttrends.
J.F. Samhouri et al. Biological Conservation 231 (2019) 103–121
118
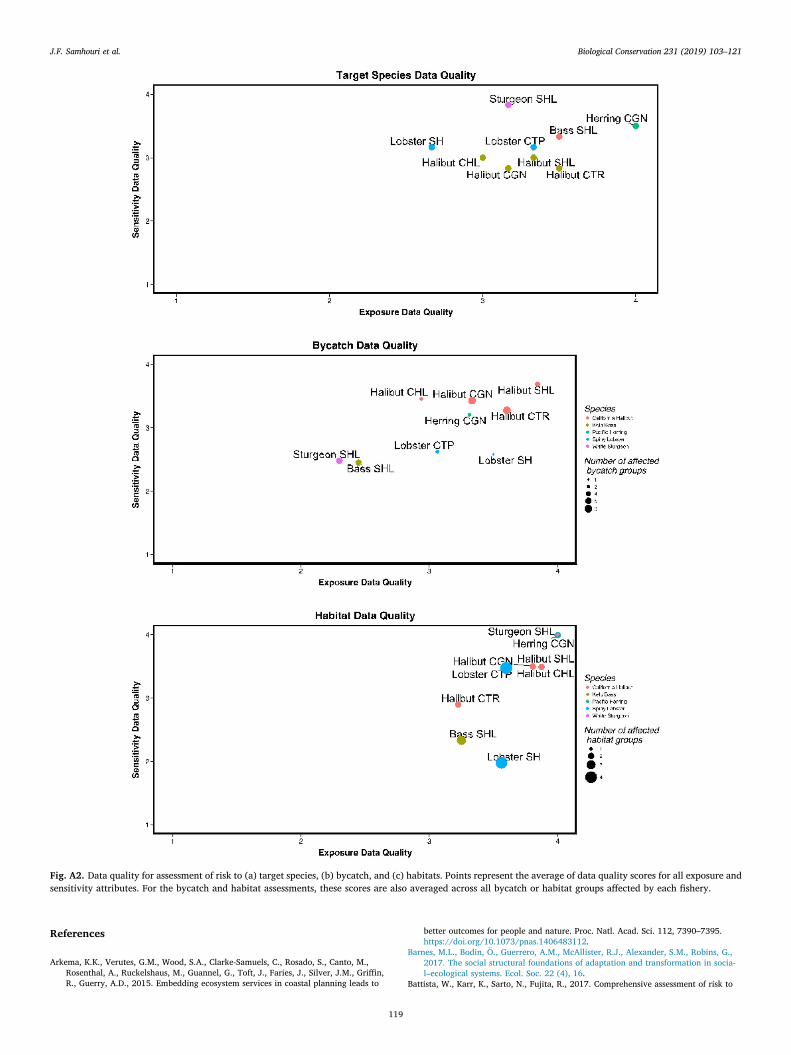
Fig. A2. Data quality for assessment of risk to (a) target species, (b) bycatch, and (c) habitats. Points represent the average of data quality scores for all exposure andsensitivity attributes. For the bycatch and habitat assessments, these scores are also averaged across all bycatch or habitat groups affected by each fishery.
References
Arkema, K.K., Verutes, G.M., Wood, S.A., Clarke-Samuels, C., Rosado, S., Canto, M.,Rosenthal, A., Ruckelshaus, M., Guannel, G., Toft, J., Faries, J., Silver, J.M., Griffin,R., Guerry, A.D., 2015. Embedding ecosystem services in coastal planning leads to
better outcomes for people and nature. Proc. Natl. Acad. Sci. 112, 7390–7395.https://doi.org/10.1073/pnas.1406483112.
Barnes, M.L., Bodin, Ö., Guerrero, A.M., McAllister, R.J., Alexander, S.M., Robins, G.,2017. The social structural foundations of adaptation and transformation in socia-l–ecological systems. Ecol. Soc. 22 (4), 16.
Battista, W., Karr, K., Sarto, N., Fujita, R., 2017. Comprehensive assessment of risk to
J.F. Samhouri et al. Biological Conservation 231 (2019) 103–121
119
ecosystems (CARE): a cumulative ecosystem risk assessment tool. Fish. Res. 185,115–129. https://doi.org/10.1016/j.fishres.2016.09.017.
Bednarek, A.T., Shouse, B., Hudson, C.G., Goldburg, R., 2016. Science-policy inter-mediaries from a practitioner's perspective: the Lenfest Ocean program experience.Sci. Public Policy 43, 291–300. https://doi.org/10.1093/scipol/scv008.
Brown, S.L., Reid, D., Rogan, E., 2013. A risk-based approach to rapidly screen vulner-ability of cetaceans to impacts from fisheries bycatch. Biol. Conserv. 168, 78–87.https://doi.org/10.1016/j.biocon.2013.09.019.
Burgess, M.G., Polasky, S., Tilman, D., 2013. Predicting overfishing and extinction threatsin multispecies fisheries. Proc. Natl. Acad. Sci. 110, 15943–15948. https://doi.org/10.1073/pnas.1314472110.
Burgman, M., 2005. Risks and Decisions for Conservation and EnvironmentalManagement. Cambridge University Press, Cambridge, UK.
California Department of Fish and Wildlife, 2018. 2017–18 Summary of the PacificHerring Spawning Population and Commercial Fisheries in San Francisco Bay.https://nrm.dfg.ca.gov/FileHandler.ashx?DocumentID=159747&inline.
Cash, D.W., Clark, W.C., Alcock, F., Dickson, N.M., Eckley, N., Guston, D.H., Jäger, J.,Mitchell, R.B., 2003. Knowledge systems for sustainable development. Proc. Natl.Acad. Sci. 100, 8086–8091. https://doi.org/10.1073/pnas.1231332100.
Clark, W.C., Tomich, T.P., van Noordwijk, M., Guston, D., Catacutan, D., Dickson, N.M.,McNie, E., 2016. Boundary work for sustainable development: natural resourcemanagement at the consultative group on international agricultural research(CGIAR). Proc. Natl. Acad. Sci. 113, 4615–4622. https://doi.org/10.1073/pnas.0900231108.
Cook, C.N., Mascia, M.B., Schwartz, M.W., Possingham, H.P., Fuller, R.A., 2013.Achieving conservation science that bridges the knowledge-action boundary.Conserv. Biol. J. Soc. Conserv. Biol. 27, 669–678. https://doi.org/10.1111/cobi.12050.
Costello, C., Ovando, D., Clavelle, T., Strauss, C.K., Hilborn, R., Melnychuk, M.C., Branch,T.A., Gaines, S.D., Szuwalski, C.S., Cabral, R.B., Rader, D.N., Leland, A., 2016. Globalfishery prospects under contrasting management regimes. Proc. Natl. Acad. Sci.5125–5129. https://doi.org/10.1073/pnas.1520420113.
Dolan, T.E., Patrick, W.S., Link, J.S., 2016. Delineating the continuum of marine eco-system-based management: a US fisheries reference point perspective. ICES J. Mar.Sci. 73, 1042–1050. https://doi.org/10.1093/icesjms/fsv242.
Fletcher, W.J., 2005. The application of qualitative risk assessment methodology toprioritize issues for fisheries management. ICES J. Mar. Sci. 62, 1576–1587.
Fletcher, W.J., Bianchi, G., 2014. The FAO – EAF toolbox: making the ecosystem ap-proach accessible to all fisheries. Ocean Coast. Manag. 90, 20–26. https://doi.org/10.1016/j.ocecoaman.2013.12.014.
Francis, T.B., Levin, P.S., Punt, A.E., Kaplan, I.C., Varney, A., Norman, K., 2018. Linkingknowledge to action in ocean ecosystem management: the ocean modeling forum.Elem. Sci. Anth. 6 (83). https://doi.org/10.1525/elementa.338.
Frimodig, A., Horeczko, M., Mason, T., Owens, B., Prall, M., Tillman, T., Wertz, S., 2008.Review of California Halibut Trawl Fishery in the California Halibut Trawl Grounds.[WWW Document]. http://aquaticcommons.org/1446/ (accessed 2.8.18).
Foley, M.M., Armsby, M.H., Prahler, E.E., Caldwell, M.R., Erickson, A.L., Kittinger, J.N.,Crowder, L.B., Levin, P.S., 2013. Improving Ocean Management through the Use ofEcological Principles and Integrated Ecosystem Assessments. BioScience 63,619–631. https://doi.org/10.1525/bio.2013.63.8.5.
Gaichas, S.K., Seagraves, R.J., Coakley, J.M., DePiper, G.S., Guida, V.G., Hare, J.A., Rago,P.J., Wilberg, M.J., 2016. A framework for incorporating species, fleet, habitat, andclimate interactions into fishery management. Front. Mar. Sci. 3. https://doi.org/10.3389/fmars.2016.00105.
Gibbs, M.T., Browman, H.I., 2015. Risk assessment and risk management: a primer formarine scientists. ICES J. Mar. Sci. 72, 992–996. https://doi.org/10.1093/icesjms/fsu232.
Halpern, B.S., Kappel, C.V., Selkoe, K.A., Micheli, F., Ebert, C.M., Kontgis, C., Crain, C.M.,Martone, R.G., Shearer, C., Teck, S.J., 2009. Mapping cumulative human impacts toCalifornia current marine ecosystems. Conserv. Lett. 2, 138–148.
Halpern, B.S., Longo, C., McLeod, K.L., Cooke, R., Fischhoff, B., Samhouri, J.F.,Scarborough, C.S., 2013. Elicited preferences for components of ocean health in theCalifornia current. Mar. Policy 42, 68–73.
Harty, J.M., Healey, M.C., Ludicello, S., DeWitt, J., Kirlin, J.J., Larson, R., 2010. LessonsLearned From California's Marine Life Management Act: Final Report. pp. 73.Available at: http://opc.ca.gov/webmaster/ftp/project_pages/mlmall/FINAL%20MLMA%20LL%205-26-10.pdf.
Hobday, A.J., Smith, A.D.M., Stobutzki, I.C., Bulman, C., Daley, R., Dambacher, J.M.,Deng, R.A., Dowdney, J., Fuller, M., Furlani, D., Griffiths, S.P., Johnson, D., Kenyon,R., Knuckey, I.A., Ling, S.D., Pitcher, R., Sainsbury, K.J., Sporcic, M., Smith, T.,Turnbull, C., Walker, T.I., Wayte, S.E., Webb, H., Williams, A., Wise, B.S., Zhou, S.,2011. Ecological risk assessment for the effects of fishing. Fish. Res. 108, 372–384.
Holsman, K., Samhouri, J., Cook, G., Hazen, E., Olsen, E., Dillard, M., Kasperski, S.,Gaichas, S., Kelble, C.R., Fogarty, M., Andrews, K., 2017. An ecosystem-based ap-proach to marine risk assessment. Ecosyst. Health Sustain 3https://doi.org/10.1002/ehs2.1256. n/a–n/a.
Hunsaker, C.T., Graham, R.L., Suter, G.W., O'Neill, R.V., Barnthouse, L.W., Gardner, R.H.,1990. Assessing ecological risk on a regional scale. Environ. Manag. 14, 325–332.https://doi.org/10.1007/BF02394200.
ISO, 2009. ISO 31000 - Risk Management - Principles and Guidelines. InternationalOrganisation of Standards, Geneva, Switzerland.
Jarvis, R.M., Borrelle, S.B., Breen, B.B., Towns, D.R., 2015. Conservation, mismatch and
the research–implementation gap. Pac. Conserv. Biol. 21, 105–107. https://doi.org/10.1071/PC14912.
Koehn, L.E., Essington, T.E., Marshall, K.N., Sydeman, W.J., Szoboszlai, A.I., Thayer, J.A.,Anderson, E., 2017. Trade-offs between forage fish fisheries and their predators in theCalifornia current. ICES J. Mar. Sci. 74, 2448–2458. https://doi.org/10.1093/icesjms/fsx072.
Levin, P.S., Essington, T.E., Marshall, K.N., Koehn, L.E., Anderson, L.G., Bundy, A.,Carothers, C., Coleman, F., Gerber, L.R., Grabowski, J.H., Houde, E., Jensen, O.P.,Möllmann, C., Rose, K., Sanchirico, J.N., Smith, A.D.M., 2018. Building effectivefishery ecosystem plans. Mar. Policy 92, 48–57. https://doi.org/10.1016/j.marpol.2018.01.019.
Marshall, K.N., Levin, P.S., Essington, T.E., Koehn, L.E., Anderson, L.G., Bundy, A.,Carothers, C., Coleman, F., Gerber, L.R., Grabowski, J.H., Houde, E., Jensen, O.P.,Möllmann, C., Rose, K., Sanchirico, J.N., Smith, A.D.M., 2017. Ecosystem-basedfisheries management for social-ecological systems: renewing the focus in the UnitedStates with next generation fishery ecosystem plans. Conserv. Lett. https://doi.org/10.1111/conl.12367. (n/a–n/a).
Maunder, M., Reilly, P., Tanaka, T., Schmidt, G., Penttila, K., 2011. California HalibutStock Assessment. (California Department of Fish and Wildlife).
Micheli, F., De Leo, G., Butner, C., Martone, R.G., Shester, G., 2014. A risk-based fra-mework for assessing the cumulative impact of multiple fisheries. Biol. Conserv. 176,224–235. https://doi.org/10.1016/j.biocon.2014.05.031.
National Research Council, 2008. Public Participation in Environmental Assessment andDecision Making. https://doi.org/10.17226/12434.
O., M., Martone, R.G., Hannah, L., Grieg, L., Boutillier, J., Patton, S., 2012. A risk-basedframework for ecosystem-based oceans management. In: CSAP Working Paper.
Oksanen, J., Kindt, R., Legendre, P., O'Hara, R.B., Simpson, G.L., Solymos, P., Stevens,M.H.H., Wagner, H., 2008. Vegan: Community Ecology Package. R Package Version1.15-0. Httpcranr-Proj. Httpveganr-Forg.-Proj.
Patrick, W.S., Spencer, P., Link, J., Cope, J., Field, J., Kobayashi, D., Lawson, P.,Gedamke, T., Cortés, E., Ormseth, O., Bigelow, K., Overholtz, W., 2010. Using pro-ductivity and susceptibility indices to assess the vulnerability of United States fishstocks to overfishing. Fish. Bull. 108, 305–322.
Plagányi, É.E., van Putten, I., Hutton, T., Deng, R.A., Dennis, D., Pascoe, S., Skewes, T.,Campbell, R.A., 2013. Integrating indigenous livelihood and lifestyle objectives inmanaging a natural resource. Proc. Natl. Acad. Sci. 110, 3639–3644. https://doi.org/10.1073/pnas.1217822110.
Poe, M.R., Norman, K.C., Levin, P.S., 2014. Cultural dimensions of socioecological sys-tems: key connections and guiding principles for conservation in coastal environ-ments. Conserv. Lett. 7, 166–175. https://doi.org/10.1111/conl.12068.
R Core Team, 2014. R: A Language and Environment for Statistical Computing. RFoundation for Statistical Computing, Vienna, Austria.
Röckmann, C., Kraan, M., Goldsborough, D., van Hoof, L., 2017. Stakeholder participa-tion in marine management: the importance of transparency and rules for partici-pation. In: Conservation for the Anthropocene Ocean, pp. 289–306. https://doi.org/10.1016/B978-0-12-805375-1.00014-3.
Samhouri, J.F., Levin, P.S., 2012. Linking land- and sea-based activities to risk in coastalecosystems. Biol. Conserv. 145, 118–129. https://doi.org/10.1016/j.biocon.2011.10.021.
Sayce, K., Shuman, C., Connor, D., Reisewitz, A., Pope, E., Miller-Henson, M., Poncelet,E., Monié, D., Owens, B., 2013. Beyond traditional stakeholder engagement: publicparticipation roles in California's statewide marine protected area planning process.Ocean Coast. Manag. 74, 57–66. https://doi.org/10.1016/j.ocecoaman.2012.06.012.Special Issue on California's Marine Protected Area Network Planning Process.
Smith, A.D.M., Smith, D.C., Haddon, M., Knuckey, I.A., Sainsbury, K.J., Sloan, S.R., 2014.Implementing harvest strategies in Australia: 5 years on. ICES J. Mar. Sci. 71,195–203. https://doi.org/10.1093/icesjms/fst158.
Stelzenmüller, V., Ellis, J.R., Rogers, S.I., 2010. Towards a spatially explicit risk assess-ment for marine management: assessing the vulnerability of fish to aggregate ex-traction. Biol. Conserv. 143, 230–238. https://doi.org/10.1016/j.biocon.2009.10.007.
Stelzenmüller, V., Fock, H.O., Gimpel, A., Rambo, H., Diekmann, R., Probst, W.N., Callies,U., Bockelmann, F., Neumann, H., Kröncke, I., 2015. Quantitative environmental riskassessments in the context of marine spatial management: current approaches andsome perspectives. ICES J. Mar. Sci. 72, 1022–1042. https://doi.org/10.1093/icesjms/fsu206.
Stelzenmüller, V., Coll, M., Mazaris, A.D., Giakoumi, S., Katsanevakis, S., Portman, M.E.,Degen, R., Mackelworth, P., Gimpel, A., Albano, P.G., Almpanidou, V., Claudet, J.,Essl, F., Evagelopoulos, T., Heymans, J.J., Genov, T., Kark, S., Micheli, F., Pennino,M.G., Rilov, G., Rumes, B., Steenbeek, J., Ojaveer, H., 2018. A risk-based approach tocumulative effect assessments for marine management. Sci. Total Environ. 612,1132–1140. https://doi.org/10.1016/j.scitotenv.2017.08.289.
Stobutzki, I.C., Miller, M.W., Brewer, D., 2001. Sustainability of fishery bycatch: a processfor assessing highly diverse and numerous bycatch. Environ. Conserv. 28, 167–181.
Swasey, J., Zollett, E., Wilson, E., 2016. Productivity and Susceptibility Analysis forSelected California Fisheries. MRAG Americas: Report to California Ocean ScienceTrust and California Department of Fish and Wildlife.
Wall, T.U., McNie, E., Garfin, G.M., 2017. Use-inspired science: making science usable byand useful to decision makers. Front. Ecol. Environ. 15, 551–559. https://doi.org/10.1002/fee.1735.
Weichselgartner, J., Kasperson, R., 2010. Barriers in the science-policy-practice interface:toward a knowledge-action-system in global environmental change research. Glob.
J.F. Samhouri et al. Biological Conservation 231 (2019) 103–121
120
Environ. Chang. 20, 266–277. https://doi.org/10.1016/j.gloenvcha.2009.11.006.White, C., Halpern, B.S., Kappel, C.V., 2012. Ecosystem service tradeoff analysis reveals
the value of marine spatial planning for multiple ocean uses. Proc. Natl. Acad. Sci.109, 4696–4701. https://doi.org/10.1073/pnas.1114215109.
Williams, A., Dowdney, J., Smith, A.D.M., Hobday, A.J., Fuller, M., 2011. Evaluatingimpacts of fishing on benthic habitats: A risk assessment framework applied toAustralian fisheries. In: Fisheries Research, Special Issue on Ecosystem-based ap-proaches for the assessment of fisheries under data-limited situations. 112. pp.154–167. https://doi.org/10.1016/j.fishres.2011.01.028.
Winemiller, K.O., 1989. Patterns of variation in life history among South American fishesin seasonal environments. Oecologia 81, 225–241. https://doi.org/10.1007/BF00379810.
Zhou, S., Griffiths, S.P., 2008. Sustainability assessment for fishing effects (SAFE): a newquantitative ecological risk assessment method and its application to elasmobranchbycatch in an Australian trawl fishery. Fish. Res. 91, 56–68.
Zhou, S., Hobday, A.J., Dichmont, C.M., Smith, A.D.M., 2016. Ecological risk assessmentsfor the effects of fishing: a comparison and validation of PSA and SAFE. Fish. Res.183, 518–529. https://doi.org/10.1016/j.fishres.2016.07.015.
J.F. Samhouri et al. Biological Conservation 231 (2019) 103–121
121