Embed Size (px)
Citation preview
An elastomeric insole for 3-axis ground reaction force measurement
Lucas Samuel Lincoln, Stacy J. Morris Bamberg, Erin Parsons, Curt Salisbury, and Jason Wheeler
Abstract— Measurement of the ground reaction force vec-tor is important in clinical gait analysis and biomechanicsresearch, for example to enable inverse dynamic calculations.Instrumented insoles allow biomechanical data to be collectedoutside of the motion analysis laboratory in many environments.However, current insole-based approaches typically measureonly the vertical component of the reaction force and theplantar center of pressure. This work describes the developmentand evaluation of a silicone insole capable of measuring thecomplete three dimensional reaction force vector. The insole isoptically based and low-cost with no complex manufacturingrequirements. Accuracy over five nominal gait trails is shownto be on the order of 10% of the force range, with mean errorsof 10.7 N in the shear directions and 68.1 N in normal. Theinsole can provide a simple mobile platform that allows kineticgait data to be collected in many environments while minimallyaffecting the wearer’s gait.
I. INTRODUCTION
Human motion analysis is an important tool for theidentification and diagnoses of pathological gait disordersor abnormalities. Though there are a handful of motionanalysis techniques of various technical sophistication, themodern motion analysis laboratory (MAL) typically sharesa common set of equipment: a stereographic camera systemfor 3D linkage kinematics, with passive or active markersattached to the subject; one or more 3- or 6-axis forceplates embedded in the floor for ground reaction force (GRF)and plantar center of pressure (CoP) measurement; a videocamera for qualitative analysis; and an electromyography(EMG) recording system to estimate muscle activation.
This type of laboratory is valuable due to its ability toquantify joint kinematics, kinetics and muscle activity. Theuse of force plates and camera systems in a MAL hasprovided clinicians and researchers with a robust set oftools for analyzing human motion for nearly 30 years [1],[2]. Inverse dynamic analysis can be performed to calculateexternal joint forces and torques. Additionally, algorithmssuch as computed muscle control [3] can be used to esti-mate muscle forces. This approach has several advantagesover competing methods for muscle force estimation, suchas the use of embedded in-vivo transducer placement [4]which is prohibitively invasive and EMG measurement [5]which is most effective for large, superficial muscles. GRF
L.S. Lincoln and E. Parsons are students in the Bioinstrumentation Lab atthe University of Utah, Salt Lake City, UT 84101 {lucas.lincoln,e.parsons}@utah.edu
Stacy Bamberg is an assistant professor at the University of Utah, SaltLake City, UT 84101 [email protected]
Jason Wheeler and Curt Salisbury are with the Intelligent Systems Con-trols Department, Sandia National Laboratories, Albuquerque, NM 87123{jwwheel, cmsalis}@sandia.gov
measurement using force plates is the current state of the artfor most kinetic motion analysis research.
Despite these advantages, there are some distinct disad-vantages to the use of conventional MAL equipment. First,an external reference motion capture system, such as room-mounted force plates and cameras, limits motion capture toa laboratory setting. In these systems, the temporal amountof data which can be captured is limited by the subject’stime in the laboratory and the spatial amount of data whichcan be captured is limited by the working volume of thelaboratory. The range of gaits that can be captured is alsolimited by the environment; though stairs and ramps can beinstrumented, common household and workplace obstaclesmust be brought in and adapted to function with a forceplate to simulate daily tasks [6], [7], [8].
Additionally, the biomechanics of the foot are difficult toanalyze in these systems because force plate data capturethe GRF from the CoP of the shoe sole rather than thefoot. Different types of shoes can affect the gait parametersand change the plantar pressure distribution on the foot [9].Measuring the pressure distribution inside the shoe can allowa more direct, accurate, and detailed measurement of the footplantar pressures and allow more accurate analysis of thebiomechanics of the foot joints and muscles.
Finally, in order to evaluate the chronic effects of gait dis-orders or parameters, motion capture must take place often,or over long time scales. Ideally, data can be captured in theeveryday environment of the subject to evaluate the effectsof stairs, ramps, terrain and obstacles on gait characteristics.The authors assert that a low cost, external-reference free,and mobile motion analysis system holds immense value formotion analysis; as well as asserting that an insole-basedsolution is preferred. Mobile kinematic gait analysis systemshave been developed but kinetic measurement systems areimmature relative to MAL technology.
Several instrumented insoles and shoes are available forvertical GRF and CoP measurement. The GaitShoe (Mas-sachusetts Institute of Technology, Boston, MA, USA) hasbeen shown to estimate vertical GRF using force-sensitive-resistors (FSRs) [10]. CoP has also been estimated with theLEAFS (University of Utah, Utah, USA) insoles using FSRsand validated against force plate data [11]. The Parotec Sys-tem (Paromed Medizintechnik, Neubeuern, Germany) insoleuses 24 microsensors embedded within a hydrocell to obtainCoP data [12]. The BioFoot (Instituto de Biomecanica deValencia, Valencia, Spain) contains 64 piezoelectric sensorsto acquire detailed plantar pressure distributions [13]. TheF-scan (Tekscan Inc., Boston, MA, USA) uses 960 pressuresensors for an insole measurement system, which has been
The Fourth IEEE RAS/EMBS International Conferenceon Biomedical Robotics and BiomechatronicsRoma, Italy. June 24-27, 2012
978-1-4577-1198-5/12/$26.00 ©2012 IEEE 1512
used to detect GRF events such as initial contact and toe-off[14].
Insole technology for measuring shear forces began withmagneto-resistive sensor technology in the fore-aft direction[15] and later adapted to measuring shear forces in twodirections [16] in the 1980’s. The magneto-resistive trans-ducers can be coupled with load cells to obtain three-axisGRF with an insole [16]. The Kent Shear System (KentUniversity, Canterbury, UK) developed a bi-axial shear stressinsole measurement system using piezoelectric resistors [17].These shear insoles are constructed using cork and leatherthat are the same thickness as the transducer, so the subject’sfoot can come in direct contact with the shear transducer.
The XSens ForceShoe (XSens Technologies, Enschede,Netherlands) uses MEMS 3D inertial sensors in combinationwith load cells in an instrumented shoe to acquire three-axis GRF and CoP [18]. The ability of the ForceShoeto measure the GRF in three directions has significantlyimproved mobile motion analysis. However, the instrumentedshoe design may alter the wearer’s gait, must be fit carefullyand is expensive. The insole Parotec System has the capa-bility to measure three-axis GRF using the shear modulusof elasticity of the hydrocell [19] but, has not yet beensuccessfully implemented in research due to the sensitivityof the sensor locations [12]. The M3D system (DoshishaUniversity, Kyoto, Japan), uses small, mobile force platesand inertial measurement units (IMU) attached externally tovarious shoe types and sizes to measure three-axis GRF andCoP [20].
The insoles developed from previous research have beenshown to accurately measure vertical GRF and plantar CoP.There is a need to measure three-axis GRF in order toaccurately use inverse dynamics to resolve the joint kineticsand muscle forces. Although the instrumented ForceShoe canmeasure three-axis GRF, its applicability is limited by itshigh cost, limited range of shoe types/sizes and potentialconfounding effects on the wearer’s gait. The work presentedin this paper describes a novel, low-profile insole for mea-suring three-axis GRF and CoP with low cost tactile sensors,embedded in a silicone mold that can be adapted to variousshoe types and sizes.
II. INSOLE DEVELOPMENT
The present work describes an elastomeric insole consist-ing of five 3-axis optical tactile sensor sites. The sensors aremounted on a flexible printed circuit board (PCB) and areembedded in silicone so as to not be felt by the wearer. Theinsole can be placed in most shoes within minimal effecton comfort or performance. The details of the sensors andinsole are provided below.
A. Sensor Principal of Operation
The sensor uses reflected light intensity to detect theproximity of a reflective material. As a normal load isapplied to the reflective material, the interstitial transparentmaterial compresses and the reflective material moves closerto the light source (emitter) and light sensor (detector). This
a) b)
c) d)
Fig. 1. The optical sensor’s operating principle. a)-b) Normal loads movethe reflective surface closer to the emitter, increasing the intensity of thelight at the detector. c)-d) Shear loads move the absorptive portion of thepolymer relative to the emitter, changing the intensity of the light at thedetector.
re�ective
opaque
material
absorptive
opaque
material
clear
resilient
material
clear
rigid
material
re�ective
optical
sensors
6 mm+ Z direction
+ X direction
+ Y direction
2
3
5
Fig. 2. Configuration of five photomicrosensors embedded in a siliconeinsole covered with a silicone mask.
causes the detector to detect increased reflected light fromthe emitter. (See Fig. 1a and 1b) Shear loads are sensedby adding absorptive regions to the reflective layer. Anapplied shear load changes the ratio of absorptive to reflectivematerial between the emitter and the detector. The changesthe amount of light reflected back to the detector. (See Fig. 1cand 1d)
B. Sensor Construction
The tactile sensor uses photomicrosensors (EE-SY199,Omron Corporation, Kyoto, Japan) containing a light emitterand detector. The emitter is potted in optically clear epoxy(ES1902 Hysol, Locktite, Henjel, Dusseldorf, Germany) anda clear layer of silicone rubber (Dragon Skin FAST, Smooth-On, Inc, Easton, Pennsylvania) is adhered atop the sensor.Attached to the top of the clear, resilient silicone layer is anopaque silicone layer with a pattern of absorptive (black) andreflective (white) areas. Utilizing 5 photomicrosensors, anddesigning the geometry of the microsensor layer and siliconemask, the sensor responds to strain in the elastomer in three
1513
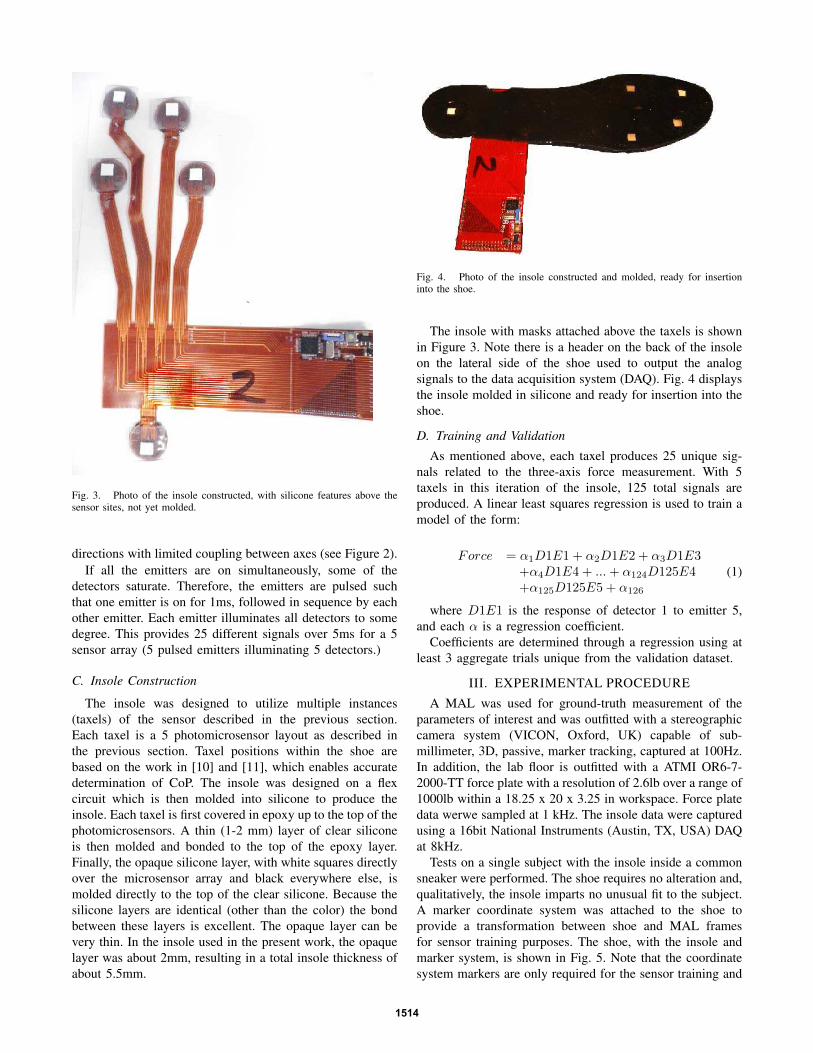
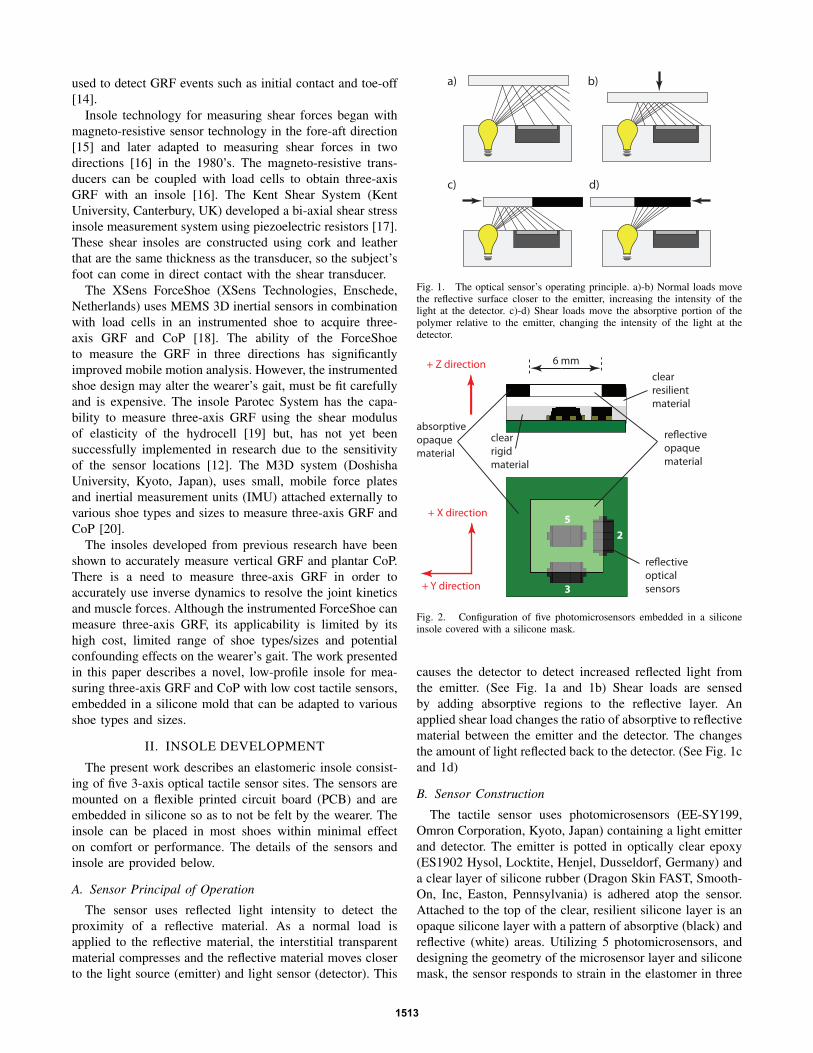
Fig. 3. Photo of the insole constructed, with silicone features above thesensor sites, not yet molded.
directions with limited coupling between axes (see Figure 2).If all the emitters are on simultaneously, some of the
detectors saturate. Therefore, the emitters are pulsed suchthat one emitter is on for 1ms, followed in sequence by eachother emitter. Each emitter illuminates all detectors to somedegree. This provides 25 different signals over 5ms for a 5sensor array (5 pulsed emitters illuminating 5 detectors.)
C. Insole Construction
The insole was designed to utilize multiple instances(taxels) of the sensor described in the previous section.Each taxel is a 5 photomicrosensor layout as described inthe previous section. Taxel positions within the shoe arebased on the work in [10] and [11], which enables accuratedetermination of CoP. The insole was designed on a flexcircuit which is then molded into silicone to produce theinsole. Each taxel is first covered in epoxy up to the top of thephotomicrosensors. A thin (1-2 mm) layer of clear siliconeis then molded and bonded to the top of the epoxy layer.Finally, the opaque silicone layer, with white squares directlyover the microsensor array and black everywhere else, ismolded directly to the top of the clear silicone. Because thesilicone layers are identical (other than the color) the bondbetween these layers is excellent. The opaque layer can bevery thin. In the insole used in the present work, the opaquelayer was about 2mm, resulting in a total insole thickness ofabout 5.5mm.
Fig. 4. Photo of the insole constructed and molded, ready for insertioninto the shoe.
The insole with masks attached above the taxels is shownin Figure 3. Note there is a header on the back of the insoleon the lateral side of the shoe used to output the analogsignals to the data acquisition system (DAQ). Fig. 4 displaysthe insole molded in silicone and ready for insertion into theshoe.
D. Training and Validation
As mentioned above, each taxel produces 25 unique sig-nals related to the three-axis force measurement. With 5taxels in this iteration of the insole, 125 total signals areproduced. A linear least squares regression is used to train amodel of the form:
Force = α1D1E1 + α2D1E2 + α3D1E3+α4D1E4 + ...+ α124D125E4+α125D125E5 + α126
(1)
where D1E1 is the response of detector 1 to emitter 5,and each α is a regression coefficient.
Coefficients are determined through a regression using atleast 3 aggregate trials unique from the validation dataset.
III. EXPERIMENTAL PROCEDURE
A MAL was used for ground-truth measurement of theparameters of interest and was outfitted with a stereographiccamera system (VICON, Oxford, UK) capable of sub-millimeter, 3D, passive, marker tracking, captured at 100Hz.In addition, the lab floor is outfitted with a ATMI OR6-7-2000-TT force plate with a resolution of 2.6lb over a range of1000lb within a 18.25 x 20 x 3.25 in workspace. Force platedata werwe sampled at 1 kHz. The insole data were capturedusing a 16bit National Instruments (Austin, TX, USA) DAQat 8kHz.
Tests on a single subject with the insole inside a commonsneaker were performed. The shoe requires no alteration and,qualitatively, the insole imparts no unusual fit to the subject.A marker coordinate system was attached to the shoe toprovide a transformation between shoe and MAL framesfor sensor training purposes. The shoe, with the insole andmarker system, is shown in Fig. 5. Note that the coordinatesystem markers are only required for the sensor training and
1514
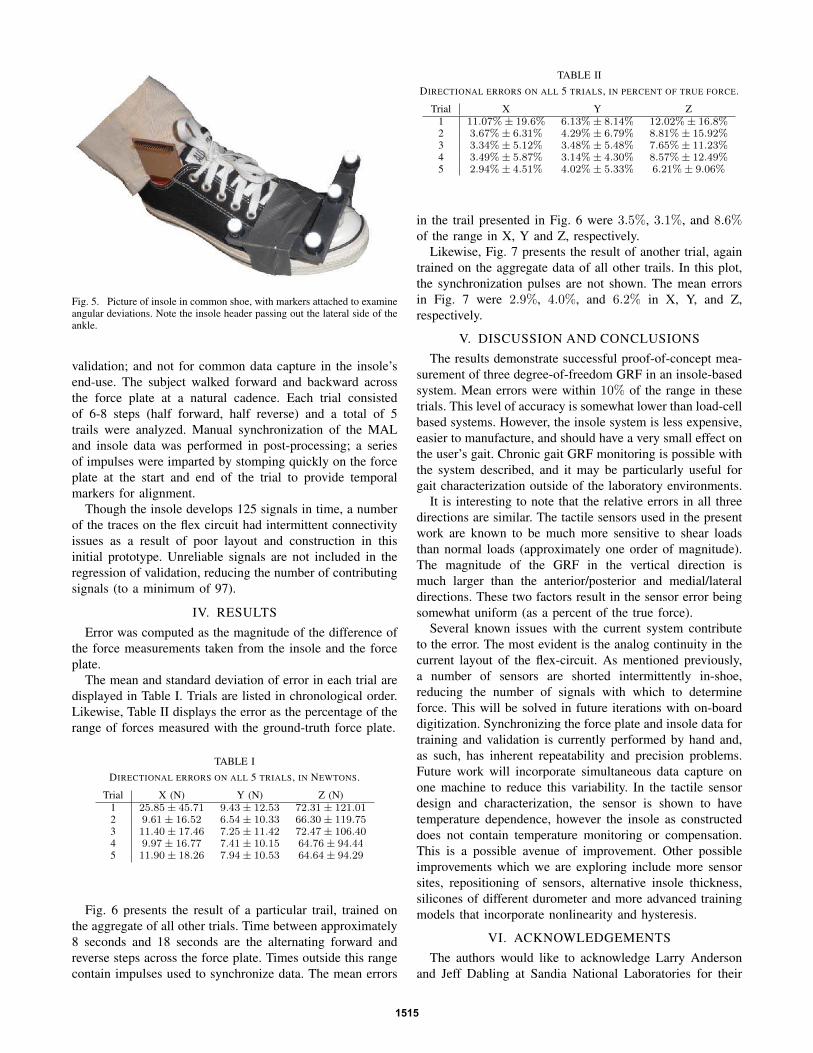
Fig. 5. Picture of insole in common shoe, with markers attached to examineangular deviations. Note the insole header passing out the lateral side of theankle.
validation; and not for common data capture in the insole’send-use. The subject walked forward and backward acrossthe force plate at a natural cadence. Each trial consistedof 6-8 steps (half forward, half reverse) and a total of 5trails were analyzed. Manual synchronization of the MALand insole data was performed in post-processing; a seriesof impulses were imparted by stomping quickly on the forceplate at the start and end of the trial to provide temporalmarkers for alignment.
Though the insole develops 125 signals in time, a numberof the traces on the flex circuit had intermittent connectivityissues as a result of poor layout and construction in thisinitial prototype. Unreliable signals are not included in theregression of validation, reducing the number of contributingsignals (to a minimum of 97).
IV. RESULTSError was computed as the magnitude of the difference of
the force measurements taken from the insole and the forceplate.
The mean and standard deviation of error in each trial aredisplayed in Table I. Trials are listed in chronological order.Likewise, Table II displays the error as the percentage of therange of forces measured with the ground-truth force plate.
TABLE IDIRECTIONAL ERRORS ON ALL 5 TRIALS, IN NEWTONS.
Trial X (N) Y (N) Z (N)1 25.85± 45.71 9.43± 12.53 72.31± 121.012 9.61± 16.52 6.54± 10.33 66.30± 119.753 11.40± 17.46 7.25± 11.42 72.47± 106.404 9.97± 16.77 7.41± 10.15 64.76± 94.445 11.90± 18.26 7.94± 10.53 64.64± 94.29
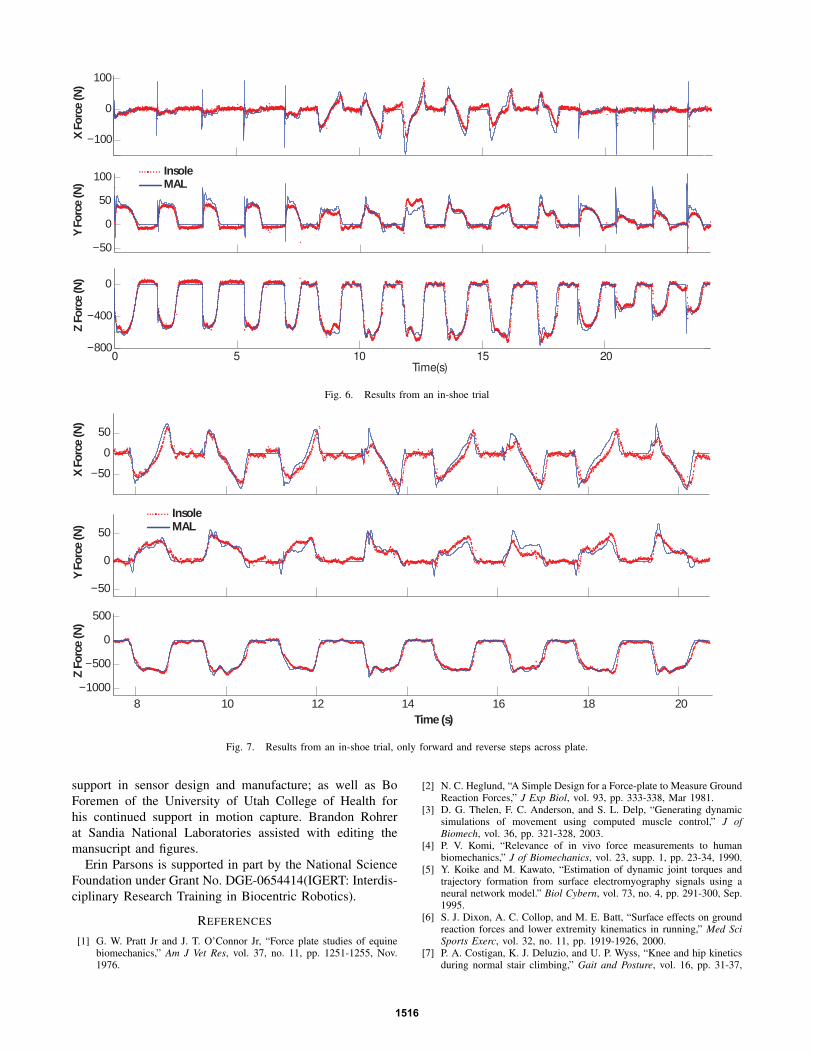
Fig. 6 presents the result of a particular trail, trained onthe aggregate of all other trials. Time between approximately8 seconds and 18 seconds are the alternating forward andreverse steps across the force plate. Times outside this rangecontain impulses used to synchronize data. The mean errors
TABLE IIDIRECTIONAL ERRORS ON ALL 5 TRIALS, IN PERCENT OF TRUE FORCE.
Trial X Y Z1 11.07%± 19.6% 6.13%± 8.14% 12.02%± 16.8%2 3.67%± 6.31% 4.29%± 6.79% 8.81%± 15.92%3 3.34%± 5.12% 3.48%± 5.48% 7.65%± 11.23%4 3.49%± 5.87% 3.14%± 4.30% 8.57%± 12.49%5 2.94%± 4.51% 4.02%± 5.33% 6.21%± 9.06%
in the trail presented in Fig. 6 were 3.5%, 3.1%, and 8.6%of the range in X, Y and Z, respectively.
Likewise, Fig. 7 presents the result of another trial, againtrained on the aggregate data of all other trails. In this plot,the synchronization pulses are not shown. The mean errorsin Fig. 7 were 2.9%, 4.0%, and 6.2% in X, Y, and Z,respectively.
V. DISCUSSION AND CONCLUSIONSThe results demonstrate successful proof-of-concept mea-
surement of three degree-of-freedom GRF in an insole-basedsystem. Mean errors were within 10% of the range in thesetrials. This level of accuracy is somewhat lower than load-cellbased systems. However, the insole system is less expensive,easier to manufacture, and should have a very small effect onthe user’s gait. Chronic gait GRF monitoring is possible withthe system described, and it may be particularly useful forgait characterization outside of the laboratory environments.
It is interesting to note that the relative errors in all threedirections are similar. The tactile sensors used in the presentwork are known to be much more sensitive to shear loadsthan normal loads (approximately one order of magnitude).The magnitude of the GRF in the vertical direction ismuch larger than the anterior/posterior and medial/lateraldirections. These two factors result in the sensor error beingsomewhat uniform (as a percent of the true force).
Several known issues with the current system contributeto the error. The most evident is the analog continuity in thecurrent layout of the flex-circuit. As mentioned previously,a number of sensors are shorted intermittently in-shoe,reducing the number of signals with which to determineforce. This will be solved in future iterations with on-boarddigitization. Synchronizing the force plate and insole data fortraining and validation is currently performed by hand and,as such, has inherent repeatability and precision problems.Future work will incorporate simultaneous data capture onone machine to reduce this variability. In the tactile sensordesign and characterization, the sensor is shown to havetemperature dependence, however the insole as constructeddoes not contain temperature monitoring or compensation.This is a possible avenue of improvement. Other possibleimprovements which we are exploring include more sensorsites, repositioning of sensors, alternative insole thickness,silicones of different durometer and more advanced trainingmodels that incorporate nonlinearity and hysteresis.
VI. ACKNOWLEDGEMENTSThe authors would like to acknowledge Larry Anderson
and Jeff Dabling at Sandia National Laboratories for their
1515
−100
0
100X
Forc
e (N
)
−50
0
50
100
Y Fo
rce
(N)
−800
−400
0
Z Fo
rce
(N)
20151050
Time(s)
InsoleMAL
Fig. 6. Results from an in-shoe trial
−50
0
50
X F
orce
(N)
−50
0
50
Y Fo
rce
(N)
8 10 12 14 16 18 20−1000
−500
0
500
Time (s)
Z Fo
rce
(N)
InsoleMAL
Fig. 7. Results from an in-shoe trial, only forward and reverse steps across plate.
support in sensor design and manufacture; as well as BoForemen of the University of Utah College of Health forhis continued support in motion capture. Brandon Rohrerat Sandia National Laboratories assisted with editing themansucript and figures.
Erin Parsons is supported in part by the National ScienceFoundation under Grant No. DGE-0654414(IGERT: Interdis-ciplinary Research Training in Biocentric Robotics).
REFERENCES
[1] G. W. Pratt Jr and J. T. O’Connor Jr, “Force plate studies of equinebiomechanics,” Am J Vet Res, vol. 37, no. 11, pp. 1251-1255, Nov.1976.
[2] N. C. Heglund, “A Simple Design for a Force-plate to Measure GroundReaction Forces,” J Exp Biol, vol. 93, pp. 333-338, Mar 1981.
[3] D. G. Thelen, F. C. Anderson, and S. L. Delp, “Generating dynamicsimulations of movement using computed muscle control,” J ofBiomech, vol. 36, pp. 321-328, 2003.
[4] P. V. Komi, “Relevance of in vivo force measurements to humanbiomechanics,” J of Biomechanics, vol. 23, supp. 1, pp. 23-34, 1990.
[5] Y. Koike and M. Kawato, “Estimation of dynamic joint torques andtrajectory formation from surface electromyography signals using aneural network model.” Biol Cybern, vol. 73, no. 4, pp. 291-300, Sep.1995.
[6] S. J. Dixon, A. C. Collop, and M. E. Batt, “Surface effects on groundreaction forces and lower extremity kinematics in running,” Med SciSports Exerc, vol. 32, no. 11, pp. 1919-1926, 2000.
[7] P. A. Costigan, K. J. Deluzio, and U. P. Wyss, “Knee and hip kineticsduring normal stair climbing,” Gait and Posture, vol. 16, pp. 31-37,
1516
2002.[8] B. Yu, E. S. Growney, F. M. Schultz, and K. An, “Calibration of
measured center of pressure of a new stairway design for kineticanalysis of stair climbing,” J of Biomechanics, vol. 29, no. 12, pp.1625-1628, 1996.
[9] T. G. McPoil Jr, “Footwear,” J of Phys Therap, vol. 68, no. 12, pp.1857-1865, Dec. 1988.
[10] S. J. M. Bamberg, A. Y. Benbasat, D. M. Scarborough, D. E. Krebs,and J. A. Paradiso, “Gait Analysis Using a Shoe-Integrated WirelessSensor System,” IEEE Trans on Info Tech in Biomedicine, vol. 12, no.4, pp. 413-423, Jul 2008.
[11] P. S. Dyer and S. J. M. Bamberg, “Instrumented Insole vs. Force Plate:A Comparison of Center of Plantar Pressure,” presented at the IEEEEng in Med and Bio Conf, Boston, MA, USA, Sept 2011.
[12] K. J. Chesnin, L. Selby-Silverstein, and M. P. Besser, “Comparison ofan in-shoe pressure measurement device to a force plate: concurrentvalidity of center of pressure measurements,” Gait and Posture, vol.12, pp. 128-133, 2000.
[13] A. Martınez-Nova, J. C. Cuevas-Garcıa, J. Pascual-Huerta, and R.Sanchez-Rodrıguez, “BioFoot in-shoe system: Normal values andassessment of the reliability and repeatability,” The Foot, vol. 17, pp.
190-196, Apr 2007.[14] P. Catalfamo, D. Moser, S. Ghoussayni, and D. Ewins, “Detection of
gait events using an F-Scan in-shoe pressure measurement system,”Gait & Posture, vol. 28, pp. 420-426, Jan 2008.
[15] J. P. Pollard, L. P. Le Quesne, and J. W. Tappin, “Forces under thefoot,” J of Biomed Eng, vol. 5, no. 1, pp. 37-40, Jan 1983.
[16] M. Lord, R. Hosein, and R. B. Williams, “Method for in-shoe shearstress measurement,” J of Biomed Eng, vol. 14, no. 3, pp. 181-186,May 1992.
[17] F. Akhlaghi and M. G. Pepper, “In-shoe biaxial shear force measure-ment: the Kent shear system,” Med Biol Eng Comput, vol. 34, no. 4,pp. 315-317, Jul 1996.
[18] XSens Technologies, “The ForceShoe.” [Online]. Available:http://www.xsens.com/en/general/forceshoe
[19] Parotec System instruction manual, Paromed Medizintechnik GmbH.1997: Neubeuern, Germany.
[20] W. Adachi et al., “Development of Walking Analysis System Consist-ing of Mobile Force Plate and Motion Sensor,” 33rd Annual Int Confof the IEEE EMBS , Boston, MA, USA, Aug 2011.
1517