Embed Size (px)
Citation preview

THE ECONOMICS OF LAND DEGRADATION
Land Degradation, Less Favored Lands and the Rural Poor: A Spatial and Economic Analysis
An ELD Assessment
www.eld-initiative.org

2
Suggested citation:
Edward B. Barbier and Jacob P. Hochard, 2014. “Land Degradation, Less Favored Lands and the Rural Poor: A Spatial and Economic Analysis.” A Report for the Economics of Land Degradation Initiative. Department of Economics and Finance, University of Wyoming.
Available from: www.eld-initiative.org
Report main contributors:
Edward B. Barbier, John S. Bugas Professor of Economics, Department of Economics & Finance, University of Wyoming
Jacob P. Hochard, Department of Economics & Finance, University of Wyoming
This report was published with the support of the partner organizations of the ELD Initiative and
the Deutsche Gesellschaft für Internationale Zusammenarbeit (GIZ) GmbH on behalf of the
German Federal Ministry for Economic Cooperation and Development (BMZ)
Front cover photos: ELD Secretariat
Visual concept: MediaCompany, Bonn Office
Layout: kippconcept GmbH, Bonn
For further Information and feedback please contact:
ELD Secretariat
Mark Schauer
c/o Deutsche Gesellschaft für Internationale Zusammenarbeit (GIZ) GmbH
Godesberger Allee 119
53175 Bonn, Germany

A N E L D A S S E S S M E N T
3
Executive summary
This study h as three objectives:
❚❚ To determine the spatial distribution of global rural populations on less favoured agricultural land and in less favoured agricultural areas from 2000–2010;
❚❚ To determine the spatial distribution of global rural populations on degrading and improving agricultural land from 2000–2010;
❚❚ To analyse how these spatial distributions affect poverty in developing countries.
Less favoured agricultural land (LFAL) is susceptible to low productivity and degradation, because its agricultural potential is constrained biophysically by terrain, poor soil quality or limited rainfall. We include in LFAL irrigated land on terrain greater than 8 per cent median slope; rainfed land with a length of growing period (LGP) of more than 120 days but either on terrain greater than eight per cent median slope or with poor soil quality; semi-arid land (land with LGP 60–119 days); and arid land (land with LGP < 60 days).
Less favoured agricultural areas (LFAA) include all LFAL plus favourable agricultural land with limited market access (i. e. located in remote areas). Market access is identified as less than five hours of travel to a market city with a population of 50,000 or more.
Degrading agricultural land consists of agricultural land with a negative change in Net Primary Pro-
ductivity (NPP) from 1981–2000. NPP is measured as the change in grams of carbon sequestered per square meter over this time period after subtract-ing respiration losses.
Improving agricultural land consists of agricultural land with a non-negative change in NPP from 1981–2000.
Using a variety of global spatially referenced data-sets, we analyze the spatial distribution of global rural populations on these four types of land in 2000 and 2010.
As summarized in the table below, our spatial anal-ysis confirms that the concentration of rural popu-lations on LFAL, LFAA and degrading agricultural lands is predominantly a developing country prob-lem. The number of people in these locations has increased significantly from 2000–2010, both glob-ally and in each major developing country region. In 2000, over 1.3 billion rural people in developing countries were located on LFAL, and their numbers increased to 1.5 billion in 2010. In 2000, nearly 1.4 billion people lived in LFAA in developing coun-tries, increasing to nearly 1.6 billion in 2010. Thus, well over a third of the rural population is located in LFAL and LFAA. In 2000, nearly 1.3 billion were located on all degrading agricultural land, which included 202 million without market access (around 6 per cent of the rural population). By 2010, over 1.4 billion people were located on degrading
Population in 2000 (millions)
Population in 2010 (millions)
Global
Developing country
Global
Developing country
Rural population 4,111.5 3,706.8 4,663.9 4,248.6
Rural population on LFAL 1,486.3 1,314.5 1,666.6 1,499.7
Rural population in LFAA 1,556.4 1,382.7 1,748.6 1,579.8
Rural population on remote LFAL 298.4 288.2 332.4 322.5
Rural population on all degrading agricultural land 1,331.3 1,258.7 1,496.9 1,426.3
Rural population on remote degrading agricultural land 205.4 202.2 233.2 230.2
Rural population on all improving agricultural land 1,537.1 1,340.7 1,729.9 1,539.4
Rural population on remote improving agricultural land 164.3 155.3 178.2 169.2
Developing countries are all low and middle-income economies with 2012 per capita income of USD 12,615 or less (World Bank, 2014).

4
agricultural land, which included 230 million peo-ple in remote areas. They account for 34 and 5 per cent of the rural population, respectively.
Of particular concern is the continuing expansion in the number of rural people in developing coun-tries on LFAL without market access, from nearly 300 million in 2000 to over 330 million in 2010. This critical population group appears to be increasing by over 1 per cent annually across the developing world, and at annual rates approaching 2 per cent in Latin America & Caribbean and South Asia and over 3 per cent in Sub-Saharan Africa. But there should also be concern over the growth in the rural population of developing countries on remote degraded agricultural land. This segment of the rural population appears to be expanding by over 1 per cent annually across the developing world, and at annual rates of 2 per cent in Latin America & Caribbean and South Asia and 4 per cent in Sub-Saharan Africa.
However, an encouraging trend is the growth in the population of developing countries on all improving agricultural land, even in some remote areas. In 2000, there were 1.3 billion people on improving agricultural land, which included 155 million people without market access. By 2010, there were over 1.5 billion people on improving agricultural land in developing countries, and the numbers in remote areas increased to 169 million people. These comprised 36 and 4 per cent of the rural population, respectively.
Across a wide range of developing countries, as more rural people are located on LFAL, LFAA and degrading agricultural land, the result is an increase in the overall poverty rate. However, if the share of the rural population on improving agricul-tural land rises, then poverty is reduced. The most critical population groups appear to be rural popu-lations on less favoured and degrading agricul-tural land without market access. If there is a sub-stantial reduction in the share of the rural popula-tion on remote LFAL and degrading agricultural land, then poverty rates could fall across a wide range of developing countries.
These results lend credence to recent concerns about the prevalence of geographical poverty traps in the rural areas of developing countries. Reduc-ing rural poverty may require either a large-scale regional approach or assisting the exit of popula-tions to alleviate the problem of the concentration of rural populations on LFAL, LFAA and degrading agricultural lands. In particular, our findings sug-gest that the most critical and vulnerable rural population groups are those located on LFAL and degrading agricultural lands that are also remote from markets. These segments of the rural popula-tion should be the main target of any strategy aimed at encouraging out-migration while invest-ing in improving the livelihoods of those who remain in such locations.
Initial level
Final level
per cent change in poverty rate
per year
Share (%) of rural population on LFAL 38.15 59.10 0.92 to 0.99
Share (%) of rural population in LFAA 40.04 60.83 0.97 to 1.11
Share (%) of rural population located on remote LFAL 8.50 16.90 0.35 to 0.47
Share (%) of rural population on LFAL located on remote LFAL 24.74 43.55 0.95 to 1.32
Share (%) of rural population on all degrading agricultural land 27.11 48.15 0.98 to 1.04
Share (%) of rural population on all remote degrading agricultural land 5.02 9.45 0.18 to 0.25
Share (%) of rural population on all improving agricultural land 31.89 52.94 –0.57 to –0.76
Share (%) of rural population on all remote improving agricultural land 13.45 32.28 –0.55 to –0.74
The initial level is based on the mean and the final level on a one-standard-deviation change in the relevant variables listed in the far-left column for the sample of 83 developing countries.

A N E L D A S S E S S M E N T
5
Table of contents
Executive summary. . . . . . . . . . . . . . . . . . . . . . . . . . . . . . . . . . . . . . . . . . . . . . . . . . . . . . . . . . . . . . . . . . . . . 3
Table of contents . . . . . . . . . . . . . . . . . . . . . . . . . . . . . . . . . . . . . . . . . . . . . . . . . . . . . . . . . . . . . . . . . . . . . . . . 5
Chapter 1 Introduction . . . . . . . . . . . . . . . . . . . . . . . . . . . . . . . . . . . . . . . . . . . . . . . . . . . . . . . . . . . . . . . . . . . . . . . . . . . . 6
Chapter 2 Rural Populations on LFAL and LFAA . . . . . . . . . . . . . . . . . . . . . . . . . . . . . . . . . . . . . . . . . . . . . . . . . . . 8
Chapter 3 Rural Populations on Degrading and Improving Agricultural Land . . . . . . . . . . . . . . . . . . . 18
Chapter 4 Poverty and the Spatial Distribution of Rural Populations. . . . . . . . . . . . . . . . . . . . . . . . . . . . . . 28
Chapter 5 Conclusion: Policy Implication and Further Research . . . . . . . . . . . . . . . . . . . . . . . . . . . . . . . . . 32
References . . . . . . . . . . . . . . . . . . . . . . . . . . . . . . . . . . . . . . . . . . . . . . . . . . . . . . . . . . . . . . . . . . . . . . . . . . . . . . 35
Appendix: Technical Notes . . . . . . . . . . . . . . . . . . . . . . . . . . . . . . . . . . . . . . . . . . . . . . . . . . . . . . . . . . . . . 37

C H A P T E R
01
6
Introduction
About a quarter of global land area is degraded, affecting around 1.5 billion people worldwide (Bai et al., 2008; von Braun et al., 2012). However, the economic consequences of land degradation are not the same for all people or countries. A number of studies of the spatial location of populations in marginal areas indicate that it is the rural poor of the least developed economies whose livelihoods are most dependent on degraded and less favoured lands (Barbier, 2010 and 2012; CGIAR 1999; Nachter-gaele et al., 2010; World Bank, 2003 and 2008). Such evidence has important implications for policies to promote sustainable land management, alleviate poverty, and foster economic development.
For example, as the World Bank (2008, p. 49) con-cludes, “the extreme poor in more marginal areas are especially vulnerable”, and “one concern is the existence of geographical poverty traps”. Such traps may occur because production on LFAL is sub-ject to low yields and soil degradation, while lack of access to markets and infrastructure may con-strain the ability of poor households to improve their farming systems and livelihoods or obtain off-farm employment. If the spatial concentration of rural populations on LFAL and LFAA perpetuates geographical poverty traps, such “spatial inequal-ity” may have significant implications for the reduction of overall poverty in developing coun-tries (Barbier, 2012; Bird et al., 2002 and 2010; Jalan and Ravallion, 2002; Kanbur and Venables, 2005).
One of the first studies to determine the distribu-tion of the rural poor on less favoured lands glob-ally was CGIAR (1999), which concluded that nearly two-thirds of the rural population of developing countries – almost 1.8 billion people – live on less-favoured lands, including marginal agricultural lands, forest and woodland areas, and arid zones. By applying national rural poverty percentages, CGIAR (1999) determined that 633 million poor people lived on less favoured lands in developing
countries, or around two-thirds of the total rural poor (see also CAWMA, 2008).
A subsequent analysis by the World Bank (2003) sought to identify the percentage of total popula-tion in a selection of low and middle-income econo-mies located on “fragile lands” in 2000. This classi-fication comprised four categories of land: terrain greater than eight per cent median slope, soil unsuitable for rainfed agriculture, arid and dry semi-arid land without access to irrigation, and for-ests (deciduous, evergreen and mixed). The study estimated that nearly 1.3 billion people in 2000 – almost a fifth of the world’s population – lived in such areas in developing regions, and concluded that since 1950, the estimated population in devel-oping economies on “fragile lands” may have dou-bled (World Bank, 2003).
A further study by the World Bank (2008) employed the definition proposed by Pender and Hazell (2000) for less favoured areas to determine the spa-tial distribution of rural populations in 2000. How-ever, the analysis was able to determine only the distribution of rural population on lands limited by rainfall (arid and semi-arid lands) and in remote areas. The latter are defined as locations with poor market access, requiring five or more hours to reach a market town of 50,000 or more. In 2000, around 430 million people in developing countries lived in such distant rural areas, and nearly half (49 per cent) of these populations were located in semi and semi-arid regions characterised by fre-quent moisture stress that limits agricultural pro-duction (World Bank, 2008).
Since the 1980s, remotely sensed global normal-ized difference vegetation index (NDVI) data trends have been used as a proxy for land degradation (Bai et al., 2008 and 2010; de Jong et al., 2011). This has been facilitated by the availability of a long time series of consistent global NDVI data and detailed

A N E L D A S S E S S M E N T
7
studies of its relationship with leaf area index and net primary productivity (NPP). For example, Bai et al. (2008) depict global change in NDVI, scaled in terms of NPP, over the period 1981–2003, and have determined that over 1.5 billion people, or nearly a quarter of the world’s population is affected by land degradation. Nachtergaele et al. (2010) employ NDVI to determine the spatial location of the rural poor with respect to degraded land. Globally, around 42 per cent of the poor are located on degraded land, compared with 32 per cent of the moderately poor and 15 per cent of the non-poor (Nachtergaele et al., 2010). Other studies also use NDVI to indicate correlations between land degra-dation and GDP in various global regions (Nkonya et al., 2011; von Braun et al., 2012). The results show that, in all regions, GDP changes are positively cor-related with NDVI changes, and this trend is espe-cially noticeable in North America, Russia, India, central Africa (north of the equator) and China.
However, these past studies on the spatial location of rural populations with respect to degraded and unfavourable land have two shortcomings. First, the studies differ significantly in their use of key spatial land and population indicators (Nkonya et al., 2011). Second, the spatially referenced data gen-erated are inadequate for cross-country economic analysis of the impact of land degradation on global poverty (von Braun et al., 2012).
The following study addresses these two shortcom-ings. First, through geographic information sys-tem (GIS) analysis, spatially referenced data are employed to map globally indicators of degrading versus improving agricultural land, LFAL and LFAA. Second, GIS is also used to overlay the latter indicators with spatially referenced data on rural population. This analysis is conducted globally, across the developing world, by region and by country, and for two time periods, 2000 and 2010. Third, these spatial data sets are used in a cross-
country econometric analysis to determine how changes in poverty are affected by the spatial dis-tribution of rural populations in developing coun-tries on degrading and improving agricultural land, LFAL and LFAA. Finally, the results of the spa-tial and econometric analysis inform how better policies can be implemented to improve sustaina-ble land management and poverty alleviation.

C H A P T E R
02
8
Rural Populations on LFAL and LFAA
Two types of spatial distributions of rural popula-tions are considered, the concentration of rural populations on less favoured agricultural land (LFAL), and their concentration in less favoured agricultural areas (LFAA). As shown in Figure 1, these two land classifications are related (Pender and Hazell, 2000). LFAL is defined as susceptible to low produc-tivity and degradation, because its agricultural potential is constrained biophysically by terrain, poor soil quality or limited rainfall (box A and B in Figure 1). LFAA includes LFAL plus favourable agri-cultural land that is remote; i. e., it has high agricul-tural potential but is located in an area with limited access to infrastructure and markets (box D). Thus, in Figure 1, LFAA are the shaded grey boxes A, B,
and D. Of these areas, the most critical may be LFAL that is also remote due to poor access to infrastruc-ture and markets (box B).
Using a variety of global spatially referenced data-sets, we analyze the spatial distribution of global rural population in 2000 and 2010, following the classification of LFAL and LFAA in Figure 1 (See the technical notes in Appendix for further details). LFAL consists of irrigated land on terrain greater than eight per cent median slope; rainfed land with a length of growing period (LGP) of more than 120 days but either on terrain greater than eight per cent median slope or with poor soil quality; semi-arid land (land with LGP 60–119 days); and arid land
F I G U R E 1
Classification of LFAL and LFAASource: Based on the definition and classification of less favoured areas in Pender and Hazell (2000).
A.Less Favoured
Agricultural Land
B.Less Favoured
Agricultural Land
C.Favoured
Agricultural Land
Low
Biophysical Agricultural Potential
Acc
ess
to In
fras
truc
ture
and
Mar
kets
Low
High
High
D.Less Favoured
Agricultural Land
LFAL (A and B) has low agricultural potential as it is constrained biophysically by terrain, poor soil quality or limited rainfall. LFAA (shaded grey) also include favoured agricultural land that is remote due to poor access to infrastructure and markets (D).
See technical notes in Appendix for further details.

A N E L D A S S E S S M E N T
9
(land with LGP < 60 days). These various land areas were determined by employing in Arc GIS 10.1:
❚❚ National Boundaries: Gridded Population of the World, Version 3 (GPWv3) of the Center for International Earth Science Information Network (CIESIN) and Cen-tro Internacional de Agricultura Tropical (CIAT) (Available online: http://sedac.ciesin.columbia.edu/data/collection/gpw-v3)
❚❚ Biophysical agricultural potential:FAO Global Agro-Ecological Zones (GAEZ) Data Portal version 3 (Available online: http://gaez.fao.org)
❚❚ Agricultural land extent: Pilot Analysis of Global Ecosystems (PAGE) (Available online: http://www.ifpri.org/dataset/pilot-analysis-global-ecosystems-page)
❚❚ Rural populations:CIESIN Global Rural Urban Mapping Project (GRUMPv1) (Available online: http://sedac.ciesin.columbia.edu/data/collection/grump-v1)
❚❚ Market accessibility:Nelson (2008) as released by the Global Environ-ment Monitoring Unit of the Joint Research Centre of the European Commission. Market access is identified as less than five hours of travel to a market city with a population of 50,000 or more.
The results of this analysis for 2000 are depicted in Table 1. Just under 1.5 billion people in the world lived on LFAL, and nearly all (1.3 billion) were found in low and middle-income economies. Almost 36 per cent of the 2000 rural population in develop-ing countries was located on such marginal agri-cultural land, although this share ranged from
LFAL consists of irrigated land on terrain greater than eight per cent median slope; rainfed land with a length of grow-ing period (LGP) of more than 120 days but either on terrain greater than eight per cent median slope or with poor soil quality; semi-arid land (land with LGP 60-119 days); and arid land (land with LGP ‹ 60 days). LFAA include LFAL as well as favoured agricultural land with limited market access (i. e. located in remote areas). Market access is identified as less than five hours of travel to a market city with a population of 50,000 or more.
Developing countries are all low and middle-income economies with 2012 per capita income of USD 12,615 or less (World Bank, 2014).
Column (1) is estimated for 205 countries. Columns (2) and (3) are estimated for 184 countries; one country was inde-terminate due to changing political boundaries, and 20 countries had missing data or insufficient spatial resolution denoting agricultural land.
See technical notes in Appendix for further details.
Population in 2000 (millions)
Rural
population (1)
Rural population
on LFAL (2)
% share (2)/(1)
Rural population
in LFAA (3)
% share (3)/(1)
Developing country 3,706.8 1,314.5 35.5 1,382.7 37.3
East Asia & Pacific 1,398.4 645.0 46.1 672.9 48.1
Europe & C. Asia 173.8 96.4 55.5 97.1 55.9
Latin America & Caribbean 294.1 94.9 32.3 97.0 33.0
Middle East & N. Africa 195.6 44.9 23.0 45.2 23.1
South Asia 1,090.4 269.0 24.7 291.0 26.7
Sub-Saharan Africa 554.6 164.3 29.6 179.5 32.4
Developed country 404.7 171.8 42.4 173.8 42.9
World 4,111.5 1,486.3 36.1 1,556.4 37.9
T A B L E 1
Rural population on LFAL and LFAA, 2000

C H A P T E R 0 2 Land Degradation, Less Favored Lands and the Rural Poor: A Spatial and Economic Analysis
10
23 per cent in Middle East & North Africa to 56 per cent in Europe & Central Asia. In 2000, around 1.6 billion people worldwide lived in LFAA, with nearly 1.4 billion in low and middle-income econo-mies. Over 37 per cent of the rural population in developing countries was in LFAA, with the share again varying from 23 per cent in Middle East & North Africa to nearly 56 per cent in Europe & Cen-tral Asia. Given the similarity in population distri-butions in Table 1, it is clear that nearly all the rural populations in LFAA comprise people living on marginal agricultural land.
Figure 2 displays the global distribution of the rural population in developing countries in 2000 on LFAL. The figure shows the density of this distribu-tion in terms of population per km2. Figure 3 shows a similar global distribution for 2000 of the rural population in low and middle-income economies in LFAA.
F I G U R E 2
Distribution of rural population of developing countries on LFAL, 2000
LFAL consists of irrigated land on terrain greater than 8 per cent median slope; rainfed land with a length of growing period (LGP) of more than 120 days but either on terrain greater than 8 per cent median slope or with poor soil quality; semi-arid land (land with LGP 60–119 days); and arid land (land with LGP ‹ 60 days).
Developing countries are all low and middle-income econo-mies with 2012 per capita income of USD 12,615 or less (World Bank, 2014).
Less favorable agricultural land
Population per sq km
0
1–120
121–240
241–480
481–26,255

A N E L D A S S E S S M E N T
11
F I G U R E 3
Distribution of rural population of developing countries in LFAA, 2000
LFAA consist of all less favored agricultural lands plus favored agricultural lands with limited market access. Mar-ket access is identified as less than five hours of travel to a market city with a population of 50,000 or more.
Developing countries are all low and middle-income econo-mies with 2012 per capita income of USD 12,615 or less (World Bank, 2014).
Less favorable agricultural land
Population per sq km
0
1–120
121–240
241–480
481–26,255

C H A P T E R 0 2 Land Degradation, Less Favored Lands and the Rural Poor: A Spatial and Economic Analysis
12
Population in 2000 (millions)
Rural populationon remote
LFAL
% share of
rural population
% share of rural population on
LFAL
Developing country 288.2 7.8 21.9
East Asia & Pacific 164.7 11.8 25.5
Europe & C. Asia 12.0 6.9 12.4
Latin America & Caribbean 12.8 4.3 13.5
Middle East & N. Africa 6.8 3.5 15.1
South Asia 42.6 3.9 15.8
Sub-Saharan Africa 49.3 8.9 30.0
Developed country 10.2 2.5 6.0
World 298.4 7.3 20.1
T A B L E 2
Rural population on remote LFAL, 2000
LFAL consists of irrigated land on terrain greater than eight per cent median slope; rainfed land with a length of grow-ing period (LGP) of more than 120 days but either on terrain greater than eight per cent median slope or with poor soil quality; semi-arid land (land with LGP 60–119 days); and arid land (land with LGP ‹ 60 days). LFAA include LFAL as well as favoured agricultural land with limited market access (i. e. located in remote areas). Market access is identified as less than five hours of travel to a market city with a population of 50,000 or more.
Developing countries are all low and middle-income economies with 2012 per capita income of USD 12,615 or less (World Bank, 2014).
Estimated for 184 countries; one country was indeterminate due to changing political boundaries, and 20 countries had missing data or insufficient spatial resolution denoting agricultural land.
See technical notes in Appendix for further details.
Table 2 indicates the distribution of people on remote LFAL, which is the critical population denoted by box B in Figure 1. In 2000, nearly 300 million people globally were located on remote LFAL, or over 7 per cent of the rural population. Nearly all (288 million) were in low and middle-income economies, which accounted for almost 8 per cent of the rural population. This share varies from around 4 per cent in the Middle East & North Africa and South Asia to almost 12 per cent in East Asia & Pacific. One fifth of the global rural popula-tion on LFAL does not have market access, and for developing countries, this share rises to nearly 22 per cent. It ranges from just over 12 per cent in East Asia & Pacific to 30 per cent in Sub-Saharan Africa.

A N E L D A S S E S S M E N T
13
LFAL consists of irrigated land on terrain greater than eight per cent median slope; rainfed land with a length of grow-ing period (LGP) of more than 120 days but either on terrain greater than eight per cent median slope or with poor soil quality; semi-arid land (land with LGP 60–119 days); and arid land (land with LGP ‹ 60 days). LFAA include LFAL as well as favoured agricultural land with limited market access (i. e. located in remote areas). Market access is identified as less than five hours of travel to a market city with a population of 50,000 or more.
Developing countries are all low and middle-income economies with 2012 per capita income of USD 12,615 or less (World Bank, 2014).
Column (1) is estimated for 205 countries. Columns (2) and (3) are estimated for 183 countries; one country was inde-terminate due to changing political boundaries, and 21 countries had missing data or insufficient spatial resolution denoting agricultural land.
See technical notes in Appendix for further details.
Population in 2000 (millions)
Rural
population (1)
Rural population
on LFAL (2)
% share (2)/(1)
Rural population
in LFAA (3)
share (3)/(1)
Developing country 4,248.6 1,499.7 35.3 1,579.8 37.2
East Asia & Pacific 1,499.1 709.4 47.3 739.7 49.3
Europe & C. Asia 180.7 97.7 54.1 98.4 54.5
Latin America & Caribbean 336.1 109.2 32.5 111.7 33.2
Middle East & N. Africa 237.2 50.4 21.3 50.9 21.4
South Asia 1,284.0 309.7 24.1 335.3 26.1
Sub-Saharan Africa 711.4 223.2 31.4 243.8 34.3
Developed country 415.3 166.9 40.2 168.7 40.6
World 4,663.9 1,666.6 35.7 1,748.6 37.5
T A B L E 3
Rural population on LFAL and LFAA, 2010
The results of the distribution of people in 2010 on marginal agricultural lands and remote areas are indicated in Table 3. By 2010, there were nearly 1.7 billion people on LFAL and just over 1.7 billion in LFAA, which comprised 36 per cent and 38 per cent of the rural population respectively. Again, nearly all these populations were in developing countries; 1.5 billion on LFAL and nearly 1.6 billion in LFAA, or 35 and 37 per cent of the rural population respec-tively. The rural population share for the six major developing country regions were largely the same as in 2000 (see Table 1).

C H A P T E R 0 2 Land Degradation, Less Favored Lands and the Rural Poor: A Spatial and Economic Analysis
14
F I G U R E 4
Distribution of rural population of developing countries on LFAL, 2010
LFAL consists of irrigated land on terrain greater than 8 per cent median slope; rainfed land with a length of growing period (LGP) of more than 120 days but either on terrain greater than 8 per cent median slope or with poor soil quality; semi-arid land (land with LGP 60–119 days); and arid land (land with LGP ‹ 60 days).
Developing countries are all low and middle-income econo-mies with2012 per capita income of USD 12,615 or less (World Bank, 2014).
Less favorable agricultural land
Population per sq km
0
1–120
121–240
241–480
481–30,619
Figures 4 and 5 display the global distribution per km2 of the rural population in developing coun-tries in 2010 on LFAL and LFAA. Again, the distribu-tions are relatively similar.

A N E L D A S S E S S M E N T
15
F I G U R E 5
Distribution of rural population of developing countries in LFAA, 2010
LFAA consist of all less favored agricultural lands plus favored agricultural lands with limited market access. Mar-ket access is identified as less than five hours of travel to a market city with a population of 50,000 or more.
Developing countries are all low and middle-income econo-mies with 2012 per capita income of USD 12,615 or less (World Bank, 2014).
Less favorable agricultural land
Population per sq km
0
1–120
121–240
241–480
481–30,619

C H A P T E R 0 2 Land Degradation, Less Favored Lands and the Rural Poor: A Spatial and Economic Analysis
16
Population in 2000 (millions)
Rural populationon remote
LFAL
% share of
rural population
% share of rural population on
LFAL
Developing country 322.5 7.6 21.5
East Asia & Pacific 173.1 11.5 24.4
Europe & C. Asia 12.4 6.8 12.6
Latin America & Caribbean 14.8 4.4 13.5
Middle East & N. Africa 7.2 3.0 14.2
South Asia 49.7 3.9 16.0
Sub-Saharan Africa 65.5 9.2 29.4
Developed country 9.9 2.4 5.9
World 332.4 7.1 19.9
T A B L E 4
Rural population on remote LFAL, 2010
LFAL consists of irrigated land on terrain greater than eight per cent median slope; rainfed land with a length of grow-ing period (LGP) of more than 120 days but either on terrain greater than eight per cent median slope or with poor soil quality; semi-arid land (land with LGP 60–119 days); and arid land (land with LGP ‹ 60 days). LFAA include LFAL as well as favoured agricultural land with limited market access (i. e. located in remote areas). Market access is identified as less than five hours of travel to a market city with a population of 50,000 or more.
Developing countries are all low and middle-income economies with 2012 per capita income of USD 12,615 or less (World Bank, 2014).
Estimated for 183 countries; one country was indeterminate due to changing political boundaries, and 21 countries had missing data or insufficient spatial resolution denoting agricultural land.
See technical notes in Appendix for further details
By 2010, the number of people worldwide on remote LFAL had increased to over 330 million, of which at least 320 million were in developing countries (see Table 4). Around 7 per cent of the rural population globally and almost 8 per cent in developing coun-tries were on remote LFAL. This proportion changes from 3 per cent in Middle East & North Africa to nearly 12 per cent in East Asia & Pacific. About one fifth of the global rural population on LFAL does not have market access, and almost 22 per cent in developing countries. Europe & Central Asia has the smallest share (13 per cent) and Sub-Saharan Africa the largest (29 per cent).

A N E L D A S S E S S M E N T
17
LFAL consists of irrigated land on terrain greater than eight per cent median slope; rainfed land with a length of grow-ing period (LGP) of more than 120 days but either on terrain greater than eight per cent median slope or with poor soil quality; semi-arid land (land with LGP 60–119 days); and arid land (land with LGP ‹ 60 days). LFAA include LFAL as well as favoured agricultural land with limited market access (i. e. located in remote areas). Market access is identified as less than five hours of travel to a market city with a population of 50,000 or more.
Developing countries are all low and middle-income economies with 2012 per capita income of USD 12,615 or less (World Bank, 2014).
Column (1) is estimated for 205 countries. Columns (2), (3) and (4) are estimated for 183 countries; one country was indeterminate due to changing political boundaries, and 21 countries had missing data or insufficient spatial resolution denoting agricultural land.
See technical notes in Appendix for further details.
Percentage (%) change from 2000–2010
Rural population (1)
Rural population
on LFAL (2)
Rural population
in LFAA (3)
Rural population on remote
LFAA (4)
Developing country 14.6 14.1 14.3 11.4
East Asia & Pacific 7.2 10.0 9.9 5.1
Europe & C. Asia 4.0 1.4 1.4 3.3
Latin America & Caribbean 14.3 15.1 15.2 15.4
Middle East & N. Africa 21.3 12.3 12.4 5.6
South Asia 17.8 15.1 15.2 16.6
Sub-Saharan Africa 28.3 35.9 35.8 32.9
Developed country 2.6 –2.9 –2.9 –3.1
World 13.4 12.1 12.3 11.9
T A B L E 5
Rural population on LFAL and LFAA, 2000-2010 changes
Table 5 indicates the changes in the distribution of rural populations on LFAL and LFAA from 2000–2010. Over this period, rural population rose nearly 13 per cent globally, around 3 per cent in high-income economies, and almost 15 per cent in devel-oping countries. However, in high-income coun-tries, the rural populations on LFAL, in LFAA, and on remote LFAL fell by 3 per cent. In contrast, in low and middle-income economies, the rural popula-tions on LFAL and in LFAA grew at 14 per cent, keep-ing pace with the overall growth in rural popula-tions. The rural population on remote LFAL grew at a slightly slower pace, just over 11 per cent. How-ever, from 2000–2010, this critical population group expanded over 15 per cent in Latin America & Caribbean, nearly 17 per cent in South Asia and 33 per cent in Sub-Saharan Africa.
In conclusion, our spatial analysis confirms that the concentration of rural populations on LFAL and LFAA is predominantly a developing country prob-lem. The number of people in these locations has increased significantly from 2000–2010, both glob-ally and in each major developing country region. Of particular concern is the continuing expansion in the number of rural people in developing coun-tries on LFAL without market access, from nearly 300 million in 2000 to over 330 million in 2010. This critical population group appears to be increasing by over 1 per cent annually across the developing world, and at annual rates approaching 2 per cent in Latin America & Caribbean and South Asia and over 3 per cent in Sub-Saharan Africa (see Table 5).

C H A P T E R
03
18
Rural Populations on Degrading and Improving Agricultural Land
Our approach to the spatial analysis of rural popu-lations on degrading and improving agricultural land over 1981–2000 follows closely that of Bai et al. (2008 and 2010), who depict global change using the normalized difference vegetation index (NDVI), scaled in terms of NPP change. Thus, in this analy-sis, degrading agricultural land consists of agricul-tural land with a negative change in NPP from 1981–2000, where NPP is measured as the change in grams of carbon sequestered per square meter over the 1981–2000 time period after subtracting respi-ration losses. Consequently, improving agricultural land is agricultural land with a non-negative change in NPP from 1981–2000. Market accessibil-ity was also used to identify remote degrading and remote improving agricultural land, where market access is less than five hours of travel to a market city with a population of 50,000 or more.
Using a variety of global spatially referenced data-sets, we analyze the spatial distribution of rural population across developing countries in 2000 and 2010 on degrading versus improving agricul-tural land over 1981–2000 (See the technical notes in Appendix for further details). Degrading or improving land was determined using University of Maryland’s Global Land Cover Facility’s AVHRR Global Production Efficiency Model (GloPEM), which is available from 1981–2000 with annual summations of net primary production (NPP) change measured in grams of carbon sequestered per square meter per year (gC//yr). Agricultural land extent was obtained from the Pilot Analysis of Global Ecosystems (PAGE) (http://www.ifpri.org/dataset/pilot-analysis-global-ecosystems-page), and rural populations determined from the rural-urban extent dataset that was published as part of CIESIN Global Rural Urban Mapping Project (GRUMPv1). Market accessibility was used to iden-tify remote areas using Nelson (2008) as released by the Global Environment Monitoring Unit of the Joint Research Centre of the European Commis-sion.

A N E L D A S S E S S M E N T
19
Table 6 summarises the estimates of the rural pop-ulation on all degrading agricultural land in 2000. Globally, over 1.3 billion people lived in these areas in 2000, nearly all in developing countries. Around 32 per cent of the rural population of low and mid-dle-income economies was on degrading agricul-tural lands, and 34 per cent of the global popula-tion. This share ranges from 13 per cent in Latin America & Caribbean to 51 per cent in East Asia & Pacific. Almost all the world’s 200 million people on remote degrading agricultural land were in developing countries. This accounts for 5 per cent of the rural population globally and about 6 per cent in low and middle-income economies. The proportion is less than 2 per cent in Latin America & Caribbean and 9 per cent in East Asia & Pacific.
Degrading agricultural land (DAL) consists of agricultural land with a negative change in Net Primary Productivity (NPP) from 1981–2000. NPP is measured as the change in grams of carbon sequestered per square meter over the 1981-2000 time period after subtracting respiration losses. Market accessibility is used to identify remote DAL, where market access is defined as less than five hours of travel to a market city with a population of 50,000 or more.
Developing countries are all low and middle-income economies with 2012 per capita income of USD 12,615 or less (World Bank, 2014).
Column (1) is estimated for 205 countries. Columns (2) and (3) are estimated for 183 countries; one country was inde-terminate due to changing political boundaries, and 21 countries had missing data or insufficient spatial resolution denoting agricultural land.
See technical notes in Appendix for further details.
Population in 2000 (millions)
Rural population
(1)
Rural
population on all DAL
(2)
% share (2)/(1)
Rural population
on all remote DAL (3)
% share (3)/(1)
Developing country 3,706.8 1,258.7 32.4 202.2 5.5
East Asia & Pacific 1,398.4 710.3 50.8 125.2 9.0
Europe & C. Asia 173.8 67.0 38.5 6.2 3.6
Latin America & Caribbean 294.1 38.3 13.0 5.6 1.9
Middle East & N. Africa 195.6 43.7 22.3 5.4 2.8
South Asia 1,090.4 285.2 26.2 27.4 2.5
Sub-Saharan Africa 554.6 114.1 20.6 32.4 5.8
Developed country 404.7 72.6 17.9 3.2 0.8
World 4,111.5 1,331.3 34.0 205.4 5.0
T A B L E 6
Rural population on all degrading agricultural lands, 2000

C H A P T E R 0 3 Land Degradation, Less Favored Lands and the Rural Poor: A Spatial and Economic Analysis
20
F I G U R E 6
Distribution of rural population of developing countries on all degrading agricultural land, 2000
Degrading agricultural land consists of agricultural land with a negative change in Net Primary Productivity (NPP) from 1981–2000.
Developing countries are all low and middle-income econo-mies with 2012 per capita income of USD 12,615 or less (World Bank, 2014) .
Degrading agricultural land
Population per sq km
0
1–120
121–240
241–480
481–19,085
Figure 6 shows the global distribution per km2 of the rural population in developing countries in 2000 on all degrading agricultural land.

A N E L D A S S E S S M E N T
21
Improving agricultural land (IAL) consists of agricultural land with a non-negative change in Net Primary Productivity (NPP) from 1981–2000. NPP is measured as the change in grams of carbon sequestered per square meter over the 1981–2000 time period after subtracting respiration losses. Market accessibility is used to identify remote IAL, where market access is defined as less than five hours of travel to a market city with a population of 50,000 or more.
Developing countries are all low and middle-income economies with 2012 per capita income of USD 12,615 or less (World Bank, 2014).
Column (1) is estimated for 205 countries. Columns (2) and (3) are estimated for 183 countries; one country was inde-terminate due to changing political boundaries, and 21 countries had missing data or insufficient spatial resolution denoting agricultural land.
See technical notes in Appendix for further details.
Population in 2000 (millions)
Rural population
(1)
Rural
population on all IAL
(2)
% share (2)/(1)
Rural population
on all remote IAL (3)
% share (3)/(1)
Developing country 3,706.8 1,340.7 36.2 155.3 4.2
East Asia & Pacific 1,398.4 398.7 28.5 67.9 4.9
Europe & C. Asia 173.8 66.7 38.4 6.6 3.8
Latin America & Caribbean 294.1 90.6 30.8 9.3 3.2
Middle East & N. Africa 195.6 28.1 14.4 1.7 0.9
South Asia 1,090.4 641.8 58.9 37.3 3.4
Sub-Saharan Africa 554.6 114.8 20.7 32.5 5.9
Developed country 404.7 196.4 48.5 9.0 2.2
World 4,111.5 1,537.1 37.4 164.3 4.0
T A B L E 7
Rural population on all improving agricultural lands, 2000
Table 7 indicates the distribution of the rural popu-lation on all improving agricultural land in 2000. Around 1.5 billion are on such lands globally, with 1.3 billion in developing countries. People on improving agricultural lands constitute 37 per cent of the rural population worldwide and 36 per cent in low and middle-income economies. Just over 160 million people globally are on improving agricultural lands without market access, almost all in developing countries. They account for about 4 per cent of rural populations globally and in low and middle-income economies.

C H A P T E R 0 3 Land Degradation, Less Favored Lands and the Rural Poor: A Spatial and Economic Analysis
22
F I G U R E 7
Distribution of rural population of developing countries on all improving agricultural land, 2000
Improving agricultural land consists of agricultural land with a non-negative change in Net Primary Productivity (NPP) from 1981–2000.
Developing countries are all low and middle-income econo-mies with 2012 per capita income of USD 12,615 or less (World Bank, 2014).
Improving agricultural land
Population per sq km
0
1–120
121–240
241–480
481–17,768
Figure 7 shows the global distribution per km2 of the rural population in developing countries in 2000 on all improving agricultural land.

A N E L D A S S E S S M E N T
23
Degrading agricultural land (DAL) consists of agricultural land with a negative change in Net Primary Productivity (NPP) from 1981–2000. NPP is measured as the change in grams of carbon sequestered per square meter over the 1981–2000 time period after subtracting respiration losses. Market accessibility is used to identify remote DAL, where market access is defined as less than five hours of travel to a market city with a population of 50,000 or more.
Developing countries are all low and middle-income economies with 2012 per capita income of USD 12,615 or less (World Bank, 2014).
Column (1) is estimated for 205 countries. Columns (2) and (3) are estimated for 183 countries; one country was inde-terminate due to changing political boundaries, and 21 countries had missing data or insufficient spatial resolution denoting agricultural land.
See technical notes in Appendix for further details.
Population in 2000 (millions)
Rural population
(1)
Rural
population on all DAL
(2)
% share (2)/(1)
Rural population
on all remote DAL (3)
% share (3)/(1)
Developing country 4,248.6 1,426.3 33.6 230.2 5.4
East Asia & Pacific 1,499.1 770.1 51.4 133.6 8.9
Europe & C. Asia 180.7 67.7 37.4 6.5 3.6
Latin America & Caribbean 336.1 45.3 13.5 6.6 2.0
Middle East & N. Africa 237.2 49.9 21.1 5.8 2.4
South Asia 1,284.0 336.1 26.2 32.6 2.5
Sub-Saharan Africa 711.4 157.2 22.1 45.1 5.4
Developed country 415.3 70.6 17.0 3.1 0.7
World 4,663.9 1,496.9 32.1 233.2 5.0
T A B L E 8
Rural population on all degrading agricultural lands, 2000
The results of the 2010 distribution of rural popula-tion on all degrading agricultural land are dis-played in Table 8. By 2010, there were 1.5 billion on such lands globally and 1.4 billion in developing countries. They comprised 32 per cent of the rural population worldwide and nearly 34 per cent in low and middle-income economies. This share varies from nearly 14 per cent in Latin America & Carib-bean to 51 per cent in East Asia & Pacific. The num-ber of people globally on remote degrading agri-cultural land in 2010 was over 230 million, and located almost entirely in developing countries. They accounted for around 5 per cent of the rural population worldwide and in low and middle-income economies. This proportion was 2 per cent in Latin America & Caribbean compared to 9 per cent in East Asia & Pacific. Figure 8 shows the global distribution per km2 of the rural population in
developing countries in 2010 on all degrading agri-cultural land.

C H A P T E R 0 3 Land Degradation, Less Favored Lands and the Rural Poor: A Spatial and Economic Analysis
24
F I G U R E 8
Distribution of rural population of developing countries on all degrading agricultural land, 2010
Degrading agricultural land consists of agricultural land with a negative change in Net Primary Productivity (NPP) from 1981–2000.
Developing countries are all low and middle-income econo-mies with 2012 per capita income of USD 12,615 or less (World Bank, 2014).
Degrading agricultural land
Population per sq km
0
1–120
121–240
241–480
481–28,431

A N E L D A S S E S S M E N T
25
Improving agricultural land (IAL) consists of agricultural land with a non-negative change in Net Primary Productivity (NPP) from 1981–2000. NPP is measured as the change in grams of carbon sequestered per square meter over the 1981–2000 time period after subtracting respiration losses. Market accessibility is used to identify remote IAL, where market access is defined as less than five hours of travel to a market city with a population of 50,000 or more.
Developing countries are all low and middle-income economies with 2012 per capita income of USD 12,615 or less (World Bank, 2014).
Column (1) is estimated for 205 countries. Columns (2) and (3) are estimated for 183 countries; one country was inde-terminate due to changing political boundaries, and 21 countries had missing data or insufficient spatial resolution denoting agricultural land.
See technical notes in Appendix for further details.
Population in 2000 (millions)
Rural population
(1)
Rural
population on all IAL
(2)
% share (2)/(1)
Rural population
on all remote IAL (3)
% share (3)/(1)
Developing country 4,248.6 1,539.4 36.2 169.2 4.0
East Asia & Pacific 1,499.1 446.3 2.8 68.2 4.5
Europe & C. Asia 180.7 66.3 36.7 7.0 3.9
Latin America & Caribbean 336.1 103.3 30.7 10.5 3.1
Middle East & N. Africa 237.2 34.6 14.6 2.5 1.1
South Asia 1,284.0 734.5 57.2 43.8 3.4
Sub-Saharan Africa 711.4 154.3 21.7 37.2 5.2
Developed country 415.3 190.5 45.9 9.0 2.2
World 4,663.9 1,729.9 37.1 178.2 3.8
T A B L E 9
Rural population on all improving agricultural lands, 2010

C H A P T E R 0 3 Land Degradation, Less Favored Lands and the Rural Poor: A Spatial and Economic Analysis
26
F I G U R E 9
Distribution of rural population of developing countries on all improving agricultural land, 2010
Improving agricultural land consists of agricultural land with a non-negative change in Net Primary Productivity (NPP) from 1981–2000.
Developing countries are all low and middle-income econo-mies with 2012 per capita income of USD 12,615 or less (World Bank, 2014).
Improving agricultural land
Population per sq km
0
1–120
121–240
241–480
481–26,726
By 2010, there were also 1.7 billion people world-wide on improving agricultural land, of which approximately 1.5 billion were in developing coun-tries (see Table 9). The number of people on improv-ing agricultural land without market access increased to nearly 180 million in 2010, with 170 million in developing countries. The global and regional shares of the rural population on all and remote improving agricultural land did not change significantly from 2000. Figure 9 depicts the global distribution per km2 of the rural population in developing countries in 2010 on all improving agri-cultural land.
Table 10 indicates the changes in the distribution of rural populations on degrading and improving agricultural land from 2000–2010. Recall that, over this period, rural population rose nearly 13 per cent globally, 3 per cent in high-income economies and almost 15 per cent in developing countries. How-ever, in high-income countries, the rural popula-tions on all degrading and improving agricultural land fell by 3 per cent, and declined by 2 per cent on remote degrading agricultural land. On remote improving lands, the population was almost unchanged. In contrast, in low and middle-income economies, the rural populations in all degrading, remote degrading and improving agricultural lands grew 13, 14, and 15 per cent respectively, keep-ing pace with the overall growth in rural popula-tions. However, in Sub-Saharan Africa people on all remote and degrading agricultural lands grew 38 and 39 per cent respectively, in Latin America &

A N E L D A S S E S S M E N T
27
Degrading agricultural land (DAL) consists of agricultural land with a negative change in Net Primary Productivity (NPP) from 1981–2000. NPP is measured as the change in grams of carbon sequestered per square meter over the 1981–2000 time period after subtracting respiration losses.
Improving agricultural land (IAL) consists of agricultural land with a non-negative change in Net Primary Productivity (NPP) from 1981–2000. NPP is measured as the change in grams of carbon sequestered per square meter over the 1981–2000 time period after subtracting respiration losses.
Market accessibility is used to identify remote DAL and IAL, where market access is defined as less than five hours of travel to a market city with a population of 50,000 or more.
Developing countries are all low and middle-income economies with 2012 per capita income of USD 12,615 or less (World Bank, 2014).
Column (1) is estimated for 205 countries. Columns (2) and (3) are estimated for 183 countries; one country was inde-terminate due to changing political boundaries, and 21 countries had missing data or insufficient spatial resolution denoting agricultural land. Columns (4) and (5) are estimated for 182 countries; one country was indeterminate due to changing political boundaries, and 22 countries had missing data or insufficient spatial resolution denoting agricultural land.
See technical notes in Appendix for further details.
Percentage (%) change from 2000–2010
Rural population
(1)
Rural
population on all DAL
(2)
Rural population on remote
DAL (3)
Rural
population on all IAL
(4)
Rural population on remote
IAL (5)
Developing country 14.6 13.3 13.8 14.8 8.9
East Asia & Pacific 7.2 8.4 6.8 11.9 0.4
Europe & C. Asia 4.0 1.0 4.4 –0.6 6.4
Latin America & Caribbean 14.3 18.4 17.1 14.1 12.6
Middle East & N. Africa 21.3 14.3 5.9 23.0 49.1
South Asia 17.8 17.8 18.9 14.4 17.3
Sub-Saharan Africa 28.3 37.8 39.3 34.5 14.6
Developed country 2.6 -2.8 -1.8 -3.0 0.1
World 13.4 12.4 13.6 12.5 8.5
T A B L E 1 0
Rural population on degrading and improving agricultural lands, 2000–2010 changes
Caribbean 18 and 17 per cent, and in South Asia 18 and 19 per cent. In developing countries, from 2000–2010, the rural population on remote improv-ing agricultural lands grew at a slower pace, around 9 per cent. The fastest growth (49 per cent) occurred in the Middle East & North Africa. In East Asia & Pacific the population was largely unchanged.
In conclusion, our spatial analysis confirms that the concentration of rural populations on degrad-ing agricultural lands is overwhelmingly a devel-oping country problem. The number of people in these locations has increased significantly from 2000–2010, both globally and in each major devel-
oping country region. However, an encouraging trend is the growth in the population of developing countries on all improving agricultural land, even in some remote areas. But there should also be con-cern over the growth in the rural population of developing countries on degraded agricultural land without market access, which increased from just over 200 million in 2000 to 230 million in 2010. This critical population group appears to be expanding by over 1 per cent annually across the developing world, and at annual rates approaching 2 per cent in Latin America & Caribbean and South Asia, and 4 per cent in Sub-Saharan Africa (see Table 10).

C H A P T E R
04
28
Poverty and the Spatial Distribution of Rural Populations
Our poverty analysis examines whether the 2000 spatial distribution of rural populations in devel-oping countries on degraded and improving agri-cultural land, LFAL and LFAA have a direct influ-ence on changes in poverty over 2000–2012 or an indirect influence through attenuating the pov-erty-reducing impact of income growth. These hypotheses are tested through examining how the spatial distribution of rural populations in 2000 influences poverty changes from 2000–2012 in 83 developing countries.
As indicated in Tables 1–5, we have estimated four spatial distribution variables for the rural popula-tion in 2000 on LFAL and LFAA for low and middle-income economies. These variables are: ❚❚ the share (%) of the rural population on LFAL
(henceforth s1);❚❚ the share (%) of the rural population on LFAA
(s2); ❚❚ the share (%) of the rural population on remote
LFAL (s3); and❚❚ the share (%) of the rural population on LFAL on
remote LFAL (s4).
In addition, from Tables 6–10, there are four spatial distribution variables for the rural population in 2000 on degrading and improving agricultural land and remote areas for developing countries:❚❚ the share (%) of rural population located on all
degrading agricultural land (d1);❚❚ the share (%) of rural population located on all
remote degrading agricultural land (d2); ❚❚ the share (%) of rural population located on all
improving agricultural land (i1); and❚❚ the share (%) of rural population located on all
remote improving agricultural (i2).
We obtain our cross-country measures of a given poverty line z, the poverty headcount index H, and mean income from PovcalNet, the on-line tool for poverty measurement developed by the Development Research Group of the World Bank (Available online at http://iresearch.worldbank.org/PovcalNet). PovcalNet produces internation-
ally comparable country level poverty and income distribution estimates based on more than 850 standardised household surveys across 127 devel-oping countries. From this database, we identify 83 low and middle-income economies with at least two suitable household surveys from 2000–2012. The longest available spell between surveys is used for each country, and both surveys use the same welfare indicator, either consumption or income per person. The median interval between surveys is eight years, and it varies from two to eleven years.1 All monetary measures are in constant 2005 prices and are at Purchasing Power Parity (PPP).
The poverty headcount index H is the percentage of the population living in households with consump-tion per capita (or income when consumption is not available) below the poverty line. We follow Raval-lion (2012) and choose a poverty line z of USD 2.00 per person per day at 2005 PPP, which is the median poverty line among developing countries. In the initial survey year, the median poverty headcount index across all 83 countries was 42.85 per cent, but ranged widely from 0.29 to 95.44 per cent. By the final survey year, the median poverty headcount was 27.86 per cent, and it varied from 0.08 to 93.49 per cent.
Mean income is the average monthly (2005 PPP USD) per capita income or consumption expendi-ture from the household surveys for each country in the relevant year. In the initial survey year, the median per capita monthly income was USD 100 across all 83 countries, and ranged from USD 24 to 2,003. In the final survey year, median income was USD 115, and varied from USD 28 to 2,012. Finally, inequality is measured by the usual Gini Index, which was also obtained from the PovcalNet cross-country household surveys for the relevant years.
We also employ a number of control variables in our analysis, following the approach of similar pov-erty analyses.2 The controls are inflation, govern-ment consumption as a share of GDP, arable land per capita, agricultural value added as a share of
1 As far as possible,
the initial survey year
chosen was 2000,
or for the soonest
subsequent year.
However, for Burundi,
Gambia, Ghana, Iran,
Maldives and Yemen,
the initial survey year
was 1998, and for
Kenya 1997.
2 See, for example,
Adams and Page, 2005;
Dollar and Kraay, 2002;
Kraay, 2006; and
Ravallion, 2012.

A N E L D A S S E S S M E N T
29
GDP and per worker, investment as a share of GDP, trade openness, primary school enrolment, and life expectancy. These variables were obtained from the World Development Indicators (World Bank, 2014), and as far as possible, for 2000 and the used sample of 83 countries. Other controls include a dummy for landlocked country as defined by UNDP (http://unctad.org/en/pages/aldc/Landlocked per cent20Developing per cent20Countries/List-of-land-locked-developing-countries.aspx), for small island developing states as defined by UNESCO (http://www.unesco.org/new/en/natural-sciences/priorit y-areas/sids/about-unesco-and-sids/sids-list), and distance from equator for each country. We employ rule of law and democracy (voice and accountability) indices, from the Worldwide Gov-ernance Indicators (http://data.worldbank.org/data-catalog/worldwide-governance-indicators), which were averaged over 1996–2000 for each country. Finally, regional dummies for the six main developing country regions were used.
To analyze the possible direct and indirect influ-ences of the spatial distribution variables sk, dk and ik in 2000 on poverty changes from 2000–2012 in the used 83 sample countries, we follow a similar estimation strategy to Ravallion (2012). Thus, the basic regression is
gi (Hit ) = a0 + a1 ln (vit-t ) + (b0 + b1vit-t )gi (it ) + wit, (1)
where i is each country observation, t is the final survey date, is the length of spell between sur-veys, and wit is the error term. The annualised growth rate in the poverty headcount between sur-veys is i (Hit ) ln (Hit /Hit-t ) / , and gi (it ) is similarly defined as the annualized growth rate in mean income. The initial level of the variable of interest is vit-t, which in Ravallion (2012) is the initial poverty level Hit- , whereas in much of this analysis, it is one of the eight spatial distribution variables in 2000, i. e. skit-t for marginal agricultural lands and remote areas, dkit-t for degrading agricultural land and ikit-t for improving agricultural land.
Two tests of restrictions on the various parameters estimated by (1) determine the direct and indirect influence of vit-t on the annualized change in pov-erty. For example, rejection of the null hypothesis 1 = 0 indicates that initial poverty or spatial distri-bution levels have a direct influence on changes in poverty over time, and subsequently, the magni-tude of 1 determines whether this influence is pos-
itive or negative. Failure to reject the null hypothe-sis of homogeneity, i. e. b0 + b1 = 0 in the case of Hit-, skit-t or dkit-t and b0 – b1 in the case of ikit-t, confirms that initial poverty or spatial distribution levels have an indirect influence through “adjusting” the growth elasticity of poverty reduction. That is, these restrictions imply that the correct regressor in (1) is (1 – vit-t) gi (it) in the case of Hit-, skit-t or dkit-t and (1 – vit-t) gi (it) in the case of ikit-t. Because even growth adjusted for initial poverty or spatial distri-bution is expected to reduce poverty, the expected signs of the coefficients of these two regressors are negative.
We test these hypotheses by estimating various versions of (1), with vit-t represented by each of the eight spatial distribution variables in 2000, i. e. skit-t for marginal agricultural lands and remote areas, dkit-t for degrading agricultural land and ikit-t for improving agricultural land. We estimate the regressions both with and without additional con-trol variables. In none of the specifications was it possible to reject the null hypothesis 1 = 0 that ini-tial spatial distribution levels in 2000 have a direct influence on changes from 2000–2012 in the used sample of 83 developing countries. These results suggest that the 2000 spatial distribution of rural populations in developing countries on degrading and improving agricultural land, LFAL and LFAA does not have a direct influence on changes in pov-erty over 2000–2012.
However, in all estimations of (1) the null hypothe-sis of homogeneity could not be rejected either. Imposing the resulting restrictions on (1) suggest that the correct regressor is (1 – vit-t) gi (it) in the case of skit-t or dkit-t and (1 + vit-t) gi (it) in the case of ikit-t . In all versions of these estimations, both with and without controls, the relevant coefficient was significant and negative. These results confirm that initial spatial distribution levels have an indi-rect influence through “adjusting” the growth elasticity of poverty reduction.
Table 11 summarizes the results of this analysis for the four spatial distribution variables for the rural population on LFAL and in LFAA. For comparison, the table also shows the impacts on changes in pov-erty from an increase in income growth only, an increase in poverty adjusted growth and an increase in initial poverty levels. For example, in the absence of any change in the spatial distribu-tion of rural populations or in initial poverty levels,

C H A P T E R 0 4 Land Degradation, Less Favored Lands and the Rural Poor: A Spatial and Economic Analysis
30
a one-standard-deviation increase of 3.52 per cent in average income growth in the used sample of developing countries, from 3.36 to 6.88 per cent, would reduce the poverty rate by 4.97 per cent annually.
For our sample of countries, a one-standard-devia-tion change in the share of rural population on LFAL (s1) is equivalent to increasing this spatial dis-tribution by 21 per cent (e.g., at the mean, this share of rural population would rise from 38 to 59 per cent). This has the effect of increasing the poverty rate by 0.92 to 0.99 per cent each year. A one-stand-ard-deviation change (also 21 per cent) in the share of rural population located in LFAA (s2) increases poverty from 0.97 to 1.11 per cent per year. A one-standard-deviation change in the share of rural population located on remote LFAL (s3), which is 8.4 per cent, would increase poverty by 0.35 to 0.47 per cent annually. Finally, a one-standard-deviation change in the share of rural population
on LFAL located on remote land (s4) by 19 per cent increases poverty by 0.95 to 1.32 per cent each year.
Table 12 indicates the results of the poverty analysis for the two dk spatial distribution variables for rural populations on degrading agricultural land and for the two ik distribution variables for populations on improving agricultural land. For the used sam-ple of countries, a one-standard-deviation change in the share of rural population on degrading agri-cultural land (d1) is equivalent to increasing this spatial distribution by 21 per cent (e.g., at the mean, this share of rural population would rise from 27 to 48 per cent). This has the effect of increasing the poverty rate by 0.98 to 1.04 per cent annually. A one-standard-deviation change (4 per cent) in the share of rural population located on remote degrading agricultural land (d2) increases poverty from 0.18 to 0.25 per cent per year. However, a one-standard-deviation change in the share of rural population located on all improving agricultural
The last column reports the annual rate of change (%) in the poverty rate via a one standard-deviation change in each of the relevant it- variables listed in the far-left column. The penultimate column shows the one-standard-deviation change for each variable from the sample of 83 countries. For the spatial distribution variables, the lower estimate is for estimations without additional control variables whereas the higher estimate includes controls.
Descriptive Statistics % change in poverty of one standard
deviation change
Mean
Median
StandardDeviation
Annualized growth (%) in the poverty rate (USD 2/day), (Hit)
–7.70 –4.26 10.28 ––
Annualized growth (%) in the mean survey income, ( it)
3.36 3.32 3.52 –4.97
Annualized poverty-adjusted growth (%) in the mean survey income, ( it)(1–Hit–)
1.74 1.11 2.41 –6.82
Initial headcount poverty rate (% of population), Hit–
46.41 42.85 29.56 2.81
% of rural population on LFAL (2000), s1it– 38.15 38.37 20.95 0.92 to 0.99
% of rural population in LFAA (2000), s2it– 40.04 41.37 20.79 0.97 to 1.11
% of rural population located on remote LFAL (2000), s3it–
8.50 7.06 8.40 0.35 to 0.47
% of rural population on LFAL located on remote LFAL (2000), s4it–
24.74 23.55 18.81 0.95 to 1.32
T A B L E 1 1
Effects of key LFAL and less favoured agricultural area variables on annualized change in poverty (%)

A N E L D A S S E S S M E N T
31
land (i1), which is 21 per cent, would reduce poverty by 0.57 to 0.76 per cent each year. Finally, a one-standard-deviation change in the share of rural population on remote improving agricultural land (i2) by 19 per cent reduces poverty by 0.55 to 0.74 per cent annually.
To summarize the results of our poverty analysis, we find no evidence of a direct impact on poverty changes from the spatial distribution of rural pop-ulations on LFAL, LFAA, or degrading and improv-ing agricultural land, but there is a significant indi-rect impact of these distributions on the poverty-reducing effects of income growth. Across a wide range of developing countries, as more rural peo-ple are located on LFAL and degrading agricultural land, as well as in LFAA, the result is an increase in the overall poverty rate. However, if the share of the rural population on improving agricultural land rises, then poverty is reduced. The most critical population groups appear to be rural populations
on LFAL and degrading agricultural land without market access. If there is a substantial reduction in the share of the rural population on remote LFAL and degrading agricultural land, then poverty rates could fall across a wide range of developing countries.
The last column reports the impact on the annual rate of change (%) in the poverty rate via a one standard-deviation change in each of the relevant it- variables listed in the far-left column. The penultimate column shows the one-standard-deviation change for each variable from the sample of 83 countries. For the spatial distribution variables, the lower estimate is for estimations without additional control variables whereas the higher estimate includes con-trols.
Descriptive Statistics % change in poverty of one standard
deviation change
Mean
Median
StandardDeviation
Annualized growth (%) in the poverty rate (USD 2/day), (Hit)
–7.70 –4.26 10.28 ––
Annualized growth (%) in the mean survey income, ( it)
3.36 3.32 3.52 –4.97
Annualized poverty-adjusted growth (%) in the mean survey income, ( it)(1–Hit–)
1.74 1.11 2.41 –6.82
Initial headcount poverty rate (% of population), Hit–
46.41 42.85 29.56 2.81
% of rural population on LFAL (2000), d1it– 27.11 22.44 21.04 0.98 to 1.04
% of rural population in LFAA (2000), d2it– 5.02 3.81 4.43 0.18 to 0.25
% of rural population located on remote LFAL (2000), i1it–
31.89 29.6 21.05 –0.57 to –0.76
% of rural population on LFAL located on remote LFAL (2000), i2it–
13.45 5.21 18.83 –0.55 to –0.74
T A B L E 1 2
Effects of key degrading and improving agricultural land variables on annualized change in poverty (%)

C H A P T E R
05
32
Conclusion: Policy Implication and Further Research
Table 13 summarizes the findings over 2000–2010 for the distribution of rural populations on LFAL, in LFAA, degrading agricultural land and improving agricultural land.
This study has shown that a sizable proportion of the rural population in developing countries is concentrated on LFAL, which are subject to low productivity and degradation due to steep slopes, poor soil quality or limited rainfall (Figure 1, boxes A and B). In 2000, over 1.3 billion rural people in developing countries, representing almost 36 per cent of the rural population, were located on these lands, and their numbers increased to 1.5 billion in 2010 (35 per cent of the rural population).
A large segment of the rural population is also located in LFAA, which include LFAL plus favoura-ble land that is remote, due to long distances to markets and limited access to infrastructure (Fig-ure 1, boxes A, B and D). In 2000, nearly 1.4 billion people (37 per cent of the rural population) lived in LFAA in developing countries, increasing to nearly
1.6 billion (still 37 per cent of the rural population) in 2010.
Perhaps most critical may be the rural population located on LFAL that are also remote due to poor access to infrastructure and markets (Figure 1, box B). In 2000, this population in developing coun-tries consisted of 288 million people. Although they comprised less than eight per cent of the rural population, they accounted for 22 per cent of the rural population on LFAL. By 2010, the rural popu-lation on remote LFAL had increased to 323 million people.
It was also concluded that large numbers of the rural population in developing countries are located on agricultural land that has been degrad-ing over 1981–2000. In 2000, nearly 1.3 billion people were located on all degrading agricultural land (32 per cent of the rural population), which included 202 million persons without market access (around 6 per cent of the rural population). By 2010, over 1.4 billion people were located on
Developing countries are all low and middle-income economies with 2012 per capita income of USD 12,615 or less (World Bank, 2014).
Population in 2000 (millions)
Population in 2010 (millions)
global
Developing country
global
Developing country
Rural population 4,111.5 3,706.8 4,663.9 4,248.6
Rural population on LFAL 1,486.3 1,314.5 1,666.6 1,499.7
Rural population in LFAA 1,556.4 1,382.7 1,748.6 1,579.8
Rural population on remote LFAL 298.4 288.2 332.4 322.5
Rural population on all degrading agricultural land 1,331.3 1,258.7 1,496.9 1,426.3
Rural population on remote degrading agricultural land 205.4 202.2 233.2 230.2
Rural population on all improving agricultural land 1,537.1 1,340.7 1,729.9 1,539.4
Rural population on remote improving agricultural land 164.3 155.3 178.2 169.2
T A B L E 1 3
Rural population on LFAL and LFAA, 2000–2010 changes
A N E L D A S S E S S M E N T
33
degrading agricultural land (34 per cent of the rural population), which included 230 million peo-ple in remote areas (over five per cent of the rural population).
In addition, large segments of the rural population in developing countries are located on agricultural land that has been improving in terms of net pri-mary productivity over 1981–2000. In 2000, there were 1.3 billion people on improving agricultural land, or 36 per cent of the rural population. They included 155 million people without market access, or four per cent of the rural population. By 2010, there were over 1.5 billion people on improving agricultural land in developing countries, and the numbers in remote areas increased to 169 million people.
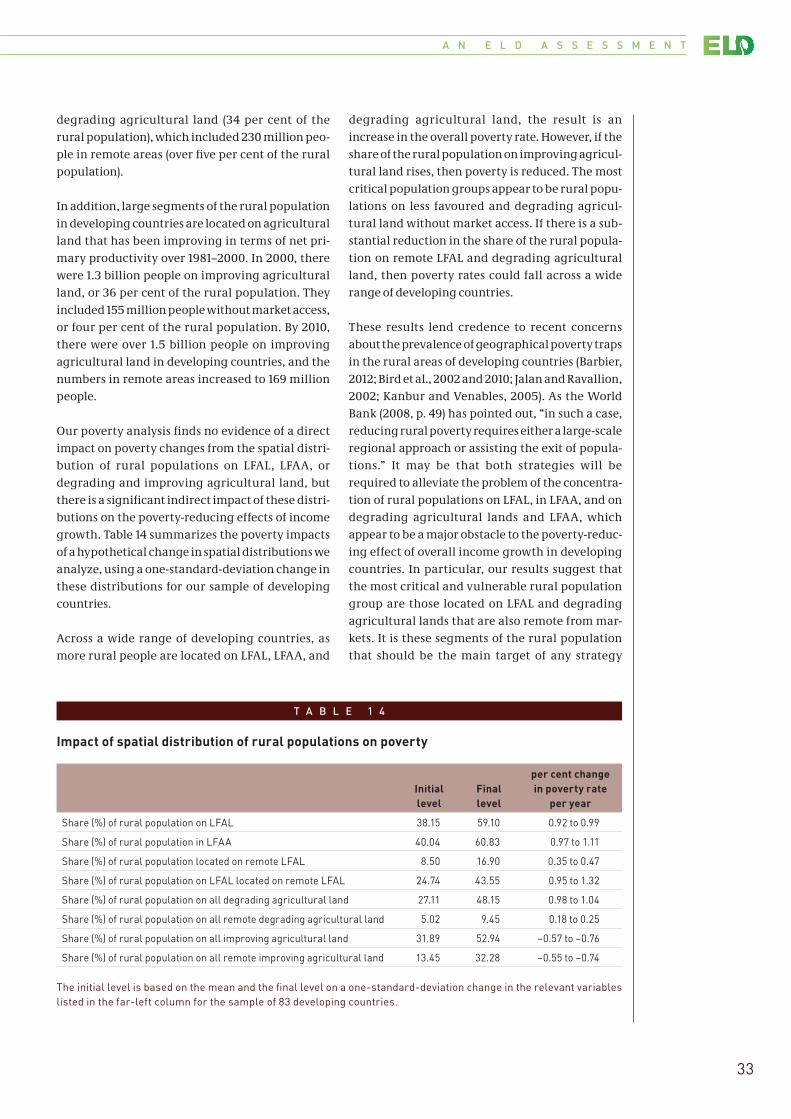
Our poverty analysis finds no evidence of a direct impact on poverty changes from the spatial distri-bution of rural populations on LFAL, LFAA, or degrading and improving agricultural land, but there is a significant indirect impact of these distri-butions on the poverty-reducing effects of income growth. Table 14 summarizes the poverty impacts of a hypothetical change in spatial distributions we analyze, using a one-standard-deviation change in these distributions for our sample of developing countries.
Across a wide range of developing countries, as more rural people are located on LFAL, LFAA, and
degrading agricultural land, the result is an increase in the overall poverty rate. However, if the share of the rural population on improving agricul-tural land rises, then poverty is reduced. The most critical population groups appear to be rural popu-lations on less favoured and degrading agricul-tural land without market access. If there is a sub-stantial reduction in the share of the rural popula-tion on remote LFAL and degrading agricultural land, then poverty rates could fall across a wide range of developing countries.
These results lend credence to recent concerns about the prevalence of geographical poverty traps in the rural areas of developing countries (Barbier, 2012; Bird et al., 2002 and 2010; Jalan and Ravallion, 2002; Kanbur and Venables, 2005). As the World Bank (2008, p. 49) has pointed out, “in such a case, reducing rural poverty requires either a large-scale regional approach or assisting the exit of popula-tions.” It may be that both strategies will be required to alleviate the problem of the concentra-tion of rural populations on LFAL, in LFAA, and on degrading agricultural lands and LFAA, which appear to be a major obstacle to the poverty-reduc-ing effect of overall income growth in developing countries. In particular, our results suggest that the most critical and vulnerable rural population group are those located on LFAL and degrading agricultural lands that are also remote from mar-kets. It is these segments of the rural population that should be the main target of any strategy
The initial level is based on the mean and the final level on a one-standard-deviation change in the relevant variables listed in the far-left column for the sample of 83 developing countries.
Initial level
Final level
per cent change in poverty rate
per year
Share (%) of rural population on LFAL 38.15 59.10 0.92 to 0.99
Share (%) of rural population in LFAA 40.04 60.83 0.97 to 1.11
Share (%) of rural population located on remote LFAL 8.50 16.90 0.35 to 0.47
Share (%) of rural population on LFAL located on remote LFAL 24.74 43.55 0.95 to 1.32
Share (%) of rural population on all degrading agricultural land 27.11 48.15 0.98 to 1.04
Share (%) of rural population on all remote degrading agricultural land 5.02 9.45 0.18 to 0.25
Share (%) of rural population on all improving agricultural land 31.89 52.94 –0.57 to –0.76
Share (%) of rural population on all remote improving agricultural land 13.45 32.28 –0.55 to –0.74
T A B L E 1 4
Impact of spatial distribution of rural populations on poverty

C H A P T E R 0 5 Land Degradation, Less Favored Lands and the Rural Poor: A Spatial and Economic Analysis
34
aimed at encouraging out-migration while invest-ing in improving the livelihoods of those who remain in such areas.
As our study indicates, currently just about the same number of rural people in developing coun-tries (1.4 billion) are on degrading agricultural land as are on improving agricultural land (1.5 billion). Both groups account for approximately one third (around 34 and 36 per cent, respectively) of the rural population. These results suggest that sub-stantial poverty reduction could occur in develop-ing countries if more of the rural population farmed improving as opposed to degrading agri-cultural land. Targeting such rural populations in developing countries to overcome biophysical con-straints to agriculture and limited market access and infrastructure must be an urgent priority.
A N E L D A S S E S S M E N T
35
References
Adams Jr. R .H., & Page, J. (2005). Do Internat ional
Migration and Remittances Reduce Povert y in
Developing Count ries? World Development 33,
1645–1669.
Bai, Z.G., De Jong, R., & van Lynden, G.W.J. (2010). An
up date of GL A DA – Globa l assessme nt of la nd
degradation and improvement. ISRIC report 2010/08,
ISR IC – World Soil In for mat ion. Wagen i ngen ,
Netherlands: Wageningen University.
Bai, Z.G., Dent, D.L., Ossen, L., & Schaepman, M.E. (2008).
Proxy global assessment of land degradation. Soil
Use and Management, 24: 223-234.
B a r bie r, E . B . (2 0 10) . P o v e r t y, de v e lopme nt , a nd
e nv i r on me nt . Env i ron me nt a nd D e ve lopme nt
Economics, 15: 635-660.
Barbier, E.B. (2012). Natural Capital, Ecological Scarcity
and Rural Poverty. Policy Research Working Paper
No. 6232. Washington, D.C.: The World Bank.
Bird, K., McKay, A., & Shinyekwa, I. (2010). Isolation and
p over t y : T he relat ion sh ip b et we en s pat ia l ly
differentiated access to goods and services and
poverty. ODI Working Paper 322. London, United
Kingdom: Overseas Development Institute.
Bolden, D., (Ed.). (2007). Water for Food, Water for Life: A
Comprehensive Assessment of Water Management in
Agriculture. London: Earthscan and Colombo, Sri
Lanka: International Water Management Institute.
CGI A R ( TAC S e c ret a r iat). ( 1999). CGI A R s t udy on
marginal lands: Report on the study on CGIAR
research priorit y for marginal lands. Marginal
Lands Study Paper No. 1. Rome, Italy: FAO.
de Jong, R., de Bruin, S., Schaepman, M., & Dent, D. (2011).
Quantitative mapping of global land degradation
using Earth observations. International Journal of
Remote Sensing, 32: 6823-6853.
Dollar, D., & Kraay, A. (2002). Growth is Good for the
Poor. Journal of Economic Growth 7: 195-225.
Jalan, J., & Ravallion, M. (2002). Geographic poverty
traps? A micro model of consumption growth in
rural China. Journal of Applied Econometrics, 17:
329-346.
Kanbur, R ., & Venables, A .J., (Eds.). (2005). Spatial
I ne q ua l it y a nd D e ve lo pm e nt. O x for d , Un it e d
Kingdom: Oxford University Press.
Kraay, A. (2006). When is growth pro-poor? Evidence
from a panel of countries. Journal of Development
Economics, 80: 198-227.
Nachtergaele, F., Petri, M., Biancalani, R., van Lynden,
G . , v a n Va l t hu i z e n , H . ( 2 0 1 0 ) . G l o b a l L a n d
Degradation Information System (GLADIS), Beta
Ve r s i o n . A n i n f o r m at i o n d at a b a s e f o r l a n d
degradation assessment at a global level. Land
Degradation Assessment in Drylands Technical Report
No. 17. Rome, Italy: FAO.
Nkonya, E., Gerber, N., Baumgartner, P., von Braun, J.,
De Pinto, A., Graw, V., Kato, E., Kloos, J., & Walter, T.
(2011). T he economics of deser t ificat ion, land
degradation, and drought. IFPRI discussion paper
01086. Washington, D.C.: IFPRI.
Pender, J. (2008). Agricultural technology choices for
poor farmers in less-favoured areas of South and
East A sia. Occasional Paper 5, A sia and Pacific
Devision. Rome, Italy: IFAD.
Pender, J., & Ha zel l, P. (2 0 0 0). Br ief 1: P romot i ng
sustainable development in less-favoured areas:
Overview. In Pender, J., & Hazell, P., (Eds.), Promoting
sustainable development in less-favoured areas.
Policy Brief Series, Focus 4. IFPRI: Washington, D.C.
R a v a l l i o n , M . ( 2 0 1 2) . W hy d o n’t w e s e e p o v e r t y
convergence? American Economic Review 102: 504-
523.
Ravallion, M., & Chen, S. (1997). What can new survey
data tell us about recent changes in distribution
and poverty? World Bank Economic Review 11: 357-
382.
Skoutias, E., Rabassa, M., & Olivieri, S. (2011). The poverty
i mp a c t s of c l i m at e c h a nge: A r e v ie w of t he
ev idence. Polic y Research Working Paper 5622.
Washington, D.C.: The World Bank.
Von Braun, J., Gerber, N., Mirzabaev, A., & Nkonya, E.
(2012). The economics of land degradation: An
issue paper for Global Soil Week (October 10, 2012).
Bonn, Germany: Center for Development Research,
University of Bonn.
World Bank. (2003). World Development Report 2003.
Washington, D.C.: The World Bank.
World Bank. (2008). World Development Report 2008:
Agricultural Development. Washington, D.C.: The
World Bank.
World Bank. (2014). World Development Indicators.
Washington, D.C.: The World Bank. (available at
databank.worldbank.org).

A P P E N D I X Technical Notes
36
Appendix: Technical Notes
Data sources:
Several geospatial datasets were utilized in this analysis
(1) National boundaries were determined from the Gridded Population of the World, Version 3 (GPWv3): National Administrative Boundaries file as published by the Center for International Earth Science Information Network (CIESIN) and Centro Internacional de Agricultura Tropical (CIAT) in 2005. Country boundaries are denoted by polygons and are identified using unique ISO3V10 3-letter country/state codes. The geographic coordinates of this dataset are in decimal degrees using the World Geodetic System spheroid of 1984 (WGS84). Territo-ries of countries were not included in this analysis.
Center for International Earth Science Information Network (CIESIN), Columbia University; and Centro Internacional de Agricultura Tropical (CIAT). 2005. Gridded Population of the World Version 3 (GPWv3): National Boundaries. Palisades, NY: Socioeconomic Data and Applications Center (SEDAC), Columbia Uni-versity. Available at http://sedac.ciesin.columbia.edu/gpw (Accessed 17 July 2013).
(2) Populations for 2000 and 2010 were identified using the Gridded Population of the World, Ver-sion 3 (GPWv3) dataset published in 2005 by the CIESIN, International Food Policy Research Insti-tute (IFPRI) and CIAT. It was chosen not to use the higher resolution Global Rural-Urban Mapping Project (GRUMP), Version 1 also published by CIESIN because in addition to 1990, 1995 and 2000 popula-tion data, the GPWv3 also offers population projec-tions for 2005, 2010 and 2015. The resolution of this GR ID format ted raster is 0.041666667 by 0.041666667 decimal degrees or 2.5 by 2.5 arc-min-utes (approximately 5 km2 cells).
Center for International Earth Science Information Network (CIESIN)/Columbia University, United Nations Food and Agriculture Programme (FAO), and Centro Internacional de Agricultura Tropical (CIAT).
2005. Gridded Population of the World, Version 3 (GPWv3): Population Count Grid. Palisades, NY: NASA Socioeconomic Data and Applications Center (SEDAC). htt p://sedac.ciesin.columbia.edu/data/set/gpw-v3-population-count (Accessed 7 July 2013).
(3) Urban areas were identified using the Urban Extents Grid, Version 1 (1995) from GRUMP V1. This data was published in 2011 by CIESIN, International Food Policy Research Institute (IFPRI), the World Bank and Centro Internacional de Agricultura Tropical (CIAT). The resolution of this GRID format-ted raster is 0.0083333333 by 0.0083333333 deci-mal degrees or 30 arc-seconds (approximately 1 km2 cells). Rural areas were defined as those that are non-urban.
Center for International Earth Science Information Network (CIESIN)/Columbia University, International Food Policy Research Institute (IFPRI), The World Bank, and Centro Internacional de Agricultura Tropi-cal (CIAT). 2011. Global Rural-Urban Mapping Project, Version 1 (GRUMPv1): Urban Extents Grid. Palisades, NY: NASA Socioeconomic Data and Applications Center (SEDAC). http://sedac.ciesin.columbia.edu/data/set/grump-v1-urban-extents (Accessed 17 July 2013).
(4) Length of growing period (LGP) data, using a baseline period of 1961–1990, was published by the FAO on the Global Agro-Ecological Zones (GAEZ) Data Portal on 2012-05-02 in the Agro-climatic resources series with the “Growing period” collec-tive title. The resolution of this TIFF formatted ras-ter is 0.083333333 by 0.083333333 decimal degrees or 5 by 5 arc-minutes (approximately 10 km2 cells).
FAO Global Agro-Ecological Zones Data Portal version 3. Available online: http://gaez.fao.org (Accessed 17 July 2013).
(5) Terrain data, for median terrain slope classes, was published by the FAO on the Global Agro- Ecological Zones (GAEZ) Data Portal on 2012-05-02

A N E L D A S S E S S M E N T
37
in the land resources series with the “Terrain Resources” collective title. The dataset’s eight rele-vant terrain classes include (i) 0–0.5 per cent, (ii) 0.5–2 per cent, (iii) 2–5 per cent, (iv) 5 – 8 per cent, (v) 8–16 per cent, (vi) 16–30 per cent, (vii) 30–45 per cent and (viii) > 45 per cent. The resolution of this TIFF formatted raster is 0.083333333 by 0.083333333 decimal degrees or 5 by 5 arc-minutes (approximately 10 km2 cells).
FAO Global Agro-Ecological Zones Data Portal ver-sion 3. Available online: http://gaez.fao.org (Accessed 17 July 2013).
(6) Soil constraints are identified from a series of data sources published by the FAO on the Global Agro-Ecological Zones (GAEZ) Data Portal on 2012-05-02 in the land resources series with the “Soil Resources” collective title. There are seven con-straints on soil including (i) nutrient availability, (ii) nutrient retention capacity, (iii) rooting conditions, (iv) oxygen availability to roots, (v) excess salts, (vi) toxicity, and (vii) workability. Within each soil con-straint category there are four levels classifying how constrained soil is including (i) No or slight constraints, (ii) Moderate constraints, (iii) Severe constraints and (iv) Very severe constraints. We consider less favoured soil where any of these constraints are considered severe or very severe. The resolution of this TIFF formatted raster is 0.083333333 by 0.083333333 decimal degrees or 5 by 5 arc-minutes (approximately 10 km2 cells).
FAO Global Agro-Ecological Zones Data Portal ver-sion 3. Available online: http://gaez.fao.org (Accessed 17 July 2013).
(7) Irrigated cultivated land data was published by the FAO on the Global Agro-Ecological Zones (GAEZ) Data Portal on 2012-05-02 in the land resources series with the “Water Resources” collec-tive title. The percentage of land equipped for irri-gation is given for each pixel in the dataset. Consist-ent with the Fan and Hazell (1999), we classify land as irrigated if greater than 25 per cent of all culti-vated land within a pixel is irrigated. The resolu-tion of this TIFF formatted raster is 0.083333333 by 0.083333333 decimal degrees or 5 by 5 arc-minutes (approximately 10 km2 cells).
Fan, S., & Hazell, P. (1999). Are returns to public invest-ments lower in less-favoured rural areas? An empirical analysis of India. Environment and Production Tech-nology Division, Discussion Paper 43. Washington, D.C.: IFPRI.
FAO Global Agro-Ecological Zones Data Portal ver-sion 3. Available online: http://gaez.fao.org (Accessed 17 July 2013).
(8) Market accessibility was used to identify remote areas using Nelson (2008) “Travel time to major cit-ies: A global map of accessibility” as released by the Global Environment Monitoring Unit of the Joint Research Centre of the European Commission. Market access is identified as less than five hours of travel to a market city with a population of 50,000 or more. This dataset was published in seconds of travel to the nearest city and was converted to hours of travel. Additional details on how travel dis-tances and speeds were calculated and accompa-nying assumptions can be found here http://bioval.jrc.ec.europa.eu/products/gam/description.htm. The resolution of this GRID formatted raster is 0.0083333333 by 0.0083333333 decimal degrees or 30 arc-seconds (approximately 1 km2 cells).
Nelson, A. (2008). Travel time to major cities: A global map of Accessibility. Global Environment Monitoring Unit - Joint Research Centre of the European Commis-sion, Ispra Italy. Available at http://gem.jrc.ec.europa.eu.
(9) Global agricultural lands were identified using the International Food Policy Research Institute’s (IFPRI) Pilot Analysis of Global Ecosystem (PAGE) agricultural extent (PAGE v.1).
Pilot Analysis of Global Ecosystems (PAGE): Agro-ecosystems, 2000. 2005. Washington, DC: World Resources Institute and the International Food Policy Research Institute (datasets). http://www.ifpri.org/dataset/pilot- analy sis- global- ecos y stems-page (Accessed 17 July 2013)
Consistent with the original seasonal land cover region (SLCR) agriculture threshold (see You et al. (2008) for greater detail), we set the percent of land cover area consisting of “cropland, grazing land or irrigated area net of areas with a growing period of zero days” (Sebastian, 2006) threshold at thirty per-cent.

A P P E N D I X Technical Notes
38
You, Liangzhi, Stanley Wood, and Kate Sebastian. 2008 "COMPARING AND SYNTHESIZING DIFFERENT GLOBAL AGRICULTURAL LAND DATASETS FOR CROP ALLOCATION MODELING." The International Archives of the Photogrammetry, Remote Sensing and Spatial Information Sciences, 37(B7), 1433-40.
Sebastian, K. 2006b. Global Extent of Agriculture. Dataset derived from Ramankutty (2005 & 2002), Sie-bert (2006) and IIASA/FAO (2000). International Food Policy Research Institute (IFPRI). Washington, D. C. Unpublished data
Note the thirty percent threshold is slightly more restrictive than the ten percent threshold used in the World Development Report (WDR) 2008 analy-sis (Sebastian, 2007), which will make our estimates of individuals on agricultural land conservative.
Sebastian, K. 2007. GIS/Spatial Analysis Contribution to 2008 WDR. http://siteresources.worldbank.org/INT WDR2008/Resources/2795087-1191427986785/SebastianK_ch2_GIS_input_report.pdf (Accessed on 16 February 2014).
The source data for the agricultural extent is the 1992–93 Advanced High Resolution Radiometer (AVHRR) dataset, which was used to calculate indi-viduals on agricultural land in the year 2000. Cal-culations of individuals on agricultural land for 2010 were scaled linearly by the change in agricul-tural land percentage from 2000–2010, respec-tively. Agricultural land ( per cent of land area) data for 2000 and 2010 is from the World Bank’s World Development Indicators (WDI). Regional classifica-tions (both developing and all countries) and income classifications were also extracted from the most recent version of the WDI. Developing economies are those that were low, lower-middle or upper-middle income as of 18 December 2013.
World Development Indicators, 1960–2013. The World Bank. Last updated 18-Dec-2013. http://data. worldbank.org/data-catalog/world-development-indicators (Accessed 16 February 2014).
Degrading or improving land was determined using University of Maryland’s Global Land Cover Facility’s AVHRR Global Production Efficiency Model (GloPEM) (Prince and Goward, 1995; Prince and Small, 2003), which is available from 1981–2000 with annual summations of net primary produc-tion (NPP) change measured in
Prince, S., & Small, J. (2003). Global Product Efficiency Model, 1997_npp_latlon, College Park, Maryland: Department of Geography, University of Maryland.
Prince, Stephen D., and Samuel N. Goward. "Global primary production: a remote sensing approach." Journal of biogeography (1995): 815-835.
grams of carbon sequestered per square meter per year (gC/m2/yr). Consistent with Bai et al. (2008) and Bai and Dent (2007) annual changes in net pri-mary productivity are taken as an indicator of land degradation or improvement.
Bai, Z.G., Dent, D.L., Olsson, L., & Schaepman, M. (2008). Proxy global assessment of land degradation. Soil Use and Management, 24(3): 223-234.
Bai, Z.G., & Dent, D.L. (2007). Land degradation and improvement in Senegal. Identification by remote sensing. Report 2007/07 ISRIC – World Soil Informa-tion. Wageningen, Netherlands: Wageningen Univer-sity.
Raster dataset management:3
All of the raster datasets used in these analyses were resampled to 30 arc-second ERDAS IMAGINE (.img) formatted raster layers using the nearest neighbor resampling technique. Raster alignment was ensured by setting the geoprocessing environ-ment to snap all raster datasets to the extent of the LGP dataset (Top 90, Left –180, Right 180, Bottom –90). The population raster datasets from the GPWv3 were resampled (and values converted appropriately) from 2.5 arc-minute resolution to 30 arc-second resolution.
Less Favoured Land:
Length of growing period data was reclassified for cells with a LGP from 0–119 (Arid and Semi-Arid) having an assigned value of “1” and all other cells having an assigned value of “NoData”. Terrain was reclassified for cells with a median slope of 0 –8 per cent having a value of “NoData” and cells with a slope > 8 per cent having a value of “1”. The classes that corresponded to steep terrain included class 5 (8 per cent – 16 per cent), class 6 (16 per cent – 30 per cent), class 7 (30 per cent – 45 per cent) and class 8 (> 45 per cent).
3 All geospatial
analysis was conducted
using ESRI ArcGIS 10.1
licensed to the
University of Wyoming.

A N E L D A S S E S S M E N T
39
Irrigated land with poor soil and irrigated land with steep terrains were calculated with a cell value of “1” to create the product of each individual constraint (e. g. Irrigated*Poor Soil, Irrigated*Steep Terrain) for less favoured land and “NoData” for those areas not affected by these constraints.
Rainfed land with LGP > 120 days on > 8 per cent sloped land and rainfed land with LGP > 120 days on poor soil quality land were also calculated for the product of each of the constraint. Rainfed land was defined as land that was not irrigated (land with per pixel irrigated cell area coverage of 25 per cent or less).
The four raster constraints on less favoured land, (i) irrigated land on > 8 per cent slope, (ii) rainfed land with LGP > 120 days on > 8 per cent slope (iii) rain-fed land with LGP > 120 days and poor soil and (iv) arid (LGP < 60 days) and semi-arid (LGP 60–119 days) lands, were combined into a single less favoured land mosaic. This less favoured land mosaic was masked to include only agricultural land creating a mosaic of LFAL.
All population summations, within the boundaries of countries, were conducted within the extent of the urban-rural raster dataset. Population counts of interest were then calculated using zonal statis-tics and a mask on rural areas, at the country level, to create our key variables of interest.
Less Favoured Areas:
An accessibility mask was created from the market accessibility dataset by reclassifying raster values as “1” if the cell was 5 hour more hours from the nearest market center of 50,000 or more individu-als. This mask resembles remote areas. The favoured land dataset, defined as those areas that are not less favoured, was extracted to include only remote favoured locations. The “rural less favoured land” raster dataset and the “remote favoured land” raster datasets were combined into a single mosaic representing less favoured areas. Variables of interest were calculated using zonal statistics as the country level.
Remote agricultural and LFAL:
Additional refinements (extracting populations from the LFAL and LFAA datasets using the remote-ness mask and summarizing those populations) were made to create our remaining indicators. Degrading and improving lands and areas:
Two decades of land degradation and improve-ment data are analysed (1981–2000), using the dif-ference in the annual sum NPP between 2000 and 1981. Degrading land is defined as land with a nega-tive NPP change over these twenty years. Improv-ing land is defined as land that is not degrading (land with a non-negative change in NPP). These degrading and improving lands are dissected in a manner analogous to the divisions in the LFAL and LFAA analyses. Rural individuals on degrading and improving agricultural land were separately sum-marized using the improving and degrading land masks, respectively. These individuals were then masked, using the remoteness indicator, and sum-marized to find the rural population located on all remote degrading (and improving) agricultural land.
Maps
All accompanying maps are projected using a standard Robsinson (world) projection.
Definitions
Less Favoured Agricultural Land (LFAL): This consists of irrigated land on terrain greater than 8 per cent median slope; rainfed land with a length of grow-ing period (LGP) of more than 120 days but either on terrain greater than 8 per cent median slope or with poor soil quality; semi-arid land (land with LGP 60-119 days); and arid land (land with LGP < 60 days).
Less Favoured Agricultural Areas (LFAA): This include LFAL as well as favoured agricultural land with lim-ited market access (i. e. located in remote areas). Market access is identified as less than five hours of travel to a market city with a population of 50,000 or more.

A P P E N D I X Technical Notes
40
Degrading Agricultural Land (DAL): This consists of agricultural land with a negative change in Net Pri-mary Productivity (NPP) from 1981–2000.
Improving Agricultural Land (IAL): This consists of agricultural land with a non-negative change in Net Primary Productivity (NPP) from 1981–2000.
Net Primary Productivity (NPP): This is measured as the change in grams of carbon sequestered per square meter over the 1981–2000 time period after subtracting respiration losses.
Length of Growing Period (LGP): This data, using a baseline period of 1961–1990, was published by the FAO on the Global Agro-Ecological Zones (GAEZ) Data Portal on 2012-05-02 in the Agro-climatic resources series with the “Growing period” collec-tive title.
Terrain: Terrain data, for median terrain slope classes, was published by the FAO on the Global Agro-Ecological Zones (GAEZ) Data Portal on 2012-05-02 in the land resources series with the “Terrain Resources” collective title. The dataset’s eight rele-vant terrain classes include (i) 0–0.5 per cent, (ii) 0.5–2 per cent, (iii) 2–5 per cent, (iv) 5–8 per cent, (v) 8–16 per cent, (vi) 16–30 per cent, (vii) 30–45 per cent and (viii) > 45 per cent.
Soil Constraints: Soil constraints are identified from a series of data sources published by the FAO on the Global Agro-Ecological Zones (GAEZ) Data Portal on 2012-05-02. There are seven constraints on soil including (i) nutrient availability, (ii) nutrient reten-tion capacity, (iii) rooting conditions, (iv) oxygen availability to roots, (v) excess salts, (vi) toxicity, and (vii) workability. Within each soil constraint cate-gory there are four levels classifying how con-strained soil is including (i) No or slight constraints, (ii) Moderate constraints, (iii) Severe constraints and (iv) Very severe constraints. We consider less favoured soil where any of these constraints are considered severe or very severe.
Irrigated areas: Irrigated cultivated land data was published by the FAO on the Global Agro-Ecologi-cal Zones (GAEZ) Data Portal on 2012-05-02 in the land resources series with the “Water Resources” collective title. The percentage of land equipped for irrigation is given for each pixel in the dataset. Consistent with the Fan and Hazell (1999), we clas-sify land as irrigated if greater than 25 per cent of all cultivated land within a pixel is irrigated.

A N E L D A S S E S S M E N T
41

www.eld-initiative.org
For further information and feedback please contact:
ELD SecretariatMark Schauerc/o Deutsche Gesellschaftfür Internationale Zusammenarbeit (GIZ) GmbHGodesberger Allee 11953175 BonnGermanyT + 49 228 24934-400F + 49 228 24934-215E [email protected] www.eld-initiative.org
This brochure was published with the support of the Partner Organisations of the ELD initiative and the Deutsche Gesellschaft für Internationale Zusammenarbeit (GIZ) GmbH on behalf of the German Federal Ministry for Economic Cooperation and Development (BMZ)
Photography: Front and back cover © ELD SecretariatDesign: kippconcept GmbH, BonnPrinted in the EU on FSC-certified paperBonn, September 2014©2014