Embed Size (px)
Citation preview
Syst. Zool., 35(1):1-21, 1986
AN ELECTROPHORETIC ANALYSIS OF HOLARCTIC HYLID FROG EVOLUTION
S. BLAIR HEDGES
Department of Zoology, University of Maryland, College Park, Maryland 20742
Abstract.-The phylogenetic relationships of 30 taxa of Holarctic hylid frogs were examined using starch gel electrophoresis. Allelic variation was scored at 33 presumed genetic loci and genetic distance data were used to construct trees representing the phylogenetic relationships. There are two major groups: (A) Hyla regilla, H. cadaverina, H. crucifer, Limnaoedus ocularis, and all presently recognized species of Pseudacris; and (8) the remaining species of Holarctic Hylli. The positions of Acris and H. meridionalis are unclear. In general, the relationships based on electrophoretic data agree well with immunological, hybridization, and chromosome studies, but conflict with some morphological studies. A phylogenetic classification requires that H. regilla, H. cadaverina, H. crucifer, and L. ocularis be transferred to the genus Pseudacris. This genus is characterized by terrestrial species that breed during cold weather and possess small digital pads and spherical (or ovoid) dark testes. Holarctic Hyla are arboreal species that breed during warm weather and possess large digital pads and elongate white (or yellowish) testes. The correlation between albumin immunological distance (AID) and Nei's electrophoretic distance (D) is significant, with 1 D = 70 AlD. Calibration of the molecular clock for Holarctic hylid frogs suggests that Pseudacris diverged from a Hyla-like ancestor in the early Tertiary. The physiological traits associated with cold-weather breeding and the morphological trait (small digital pads) associated with terrestrial habits appear to have been key innovations that allowed Pseudacris to undergo an adaptive radiation in North America coinciding with the radiation of Holarctic Hyla. [Electrophoresis; phylogeny; genetic distance; molecular clock; Hylidae; Acris; Hyla; Limnaoedus; Pseudacris.]
Molecular techniques such as electrophoresis, microcomplement fixation, and DNA-DNA hybridization have become important tools in systematic research. However, techniques other than sequencing are indirect in their assessment of genetic differences. Redundancy of the genetic code, differences between reciprocal comparisons, and convergence in electrophoretic mobility are a few of the sources of error that may influence the results of these methods. One approach to revealing the strengths and weaknesses of molecular techniques is by com paring the results of two or more techniques applied to the same taxonomic group. Concordant results between two independent molecuar data sets suggest that both may be providing a good estimate of relationships. For example, the correlation between electrophoretic distance and albumin immunological distance is usually highly significant, although slopes vary among taxonomic groups (Wyles and Gorman, 1980). In one group of salamanders
1
(Plethodon), there are strong correlations among data obtained by electrophoresis, DNA-DNA hybridization, and microcomplement fixation (Macgregor et al., 1973; Highton and Larson, 1979; Maxson and Maxson, 1979). Primates have been extensiv.ely studied using several molecular techniques and the results have been generally congruent (Sibley and Ahlquist, 1984; and references therein).
The purpose of this study is to examine the relationships of Holarctic hylid frogs using electrophoresis. This group comprises about 35 described species of arboreal, terrestrial, and semiaquatic frogs that have been placed in four genera: Acris (2 species), Hyla (25), Limnaoedus (I), and Pseudacris (7). Several independent lines of evidence suggest that these species form a monophyletic (or paraphyletic) group within the family Hylidae (ca. 640 species; Frost, 1985). First, all have 24 chromosomes except the two species of Acris (22) and the tetraploid H. versicolor (48). Other Hyla have 18, 20, 22, 24, and 30 chromo-
2 SYSTEMATIC ZOOLOGY VOL. 35
somes (Bogart, 1973). Second, the ability to produce hybrids in the laboratory is relatively high among species of this group as compared with a cross between a Holarctic and a 24-chromosome Neotropical species (Ralin, 1970). Third, immunological distances are lower and, thus, show closer relationship among Holarctic species than when those species are compared with Neotropical or Australian hylids, although some Middle American species appear to be closely related to the Holarctic assemblage (Maxson and Wilson, 1975; Maxson, 1977). Savage (1973) suggested that the Nearctic species arose from a Neotropical ancestor and in turn colonized the Palearctic region via Beringia. In addition to being morphologically well known, this group has been previously examined by microcomplement fixation (Maxson and Wilson, 1975), thus providing an opportunity to compare the results of two independent molecular techniques.
MATERIALS AND METHODS
Products of 33 presumed genetic loci were examined in 30 taxa of Holarctic hylid frogs. Frogs were collected in the field and obtained from colleagues (localities and sample sizes are given in Appendix 1; the average sample size per species is 4.3). The use of small samples can be justified as long as the number of loci is large, genetic distances among taxa are large, and average heterozygosity within species is low (Le., < 10%) (Sarich, 1977; Nei, 1978; Gorman and Renzi, 1979). Nei et al. (1983) found that 30 or more loci were necessary for estimating the phylogeny of a diverse gr(mp of species. Thus, the first criterion was satisfied. I will show below that the other two criteria, large distances and low heterozygosity, also were satisfied.
Heart, liver, kidney, skeletal muscle, and in some cases, intestines were removed from each individual and homogenized in distilled water at a ratio (water: tissue) of 3:1 (justification for combining tissue is given below under protein homology). Dilutions of up to 6:1 were used with small individuals (e.g., Limnaoedus ocularis). Any food present in the intestinal tract was dis-
carded before homogenization. After centrifugation at 2°C for 20 min and 10,000 rpm, the aqueous protein extracts were stored at -75°C. Starch gel electrophoresis was performed in the laboratory of Richard Highton, University of Maryland, using Sigma starch (54501) at a concentration of 12.5%. Buffers were prepared following the methods of Selander et al. (1971). The loci examined, electrophoretic conditions, and stain recipes used are listed in Table 1. Assays for the following proteins were modified: ACP, 30 mg 4-methylumbelliferyl phosphate was dissolved in 20 ml 0.1 M acetic acid (pH 5.5); AK, this locus was scored on the gel assayed for pyruvate kinase, ADH, 0.8 ml absolute ethanol was substituted for 0.3 ml; CD, 10 mg 4-methylumbelliferyl acetate was dissolved in 0.75 ml acetone and combined with 50 ml 0.5 M acetate (pH 5.2); ES, 25 ml 0.2 M monobasic Na phosphate (pH 4.4), 5 ml 0.2 M dibasic Na phosphate (pH 8.7), 20 ml water, 20 mg Fast Garnet GBC, and 0.75 ml alpha-naphthyl betanaphthyl acetate (in acetone); lCD, MnCl was not used; LDH, 20 ml water, 20 ml 0.2 M tris HCI (pH 8.0), 1 ml 0.5 M lithium lactate, 13 mg NAD, 5 mg NBT, and 5 mg PMS; MDH, 30 ml 0.2 M tris HCI (pH 8.0), 5 m12.0 M D-L malate, 20 mg NAD, 10 mg NBT, 10 mg MTT, and 5 mg PMS; DPEP, 25 ml 0.2 M tris HCI (pH 8.0), 40 mg D-Ieucylalanine, 10 mg Crotalus atrox venom (Sigma V7000), 20 mg peroxidase, 10 mg o-dianisidine applied as a 2% agar overlay (25 ml); PT (general protein), 112.5 mg coomassie blue R250 dissolved in 2,475 ml acetic acid/methanol/water (1:5:16) for stock solution; SOD, seen on many gels but scored on gels assayed for malic enzyme; XDH, 50 mg substrate was used.
All differences in electrophoretic mobility were assumed to be of genetic origin and inherited in a Mendelian fashion. Allelomorphs were given alphabetic designations starting with the one most anodal. When more than one locus was visible on a gel, they were numbered in order from cathode to anode. All differences in mobility were confirmed in side-by-side comparisons with electromorphs of similar
1986 HOLARCTIC HYLID EVOLUTION 3
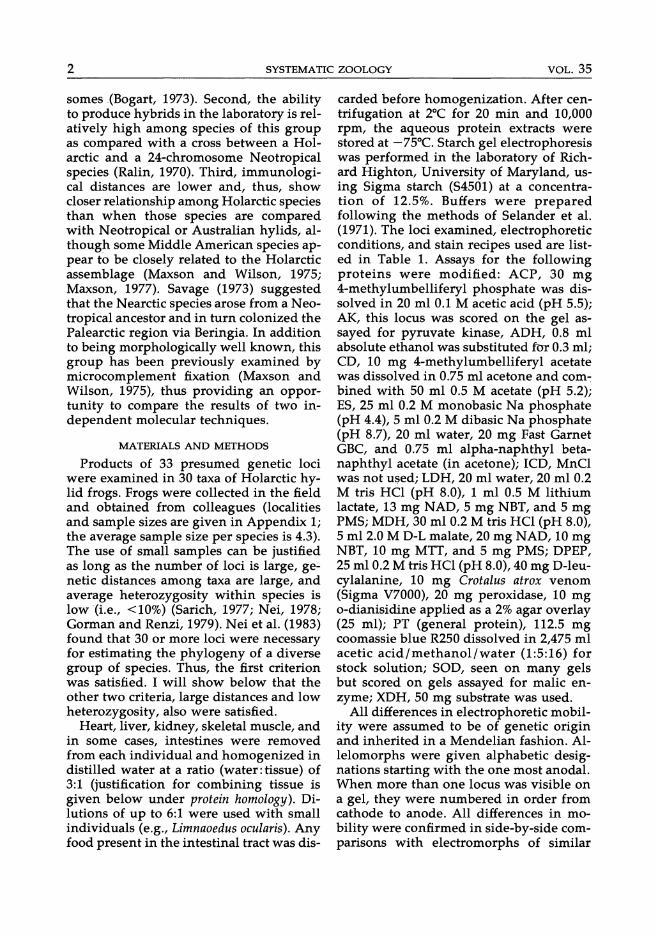
TABLE 1. Protein loci and electrophoretic conditions.
Enzyme Commission Electrophoretic Stain Protein8 Locus number' conditionsb referenceC
Acid phosphatase Acp 3.1.3.2 5 -Adenylate kinase Ak 2.7.4.3 1 1 Alcohol dehydrogenase Adh 1.1.1.1 6 2-Aminopeptidase Apep 3.4.11.1 4 3 Aspartate aminotransferase Aat-l 2.6.1.1 1,2 3 Aspartate aminotransferase Aat-2 2.6.1.1 1,2 3 Carbonate dehydratase Cd 4.2.1.1 6 -Creatine kinase Ck 2.7.3.2 6 2 Cytochrome bs reductase Cr 1.6.2.2 1 2 Dipeptidase Dpep 3.4.13.11 4 -Esterase E5-1 3.1.1.1 6 -Esterase E5-2 3.1.1.1 6 .-Glucosephosphate isomerase Gpi 5.3.1.9 5 3 Glutamate dehydrogenase Glud 1.4.1.3 1 4 Glutathione reductase G5r-2 1.6.4.2 6 2 Glycerol-3-phosphate dehydrogenase Gpd 1.1.1.8 5 3 Isocitrate dehydrogenase lcd-l 1.1.1.42 1 3-Isocitrate dehydrogenase Icd-2 1.1.1.42 1 3-Lactate dehydrogenase Ldh-l 1.1.1.27 3 -Lactoyl-glutathione lyase Lgl 4.4.1.5 6 2 Malate dehydrogenase Mdh-l 1.1.1.37 2 3-Malate dehydrogenase Mdh-2 1.1.1.37 2,3 3-Malate dehydrogenase
(NADP-dependent) Me 1.1.1.40 3,5 5 Mannosephosphate isomerase Mpi 5.3.1.8 5 5 Phosphoglucomutase Pgm 2.7.5.1 2 3 Phosphogluconate dehydrogenase Pgd 1.1.1.44 5 3 Protein 1 Pt-l 3,4 -Protein 2 Pt-2 3,4 -Protein 3 Pt-3 3,4 -Pyruvate kinase Pk 2.7.1.40 1 1 Superoxide dismutase Sod 1.15.1.1 3 -Xanthine dehydrogenase Xdh-l 1.2.1.37 6 3-Xanthine dehydrogenase Xdh-2 1.2.1.37 6 3-
a Nomenclature Committee of the International Union of Biochemistry (1979). b (1) Tri8-citrate pH 8.0, 130 V, 5 h; (2) Tris·citrate pH 6.7, 140 V, 5 h; (3) Poulik, 240 V, 4 h; (4) Lithium hydroxide, 325 V, 5 h; (5) Tris-versene-
borate, 200 V, 5 h; (6) Tris-HCl, 200 V, 3 h. c (1) Buth and Murphy (1980); (2) Harris and Hopkinson (1976); (3) Selander et at. (1971); (4) Shaw and Prasad (1970); (5) Siciliano and Shaw
(1976). An asterisk indicates that a technique is included in the text.
mobility, this procedure accounting for a majority of the electrophoretic runs.
Protein homology.-A common misconception ,concerning multilocus enzyme systems is that homologies cannot be determined unless specific tissues (heart, liver, kidney, and skeletal muscle) are run separately. In most cases, this is not true. Although it is known that some enzymes are restricted to certain tissues, there are many ways of determining protein homology other than by tissue specificity. For example, Holarctic hylids possess two isozymes of lactate dehydrogenase: one is found mostly in skeletal muscle (Ldh-1); the other is found mostly in the heart
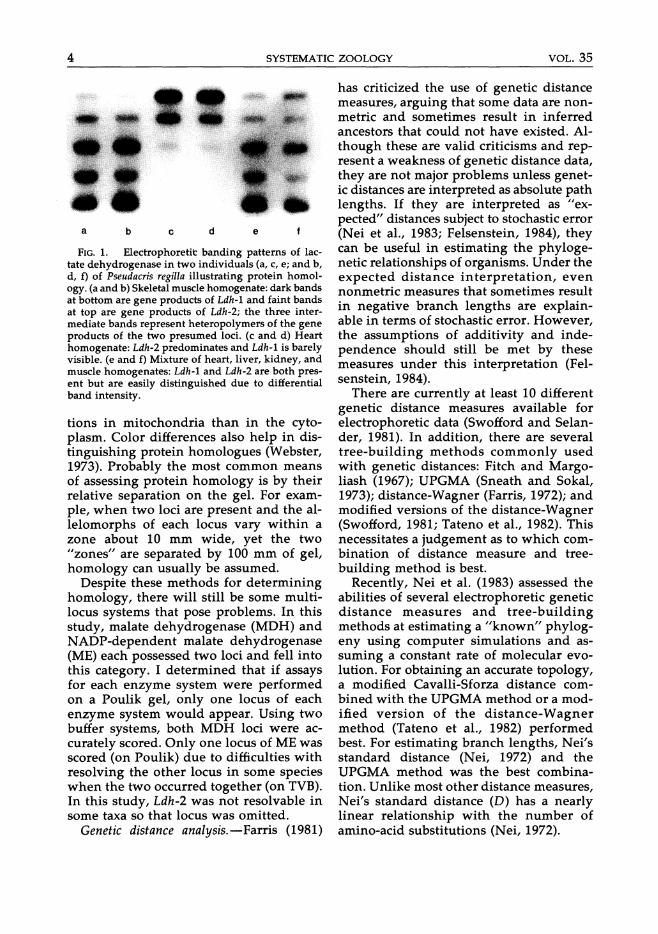
(Ldh-2). When skeletal muscle and heart homogenates are run separately and stained for LDH, the differential in enzyme concentration of the respective tissues results in only one of the two isozymes being predominantly expressed. When heart, liver, kidney, and skeletal muscle are mixed (as in this study), both isozymes of LDH appear on the gel but the homologies are still clear: Ldh-2 bands are considerably lighter because heart makes up a smaller proportion of the total homogenate than skeletal muscle (Fig. 1). In other cases, cell fractionation methods (Henderson, 1965) can be used to isolate isozymes that occur at higher concentra-
4 SYSTEMATIC ZOOLOGY VOL. 35
a b c d e
FIG. 1. Electrophoretit banding patterns of lactate dehydrogenase in two individuals (a, c, e; and b, d, f) of Pseudacris regilla illustrating protein homology. (a and b) Skeletal muscle homogenate: dark bands at bottom are gene products of Ldh-l and faint bands at top are gene products of Ldh-2; the three intermediate bands represent heteropolymers of the gene products of the two presumed loci. (c and d) Heart homogenate: Ldh-2 predominates and Ldh-l is barely visible. (e and f) Mixture of heart, liver, kidney, and muscle homogenates: Ldh-l and Ldh-2 are both present but are easily distinguished due to differential band intensity.
tions in mitochondria than in the cytoplasm. Color differences also help in distinguishing protein homologues (Webster, 1973). Probably the most common means of assessing protein homology is by their relative separation on the gel. For example, when two loci are present and the allelomorphs of each locus vary within a zone about 10 mm wide, yet the two "zones" are separated by 100 mm of gel, homology can usually be assumed.
Despite these methods for determining homology, there will still be some multilocus systems that pose problems. In this study, malate dehydrogenase (MDH) and NADP-dependent malate dehydrogenase (ME) each possessed two loci and fell into this category. I determined that if assays for each enzyme system were performed on a Poulik gel, only one locus of each enzyme system would appear. Using two buffer systems, both MDH loci were accurately scored. Only one locus of ME was scored (on Poulik) due to difficulties with resolving the other locus in some species when the two occurred together (on TVB). In this study, Ldh-2 was not resolvable in some taxa so that locus was omitted.
Genetic distance analysis.-Farris (1981)
has criticized the use of genetic distance measures, arguing that some data are nonmetric and sometimes result in inferred ancestors that could not have existed. Although these are valid criticisms and represent a weakness of genetic distance data, they are not major problems unless genetic distances are interpreted as absolute path lengths. If they are interpreted as "expected" distances subject to stochastic error (Nei et al., 1983; Felsenstein, 1984), they can be useful in estimating the phylogenetic relationships of organisms. Under the expected distance interpretation, even nonmetric measures that sometimes result in negative branch lengths are explainable in terms of stochastic error. However, the assumptions of additivity and independence should still be met by these measures under this interpretation (Felsenstein, 1984).
There are currently at least 10 different genetic distance measures available for electrophoretic data (Swofford and Selander, 1981). In addition, there are several tree-building methods commonly used with genetic distances: Fitch and Margoliash (1967); UPGMA (Sneath and Sokal, 1973); distance-Wagner (Farris, 1972); and modified versions of the distance-Wagner (Swofford, 1981; Tateno et al., 1982). This necessitates a judgement as to which combination of distance measure and treebuilding method is best.
Recently, Nei et al. (1983) assessed the abilities of several electrophoretic genetic distance measures and tree-building methods at estimating a "known" phylogeny using computer simulations and assuming a constant rate of molecular evolution. For obtaining an accurate topology, a modified Cavalli-Sforza distance combined with the UPGMA method or a modified version of the distance-Wagner method (Tateno et al., 1982) performed best. For estimating branch lengths, Nei's standard distance (Nei, 1972) and the UPGMA method was the best combination. Unlike most other distance measures, Nei's standard distance (D) has a nearly linear relationship with the number of amino-acid substitutions (N ei, 1972).
1986 HOLARCTIC HYLID EVOLUTION 5
Since neither a constant nor variable rate of protein evolution could be assumed, both the UPGMA and distance-Wagner methods were used to construct phylogenetic trees from the genetic distance data. The modified Cavalli-Sforza distance was used with the UPGMA method because of its superior performance in computer simulations (Nei et al., 1983). The original Cavalli-Sforza and Edwards (1967) chord distance was used with the distance-Wagner method because it is a metric that agrees with Wright's (1978:102) criteria for an optimal distance measure. The distance-Wagner tree was constructed using the multiple-addition criterion (maxtree = 30) and rooted at the midpoint of the longest path (Swofford, 1981). An additional tree was produced using Nei's unbiased distance (a modified version of D for small sample sizes; Nei, 1978) and the UPGMA method to obtain rough estimates of divergence times. All trees were produced using the BIOSYS-l program (Swofford and Selander, 1981). This program was modified to incorporate the Cavalli-Sforza distance used by Nei et al. (1983).
Goodness-of-fit.-One way to compare trees generated by genetic distance data is by' examining their goodness-of-fit measures. When trees to be compared are generated using the same clustering method, this is an objective way of determining the tree that best represents the data. However, when different methods are involved, each operating under a different set of assumptions, comparison of goodness-of-fit statistics may not be appropriate. This point was made by Swofford (1981), who realized that methods which allow negative homoplasies (~.g., UPGMA) have an unfair advantage in terms of goodness-of-fit over those that do not (distance-Wagner). For this reason, he described an optimization procedure that allows negative homoplasies in the generation of distance-Wagner trees so that they could be objectively compared with other trees. Unfortunately, there are other assumptions associated with these methods, particularly the constant-rate assumption of the UPGMA method, that still reduce
the effectiveness of goodness-of-fit measures in comparing different trees (Nei et al., 1983). They will be used here simply as a means of determining which tree best represents the data but not necessarily which is the best tree, the latter decision depending on the assumption one wishes to invoke. Several different goodness-offit statistics are available to compare trees (Swofford, 1981), but all are highly correlated so only one is used here-Prager and Wilson's (1976) F statistic. .
Least-squares regression lines, productmoment correlation coefficients, and matrix correlation coefficients (Sneath and Sokal, 1973) were computed for the comparison between D and AID. Levels of significance for the matrix correlations were calculated using the Mantel test (Schnell et al., 1985:appendix). All goodness-of-fit statistics and measures of variability for the electrophoretic data were obtained using BIOSYS-l.
RESULTS
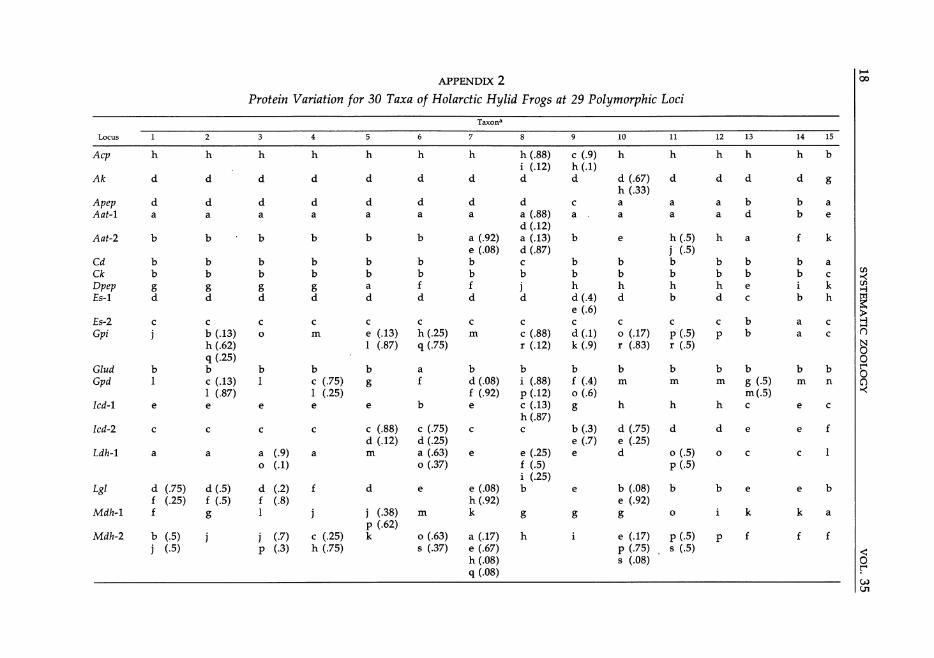
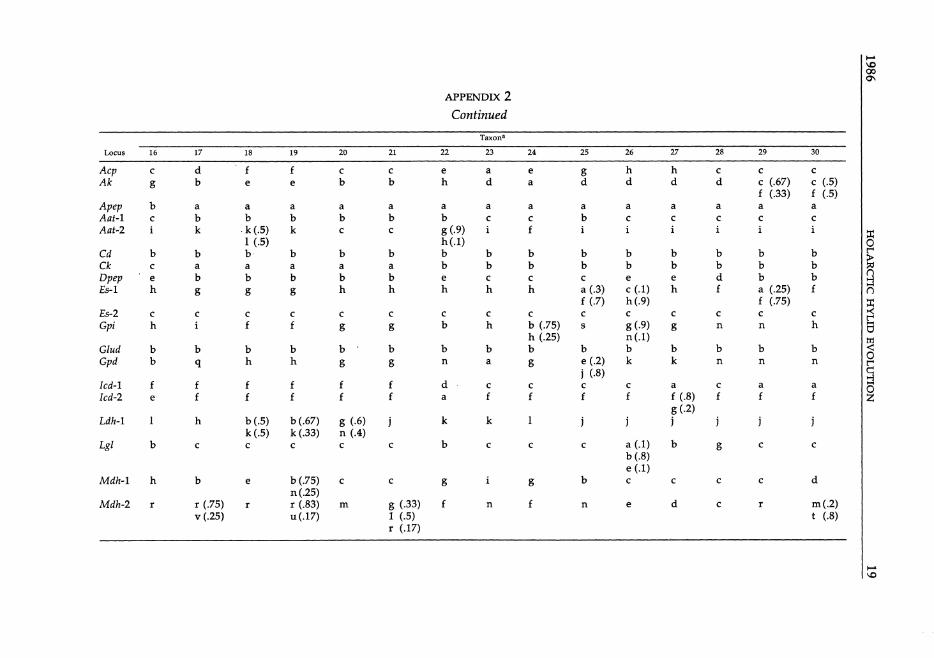
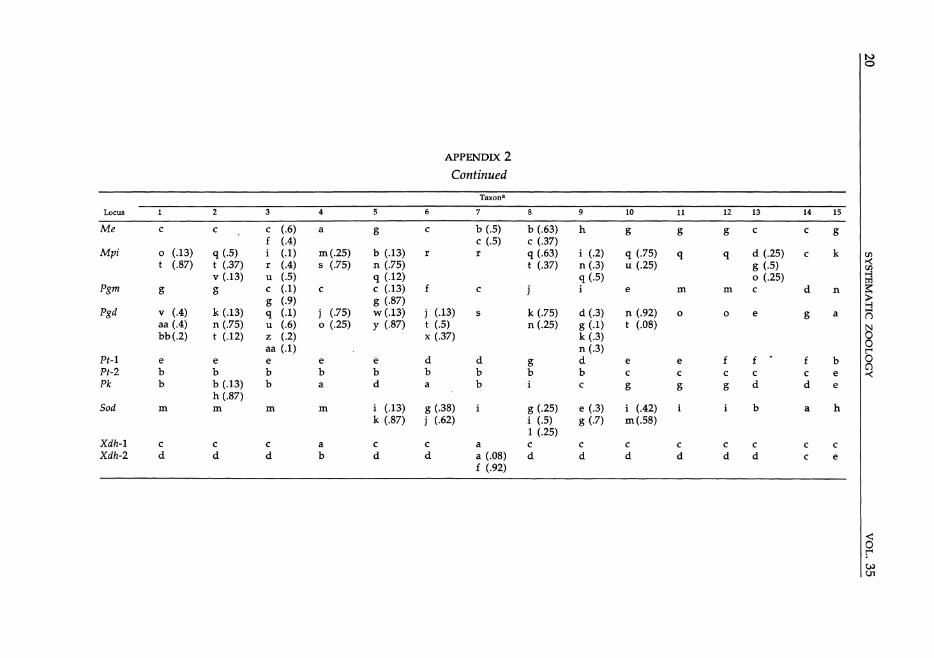
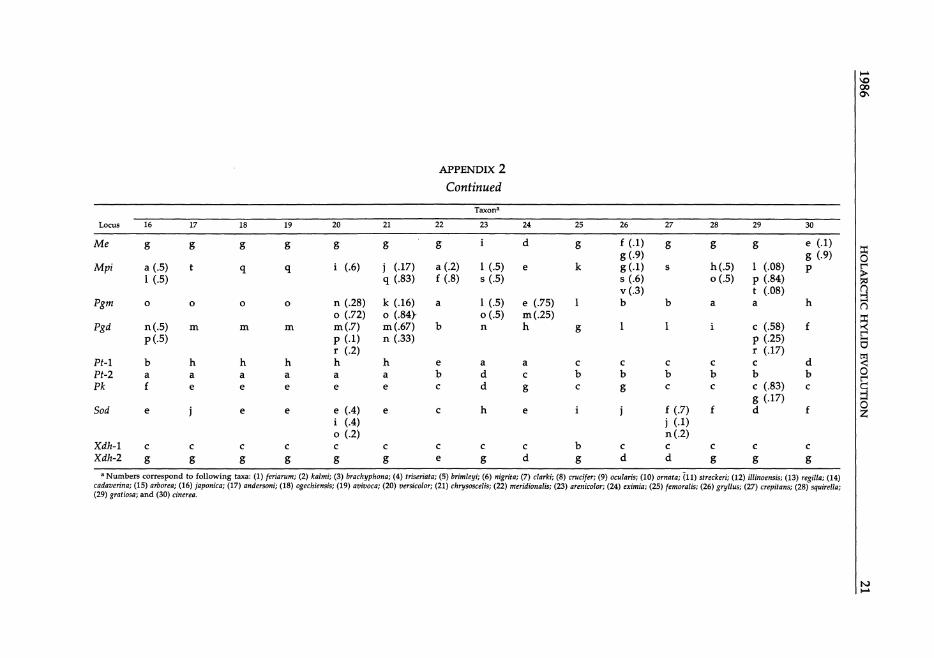
There were 306 alleles identified at 33 presumed genetic loci. Only four loci were monomorphic (Adh, Cr, Gsr-2, and Pt-3). Estimates of average heterozygosity across all 33 loci ranged from zero in H. arborea, H. cadaverina, and P. s. illinoensis to 13% (SE = 5.0) in P. nigrita with a mean of 5.3% (SE = 3.55) among all taxa. Of the taxa represented by one or two individuals, only one, P. s. streckeri (12.1 %, SE = 5.8) exceeded 10% average heterozygosity. The percentage of polymorphic loci ranged from o to 33 with a mean of 11.5. Allelic variation in all taxa for the 29 polymorphic loci is given in Appendix 2. Cavalli-Sforza and Edwards' chord distances (DC> and modified Cavalli-Sforza distances (D A) are presented in Table 2.
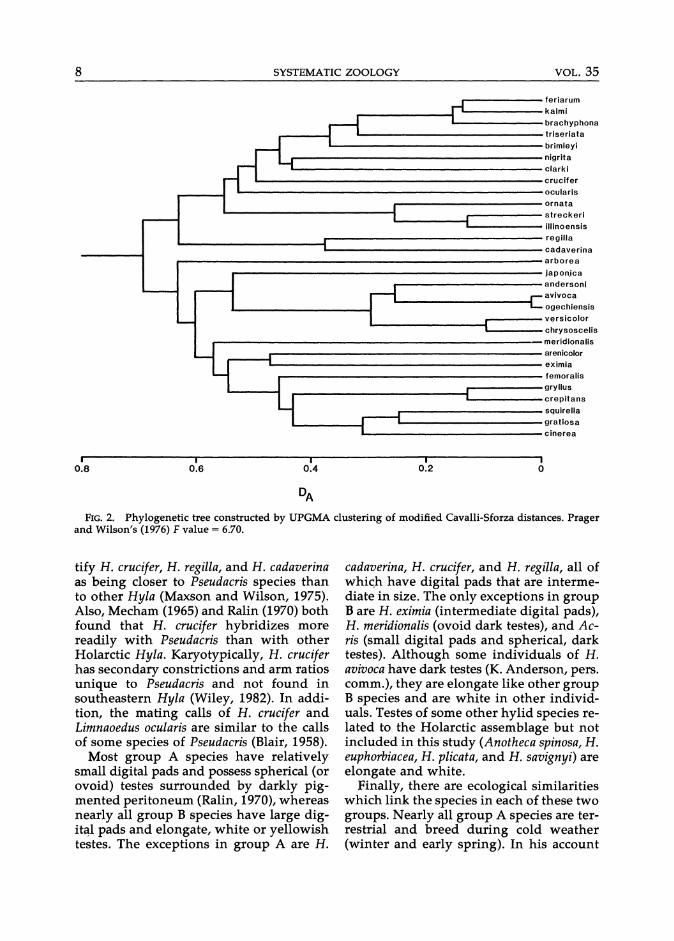
Phenograms constructed by UPGMA clustering of D A and D are identical in topology and, therefore, only the former is presented (Fig. 2). Two large groups are defined: one group (A) contains Hyla regilla, H. cadaverina, H. crucifer, Limnaoedus ocularis, and all Pseudacris taxa, whereas the other group (B) contains A. crepitans, A. gryllus, and all remaining Holarctic Hyla.
6 SYSTEMATIC ZOOLOGY VOL. 35
TABLE 2. Cavalli-Sforza and Edwards (1967) chord distances above diagonal and modified Cavalli-Sforza distances (Nei et ai., 1983) below diagonal for all pairs of taxa.
Taxon
1 feriarum 2 kalmi 3 brachyphona 4 triseriata 5 brimleyi 6 nigrita 7 clarki 8 crucifer 9 ocularis
10 ornata 11 streckeri 12 illinoensis 13 regilla 14 cadaverina 15 arborea 16 japonica 17 andersoni 18 ogechiensis 19 avivoca 20 versicolor 21 chrysoscelis 22 meridionalis 23 arenicolor 24 eximia 25 femoralis 26 gryllus 27 crepitans 28 squirella 29 gratiosa 30 cinerea
2 4
.33 .34 .52 .14 .36 .51 .14 .16 .50 .33 .32 .31 .34 .34 .35 .43 .44 .40 .42 .49 .46 .48 .44 .42 .48 .42 .51 .55 .55 .48 .54 .61 .53 .45 .49 .59 .58 .55 .56 .62 .58 .55 .55 .62 .63 .63 .63 .70 .64 .64 .64 .70 .79 .79 .79 .82 .76 .72 .76 .79 .73 .74 .76 .79 .76 .74 .76 .79 .76 .74 .76 .79 .76 .74 .75 .79 .76 .72 .76 .79 .67 .63 .67 .70 .70 .65 .70 .71 .70 .65 .70 .76 .70 .70 .70 .70 .61 .60 .60 .65 .61 .61 .61 .64 .66 .67 .67 .68 .69 .69 .70 .73 .70 .67 .70 .73
5 6
.53 .59
.52 .57
.53 .58
.59 .63 .63
.49
.50 .43
.51 .53
.53 .48
.50 .56
.51 .60
.51 .57
.60 .64
.64 .67
.76 .82
.73 .77
.73 .76
.72 .79
.72 .79
.68 .79
.69 .79
.64 .73
.67 .71
.67 .72
.66 .73
.58 .60
.58 .63
.64 .70
.67 .73
.67 .68
7
.61
.63
.60
.58
.63
.59
.49
.55
.60
.64
.61
.61
.64
.82
.79
.79
.79
.79
.77
.79
.73
.73
.76
.67
.64
.67
.70
.73
.70
8 9
.63 .67
.58 .63
.64 .66
.67 .70
.64 .65
.65 .63
.63 .67 .64
.51
.49 .48
.53 .58
.51 .56
.65 .63
.71 .65
.72 .79
.75 .68
.77 .76
.76 .72
.76 .72
.76 .69
.76 .68
.67 .64
.70 .68
.69 .65
.70 .66
.60 .62
.61 .60
.69 .61
.72 .64
.73 .61
10 11 12 13
.65 .68 .68 .72
.60 .67 .67 .71
.63 .67 .67 .72
.69 .71 .71 .75
.63 .65 .65 .70
.67 .69 .68 .72
.70 .72 .70 .70
.63 .66 .64 .73
.62 .68 .67 .72 .45 .46 .68
.24 .32 '.71
.26 .13 .69
.58 .62 .59
.60 .61 .61 .37
.72 .70 ' .70 .76
.68 .70 .70 .70
.70 .70 .70 .79
.67 .67 .67 .79
.67 .67 .67 .79
.67 .66 .66 .77
.66 .67 .67 .77
.58 .60 .63 .67
.64 .67 .64 .67
.55 .59 .59 .59
.65 .64 .64 .73
.52 .52 .52 .58
.57 .55 .55 .64
.64 .64 .64 .69
.65 .65 .65 .76
.67 .67 .67 .76
In the former, the most distant division separates a cluster containing H. regilla and H. cadaverina and one containing the remaining taxa in group A. Of those latter taxa, P. ornata, P. s. streckeri, and P. s. illinoensis form one cluster; H. crucifer, L. ocularis, and the remaining Pseudacris taxa form another cluster. Within group B, the most distant taxon is H. arborea. The other taxa form two large subgroups: one contains H. andersoni, H. a. avivoca, H. a. ogechiensis, H. chrysosceIis, H. versicolor, and H. japonica; the other contains the remaining taxa in group B. Within the former subgroup, H. japonica is the most distant taxon; H. andersoni clusters with H. a. avivoca and H. a. ogechiensis; that cluster, in turn, joins one containing H. versicolor and H. chrysoscelis. In the other subgroup of gr,Oup B, H. meridionalis is the most distant taxon; H. eximia and H. arenicolor form a
cluster and join with another cluster containing H. femoralis, Acris (crepitans and gryll1-Js), and a unit containing H. squirella, H. gratiosa, and H. cinerea.
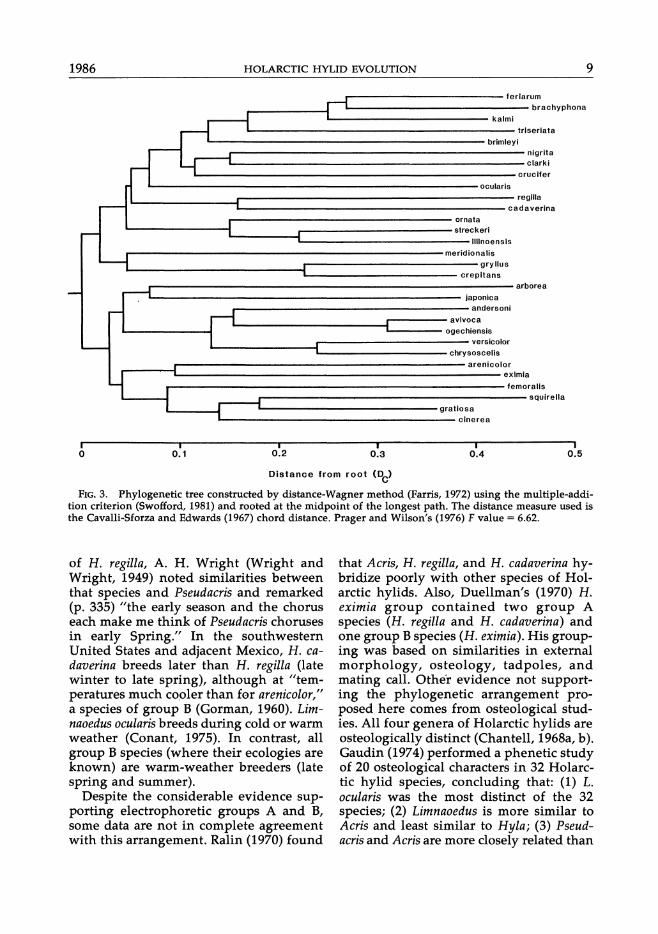
The phylogenetic tree produced by the distance-Wagner method (Fig. 3) is similar overall to the UPGMA tree (Fig. 2), yet it differs in a few details. Group A defined in the UPGMA tree now includes a subgroup containing H. meridionalis and the two species of Acris. In the optimized version of this tree (not shown), the topology is identical except that these three species are in Group B. Another difference between Figures 2 and 3 is that the branching order of the cluster containing H. cadaverina and H. regilla and the one containing P. s. streckeri, P. s. illinoensis, and P. ornata is reversed. Also, H. crucifer clusters with P. nigrita and P. clarki in Figure 3; P. t. feriarum clusters with P. brachy-
1986 HOLARCTIC HYLID EVOLUTION 7
TABLE 2. Continued.
14 15 16 17 18 19 20 21 22 23 24 25 26 27 28 29 30
.72 .80 .78 .77 .78 .78 .78 .78 .74 .75 .75 .75 .70 .70 .73 .75 .75
.72 .80 .76 .77 .77 .77 .78 .77 .71 .72 .72 .75 .70 .70 .74 .75 .74
.72 .80 .78 .78 .78 .78 .78 .78 .74 .75 .75 .75 .70 .70 .74 .75 .75
.75 .81 .80 .80 .80 .80 .80 .80 .75 .76 .78 .75 .72 .72 .74 .77 .77
.72 .78 .77 .77 .76 .76 .74 .75 .72 .74 .74 .73 .68 .68 .72 .74 .74
.74 .81 .79 .79 .80 .80 .80 .80 .77 .76 .76 .77 .70 .71 .75 .77 .74
.72 .81 .80 .80 .80 .80 .79 .80 .77 .77 .78 .74 .72 .74 .75 .77 .75
.76 .76 .78 .79 .79 .79 .78 .78 .74 .75 .75 .75 .70 .70 .75 .77 .77
.73 .80 .74 .78 .76 .76 .75 .74 .72 .74 .73 .73 .71 .70 .70 .72 .70
.70 .76 .74 .75 .74 .74 .74 .73 .69 .72 .67 .73 .65 .68 .72 .73 .74
.70 .75 .75 .75 .74 .74 .73 .74 .70 .74 .69 .72 .65 .67 .72 .73 .. 74
.70 .75 .75 .75 .74 .74 .73 .74 .71 .72 .69 .72 .65 .67 .72 .73 .74
.55 .78 .75 .80 .80 .80 .79 .79 .74 .74 .69 .77 .69 .72 .75 .78 .78 .80 .77 .78 .78 .78 .78 .78 .75 .75 .74 .75 .75 .75 .77 .78 .77
.79 .68 .72 .72 .72 .71 .72 .68 .72 .70 .74 .71 .72 .72 .74 .74
.73 .58 .69 .67 .67 .65 .63 .71 .67 .71 .75 .69 .68 .70 .67 .70
.76 .64 .58 .46 .45 .50 .49 .74 .71 .74 .68 .72 .73 .72 .66 .68
.76 .65 .55 .26 .11 .49 .47 .72 .69 .72 .70 .74 .74 .72 .67 .68
.76 .64 .55 .25 .02 .49 .47 .73 .70 .72 .70 .74 .74 .72 .67 .68
.76 .63 .52 .31 .30 .30 .28 .72 .69 .69 .69 .69 .69 .68 .64 .66
.76 .64 .49 .30 .27 .27 .10 .72 .68 .68 .68 .67 .67 .67 .62 .65
.70 .58 .63 .67 .65 .65 .64 .64 .72 .67 .70 .67 .65 .67 .67 .68
.70 .64 .55 .62 .59 .60 .59 .57 .64 .62 .61 .64 .65 .65 .66 .67
.67 .61 .62 .67 .64 .64 .59 .58 .55 .47 .70 .65 .69 .70 .69 .67
.70 .67 .70 .58 .61 .61 .59 .58 .61 .46 .61 .63 .63 .57 .59 .63
.69 .61 .58 .64 .67 .67 .58 .55 .55 .50 .52 .49 .32 .56 .59 .67
.70 .64 .58 .66 .67 .67 .58 .55 .52 .53 .58 .49 .13 .55 .57 .61
.73 .64 .61 .64 .64 .64 .58 .55 .55 .52 .61 .40 .39 .37 .45 .54
.76 .67 .56 .54 .55 .55 .51 .47 .55 .54 .59 .43 .43 .40 .25 .45
.73 .67 .61 .58 .58 .58 .53 .52 .58 .55 .56 .49 .55 .46 .37 .25
phona, instead of P. t. kalmi. In group B, the known to be relatively constant, the only difference is that H. arborea now clus- UPGMA tree (Fig. 2) might be a better ters, although distantly, with H. japonica. "species tree" even though it is not the
Prager and Wilson's (1976) F values for best "gene tree" (Nei et ai., 1983). In fact, each of the three trees are: UPGMA of D A the evenness of branch lengths in Figure (Fig. 2), 6.70; UPGMA of D (not shown), 3 suggests that the rate of protein evolu-12.7; unoptimized distance-Wagner (Fig. tion, among lineages of this group, is not 3), 6.62; optimized distance-Wagner (not highly variable. shown), 2.03. Thus, the UPGMA tree (Fig.
DISCUSSION 2) and the un optimized distance-Wagner tree (Fig. 3) have virtually identical fit Two major groups of Holarctic hylid measures but the best-fit tree is the opti- frogs are indicated by the electrophoretic mized distance-Wagner. Of the two data. Although the positions of A. crepi-UPGMA trees, the one using D A values tans, A. gryllus, and H. meridionalis are un-(Fig. 2) has a considerably better fit than clear, all other Holarctic species can be the one using D values, yet they are iden- placed in one of the two groups by genetic tical in topology. Although the distance- distance data analyzed both phenetically Wagner tree has the best fit, it may not be (Fig. 2) and cladistically (Fig. 3). In addi-the best estimate of the evolution of this tion to electrophoretic data, these two group using electrophoretic data. If the rate groups (A and B) are distinctive in other of' protein evolution in hylid frogs was ways. Albumin immunological data iden-
8 SYSTEMATIC ZOOLOGY VOL. 35
~
'---
0.8
~ I
"--
1-t I
i 0.6
i 0.4
I
i 0.2
i 0
feriarum kalmi brachyphona trlserlata brimleyl nigrita
clarki crucifer ocularls ornata streckerl IIlInoensis reg ilia
cadaverina arborea japonjca
andersonl avivoca ogechlensls
versicolor chrysoscelis meridlonalls arenicolor
exlmla femoralis gryllus crepitans squirella gratiosa cinerea
FIG. 2. Phylogenetic tree constructed by UPGMA clustering of modified Cavalli-Sforza distances. Prager and Wilson's (1976) F value = 6.70.
tify H. crucifer, H. regilla, and H. cadaverina as being closer to Pseudacris species than to other Hyla (Maxson and Wilson, 1975). Also, Mecham (1965) and Ralin (1970) both found that H. crucifer hybridizes more readily with Pseudacris than with other Holarctic Hyla. Karyotypically, H. crucifer has secondary constrictions and arm ratios unique to Pseudacris and not found in southeastern Hyla (Wiley, 1982). In addition, the mating calls of H. crucifer and Limnaoedus ocularis are similar to the calls of some species of Pseudacris (Blair, 1958).
Most group A species have relatively small digital pads and possess spherical (or ovoid) testes surrounded by darkly pigmented peritoneum (Ralin, 1970), whereas nearly all group B species have large digit~l pads and elongate, white or yellowish testes. The exceptions in group A are H.
cadaverina, H. crucifer, and H. regilla, all of whi~h have digital pads that are intermediate in size. The only exceptions in group Bare H. eximia (intermediate digital pads), H. meridionalis (ovoid dark testes), and Acris (small digital pads and spherical, dark testes). Although some individuals of H. avivoca have dark testes (K. Anderson, pers. comm.), they are elongate like other group B species and are white in other individuals. Testes of some other hylid species related to the Holarctic assemblage but not included in this study (Anotheca spinosa, H. euphorbiacea, H. plicata, and H. savignyi) are elongate and white.
Finally, there are ecological similarities which link the species in each of these two groups. Nearly all group A species are terrestrial and breed during cold weather (winter and early spring). In his account
1986
i o
HOLARCTIC HYLID EVOLUTION
,------------ feriarum '-------------- brachyphona ,-----lr----L -========== kalmi '-------------------- trlserlata '---------------------- brlmleyi ,---------------------- nigrlta '--____________________ clarki
'--______________________ crucifer
'------------------------ ocularis
L-------C==================::, regilla cadaverlna
r----------------- ornata L ------'""1 ____ --{===========s~tr:eckeri IIl1noensls ,------------------------meridionalis
l------------C==========:::~ gryllus crepitans
r--------------------------- arborea '----------------------- japonlca ,..-________________ anderson I L __________ -[===~ avivoca ogechlensls
L-------C========::~ versicolor chry soscells
arenicolor exlmla ...------------------------femoralls r __ -c============:-;::::;----SQUirelia
L ___ L __ =============-g~r:at1osa cinerea
I 0.1
I 0.2
I 0.3
Distance from root (DC>
I 0.4
i 0.5
9
FIG. 3. Phylogenetic tree constructed by distance-Wagner method (Farris, 1972) using the multiple-addition criterion (Swofford, 1981) and rooted at the midpoint of the longest path. The distance measure used is the Cavalli-Sforza and Edwards (1967) chord distance. Prager and Wilson's (1976) F value = 6.62.
of H. regilla, A. H. Wright (Wright and Wright, 1949) noted similarities between that species and Pseudacris and remarked (p. 335) "the early season and the chorus each make me think of Pseudacris choruses in early Spring." In the southwestern United States and adjacent Mexico, H. cadaverina breeds later than H. regilla (late winter to late spring), although at "temperatures much cooler than for arenicolor," a species of group B (Gorman, 1960). Limnaoedus ocularis breeds during cold or warm weather (Conant, 1975). In contrast, all group B species (where their ecologies are known) are warm-weather breeders (late spring and summer).
Despite the considerable evidence supporting electrophoretic groups A and B, some data are not in complete agreement with this arrangement. Ralin (1970) found
that Acris, H. regilla, and H. cadaverina hybridize poorly with other species of Holarctic hylids. Also, Duellman's (1970) H. eximia group contained two group A species (H. regilla and H. cadaverina) and one group B species (H. eximia). His grouping was based on similarities in external morphology, osteology, tadpoles, and mating call. Othe"r evidence not supporting the phylogenetic arrangement proposed here comes from osteological studies. All four genera of Holarctic hylids are osteologically distinct (Chantell, 1968a, b). Gaudin (1974) performed a phenetic study of 20 osteological characters in 32 Holarctic hylid species, concluding that: (1) L. ocularis was the most distinct of the 32 species; (2) Limnaoedus is more similar to Acris and least similar to Hyla; (3) Pseudacris and Acris are more closely related than
10 SYSTEMATIC ZOOLOGY VOL. 35
0" o 00
000
0.5
Nel genetic distance
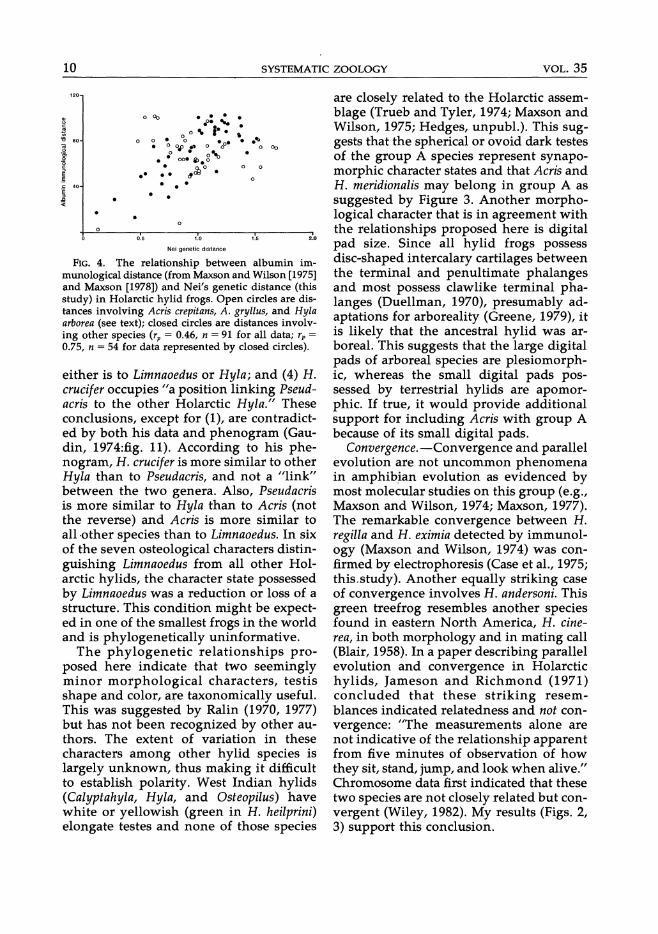
FIG. 4. The relationship between albumin immunological distance (from Maxson and Wilson [1975] and Maxson [1978]) and Nei's genetic distance (this study) in Holarctic hylid frogs. Open circles are distances involving Acris crepitans, A. gryllus, and HyZa arborea (see text); closed circles are distances involving other species (rp = 0.46, n = 91 for all data; rp = 0.75, n = 54 for data represented by closed circles).
either is to Limnaoedus or Hyla; and (4) H. crucifer occupies "a position linking Pseudacris to the other Holarctic Hyla." These conclusions, except for (1), are contradicted by both his data and phenogram (Gaudin, 1974:fig. 11). According to his phenogram, H. crucifer is more similar to other Hyla than to Pseudacris, and not a "link" between the two genera. Also, Pseudacris is more similar to Hyla than to Acris (not the reverse) and Acris is more similar to all·other species than to Limnaoedus. In six of the seven osteological characters distinguishing Limnaoedus from all other Holarctic hylids, the character state possessed by Limnaoedus was a reduction or loss of a structure. This condition might be expected in one of the smallest frogs in the world and is phylogenetically uninformative.
The phylogenetic relationships proposed here indicate that two seemingly minor morphological characters, testis shape and color, are taxonomically useful. This was suggested by Ralin (1970, 1977) but has not been recognized by other authors. The extent of variation in these characters among other hylid species is largely unknown, thus making it difficult to establish polarity. West Indian hylids (Calyptahyla, Hyla, and Osteopilus) have white or yellowish (green in H. heilprini) elongate testes and none of those species
are closely related to the Holarctic assemblage (Trueb and Tyler, 1974; Maxson and Wilson, 1975; Hedges, unpubl.). This suggests that the spherical or ovoid dark testes of the group A species represent synapomorphic character states and that Acris and H. meridionalis may belong in group A as suggested by Figure 3. Another morphological character that is in agreement with the relationships proposed here is digital pad size. Since all hylid frogs possess disc-shaped intercalary cartilages between the terminal and penultimate phalanges and most possess clawlike terminal phalanges (Duell man, 1970), presumably adaptations for arboreality (Greene, 1979), it is likely that the ancestral hylid was arboreal. This suggests that the large digital pads of arboreal species are plesiomorphic, whereas the small digital pads possessed by terrestrial hylids are apomorphic. If true, it would provide additional support for including Acris with group A because of its small digital pads.
Convergence.-Convergence and parallel evolution are not uncommon phenomena in amphibian evolution as evidenced by most molecular studies on this group (e.g., Maxson and Wilson, 1974; Maxson, 1977). The remarkable convergence between H. regilla and H. eximia detected by immunology (Maxson and Wilson, 1974) was confirmed by electrophoresis (Case et al., 1975; this.study). Another equally striking case of convergence involves H. andersoni. This green treefrog resembles another species found in eastern North America, H. cinerea, in both morphology and in mating call (Blair, 1958). In a paper describing parallel evolution and convergence in Holarctic h y lids, Jameson and Richmond (1971) concluded that these striking resemblances indicated relatedness and not convergence: "The measurements alone are not indicative of the relationship apparent from five minutes of observation of how they sit, stand, jump, and look when alive." Chromosome data first indicated that these two species are not closely related but convergent (Wiley, 1982). My results (Figs. 2, 3) support this conclusion.
1986 HOLARCTIC HYLID EVOLUTION 11
The morphological similarity among the Palearctic species (arborea, japonica, and meridionaIis), although not as striking, is indicated by the fact that all three were considered conspecific until relatively recently (Ralin, 1970, 1977). The results presented here show that these three species are not closely related to each other or to other Holarctic hylids (albumin immunological data [Maxson, 1978] indicate a closer relationship between H. arborea and H. japonica). In general, the independence of morphological and molecular evolution (Wilson et al., 1977) suggests that many more cases of convergence and parallel evolution will be found as additional groups are studied using molecular techniques.
Taxonomic implications. -Several taxonomic changes are necessary to produce a classification of Holarctic hylid frogs that is in closer agreement with their phylogenetic relationships proposed here. Hyla cadaverina, H. crucifer, H. regilla, and L. ocularis are all transferred to the genus Pseudacris, which now corresponds to group A. The type species of Hyla is arborea (Duellman, 1970:173) and, thus, group B species retain that generic name. Since the exact relationship of Acris and H. meridionalis to other Holarctic hylids is unclear, no taxonomic change is proposed here for those taxa.
These taxonomic changes do not solve all of the problems of paraphyly (or polyphyly) in the genus Hyla. There are many additional species of Hyla in Middle and South America that are not closely related to the Holarctic assemblage (Duellman, 1970; Maxson and Wilson, 1975). Also, Maxson and Wilson (1975) and Maxson (1977) found that several genera of Middle American hylids are closely related to the Holarctic hylids. These include Anotheca, Nyctimantis, Plectrohyla, and several species of Hyla (elaeochroa, hazalae, pseudopuma, siopela, and staufferi). Most of these species appear to form a group on the basis of immunological data but their exact relationship to the Holarctic hylids must await further studies.
Within Pseudacris, the two currently recognized species groups (Mecham, 1965) are supported by this study: the ornata group includes ornata and streckeri; and the nigrita group includes brachyphona, brimleyi, clarki, feriarum, nigrita, and triseriata. In addition, I propose that the following three groups be added: the crucifer group, containing Pseudacris crucifer (new comb.); the ocularis group, containing Pseudacris ocularis; and the regilla group, containing Pseudacris cadaverina (new comb.) and Pseudacris regilla (new comb.). Ralin's'(1970) recognition of feriarum as a full species is supported by my electrophoretic data. My findings also suggest that illinoensis and kalmi warrant recognition as full species, but that decision must await detailed studies on geographic variation within streckeri and feriarum. However, since kalmi is geographically and genetically more similar to feriarum than to triseriata, it should be tentatively recognized as a subspecies of the former species: Pseudacris feriarum kalmi (new comb.).
Within Holarctic Hyla, there is disagreement as to the number and composition 'of the species groups (Blair, 1958; Duellman, 1970; Ralin, 1970, 1977; Jameson and Richmond, 1971; Maxson, 1978; Wiley, 1982). Nonetheless, there is general agreement that: the cinerea group contains at least cinerea, gratiosa, and squirella; and the versicolor group contains at least avivoca, chrysoscelis, and versicolor. The electrophoretic data are in agreement with these "core" groups but suggest some changes. Hyla femoraIis is here considered a distant member of the cinerea group, and the inclusion of andersoni in the versicolor group by Wiley (1982) is supported. A Palearctic species, japonica, is here considered a distant member of the versicolor group. No evidence was found for including arenicolor with the versicolor group (Blair, 1958) but, instead, I consider it a member of the eximia group which now includes arenicolor, eximia, euphorbiacea, plicata, and walkeri. The last three species were not examined in this study but euphorbiacea was shown to be closely related to eximia by Maxson
12 SYSTEMATIC ZOOLOGY VOL. 35
10
5
o I. 1-4 5-8 9-12 13-16 17-20 21-24 25-28
Alleles per locus
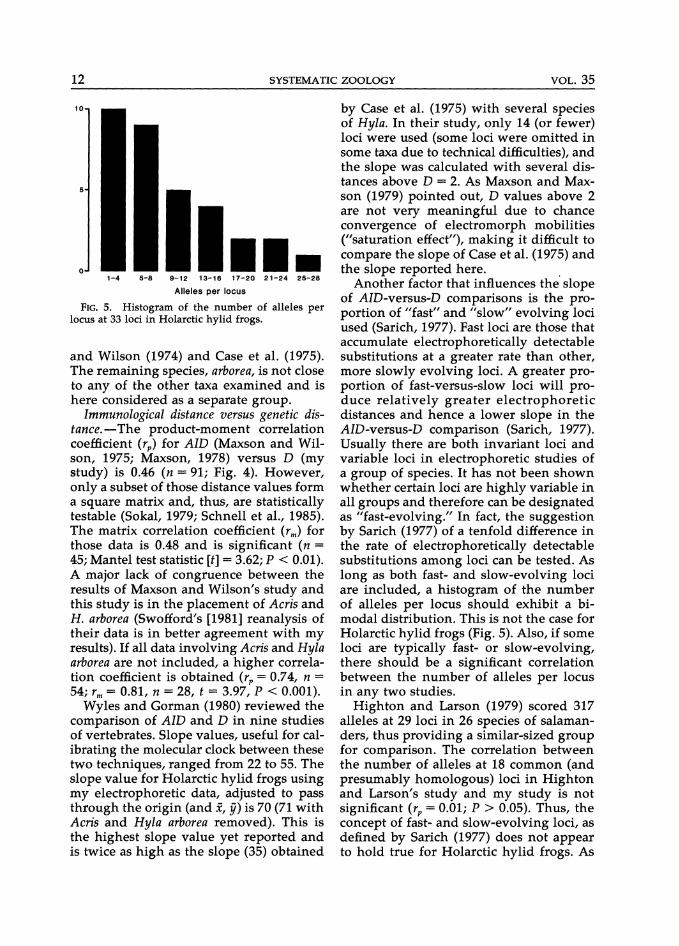
FIG. 5. Histogram of the number of alleles per locus at 33 loci in Holarctic hylid frogs.
and Wilson (1974) and Case et al. (1975). The remaining species, arborea, is not close to any of the other taxa examined and is here considered as a separate group.
Immunological distance versus genetic distance. - The product-moment correlation coefficient (rp) for AID (Maxson and Wilson, 1975; Maxson, 1978) versus D (my study) is 0.46 (n = 91; Fig. 4). However, only a subset of those distance values form a square matrix and, thus, are statistically testable (Sokal, 1979; Schnell et al., 1985). The matrix correlation coefficient (r m) for those data is 0.48 and is significant (n = 45; Mantel test statistic [t] = 3.62; P < 0.01). A major lack of congruence between the results of Maxson and Wilson's study and this study is in the placement of Acris and H. arborea (Swofford's [1981] reanalysis of their data is in better agreement with my results). If all data involving Acris and Hyla arborea are not included, a higher correlation coefficient is obtained (rp = 0.74, n = 54; rm = 0.81, n = 28, t = 3.97, P < 0.001).
Wyles and Gorman (1980) reviewed the comparison of AID and D in nine studies of vertebrates. Slope values, useful for calibrating the molecular clock between these two techniques, ranged from 22 to 55. The slope value for Holarctic hylid frogs using my electrophoretic data, adjusted to pass through the origin (and X, y) is 70 (71 with Acris and Hyla arborea removed). This is the highest slope value yet reported and is twice as high as the slope (35) obtained
by Case et al. (1975) with several species of Hyla. In their study, only 14 (or fewer) loci were used (some loci were omitted in some taxa due to technical difficulties), and the slope was calculated with several distances above D = 2. As Maxson and Maxson (1979) pointed out, D values above 2 are not very meaningful due to chance convergence of electromorph mobilities ("saturation effect"), making it difficult to compare the slope of Case et al. (1975) and the slope reported here. .
Another factor that influences the slope of AID-versus-D comparisons is the proportion of "fast" and "slow" evolving loci used (Sarich, 1977). Fast loci are those that accumulate electrophoretically detectable substitutions at a greater rate than other, more slowly evolving loci. A greater proportion of fast-versus-slow loci will produce relatively greater electrophoretic distances and hence a lower slope in the AID-versus-D comparison (Sarich, 1977). Usually there are both invariant loci and variable loci in electrophoretic studies of a group of species. It has not been shown whether certain loci are highly variable in all groups and therefore can be designated as "fast-evolving." In fact, the suggestion by Sarich (1977) of a tenfold difference in the rate of electrophoretically detectable substitutions among loci can be tested. As long as both fast- and slow-evolving loci are included, a histogram of the number of alleles per locus should exhibit a bimodal distribution. This is not the case for Holarctic hylid frogs (Fig. 5). Also, if some loci are typically fast- or slow-evolving, there should be a significant correlation between the number of alleles per locus in any two studies.
Highton and Larson (1979) scored 317 alleles at 29 loci in 26 species of salamanders, thus providing a similar-sized group for comparison. The correlation between the number of alleles at 18 common (and presumably homologous) loci in Highton and Larson's study and my study is not significant (rp = 0.01; P > 0.05). Thus, the concept of fast- and slow-evolving loci, as defined by Sarich (1977) does not appear to hold true for Holarctic hylid frogs. As
1986 HOLARCTIC HYLID EVOLUTION 13
a result, the high slope value (70) for AIDversus-D in this study is not "adjustable" by computing the proportion of these loci used since fast- and slow-evolving loci cannot be identified. Instead, it is an indication that substitution rates, as measured by electrophoresis or microcomplement fixation (or both) differ among groups studied. As long as these differences occur among groups and not within groups, methods of analysis that assume rate constancy (UPGMA) may still prove useful.
Molecular clock estimates of divergence times.-If the molecular-clock hypothesis (Wilson et al., 1977; Thorpe, 1982) is in large part correct, it can be used to date divergence events in the evolutionary history of Holarctic hylid frogs. However, such a clock needs calibration. N ei (1972) originally suggested a calibration of 1 D = 5 Myr. In plethodontid salamanders, 1 D = 14 Myr has generally been used based on a calibration with the albumin clock (Maxson and Maxson, 1979). Smith and Coss (1984) calibrated the electrophoretic clock in ground squirrels based on fossil and geologic information at 1 D = 6.8 Myr. Thorpe (1982) reviewed studies pertaining to the molecular clock hypothesis and arrived at an average calibration of 1 D = 18.9 Myr. Considering the diversity of calibrations and the evidence that individual protein loci evolve at different rates in different groups, this last electrophoretic calibration should not be used unless other data are unavailable. Although it is rare that the fossil record is complete enough to establish an exact date of divergence of two lineages, the first occurrence of those two lineages in an incomplete fossil record provides a minimum estimate of the time of their separation. The fossil record for most amphibians is poor, but some fossil hylids exist that allow a rough calibration to be made. Chantell (1964) described a diverse hylid fauna from the MiocenePliocene boundary (approximately 5 million years ago) in Nebraska that includes fossils assigned to H. cinerea, H. gratiosa, and H. squirella. The lineages leading to these three species are distinct at a D of
0.25 (the divergence of H. squirella and H. gratiosa). If this D value corresponds to 5 Myr based on the hylid fossil record, then the electrophoretic clock is calibrated at 1 D = 20 Myr. This calibration is obviously a conservative estimate since the actual divergence occurred prior to the MiocenePliocene boundary.
Another independent calibration can be made using the albumin clock (Sarich and Wilson, 1967). Albumin immunological distance has been shown to be roughly correlated with divergence time in several groups of animals (Carlson et al., 1978). One AID corresponds to approximately 0.6 Myr. If albumin evolution is relatively constant among groups (Maxson et al., 1975), then the albumin clock may be used to calibrate the electrophoretic clock. Using the slope value (70) of the AIDversus-D relationship in hylid frogs (Fig. 4),1 D corresponds to about 42 Myr. This is more than twice the value obtained by calibration with the fossil record. The difference in these two independent estimates is not unreasonable considering that the fossil Hyla used in the first calibration probably diverged a considerable amount of time before they were preserved as recognizable species in the fossil record. Using the albumin calibration (1 D = 42 Myr) as a rough approximation, and the hylid fossil calibration (1 D = 20 Myr) as a minimu~ estimate, it appears that the divergence of the two major groups of Holarctic hylids probably occurred by the early Eocene (50 Myr ago) but no later than the mid-Oligocene (27 Myr ago). There are no other hylid fossils that have a direct bearing on the time of this divergence. Fossil Acris, Hyla, and an "intermediate" genus, Proacris, are known from the lower Miocene (22 Myr ago) of Florida (Holman, 1967). If the fossil Hyla from that site represents a Holarctic lineage, then the divergence of Acris and Holarctic Hyla must have occurred prior to that time. These findings are in agreement with Hecht (1963), who postulated (based on limited fossil evidence) that most genera of living frogs were probably present in the early Tertiary.
14 SYSTEMATIC ZOOLOGY VOL. 35
Two adaptive radiations.-Adaptive radiations are believed to occur when a large number of ecological niches suddenly become available and are then rapidly filled by the descendents of a single lineage through adaptation (Romer, 1966). Relative to other hylid groups, the Holarctic assemblage lacks diversity (Duellman, 1970) but nonetheless can be viewed as representing two adaptive radiations.
Larson et al. (1981) used molecular data to show that two "key innovations" appeared during a relatively short period of time preceding the radiation of the salamander genus Aneides. Likewise, the two major features that distinguish Pseudacris from Holarctic Hyla, small digital pad size and cold-weather breeding, probably evolved in a short period of time relative to the duration of the group. The early divergence of the regilla and ornata groups (Figs. 2, 3) and the fact that both groups have species with reduced digital pads and cold-weather breeding provides support for that view.
Hylid frogs are believed to have originated in the New World tropics (Duellman, 1970) and, thus, it is likely that warm-weather breeding was the ancestral condition. Cold-weather breeding does not appear to be linked to any major morphological trait although it has probably been accompanied by a number of physiological adaptations. Several species of the anuran genera Bufo and Rana have also adapted to cold-weather breeding. This dichotomy in breeding time (winter / early spring versus late spring/summer) has resulted in two distinct anuran larval communities (Wilbur, 1980). Species belonging to the cold-weather community are adapted for growth and development at lower temperatures than species belonging to the warm-weather community. Density independent mortality due to freezing of the eggs can be important in the cold-weather community, whereas drought may be a problem in the warmweather community (Wilbur, 1980). Studies have shown that competition and predation can have significant effects on the structure of anuran larval communities
(Wilbur, 1980, 1982; Morin, 1981, 1983; Wilbur et al., 1983). Pseudacris are smaller, on the average, than Holarctic Hyla and have relatively small larvae. Also, at least one species, P. crucifer, is a poor competitor with other sympatric anuran species (Morin, 1983). Thus, cold-weather breeding may have allowed Pseudacris to escape from interspecific competition during the larval stage. Also, the preference for shallow ponds or ditches for breeding instead of deeper and more permanent bodies of water may have been a way of reducing interspecific competition with other coldweather breeding anurans, as well as a way of avoiding predation by invertebrates (Smith, 1983). Ambystomatid salamander larvae are the major predators of the coldweather community, whereas invertebrate predation is strongest in the warm-weather community (Wilbur, 1980). Natricine snakes are also predators on anurans and their larvae (Whitaker, 1971; Wassersug and Sperry, 1977; Wilbur et al., 1983). The early emergence and explosive breeding of Pseudacris may be an adaptation to reduce snake predation on adult frogs.
The semiaquatic habits of Acris represent a third lifestyle found in Holarctic hylids. The major morphological innovation associated with this lifestyle is the presence of webbing between the toes. Unlike Holarctic Hyla and Pseudacris, Acris apparently did not undergo an adaptive radiation as it is represented by only two closely related extant species.
ACKNOWLEDGMENTS
The following persons generously provided assistance in the field or supplied specimens: Karen Anderson, James Bogart, Stephen Busack, Clay Corry, Herndon Dowling, Richard Franz, John Grameiri, Richard Highton, Jeremy Jacobs, David Jameson, Jan Jenner, Ronald Kassof, Lisa Levinson, Loren Moehn, Paul Moler, Barbara Pytell, Ray Semlitsch, and Sam Sweet. Samples of H. arenicolor and H. eximia were obtained from the frozen tissue collection at the Museum of Vertebrate Zoology (University of California at Berkeley) through the courtesy of David Wake. James Bogart, Jerry Coyne, Douglas Gill, Carla Hass, Richard Highton, Linda Maxson, Charles Mitter, Gary Schnell, and David Swofford offered many helpful suggestions. I especially thank Richard Highton for advice, encouragement, and the use of his electro-
1986 HOLARCTIC HYLID EVOLUTION 15
phoresis laboratory. Financial support was provided by the Computer Science Center of the University of Maryland, Sigma Xi, and the National Science Foundation (Grants DEB-79-03858, DEB-81-17983, and BSR 83-07115 to Richard Highton). This paper is adapted from a thesis submitted to the University of Maryland in partial fulfillment of the Master of Science degree.
REFERENCES
BLAIR, W. F. 1958. Call structure and species groups in U.S. treefrogs (Hyla). Southwest. Nat., 3:77-89.
BOGART, J. P. 1973. Evolution of anuran karyotypes. Pages 337-349 in Evolutionary biology of the anurans: Contemporary research on major problems 0. 1. Vial, ed.). Univ. Missouri Press, Columbia.
BUTH, D. G., AND R W. MURPHY. 1980. Use of nicotinamide adenine dinucleotide (NAD)-dependent glucose-6-phosphate dehydrogenase in enzyme staining procedures. Stain Techno1., 55:173-176.
CARLSON, S. S., A. C. WILSON, AND R D. MAXSON. 1978. Do albumin clocks run on time? Science, 200:1183-1185.
CASE, S. M., P. G. HANELINE, AND M. F. SMITH. 1975. Protein variation in several species of Hyla. Syst. Zoo1.,24:281-295.
CAVALLI-SFORZA, 1. 1., AND A. W. F. EDWARDS. 1967. PhylogenetiC analysis: Models and estimation procedures. Evolution, 21:550-570.
CHANTELL, C. J. 1964. Some Mio-Pliocene hylids from the Valentine formation of Nebraska. Am. Nat., 72:211-225.
CHANTELL, C. J. 1968a. The osteology of Acris and Limnaoedus (Amphibia: Hylidae). Am. Midland Nat., 79:169-182.
CHANTELL, C. J. 1968b. The osteology of Pseudacris. Am. Midland Nat., 80:381-391.
CONANT, R 1975. A field gUide to reptiles and amphibians of eastern and central North America. Houghton Mifflin Co., Boston.
DUELLMAN, W. E. 1970. The hylid frogs of Middle America. Monogr. Mus. Nat. Hist., Univ. Kansas, No.1 (2 vols.).
FARRIS, J. S. 1972. Estimating phylogenetic trees from distance matrices. Am. Nat., 106:645-668.
FARRIS, J. S. 1981. Distance data in phylogenetic analysis. Pages 3-24 in Advances in cladistics (V. A. Funk and D. R Brooks, eds.). Proceedings of the first meeting of the Willi Hennig Society. New York Botanical Garden, New York.
FELSENSTEIN, J. 1984. Distance methods for inferring phylogenies: A justification. Evolution, 38:16-24.
FITCH, W. M., AND E. MARGOLIASH. 1967. Construction of phylogenetiC trees. Science, 155:276-284.
FROST, D. R. 1985. Amphibian species of the world. Assoc. Systematics Collections, Lawrence, Kansas.
GAUDIN, A. J. 1974. An osteological analysis of Holarctic tree frogs, family Hylidae. J. Herpeto1., 8: 141-152.
GORMAN, G. c., AND J. RENZI, JR. 1979. Genetic distance and heterozygosity estimates in electropho-
retic studies: Effects of sample size. Copeia, 1979: 242-249.
GORMAN, J. 1960. Treetoad studies, 1. Hyla californiae, new species. Herpetologica, 16:214-222.
GREENE, D. M. 1979. Treefrog toepads: Comparative surface morphology using scanning electron microscopy. Can. J. Zoo1., 57:2033-2046.
HARRIS, H., AND D. A. HOPKINSON. 1976. Handbook of enzyme electrophoresis in human genetics. North Holland Publishing, Amsterdam, The Netherlands.
HECHT, M. K. 1963. A reevaluation of the early history of the frogs. Part II. Syst. Zoo1., 12:20-35.
HENDERSON, N. S. 1965. Isozymes of isocitrate dehydrogenase: Subunit structure and intracellular location. J. Exp. Zoo1., 158:263-274. .
HIGHTON, R, AND A. LARSON. 1979. The genetic relationships of the salamanders of the genus Plethodon. Syst. Zoo1., 28:579-599.
HOLMAN, J. A. 1967. Additional Miocene anurans from Florida. J. Florida Acad. Sci., 30:121-140.
JAMESON, D. 1., AND R C. RICHMOND. 1971. Parallelism and convergence in the evolution of size and shape in Holarctic Hyla. Evolution, 25:497-508.
LARSON, A., D. B. WAKE, 1. R MAXSON, AND R HIGHTON. 1981. A molecular phylogenetic perspective on the origins of morphological novelties in the salamanders of the tribe Plethodontini (Amphibia, Plethodontidae). Evolution, 35:405-422.
MACGREGOR, H. c., H. HORNER, C. A. OWEN, AND I. PARKER. 1973. Observations on centromeric heterochromatin and satellite DNA in salamanders of the genus Plethodon. Chromosoma, 43:329-348.
MAXSON, L. R 1977. Immunological detection of convergent evolution in the frog Anotheca spinosa (Hylidae). Syst. Zoo1., 26:72-76.
MAXSON, L. R 1978. Immunological evidence pertaining to relationships between Old World Hyla arborea (Amphibia, Anura, Hylidae) and North American Hyla. J. Herpeto1., 12:98-100.
MAXSON, L. R, AND R D. MAXSON. 1979. Comparative albumin and biochemical evolution in plethodontid salamanders. Evolution, 33:1057-1062.
MAXSON, L. R, V. M. SARICH, AND A. C. WILSON. 1975. Continental drift and the use of albumin as an evolutionary clock. Science, 255:397-400.
MAXSON, L. R, AND A. C. WILSON. 1974. Convergent morphological evolution detected by studying proteins of tree frogs in the Hyla eximia species group. Science, 185:66-68.
MAXSON, L. R, AND A. C. WILSON. 1975. Albumin evolution and organismal evolution in tree frogs (Hylidae). Syst. Zoo1., 24:1-15.
MECHAM, J. S. 1965. Genetic relationships and reproductive isolation in southeastern frogs of the genera Pseudacris and Hyla. Am. Midland Nat., 74: 269-308.
MORIN, P. J. 1981. Predatory salamanders reverse the outcome of competition among three species of anuran tadpoles. Science, 212:1284-1286.
MORIN, P. J. 1983. Predation, competition, and the composition of larval anuran guilds. Eco1. Monogr., 53:119-138.
16 SYSTEMATIC ZOOLOGY VOL. 35
NEI, M. 1972. Genetic distance between populations. Am. Nat., 106:283-291.
NEI, M. 1978. Estimation of average heterozygosity and genetic distance from a small number of individuals. Genetics, 89:583-590.
NEI, M., F. TAJIMA, AND Y. TATENO. 1983. Accuracy of estimated phylogenetic trees from molecular data. J. Mol. Evol., 19:153-170.
NOMENCLATURE COMMITTEE OF THE INTERNATIONAL UNION OF BIOCHEMISTRY. 1979. Enzyme nomenclature 1978. Academic Press, New York.
PRAGER, E. M., AND A. C. WILSON. 1976. Congruency of phylogenies derived from different proteins. A molecular analysis of the phylogenetic position of cracid birds. J. Mol. Evol., 9:45-57.
RALIN, D. B. 1970. Genetic compatibility and a phylogeny of the temperate North American hylid fauna. Ph.D. Dissertation, Univ. Texas, Austin.
RALIN, D. B. 1977. Hybridization of Hyla cinerea of the United States and H. arborea savignyi (Amphibia, Anura, Hylidae) of Israel. J. Herpetol., 11: 105-106.
ROMER, A. S. 1966. Vertebrate paleontology. Univ. Chicago Press, Chicago.
SARICH, V. M. 1977. Rates, sample sizes, and the neutrality hypothesis for electrophoresis in evolutionary studies. Nature (Lond.), 265:24-28.
SARICH, V. M., AND A. C. WILSON. 1967. Immunological time scale for hominid evolution. Science, 158: 1200-'1203.
SAVAGE, J. M. 1973. The geographic distribution of frogs: Patterns and predictions. Pages 351-445 In Evolutionary biology of the anurans 0. 1. Vial, ed.). Univ. Missouri Press, Columbia.
SCHNELL, G. D., D. J. WATT, AND M. E. DOUGLAS. 1985. Statistical comparison of proximity matrices: Applications in animal behavior. Anim. Behav., 33: 239-253.
SELANDER, R K., M. H. SMITH, S. Y. YANG, W. E. JOHNSON, AND J. B. GENTRY. 1971. Biochemical polymorphism and systematics in the genus Peromyscus. I. Variation in the old-field mouse (Peromyscus polionotus). Studies in Genetics VI. Univ. Texas Publ., 7103:49-90.
SHAW, C. R, AND R PRASAD. 1970. Starch gel electrophoresis of enzymes-A compilation of recipes. Biochem. Genet., 4:297-320.
SIBLEY, C. G., AND J. E. AHLQUIST. 1984. The phylogeny of the hominoid primates, as indicated by DNADNA hybridization. J. Mol. Evol., 20:2-15.
SICILIANO, M. J., AND C. R SHAW. 1976. Chapter 8. Separation and visualization of enzymes on gels. Pages 185-209 in Chromatographic and electrophoretic techniques (I. Smith, ed.). Volume 2. Fourth edition. William Heinemann Medical Books, Ltd., London.
SMITH, D. C. 1983. Factors controlling tadpole populations of the chorus frog (Pseudacris triseriata) on Isle Royale, Michigan. Ecology, 64:501-510.
SMITH, D. G., AND R. G. Coss. 1984. Calibrating the molecular clock: Estimates of divergence made us,ing fossil and geological time markers. Mol. Biol. Evol., 1:249-259.
SNEATH, P. H. A., AND R R SOKAL. 1973. Numerical taxonomy. W. H. Freeman, San Francisco.
SOKAL, R R 1979. Testing statistical significance of geographic variation patterns. Syst. Zool., 28:227-232.
SWOFFORD, D. 1. 1981. On the utility of the distance Wagner procedure. Pages 25-43 in Advances in cladistics. Proceedings of the first meeting of the Willi Hennig Society (V. A. Funk and D. R Brooks, eds.). New York Botanical Garden, New York.
SWOFFORD, D. 1., AND R B. SELANDER. 1981. BIOSYS-l: A Fortran program for the comprehensive analysis of electrophoretic data in population genetics and systematics. J. Hered., 72:281-283.
TATENO, Y., M. NEI, AND F. TAJIMA. 1982. Accuracy of estimated phylogenetic trees from molecular data. I. Distantly related species. J. Mol. Evol., 18: 387-404.
THORPE, J. P. 1982. The molecular clock hypothesis: Biochemical evolution, genetic differentiation, and systematics. Annu. Rev. Ecol. Syst., 13:139-168.
TRUEB, 1., AND M. J. TYLER. 1974. Systematics and evolution of the Greater Antillean hylid frogs. Occas. Pap. Mus. Nat. Hist., Univ. Kansas, 24:1-60.
WASSERSUG, R J., AND D. G. SPERRY. 1977. The relationship of locomotion to differential predation on Pseudacris triseriata (Anura: Hylidae). Ecology, 58:830-839.
WEBSTER, T. P. 1973. Adaptive linkage disequilibrium between two esterase loci of a salamander. Proc. Natl. Acad. Sci. USA,70:1156-1160.
WHITAKER, J . .0., JR. 1971. A study of the western chorus frog, Pseudacris triseriata, in Vigo County, Indiana. J. Herpetol., 5:127-150.
WILBUR, H. M. 1980. Complex life cycles. Annu. Rev. Ecol. Syst., 11:67-93.
WILBUR, H. M. 1982. Competition between tadpoles of Hyla femoralis and H. gratiosa in laboratory experiments. Ecology, 63:278-282.
WILBUR, H. M., P. J. MORIN, AND R N. HARRIS. 1983. Salamander predation and the structure of experimental communities: Anuran responses. Ecology, 64:1423-1429.
WILEY, J. E. 1982. Chromosome banding patterns of tree frogs (Hylidae) of the eastern USA. Herpetologica, 38:507-520.
WILSON, A. c., S. S. CARLSON, AND T. J. WHITE. 1977. Biochemical evolution. Annu. Rev. Biochem., 46: 573-639.
WRIGHT, A. H., AND A. A. WRIGHT. 1949. Handbook of frogs and toads of the United States and Canada. Comstock Publishing Co., Ithaca, New York.
WRIGHT, S. 1978. Evolution and the genetics of populations. Volume 4. Variability within and among natural populations. Univ. Chicago Press, Chicago.
WYLES, J. S., AND G. C. GORMAN. 1980. The albumin immunological and Nei electrophoretic distance correlation: A calibration for the saurian genus Anolis (Iguanidae). Copeia, 1980:66-71.
Received 8 May 1985; accepted 13 November 1985.
1986 HOLARCTIC HYLID EVOLUTION 17
APPENDIX 1
Localities and Sample Sizes Acris crepitans (n = 5), Maryland, Prince Georges Co.;
A. gryllus (n = 5), Georgia, Effingham Co., 7.2 km SE Pineora; Hyla andersoni (n = 2), New Jersey, Burlington Co., Chatsworth; H. arborea (n = 1), Italy; H. arenicolor (n = 1), Arizona, Pima Co., Sabin Canyon; H. a. avivoca (n = 6), Alabama, Greene Co.; H. a. ogechiensis (n = 1), South Carolina, Jasper Co., 2.6 km WNW Tillman; H. cadaverina (n = 2), California, San Bernardino Co., San Gorgonio Pass; H. chrysoscelis (n = 3), Texas, Travis Co., 1.6 km W Bee Cave; H. cinerea (n = 5), Maryland, Dorchester Co., Smithville; H. crucifer (n = 4), Virginia, Caroline Co., 19.4 km S Bowling Green; H. eximia (n = 2), Mexico, Mexico, 0.4 km E Rio Frio; H. femoralis (n = 5), Georgia, Effingham Co., 7.2 km SE Pineora; H. gratiosa (n = 6), Georgia, Effingham Co., 7.2 km SE Pineora; H. japonica (n = 1),
Japan, Shizuoka Prefecture, Shizuoka; H. meridionalis (n = 5), Morocco, Tetouan Province, 13.4 km S Asilah; H. regilla (n = 4), California, Riverside Co., Vail Reservoir; H. squirella (n = 1), Georgia, Effingham Co., Meldrim; H. versicolor (n = 5), Texas, Montgomery Co., Woodlands; Limnaoedus ocularis (n = 5), Florida, Alachua Co., Gainesville; Pseudacris brachyphona (n = 5), Georgia, Pickens Co., 6.2 km W, 2.4 km N Talking Rock; P. brimleyi (n = 4), Virginia, Caroline Co., 4.0 km E Dawn; P. clarki (n = 6), Texas, Travis Co., Manor; P. nigrita (n = 4), South Carolina, Berkeley Co., 1.0 km W Jamestown; P. ornata (n = 6), South Carolina, Aiken Co., Flamingo Bay; P. s. illinoensis (n = 6), Illinois, Mason Co., 8 km S Bath; P. s. streckeri (n = 1), Texas, Parker Co., near Fort Worth; P. t. feriarum (n = 4), Tennessee, Blount Co., 3.8 km W, 1.6 km S Townsend; P. t. kalmi (n = 4), Maryland, Kent Co., 4.2 km E, 1.6 km N Massey; P. t. triseriata (n = 2), lllinois, Cass Co., 3.2 km E Chandlerville.
-APPENDIX 2 100
Protein Variation for 30 Taxa of Holarctic Hylid Frogs at 29 Polymorphic Loci
Taxona
Locus 2 3 4 6 7 9 10 11 12 13 14 15
Acp h h h h h h h h (.88) c (.9) h h h h h b i (.12) h (.1)
Ak d d d d d d d d d d (.67) d d d d g h (.33)
Apep d d d d d d d d c a a a b b a Aat-I a a a a a a a a (.88) a a a a d b e
d (.12) Aat-2 b b b b b b a (.92) a (.13) b e h (.5) h a f k
e (.08) d (.87) j (.5) Cd b b b b b b b c b b b b b b a Ck b b b b b b b b b b b b b b c CJ'J
>< Dpep g g g g a f f j h h h h e i k CJ'J
>-l E5-1 d d d d d d d d d (.4) d b d c b h tt:I
e (.6) ~ E5-2 c c c c c c c c c c c c b a c ..... Gpi b (.13) 0 m e (.13) h (.25) m c (.88) d (.1) o (.17) P (.5) P b a c ()
h (.62) 1 (.87) q (.75) r (.12) k (.9) r (.83) r (.5) ~ q (.25) 0
Glud b b b b b a b b b b b b b b b t"" 0
Gpd 1 c (.13) 1 c (.75) g f d (.08) i (.88) f (.4) m m m g (.5) m n G')
1 (.87) 1 (.25) f (.92) P (.12) 0(.6) m(.5) >< Icd-I e e e e e b e c (.13) g h h h c e c
h (.87) Icd-2 c c c c c (.88) c (.75) c c b (.3) d (.75) d d e e f
d (.12) d (.25) e (.7) e (.25) Ldh-I a a a (.9) a m a (.63) e e (.25) e d 0(.5) 0 c c
o (.1) o (.37) f (.5) P (.5) i (.25)
Lgl d (.75) d (.5) d (.2) f d e e (.08) b e b (.08) b b e e b f (.25) f (.5) f (.8) h (.92) e (.92)
Mdh-I f g 1 j (.38) m k g g g 0 k k a p (.62)
Mdh-2 b (.5) j (.7) c (.25) k o (.63) a (.17) h e (.17) p (.5) P f f f (.5) P (.3) h (.75) s (.37) e (.67) p (.75) s (.5)
I~ h (.08) s (.08) q (.08)
w CJ1
-\0 00 0-.
I APPENDIX 2 Continued
Taxona
Locus 16 17 18 19 20 21 22 23 24 25 26 27 28 29 30
Aep c d f f c c e a e g h h c c c Ak g b e e b b h d a d d d d c (.67) c (.5)
f (.33) f (.5) Apep b a a a a a a a a a a a a a a Aat-I c b b b b b b c c b c c c c c Aat-2 k . k (.5) k c c g (.9) f ::I:
1 (.5) h(.I) 0 Cd b b b b b b b b b b b b b b b [; Ck c a a a a a b b b b b b b b b :;g
Dpep b b b b b e c c c e e d b b ()
e I-:l E5-1 h h h h h h a (.3) c (.1) h f a (.25) f
..... g g g ()
f (.7) h(.9) f (.75) ::I: Es-2 c c c c c c c c c c c c c c c ><
t"" Gpi h f f g g b h b (.75) s g (.9) g n n h .....
Cl h (.25) n(.I) tt:I
Glud b b b b b b b b b b b b b b b <: Gpd b q h h g g n a g e (.2) k k n n n 0
t"" j (.8) c:
I-:l led-l f f f f f f d c c c c a c a a .....
0 led-2 e f f f f f a f f f f f (.8) f f f Z
g (.2) Ldh-l h b (.5) b (.67) g (.6) k k j
k (.5) k (.33) n (.4) LgI b c c c c c b c c c a (.1) b g c c
b (.8) e (.1)
Mdh-l h b e b (.75) c c g g b c c c c d n(.25)
Mdh-2 r r (.75) r r (.83) m g (.33) f n f n e d c r m(.2) v (.25) u(.17) 1 (.5) t (.8)
r (.17)
I -\0
APPENDIX 2 Continued
Taxon-
Locus 2 3 4 5 6 7
Me c c c (.6) a g c b (.5) f (.4) c (.5)
Mpi o (.13) q (.5) i (.1) m(.25) b (.13) r r t (.S7) t (.37) r (.4) s (.75) n (.75)
v (.13) u (.5) q (.12) Pgm g g c (.1) c c (.13) f c
g (.9) g (.S7) Pgd v (.4) k (.13) q (.1) j (.75) w(.13) j (.13) s
aa (.4) n (.75) u (.6) o (.25) y (.S7) t (.5) bb(.2) t (.12) z (.2) x (.37)
aa (.1) Pt-l e e e e e d d Pt-2 b b b b b b b Pk b b (.13) b a d a b
h (.S7) Sod m m m m i (.13) g (.3S)
k (.S7) j (.62)
Xdh-l c c c a c c a Xdh-2 d d d b d d a (.OS)
f (.92)
8 9 10 11 12
b (.63) h g g g c (.37) q (.63) i (.2) q (.75) q q t (.37) n (.3) u (.25)
q (.5) e m m
k (.75) d (.3) n (.92) 0 0
n (.25) g (.1) t (.OS) k (.3) n (.3)
g d e e f b b c c c
c g g g
g (.25) e (.3) i (.42) i (.5) g (.7) m(.5S) 1 (.25) c c c c c d d d d d
13 14
c c
d (.25) c g (.5) o (.25) c d
e g
f f c c d d
b a
c c d c
15
g
k
n
a
b e e
h
c e
~
CJ'J >< CJ'J >-:l tI:I
~ .... n
~ 0 t"' 0 ~
~ W 01
APPENDIX 2 Continued
Taxona
Locus 16 17 18 19 20 21 22 23 24 25 26 27 28 29 30
Me g g g g g g g d g f (.1) g g g e (.1) g (.9) g (.9)
Mpi a (.5) q q i (.6) j (.17) a (.2) 1 (.5) e k g(.I) s h(.5) 1 (.08) P 1 (.5) q (.83) f (.8) s (.5) s (.6) 0(.5) P (.84)
v (.3) t (.08) Pgm 0 0 0 0 n (.28) k (.16) a 1 (.5) e (.75) b b a a h
o (.72) o (.84} 0(.5) m(.25) Pgd n(.5) m m m m(.7) m(.67) b n h g c (.58) f
p(.5) p (.1) n (.33) p (.25) r (.2) r (.17)
Pt-l b h h h h h e a a c c c c c d Pt-2 a a a a a a b d c b b b b b b Pk f e e e e e c d g c g c c c (.83) c
g (.17) Sod e e e e (.4) e c h e f (.7) f d f
i (.4) j (.1) o (.2) n(.2)
Xdh-l c c c c c c c c c b c c c c c Xdh-2 g g g g g g e g d g d d g g g
a Numbers correspond to following taxa: (1) feriarum; (2) kalmi; (3) brachyphona; (4) triseriata; (5) brimley;; (6) nigrita; (7) clarki; (8) crucifer; (9) ocularis; (10) ornata; (11) streckeri; (12) illinoensis; (13) regilla; (14) cadaverina; (15) aroorea; (16) japonica; (17) andersoni; (18) ogechiensis; (19) avivoca; (20) versicolor; (21) chrysoscelis; (22) meridionalis; (23) arenicolor; (24) erimia; (25) femoralis; (26) gryl/us; (27) crepitans; (28) squirel/a; (29) gratiosa; and (30) cinerea.
..... ~ 0\
6 5: Q .... (")
::t: >< r< .... 0
~ 0 r< c:: >-l .... 0 Z
N .....

![A method for determining electrophoretic and …...[4,5]. Current techniques for measuring electrophoretic mo-bility include an electroacoustic method [6], electrophoretic light scattering](https://img.pdfslide.net/doc/110x75/5f08e22b7e708231d4242f99/a-method-for-determining-electrophoretic-and-45-current-techniques-for-measuring.jpg)