Embed Size (px)
Citation preview
Portland State University Portland State University
PDXScholar PDXScholar
Metroscape Institute of Portland Metropolitan Studies
Winter 2018
An Emerging Contradiction: Non-Farm Activity within An Emerging Contradiction: Non-Farm Activity within
Exclusive Farm Use Zones Exclusive Farm Use Zones
Nicholas Chun Portland State University
Follow this and additional works at: https://pdxscholar.library.pdx.edu/metroscape
Part of the Agricultural and Resource Economics Commons, and the Urban Studies and Planning
Commons
Let us know how access to this document benefits you.
Recommended Citation Recommended Citation Chun, Nicholas, "An Emerging Contradiction: Non-Farm Activity within Exclusive Farm Use Zones" (2018). Metroscape. 128. https://pdxscholar.library.pdx.edu/metroscape/128
This Article is brought to you for free and open access. It has been accepted for inclusion in Metroscape by an authorized administrator of PDXScholar. Please contact us if we can make this document more accessible: [email protected].
Page 13Metroscape
Periodic Atlas of the Metroscape
An Emerging ContradictionNon-Farm Activity within Exclusive Farm Use Zones
by Nick Chun
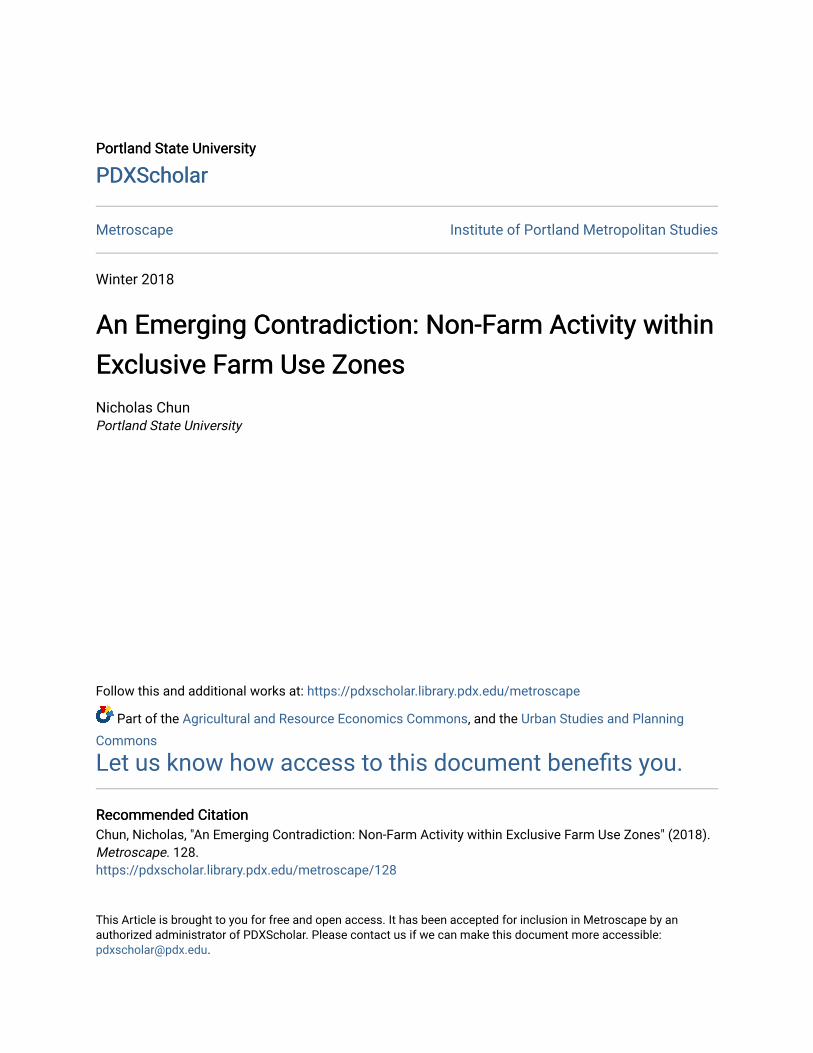
Oregon’s land use policy plan has been lauded nationally as one of the most successful conservation strategies for agricultural and forest lands.1 Urban growth boundaries (UGB), which limit urban develop-ment within the UGB area, are a key component of this statewide land use system to mitigate sprawl. In combination with UGBs, exclusive farm use (EFU) zones facilitate and protect farm production by restricting development that may potentially conflict with agricultural practices and offering tax incentives for farming. However, this restriction is not absolute, as a variety of non-farm-related uses and dwell-ings are legally allowed within EFU zones. The allowed non-farm activities are diverse, and delineating their impact on farm operations has been difficult due to the lack of data to measure these phenomena. In this edition of the Atlas, we mapped the locations of non-farm permits collected and maintained by the Department of Land Conservation and Development (DLCD), from 1993 to 2015 in the northern Willamette Valley. We hope this work will contribute to a dialogue among various actors and researchers interested in the growth management of Oregon.
BACKGROUND & SIGNIFICANCE
While Oregon’s Statewide Planning Goal 3 explicitly states “agricultural lands shall be preserved and main-tained for farm use,” it also allows counties to “authorize farm uses and nonfarm uses defined by com-mission rule that will not have significant adverse effects on accepted farm or forest practices.”2 It seems contradictory that non-farm activities are permitted to function within EFU zones, but there are a variety of reasons for their existence. Some non-farm operations, including processing plants, storage facilities,
agri-tourist events, and other accessory uses, sustain the agglomerative properties of the local agriculture industry and serve as com-plementary, if not essential, elements to farm-ing practices.3 Another reason is that some activities, such as solar farms and wind tur-bines, require open space and thus, contend with farming demand for EFU lands.4 Lastly, 1. Kline, “Forest and Farmland Conservation Effects of Oregon’s (USA) Land-Use Planning Program”; Nel-son, “Preserving Prime Farmland in the Face of Urban-ization”; Tulloch et al., “Integrating GIS into Farmland Preservation Policy and Decision Making.”2. DLCD, “Goal 3: Agricultural Lands.”3. Lynch, Economics and Contemporary Land Use Policy; Lynch and Carpenter, “Is There Evidence of a Critical Mass in the Mid-Atlantic Agriculture Sector between 1949 and 1997?”; Nelson, “Preserving Prime Farmland in the Face of Urbanization.”4. DLCD, “2014-2015 Oregon Farm & Forest Report.”
WA S H I N G T O N C O .
C L A C K A M A S C O .
YA M H I L L C O .
M U LT N O M A H C O .
M A R I O N C O .P O L K C O .
Figure 1. Non-farm use study-area.
Page 14Metroscape
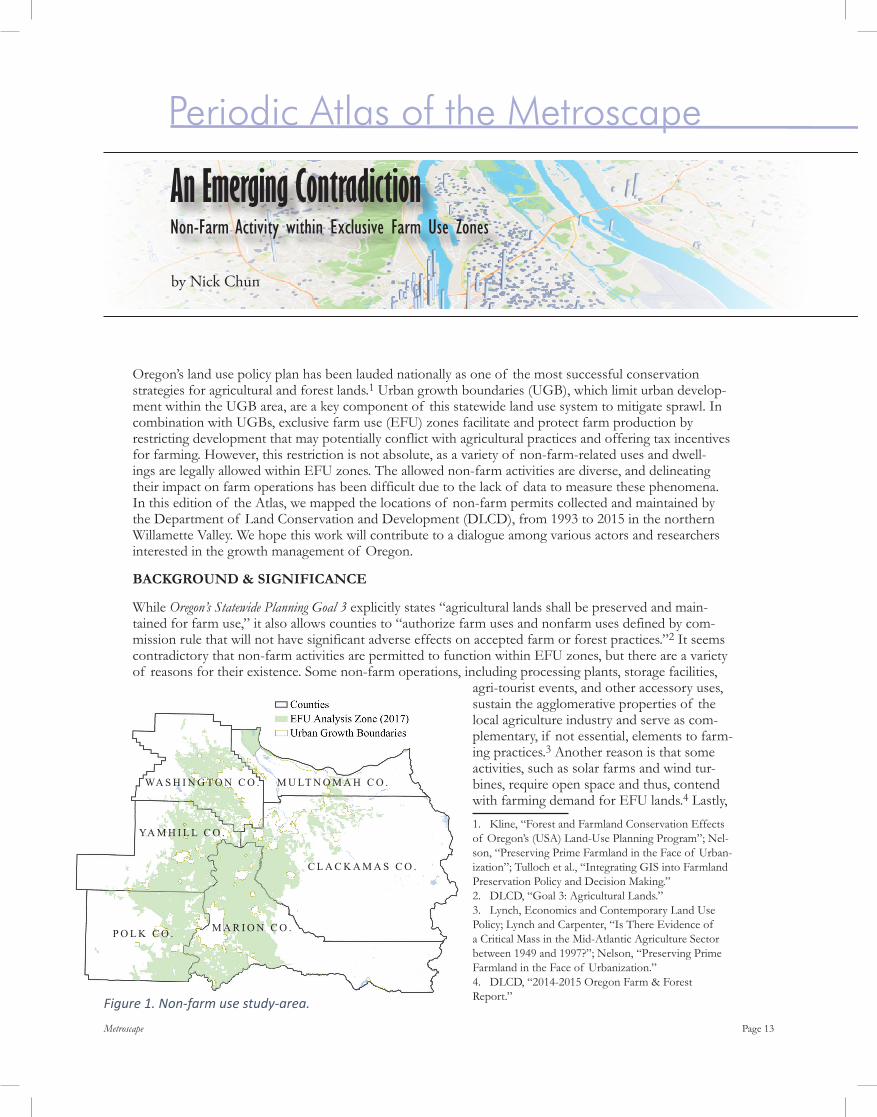
it’s worth noting that not all land within EFU zones are conducive to farming because of soil quality or gradient. Ideally, non-farm uses and dwellings are relegated to non-productive farmlands as long as they don’t conflict with nearby farms.5 However since the creation of the first EFU zone in 1963, the number of allowed non-farm uses has increased from six to over fifty uses today.6 The gradual addition of uses over the decades has been a politi-cal process and a compromise with farmers and landowners, who want to increase the economic return of their land. Nonetheless, there is concern that the growing number of non-farm uses and dwellings may eventually undermine the critical mass of agricultural land, or the minimum inventory of land needed for farming to remain sustainable. Isolated operations may have little to no impact on farming practices individually, but concerns focus on the cumulative impacts of these activities.
Farm operations require open space to func-tion because some farm activities (e.g. late and early work hours, farm machines on streets, animal noises and smells, and weed and pest management) may conflict with the day-to-day activities of neighboring, non-5. DLCD.6. DLCD.
Figure 3. Dundee area use cases.
Figure 2. Examples of permitted use types.
Page 15Metroscape
farm businesses and residents. Conversely, in addi-tion to converting farmland to other uses, nearby dwellings and non-farm operations can produce traffic, pollution, and complaints of their own that negatively impact the longevity and production of nearby farms.
While these processes have been discussed at length by researchers and farm advocates, we know relatively little about how they function on the ground. Questions surrounding the extent of these operations, their locations, and their overall impact on farming practices have not been thor-oughly addressed. By analyzing the spatial distri-bution at a local scale, this work takes an impor-tant step towards deepening our understanding of the cumulative impacts of non-farm develop-ment. Using administrative data maintained by DLCD, we’ve geocoded permits for dwellings and uses from 1993 to 2015 in the northern Willamette Valley, Oregon’s agricultural heartland. An important note is that the permit data in their current form do not capture the entire history of non-farm development in the region, as illegal operations and structures are not recorded. By their nature, these permits can only inform us of approved development at specific points in time, not what is currently operational. Furthermore, we are not arguing that these phenomena produce a net negative or positive impact on farming prac-tices, nor is it the intent of these maps to illustrate such. The purpose is to highlight the presence of these activities, identify broad areas where they have clustered, and generate questions for future research and practices.
USES
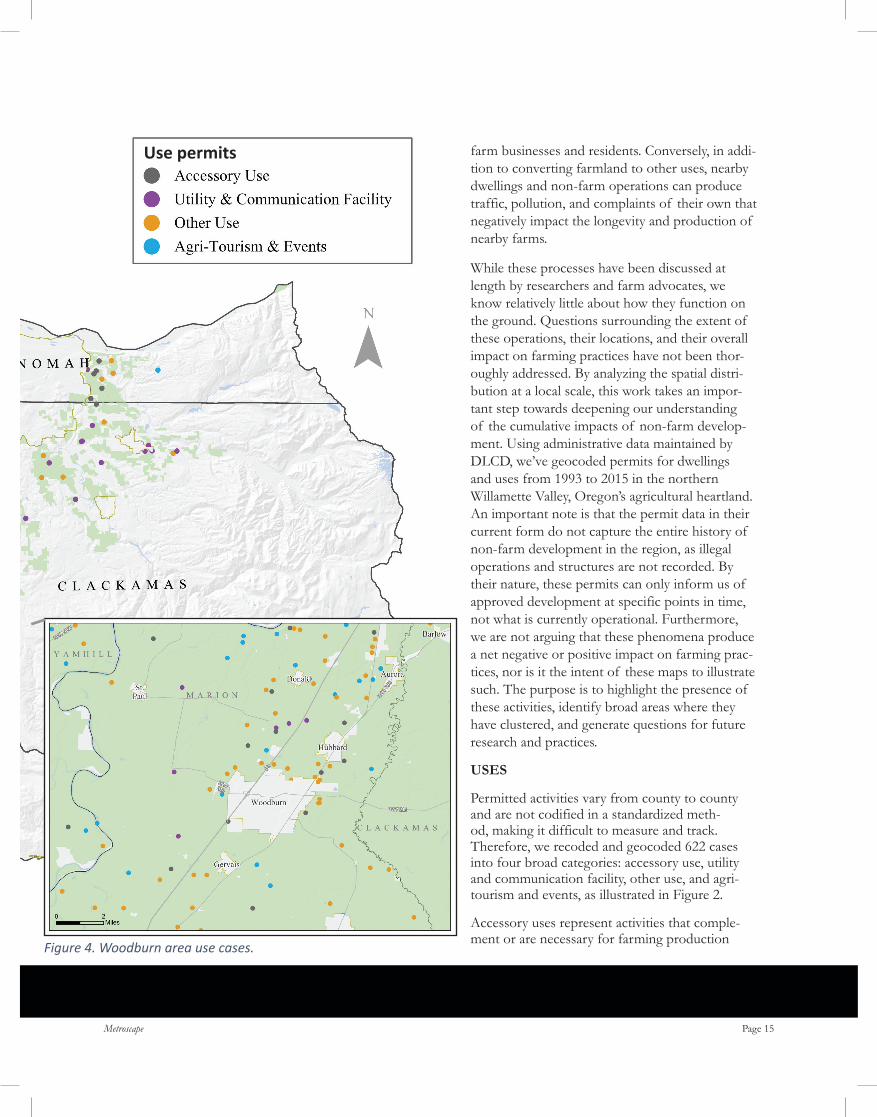
Permitted activities vary from county to county and are not codified in a standardized meth-od, making it difficult to measure and track. Therefore, we recoded and geocoded 622 cases into four broad categories: accessory use, utility and communication facility, other use, and agri-tourism and events, as illustrated in Figure 2.
Accessory uses represent activities that comple-ment or are necessary for farming production Figure 4. Woodburn area use cases.
Use permits
Page 16Metroscape
and made up roughly 16 percent, or 97 cases, of permitted uses. Utility and communication facilities include wind turbines, power plants, and cell tow-ers, making up roughly 20 percent, or 126 cases, of permitted uses. We’ve isolated these activities from “other uses” because they are generally public ame-nities that require open space to operate, opposed to private commercial activities. Other uses was the broadest category including private parks, home businesses, personal airports, and many other activi-ties not related to farming. A plurality of permits fell under other uses and made up roughly 39 percent, or 242 cases, of permitted uses. A large number of these cases clustered outside the city of Woodburn (Figure 4).
Finally, agri-tourism and events represent farm stands, viticulture operations, bed and breakfast establishments, and wedding venues. We chose to isolate agri-tourism because of its unclear rela-tionship to farming. While agri-tourism may help individual operations, there is not a consensus on its impact on farming practices as a whole.7 On the one hand, agri-tourism, such as u-pick stations, farm stands, and wine tasting stations, produces supple-mentary income streams for farm operations. On the other hand, it can also create residential traffic and development that can nega-tively affect other farm operations that have not adopted these prac-tices. By codifying these cases into a different category, we hope to highlight areas where these events are occurring. Agri-tourism made up 25 percent, or 157 cases, of permitted uses with a large major-ity concentrating in Yamhill County near Dundee (Figure 3).
DWELLINGS
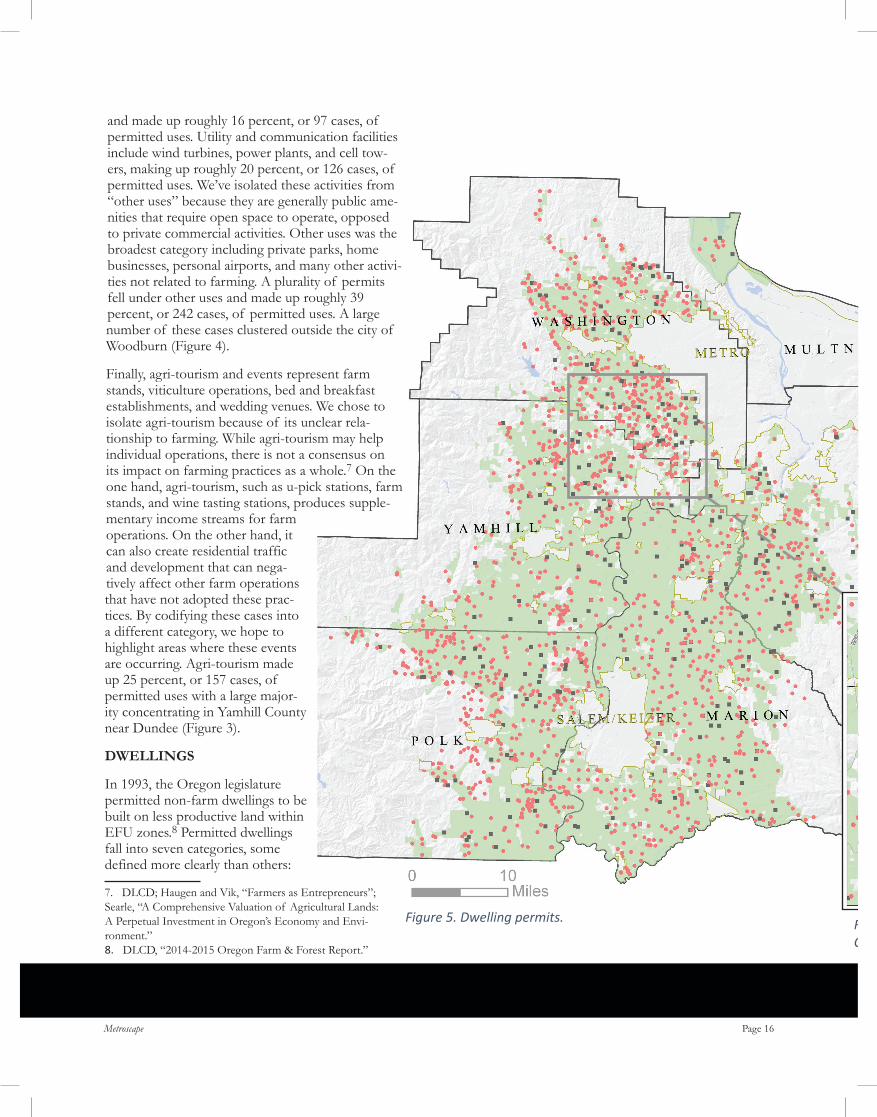
In 1993, the Oregon legislature permitted non-farm dwellings to be built on less productive land within EFU zones.8 Permitted dwellings fall into seven categories, some defined more clearly than others:
7. DLCD; Haugen and Vik, “Farmers as Entrepreneurs”; Searle, “A Comprehensive Valuation of Agricultural Lands: A Perpetual Investment in Oregon’s Economy and Envi-ronment.”8. DLCD, “2014-2015 Oregon Farm & Forest Report.”
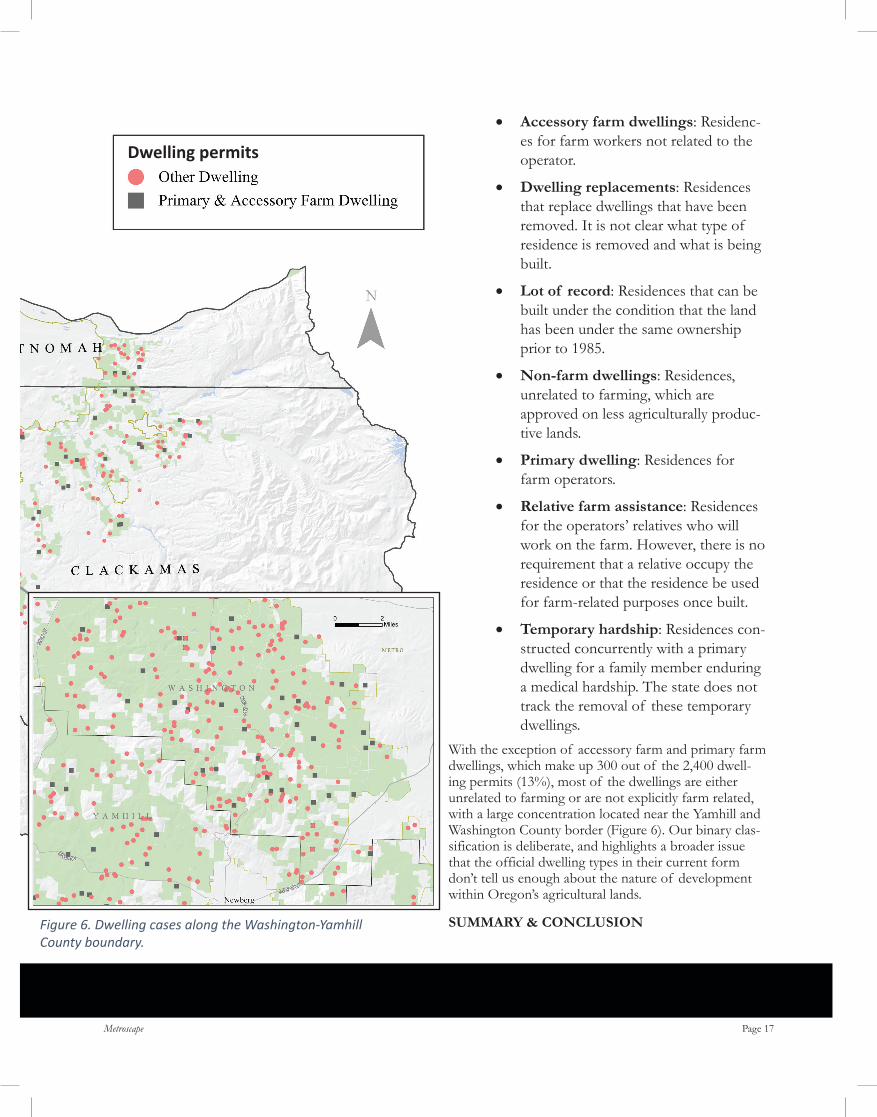
Figure 5. Dwelling permits. Figure 6. Dwelling cases along the Washington-Yamhill County boundary.
Page 17Metroscape
• Accessory farm dwellings: Residenc-es for farm workers not related to the operator.
• Dwelling replacements: Residences that replace dwellings that have been removed. It is not clear what type of residence is removed and what is being built.
• Lot of record: Residences that can be built under the condition that the land has been under the same ownership prior to 1985.
• Non-farm dwellings: Residences, unrelated to farming, which are approved on less agriculturally produc-tive lands.
• Primary dwelling: Residences for farm operators.
• Relative farm assistance: Residences for the operators’ relatives who will work on the farm. However, there is no requirement that a relative occupy the residence or that the residence be used for farm-related purposes once built.
• Temporary hardship: Residences con-structed concurrently with a primary dwelling for a family member enduring a medical hardship. The state does not track the removal of these temporary dwellings.
With the exception of accessory farm and primary farm dwellings, which make up 300 out of the 2,400 dwell-ing permits (13%), most of the dwellings are either unrelated to farming or are not explicitly farm related, with a large concentration located near the Yamhill and Washington County border (Figure 6). Our binary clas-sification is deliberate, and highlights a broader issue that the official dwelling types in their current form don’t tell us enough about the nature of development within Oregon’s agricultural lands.
SUMMARY & CONCLUSIONFigure 6. Dwelling cases along the Washington-Yamhill County boundary.
Dwelling permits
Page 18Metroscape
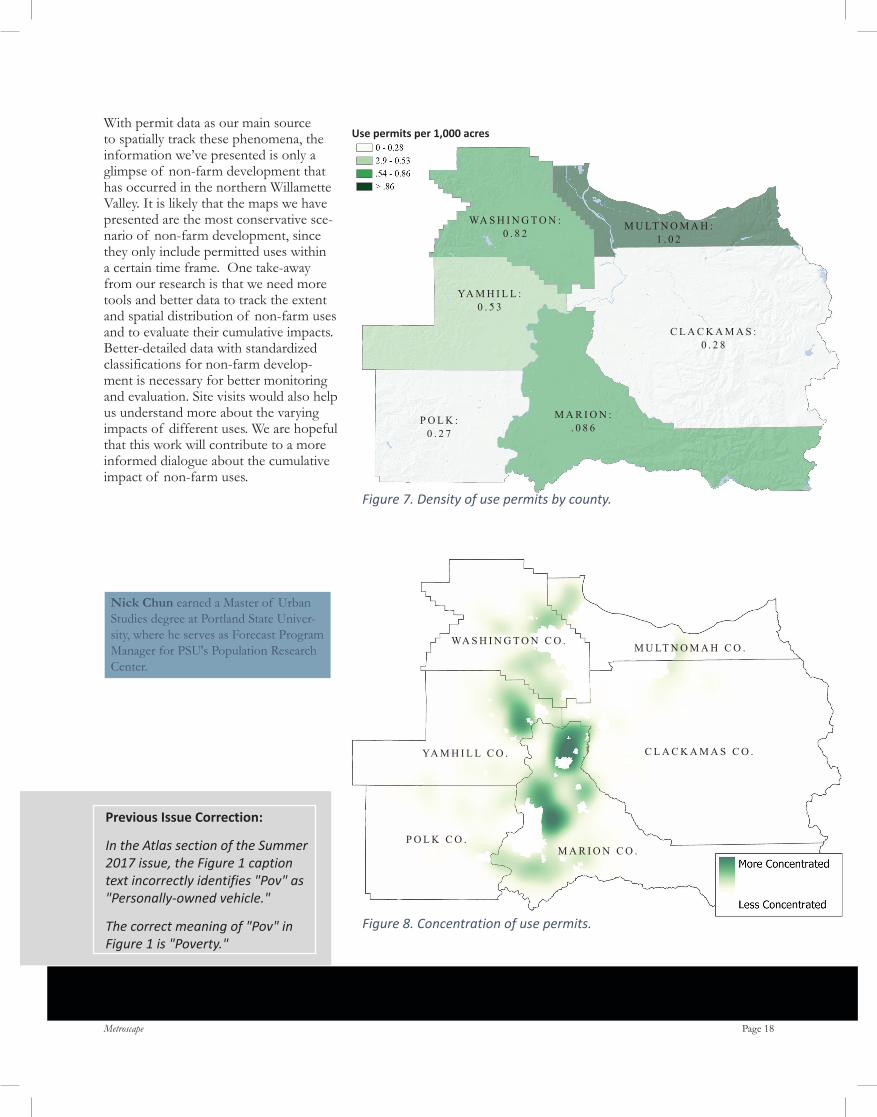
WA S H I N G T O N :0 . 8 2
C L A C K A M A S :0 . 2 8
YA M H I L L :0 . 5 3
M U LT N O M A H :1 . 0 2
M A R I O N :. 0 8 6
P O L K :0 . 2 7
WA S H I N G T O N C O .
C L A C K A M A S C O .YA M H I L L C O .
M U LT N O M A H C O .
M A R I O N C O .P O L K C O .
With permit data as our main source to spatially track these phenomena, the information we’ve presented is only a glimpse of non-farm development that has occurred in the northern Willamette Valley. It is likely that the maps we have presented are the most conservative sce-nario of non-farm development, since they only include permitted uses within a certain time frame. One take-away from our research is that we need more tools and better data to track the extent and spatial distribution of non-farm uses and to evaluate their cumulative impacts. Better-detailed data with standardized classifications for non-farm develop-ment is necessary for better monitoring and evaluation. Site visits would also help us understand more about the varying impacts of different uses. We are hopeful that this work will contribute to a more informed dialogue about the cumulative impact of non-farm uses.
Nick Chun earned a Master of Urban Studies degree at Portland State Univer-sity, where he serves as Forecast Program Manager for PSU's Population Research Center.
Figure 7. Density of use permits by county.
Figure 8. Concentration of use permits.
Use permits per 1,000 acres
Previous Issue Correction:
In the Atlas section of the Summer 2017 issue, the Figure 1 caption text incorrectly identifies "Pov" as "Personally-owned vehicle."
The correct meaning of "Pov" in Figure 1 is "Poverty."
Page 19Metroscape
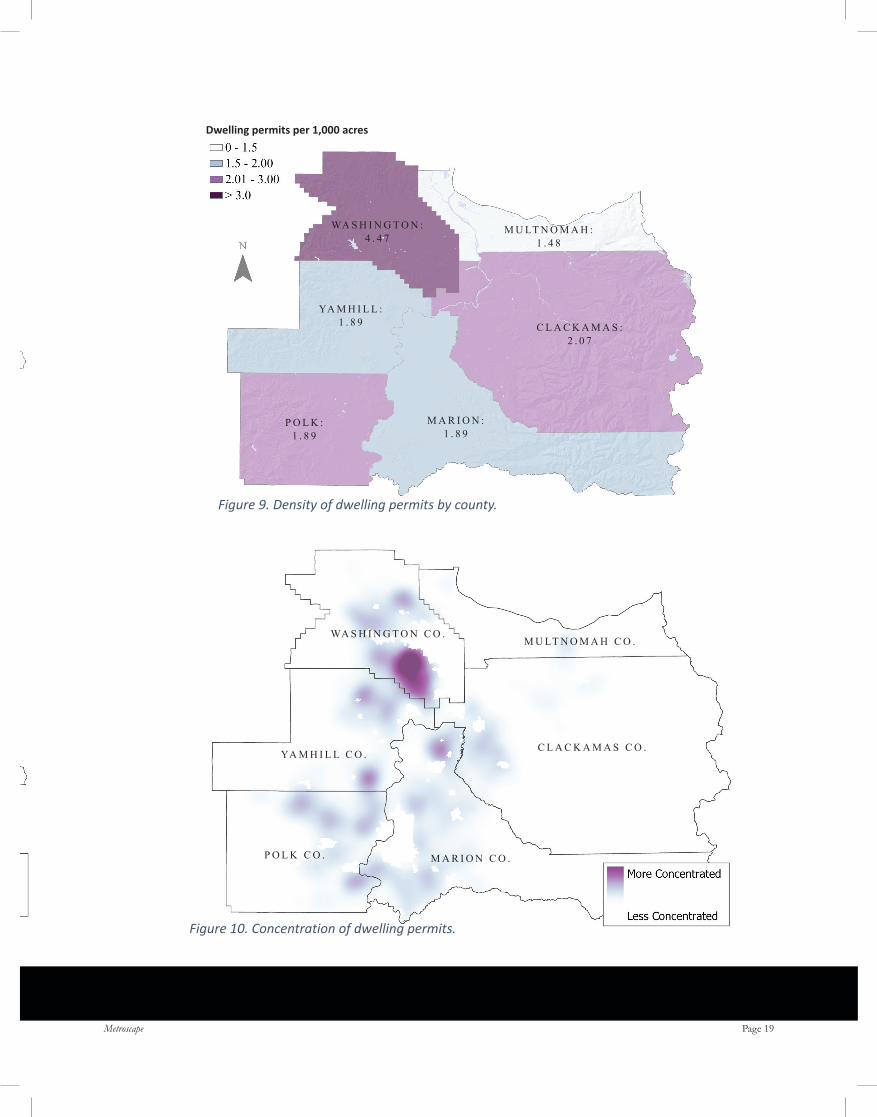
WA S H I N G T O N :4 . 4 7
C L A C K A M A S :2 . 0 7
YA M H I L L :1 . 8 9
M U LT N O M A H :1 . 4 8
M A R I O N :1 . 8 9
P O L K :1 . 8 9
WA S H I N G T O N C O .
C L A C K A M A S C O .YA M H I L L C O .
M U LT N O M A H C O .
M A R I O N C O .P O L K C O .
Figure 9. Density of dwelling permits by county.
Figure 10. Concentration of dwelling permits.
Dwelling permits per 1,000 acres